WORLD METEOROLOGICAL ORGANIZATION
Operational HydrologyReport No. 10
STATISTICAL INFORMATION ONACTIVITIES IN
OPERATIONAL HYDROLOGY
I WMO • No. 464 ISecretariat of the World Meteorological Organization • Geneva • Switzerland
1977
GENERAL DISCLAIMER
The designations employed and the presentation of material in this publication donot imply the expression of any opinion whatsoever on the part of the Secretariatof the World Meteorological Organization concerning the legal status of any country,territory, city or area, or of its authorities, or concerning the delimitation of its frontiers or boundaries.
Where the designation "state or territory" appears in the headings of tables, itcovers countries, territories, cities or areas.
© 1977, World Meteorological Organization
ISBN 92.63·10464·6
STATISTICAL INFORMATION ON ACTIVITIES IN OPERATIONAL HYDROLOGY
ANNOTATED TABLE OF CONTENTS
1.
FOREWORD
INTRODUCTION
..................................................... XXXIX
1
Aim of the publication - sources of information - frequency andpresentation of publication
2. INTERNATIONAL AND NATIONAL ORGANIZATIONS DEALING WITH HYDROLOGY ANDWATER RESOURCES 2
Definition of governmental and non-governmental organizations;organization of national services dealing with hydrological networksand stations; services responsible for various hydrologicalactivitiesi inter-service co-ordination
Table 2.1 - International governmental organizations - globaland regional ...................................•...•.. 4
names, addresses
Table 2.2 - International non-governmental organizations 5
names and addresses
Table 2.3 - National services dealing operationally with stationnetworks for hydrological purposes 6
names and addresses of services; responsibleauthori ties
Table 2.4 - Activities of national services listed in Table 2.3 ... 24
hydrometric, groundwater and climatologicalobservations; data storage and retrieval; yearbooksand catalogues; standards; inter-serviceco-ordination
Table 2.5 - Number of countries operating hydrological services
statistical summary based on Table 2.434
Table 2.6 - Number of countries operating networks for observingspecific elements. 34
statistical summary based on Table 2.4
IV
Tabla 2.7 - Number of countries publishing yearbooksor summaries and catalogues .... < • ••••••••••••••••• 35
statistical summary based on Table 2.4
Table 2.8 _ Inter-service co-ordination 36
statistical summary based on Table 2.4
3. PRINCIPAL RIVER BASINS .................................................... 37
List of principal river basins, international system of hydrologicalobservation station identification numbers - institutionalized cooperation in river basins - catchment areGS
Table 3.1 - Principal river basins in Africa , .
Map 3(0) - international river basins - Africa
Table 3.2 - Principal river basins in Asia
Map 3(b) - international river basins - Asia
Table 3.3 - Principal river basins in South America
Map 3(c) - international river basins South America
39
45
50
Table 3.4 - Principal river basins in North and CentralAmerica ..........................................• ' 55
Map 3(d) - international river basins - Northand Central America
Table 3.5 - Principal river basins in South·-West Pacific .... ..• 59
Map 3(e) - international river basins - South-WestPaci fie
Table 3.6 - Principal river basins in Europe ........•........... 62
Map 3(f) - international river basins - Europe
Table 3.7 - Institutionalized co-operation in internationalriver and lake basins '" .
region and basin; name of institution; membercountries; headquarters; year of agreement; typeof institution; field of co-operation
68
4. NETWORKS OF HYDROLOGICAL OBSERVING STATIONS 74
Statistics in existing networks/ sources of infcrmation; recommendedminimum densities of networks for precipitation, evaporation, hydrometric observations; sediment transport and water quality; existing
network densities
4.1 Africa
Table 4.1.1
Table 4.1.2
- Precipitation observation networks 78
Map 4.1(0) - density of precipitation stations
- Evaporation observation networks.................... 80
Map 4.1(b) - density of evaporation pans
Table 4.1.3(0) - Surface water observation networks - discharge
Map 4.1(c) - density of discharge stations
82
Table 4.1.3(b) - Surface water observation networks - stage,
sediment and woter quality 84
4.2 Asia
Table 4.2.1 - Precipi totlon observation networks .
Map 4.2(0) - density of precipitation stations
85
Table 4.2.1(0) - Precipitation observation networks (below 500m) .•.... 87
Table 4.2.1(b) " " " (501-1000m) ....... 88
Table 4.2.1(c) " " " (1001-1500m) •..... 89
Table 4.2.1(d) " " " (1501-2000m) ....•. 90
Table 4.2.1(e) " " " (2001-2500m) ....•. 91
Table 4.2.1(f) " " " (above 2500m) ...•. 92
Table 4.2.2 - Evaporation observation networks .................... 93Map 4.2(b) - density of evaporation pans
Table 4.2.3(0) - Surface water observation networks - discharge ...... 95
Map 4.2( c) - density of discharge stations
Table 4.2.3(b) - Surface water observation networks - stage, sedimentand water quaE ty 97
Table 4.2.4
4.3 South America
Table 4.3.1
- Groundwater observation networks.................... 98
- Precipitation observation networks 99
Map 4.3(0) - density of precipitation stations
VI:
Table 4.3.2 - Evaporation observation networks •..••...•.....•...•• 101
Map 4.3(b) - density of evaporation pans
Table 4.3.3(0) - Surface water obse.rvation networks - discharge
Map 4 .. 3(c) - den.sity of disclmrge da.tians
Table 4.3.3(b) - Surface Hater observation networks - stage, sedimentand w.ater q,u.olity ._ _._ .._ .
103
105
Table 4.3.4 - Gro.und"w.ater obs.ervation networKs - __ .- ., 106
4'.4 Narth an-d Ce'ntFol AAleri.ca.
Table 4.4.1
Table 4.4.2
- Precipitation ab-servotion networks ....•......•..... 107
i'la.p 4.4(0) - den'sity of precipitation sta.tions
E t ' b t' t k 109- vepora lon Q servo -lon newor s . 0.0 ••••••••••••••••
Map 4.4(b) - density of evaporation pans
Table 4.4.3(0} - Surface water observation networks - discharge
Map 4.4(c) - den'si ty of discharge stations
III
Table 4.4.3(b) - Surface water observation networks - stage, sedimentand water quality................ 113
Table 4.4.4 - Groundwater observation networks _........... 114
4'.5 Sauth-W'est Pacific
Table 4.5.1 - Precipitation observation networks 115
Map 4.5(0) - density of precipitation stations
Table 4.5.1(0) - Precipitation observation nehlOrks (below 500m). ... , 117
Table 4.5.1(b) " " " ( 501-1000m) 118
Table 4.5.1(c) " n " (1001-1500m) 119
Table 4.5.1(d) " " " (1501-2000m) 120
Table 4.5.1(e) " " n (200 1-2500m) 121
Table 4.5.1( f) " " " (above 2500m). " 122
Table 4.5.2 Evaporation observation networks ................... 123
Map 4.5(b) - density of evaporation pans
VIIPage
Table 4.5.3(0) - Surface water observation networks -discharge .•.................................... 125
Map 4.5(c) - density of discharge stations
Table 4.5.3(b) - Surface water observation networks - stage,sediment and water quall ty 127
Table 4.5.4
4.6 Europe
Table 4.6.1
- Groundwater observation networks 128
- Precipi totion observation networks 129
Map 4.6(0) - density of precipitation stations
Table 4.6.1(0) - Precipitation observation networks (below 500m) . 131
Table 4.6.l(b) " " " (50l-l000m) .. 132
Table 4.6.l(c) " " " (lOOl-1500m) . 133
Table 4.6.l(d) " " " (l50l-2000m) . 134
Table 4.6.l(e) " " " (2001-2500m) . 135
Table 4.6.l(f) " " " {above 2500m) 136
Table 4.6.2 - Evaporation observation networks ............... 137
Map 4.6(b) - density of evaporation pans
Table 4.6.3(0) - Surface water observation networks - discharge., 139
Map 4.6(c) - density of discharge stations
Table 4.6.3(b) - Surface water observation networks - stage,sediment and water quality 141
TobIe 4.6.4 - Groundwater observation networks 142
5. COST AND MANPOWER FOR OPERATION OF HYDROMETRIC NETWORKS 143
Sample representative regions; characteristics (area, population,climate, topography); number of stations; annual budget; cost ofmanpower J equipment and maintenance; per capita income
Table 5.1
Table 5.2
- Estimated cost for operating hydrometricnetworks 144
- Manpower used to operate hydrometric networks .. 147
VIn
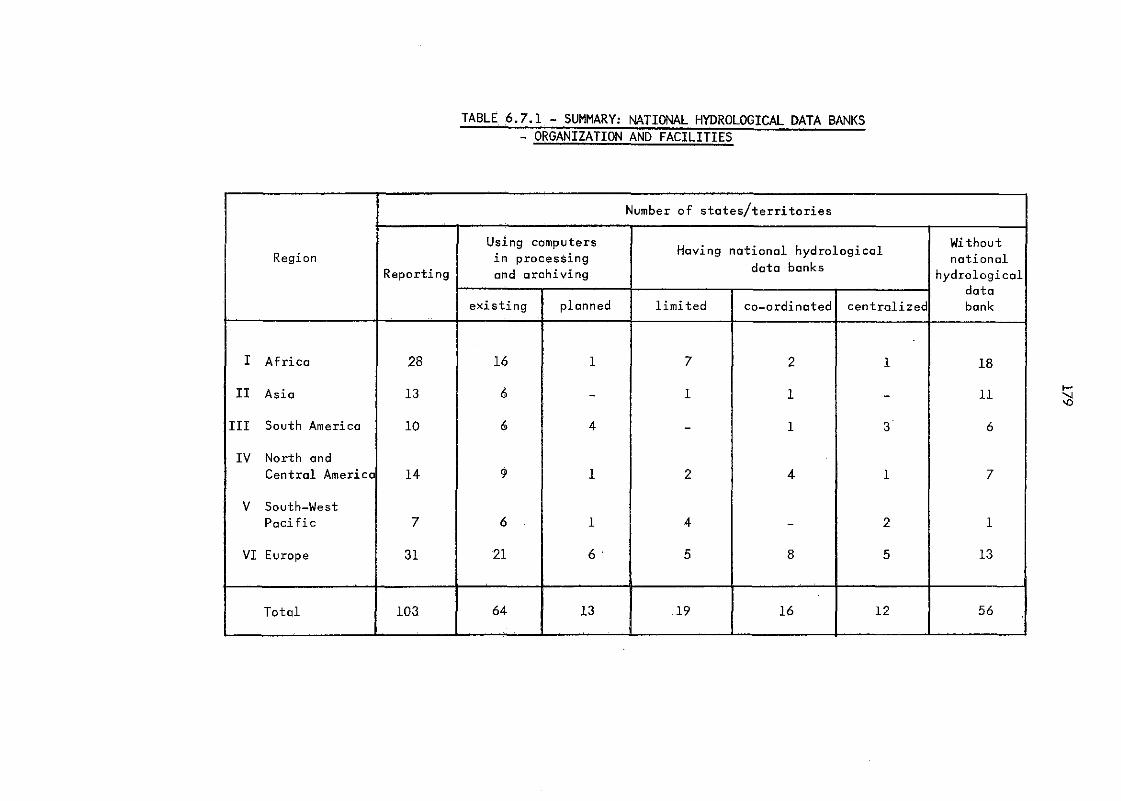
6. HYDROLOGICAL DATA BANKS .. ...... ............................................ 150
Source of information;hydrological data bank;basic and analysed data;
6.1 Africa
hydrological data; definition of a nationaldata in digital formi digital archives;catalogues
Table 6.1.1 - National hydrological data banks -organization and facilities 152
Table 6.1.2 - Hydrological data collection and automaticprocessing ~ , D 154
Table 6.1.3 - Hydrological data archiving ......................•. 156
6.2 Asia
Table 6.2.1 - National hydrological data banks -organization and facilities 158
TobI e 6.2.2 - Hydrologi cal data call eetian and automoticprocessing 159
Table 6.2.3 - Hydrologicol data archiving 161
6.3 South America
Table 6.3.1 - National hydrological dota banks -organization and facilities 163
Table 6.3.2 - Hydrological data collection and automaticprocessing ...•.....•...........•.•••.•............. 164
Table 6.3.3 - Hydrological data archiving ........•............... 165
6.4 North and Central America
Table 6.4.1 - National hydrological data banks -organization and facilities ........•............... 166
Table 6.4.2 - Hydrological data collection and automaticprocessing .........•..........•.................... 167
Table 6.4.3 - Hydrological data archiving •.........•............• 169
6.5 South-West Pacific
TobIe 6.5.1 - National hydrological data banks -organization and facilities........................ 170
IXPage
Table 6.5.2 - Hydrologicol do to collection ond automoticprocessing ..•.........•.•...................•.•... 171
Table 6.5.3 - Hydrological data archiving 172
6.6 Europe
Table 6.6.1 - National hydrological data bonks -organization and facilities 173
Table 6.6.2 - Hydrological data collection ond outomaticprocessing ..•.•......••....•..•.••..............•. 175
TobIe 6.6.3 - Hydrological data archiving .................••.... 177
6.7 Summary
TobIe 6.7.1 - National hydralogical data banks - organizationand faciE ties 179
Table 6.7.2 - Hydrological data collection ond autamaticprocessing ............•.......................... 180
Table 6.7.3 - Hydrological data archiving .............•.•..•.•• 181
-------
AVANT-PROPOS
RENSEIGNEMENTS STATISTIQUES SUR LES ACTIVITES
D'HYDROLOGIE OPERATIONNELLE
TABLE DES MATIERES DETAILLEE
• .. • • • • • • • • • • • • • • • • • • • • .. • • • • • • • • • • • • • • • • • • • • • • • • • • • • • • • XXXIX
1 • INTRODl.JCTION. • • • • • • • • • • • • • • • • • • • • • • • • • • • • • • • • • • • • • • • • • • • • • • • • • • • • • • • • • • 1
But de 10 publication - sources des renseignements - frequence deparution et presentation de 10 publication
2. ORGANISATIONS INTERNATIONALES ET NATIONALES QUI S'OCCUPENT D'HYDROLOGIEET DE RESSOURCES EN EAU ••••••••••••••••••••••• I • • • • • • • • • • • • • • • • • • • • • • • • 2
Definition des organisations gouvernementales et non gouvernementales; organisation des services nationaux qui sloccupent desreseaux et des stations hydrologiques; services responsables dediverses activites hydrologiques; coordination entre les services
Tableau 2.1 - Organisations internationales gouvernementales ~
mondiales et r~gionales •••••••••••••••••••••••• 4
noms et adresses
Tableau 2.2 - Organisations internationales non gouvernemen-tales •••••••••••••••••••••••••••••••••••••••••• 5
noms et adresses
Tableau 2.3 - Services nationaux qui exploitent des reseaux destotions a des fins hydrologiques •••••••••••••• 6
noms et adresses des services; autorit~s responsobles
Tableau 2.4 - Activites des services nationaux mentionnes dansIe tableau 2.3 •• 0.............................. 24
observations hydrometriques, observations deseaux souterraines et observations climatologiquesj stockage et restitution des donnees;annuaires et catalogues; normes; coordinationentre les services
XII
Tableau 2.5 - Nombre de pays exploitant des services hydra-logiq ues .••••••••••••••••.••••••.•••• 0........ 34
resume statistique fonde sur Ie tableau 2.4
Tableau 2.6 - NombIe de pays exploitant des reseaux pourllobservation de certains elements .••••••.•••• 34
resume statistique fonde sur Ie tableau 2.4
Tableau 2.7 - NombIe de pays publiant des annuaires ou desresumes et des catalogues •••••••••..•••••••••• 35
resume statistique fonde sur Ie tableau 2.4
Tableau 2.8 - Coordination entre les services
resume statistique fonde sur Ie tableau 2.4
36
3. PRINCIPAUX BASSINS HYDROGRAPHIQUES •.•.•.••.•..•..•..•.••••.••••....... 37
Liste des principaux bassins hydrographiques t systeme international d'identification des stations d'observation hydrologique cooperation institutionna1isee a l'interieur de bassins versants
Tableau 3.1 - Principaux bassins d'Afrique
carte 3 a) - bassins internationaux - Afrique
39
Tableau 3.2 - Principaux bassins d'Asie ••••••••••••••••••••• 45
carte 3 b) - bassins internationaux - Asie
Tableau 3.3 - Principaux bassins dlAmerique du Sud .•..•...•. 50
carte 3 c) - bassins internationaux -Amerique du Sud
Tableau 3.4 - Principaux bassins d'Amerique du Nord etd I Amerique centrale ••••.••..•.•..•••...•••.... 55
carte 3 d) - bassins internationaux Amerique du Nord et Amerique centrale
Tableau 3.5 - Principaux bassins du Pacifique Sud-Ouest
carte 3 e) - bassins internationaux - Pocifiqu~
Sud-Ouest
59
Tobl~au 3.6 - PrincilluuX bassins dlEurope .•.••..•... .••. .•.. 62
~art(: '\ f) - bassins inb;rnationclu.oc, - [urup,o
UTI
Tableau 3.7 - Cooperation institutionnalisee a l'interieurde bassins fluviaux et lacustres interna-tionaux ••••••••••••••••••••••••••••••••••••••• 68
region et bassin; nom de l'institution; paysmembres; siege; annee de l'accord; typed'institutioni domaine de cooperation
4. RESEAUX DE STATIONS D'OBSERVATION HYDROLOGIQUE ••.•••••••••••••••••..•• 74
Statistiques des reseaux existents, sources des renseignements;densites minimales recommandees pour les Ieseaux d'observation desprecipitations, de l'evaporation .et les reseaux de stations mesurant Ie debit, Ie niveau, Ie transport des sediments et 10 qualitede l'eau; densite des reseaux existents
4.1 Afrique
Tableau 4.1.1
Tableau 4.1. 2
- Reseaux d'observation des precipitations.
carte 4.1 a) - densite des reseaux de stations d'observation des precipitations
- Res-eaux -dLobservation de 11 evaporation
carte 4.1 b) - densite des reseaux de bacsdlevaporation
78
80
Tableau 4.1.3 a) - Reseaux d'observation des eaux de surface-debit •••••••••••••••••••••••••••••••••••• 82
carte 4.1 c) - densite des reseaux de stations mesurant Ie debit
Tableau 4.1.3 b) - Reseaux d'observation des eaux de surface-niveau, sediments et qualite de lleau •••• 84
4.2 Asie
Tableau 4.2.1 - Reseaux d'observation des precipitations.
carte 4.2 a) _ densite des TeSeaUX de stations dlobservation des precipitations
85
Tableau 4.2.1 a) - Reseaux d'observation(au-dessous de 500 m)
des precipitations87
Tableau 4.2.1 b) - Reseaux d'observation des precipitations(501-1000 m) .•••••...•...•....•.......... 88
~] v
"FcrlliJ.i.eUll'(' 4: •. 2 •.1 c-}' - R'E!'se-aux d"observation d'es prec.ip:itations.(1001-15Q(lm) ".~ ~ ••• , •••••~. &g
Tableau 4.2'.1 d} - Keseo:ux drob-servation des precipitatio:lls(1501-2000' m)' •••• ••• • •.• ... ••.• •• • .. •• •• • ••• gO
Table-a:u, 4.:2".1 e)' - Res-ea-ux d:J:observation des precipitatio.ns(2001-2500 m) " " •• • • 91
Tahleau 4.2•.1 f} - Reseaux d"'observatian(au-dessus d'e 2500' m)
des precipitations
Ta&leau 4.2.2 _. ReseolJx d'ro-hse-xo/ction de: l"evaporation- ._ .....
c'arte- ~.:at b.} - den.s.it€- de-s- re.s:eaux d:e~ hacsd" evapo'ra:t-io:1:1l
93
Tableau lL2•.a o} - Reseaux d'1'obse-rvaiion des eaux de: sUTf-cJ.c.e: -de:bit ...,., .. ., •. ,.,~.·.._~._._.,o> ..,",O ._ ....... -.0 •••••_ •••, ....''0••,''''." .. '"' 9'5,
c.o;I.te 41 •.2" c): - dfensi.fe d;e.s· res:ecrux d~e st:ut.ions- me:s:l:Jran,t 1.e d'eb:&t:
Tcrbleau 4 •.-2.3- oJ - Resea-l:Jx d:';o'bs"ervati:o~n d"e's eaux d:e s"urfac.e: -mlvequ" sediments et qualite de L'eav ••~... 97
Tauleau 4.2•.4 _. Re.seaux d":obse:rvatlon: d:es e:a,ux s.o.ut.erraines 98'
Tableau 4.3.1
Tableau 4.3.2
_ Re'sea'ux d"observatio'n des precipitations •.• 99-
carte 4.3~ o} - d'ens-ite" des reseaux de sta-tions d"'olJservation des precipitations
_ Reseaux d'observation de l'evaporation 101
carte 4.3 b) - d€nsite des reseaux de bacsd' evapo.ration.
Tableau 4.3.3 oJ - Reseoux d1observation des eaux de surface -debi t ••......•••••.••.•.•.•.•••.• '. • .•••• •• 103
carte 4.3 c) - densite des reseaux de stations mesurant Ie debit
Tableau 4.3.3 b) - Reseaux d'observotion des eaux de surface niveau, sediments et quolite de 1 1eau ••.•• 105
Tableau 4.3.4 Reseaux d'observation des eaux souterraines 106
xv
4.4 Amerique du Nord et Amerique centrole
Tableou 4.4.1 - Reseaux d'observation des precipitations •• 107
carte 4.4 a) - densite des reseaux de sta-tions d'observation des precipitations
Tobleou 4.4.2 - Reseaux d'observation de l'evaporation
carte 4.4 b) - densite des reseaux de baesd'evaporation
109
Tableau 4.4.3 a) - Reseaux d'observation des eaux de surface -debit..................................... 111
carte 4.4 c) - densite des reseaux de stations mesurant Ie debit
Tableau 4.4~3 b) - Reseaux d'observation des eaux de surface niveau, sediments et qualite de l'eau ••.•. 113
Tobleou 4.4.4 - Reseaux d1observation des eaux sQuterraines 114
4.5 Pocifique Sud-Ouest
Tableau 4.5.1 - Reseaux d'observation des precipitations.o 115
carte 4.5 a) - den site des reseaux de sta-tions d'observation des precipitations
Tobleou 4.5.1 0) - Reseaux d'observotion(au-dessous de 500 m)
des precipitations••••••••••••••••• <> ••• 117
Tableau 4.5.1 b) - Reseaux d'observation des precipitations(501-1000 m) •••••••••••••••••••••••••••••• 118
Tableau 4.5.1 c) - Reseaux d1observation des precipitations(1001-1500 m) ••••••••••••••••••••••••••••• 119
Tableau 4.5.1 d) - Reseaux d'observation des precipitations(1501-2000 m) ••••••••••••••••••••••••••••• 120
Tableau 4.5.1 e) - Reseaux d'observation des precipitations(2001-2500 m) •••••••••••••••••••.••••••••• 121
Tableau 4.5.1 f) - Reseoux d'oQservotion(ou-dessus de 2500 m)
des precipitations..................... 122
'{Vj
Tableau 4.5.2 - Reseaux d'observation de l'evaporation •••. 123
carte 4.5 b) - densite des reseaux de bacsd'evaporation
Tableau 4.5.3 a) - Reseaux d'observation des eaux de surface -debi t .•..••••••••••..••..•.••.•.•.••..••.• 125
carte 4.5 c) - densite des reseaux de stations mesurant Ie debit
Tableau 4.5.3 b) - Reseaux d1observation des eaux de surface nlveau/ sediments et qua1ite de l'eau ••... 127
Tableau 4.5.4
4.6 Europe
Tableou 4.6.1
- Reseaux d'observation des eaux sQuterraines 128
- Reseaux d'observation des precipitations •. 129
carte 4.6 a) - den site des reseaux de sta-tions d'observation des precipitations
Tableau 4.6.1 a) - Reseaux d'observation(au-des so us de 500 m)
des precipitations131
Tableau 4.6.1 b) - Reseaux d'observation des precipitations(501-1000 m) •••••••••••••••••••••••••••••• 132
Tableau 4.6.1 c) - Reseaux d'observation des precipitations(1001-1500 m) ••••••••••••••••••••••••••••• 133
Tableau 4.6.1 d) - Reseaux d'observation des precipitations(1501-2000 m) •••• 0........................ 134
Tableau 4.6.1 e) - Reseaux d'observaiion des precipitations(2001-2500 m) ••••••••••••••••••••••••••••• 135
Tableau 4.6.1 f) - Reseaux d'observation(au-des sus de 2500 m)
des precipitations136
Tableau 4.6.2 - Reseaux d 1 observation de l'evaporation •••• 137
carte 4.6 b) - densite des reseaux de baesd'evaporation
XVII
Tableau 4.6.3 a) - Reseaux d'observation des eaux de surface -debi t .••.••....•..•...••.••••.••.•••••.•.• 139
carte 4.6 c) - den site des reseaux de stations mesurant Ie debit
Tableau 4.6.3 b) - Reseaux d'observation des eaux de surface niveau, sediments et qualite de Lleov ••••• 141
Tableau 4.6.4 - Reseaux d'observation des eaUx souterraines 142
caracteristiques (superficie,nambre de stations; budgetde l'equipement et de 10 mainte-
5. EXPLOITATION DES RESEAUX HYDROMETRIQUES - COUT ET MAIN-D'OEUVRE ••...... 143
Regions temoins representatives;population, climat, topographie)iannuel: coOt de 10 main-d'oeuvre,nance; revenu par personne
Tableau 5.1
Tableau 5.2
CoOt estime de l'exploitation des reseauxhydrometriques ..•••••.••..•...•••••.•..••• 144
- Main-d'oeuvre utilisee pour l'exploitationdes reseaux hydrometriques •••••••••••••••. 147
6. BANQUES DE DONNEES HYDROLOGIQUES • •••• g •••••••••••••••••• g •••••••••••••• 150
Source des renseignementsi donnees hydrologiques; definitiond'une banque nationale de donnees hydrologiquesi donnees so usforme numerique; archives de donnees numeriques; donnees de baseet donnees analyseesi catalogues
6.1 Afrique
Tableau 6.1.1 - Banques nationales deques ~ organisation et
donnees hydrologiinstallations .••••• 152
Tableau 6.1.2
Tableau 6.1.3
_ Rassemb1ement et traitement automatique desdonnees hydrologiques ..•...•.••..•...•..•. 154
- Mise en archives des donnees hydrologiques 156
XVI II
6.2 Asie
Tableau 6.2.1
Tableau 6.2.2
Tableau 6.2.3
6.3 Amerique du Sud
Tableau 6.3.1
Tableau 6.3.2
Tableau 6.3.3
- Banques nationales de donnees hydrologi-ques - organisation et installations ••.. G. 158
- Rassemblement et traitement Qutomatique desdonnees hydrologiques ..••.•...•••.••••.••• 159
- Mise en archives des donnees hydrologiques 161
_ Banques nationales de donnees hydrologi-ques _ organisation et installations •••••• 163
_ Rassemblement et traitement automatique desdonnees hydrologiques •••••••••••••••••.••• 164
_ Mise en archives des donnees hydrologiques 165
6.4 Amerique du Nord et Amerique centrale
Tableau 6.4.1
Tableau 6.4.2
Tableau 6.4.3
- Banques nationales de donnees hydrologi~
ques - organisation et installations •••••. 166
- Rassemblement et traitement Qutomatique desdonnees hydrologiques ••••••••••••••••••••• 167
- Mise en archives des donnees hydrologiques 169
6.5 Pacifique Sud-Ouest
Tableau 6.5.1
Tableau 6.5.2
Tableau 6.5.3
- Banques nationales de donnees hydrologi-ques ~ organisation et installations .~ •••• 170
- Rassemblement et traitement automatique desdonnees hydrologiques •••••••••••••••••.••• 171
_ Mise en archives des donnees hydrologiques 172
6.6 Europe
Tableau 6.6.1
Tableau 6.6.2
Tableau 6.6.3
6.7 Resume
Tableau 6.7.1
Tableau 6.7.2
Tableau 6.7.3
XIX
- Banques nation ales de donnees hydrologi-ques - organisation et installations •..••• 173
- Rassemblement et traitement Qutomatique desdonnees hydrologiques ...••.•...••••..•.••• 175
- Mise en archives des donnees hydrologiques 177
- Banques nationales de donnees hydrologi-ques - organisation et installations .•.•.. 179
- Rassemblement et traitement automatique desdonnees hydrologiques .••.••..••••..••..•.. 180
- Mise en archives des donnees hydrologiques 181
CTATilCTilQECKAH ilH~OPW~UilH 0 AEHTEnbHOCTilB OEnACTil OITE~A~ilBHOn rilg~onorilil
AHHOTTIPOBAHHOE COAEPlliAHilE
ITPEAilCJlOBilE
1 . BBEAEHilE.
Ue~b rry6nMKa~MM - MCTOqHHKM HHwopMaqHH - TIepHO~HqHOCTb
H rrpe~CTaBneHHe TIy6nHKa~MH
2. MElliAYHAPOAHblli il HAUilOHAJlbHblli OprAHilSAUilil, SAHil~IDmHECH
BOITPOCAMTI rilAPOJlOrilil M BOAHMX PECYPCOB .
Orrpe~eneHHe rrpaBHTenbcTBeHH~x H HerrpaBHTenbcTB8HHMX
opraHH3a~HHj opraHHsaqHH HaqHoHanbHNX cny~6, 3aHHMaro~HxcH
rM~pOnOrMqeOKHMH C8TRMH H cTaHQMHMM; cny~6N, OTB8TCTB8HHN8
sa pa3nH~HNe BH~N rH~pOnOrMqeCKOH ~eHTenbHOCTH; Me~Be
~OMCTBeHHaH Koop~MHaqHH
~
XXXIX
1
2
Ta6JIHqa 2.1 - Me:IKAYHap0;IJ;Hbl8 npaBHT8JIhOTB-8HHbT8 opr-aHM3-a:gMM -
rJI06aJIbHbI8 H perHOHaJIbHbJ8 4
HaSBaHMH H a,n;peca
Ta5JIHqa 2.2 - Me:IKAyHapO,II;HN8 HerrpaBMT8JIbCTB8HHH8
opraHHSalI,HM .
HasBaHHH M aApeca
5
Ta6JIM1I,a 2.3 - HagHoHaJIbHH8 CJIy~6H, 3aHMMaID~HecH
onepaTHBHo C8TflMM CTaH1I,HH AJIa rMAPOJIO-
rH~eCKHX ~eAefi . 6
HaSBaHHfl H a~peca c~y~6; OTB8TCTBeHHM8
OpraHbJ
Ta6~HQa 2.4 - ~eflTe~bHocTb Ha~HOHaRbHbJX cny~6}
rrepe~HC~eHHbJX B Ta6~H~e 2.3 . 24
XXII
HaOJIIO,n;eHHH
sa rrO,1I;S€MHMMH Bo,n;aMH H KJIHMa~a~OrHqeCKHe
HaOJIID,n;8HMHj xpaH8HH8 11 TIONeR AaHH~~;
e~erOAHHKH H KaTaJIOPHi CTaH,n;apTMj
Me~Be,n;OMCTBeHHaH Koop,n;MHa~HH
Ta6JIM~a 2.5 - qHCJIO cTpaH, HMeID~Hx rHAPOJIOrH~eCKHe
cny%6N . 34
CTaTHCTH~eCKHH 0630p,ocHoBaHHMMHaTa6nHI\e 2.4
Ta6JIH~a 2.6 - qHC~O cTpaH, MMero~Hx oeTH ,1I;JIH rrpoB8,n;8HHH
HaOJIID,n;8HMH 3a KOHKpeTHNMH 3JI8MeHTaMH 34
CTaTHCTRQeCKHH 0630p, oCHoBaHHHH Ha
Ta6nHI\e 2.4
Ta6JIH~a 2.7 - qHCJIO cTpaH, rry6JIHKyro~Mx e~ero,n;HMKH MJIMC60pHHKH 11 KaTaJIOrH . • 35
CTaTHCTH~eOKHH 0030P, oCHoBaHHHH Ha
Ta6nHI\e 2.4
3.
TaOJIHua 2.8 - Me~BeAoMcTBeHHaH KooPAHHaUMH .
CTaTMC-THlIeCKHH 06 30p, oCHoBaHHHH Ha
Ta6nHI\e 2 .. 4
rnABHNE PE~HNE EACCEHHH
enReGK rJIaBHMX peQHNX- 6acc8HHoB, Me~,n;YHapo,n;HaH CMCT8Ma
orr03HaBaT8JIbHMX HOMepoB rH~ponorH~ecKHx Ha6~IDiaTe~hH~x
cTaH~HH - Me~Be~OMCTBeHHoe COTpY~HHqeCTBO B peqH~X
6acceuHax - BOAoc6oPN
Ta6nH~a 3.1 - rnaBHNe pe~HNe 6acceuHN B AwpHKe .
KapTa 3 (a) - Me%~YHapo~HNe peQHNe6acceuHN - AwpHKa
Ta6~H~a 3.2 - rnaBHH8 pe~HHe 6acceliHH B A3HH •
KapTa 3 (b) ~ Me%~YHapO~HNe pe~HNe
6accefiHH - A3HE
36
. 37
39
45
XXI II
ILLa6JIIIIJ,a ~~. ~~ - l'JIaBHbJ8 pe'Y:HbJ8 6aCC8MHbJ B
lOJKHOM AMepl1K8
KapTa 3 (c) - Me~~YHapo~H~e pe~HHe
6aCC8MHbJ - IDMHaR AMepHKa
Ta6~IT~a 3.4 - r~aBHHe peqHHe 6accellHH B CeBepHollIT UeHTpa~bHoll AMepITKe
KapTa 3 (d) - Me~~YHapo~HHe peqHHe
6accellHH - CeBepHaH IT UeHTpa~bHaH AMepITKa
55
Ta6~Ml.J,a 3.5 - rnaBHbJ8 peQHH8 6aCC8HHbJ B IDro-3arra~HoH
qaCTH TMxoro OKeaHa
KapTa 3 (e) - Me~~YHapo~HHe peQHHe6aCC8HHbJ - roro-3arra~Hafl qaCTb THXOTOOKeaHa
Ta6nHIJ,a 3.6 - rnaBHbJ8 pellHbJ8 6aCC8HHbJ B EBpon8
KapTa 3 (f) - Me~AYHapo~HHe peQHHe5aCC8HHbJ - EBpana
.• 59
. 62
Ta6nHIJ,a 3.7 - Me~Be~oMcTBeHHoe COTpY~HHqeCTBO B Me~~y-
HapoAHbIx peQHbIX 11 o3epHbIx 6acc8HHax . 68
perMOR H 6acc8HH; Ha3BaHH8 yqpe~AeHHfl;
cTpaHa-qneH; illTa5-KBapTHpaj rCA cornalli8HHH; BRA yqpe~AeHHH; 06naCTh
COTPY,IJ,HH1J8CTBa
4. CETh rH~POnOrH~ECKHX CTAHUHH HAEnID~EHHH.
CTaTHCTHKa TIO cy~eCTBYID~HM C8THM, HCTDQHHKH HH~OpMal.J,HH;
peKOM8H,IJ,OBaHHaH MHHHManbHaR rrnOTHOCTb ceTeR ARfl H3MepeHHH
oca~KOB, HcrrapeHHR, rH~pOMeTpHqeCKHX Ha6~ID~eHMM, Ha6~ID~eHHtl
3a rrepeHOCOM HaHOCOB M KaqeCTBOM BO~~; rr~OTHOCTb
cymecTByromHX C8T8H
4.1 AcjJpITKa
Ta6RH~a 4.1.1 - C8TH cTaH~MH ~~H Ha6AID~eHHll 3a
OCa~KaMl1 .
KapTa 4.1 (a) - rr~OTHOCTb cTaHQHll~~R Ha6nID~eHHH 3a oca~KaMH
. 74
• ';'8
XXIV
- CeTR cTaHgHH ~~H Ha6nm~eHMtt 3a
Hcrrap-eHH€M .
KapTa 4.1 (b) - ilJIOTHOCTb l1Cnap'fTeJIelt
80
'1'a6JIl1l\a 4.1.3 (a) - Ce Tl1 CTaHl\l1H ,D,JIi! Ha6JIlO,D,eHl1H saIIOB8'PXHO,CTHbTMR Bo,n;aMI1 - pacxoJI.
!{apTa 4.1 (c) - nJIOTHOCTb CTaHl\l1H ,D,JIi!Ha6JIIO.n;eHHtt 3a I;Jac-xo,n;oM
82
Ta6JIl1l\a 4.1.3 (&) - CeTl1 cTaHl\l1H ,D,JIi! Ha6JIlO,D,eHl1R sa IloBepxHO-CTHbTMH BO-,lJ;aMli - ypOB8Hb, HaHOCbI
H Kaq-eC'JrBO BO-)f;bJ ~ 0- • • • • .' 84
4.2 ASlf'"
Ta6JIl1l\a 4.2.1 Ce-TH C.T-aHIJ;HR ,n;JIH Ha6JIIO,II;8HHH 3a
oc.a,IJ;KaMY • '"
KapTa 4.2 (a) - IlJIOTHOCTb cTaHl\HH,.n;JlH Ha6JIIO;IJ;.8HHH sa Oca,TI.KaMH:
85
Ta6JIlfl\a 4.2.1 (a.) - CeTH GTaHgHH. ,n;JIH
oca.n;xaMR
Ha6JIIO,lI,8HHH 3a
(Hl1JKe 500 M) 87
Ta6JIl1l\a 4.2.1 ( b)
Ta6.• l1l\a 4.2.1 (c)
Ta6JIl1l\a 4.2.1 ( d)
Ta6JIlfl\a 4.2.1 (e)
Ta6JIlfl\a 4.2.1 ( f)
Ta6JIlfl\a 4.2.2
" 1t " (501-1 000)
" " 1'1' (1 oJ01-1 500) .
" " " (1 501-2 000) .
" " " (2 001-2 500) .
" " " ( BbJIIIe 2 500 M)
- CeTH CTaHUHH AJIH Ha6JIIO.n;eHHM 3aHcnapeHH8M .
KapTa 4.2 (b) - nJIOTHOCTb l1CIlapl1TeJIeR
88
89
90
91
. 92
93
Ta6JIl1l\a 4.2.3 (a) - CeTl1 cTaHl\l1H ,D,JIi! Ha6JIlO,D,eHl1H saTIOBepXHocTHMMH Bo.n;aMH - pacxoJI.
KapTa 4.2 (c) - nJIOTHOCTb cTaHl\l1H ,D,JIi!Ha6JIro.n;eHHH sa paCXQ)J.oM
95
Ta6~ll~a 4.2.3 (b) - CeTll cTaH~lltl ~~H Ha6~ro~8Hlltl
3a nOBepxHocTHHMH Bo~aMH
YPOB8Hb, HaHOO~ H KaqeCTBO
BO~bl
xxv
97
Ta6Jlll~a 4.2.4
Ta6Jlll~a 4.3.1
Ta6~H~a 4.3.2
- CeTll cTaH~lltl ~~R Ha6~ro~eHlln
sa rrO~3eMHNMH BOAaMH .
- CeTH CTaH~HH ,n;nH Ha5nIO,n;8HHHsa oca,n;KaMH .
KapTa 4.3(a) - n~OTHOCTh cTaH~lltl
AHa Ha6nWA8HHH sa ocaAKaMH
- CeTH CTaH~HH AHE Ha6HIDA8HHH 3aHcrrapeHH8M .
98
. 99
· 101
KapTa 4.3(b) - nnOTHOCTh HcnapHTeflen
Ta6flll~a 4.3.3(a) - CeTll cTaH~Htl ~flR Ha6flro~8HHll 3aITOBepXHOCTHHMH BOAaMH - pacxo,n;
KapTa 4.3(c) - nflOTHOCTh CTaH~Hll
AHff Ha6HWAeHHH sa pacxo,n;OM
· 103
Ta6flH~a 4.3.3(b) - CeTH CTaH~HH ~flR Ha6flID~eHHH 3arrOBepXHOCTHNMH BOAaMH - ypOB8Hh,
HaBoCN H KaqeCTBO BO)J;N . . 105
Ta6flHlCja 4. 3 . 4 - CeTH cTaHqHH AHff Ha6~ID,n;eHHM sa
nO,1J;38MHNMH Bo,n;aMH • 106
Ta6flH~a 4.4.1
Ta6~H~a 4.4.2
- CeTH cTaHqHH AnE Ha6llw,n;eHHH saoca.n;RaMH .
KapTa 4.4(a) nflOTHOCTh CTaH~llll
)l;JIH Ha6JIIO,n;eHHH sa o-ca,n;KaMH
- CeTH cTaHqHH AJIH Ha6JIIDAeHHH 3aHonapeHH8M .
· 107
109
KapTa 4.4(b) - nflOTHOCTh HcnapllT8fl8ll
XXVI
Illa 6JIHu,a t:J .1.3 (a) - CeTl1 CTaHlJ,HM ,IJ;JIH H-a-6JIlO,n;e'fH:IH: ·3,a
TIOB:epXH-OCTHblMI1 Bo;rr,aMM - IJacxo,n; 111
KapTa 4.4 (c) - llJIOTHOCTb CTaHI\Hll
)J;JIJI Ha6JIIO,II,8HMH ·3a pacXOJl;OM
Ta6JIILI\a 4.4.3 (h) - G8'TH CTaHl\llll ,1\JIJI Ha6JIIO,IJ.8HHll 3a
noo:S'epXHOCTHblMH 'BO;n;-aMM - ,YPOB8Hb"
H'aH:O'C1iJ '11 RaY8,C'TBO BD.,IJ;hT ~ .. .. .. 113
- De'J'Hc'T:alHJ;'MM iIT,JIH. Ha:6.JIIO;I!;:eRHM ·3a
npA3~MHHMH Bn~aMI1 . 114
Ta6JIlll\a 4.5..• 1 - Ge-T 11 :c:TaHIJ;-H.H ,1I;JLfI 1!a6JIfO.;JI;-:eHHM sa
;o'G-.a)J;1Ka:MH _. 00 -.0 ,. .. '. .. ..... " '. ...
KapTa 4.'5 (a)- mroTHo'CTf> CTaHl\Hll
;IJ,JIR" Ha6JIIO,Il,8HHll .sa -O'c-a;U;KaMH
115
Ta6JIllIla 4.5.1 (a) - G8T·ll CTaHIJ;HH ,IJ.JIJI -Ha-6 JI.1O;1I;.8HHH 3a
o-e-a.n;KaMH (HH"'8 500 M)
Ta6JI.HI\a 4.5 .. 1 (:b) 11 " " (501-1000 M)
T.a6JIRI\a 4.5.1 (c ) " " " (1001-1500 M)
Ta6JIHIJ;a 4.5.1 (il ) " " " (1501-2000 M)
Ta6.JIllIJ;a 4.5.1 (e) " -I' 11 (2001-2500 M)
Ta6.JIHIJ;a 4.5.1 (f) - " " " ( BbJIIl8 2500 M)
117
118 •
119
120
121
. . 122
- Ge.T.ll CTaHJJ;I1:.H )I,JIH Ha-5JI.ro.n;,8HHi1 sa
l:rcnapBHRe:M • ,.
Kal'Ta 4.5 (h) - llJIOT1WeTf>
HcnapUT'8JI-8H
123
Ta6JIHI\a 4.5.3 (a.) - G8TH CTam'lHll ,1\JIJIHa6JIIO,1\8HHll 3a
lIOB8PXHOCTHbJMI1 Bo,n;aMH - .pacxo,n; 125
KapTa 4.5 (e) - ITJIOTHOeTb CTaHI\l1ll
,IJ;JIH Ha6J1IO.n;eHHH sa pacxo.n;oM
XXVII
Ta6nM~a 4.5.3 (b) - CeTM cTaH~MH ~nR Ha6nID~eHMH 3arroBepxHocTH~MH Bo~aMH - YPOB8Hh,
HaHOCH H Ka~eCTBO BO~~ . 127
Ta6JIM~a 4.5.4 - CeTM cTaH~HH ~~H Ha6~ID~eHHH 3aIIO,.n; 38MHbJMH BO)J.a~H 128
4.6 EBporra
Ta6nM~a .4.6.1 - CeTM cTaH~MH ~nR Ha6.lIlo,n;eHMH 3aDca,II,KaMH . 129
KapTa 4.6 (a) - IIJIOTHOCTh CTaHIJ,HH
,n;JIH Ha6JIIOA8HHH 3a oca,n;KaMH
Ta6nM~a 4.6.1 (a) - CeTM CTaHI..J,HR ~nR Ha6JIIO,n;eHHH 3aoca,II,KaMH (HMlKe 500 M) 131
Ta6nll~a 4.6.1 (b) - " " " (501-1000 M) 132
Ta6JIM~a 4.6.1 (c) - " " " (1001-1500 M) 133
Ta6nll~a 4.6.1 ( d) - " " " (1501-2000 M). 134
Ta6nM~a 4.6.1 ( e) - " " " ( 2001-2500 M) 135
Ta6nll~a 4.6.1 ( f) - " lJ lJ (BbJllle 2500 M) 136
Ta6nM~a 4.6.2 - CeTll cTaH~llH ~nR Ha6JIIO,n;eHHH 3aHcnapeHH8M 137
KapTa 4.6 (b) - rrnOTHOCTh llcrrapMTeneH
Ta6nM~a 4.6.3 (a) - CeTll cTaH~MH ~nR Ha6nID~eHllH 3aITOBepXHocTH~MH BOAaMM - pacxo,n; 139
KapTa 4.6 (c) - rrnOTHOCTh cTaH~llH
)I,JIH Ha6JIIOA8HHH sa pacxD)I,OM
Ta6nll~a 4.6.3 (b) - CeTll cTaH~llH ~nR Ha6nro~eHMH 3arroBepxHocTH~MH BO)I,aMH - YPOB8Hh l
HaHDCM M Ka~eCTBO BO)I,H . 141
Ta6nll~a 4.6.4 - CeTH CTaHIJ,HH AJIE Ha6JIIOA8HHH sa
nO~3eMHHMH Bo.n.aMH . 142
XXVIII
~) .
cO'
PAl'XU)lM Ii fJEPl;OHAJI iJ,JlH OEGJIYJI(l\lJAHlllJ fll,!lPOME1'PI\QEGKllX GETER
BM50pOQHM8 perrpe3eHTaTHBH~e perffOH~~ xapaKTepHcTHKH
(ITJIOm;a.n;h, HaC8JI8HH8,. KJIllMaT, TOiloTpaepHH); KOJII11:f8CTBO
C-TaHIJ,nii; rO)J,oBoR 6JQ,Il)K8T, pacx0,ll,bJ Ha nepCOHaJI,
oGopy.n;oBaHH8 H yxo)J,; )J,OXQ)J, Ha AYmy HaC8JI8HHH
Ta6JIHIJ,a 5~1 - CM8Ta paeXo,ll,OB )J,JIH onepaTHBHbrr
rn,D;IloM8TPUt.I8CKI1X ceT-eM
Ta6JlHIJ,a 5 .. 2 --. IIepCQHaJI-" IfC-rLO-JIb3:ye.MW .nJIE
06CJIyMliBaHHH rli.n;~QMeTpa~ecKax
ceT-eM .,
EAHKIl fH,!lPOJlOfWIEGKIlX ,!lAHHHX
MCTOQHHK HHWOpMaIJ,HHj rHAPOJIOrn1:feCKH8 )J,aHHRe;
onpe)J,8JI8HHe HaIJ,HOHaJIbHMX GaHKoB rH,n;pOJIOrHt.IeCKHX
,ll,aHHHX; ,ll,aHHN8 B IJ,HWpOBOH epOpM8j IJ,HwpoB~e apxHBH;
OCHOBHbJ8 fl npOaHaJlIl.3HpOBaHHbT8 .n;aHHbJ8; KaTaJIOTn
6.,1 Aq,pllKa
_Ta6JIuu;a 6.1.1 - HaqH:OHaJIbHbT8 GaHKH: rlf.n;pOJIOrl1l'JeCKHX
AaHH~X - opraHH3a~RH H cpe~cTBa
Ta6JIfl:u:a 6 .. 1.2 - C60p rn,1I.pOJIOrH'LIeCKllX ,n;aHlf.bIX H
aBTOMa.THlieCKHfl o.6pa:6oTKa
Ta6JIllI1a 6.1.3 - XpaHeHHe rHi1pOJIOrll'leCKllX
,n;aHHbIX .
6.2 A3llJI
• 143
144
14'1
. 150
156
Ta6JIllI1a 6.2.1 - HaI1HOHaJIbH~e 6aHKH rHi1pOJIOrH'leCKHX
,n;aHHbIX - opraHH3aqHH M cpe,n;cTBa 158
Ta6JIllI1a 6.2.2 - G60p rHi1pOJlOrH'leCKHX i1aHH~X H
aBTOMaTli'LIeCKaa o6pa6oTKa 15~
Ta6JIH:u:a 6.2.3 - XpaHeHHe rH,n;pOJIOrH1IeCKHX ,n;aHHWX . .Lol
XXIX
Ta6AH~a 6.3.1 - Ha~HoHaAbHNe 6aHKH rH~poAorH~ecKHx
~aHHNX - opraHH3a~HH H cpe~cTBa 163
Ta6AH~a 6.3.2 - C60p rH~poAorH~ecKHx ~aHHNx HaBTOMaTHQeCKaH o6pa6oTKa
Ta6AH~a 6.3.3 - XpaHeHHe rH~ponorH~ecKHx ~aHHNX
6.4 CeBepHaH H ~eHTpaAbHaH AMepHKa
164
165
Ta6AH~a 6.4.1 - Ha~HoHaAbHNe 6aHKH rH~poAorH~ecKHx
~aHHNx - opraHH3a~HH H cpe~cTBa 166
Ta6nH~a 6.4.2 - C60p rH~poAorH~ecKHx ~aHHNx HaBTOMaTH~eCKaH o6pa6oTKa 167
Ta6AH~a 6.4.3 - XpaHeHHe rH~ponorH~ecKHx ~aHHNX . 169
6.5 IDro-3ana~HaR ~aCTb Tnxoro OKeaHa
Ta6~H~a 6.5.1 - Ha~HoHa~nHHe 6aHKM rH~pO~OrHqeCKHX
~aHHNX - opraHH3a~HH H cpe~cTBa 170
Ta6nH~a 6.5.2 - C60p rH~ponorH~ecKHx ~aHHNx HaBTOMaTH~eCKaH o6pa6oTKa 171
Ta6AH~a 6.5.3 - XpaHeHHe rH~ponorH~ecKHx ~aHHNX . 172
6.6 EBporra
Ta6~H~a 6.6.1 - Ha~HoHa~bHHe 6aHKH rH~pOROrHqeCKHX
~aHHNx - opraHH3a~HH H cpe~cTBa
Ta6nH~a 6.6.2 - C60p rH~ponorH~ecKHx ~aHHNx HaBTOMaTRQeCKaH o6pa6oTKa
.173
175
Ta6nH~a 6.6.3 - XpaHeHHe rH~ponorH~ecKHx ~aHHNX . 177
.lllaOJlll.IJ;a n.? .."1 - HaI.U1:O-HaJI:DHbIB OaHK.I1· FHA.p·a'JIo:PH"tI(HC"ItMX
,1l;aHtIBrX _. o,praHM::Jalli.I1H 11' c·pe.n;c'TBa 1 ?~)
~l~a6JI:}HJ,a f)- ,'I . ~:~:. - COO'I! FJio;IJ,p'oJrorHLJeCKliX ARHiHblX 1'1"
aBTOMRTli-:q.eCKaH o6paJ-5o.TKa leo
181
INFORMACION ESTADISTICA SOBRE LAS ACTIYIDADES DE HIDROLOGIA OPERATIYA
INDICE ANOTADO
PREAMBULO ......................................................Pagina
XXXIX
1. INTRODUCCION ••••••••••••••••••••••••••••••••••••••••••••••••• 0 ••••••••• 1
2.
Finalidad de Ie publicaci6nj fuentes de informacionj frecuenciay presentaci6n de 10 publicaci6n
ORGANIZACIONES INTERNACIONALES Y NACIONALES QUE TRATAN DE LAHIDROLOGIA Y DE LOS RECURSOS HIDRICOS •••••••••••••••.••••••.•••••••••••
Definicion de 10 que se entiende por organizaciones gubernamen~
tales y no gubernamentales; organizaci6n de los servicios nacionales encargados de las redes y estaciones hidro16gicasj servicios responsables de diverses actividades hidrologicasj coordinacion entre los servicios
2
Tabla 2.1 - Organizaciones internacionales gubernamentales -mundlales y regionales •••••••••••••••••••••••• 0...... 4
Nombres y senas
Tabla 2.2 ~ Organizaciones internacionales no gubernamentales •••• 5
Nombres y senas
Tabla 2.3 - Servicios nacionales encargados del funcionamiento de las redes de estaciones para fines
Nombres y senas de los servicios; autoridadesresponsables
Tabla 2.4 - Actividades de los servicios nacionales resenadosen 10 Tabla 2.3 ••••••••••••••• to •••••••••••••••• 0...... 24
Actividades hidrometricas, observaciQnes climato16gicas y de las aguas subterraneaSi archivo ybusqueda de datos; cnuarios y cat61ogos; normas;coordinacion entre servicios
Tabla 2.5 - Numero de paIses que disponen de 5ervicioshidrol6gicos ••••••••••••••••••••••••.•••••••••••••••• 34
Resumen estadfstico basado en la Tabla 2.4
Pagina
Tabla 2.6 - Numero de paIses que tienen en explotaci6nredes para 10 observacion de elementos es-pecificos ."""C'GG .. ~GG."" •• "Q •••• "C •• " ..... c"C""........ 34
Resumen estodIstico basado en 10 "fabla 2 .. 4
Tabla 2.7 ~ Numero de poises que publican anuarlOS 0
resumenes y catalogos. '''''''' G'. a........................... 35
Resumen estadlstico bosado en 10 Tabla 2.4
Tabla 2 .. 8 - Coordinaci6n entre los servicios o •• ~ . 36
3.
Resumen estadistico bas ado en 10 Tabla 2 .. 4
PRINCIPALES CUENCAS FLUVIALES ••••••••••••••••••••••••••••••••••••••••••
Lista de las principales cuencas fluviales, sistema interna~
cional de numeros de identificaci6n de las estaciones hidro~
16gicas de observaci6n; cooperaci6n institucionalizada delas cuencas fluviales; zonas de captaci6n
37
Tabla 3.1 - Principales cUencas fluviales en Africa ..... "0.,, ...... 39
Mapa 3(0) - Cuencas fluviales internacionales -Africe
Tabla 3.2 - Principales cUencas fluviales en Asia c ....... "oc ....... 45
Mapa 3( b) - Cuencas fluviales internacionales -Asia
Tabla 3.3 - Principales cuencas fluviales en America del Sur 50
Mapa 3(c) - Cuencas fluviales internacionales -America del Sur
Tabla 3.4 - Principales cUencas fluviales en America delNorte y America Central ........... c •• e ............ c •• c •• 55
Mapa 3( d) - Cuencas fluviales internacionales -America del Norte y America Central
Tabla 3.5 - Principales cuencas fluviales en el Suroestedel Pacifico .................................... 0 ............... 59
Mapa 3(e) - Cuencas fluviales inte rnacionales -Suroeste del Pacifico
Tabla 3.6 - Principales cuencas fluviales en Europa ...... - ..... 62
Mapa 3( f) - Cuencas fluviales internacionales -Europa
XXXIII
P6gina
Tabla 3.7 - Cooperaci6n institucionalizada en las cuencasfluviales y lacustres internacionales •••••••••••••• 68
Region y cuenca; nambra de 10 instituci6n; paisesmiembros; sedes; ana del acuerdo; tipo de instituci6n; esfero de colaboraci6n
REDES DE ESTACIONES HIDROLOGICAS DE OBSERVACION ••••••.•.•••••••••••••••
Estad!sticas relatives a las redes existentes, Fuentes de informacion; densidades rninimas recomendadas para las redes de estaciones de medida de 10 precipitaci6n, de 10 evaporacion, paralas observociones hidrometricas l para 10 medida del transportede sedimentas y para la medida de la calidad del agua; densidadde las redes existentes
4.1 Africa
74
Tabla 4.1.1
Tabla 4.1.2
- Redes de observacion de 10 precipitacion •••••
Mapa 4.1(0) _ Densidad de las estacianes deobservacion de 10 precipitacion
- Redes de observacion de la evaporaci6n •••••••
Mapa 4.1(b) - Densidad de las tanques deevaporaci6n
78
80
Tabla 4.1.3(0) - Redes de abservaci6n de las aguas super-ficiales - caudal •• ~~~eee~e8ee••• e.e •• e===ee= 82
Mapa 4.1(c) - Densidad de las estaciones demedida del caudal
Tabla 4.1.3(b) - Redes de abservaci6n de las aguas superficioles _ nivel 1 sedimentos y calidad delague 84
4.2 Asia
Tabla 4.2.1 - Redes de observaci6n de 10 precipitaci6n
Mapa 4.2(0) - Densidad de las estaciones demedida de 10 precipitoci6n
85
Tabla 4.2.1(0) - Redes de observaci6n de la precipitaci6n(a menos de 500 m) ••••••••••••••••••••••••.•• 87
Tabla 4.2.1(b) - Redes de observaci6n de la precipitaci6n(501 _ 1.000 m) •••••• "'....................... 88
Tabla 4.2.1(c) - Redes de abservaci6n de 10 precipitaci6n(1.001 - 1.500 m) 89
XXXIV
Pagina
Tabla 4.2.1(d) - Redes de observaci6n de 10 precipitaci6n(1.501 - 2.000 m) ~o .•• oo& .••• e.eo............ 90
Tobla 4.2.1(e) - Redes de observaci6n de 10 precipitaci6n(2.001 - 2.500 m) ,..... 91
Tabla 4.2.1(f) - Redes de observaci6n de 10 precipitaci6n(0 m6s de 2.500 m) .••. 0...................... 92
Tabla 4.2.2 - Recles de observaci6n de 10 evaporaci6n •••••••
Mapa 4.2(b) - Densidad de los tanques deevaporacion
93
Tabla 4.2.3(a) - Redes de observaci6n de las aguassuperficiales - caudal....................... 95
Mapa 4,2(c) - Densidad de las estacianesde medida del caudal
Tabla 4.2.3(b) - Redes deficialesdel agua
observaci6n de las aguas super- nivel, sedimentos y calidad••••• " •• 0 •••• 0 •• " •••• a ...... " ... "e .... e. 97
Tabla 4.2.4 - Redes de observoci6n de las aguassubterr6neas •••••• 0.......................... 98
4.3 America del Sur
Tabla 4.3.1
Tabla 4.3.2
= Redes de observacion de 10 precipitaci6n •••••
Mapa 4.3(0) - Densidad de las estacionesde medida de 10 precipitaci6n
- Redes de observaci6n de 10 evaporaci6n •••••••
Mapa 4.3(b) - Densidad de los tanques deevaporaci6n
99
101
Tabla 4,3.3(a) - Redes de abservaci6n de las aguas super-ficiales - caudal •.••••.•••• eee •••••••• e •••• o 103
Mapa 4.3(c) - Densidad de las estacianesde medida del caudal
Tabla 4.3.3(b) - Redes deficialesdel agua
observacion de las aguas super- nivel t sedimentos y coli dad..................................... 105
Tabla 4.3,4 - Redes de observaci6n de las aguassubterranea·s •••••••• 0 •••••• 0 •••• co. 0 •••••••• ". 106
xxxv
Pegina4.4 America del Norte y America Centrol
Tablo 4.4.1
Tablo 4.4.2
- Redes de observaci6n de 10 precipitoci6n •••••
Mapo 4.4(a) - Densidad de las estocionesde medido de 10 precipitoci6n
- Redes de observaci6n de 10 evaporaci6n •••••••
Mapo 4.4(b) - Densidad de los tonques deevaporaci6n
107
109
Tabla 4.4.3(a) - Redes de abservaci6n de las aguas super-ficiales - caudal............................ III
Mapa 4.4.(c) - Densidad de las estacionesde medida del caudal
Tabla 4.4.3(b) - Redes de observaci6n de las aguas superficia-les - nivel, sedimento y calidad del agua •••• 113
Tabla 4.4.4 - Redes de observaci6n de las aguas sub-terr6neas . 114
4.5 Suraeste del Pacifico
Tabla 4.5.1 - Redes de observocio.n dele _precipitaci6n
Mapa 4.5(a) - Densidad de las estaciones demedida de la precipitaci6n
115
Toblo 4.5.1(a) - Redes de observaci6n de la precipitaci6n(0 menos de 500 m) ••••• 90.................... 117
Tabla 4.5.1(b) - Redes de observaci6n de la precipitaci6n(501 - 1.000 m) 0............................. 118
Tablo 4.5.1(c) - Redes de observaci6n de la precipitaci6n(1.001 - 1.500 m) •••••••••••••••••••••••.•••• 119
Toblo 4.5.1(d) - Redes de observaci6n de la precipitaci6n(1,501 - 2.000 m) 0............................. 120
Toblo 4.5.1(e) - Redes de observoci6n de 10 precipitaci6n(2.001 - 2.500 m) •....••..•••.•••.•.••...•... 121
Tabla 4.5.1(f) - Redes de observaci6n de la precipitaci6n(0 mas de 2,500 m) •••••••••••••••••••••.••••. 122
Tablo 4.5.2 _ Redes de observaci6n de 10 evoporaci6n •••••••
Mopo 4.5(b) - Densidad de los tanques deevaporaci6n
123
XXXVI
P6gina
Tabla 4.5.3(0) - Redes de observaci6n de las aguas super-ficiales = caudal 0......... 125
Mapa 4.5(c) - Densidad de las estaciones demedida del caudal
Tabla 4.5.3(b) - Redes de abservaci6n de las aguas superficiales - nivel, sedimentos y calidad delas aguas "" ••.••••. 0 •••••••• 0.. 127
Tabla 4.5.4
4.6 Europa
~ Redes de observaci6n de las aguas sub-terraneas ." /1............ 128
Tabla 4.6.1 - Redes de observaci6n de 10 precipitaci6n
Mapa 4.6(0) - Densidad de las estacianes demedida de la precipitaci6n
129
Tabla 4.6.1(0) - Redes de observaci6n de 10 precipitaci6n(0 menes de 500 m) .@......................... 131
Tabla 4.6.1(b) - Redes de observaci6n de 10 precipitaci6n(501 - 1.000 m) .. 0 0 00".......... 132
Tabla 4.6.1(c) - Redes de observaci6n de la precipitaci6n(1.001 - 1.500 m) 133
Tabla 4.6.1(d) - Redes de abservaci6n de 10 precipitaci6n(1.501 - 2.000 m) .•..••.......•.......•..•..• 134
Tabla 4.6.1(e) - Redes de abservaci6n de 10 precipitaci6n(2.001 - 2.500 m) 135
Tabla 4.6.1(f) - Redes de abservaci6n de la precipitaci6n(0 m~s de 2.500 m) •••••••••••••••••••••.••• 0. 136
Tabla 4.6.2 - Redes de observaci6n de la evaporaci6n ••.•.••
Mapa 4.6(b) - Densidad de los tanques deevcporaci6n
137
Tabla 4.6.3(0) - Redes de abservaci6n de las aguas super-ficiales - caudal •••••••••••••••• eo.......... 139
Mapa 4.6(c) - Densidad de las estacianes demedida del caudal
Tabla 4.6.3(b) - Redes deficialesdel agua
observcci6n de las agucs super- nivel, sedimentos y calidad....................................... 141
XXXVII
Tabla 4.6.4 - Redes de observaci6n de las aguas subterr6neas
5. COSTE Y PERSONAL NECESARIO PARA ASEGURAR EL FUNCIONAMIENTO DE LAS
....P6gina
142
REDES HIDROMETRICAS .••.•.•.••.••.••.••.••••.••.•••••.••.•.••••.•••••.••• 143
Regiones representatives tipoj caracterlsticas (zona, poblaci6n,clime, topografla)i numera de estacionesj presupuesto cnval;gastos de personal, equipo y conservoci6nj renta per c6pita
Tabla 5.1
Tabla 5.2
- Coste estimado relativo 01 funcionamientode las redes hidrom6tricas ••••.••••••••••••••••••••
- Personal empleado para asegurar e1 funcio-namiento de las redes hidrometricos ••••• 00 ••••••••
144
147
6. BANCOS DE DATOS HIDROLOGICOS 0 150
Fuentes de informacion; datos hidrologicos; definicion de 10 quese entiende por banco nacional de datos hidro16gicos; datos presentados en forma numericc; archivos numericos; datos basicos ydatos onolizados; cat61ogos
6.1 Africa
Tabla 6.1.1 - Bancos nacionales de dotos hidro16gicos -organizacion e instalaciones y medias ••••••••••••• 152
Tabla 6.1.2 - Concentraci6n de datos hidro16gicos y pra-cesamiento automatico de los mismos ••• e........... 154
Tabla 6.1.3 - Archivo de datos hidro16gicos •••••••• 0............ 156
6.2 Asio
Tabla 6.2.1 - Bancos nacionales de datos hidro16gicos -organizQci6n e instalaciones y medios •.••••.•••..• 158
Tabla 6.2.2 _ Concentraci6n de datos hidro16gicos y pro-cesamiento automatico de los mismos •..•••.•.•••••• 159
Tabla 6.2.3 - Archivo de datos hidro16gicos ••••••.•••••••..•••.. 161
6.3 America del Sur
Tabla 6.3.1 - Boncos nacionales de dotos hidro16gicos -organizQci6n e instalaciones y medios •••••.••••.•. 163
Tabla 6.3.2 - Concentraci6n de datos hidro16gicas y pro-cesamiento automotico de los mismos ••••••••••••••• 164
XXXVIII
Pagina
Tabla 6.3.3 - Archivo do datos hidra16gicos
6.4 America del Norte y America Central
165
Tabla 6.4.1 - Boncos nocionales de datos hidro16gicos -organizQcion e instalaciones y medias ••• ~.......... 166
Tabla 6.4.2 - Concentracion de datos hidro16gicos y pro-cesamiento automatico de los mismos •••••••••••••••• 167
Tabla 6.4.3 - Archivo de datos hidro16gicos •••••••••••••.•••••••• 169
6~5 Suroeste del PacIfico
Tabla 6.5.1 _ Boncos nacionales de datos hidro16gicos ~
organizQci6n e instalaciones y medias •••••••••••••• 170
Tabla 6.5.2 - Concentraci6n de datos hidro16gicos y pro-cesomiento automaticos de los mismos ••••••••••••••• 171
Tabla 6.5.3 - Archivo de datos hidra16gicos
6.6 Europa
172
Tabla 6.6.1 - Boncos nacionales de datos hidrologicos -organizQci6n e instalaciones y medios •••••••••••••• 173
Tabla 6.6.2 - Concentraci6n de datos hidro16gicas y pra-cesamiento automatico de los mismos ••••••••••••• 0.. 175
Tabla 6.6.3 - Archivo de datos hidre16gicos 0..................... 177
6.7 Resumen
Tabla 6.7.1 - Bancos nacionales de datos hidro16gicas -organizaci6n e instalaciones y medios •••••••••••• 0. 179
Tabla 6.7.2 - Concentraci6n de datos hidro16gicos y pro-cesamiento automatico de los mismos •••••••••••••••• 180
Tabla 6.7.3 - Archive de datos hidro16gicos ••••••••• 0............ 181
FOREWORD
The WMO Commission for Hydrology at its fourth session (1972)recommended that relevant global statistics on all types of hydrological networksshould be compiled through the WMO regional associations. In addition to theinformation on hydrological networks which was gathered in accordance with thisrecommendation, a considerable amount of other information on activities inoperational hydrology was also collected from WHO Members for use by the workinggroups and rapporteurs of the Commission for Hydrology and regional associationsand by the Advisory Committee for Operational Hydrology (ACOH).
At its second session, ACOH considered that this type of informationwould be useful to Hydrological Services for their activities at national andregional levels and in particular for planning and co-ordination purposes. Itwould provide comparative information on existing densities of hydrological networks,data processing facilities, manpower, operational costs, etc. It would indicatemajor deficiencies in the operational facilities at the national and regional levelsand thus provide a basis for planning technical assistance activities. ACOH therefore recommended to the Secretary-General that the available material on nationalhydrological networks, hydrological data banks and other related matters should bepublished by WHO. The present publication is the result of this recommendation.
For completeness, information has been included in Chapter:. 2 on theorganization of national operational services dealing with hydrologi"cal' observationnetworks and services. This information was supplied by WMO Members in order torevise and bring up to date WMO/IHD Report No. 10 - Organization of Hydrometeorologicaland Hydrological Services (1969).
I wish to record my gratitude to all those who provided the necessaryinformation for this important publication. Their assistance and co-operation willbe required to enable WMO to revise and bring up to date this publication, which isplanned to be done every four years.
~.. .
D. A. DaviesSecretary-General
CHAPTER 1
INTRODUCTION
1.1 Purpose of publicotion
This publication is designed to serve as a convenient, permanent andregulorly up-dated compilation of statistical information on activities inoperational hydrology, which has been collected from Members of WHO and supplemented where appropriate by published information from elsewhere. It indicates,in a fairly tangible way, the status of progress and contains some information onfuture plans with respect to operational hydrological activities of Members at thenational, regional and global levels. It should prove valuable at all these levelsfor planning and co-ordination purposes. National situations are viewed in perspective of sub-regional, regional and global settings, thus stimulating activitiesat the national level and promoting co-operation at the regional level. Theinformation contained in this publication will help in the preliminary planning ofwater resources development and will indicate regional implications of suchdevelopment. The information should be of considerable use also to ather international organizations dealing with hydrology and water resources.
1.2 Sources of information
Information has been collected from countries by means of comprehensivequestionnaires. Additional unpublished information has become available as aresult of joint activities of WMO and Regional UN Economic Commissions! such asECA, ECLA and ESCAP. Use was made, as necessary, of the UN "Statistical Yearbook",1974, and other documents and publications.
1.3 Presentation
Information is presented in tabular form! the text consists only ofexplanatory notes and footnotes to make the material readily understandable. Timedependent data are identified by date so that the reader can judge the relation ofthe information to the current situation or to his particular purpose.
1.4 Frequency of publication
It is intended to issue revised and updated editions of this publicationat four-yearly intervals. It is hoped that the statistical tables in futureeditions can be mode more complete than those contained in the present issue! byintroducing additional data and corrections that will be requested from Members.
CHAPTER 2
INTERNATIONAL AND NATIONAL ORGANIZATIONSDEALING WITH HYDROLOGY AND WATER RESOURCES
Explanatory notes
2.1
2.1.1
International organizations
International organizations are of two types:
(a) Governmental (IGOs). These are organizations established by agreements to which two or more States are party. Such organizationsmay be global or regional. Co-ordination of the activities ofthese organizations in hydrology and water resources is achievedthrough the ACC Sub-Committee on Water Resources Development.
(b) Non-governmental (NGOs). To this category belongs any international organization which is not established by intergovernmental agreement, including organizations which acceptmembers designated by government authorities, provided thatsuch membership does not interfere with the free expressionof views of the Organization*.
2.1.2 The principal IGOs and NGOs dealing with hydrology and water resourcesare listed in Tables 2.1 and 2.2 respectively. Organizations established specifically for co-operation in international river basins are listed in Chapter 3 Principal River Basins.
2.2 National organizations
2.2.1 Tables 2.3 to 2.7 are based on the information received in the WHOSecretariat from one hundred and one Members as at July 1976. This information wassought in order to revise and update WMO/IHD Report No. 10 - Organization ofHydrometeorological and Hydrological Services (1969).
2.2.2address of
*
Table 2.3 consists of three columns designatingthe service and the responsible authority.
the country, name and
Reference ECOSOC Resolution 288 (X) and Resolution 1296 (XLIV)
3
2.2.3 Table 2.4 provides detailed information about services responsible forhydrometric, groundwater and climatological observations (columns 1 to 3), andalso for other observational networks (columns 4 to 11), data storage and retrieval,publication of data, catalogues and standards (12 to 23). Column 24 denotes howco-ordination is accomplished between meteorological, hydrological and other operational services dealing with hydrological observational networks and stations.(See additional notes at the beginning of Table 2.4.)
2.2.4in Tables
A statistical summary of the information given in Table 2.4 is presented2.5, 2.6, 2.7 and 2.8.
TABLE 2.1 - INTERNATIONAL GOVERNMENTAL ORGANIZATIONS
Abbre- Name Addressviation
United Nations and its organs
UN United Notions Centre for Natural Resources, Energy andTransport, UN, New York, 10017, USA
ACC Administrative Committee on Co-ordination UN, New York, 100171 USA
ECOSOC Economic and Social Council UN, New York, 10017, USA
UNEP Uni ted Notions Environment Programme P.O. Box 30552, Nairobi, Kenya
UNDRO United Nations Disaster Relie f Office UN, Palais des Nations, Geneva, Swi tzerland
~ecialized agencies of the UN system andt a IAEA
FAO Tood and Agriculture Organization of the Vic delle Terme di Coracollo, Rome, ItalyUnited Notions
IAEA International Atomic Energy Agency 11 Korntnerring; P.O. Box 590/ Vienna,
A-IOIO Austria
IBRD International Bank for Reconstruction and 1818 H Street, N.W. , Washington, D.C.Development 20433, USA
UNDP United Nations Development Programme UN, New York, USA
Unesco United Nations Educational, Scienti fie and 1 Place de Fontenoy, Paris 75007, FranceCultural Organization
UNlDO United Nations Industrial Development Rothousplatz 2, P.O. Box 707, Vienna,Organization A-IOIO Austria
WHO World Health Organization 20 Avenue Appia, 1211 Genevo 27, Switzerland
WMO Worl_c! M.~_~.e_or~1oQ~cal _Organi~otion P.O. !3ox 5, 1211 Geneva 2O, Sw~ tzerlan~.. ..- -
2. REGIONAL
Abbreviation
ECA
ECE
ECLA
ECWA
ESCAP
CIEH
CRRH
CMEA
CEC
CE
NC
OAS
.' OAU
OECD
Name
Organs of the United Nations
Economic Commission for Africa
Economic Commission for Europe
Economic Commission for Latin America
Economic Commission for West Asia
Economic and Social Commission for Asiaand the Paci fie
Others
Inter-african Committee for Hydraulic Studies
Central American Regional Committee on WaterResources
Council for Mutuel Economic Assistance
Commission of the European Communities
Council of Europe
Nordic Council
Organization of American States
Organization of Africon Uni ty
Organization for Economic Co-operation andDevelopment
Address
P.O. Box 3001, Addis Ababa, Ethiopia
UN, Palais des Nations, Geneva, Switzerland
Avenida Dag Hammarskjold, Santiago de Chile
Bir Hassan, Beirut, Lebanon
Sola Santitham, Rajadamnern Avenue,Bangkok, Thailand
B.P. 369/ Ouagadougou, Upper Volta
(Rotative)
Kolinin Prospect 56, MOSCOH G-205, USSR
200 rue de 10 Loi, Brussels 1040, Belgium
Avenue de l'Europe, 67 Strasbourg, France
Gamla Rigsdogshuset, Stockholm, Sweden
Pan American Union Building, WashingtonD.C. USA
P.O. Box 3243, Addis Ababa, Ethiopia
Chateau de 10 Muette, 2 rue Andre .pascal,Paris, France
TABLE 2.2 - INTERNATIONAL NON-GOVERNMENTAL ORGANIZATIONS 5
Abbreviation
Nome Address
CIGR
CODATA
COSTED
COWAR
International Commission of AgriculturalEngineering
Committee on Data for Science and Technology
Committee on Science and Technology inDeveloping Countries
Scientific Committee on Water Research
10-12 rue du Capitaine Menard, 75015 Paris,France
Westendstrasse 19, 6 Frankfurt/Main, German~F.R.
see ICSU
98 rue Xavier de Maistre, 92 Rueil-Malmoison,France
FAGS
IAH
IAHR
IAHS
IAMAP
lAS
IAWPR
ICID
lCOLD
ICSI
ICSU
IGU
ISO
Federation of Astronomical andGeophysical Services
International Association of Hyclrogeologists
International Association for Hydraulic Research
International Association of HydrologicalSciences
International Association of Meteorology andAtmospheric Physics
International Association of Sedimentologists
International Association on Water PollutionResearch
International Commission on Irrigation ondDrainage
International Commission on Large Dams
International Commission on Snow ond Ice
International Council of Scientific Unions
International Geographical Union
International Organization for Standardization
URSI Secretariat, Pl. Emile Danco 7,1180 Brussels, Belgium
74 rue de 10 Federation, 75015 Paris, France
Roam 61/ P.O. Box 177, Delft, Netherlands
19 rue Eugene Carriere, 75018 Paris, France
Atmospheric Environmental Service,4905 Dufferin Street, Downsview, Canada
Department of Geology, University of Reading,Reading, England
P.O. Box 395, Pretoria, South Africa
4B Nyaya Marg, Chanakyapuri, New Delhi 21,Indio
22 et 30 Avenue de Wagram/7500B, France
147 Rickmansworth Road, Watford, Herts,England
51, Bd. de Montmorency/ 75016/ Paris, France
Department of Geography, University ofChicago, Illinois 60637, USA
1 rue de Varembe, 1211 Geneva 20, Switzerland
Royal Tropical Institute/ 63 Mauritskade,Amsterdam, Netherlands
P.O. Box 12, 5014 Bergen, Norway
1110 Marges, Switzerland
Observatoire Royal, Avenue Circulaire 3, IlBeBrussels, BelgiumP.O. Box 379, Haarlem, Netherlands
104a Park Street/ London W1Y 4BL r England
155 rue de la Loi, 1040 Brussels, Belgium
International Union of Biological Sciences
International Union for Conservation of Natureand Natural Resources
International Union of Geodesy and Geophysics
International Society of Soil Science
International Union of Geological Sciences
International Water Supply Association
Permanent International Association ofNavigation Congresses
Special Committee on Problems of the Environment see ICSU
IUBS
IUCN
IUGG
SCOPE
IUGS
IWSA
PIANC
ISSS
UIEO Union of International Engineering Organizations 62 rue de Courcelles, 75008 Paris, France
WOC Panel on World Data Centres see ICSU
WEC World Energy Conference 5 Bury Street, St. James's, London SWIY 6AB,England
is TABLE 2.3
NAMES AND ADDRESSES OF NATIONAL SERVICES DEALING OPERATIONALLYWITH STATION NETWORKS FOR HYDROLOGICAL PURPOSES
(based on information received by July 1976)
State/territory(1)
Afghanistan*
Albania
Algeria*
Angola*
Argentina
Australia
Name and ~ddress of service(2)
1. Institute Hydrometeorologic, 214 rue Kongressipgrmetit 1 Tirana
1. Institute de Hidralogio del ServicioMeteoro16gi~o Nocional
2. Obres Portuarias y Vias Navegables
3. Recursos Hldricos - Agua y Energia Elhctricode 10 Noci6n
4. Instituto Nocionol de Ciencia y T~cnica Hidricas_ Subsecretorla de Recursos Hidricos, Viamonte1145 - ler Piso, Buenos Aires
5. Departamento de Hidrografla del Comondo deMarino
6. Instituto Nacionol de GeologIa y Mineria de 10Subsecretoria de Energia
7. Direcci6n de Ingenieros del Camando delEj~rcito
8. Departamento de Climatologic del ServicioMeteoro16gico Nocional
9. Instituto Argentino de Nivologia y Glaciologia
1. Resources Commission of N.S.W., P.O. Box 952,North Sydney, New South Wales, _0060
2. Irrigation and Water Supply Commission,P.O. Box 74, North Quay, Queensland, 4001
3. State Rivers and Water Supply Commission,590 Orrong Road, Armadole, Victoria, 3143
4. Water Resources Branch, Deportment of theNorthern Territory, Darwin, N.T. 5790
Responsible authority(3)
Academie des Sciences de 10R.P. dlAlbanie
Ministerio de Defensa, Fuerza A~reo
Ministerio de Obros y ServiciospGblicos
Ministerio de Defenso, Armada
Ministerio de Obras y ServiciosPublicos
Ministerio de Defenso, Ej6rcito
Ministerio de Defenso, Fuerza A~rea
Consejo Nacional de Ciencio y T~cnica
New South Wales Department ofConservation
Queensland Minister fo;Conservation _"
Victoifa" Minister forConservation
(see col. (2)/ Australian GovernmentDept. )
5.
6.
7.
8.
9.
Bureau of Meteorology, P.O. Box 1289K,Melbourne, Victorio, 3001
Public Works Department, 2 Havelock Street/ WestPerth, Western Austrolio, 6005
Hydro-Electric Commission of Tasmania,16 Elizabeth, Street, Hobart, Tasmania, 7000
Engineering and Water Supply Deportment,P.O. Box 1751, Adelaide, South Australia, 5001
Rivers ond Water Supply Commission,P.O. Box 908J r Hobart, Tasmania, 7001
Australian Government Department ofScience
see col. (2)
Tasmanian Premier
see col. (2)
Tasmanian Minister for Lands andWQrks
* Informat~on "not recG~ved
Table 2.3, contd.
State/territory(1)
Australia 10.contd.
11.
12.
13.
14.
15.
16.
17.
13.
19.
20.
21.
22.
23.
24.
25.
26.
27.
Austria 1.
2.
3.
4.
Nome and address of service(2)
Metropolitan Water Sewerage and Drainage Board,Pitt and Bathurst Streets, Sydney, New SouthWales, 2000
Melbourne and Metropolitan Boord of Works,425 Collins Street, Melbourne, Victoria, 3000
Snowy Mountains Council f P.O. Box 377 f GoomaNorth, New South Wales, 2629
State Electricity Commission of Victoria,15 William Street, Melbourne, Victorio f 3000
Commonwealth Scientific and Industrial ResearchOrganization, P.O. Box 225, Dickson, A.C.T. 2602
Department of Public Works, State Office Block fPhillip Street, Sydney, New South Wales, 2000
Australian Water Resources Council f Box 5,Canberra/ A.C.T. 2600 (for liaison andgeneral information)
Department of Mines f 169 Rundle StreetfAdelaide, South Australia, 5000
Geological Survey of W.A., 66 Adelaide Terrace,Perth, Western Australia, 6000
Geological Survey of Victoria, 107 RussellStreet/ Melbourne, Victoria, 3000
Department of Mines f Davey Street/ Hobart,Tasmania 7000
Geological Survey of Queensland, 2 Edward Stree~
Brisbane, Queensland, 4000
Geological Survey of N.S.W., P.O. Box R2l6,Royal Exchange, Sydney, New South Wales, 2000
Bureau of Mineral Resources f P.O. Box 378,Canberra City, A.C.T., 2601
Department of ConstructionFurzer Street/ Phillip A.C.T., 2606
Soil Conservation Authority, 378 Cotham Road,Kew/ VIC. 3101
Latrobe Valley Water and Sewerage Board,P.O. Box 348/ Troralgon, VIC. 3844
University of N.S.W., P.O. Box I, Kensington,N.S.W. 2033
Hydrographisches ZentralbUro im Bundesministe_dum fUr Land und Forstwirtschaft, Marxerg 2,A-I030 Vienna
Bundesanstal t fUr Was sergUtte beim Bundesministerium fUr Land und ForstwirtschQft, A-1220Vienna, KaisermUhlen
Zentralanstalt fUr Meteorologie und Geodynamik,Hohe Warte 38, A-1190 Vienna
Institut fUr Meteorologie und Geophysik derUniversitot Innsbruck/ Schopfstr. 41 f
A-6020 Innsbruck
7
Responsible authority(3)
under New South Wales Minister forWater Resources
under Victoria Minister for LocalGovernment
Australian Government, Departmentof National Resources
under Minister for Fuel, Power andMines
Australian Government Deportment ofScience
see col. (2)
Australian Government Deportment ofNotional Resources
see col. (2)
Western Australia Department ofMines
Victoria Deportment of Mines
see col. (2)
Queensland Deportment of Mines
New South Wales Department of Mines
Australian Government Department ofNational Resources
Australian Government, Department ofConstruction
under Victoria Minister for LocalGovernment
see col. (2)
see col. (2)
Bundesministerium fUr LandForstwi rtschaft
Bundesministerium fUr Wissenschaftund Forschung
Bahamas 1. Water Department, P.O. Box 8156, Nassau Ministry of Works
8Table 2.3, ecntd.
State/territory(1)
Bangladesh
Barbados*
Belgium
Benin
Bolivia*
Bots ....ana*
Brazil
Name and address of service(2)
1. Directorate of Surface Water Hydrology,BWDP, Dacca
2. Directorate of River Morphology, Researchand Training
3. Inland Water Transport Authority, Docca
4. Port Trusts, Chittagonga ChaIn a
5. Directorate of Ground Water Circle, BWDB,Dacca
1. Service d'Etudes Hydrologiques, Rue de 10 Loil5~, ~ruxel1es 1040
2. Service de l'Hydrou1ique Agricole J Avenue de10 Toison dlOr 17A, Bruxelles 1060
3. Service Geologique, Rue Jenner 13, Bruxelles1040
4. Institut Royal Meteorologique (Section Hydrologie)/ Avenue Circulaire 3, Bruxelles 1180
5. Regie des Voies aeriennes (Service Meteorologique), Aerodrome National, Batiments meteo,Zaventem 1930
6. Force DeTienne, Wing meteoro!ogique, QuartierEvere, Avenue Jules Bordet I, Bruxelles 1130
1. Direction de 1'Hydraulique, B.P. 385, Cotonou
2. ORSTOM, Cotonou
3. Direction de l'ASECNA, Cotonou
1. Departamento Nacional de Aguas e EnergiaEl~trica - DNAEE
2. Superintendencia de Desenv~lvimento doNordeste - SUDENE
3. Departamento Nacional de Obras de Saneamento DNOS/ Av. Presidente Vargas 62, 5 andar,Rio de Jane.iro
4. Departamento Nacional de Portos e ViasNaveg6veis - DNPVN
5. Ele trobr6.s. et subsidi1'Jrias
6. Departamento Nacionol de Meteorologia, Pro yo.15 de Novembro 2, 5° andar, Rio de Janeiro
7. Directoria de Eletr8nica e Prote950 00 Voo
8. Directoria de Hidrografia e Navega950
Responsible authority(3)
Ministry of Flood Control, WaterResources and Power
Ministry of Shippings and Aviation
Ministry of Railways, Highways andPorts
Ministry of Flood Control, WaterResources and Power
Ministere des Trovaux publics
Ministere de l'Agriculture
Ministere des Affaires economiques
Ministere des Travaux publics, Mineset Energie
Ministere des Travaux publics J Mineset Energie
Ministere des Transports, Posteset Telecommunications
Ministerlo d. Minas • Energia
Ministerio do Interior
Minist6rio dos Transportes
Ministerio d. Minas • Energio
MinisUrio do Agri cuI turo
Ministerio do Aeron6utica
Ministerio do Morinho
*Informctlon not recelved
Table 2.3, contd.
State/territory(1)
Sri tish Carxib- 1.eon Terri toxies
9
Name and address of service(2)
Central Water Commission, P.O. Box 392,Carenoge, St. George, Granada
Responsible authority(3)
Ministry of Communications and Works
Bulgaria
2. Montserrat Water Authority, P.O. Box 324,Plymouth, Montserrat
3. National Water and Sewerage Authority, Belize
4. Notional Meteorological Service, Belize
5. Central Water Authority, 22 Bath Road,Roseau, Dominica
6. Water Resources Deportment, Wellington Road,Basseterre, St. Kitts
1. Hydrometeorological Service, Blvd. LeninNo. 66, Sofia
2. Department of Reservoirs ond Cascades
Ministry of Power and Communications
Ministry of Communication and Works,Post and Telegraph
Bulgarian Academy of Sciences
Ministry of Forests and EnvironmentalProtection
Ministry of Agriculture andFood Industry
Ministry of Building ond Architecture
Burma
3. State Economic Organizotion - IrrigationSystems, st. Hristo Botev No. 55, Sofia
4. State Economic Organization - Water Supply andSewerage, Blvd. Dondukov No.2, Sofio
5. Department of Mineral Waters, Sq. Lenin No.5, Ministry of Public HealthSofia
1. Deportment of Meteorology and Hydrology, Koba-Ay Ministry of Transport andPagodo Post Office, Kobo-Aye Pagoda Rood, Rangoon Communications
Burundi*
ByelorussianSSR*
2. Irrigation Department Ministry of Agriculture and Forest
Department of the EnvironmentCanada
Cape Verde*
Central AfricanRepublic*
Chad
1. Water Resources Branch, Dept. of Environment,Hull, Quebec
2. Water Quality Branch, Dept. of Environment, Hull, Deportment of the EnvironmentQuebec
3. Canada Centre for Inland Waters (CCIW), Dept. of Department of the EnvironmentEnvironment, Hull, Quebec
4. Atmospheric Environment Service, 4905 Dufferin Department of the EnvironmentStreet, Downsview, Ontario
5. Hydrography Branch, Marine and Aquatic Affairs, Department of the EnvironmentDeportment of the Environment, Ottowa, Canada
1. ORSTOM, Centre de N'Djamena
Chile 1. Direcci6n Generol de Aguas (DGA)
2. Empresa Naciondl de Electricidad S.A. (ENDESA)
3. Direccion de Obras Portuarias
4. Division de Recursos Hidraulicos (CORFO)
Ministerio de Obras PGblicas
Ministerio de Obras Publicas
Corporoci6n de Fomento de 10Producci6n
*Informat~on not rece~ved
TobIe 2.3, contd.
State/territory(1)
Chile contd.
China*
10
Name and address of service(2)
5. Direcci6n Meteorol6giea de Chile
6. Direcci6n de Conservaci6n de RecursosNaturale, (DICOREN)
Responsible authority(3)
Ministerio de Defense
Ministerio de Agricultura
Ministerio de AgricultureColombia
Comoros*
1. Instituto Colombiono de Hidrologio, Meteorolog10 y Adecuaci6~ de Tierras
2. Corporaci6n Aut6noma Regional del Valle de Cauea Ministerio de Agriculture
3. Corporaci6n de los Valles de Ubate y Ministerio de AgriculturaChiquinquir6
Congo
Costa Rica
Cuba*
Cyprus
Czechoslovakia
DemocraticKompuchea*
Oem. People I sRep. of Korea*
1. Service hydrologique de l'ORSTOM, B.P. 181,Brazzaville
2. ATC - Transports fluviaux, 76 - Brazzaville
3. S.G.A.C. - Direction de 10 Meteorologie,B.P. 208, Brazzaville
1. Ofieina de Estudios B6sicos, Instituto Costarricense de Electricidod, Apartodo XXXII, Son Jose
2. Servicio Nacional de Aguas Subterr6neos/Apartado 5262, San Jose
3. Instituto Meteorol6gico Nacional, Apartado 7 3350 Son Jose
1. Department of Water Development, Nicosia
2. Meteorological Service, Nicosia
3. Deportment of Agriculture, Nicosia
1. Hydrometeorological Institute, HydrologicalService, Prcha 5, Nab¥e¥ni 4
2. Hydrometeorological Institute, ClimatologicalService, Praha 5, Hole~kova 8
3. Hydrometeorological Institute, HydrologicalService, Bratislavo-Koliba, Jesinlova 43
4. Hydrometeorlogical Institute, ClimatologicalService, Bratislava-Koliba, Jesiniova 43
5. Research Institute of Water Economy, Praha 6 Podbaba, Podbobsk6 30
6. Reseorch Institute of Water Economy, BratislavaKarloveska cesta 9
ORSTOM ·and Ministere de 11 Enseignement technique, professionel etsuperieur
Ministere des Travaux publics et desTransports
Ministerio de Agriculture
Ministry of Agriculture and NaturalResources
Ministry of Forestry and WaterEconomy
*Informat~on not rece~ved
Table 2.3 contd.
State/territory(1)
DemocraticYemen*
Denmark
DominicanRepublic
Ecuador
Egypt*
El Salvador
Ethiopia
Finland
France
11
Name and address of servi~e
(2)
1. Hydrological Survey/ Det danske Hedeselskab,DK 4200 Slagelse
2. Geological Survey of Denmark, Thora¥ej 31/2400 Kpbenhovn N.V.
3. The Danish Met. Institute,. Lyngbyvej 100/ 2100Kpbenhovn 11
1. Instituto Nacional de Recursos Hidrliulicos
2. Instituto Nacional de Agua Potable
3. Servicio Meteorol6gico Nacional, 23 Av. NorteNo. 1153, Santo Domingo D.N.
4. 1ngenios Azucareros
1. Instituto Nacional de Meteorologla e Hidrologla(INAMHI), Av. 10 de Agosto 2627, Quito
1. Servicio Hidrol6gico, Direccion General deRecursos Naturales Renovables/ Canton EIMatasano, Soyapango/ San Salvador, EI Salvador/C.A.
2. Se-rvicio Meteo-rologico, -Direcci6n General deRecursos Naturales Renovables
1. National Water Resources Commission,P.O. Box 1008, Addis Ababa
2. Awash Valley Authority, P.O. Box 591, AddisAbaba
3. Civil Aviation Administration/ MeteorologicalDepartment/ P.O. Box 1090/ Addis Ababa
1. National Board of Waters Hydrological Office
2. Notional Board of Waters, Water Research Office
3. Finnish Meteorological InsH tute, Vuorikatu 24,Box 503, 00101 Helsinki 10
4. The Government Printing Center, Annakatu 44/SF-OOIOO/ Helsinki 10
1. Service des Circonscriptionse1ectriques/9 rue de Milan/ Paris 75009
2. Service central hydrologique/ 4 avenue LeonBollee,· Paris 75013
3. Direction de l'Amenogement rural et desStructures/ Service de l'Hydraulique/19 avenue du Maine/ 75732 .Paris Cedex 15
4. E1ectricite de France/ Division techniquegenerale, Service de 10 Production hydraulique,37 rue Diderot, 38000 Grenoble
5. Bureau de Recherches geologiques et minieres,Service geologique national, avenue de ConcyrrB.P. 6009, 45018 Orleans Cedex
Responsible authority(3)
Ministry of Agriculture
Ministry of Environment
Ministry of Defense
Secretaria de Estado de Agriculture
Ministerio de Recursos Naturalesy Energeticos
Ministerio de Agricul tura yGanaderia
Ministerio de Agricul tura yGanaderio
Ministry of Public Works
Imperial Ethiopian GovernmentMinistry of Communications
Ministry of Agriculture and Forestry
The Ministry of Traffic
Ministere de l'Industrie
Ministere de l'Equipement
MinisHre de l'Agriculture
Ministere de l'Industrie
*Information not received
Table 2.3 contd.12
State/territory(1)
Name and address of service(2)
Responsible authority(3)
France contd. 6. Meteorologie nation ale, Service meteorologiquemetropolitain, 2 avenue Rapp, Paris 75007
Secretariat d lEtat aux Transports
7. ORSTOM (Guyane, Martinique, Guadeloupe),24 rue Bayard, 75008, Paris
Office de 10 Recherche scientifiqueet technique d'Outre-Mer
FrenchPolynesia
1. ORSTOM Tahiti, B.P. 529, Papeete Office de la Recherche scientifiqueet technique d'Outre-Mer
FrenchTerri tory ofthe Afors andIssa*
Gabon 1. ORSTOM, Service hydro1ogique, B.P. 13.115,Libreville
2. S.E.E.G., B.P. 2187 Libreville
3. Direction de llExploitation meteorologique,B.P. 3144, Dakar
4. Direction de 10 Meteorologie nationale,B.P. 377, Libreville
Ministere d'etat charge des Travauxpublic~ des Transports et dellAeronoutique civile
Ministere d'etat charge des Travauxpublics des Transports et dellAeronoutique civile
Ministere d'etat charge des Travouxpublics des Transports et del'Aeronautique civile
Ministere d1etot charge des Travauxpublics des Transports et dellAeronautique civile
""""
Bundesministerium fUr Verkehr, Bonn
Ministerium des Innern
Ministerium fUr Umweltschutz und Wasserwirtschaft, DDR _ 102, Berlin, Hans-Beimler-Str.70-72
Meteorologischer Dienst der DDR, DDR - 15Potsdam, Luckenwalder Str. 42-44-46
Bundesonstal t fUr Gewtisserkunde, D-54 Koblenz,Kaiserin_Augusta_Anlagen 15-17, Postfoch 309
Deutscher Wetterdiens~Zentralamt,D-605 Offen_bach, Frankfurter Strosse 135, Schliessfach 185
Federal Water and Navigation:
Wasser-und Schiffahrtsdirektion Aurich, D-296Aurich, Schlossplatz 9, Postfach 2020
Wasser-und Schiffahrtsdirektion Hannover, D-3Hannover I, Am Water100platz 5, Postfach 6307
Wasser-und Schiffahrtsdirektion MUnster, D-44MUnster, Cheruskerring 11, Postfach 5905
Wosser-und Schiffahrtsdirektion Moinz, 0-65Mainz, Stresemannufer 2, Postfach 4360
Wosser-und Schiffohrtsdirektion Freiburg, D-78Freiburg, Stefan-Meier-Strasse 4-6, Postfach
Wasssr-und Schiffahrtsdirektion Regensburg, 0-84Regensburg 2, KumpfmUhlerstrasse 6, Postfoch 315
Wasser-und Schiffahrtsdirektion Hamburg, 0-2Hamburg 4, Bernharcl-Nocht-Strasse 78, Postfach240
German Oem. 1.Republic
2.
Germany, Fed. 1.Republic of
2.
3.
0)
b)
c)
d)
e)
f)
g)
h) Wasser-und Schiffahrtsdirektion Bremen, D-28Bremen I, Franziuseck 5, Postfach
*Informat10n not rece1ved
Table 2.3 eontd.
State/territory(1)
Ghana
13
Name and address of service(2)
i) Wasser-und Schiffahrtsdirektion Duisburg,0-4102 Homberg, Konigstrasse 84
j) Wasser-und Schiffahrtsdirektion Kiel, 0-23Kiel 1, Hindenburgufer 247, Postfach 4467
k) Wosser-und Schiffahrtsdirektion Stuttgart, 0-7Stuttgart I, Birkenwaidstrasse 38, Postfach2634
1) Wasser-und Schiffahrtsdirektion WUrzburg, 0-87WUrzburg 2, Worthstrasse 19, Postfach
4. Water - Management - Administration of thestates
a) Boubehorde, Tiefbauamt der Hansestadt Homburg,Hauptabtei1ung Wasserwirtschaft, 0-2 Homburg 36Neuer Wall 72
b) Landesamt fUr Wasserhaushalt und KUsten,Schleswig-Holstein, 0-23 Kiel, SoarbrUckenstrasse 38
c) Bayerisches Landesamt fUr Wasserwirtschaft, Abt.Gewasserkunde, 0-8 MUnchen 22, Prinzregentenstrasse 24
d) Niedersachsisches Ministerium fUr Ernahrung 1
Landwirtschaft und Forsten, 0-3 Hannover,Ca1enberger Strasse 2, Postfach
e) Londesomt fUr Wosserwirtschaft und Abfol1beseitigung1 0-66 Saarbrucken, He11wigstrosse 14
f) Freie Honsestadt Bremen, WasserwirtschaftsamtBremen, 0-28 Bremen, Bremen I, Bleicherstrasse25, Postfoch 1022
g) Senator fUr Bau- und Wohnungswesen, 0-1 Berlin3D, Potsdamer Strasse 180/182
h) Lande~anstalt fUr Wasser und Abfall NordrheinWestfolen, D-4 Dusseldorf I, Bornestrasse 10,Postfoch 5227
i) Landesanstalt fUr Umweltschutz BodenWUrttemberg, Institut fUr Wasser- und Abfollwirtschaft, 0-75 Karlsruhe, Bannwaldallee 24
j) Londesomt fUr Gewasserkunde Rheinland-Pfalz,0-65 Moinz 1, Am Zollhafen 9
k) Hessische Landesanstolt fur Umwelt, D-62Wiesbaden, Kranzplatz 5/6
1. Hydrological Branch of Public Works DepartmentP.O. Box 136, Acero
2. Water Resources Research Unit, P.O. Box M.32,Acero
3. Ghana Water and Sewerage Corporation, P.O. Box1941 Accro
4. Volta River Authority, P.O. Box M.77, Acero
5. Geological Surveys, P.O. Box M.BO, Acero
Responsible authority(3)
Minister fur Ernahrung, Landwirtschaft und Forsten, Keil
Bayerisches Staatsministerium desInnern, Oberste Baubehorde, MUnchen
Minister fur Umwelt, Raumordnung undBauwesen, Saorbrucken
Minister fur Ernahrung, Landwirtschoft und Forsten, DUsseldorf
Minister fur Ernahrung, Landwirtschaft und Umwelt Baden-Wurttemberg,Stuttgart
Minister fUr Landwirtshaft, Weinbouund Umweltschutz des LandesRheinland-Pfalz
Hessisches Ministerium fUr Londwirt_schoft und Umwelt
Ministry of Transport and Communication
Ministry of Works and Housing
Ministry of Lands and MineralResources
6. Meteorological Services Department, P.O. Box 87Legan :;.:'
~._. I-__-=' ~~ ._'- -"c.J-
*Information not received
-;t-
Table 2.3 contd. 14
State/territory(1)
Name and address of service(2)
Responsible authority(3)
Greece 1. Hydraulic Works Service, 7 Themistocleons str.,Athens
2. Land Reclamation Service J 22 Menondrou str.,Athens
3. Center for Environmental Data, Public PowerCorporation, 22 Chalkokondyli str., Athens
4. National Institute of Geological and MiningResearch, 34 Veranzerou str., Athens
5. Hellenic Nat. Met. Service, Cholargos, Athens
Ministry of Public Works
Mini stry of Agri cuI tu re
Ministry of Industry
Ministry of Notional Defence
Guatemala 1. Instituto Nacional de Electricificaci6n
2. Observatorio Nacional
3. Instituto Geografico Nacional
4. Direcci6n de Limites y Aguas Internacianales
Ministerio de Comunicociones
tHnisterio de Agriul tura
Minist~rio de Comunicaciones
Ministerio de Relociones Exteriores
Guinea*
'Hoiti*
Honduras 1. Departmento de Hidrometeorologia, Direcci6nGeneral de Irrigaci6n
2. Unidad de Hidrologla, Empresa Nacional deEnergia Electrica
3. Divisi6n de Hidrologia, Servicio Nacional deAcueductos y A1acantaril1ados
Ministerio de Recursos Naturales
Hong Kong 1. Waterworks Office, Public Works Department,Murrey Building, Hong Kong
2. Royal Observatory, Nathan Road, Kowloon,Hong Kong
Hungary 1. Research Institute for Water Resources,Budapest, VIII, R6k6czi ut 41
Notional Water Authority
Ministry of Industry
National Water Authority
Ministry of Communications
National Board for TechnicalDevelopment
National Water Authority
Ministry of Industry
Water Resources Center, Budapest V.Alkotm6ny u. 29
Meteorological Service of the Hungarian People'sRepublic, Budapest, II., Kitaibel P6l u.l
12 District Water Authorities
National Energy Authority, Hydrological Survey,Laugavegur 116, Reykjavik
Icelandic Glaciological Society, P.O. Box 5194/Reyk jovik
Industrial Research and Development Institute,Keldnoholti, Reykjavik
Reykjavik's Municipal Water Works, Sk610tuni 2,Reykjavik
5. Iceland Meteorological Office, P.O. Box 5330,Reykjavik
2.
3.
4.
Iceland 1.
2.
3.
4.
*Information not received
Table 2.3 contd.
State/territory(1)
India
Indonesia
Iran
Iraq*
Ireland
Israel
Italy
Ivory Coast
Jamaica
Japan
15
Name and address of service(2)
1. India Meteorological Department, Lodi Road,New Delhi 110003
2. Central Water Commission, Bikaner House,New Delhi
3. Central Ground Water Board, Jamnogar House,Mansingh Road, New Delhi
4. Geological Survey of India, Calcutta 1
1. Direktorat Penyelidikan Masalah Air (Instituteof Hydraulic Engineering) Jl. Ir. H. Juanda 193Bandung
2. Meteorological and Geophysical Institute,Jl.A.R. Hakim 3, Jakarta
1. Surface Water Department, c/o Ministry ofEnergy, Tehran
2. Groundwater Department, c/o Ministry of Energy,Tehran
3. Meteorological Organization, Mohammad Reza ShahSquare, Tehran
1. Hydrometric Section, Office of Public Works,51 St. Stephen's Green, Dublin 2
2. Civil ·Works Department, Electricity SupplyBoard, Stephen's Ct., 18-21 St. Stephen's GreenDublin 2
3. The Meteorological Service, Department ofTransport and Power, 44 Upper O'Connell Street,Dublin 1
1. Hydrological Service, P.O. Box 6381, Jerusalem
2. Kinneret Limnological Laboratory, P.O. Box 345Tiberios
3. Israel Meteorological Service, P.O. Box 25,Bet Dogan
1. Service Hydrographique
2. Ubrerla dello Stato, Piazza Verdi No. 10, Romo
1. Sous-Direction de 1'Hydraulique
2. ORSTOM
3. Direction des Mines et de 10 Geologie
1. Water Resources Division, Hope Gardens, P.O. Box91, Kingston 7
2. Jamaica Meteorological Service, Norman MonleyAirport
3. Government Printing Office, Duke Street,Kingston
1. River Bureau, Ministry of Construction,2-1-3 Kosumigaseki Chiyodaku, Tokyo
Responsible authority(3)
Ministry of Tourism and CivilAviation
Ministry of Agriculture andIrrigation
Ministry of Steel and Mines
Ministry of Public Works andElectric Power
Department of Communications
Ministry of Energy
Ministry of Energy
Ministry of War
Department of Finance
Department of Transport and Power
Ministry of Agricu1 ture and Fisheries
Israel Oceanographic and LimnologicalResearch Limited
Ministry of Transport andCommuni cation s
Ministere des Travaux publics
Ministry of Construction
*Information not received
Table 2.3, contd.
State/terri tory(1)
Jordan
Kenya
La.p--Peopl--e-' -s::Dem. R~pu;bJ.i-c*
Lebonon*
Li.byan Ar.abRepu:blic*
Luxembourg
Madagascar
16
Name and address of service(2)
1. Natural Resources Authority, P.O. Box 7, Amman
2. Meteorological Department/ Amman Civil Airport,Amman
1. Ministry of Agriculture, Water Dept., P.O. Box30521, Nai robi
2. Meteorological Deportment/ P.O. Box 3UD05,NaLr,obi
None
1. Service de 10 Meteor01ogie et de l' Hydrologie,16 route d'Esch, Luxembourg
1. Meteoro1ogie nationale (Hydrometeorologie)B.P. 1254/ Tananarive
2. Direction des Mines et de l'Energie (Hydrogeologie), B.P. 280/ Tananarive
Responsible authority(3)
Prime Minister as President
Ministry of Transport
Ministry of Agriculture
East African Community
Minist?ne de I' Agricul ture
Ministere des Transports et duRavi taillement
Minist6re des Finances
Malawi 1. Water Resources Division, P.O. Box 596 Lilongwe Ministry of Agriculture and NaturalResource:s
Malaysia
Mali
Mauri tania*
Mauri tius
2. Department of Geological Survey, P.O. Box 27Zomba
3. Department of Civil Aviation l P.O. Box 30200Blantyre
1. Drainage and Irrigation Department/ SwettenhamRoad l Kuala Lumpur
2. Notional Electricity Boord, Jolon Bangsar,Kuala Lumpur
3. Public Works Department l Maxwell Road,Kuala Lumpu-r
4. Department of Geological Survey, Jolon Gurney,Kuala Lumpur
5. Malaysian Meteorological Service, Julan Sulton,Petaling Jaya, Selongor
1. Direction generale de l'Hydraulique et del'Energie, B.P. 66 Bamako
2. Service de Meteorologie l B.P. 237, Bamako
1. Central Water AuthoritYI Jules Koeing Street,Port
2. Meteorological Service/ Vacoas
Ministry of Agriculture and NaturalResources
Ministry of Transport andCommunications
Ministry of Agriculture and RuralDevelopment
Ministry of Power l Technology andResearch
Ministry of Works and Transport
Ministry of Lands and Mines
Ministry of Communications
Ministere du Developpement industrielet des Travaux publics
Ministere des Transports etTelecommunications
Ministry of Energy, Fuel and NaturalResources
Ministry of Communications
*InformQt~on not received
Table 2.3, contd.
State/territory(1 )
Mexico*
Mongolia
Morocco
Mozambique
Nepal
Netherlands
NetherlandsAntilles
New Caledonia
New Zealand
Nicaragua
17
Name and address of service(2)
1. Administration of the HydrometeorologicalService l Gudamj October 5, Ulan Bator
2. Ministry of Water Economy, Gudamj Natsagdorjyn13 1 Ulan Bator
1. Direction de 11Hydraulique, Rabat
2. Direction des Eaux et Forsts et de 10 Conservation des Solsl Rabat
3. Office national de l'Electricite, Casablanca
4. Service de 10 Meteorologie nationale l
Casablanca - Anfa
5. Institut national de Recherches agronomiques,Rabat
6. Institut scientifique, Service de Physique duGlobe, Rabat
1. Servir;os Hidraulicos, C.P. 1611, Maputo
2. Servir;os de Geologia e Minas, Maputo
3. Servir;o Meteoro16gico de Mor;ombique, C.P. 256,Canphumo
1. Department of Irrigation, Hydrology andMeteorology, Bobar Mahal, Kathmandu
1. Rijkswoterstaat, Direktie Waterhuishouding enWaterbeweging, Hooftskade 1, The Hague
2. Rijksinstituut voor zuivering Afvolswater,Westeinde 3A, Voorburg
3. Dienst Grondwaterverkening TNO, Postbus 285,Del ft
4. Koninklijk Nederlands Meteorologisch Instituut,Utrechtseweg 297, De Bilt
None
1. ORSTOM Noumeo, B.P. A.5, Noumeo Cedex
1. Water and Soil Division, Ministry of Works DndDevelopment, P.O. Box 12041, Wellington
2. Geological Survey, DSIR, Private Bag, Lower Hutt
3. New Zealand Meteorological Service, P.O. Box 722Wellington
1. Empresa Nacional de Luz y Fuerza, ApartadoPostal No. 55 1 Managua
2. Catastro e Inventario de Recursos Naturales
3. Servicio Meteorol6gico Nacional, la Colle surEste No. lOlA, B.P. 87, Managua, D.N.
4. Comisi6n Nacional del Algod6n
Responsible authority(3)
Council of Ministers
Hinistere des Trovoux publics
Hinistere de l'Agriculture
Ministere des Travaux publics
Ministere de l'Agriculture
Ministry of Food, Agriculture andIrrigation
Ministry of Transport and PublicWorks
Office de 10 Recherche scientifiqueet technique d'Outre-Mer
Ministry of Works and Development
Ministerio de Economio, Industria yComercio
Ministerio de Defensa
Ministerio de Agriculture
*Informat10n not rece1ved
Table 2.3, ccntd.
State/terri tory(1)
Niger
Nigeria*
Norway
Oman*
Pakistan*
Panama
18
Name and address of service(2)
1. Ministere de l'Economie rurale, Service duGenie rural
2. Mission ORSTOM, B.P. 223, Niamey
3. Ministere des Mines, de 10 Geologie et del'Hydroulique j Direction de l'Hydraulique
4. Service meHeorologique du Niger, B.P. 218,Niamey
1. Norwegian Water Resources and ElectricityBoord/ P.O. Box 5091, Oslo 3
2. Norwegian Geological Survey, Eilert Sundtsgt 32,Oslo 2
3. Norwegian Meteorological Institute j P.O. Box320, Blindern, Oslo 3
4. Norwegian Water Research Institute
1. Departamento de Hidrometeorologia del Institutode Recursos Hidraulicos y Electrificacion
2. Division de Meteorologia e Hidrografia - Ciadel Canol Panama
Responsible authority(3)
Ministry of Industry ond Handicraft
Ministry of Industry and Handicraft
Ministry of Education andEcclesiastical Affairs
Royal Norwegian Council forScientific and Industrial Research
PapuaNew Guinea*
P-araguay 1.
2.
3.
Peru 1.
2.
3.
Philippines 1.
2.
3.
4.
Direcci6n de Meteorologia e Hidrologfa/Ministerio de Defensa Nocional, Lopez 1146,Asunci6n
Administraci6n Nacional de Navegaci6n y Puertos
Administraci6n Nocional de Electricidod (ANDE)
Servicio Nacional de Meteorologia e Hidrologia,Avenida Republica de Chile 295, Apartados 1308,4862 Lima
Ministerio de Agricultura
Ministerio de Energia y Minas
Woter Resources Survey Division, Bureau ofPublic Works, Port Area, Manila
Notional Irrigation Administration, APCBuilding, Quezon City
National Power Corporation, Port Area, Manila
PAGASA (Weather Bureau) 1424 Quezon BuildingExtension/ Quezon City
Ministerio de Defensa Nacional
Presidencia de la Republica/ PrimerMinistrQ
Department of Public Works
Office of the President
Department of National Defence
Poland
Portugal
1. Institute of Meteorology and Water Economy,ul. Pod16sna 61, 01-673 Warsaw
1. Direc~oo-Generol dos Servi90s Hidr6ulicos, Ruade Sao Manede 00 Caldost No. 23 _1 0
, Lisboa 2
Ministry of Agriculture
Minlsterio do Equipamento Social edo Ambiente
*InformatLon not rece1ved
Table 2.3, eontd.
State/territory(1)
19
Name and address of service(2)
Responsible authority(3)
Portugal eontd. 2. Servi~o Meteordlogieo Nacional, Rua Saraivade Carvalho 2
Qatar*
Ministerio das Comunica~5es
Republic ofKorea
1. Bureau of Water Resources, Seoul Ministry of Construction
2. Bureau of Regional Construction Ministry of Construction
3. Industrial Sites and Water Resources Development Ministry of ConstructionCorporation, Seoul
4. Korean Geological and Mineral Institute, Ministry of Commerce and IndustryGoribong-dong, Yeongdeungpo-ku, Seoul
5. Central Meteorological Office, Songweol-dong, Ministry of Sciences and TechnologySeoul 120
Romania
Rwanda*
St. Pierre andMiquelon*
Saudi Arabia
Sene.gal
Sierra Leone
Singapore
Soc. Republi cof Vietnam*
Somalia
South Africa**
1. Institut de Meteorologie et Hydrologie, 505.
Bucuresti-Ploie§ti No. 97, Bucarest 18
1. Hydrology Division, Ministry of Agriculture andWater, Riyadh
1. Direction generale de l'Hydraulique et dede l'Equipement rural
2. Division de 10 M6teorologia, Batiment administratif, B.P. 4014
1. Ministry of Works, New England, Freetown
2. Gumo Volley Water Company
3. Ministry of Agriculture and Natural Resources
4. Meterological Department, F.18 Charlotte StreetFreetown
5. Fourah Bay College
1. Public Utilities Board, 5th Floor, ColomboCourt Building, Singapore 6
2. Drainage Department, Ministry of Environment,Notional Development Building, Singapore 2
3. Meteorological Service, 15 Grange Road,Singapore 9
1. Deportment of Civil Aviation, MeteorologicalService, P.O. Box 310, Mogadiscio
1. Division of Hydrology, Private Bag X313,Pretoria
Ministere de l' Agricul ture, dellIndustrie alimentaire et des Eaux
Ministry of Agriculture and Water
Minist8re du Develop-pement rural etde l'Hydraulique
Ministere des Travaux publics, desTransports, de l'Urbanisme et deI'Habitat
see column (2)
see column (2)
Ministry of Transport andCommunication
University of Sierra Leone
Prime Minister's Office
Ministry of Environment
Ministry of Communications
Ministry of Transport
Department of Watey Affairs
*-Information not received**suspended by Res 38 (Cg-VII) from exercising its rights and enjoying privileges as a Member of WMO
Table 2.3, contd.
State/territory(1)
South Africa. eontd.
SouthernRhodesia*
20
Name and address of service(2)
2. Forest Research Institute, P.O. Box 727,Pretoria
3. Geological Survey, Private Bag Xl12, Pretoria
4. Weather Bureau, Private 8ag X193, Pretoria
Responsible authority(3)
Department of Forestry
Department of Mines
Department of Transport
Spain
Sri Lanka*
l. Direcci6n General de Obras Hidr6ulicos Ministerio de Obras PGblicos
2. Insti tuto Nacionol Censervaci6n Naturoleza Ministerio de Agricul tura
3. Insti tuto Geol6gico y Minero Ministerio de Industria
4. Servicio Meteorol6gico Nacional l Apartado de Ministerio del AireCorreos 285, Madrid
5. Centro de Estudios Hidrogroficos del MOP I poseo Ministerie de Obras PGblicasBajo de 10 Vi rgen del Puerto 3, Madrid 5
Sudan
Surinam
Sweden
1. Hydrology Division of Nile Water Department
2. Surface Water Division t Rural Water Corporation
3. Meteorological Department, P.O. Box 574 t
Khartoum
1. Hydraulics Research Division t POB 2110 1
Paramaribo
2. Hydrological Service of the Bureau for Hydroelectric Power Works, Rode kruis1aon 15,Paramaribo
3. Ministry of Rural Government and Decentralization, Water Supplies, Kleine Waterstraat I,Paramaribo
4. Meteorological Service, Cornelis Jongbawstraat22, Paramaribo
1. Swedish Meteorological and HydrologicalInstitute t Fack, S-601 01 Norrkoping
2. Geological Survey of Sweden t Fack, 5_104 05Stockholm 50
Ministry of Irrigoti.on and H.E.E.
Ministry of Agriculture t Food andNatural Resovrces
Ministry of Defense
Department of Public Works andTraffic
Department of Natural Resources(Opbouw)
Department of Public Works andTraffic
Ministry of Transport andCommunications
Ministry of Industry
Dept. federal des Transports etCommunications et de l'Energie
Swi tzerland
Syrian ArabRepublic*
1. Office federal de l'Economie hydraulique,Division de l'Hydrographie nationale J Bollwerk27, CH-3001 Berne
2. Insti tut suisse de Meteorologie, Kr~hb·(Jhlstrasse Dept. federal de l'interieur58, CH-8044, Zurich
3. Institut pour l'Etude de la Neige et des Dept. federal de l'InterieurAvalanches, Weissfluhjoeh l CH-7260 Davos
4. Laboratoire de Recherches hydrauliques, hydrologiques et glaciologiques de l'EcolePolytechnique federale de Zurich, Gloriastrasse37/39, CH-8006 Zurich
Thailand 1. Royal Irrigation Department, 811 Sam Sen Road l
Bangkok 3Ministry of Agricul ture
*Informat~on not rece~ved
Table 2.3, contd.
State/territory(1)
21
Name and address of service(2)
Responsible authority(3)
Thailand contd. 2. Meteorological Department/ 612 Sukhumvit Road,Bangkok 11
3. Electricity Generating Authority of Thailand,Near Ramo 6 Bridge, Nonthaburi
4. National Energy Administration, Ban Phibuntham/Rama 1 Rood, Bangkok 5
5. Department of Mineral Resources, Ramo 6 Road,Bangkok 4
Togo*
Ministry of Communications
Office of the Prime Minister
Ministry of Industry
Union of Soviet 1.Socialist Reps.
Trinidadand Tobago
Tunisia
Turkey
Uganda
Ukrainian SSR*
United Kingdomof Gt. Britainand N. Ireland
1. Water Resources Survey, Government of Trinidadand Tobago, P.O. Box 145, Port of Spain,Trinidad WI
2. Hydrology Section, Drainage Division, Ministryof Works, Government of Trinidad and Tobago
3. Water and Sewerage Authority, Government ofTrinidad and Tobago
4. Central Experimental Station, Ministry ofAgriculture, Government of Trinidad and Tobago
1. Direction des Ressources en Eau et en Sol,41 rue de 10 Manoubio, Montfleury, Tunis
2. Institut notional de la Meteorologie, B.P. 22Aeroport de Tunis-Carthage
1. General Directorate of State Hydraulic Works
2. General Directorate of Electrical PowerResources Surveying and Design Deportment
3. General Directorate of State MeteorologicalService, P.O. Box 401, Ankara
1. Water Development Department, P.O. Box 19,Entebbe
2. East African Meteorological Department, UgandaRegion, P.O. Box 7025 Kampala
Chief Administration of the HydrometeorologicalService under the Council- of Ministers of theUSSR, 12 Pavlik Morozov Street, Moscow D-376
2. Ministry of Geology of the USSR, ul BolshajaGruzinskaja, D.4/ Moscow
1. Water Data Unit, DOE Reading Bridge House,Reading, for the Ten Regional Water Authoritiesin England and Wales and for equivalent bodiesin Scotland and Northern Ireland
2. Metborological Office, London Road, Bracknell,Berkshire RGl2 2SZ
Ministry of Public Utilities
Ministry of Works
Ministry of Public Utilities
Ministry of Agriculture
Ministry of Energy and NaturalResources
Ministry of Agricul tura
Ministry of Land and Water Resources
East African Community, RegionalHeadquarters, Uganda
Council of Ministers of the USSR
Deportment of the Environment,London; Heish Office, Cordi ff;Scottish Office: Edinburgh;Department of the Environment (NI)Bel fast
Ministry of Defence
WlnTormat10n no rece1vea
Table 2.3, contd.
State/territory(1)
United Rep.of Gameroon
Uni ted Rep.of Tanzania
Uni t'ed Statesof America
Upper Volta
22
Name and address of service(2)
1. ORSTOM, Service hydrologique, B.P. 193/ Yaounde
2. Direction des Mines et de 10 Geologie
3. Institut de Recherches hydrologiques,geologiques et minieres
1. Ministry of Water Development and Power,Hydrological Section, P.O. Box 9153, Dar EsSalam
1. Geological Survey, Water Resources Division,Notional Center, Reston, Va. 22092
2. Corps of Engineers, Office of Chief/ WasingtonD.C. 20314
3. NOAA National Weather Service, Office ofHydrology, Silver Spring Md. 20910
4. Soil Conservation Service, Washington D.C. 20250
1. Direction de I'Hydraulique, B.P. 7025Ouagadougou
2. ORSTOM, B.P. 182, Ouagadougou
Responsible authority(3)
Ministere du Plan et deIlAmenagement du Territoire
ONAREST
Ministry of Water Development andPower
US Department of the Interior
US Deportment of Defence
US Department of Commerce
US Deportment of Agriculture
Ministere de l'Agriculture
1. Direccion de Hidrogrofia, 1414 Montevideo
5. Direcci6n General de Meteorologia del Uruguay/Casillo de Correo 64, Montevideo
6. Instituto A. Boerger
Uruguay
Venezuela*
Yemen*
2.
3.
4.
Usinas y TelEifonos del Estado, Palacio de 10Luz; MontevideoInstituto Geo16gico del Uruguay
Obros Sanitarias des Estado
Ministerio de Obras Publicas
Ministerio de Industria y Cornercio
Ministerio de Obras Publicas
Ministerio de Transporte
Ministerio de Ganaderia yAgricul tura
Yugoslavia 1. Federal Hydrometeorologicol Institute,Bircaninova 6/ P.O. Box 604, 11001 Beograd
2. Hydrometeorological Institute of the SocialistRep. of Serbia, Bacvanska 21/V~/11000, Beograd
3. Hydrometeorological Institute of the SocialistRep. of Croatia, Gric 3, 41103 Zagreb
4. Hydrometeorologicol Institute of the SocialistRep. of Slovenia, Resljeva 18, 61000 Ljubljana
5. Hydrometeorological Institute of the SocialistRep, of Bosnia and Hercegovina, Had~e Loje 8/71000 Sarajevo
6. Hydrometeorological Institute of the SocialistRep. of Macedonia/ Koce Nedelkovski 75,91000 Skop j.
7. Hydrorneteorological Institute of the SocialistRep. of Montenegro, IV proleterske 15/81000 Ti tog rod
*Inforrnotion not received
Table 2.3, contd. 23
State/territory Nome and address of service Responsible authority(1) (2) (3)
Zaire l. Regie des Voies fluviales, Kinshasa 1 Dept. des Transports etCommunications
2. Regie des Voies maritimes, Boma Dept. des Transports etCommuni cation s
3. Service geologique, Kinshasa Dept. des Transports etCommunications
4. Laboratoire national, Kinshasa Dept. de 10 Sante publique
5. Service meteorologique, Depeche speciale, Dept. des Travaux publi csKinshasa 1
6. L'lnera, Yangambi Dept. des Travaux publics
Zambia l. Department of Water Affairs, P.O. Box RW 288 Ministry of Rural DevelopmentLusaka
2. Meteorological Department, P.O. Box 200, Lusaka Ministry of Power, Transport andWorks
TII.BLE 2. 4
TABU 2.4
ACTIVITIES OF NATIONAL SERVICES LISTED IN TABLE 2.3DEALING OPERATIONALLY WITH STATIONS NETWORKS FOR
HYDROLOGICAL PURPOSES
Notes:
1. Numbers entered in the body of the table identify theServices as they aTe listed in the second column ofTable 2.3. Where more than one Service (i.e. number)is entered in any column they are listed in descendingorder of involvement in the relevant activity.
2. Sub-columns A identify hydrometric observationsSub-columns B identify groundwater observationsSub-columns C identify climatolotical observations
for hydrological purposes
3. Columns 21, 22 and 23 relate to the publication ofnational or organizational standard techniques forthe operation of hydrometric stations, groundwaterstations and climatological stations l respectively,including accuracy requirements and quality controlof the observations.
Toble 2." contd. 25
Services listed in Table 2,3, Data Publica-storage tion Cata- Standards Co-ordi-
OperateDeal operationally with and or logues published nation
stationsobservational networks on: retrieval data
forI
• -:;;- •nooo • •• • '" . • 0
~n n ¥oo " • '"0 0 00 ¥ • ~ ~ ~'" '" H • • " •" State/ ¥ ¥ " - ::; '" 0 ". p "0 0 • " ~ ooo 0 0terri tory ~ ~
ooo. ~ • • I 11 ¥
~Z 0 ,"p
~ '" 0
~0 , 'rl ,¥• • o~ ~ g ¥ , '. " 0• • -;; ,0 • • • • "" ~¥
P P rlO • P '"' • • 0 0 rl ~o " .0 0 0," 0 • " " 0 " '0< " • ~ '"0,",
l '"' " 0 0 " " " 0 ", ¥ :;;'g0 " '" 0 -;; 0 • " • " 0 ¥ ¥ 0 ..
'~ • ,",rl ¥ OO¥ • 0 ... " P ¥ • '" , " '" .¥~~ • ~ • • " • ¥n
" • • • • rl¥ ¥ • ,
¥ ! '"' ~ ·, • '" '" 0n ~ rl <, rl 0 • o. •• 0
1I"¥ " rl 0 • 0
~p 0 " ~ 0 :f11• $~ ¥ • • Orl 0 , 0 0 • , '"0 § m" ~ • • ooo '" ¥ .0 '" ~
rl rl rl 0 , bD f-! •.-1 0
" " '" :a~ ~,
~o 0 0 '" 0 '" '" 0 I:l <II r-l '"
'"0 '" " • " • '" ¥ ¥ 0 • ¥ 0 ¥ '"' o,<:'l '" .,.,
" ~<: • '" 0 ¥'o< • " . 0 p • ~0 • 0 " ~.,., <II <II, • 0 • rl
~.... R 0 ~ 0 0 z 0 o " ,0 ~ 0 ¥
• n '" 1;;-a Sa.A B 0 n • rl • 0'" 0 • A B 0 A B 0 A B 0 A B 0~ ~ " " H_ ~ " ~- footnote *1 2 } 4 5 6 7 8 9 10 11 12 I} 14 15 16 17 18 19 20 21 22 23 24_l1l'f.....
AIJlAJUA 1 1 1 a
ALtUmU**
ARGElfTINA 1 1 3 1 1 1 1 6 1 1 1 1 1 1 1 1 N N N d2 4 4 3 4 4 4} 6 84 7 9 .
5
AUSTRALIA 1 2 5 7 1 4 ; 1 1 2 5 16 5 16 2 5 N a2 17 4 12 2 2 5 2 2 17 4 .1 17} 18 6 13 } 1 3 } 18 6 6 184 1 1 4 8 4 4 1 1 15 19 2 5 5 5 5 19 2 196 4 } 6 6 6 6 4 } 47 3 7 7 7 , 7 7 } 7 }8 6 • • • • • 6 8 69 8 9 9 9 Ii 9 9 • 9 8
10 20 10 10 1 1 10 10 20 10 2011 21 11 11 11 1 11 11 21 11 2112 22 12 12 12 1 12 12 22 12 2213 23 13 13 13 1< 13 13 2} 13 2314 24 14 14 14 15 14 14 1415 15 15 15 ,j 15 15 1524 24 2} 25 24 24 2425 25 24 2 17 25 2526 26 18 26 2627 27 19 27 27
2021222}252627
AUSTRIA 1 1 1 1 1 } 1 2 1 1 1 1 1 1 1 1 1 N N N d} 3 4 } 3 } } } 3
BAHAMAS 1 1 d
BANGLADESH 1 5 1 1 1 5 1 5 1 1 5 1 1 5 1 0 0 0 d2 2 ~_2 23 } } }4 4 4 4
BAlUJAIlOS**
J3ELGnm 1 3 4 4 4 ~ 4 4 4 4 4 b-42 5
6
.. a - All services combinodb Co-ordination is oarried out by one of the servioes
(numbers rafer to Tabla 2.3)o Co-ordination is oarried out by a separate national
agano;)'
d Co-ordination is ad hoo as the need arieeee - Co-ordination not reportedf - Other
tc..* Info~tion not fGceived
Table 2.4 contd. 26
Services listed in Table 2.3:
Operatestations
:for.:
Deal operationally withobservational networks on;
Datastorage
andretrieval
Publioation
0<data
Catalogues
Standards Co-ordipUblished nation
State /terri tory
A' C
1 2 3 4 5 6 7 8 9 10 11 12 13 14 15 1b 17 18 19 20 2l 22 23 24
'ENIN 1 12
3 3 12
3 12
3 '-1
]OLIVI.A.**
BOTSWANA **
BRAZIL 12345
678
15
23
6 123
12345
678
1 6 N N d
<1 1 12346
2 23 34 46
BRITISHCARI:BBEA]'TERRITORIES
-.----+-+-+--+-1-1--+--1-+-+-+---+-+--+-1-+-+--1-1-+--1--+-1-4--1
BULGARIA 1 12 3
45
1 1 2 2 13
1 1245
1 1 1 1 1 1 N N N •
'URMA 12
1 1 12
1 12
1 o d
lIURIDillI**
]YELORUSSIANSSR**
CANAllA 123
4 1 III4 5
14
1 2 1 4 1
f4 1 4 N <
CAPE VERIlE**
CENTRAL AFRICANREPUllLIC**
ClWl 1 1 1 1 1 1 1 1 o •CHILE 1 4
23
5126
1 12 2
3 6 1 12 4
12
5126
2 4 5 1 4 52 1
<
CHINA**
COLOMBIA 1 23
1 1 1 1 1 2 13
1 3 1 1 2 13
NON a
• a
•,
All services combinedCo_ordination ia carried ou~ by one of the services(numbers refer to Table 2.3)Co-ol.'dination is carried out by a separate nationalagency
d Co-ordination is ad hoc as the need arisese Co-ordination not reportedf Other
** Information not received
Table 2.4 cantd. 27
Services listed in Table 2.3: Data Publica-storage tion Cata- Standards Co-ordi-Operate
Deal operationally with and or logues published nationatations retrieval data
forI observational networks on:
• ?" •ooo • •• • '" . • 0 ~" " ¥oo " · '"0 0 .0 ¥ • ~~ • •Stat~1 '" '" ~~ • • " •¥ ¥ " ? -;::; '" 0 " . ~ "• • • • I " '" • • 0 0territory ~ ~ m'" ~ • • I ~¥
~Z 0 '"~ § '" 0
~ • .~ ,¥• • o~ ~ 'ri ¥ , , '. ~ .• • • ? 0 • • • • • ~" ~¥~ ~ ~o • ~ ~ • • • 0 0 ~ ~o ~ .0 0 ·'" 0 • " '" 0 " ~ " ~ ~ '"o~ - § ~ " • 0
~ " "' 0 "' ¥"'~0 " '" 0 • • "' • 0 ¥ ¥ 0 ..¥ "'" • ~~ · ~ ¥ OO¥ • 0 ~~ ~ ¥ • '" ," '" ." ¥ 00 • ~ • • " • ¥ " ~ • • • ¥ ¥ • ,
¥ • '6.11 ~ $ ·, • '" 'ri • § ~ ~ ., ~ ~ • . '" .• ~ • li~ ~~ ~ • 0 ~ "l • • :£: 0 :f t:l• ill ¥ • .~ 0 " 0 • 0 " 'ri0
~ ~ • • 0. '" ¥ • • 'ri 1: ~ ~ ~ 0 " 1>0 ~ 'rl 0
" " ~ :a ~0 " ~o • • '" • ~ '" • s:: QI ...... :;.
I); ~ ~" • • • 'ri ¥ ¥ " • ¥ • ¥ ~ a..<1 <II -f>~~ • '" • ¥~
~ " . is ~ • ~ • ~ .: " ~-f> QI QI, • 0 • ~ ·~0 >< 0 0 o ~ "0
~ • ¥ ·" 'ri ~ ¥'"S"• • C " ~ • 0," 0 • ·'" A B C A • C • • C A •00 H ~ ~ H_ 00 00 ~- C, foatnms *
1 2 3 4 5 • b 7 8 9 10 11 12 13 14 15 16 17 18 19 20 21 22 23 24
COMOROS**
CONGO 1 3 1 1 1 3 1 3 1 1 b-32 1
COSTA. RICA 1 2 3 1 1 1 2 3 1 3 1 2 3 N , N d
CUBA**
CYPRUS 1 1 2 2 1 3 1 1 1 2 1 1 2 1 1 2 d1
CZECHOSLOVAKIA 1 1 2 2 1 2 1 1 1 2 1 1 2 1 1 2 N N N bJ 3 4 4 3 4 3 3 3 4 3 3 4 3 3 4
DEMOCRATICKAMPUCHEA**
DEMOCRATIC PEOPL~
REP. OF KOREA**
DEMOCRATICYEMEN**
DENMARK 1 2 3 3 1 1 2 2 1 2 3 1 3 1 2 3 c2
DOMINICAlf 1 1 3 1 1 1 1 1 2 3 3 1 1 3 ,REPUBLIC 2 1 3 2 4 2 4
4
ECUADOR 1 1 1 1 1 1 1 1 1 1 1 1 N N b-l
EGYPT**
EL SALVADOR 1 1 1 1 b-l
ETHIOPIA 1 1 3 1 1 1 1 1 3 1 3 1 1 a2 1 2 2 2 2 1 2 1 2
2 2
FIRllAml 1 1 3 1 1 1 1 2 2 1 1 3 4 4 4 4 4 4 d2 1 2 1
FRANCE 1 5 6 1 4 4 1 4 2 2 1 5 6 1 6 1 5 6 N d2 2 5 5 2 5 41' 3 3 3 3 3 2 33 3 7 7 5 4 4 7 4 7 3 74 5 5 5 7 ~5 4 'll'7e-
'RENCH 1 1 1 1 1 1 1 1 dPOLYNESIA
* 9. - All serVl.celi combl.nedb Co-ordination is oarried out by one of the sBJ;Vioee
(numbers refer to Table 2.3)o - Co-ordination is oarriad out by a separate national
agenoy
d - Co-ordination is ad hoc as the need arisese - Co-ordination not reportedf - Other
**Information not r0coivad
Toble- 2;40 contd. 28
Services li sted in Tabl e 2.3, Data publica-sto~age tion Cata- Standards Co-ordi-
Operate Deal operationally wi~hand of logues published nation
stations observational networks on: retrieval datafor:
• •" -:;j0 · 0. • ·rl 0 0 0~
" " ~ • " • ·rl0 0 .0 ~ · ~~
0
·rl ·rl ~e • 0 " . •State /
~ ~ " - rl ·rl 0 " 0 p "" • ." . " ·rl •• 0 0
~ ~OO~ ~ • " " ~
~ Z 0 ·rl
terri tory p " ·rl 0 ii ~ " ~ -ri .~
~0 Ori " ~ ·rl ~ ~
, , • oj 'l:l III
• • - 0 • a " " • " 'l:l I=l :»-Pp p riO 0 · p ~ 0 " • 0 0 ri :» 0 .<:l 01
0 0 " ·rl 0 • " " 0 " ... " • '" ·rlo~ " ~
~ " 0 " " " 0 " " ~,,~
0 " ·rl 0 • " " • " 0 ~ ~ 0 ~ <II -P I=l·rl • ~ri · ,f; ~ oo~ . 0 ,,~ p ~ • ·rl • I-I.r! <II
" ~ 00 • ~ . " " • ~" ~• 0 • .
ri~ ~oo >
~ " ri" ~~
0> " ·rl ·rl " ~~ ri
"ri • . ~ .
0~
O~ " ~" t: ~ ri • 0 p p " " :so~i1a ~" ~ • "ri 0 " 0 " 0 " " ·rl0 " "" ~ · • OOO ·rl ~ " " ·rl
~ri ri ri 0 " llDl-I -r! 0
" " a " ·rl ·rl • 0 " ~o " " ·rl • ·rl ·rl " I"l O!l rl :.:~ 0 ·rl "
0 " " " a • ·rl ~ ~ " " ~ " ~ ~ O.dCll-P
1';-' ~riO · ·rl " ~ ... a " . ~
p~ ~ " ~ " " li! -P <!> O!l
0'" > • 0 " ri ·rl ." 0 0 z 0 o ~ "0 " " ~ ." ·rl ~ ~" See
A , C " " ri • o ·rl 0 0 " ~ A , C A , C A , C A E C00 ~ " " H_ 00 00 "'- footnote *1 2 3 4 5 6 7 8 910 11 12 13 14 15 1 17 18 19 20 21 22 " 24
FRENCH TERR. OFTHE AFARS JJITIISSA **
GABON 1 ~ 3 1 1 1 1 1 3 1 3 1 1 0 d
4 4 4 4
GERMAN DEMOCRATIC 1 1 2 1 1 1 1 1 1 1 1 1 2 1 1 2 1 1 2 • Y • d
REPUBLIC 2 2
GERMAllY • FEDERAL 3 4 2 2 4 3 3 2 3 4 4 4 2 1 1 2 4 4 2 • d
REPtrnLIC OF 4 3 4 4 4
GllANA 1 2 6 1 1 1 1 1 2 6 1 6 1 5 6 .-22 534
GREECE 1 2 5 5 1 2 2 1 1 1 2 5 3 0
2 4 1 1 2 2 2 2 4 13 2 2 3 3 3 3 2
3 3 4
GUATEl·lALA 1 3 2 3 1 3 3 2 3 2 3 3 2 0 0 f
2 1 2 23 14
GUINEA**
GUYANA**
RAITI**
BONJ}URAS 1 3 1 2 2 3 1 3 1 1 1 1 1 e
2 2 2 23 3
HONG KONG 1 1 2 1 1 1 1 2 1 2 1 1 2 '-11
HUNGARY 1 1 3 1 1 1 3 1 2 1 1 3 1 1 3 1 1 3 f
2 4 1 3 4 4 24 4
ICELAND 1 1 5 1 1 2 1 1 5 1 1 1 1 5 5 1 1 5 • d2 4 1 5 33
nrnu 2 3 1 1 2 1 2 1 • • d
INDONESIA 1 1 2 1 2 1 1 1 2 1 2 1 2 • d1 0
• •b
All services combinedCo-ordination ia carried out by one of the services(numbers refer to Table 2.3)Co-ordination is carried out by a separate nationalagency
d Co-ordination is ad hoc as the need arisese Co-ordination not reportedf Other
** Information not recelved
Table 2.4 contd. 29
Services listed in Table 2.3: Data Publica-storage tion Cata- Standards Co-ordi-Operate Deal operationally with an' of logues pUblished nationstations observational networks on: retrieval data
for:. ? ."o. " 0 i~ • ." 0 0 0,~ . " ."0 0" 0
~ : • ~~0 .State/ ." ~
~ii0 , •~ ~ " -;; ~ ." 0 @ 0 ~
," " on " ., • 0 0territory ~ ~
.~ ~ 0 " ,1i ~
~z 0
.~."~ @
., 0 {i ~ " , , .~0 0 O~ ~ .~ .. • III 'Cl III• • " 0 0 n g n 'd I'! >:. +'~
~ ~o 0 · ~ M 0 n • 0 ~ ;>, 0 ,<:l to0 0·" 0 0 " ~ 0 " ~ " " ="oM @ M " ~
0 " " ~ 0 ~ a ~~~0 " ~ 0 -;; " 0 0 ~ 0 ~ . ~ 0 .. III +' >:." 0 M~ .;; .. H 0 0 ,.~ ~ ~ ." .I-I.ro! "'" ~ 00 0 ." ~ • ~" • 0 0 0 ~ ~ 0 >~ ! ~ " M C"- o > ." ." " @ ~ ~ ~
~~ ~ " o ~ •
~O~ " n~
~ ~ ~ 0 0 ~~ " N :E: 0 ~ tljE ~ • • "~ 0 a 0 " 0 a ."
Ii g C"- • 0 o • .,~ n" ." ~
~ ~ ~ 0 a bo 1-1 'ro! 0
" ." ." 0 0 " a' .~ " ",
" ." ." " j:l <l>.-I ~." " 0 " ~ " , 0 ~ ~ " • ~ , ~ M o ~ oj +',~ ~ 0 • ." " ~~ , " . ~ ~
0~ " ~ " " .!i! +' <l> <l>
~, 0 0 .i1 ~ "
o ,. ~ 0 z 0 o ~ a0~ " • a .,
~ ~~
Sa,A B C a ~ • 0·' 0 0 " ~ A B C A B C A B C A B C00 ~ " " H~ 00 00 ~~
footnote *1 2 3 4 510 7 8 9 10 11 12 13 14 15 1 17 18 19 20 21 22 23 24
lBAl! 1 2 1 1 1 1 1 1 1 2 1 1 2 3 ,3 2 3
IRAQ.**
IRELAHD 1 3 3 1 1 1 3 3 1 3 ,2 2 2 2 2
ISRAEL 1 1 3 3 1 1 1 1 1 3 1 1 3 1 1 3 ,2 2 2 2 2
ITALY 1 1 1 1 1 1 1 1 1 2 2 2 1 1 1 N N ,1 1 2 ·1
,IVORY COAST 3 1 1 N ,
2 3
JJ..,M!IGA l l , 1 2 L~ 1 1 2 1 1 .2 0 0 ,1
JAPAN 1 1 1 1 1 1 1 1 0 0 •JORDAN 1 1 1 1 1 1 1 2 1 2 1 1 2 ,
2
KENYA 1 1 2 1 1 1 1 2 2 2 N ,1 0
KUWAIT ....
LAO PEOPLE'S DEM.REPUlILIG**
LEllANON**
LIBERIA**
LIBYAN .ARAllREPUBLIC**
LUXEMBOURG 1 1 1 1 1 1 1 a
MADAGASq..rn 1 2 1 1 1 1 1 2 1 1 2 1 N b-1
MALAWI 1 2 3 1 2 1 2 3 3 1 3 ,MALAYSIA 1 4 5 1 1 1 1 4 5 1 5 1 5 0 0 b-12 2 2 2
3 3 3
* a All serV1ces combinedb - Go-ordination 1a oarried out by one of the servioes
(numbers refer to Tabla -2.3)o - Go-ordination iu oarried out by a separate national
agenoy
d Co-ordination is ad hoc ae the need ariseee Co-ordination not reportedf Other
** lnformation not received-H-ll- Hove no stations and services
TobIe 2.4. contd. 30
Sexvices listed in Table 2.3: Data Pu.blioa-storage tion Cata- Standards Co-ordi-
Operate Deal operationally with "nd of logues published nationstations obBexvational networks on: retrieval data
for:n ';;' ."o· 0 0
~0 • ~ 0 0 0p p ~ n " n . ·rl
,'i 0 00 ~ ~ ~ m n'rl ~ e 0 - 0 g
~ ~ " ;:;' ·rl pop gStotel 0 0 0" n " ~
om 0
~ ~m ~ ~ 0 • 0
~Z 0 'rl
terri tory ~~ ~'rl 0 i ~ • ~ .~ , ~
~ 0 ~ g ~ ~ ~, ,
• '" rei <IIn 0 ';; 0 0
", n g q;j l:: >'-P
~ P ~ 0 0 p ~ 0 g 0 n >. 0 .<:l "'0 o ·rl 0 0 " ~ " ~ " 0 ~'rl
o.~
~~ • 0 " " ,p 0 ~ g ~~~
0 " ·rl 0 0 ~ • ~ 0 ~ ~ ~ 01 +' l::'rl • "n n
~~ m~ m
~~~ P ~ n 'rl .!-l .... CII
" ~ o 0 n~
n 0 " ~ p . .~ .': ~ ~ m ,
~ 0 ~ " ~~ ~; " ·rl ·rl 0
~ ~ " n n~
o~ n
• .jj o~ .- j; ~ n 0 p p 0 ~ 0 ."a ~~ j; ~On , 0 • 0 0 , 'rl ,
"0 ,l~ n on ·rl ~
" 0'rl 1: ~ ~ ~ ,~ ~
I>D!-l .... 0
" g " ~ ·rl n 0 , ~o 0 0 rl 0 'rl I'l Q>.-l ;.:
~ ·rl " 0 " ,Q" a 0 'rl ~ ~ ~n ~ 0 ~ ~ o.<:l CII -P
~ " ~ 0 m 'rl l ~~ a " m " p~ 0 , 0 " .!i! -::; .g: ~0 0~ ~ ~
0 ~ ·rl o ~ R 0 ~ 0 0 z 00 j; o p ~ ~ ~~
A " C,
~ O'rl 0 0 o ~ A " C A C A A " s"w ~ 0 ~ H~ W m ,~ • " c C footnote *1 2 J 4 5 6 1 8 9 10 11 12 lj 14 15 16 17 18 19 20 21 22 2l 24
>!ALI 1 1 2 1 1 1 1 1 1 2 1 2 1 1 2 d
MAURITAllIA**
MAURITIUS 1 1 2 1 1 1 1 1 2 1 1 2 1 1 b
MEXIGO**
MONGOLIA 1 2 1 1 1 1 1 1 2 1 2 1 1 2 1 1 2 1 N N N d
MOROOGO 1 1 4 1 1 1 1 1 1 1 1 4 1 1 1 1 4 0-42 2 J J 2 4 4J 1 4
5 56
MOZAMBIQUE 1 2 J 1 1 1 1 1 2 J 1 J 1 J d
NEPAL 1 1 1 a
NETHERLANDS 1 3 4 4 1 1 1 1 1 2 1 3 4 1 4 1 3 4 0 0 0 c2
NETHERLANDS ......ARTILLES
NEW CALEDONIA 1 1 1 1 1 1 1 1 d
NEW ZEALAND 1 2 1 1 1 1 1 1 1 1 1 1 2 1 1 J 1 1 1 0-11 3 1 3 3
NIOARAGUA 1 2 1 1 4 1 1 1 2 1 1 2 1 1 2 1 0 0 r3 3 3 J4 4 4 4
NIGER 1 3 4 2 2 1 4 1 4 b-12
N18ERIA**
NORWAY 1 2 3 3 1 1 1 1 1 4 1 2 3 1 2 3 1 2 3 N d
1 1 1
OMAN**
PAKISTAll**
PANAMA 1 1 1 1 1 1 1 1 1 1 r2 2 2 2 2 2 2
* a All sarVlces combinedb Go_ordination ie carried out by one ·of the services
(numbere refer to Table 2.3)o Go-ordination is carried out by a separate national
agency
d - CO-Ordination is ad hoc as the need arisese - Co-ordination not reportedf. - Other-..* Information not received
..** Have no stations and services
Tobl~ 2.4 contd. 31
Services listed in Table 2.3: Data Publica-storage tion Cata- Standards Co-ordi-Operate
Deal operationally with and of logues published nationstations
observational networks anI retrieval datafor:
• c;;-o .ooo m •• • '00 • 0~" " ~ . " · '"0 0 m 0 ~ • ~ ~ •
Statel '" '" ~ ~ • • 0 . •~ ~ " -;:;- '" 0 ooo~ "m m oo, · " '" roo 0 0terri tory t t . ~ ~ • m m i ~ i = 0 ~
~ § '" 0
i ~ m .~ , ~~ • o~ ~ '~ ~ , , • oj <d <d• m 0 • •, • ,
~8.2t;~ ~ ~o • · ~ ~ • , 0~
~0 0 .'" 0 • " '" 0 " ~ m ~ '0
o~ 1 ~ " m 0 " " '" 0 '" " ~"'~0 " '" 0 -;;- m • '" ~~ • '" 0 ~ ~ 0~ ~ ~ f;j'" • ~~ 1: oo~ • 0 ~ ~ · j" ~ 00
~ • m " • ~" • • • • ~ • >~ m
'6"~ ~ ·, , ~ '0. § ~ M ~ <, ~ ~ m . ~ •• > .fI", ~ ~ ~ • 0 • ~ m " " 0~~• ~ ~~ ~ • • m~ 0 " 0 0 ,
" '" " "0 § m'" ~ • • ooo '0
" ' , '" ~ ~ ~ ~ 0 " !>Ill-< ".-I 0
" " '" :a~0 ~o • m " '" m '0 '0 , I'l 011 rl ;.:... 0 '" " . • " • • '" ~ ~ • ~
~,
~ ~ o..c: <d """
" ~o '" ,~~ • ". • ~ • m • ::l " ..!i!""" 011 011~ > • "
,~ ~ .~ R ~ u 0 o ~ 00 M ,
~
• 0 '" ~~'"A • c .il m ~ • " '" 0 • m '" A • C A C A S••~ 0 '" H~ ro ro ~~ • • C A • C
footnote *1 2 , ,4 5 6 7 8 9 10 11 12 13 14 1, 10 17 18 19 20 21 22 2' 24
PAPUA NEW GUIUEA**
PARAGUAY**
PERU 1 2 2 , , , 2 2 1 2 1 1 2 2 b-12 1 1 2 1, 3 , 3
PHILIPPINES 1 1 4 1 1 1 1 1 1 4 1 4 4 02 1, 2,
POLAND 1 1 1 1 1 1 1 1 1 1 1 1 Not available fo' N N N apublic USe
PORTUGAL 1 1 1 2 1 1 1 1 1 1 1 1 2 1 1 2 d2 2
.!lATAH**
1 4 5 5 2 5 2 , 1 4 5 1 5 1 5 0 0REPUlILIC OF KOREA 2 5 3 ,,ROMANIA 1 1 1 1 1 1 1 1 1 1 1 1 1 1 1 1 1 1 1 N N N' b
RWANDA**
s•. PIERRE AJlJJMIQ)JELON**
SAUDI ARA.BIA 1 1 1 1 1 1 1 1 1 1 1 1 d
SENEGAL 1 1 2 1 1 2 1 d
SIERRA LllONE - '1 4 1 1 1 4 1 1 1 1 02 1 2 2, 2
5
SINGAPORE 1 , 1 1 3 3 1 3 d2 2 2
SOCIALIST REPITELICOF VII'r-H.AM**
, ,-- r-' - - l-I--SOMALIA 1 f
BOUTH AFRICA*** 1 3 1 1 1 1 1 1 1 1 1 4 1 4 N N d2 1 4 4 0 0
- , -* a All ue:rvlcu cOlilbined
bCD-ordination ie oarried out by one of the serviaee(numbers refer to Table 2.3)
o - Co-ordination ia carried out by a separate nationalagency
d - Co-ordination is ad hoc as the need arisese - CD-ordination nGt ~Dportedf - Other "** Information not reoeived .
*** Suapanded b1 ReBt38(Cg-VII) from ererclsing !t~fOrights and enjo1 ng privileges as a Member 0
Services li.ted in Table 2.3:
Table 2.4 contd.
Operatestations
for:
Deal operationally withobservational networks on:
32
Datastorage
andretrieval
Publication
o£data
Catalogues
Standards Co-ordipublished nation
Statelterri tory
SOUTHERNRHODESIA**
A. 0
1 2 j 4 5 6 7 8 9 10 11 12 13 14 15 1 17 18 19 20 21 22 23 24
SPAIn
SRI LANKA**
1 12 j
4 4 112
2 1 1 1 1 41
15
45
5 4 N1
N .-1
SUDAN 1 j2
j 1 1 1 1 1 2 j2
1 2 32
1 2 j o 0 0 e
SURINAM 1 32
4 1 1 1 22 3
1 3 42
12
4 12
4 £
SWEDEN 1 2 1 1 1 1 1 2 1 2 1 121 1 2 1 d
SWITZERLAND
SYRIAN ARAIIREPill3LIC**
1 1 234
2 1 4j4
1 1 1 234
1 2j
4
1 1 c
THAILAND
TOGO**
1 5234
2314
1 1 1 5 22 jj 14 4
4 5 21 j3 1
4
1 5 124
o 0 0 d
TRnrIDAD All'DTOllAGO
TUNISIA
1 12 33
1 1
124
2
3
2
12
1 1
1 1
1 1 12
1 1 2
1 1 1
2
111 If If N
1 1 2
d
c
TURKEY 1 123
31
1 12 23
1 12 2
1 1 32 1
12
3 1 3 li' li' N d
UGANDA
UKRAINIAN S. S. R. **
1 12
1 1 1 1 1 1 2 1 12
1 2 d
Union of SovietSocialist Republi~ 1 2 1 1 1 1 1 1 1 1 1 1 2 1 1 1 1 1 1 N N N d
UNITED KINGD0l1 OFGREAT ]RITAIN AltD 1 1NORTHERN IRELAND
2 2 1 1 2 1 1 1 1 2 1 1 2 1 lIN •
* a All serv~ces combinedb - Go-ordination is carried out by one of the ssrvices
(numbers refer to Table 2.3)c Go-ordination is oarried out by a separate national
agency
d Go-ordination is ad hoc as the need arisese Co-ordination not reportedf - Other
*~ Information not received
Table 2.4 contd. 33
Servioes listed in Table 2.3:
Operatestations
£or;Deal operationally with
observational networke on:
Datastorage
andretrieval
Publicationof
data
Catalogues
Standards Co-ordipublished nation
State/terri tory
ABC
1 2 3 4 5 6 7 8 9 10 11 12 13 14 l51lb 17 18 19 20 2l 22 23 24
UNITED REPUBLIC 0 1 2CAMEROON
UNITED REPUBLIC 0 1TANZANIA
1
1 1
1 1 1
1
1
1 1
1
1
1
1 1
o o d
b-l
UNITED STATES OF 1 1M'1ERICA 2 2
34
34
2 1 1 13 2 24 3 3
23
1 1 12 2 23 44
1 1 32 434
1 1 42 3
1 1 42 334
o 0 0 b
UPPER YOLTA
URUGUAY
VENEZUELA**
1 1
1 32 4
12
56
1
12
1
2
56
1
4
1 1
1 3 52 4 6
1 1 1 b-l
d
YUGOSLAVIA 1 1 12 2 23 3 34 4 45 5 56 6 67 7 7
1 1 1 1 1 1 111 NNNo 0 0
b-l
ZAIRE 1 423
56
123
56
56
56
f
ZAl1BIA 1 12
2 1 2 1 1 1 1 22
1 1 22
1 1 2 d
* a All services combInedb Co-ordination is oarried out by one of the servioes
(numbers rafer to Tabla 2.3)o Co-ordination ia oarried out by a separate national
agency
d Co-ordination is ad hoo BS the need arisesa Co-ordination not reportedf - Other
** Information not received
34
TABLE 2.5 - NUMBER OF COUNTRIES OPERATING HYDROLOGICAL SERVICES
Number of countries having
Yeo.rhooksPublished
Services Data storage or SUffi- Cataloguesoperating and retd evol mari es available notional organizationalstations facilities available for standards standards
for for for for for
A - Hydrometric 96 87 80 81 26 17observations
B.- Ground I'loter 82 67 31 45 13 8observations
C - Climatological 95 85 81 79 25 14observations
TABLE 2.6 - NUMBER OF COUNTRIES OPERATINGNETWORKS FOR OBSERVING OTHER SPECIFIC ELEMENTS
Number of countries having services dealingoperationally wi th observational neworks on
~..c•H >,-0.. • .. c• • • ." C~• H • • • .. ~ ..-< ..-<
~ H • C H C H 0..-< C, • • .-0 "" -" ..-< 0 • 0 0 c u0 • • "" c H u "" .. e.c 0'" u -..-IC -" ~ u c 0 ." 0 " "" u "" e'" c c c 0 .c '" ." -0 • H " •-J" ..-< • .. .. 0 ."" • >,.c
• '" u • e "'-0 .. .c u~ c w • c ~
0 u 3~> ~-0C~
Total 40 67 12 41 18 48 78 72
TABLE 2,7 - NUMl3ER OF COUNTRIES PU:SLISRING YEA1lJ300KS OR SUMMARIES JNJ) CATALOGUES
Yearbooks and summaries Catalogues
Region hydrometric groundwater climatological hydrometric groundwater climatologicalobservations observationsobservations observations for hydrologi_ observations observations for hydrologi-cal nurnoaes cal nUXUDses
(1) (2) (3) (4) (5 ) (6) (7)
Africa 21 6 20 23 8 21
Asia 11 6 10 7 4 6
South America 5 2 6 7 4 7
North and Central America 10 3 10 10 6 10
South-West Pacific 7 - 8 7 2 8
Eu.rope 27 15 28 27 21 27
'"'"
i~;';"<~."';>-,
. ,'.-
TABLE 2.8 - INTER-SERVICE CO-ORDINATION
No. of countries
Co-ordination South North and South-WestAfrica Asia
AmericaCentrol Padfie EuropeAmerica
(1) (2) (3) ( 4) (5) (6) (7)
All services combined orco-ordination by one of 11 2 3 2 2 10the service~ ,
By a separatenational agency 2 1 - - 2 4
Ad hoc 12 8 3 4 4 16
Not reported 2 1 - 2 - -
Other 2 - 2 5 - 1
'"'"
CHAPTER 3
PRINCIPAL RIVER BASINS
Explanatory notes
3.1 List of principal river basins
Principal river basins and groups of basins are listed in tables accordingto WMO Regions (Tables 3.1 to 3.6). Major sub-basins only are shown in the case ofvery big basins.
3.2 International system of hydrological observing station identificationnumbers
In order to facilitate international exchange of hydrological informationusing WMO international hydrological codes (FM 67-VI HYDRA - Report of hydrologicalobservations from a hydrological station and FM 68-VI HYFOR - Hydrological forecast),an international system of hydrological observing station identification numbers hasbeen adopted by WMO*. The form of the number is (OOOAC.) (BBiHiHi
H) which identifies
the WMO Region (A), country (C.), river basin or group 6f basins (B8) and thestotion (iHi~iH) The basin inaicators (BB), the countries which extend into thebasin, as well as the corresponding country indicators (C.) are also shown inTables 3.1 to 3.6. The basins are listed in the order of'(BB) numbers. Not alll~ts have yet been formally adopted by the respective WMO Regional Association;the status is indicated on each list. Catchment areas of basins are derived fromnumerous sources and may not be accurate and in some cases the information is notavailable. Additional information will be provided in the next issue of thispublication, in co-operation with the Members. Each table is followed by a map ofthe Region showing the international basins.
3.3. Institutionalized co-operation in river basins·
The number of international agreements and treaties concerning international rivers and boundary waters has rapidly increased in recent years. Manyof these agreements and treaties have resulted in institutionalized co-operationamong the countries concerned. Table 3.7 lists the main international institutionsof this kind. The type of each institution is indicated in column 4 according tothe following classification:
A - Commission or committee consisting of representatives of theparticipating countries. The commission (committee) isaccorded the status of an international organization and hasan executive secretariat;
B - Commission or committee consisting of representatives of theparticipating countries and an executive secretariat (status
*WMO Manual on Codes, Volumes I and II (WMO-No. 306) 1974
38
as an international organization not indicated);
C - Joint commission consisting of the representatives of the participatingcountries and holding regular meetings;
D- Commission consisting of experts of disinterested countries and anexecutive secretary;
E - Committee consisting of representatives of the participating countries andsupported by the secretariat of the respective regional economiccommission of the United Nations.
F - Company established as a joint-stock company as defined by related act ofone of the participating countries and amended by the agreement.
Column 5 shows the fields of co-operation as follows:
I - Integrated water resou-rces planning and developmentN - NavigationP - HydropowerW- Pollution controlH - Hydrological survey and/or forecasting.
The information on this subject is derived from:
(i) Legislative Texts and Treaties - Provisions Concerning theUtilization of International Rivers for Other Purposes thanNavigation (ST/LEG/SER.B/12; United Nations Publication,Sales No. 63.V.4);
(ii) Management of International Water Resources: Institutionaland Legal Aspects (SF/ESA/5; United Nations Publication,Sales No.E.75.II.A.2);
(iii) UN ECOSOC, Document E/C.7/35, 27 October 1972.
TABLE 3.1 - PRINCIPAL RIVER BASINS IN AFRICA'
(WMO REGION I)
39
Major Approximate WMO* WMO*Basin area code State /terri tory codesub-basin km2 (8B) (Cil
,Mejerda 23,000 01 (Algeria 1
(Tunisia 2
Ch. Melrhir and Rhorsa 685,000 02 (Algeria 1(Tunisia 2
Ch. Djerid 03 Tunisia 2
Algerian Coast 04 Algeria 1
Ch. a1 Hodna 61,000 05 Algeria 1
Ch. ech Chergui 06 Algeria 1
Tofno 07 (Morocco 3(Algeria 1
Moulouya 53,700 08 Morocco 3
North-West Coast 09 (Morocco 3(Canary Islands 7
Oued -Guir) 27,400 (-Mo-roc-co 3Daoura ) - 10 (Algeria 1Cued Ora ) 20,130
Atui 11 (Western Sahara 4(Mauri tonia 5
Senegal 338,000 12 (Guinea 6(Mali 1(Mouri tonia 5(Senegal 8
Gambia 77,850 13 (Guinea 6(Senegal 8(Gambia 9
Gebo 8 / 000 14 (Senegal 8(Guinea-Bissau 1(Guinea 6
Corubal 20,000 15 (Guinea 6(Guinea Bissau 1
South-West Coast 16 (Guinea 6(Sierra Leone 2(Liberia 3(Ivory Coast 4
Kolanto (Great Scarcies) 8,000 17 (Guinea 6(Sierra Leone 2
*The WHO code has not yet been adopted by Regional Association I (Africa)
40Table 3 1 contd,
MajorApproximate WMO* WHO'
Basin area code State/terri tary codesub-bosin km2 (BB) (Gi)
Moo 17,900 19 (Guinea 6(Liberia 3(Sierra Leone 2
Mono-Morro 8,250 20 (Guinea 6(Liberia 3(Sierra Leone 2
Lofa 10;620 21 (Guinea 6(Liberia 3
St. Paul 21,900 22 (Guinea 6(Liberia 3
St. John 17,220 23 (Guinea 6(Liberia 3
Cess (Cestos) 12,560 24 (Ivory Coast 4(Liberia 3
CavaUy 30,200 25 (Guinea 6(Ivory Coast 4(Liberia 3
Gul f of Guinea 26 (Ivory Coast 4(Ghana 5(Togo 6( Benin 7(Nigeria 8
Sassandra 75,000 27 (Guinea 6(Ivory Coast 4
Komoe 76,500 28 (Upper Volta 9(Ivory Coast 4
Bia 9,650 29 (Ghana 5(Ivory Coast 4
Tone 15,000 30 (Ghana 5(Ivory Coast 4
Vol ta 394,100 31 (Upper Volta 9(Moli 1(Ghana 5(Benin 7(Togo 6(Ivory Coast 4
Mono 22/000 32 ( Benin 7(Togo 6
Oueme 47,780 33 (Benin 7(Nigeria 8
Niger 1,215/000 34 (Guinea 6Benue 305,000 35 (Moli 1
(Ivory Coast 4(Upper Volta 9(Niger 2( Benin 7
*The WMO code has not yet been adopted by Regional Association I (Africa)
41Table 3 I contd,
Major Approximate WMO* WMO*Basin area code State/terrritory codesub-basin
km2 (88) (Ci)
Niger (eontd.) (Nigeria 8(United Rep. of Cameroon 3(Chad 5
Cross 48,000 36 (United Rep. of Cameroon 3(Nigeria 8
Chad 2,400,000 37 (Central African Rep. 7(Chad 5(United Rep. of Cameroon 3(Nigeria 8(Niger 2(Sudan 6
Senaga 131,500 38 United Rep. of Cameroon 3
Nyong 26,200 39 United Rep. af Cameroon 3
Ntem 26,350 40 (United Rep. of Cameroon 3(Gabon 6(Equatorial Guinea 9
Benito 14,000 41 (Gabon 6(Equatorial Guinea 9
Utambori (Temboni) 5/000 42 {Gabon 6(Equatorial Guinea 9
Ogooue 205,000 43 {United Rep. of Cameroon 3(Congo 4{Gabon 6{Equatorial Guinea 9
Nyonga 20/800 44 {Congo 4{Gabon 6
Kouilou 55,340 45 Congo 4
Chiloango 13,000 46 {Cabinda 8{Zai re 1{Congo 4
Zoire/Congo 4,014,000 47 {Zaire 1Sangha 48 {Congo 4Ubangi 772,800 49 (Uni ted Rep. of Cameroon 3Kasai 879,000 50 (Central African Rep. 7Ruki 51 {Rwanda 8Lomami 90,000 52 {Burundi 9L. Tanganyika 238,700 53 ( Uni ted Rep. of Tanzania 2
(Zambia 5(Angola 6
Angola Coast 54 Angola 6
Kunene 106,500 55 (Angola 6(Namibia 7
Etosha Pan 56 (Angola 6{Namibia 7
*The WMO code has not yet been adopted by Regional Association I (Africa)
42Table 3 I contd,
MajorApproximate WMO';;' WMO*
Basin orea code State/terri to ry codesub-basin km2 .(BB) (Gi)
Okavango 785,000 57 (Angola 6(Botswana 3(Namibia 7(Southern Rhodesia 4
Namibia Coast 58 Namibia 7
Orange 650,000 59 (South Africo** 1(Lesotho 2(Botswana 3(Namibia 7
Cape Coast 60 South Africo**COrange to 1Maputo)
Mediterranean Coast 61 (Li byan Arab Rep. 4(Egypt 3
Nile 2,978,000 62 (Burundi 9Blue Nile 324,530 63 (Rwanda 8Atbara 88,000 64 (United Rep. of Tanzania 2Dinder 65 (Kenya 7Adar 66 (Uganda 4Sabat 67 (Zaire 1Behr" el Ghazel 68 (Sudan 6Lake Mobuto- 61,114 69 (Ethiopia 5
Sese Seko (Egypt 3Lake Victoria 264,160 70Kogera 58,370 71Mora 10,900 72Lake Kyaga 75,500 73
74
Gas-h 23,500 75 (Ethiopia 5(Sudan 6
Boraka 45,000 76 (Ethiopia 5(Sudan 6
Red Sea Coast and Gulf 77 (Egypt 3of Aden (Sudan 6
(Ethiopia 5(Somalia 8(French Terr.of Afcrs and
Issa 9
Awash 113,700 78 (Ethiopia 5(French Terr.of Afars and
Issa 9
Shebelli 260,000 79 (Ethiopia 5(Somalia 8
Jubo 196,000 80 (Ethiopia 5(Somalia 8(Kenya 7
Lake Turkana (Rudolf) 500,000 81 (Ethiopia 5(Kenya 7(Sudan 6(Uganda 4
Lake Stefanle 82 (Ethiopia 5(Kenya 7
*The \~O code has not yet been adopted by Regional Association I (Africa)
**Suspended by Res.38(Cg-VII) from exercising its rights and enjoying privileges as a Member of WMO
43Table 3 I contd,
Major Appromixate WMO* WMO*Basin
sub-basin area code State/terri tory codekm 2 (88) (Gi)
Lake Natron 83 (Kenya 7{United Rep. of Tanzania 2
Athi 70,000 84 (Kenya 7
Umbo 85 (Kenya 7(United Rep. of Tanzania 2
RuE ji 158,000 86 United Rep. of Tanzania 2
Great Ri ft Valley Basins 87 (Ethiopia 5(Kenya 7(United Rep. of Tanzania 2
Ruvuma 155,400 88 (Mozambique 8(Malawi 9(United Rep. of Tanzania 2
East Coast and 89 (Kenya 7S.W. Indian Ocean (United Rep. of Tanzania 2
(Mozambique 8(Madagascar 3{Mauritius 6
Zombezi 1,295,000 90 {Angola 6Shire 48,900 91 (Botswana 3.
92 {Zambia 5(Southern Rhodesia 4(Malawi 9(Mozambique 8
Buzi 28,800 93 (Southern Rhodesia 4(Mozambique 8
Save 101,000 94 (Southern Rhodesia 4(Mozambique 8
Limpopo 412/000 95 (South Africa** 1(Botswana 3(Southern Rhodesia 4(Mozambique 8
Incomati 46,246 96 (Swaziland 5(South Africa** 1(Mozambique 8
Umbeluzi 5,600 97 (South Africo** 1(Swaziland 5(Mozambique 8
Maputo 29,800 98 (South Africa** 1(Swaziland 5(Mozambique 8
*WMO code has not yet been adopted by Regional Association I (Africa)
**Suspanded by Res.38 (Cg-VII) from exercising its rights and enjoying privileges as a Member of WMO
44
Mop 3(0) INTEI!NATIONAL RIVER BASINS
AFR.-tC A
@G••h@Rorl'.lka
@NiI.@ Lolut Chc!d
R1Vi1r balln > 1000 000 km
Rlwf -buJinlOOOOO-1OOOOOO km
RI'iSf basin < 100 000
Ikuln OIIfiiMlIl'ltorFlQliolKl1 boundaries
TABLE 3.2 - PRINCIPAL RIVER BASINS IN ASIA
(WHO REGION II)
tfa jarApproximate WMO" WHO"
Basin area code State /territory codesub-basin km2 (BB) (C. )"
Chukotsk and Okhotsk seacoasts (except Kamchatka) 01 USSR 9
Kamchatka 02 USSR 9
Lena_Indigirka 2,785,000 03 USSR 9
Sakhalin and Kuril Islands 04 USSR 9
Sea of Japan coast 05 (USSR 9including 5uyfun (China 1
Arnur 1,844,300 06 (China 1(USSR 9(Mongolia 7
Lake Baikol 07 (Mongolia 7(USSR 9
Angora 08 USSR 9
Yenisey 2[590,000 09 (USSR 9(Mongolia 7
Upper and Middle Db 2,484,000* .. 10 (USSR 9(China 1(Mongolia 7
Irtish 11 USSR 9
Lower Db and lobol 12 (USSR 9(China 1(Mongolia 7
Kazakhstan (Central) 13 USSR 9
Lakes Balkhash and Alokal ' 14 (USSR 9(China 1
Chu, Talas, Asse andLake I ssyk-Kul' 15 USSR 9
Syr Daryo 219,000 16 USSR 9
Amu Deryo 454,000 17 (USSR 9(Afghanistan 2
Murgch, Tedzen (Harirud) 18 (USSR 9and Atrek (Afghanistan 2
(Iron 4
Ural and Emha 19 USSR 9
*WMO Code has not yet been adopted by Regional Association II (Asia)**Total area of Db river basin
45
46Table 3 2 contd.,
MajorApproximate WMO* WMO*
Basin area code State/territory codesub_basin km2 (BB) (Ci)
Tarim (including Yorkand) 20 (USSR 9(China 1
South coast of Caspian SeQ 21 Iran 4
Lake Rezayeh 51,800 22 Iran 4
Euphrates-Tigris 541,000 95 (Turkey (Region vI) 6(including (Syrian Arab Rep.
Karun) (Region VI) 3fIrcn gIraq
Ka:run 23 Iran- 4
24)2,1-49" 690 ) -Soudi Arabia 6
"25)
Tibcn. 26 {Oem. Yemen 7(Yemen 1
Fersian Gulf 27 Iran 4
Gentral Basin 28 Iron 4
Daryochech-Ye-Sistan 528,700 29 (Pakistan 3(Afghoni stan 2
Helmond 370,000 30 (Iran 4
Tolah 31 (Iron 4(Pakistan 3
D"osht 32 (Pakistan 3{Iran 4
Hingol 33 Pakistan 3
Pishin Lora 34 (Pakistan 3(Afghanistan 2
Indus 970,500 35 (Chino 1Jhelum 29,785** 36 (Indio 8Chenab 28/148** 37 (Pakistan 3Ravi 14/470** 38 (Afghani stan 2Sutlej 95,208** 39Kabul 77,850 40Khuram 41Gomol 42
Uvs Nuur 43 (USSR 9(Mongolia 7
Char Us Nuur 44 (USSR 9(Mongolia 7
Urungu 45 (Mongolia 7(China 1
*WMO Code has ~ot yet been adopted by Regional Association II (Asia)**Area in India
47T ble 3 2 contda ,
Majar Approximate WMO* WMO*Basin area code State /territory codesub-basin
km2 (BB) (Ci)
Ganges 1,059,310 46 (Chi na 1Yamuna 268,273 47 (India BGhoghra 132,000 48 (Nepal 5Gandak 45,800 49 (Bangladesh 6Kosi 86,900 50
Brahmaputra 935,000 51 (Chino 1(Indio 8(Bhutan 4(Bangladesh 6
Meghna 80,200 52 (Indio 8(Bangladesh 6
West Coast 491,600 53 India 8
East Coast (Bay of Bengal) 1,210,330 54)Mohanadi 132,790 55) India 8Godavari 302,590 56)
- 65,610 57 Sri Lanka 3
Karnafuli 58 ( India 8(Bangladesh 6
Ka1adan and Arakon Coast 59 ( India 8(Burma 2
Irrawaddy 430,000 60 (China 1(India 8(Burma 2
Sittang 32,535 61 Burma 2
Salween 280,000 62 (China 1(Burma 2(Thailand 9
Tenasserim Coast 63 (Burma 2(Thailand 9
Chao Phraya 1111 500 64 Thailand 9
Pakchan 65 (Burma 2(Thailand 9
Mekong 802,900 66 (Chino 1"67 (Burma 268 (Lao P.O.R. 469 (Soc. Rep. of Vietnam 3
(Thailand 9(Dem~ Kampuchea 5
Saigon-Voico 70 (Oem. Kampuchea 5(Soc.Rep.of Vietnam 3
Indo-China Coast 71 (Soc.Rep.of Vietnam 3
La 72 (Lao P.D.R. 4(Soc.Rep.of Vietnam 3
Ma-Chu 73 (Lao P.D.R. 4(Soc.Rep.of Vietnam 3
*WMO Code has not yet been adopted by Regional Association II (Asia)
Table 3.2, contd. 48
McjorApproximate WMO* WMO*
Basin area code State /terri tory codesub-basinkm 2 (BB) (Gi)
Reo (Koi) 120/ 000 74 (China 1( Soc. Rep.nf Vietnam 3
Tumen -"39:,.370 75 iO• P• R. af Korea 8China I
{USSR 9
Yal-\) 62,:6'80 76 {China I( O.• P•.R. of Korea 8
Han 3.3:,330 T1 ( D.P.R. of Korea 8(Rep. -of -K-orea 6
Po Hai -Coast 78) Chino 1Liaa 2-19",000 79)
Hwang He 745,100 80
Yangtze 1/ 942,500 81)Han 174,350 82)Yalung 144,280 83) Chino 1Chioling 159,810 84)Tungting 261,130 85)
South-east Coast 86 China 1
Si 328,000 87 {Soc.Rep.of Vietnam 3(China 1
Hokkoido ) 88Honshu )
372,313 89Japan 5
Shikoku ) 90Kyushu ) 91
92to ( spar-e)99
*WMO Code has not yet been adopted by Regional Association II (Asic)
Map 3(b) """NATIONAI. ",VE' IlASINS
Balin w'llin.
IlIhtmcrtional bovnc:ktri$1
!O
21 JIndv.
@--.........,~@Kar-fvly
@.......@h-rawGdoIi®",,-,@M.....@lted@H.;@,..@-@I'ahh.n
@c.@Lcdc"Ublg
@Tiban
RiWlr brllSin > , 000 000 km'
Itiw,r basin 100 000 -1 000 000 km"
11I.;",.. basin < 100 000 km'
1 lOb
(DYllnisoy0 Amllf
ffi"",,=
5 TttllMHl
& .....
(]),....0,.....(!)ILi®AmU~Dar)'a
@MUrgab
@c:oruh@•.;@Jordon
@Euphll:lm-Ti£l.il
@HOri@H<!Ilmond
@DGd.t
'"'~.
50
TABLE 3.3 - PRINCIPAL RIVER EASINS IN SOUTH AMERICA
("mo REGION III)
Approximate "/MO * WMO *Basin
Hajor area code State/territory codesub-basins (BB) (e i )
km2
Jurado 01 (Colombia 1(Panama
CarI'ibean Sea 02 Colombia 1
Magdalena-Cauca 241,000 OJ Colombia 1
Ca.tatumbo 04 (Colombia 1(Venezuela 2
Carribean Sea 05 Venezuela 2
Orinoco ,880,600
06 (Colombia 1(Venezuela 2
Meta 07 (Colombia 1(Venezuela
Essequibo 08 (Venezuela 2
Amacuro 120,000** (Guyana 3Darima
North Atlantic 09 Guyana 3Ocean
Courantijn 66,700 10 (Guyana 3(Surinam- 4
North Atlantic 11 SUrinam 4
Maroni 100,000 12 (Su:rinam 4(French Dept. of Guiana 5
North Atlantic 13 French Dept. of Guiana 5
Ciapoque 14 (French Dept. of Guiana 5(Brazil 6
.Amazon 15 <Bolivia 7(Brazil 6~colombia 1
5,778 ,300 Ecuador 8
r ana 3Pcru 9enezuela 2
Beni-MadI'e de Dios 16 U30livia 7fBrazi1 6Pcru 9
Mamore 17 fBOl1Via 7(Guapore) . Brazil 6
NegI'o 18 (Brazil 6(Colombia 1
lfapo 19 I (Ecuador 8(Peru 9
Putumayo 20 (Brazil 6(Ica) ~colombia 1
Ecuador 8(PeI'u 9
* \ofMO Code has not yet been adopted by Regional Association III
** Essequibo only
Table 3 3 1 contd
Basin
Amazon cant.
Pacific Ocean
Patia
Mira
Pacific Oc ean
Zarumilla
Tumbes
Chira - )Catamayo)
Pacific Ocean
Tocantinos
North, North EastAtlantic
San Francisco
East Atlantic
South EastAtlantic
MajorBub-basin
Caqueta f;fapura)
From its headwaters toJavari basin
From the Javari up to theAuari-Parima confluence
From the Auari-Parima confluence up to upstream cfthe Coari Lake
From the headwaters of LakeCoari up to the Rio Puruebasin
From the Purus confluence upto the Rio Negro basin
From the Rio Negro confluenceup to the Rio Madeira basin
From the Rio Madeira confluencup to the Rio Trombetas basin
From the Obidos straits up tothe Tapajos confluence
From the Tapajos confluence upto the Rio Xingu basin
Downstream of the Xingu confluence inclUding the rivers 0
Marajo Island
Approximatear~a
km
7,200(in Eouador)
5,650
17,l50
! 271,000
906,500
673,400
WMD'code(BB)
21
22
23
24
25
26
27
28
29
30
31
i~140~
41
42
43
44
45
46
47
48
49 ~
50\
~~l53l
State/territory
( Brazil( Colombia
Brazil
Brazil
Erazil
Brazil
Brazil
Brazil
Brazil
Brazil
Brazil
Brazil
(Reserve)
Colombia
(Colombia(Ecuador
(Colobmia{Ecuador
Ecuador
{Ecuador(Peru
(Ecuador{Fexu
(Ecuador(Peru
Peru
Brazil
Bxazil
61
6
6
6
6
6
6
6
6
6
6
1
18
18
8
89
89
89
9
6
6
6
51
* WMO Code has not yet been adopted by Reglonal ASSoclatlon III
52
Table 3 3, contd
Approximate ,",0 * ,",0*
BasinMajor area code state/territory codeBub-basin
km2 (BE) (C i )
Ti ticaca - l 48,800 54 tOliViB. 7Poapa (in Peru) Chile 1
Pe"" 9
Laguna Blanca 150 55 ~Chile 1Pe"" 9
Zapalar! 890 56 [Argentina 2:Bolivia 7Chile 1
Cancosasanto'l
57 ~Bolivia 7Todos 108 Chile 1LaucaCoBapilla
Plata Rio de la Plata 128,360 58 ~Argentina 2Uruguay 4
(Total ar.ea: 2Paranaiba ) 59)
Brazil 63,209,000 KIn. -
fF.arana: l 367,0001,572,410 Grande 60
~~raguay: 1,095,000fp~uguay: 38 5,080 Parana between the Grande and Tiet 89,000 61 Brazil 6lata: 128,360 confluences including Tieta basinguazu: 70,000)
Parana between the Tieta and 127,000 62 Brazil 6Paranapanema confluences
Parana between the Paranapanema, 63 ~Brazil 6includin~ that river's basin and Paraguay 3the 19uazu confluence (excludingIguazu basin)
27 2,000Parana between the Iguazu conflu- 64 trgentina 2ence including that basin and the Brazil 6Paraguay oonfluence (excluding Paraguay 3Paraguay basin)
Parana between Paraguay and 717,400 65 (Argentina 2Uraguay rivers
Paraguay from- headwaters up to the 66 (Bolivia 7Bandurral (Dtuquis) ~Brazil 6
Paraguay,095,000
Paraguay between Bamburral and 67 tOl1Via 7Apa Brazil 6
Paraguay 3
Paraguay between Apa and Panana 68 trgentina 2confluences Bolivia 7
Paraguay 3I
Uruguay 69 trgentina 2Brazil 6Uruguay 4
70 (Reserve)
Laguna Merin 71 ~Brazil 6Uruguay 4
Atlantic Ocean 72 Uruguay 4
Puna endorheic 73 Argentina 2:;asins
* WMO Code has not yet been adopted by Regional Association III
53
Table 3 3 contd,Approximate ~mo * ,·ma *
Basins axea code State/ten·!tory codekm2 (BE) (C i )
Salinas Grandee 74 Argentina 2Laguna MarChiqul taPampa de las SalinasPozo de las Yeguas
Rivers Desaguadero, 75 Argentina 2Colorado and Negro andrivers flowing into theAtlantic between the Plataand Negro rivers
Rivers of Patagonia flow- 76 Argentina 2lng into the Atlantic southsouth of the rio Negro
Closed basins of the 77 Argentina 2Patagonian Plateau
Pacific Ocean 78 Chile 1
79
80
Lake Baker j 81 ~Argentina 2Chile 1
Buenos Aires
Gallegos 82 ~Argentina 2Chile 1
Lake Fagnano 83 ~Argentina 2Chile 1
Vizoaohas 84 ~Argentina 2Chile 1
Lake San Martin 85 ~Argentina 2Chile 1
Lake Pueyrredon 86 ~Argentina 2Chile 1
Rio Gimpeonj 87 ~Argentina 2Chile 1
Huemules
Rio Picocisnss 88 ~Argentina 2Chile 1
R10 ca1eUfU_j 89 ~Argentina 2Chile 1
Corcovado-
Falena
Rio Futaleufu 90 ~Argentina 2Chile 1
Rio Puelo 91 ~Argentina 2Chile 1
Rio Manso 8,620 92 ~Argentina 2Chile 1
Rio Hua-Hua 93 ~Argentina 2Chile 1
Laguna del :Bayo 94 ~Argentina 2Chile 1
Laguna Esoondida/Salar del Pular
Laguna Mucar
Salina de Jama
* WMO Code has not yet been adopted by Regional Association III
54
Mop 3( 'J INTERNATIONAL RIVER BASINS
o'
"
@poscua
@serrClno
@Gc!hggs-ChiCD
@Culen
@sgn Marlin
@carlnfil Sliva
@';OG,".do@lak. Fognano
Rivllf benin:o 1000 000 kin'
R!VClr bClIin 100 000-1 000000 km"
River basin <_ 100 000 km"
Balin outline
Intornationol boundaries
21 PUlillo
@Y81cho
@palena
@.y".@Baker
SOUTH AMERICA
,{
\)
",'w
...~~~t0Y~~~+-----l--0gtatumbo
0Orinoco
0·-"~(DEUeqUlbo
(5)C"-'"
~::k0A.rnaZoM
9
10 loI-
n12
13 hifo
@Lak" Tllicaca-Poopa
®-.
TABLE 3.4 - PRINCIPAL RIVER BASINS IN NORTH AND CENTRAL AMERICA
(WMO REGION IV)
Major Approximate WMQ* WMQ*Basin orea code State /terri tory codesub-basin
km2 ( SS) (Gi)
Arctic Ocean 01 United States (Alaska) 1
Pad fie Ocean 02 United States (Alaska) 1
Yukon 932,400 03 (United States 1(Canada 2
Stikine 49,200 04 1(Canada 2
Pad fie Ocean 876,200 05) Canada 206)
Fraser 238,280 07 (Canada 2(United States 1
Arctic Ocean (including islands) 3,580,000** 08 Canada 2to12
Nelson-Saskatchewan 1,072,260 13 (Canado 2{United States 1
Hudson Bay 4,040,000 14 Canada 2
Columbia 668,220 15 (Canado 2(United States 1
16to18 (spore)
Mississippi 3,230,400 19 (Canada 2to (United States 130
St. John 58,500 31 (Canada 2(Uni ted States 1
Great Lakes 774,000+ 32 (Canada 2to 142
St. Lawrence 1,289,820 43 (Can ado 2(United States 1
Atlantic Ocean 958,600 44 Canada 2
*WMO Code was adapted by Regianal Association IV in November 1975**Mainland area only
+Above Iroquois dam
55
56T ble 3 4 contda ,
Approximate WHO* WMO*
BosinMajor area code State /terri tory code
sub-basin km2 (BB) (ei)
Paci fie Ocean 45) United States 146)
AHantic Ocean 47) United States 148)
Gulf o·f Mexico 49) United States 150)
Grande 471,940 51 (United State's 1(Mexico 3
Colorado 637,900 52 (United Stat,es 1(Mexi.co 3
Con-ce.pcion) 53 (United States 1
Yaqui ) (Mexico 3
-njven-a "54 (United -Stotes ~
(Mexico 3,
.P-adH:c 'Oee-an 55) Mexico "3
56), "57)
GuFf :o'f '"Mexico!: '08) Mexico 3
59)
Hcmno-Azul 60 {Mexi-co ""3 ,(Guatemala 4
CandeTaria 61 (Mexico 3 "(Guatemcila 4
Us uffiacinio-Gri jalvo 50,750*-* 62 (Mex'icc 3( GUdtemolo 4
Suchiate-Cootan) 1,-276+ 63 (Mexico 3"
Achute (Guotemal-o 4
Lempo 18,500 64 (Guatemala 4(Honduras 5(El Salvador 6
Paz 2,505 65 (Guatemala 4(El.Salva-dor 6
Motague 16,500 66 (Guatemala 4(Honduras 5
Goascoran 2,990 67 (El Salvador 6(Honduras 5
Caribbean Sea 68 Honduras 5
*WMO Code was adopted by Regional Association IV in November 1975**Areo in Mexico only+Suchiate in Guatemala only
57Table 3 4 contd,
MajorApproximate WMO* WMO*Basin
ar~a code State /territory codesub-basin km (BB) (ei)
Coco 26,550 69 (Honduras 5(Nicaragua 7
Choluteca-Negro 11,450 70 (Honduras 5(Nicaragua 7
Pad fi c Ocean 71 Nicaragua 7
Caribbean Sea 72 Nicaragua 7
San Juan 38,790 73 (Nicaragua 7(Costa Rico 8
Pad fic Ocean 74 Costa Rico 8
Cari bbeon Sea 75 Costa Rico 8
Sixaola Teribe 3,655** 76 (Costa Rico 8(-Panama 9
Pad fic Ocean 77 Panama 9
Caribbean Sea 78 Panama 9
Bahamas 13,500 79 Bahamas 1
Cuba 114,524 80) Cubo 281)
Dominican Republic 48,442 82 Dominican Republic 3
Haiti 27,750 83 Haiti 4
Jamaica 11,400 84 Jamaica 5
Puerto Rico 8 t 800 85 United States 1
Trinidad and Tobago 5,121 86 Trinidad and Tobago 6
Barbados 430 87 Barbados 7
Colombia 88 Colombia 1
S9to (spare)95
*WMO Code was adopted by Regional Association IV in November 1975**Sixaola in Panama only
58
".
Map 3(d) ItilTERNATJONAlRIVER- a-ASINS
NORTH AND CENTRAL AMERICA
INSET 1
0PaJ: @SI.LgWr<'l'l1Uj
G).•po @". J.k.
0coco{S«jp!ia) @MiPli!ippi
@GoClicorCin @Cclumbilll
® Ntlgro @COIOfCldo
®Son JUg" @RIO Grondo
~Sh:'ClOIl:.l ~4MClIIQCrlt
14 Yukon 25 Atllhonlte
Stlkine 26 Pti'Ckrnfiles
Flour @Ti1uonaNelson - Saskolchewon
fHvtlf ~sin :> 1000000 km"Rivot bolin 100000-1000000 krri'
Rlvor bosln < 100 000 kilt
IIasin OI,ltlin.
lntarncliiollol boundaries
TABLE 3.5 - PRTNCIPAL RIVER BASINS IN SOUTH-WEST PACIFIC{l)
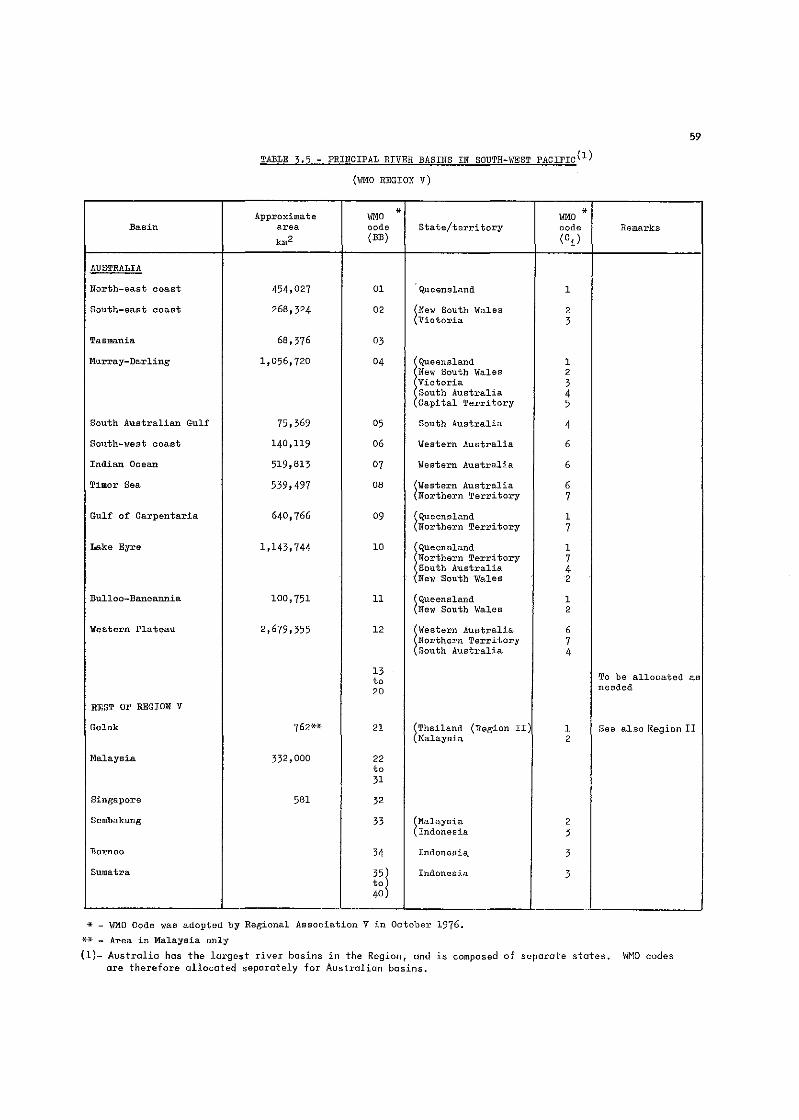
("'1'10 REGION V)
59
Approximate lIMO * *'""0Basin area oode State/territory code Remarks
km2 (BB) (OJ
AUSTRALIA
North-east ooast 454,027 01 Queensland 1
South-east coast 268,324 02 ~New South Wales 2"Victoria 3
Tasmania 68,376 03
Murray-Darling 1,056,720 04 Queensland 1New South \olales 2Victoria 3South Australia 4Capital Territory 5
South Australian Gulf 75,369 05 South Australia 4
South-west coast 140,119 06 Western Australia 6
Indian Ocean 519,813 07 Western Australia 6
Timor Sea 539.497 08 ~western Australia 6Northern Territory 7
Gulf of Carpentaria 640,766 09 ~ Queensland 1Northern Territory 7
Lake Eyre 1,143,744 10 ~QUeenSland 1Northern Territory 7South Australia 4
(New South Wales 2
Bulloo-Eancannia 100,751 11 ~ Queensland 1New South Wales 2
Western Plateau 2,679,355 12 ~western Australia 6Northern Territory 7South Australia 4
13To be allocatedto as
20 needed
REST OF REGION V
Golok 762** 21 ~Thailand (Region II) 1 See also Region IIMalaysia 2
Malaysia 332,000 22to31
Singapore 581 32
Sembakung 33 ~MalaYSia 2Indonesia 3
:Borneo 34 Indonesia, 3
Sumatra35j
Indonesia 3to40
* - vrMO Code was adopted by Regional Association V in October 1976.
** - Area in Malaysia only
(1)_ Australia has the largest river basins in the Region, and is composed of separate states. WMO codesare therefore allocated separately for Australian basins.
60
T bl 3 5 c tda e , on.> *Approximate WMO WJ>lO
:Basin area code State/territory code Remarks
km2 (BB) (0i)
Java 41 ) Indonesia 342
Sunda Isles 43) Indonesia
I3
45
Timor 14,925 46 ) Indonesia 447
Nalucas Isles 48 Indonesia 3
Tami 49 flndonesia 3Papua New Guinea 5
I-Sepik 50 fpapua lIew Guinea I 5
Indonesia 3
Fly 51 fpapua New Guinea I 5Indonesia 3
We.st Irian 52 Indonesia 3
East Irian 461,69.1 53 Papua New Guinea 5
Luzon
54jPalawan 55Mindoro 30"0,000 56Panay (area of 57 Philippil-,es 6Neg-roB Philippines) 58·Sama:r 59)Mindanao 60
New Caledonia 19,056 62 New Caledonia 7
North Island 114.70063
;New Zealand B To be allocated
to as needed65
-South Island 150,46066; N.8W Zealand 8 To be allooatedto as needed70
Hawaii 15,939 71 United States 9
* - \~O Code was adopted by Regional Association Vin October 1976.
61
Me~
'£'"..'"~
~w
" U~
~,.t; m
i •~
w~• ~ ~ • ~A .,
M :r .. ] ·att'" ~
• ~ J~
~0
0
GGE>88"
·0.~
~--~----+--~--<d--~,
. ~---+---+----fo/~'-t---I--~~-- y
,/,P
62
TABLE 3.6 _ PRINCIPAL RIVER BASINS IN EUROPE
(WHO REGION VI)
Mo-jorApp roximate WMO* WMO*
Basin ar.ea code State /terri tory code" sub-basin km2 ( BB) (Gi)
.(Iceland)
.103, 000 01 Iceland 4
Shannon 10,410 02 Ireland 5
(Rest of Ireland) 74,021 03 (I reIand 5(Uni ted Kingdom 6
Scotland 78,772 04 United Kingdom 6
England - north of Dee andHumber 05 Uni ted Kingdom 6.
East England _ from Thame s
to Humber 06 United Kingdom 6.
South England _ from Thomes
to Bristol 07 United Kingdom 6
Wales except Severn 08 United Kingdom 6
Central England 09 Uni ted Kingdom 6
North and West Coast 53,000 10 Spain 2
Mino) 1l (Spain 2
Limo) (Po.Tiugal 1
Duero (Douro) 97,000 12 (Spain 2(Portugal 1
laja (Tagus) 79,000 13 (Spain 2(Portugal 1
Wes.t coast 14 Portugal 1
South coast 15 (Spain 2(Portugal 1
Guacliana 82,725 ·16 (Spain 2(Portugal 1
GuodalqlJivir 56/630 17 {Spain 2{Portugal 1
English Channel coast 18 {France 1{Belgium 2
Atlantic coast 19 France 1
*The WHO Code wos adopted by Regional Association VI in September 1975.
63TobIe 3 6 contd,
Basin MajorApproximate WMO* WMO*
sub-basi narea cade State /territory codekm 2 (88) (Ci)
Schelde 20 (France 1(Belgium 2(Netherlands 4
Meuse 28,950 21 (France 1(ot Lith) (Belgium 2
(Germany, F.R. 3(Netherlands 4
Seine 78,650 22 France 1
Loire 115,120 23 France 1
Dordogne 23,860 24 France 1
Garanne 85,470 25 (France 1(Spain 2
Ebra 82,880 26 (Spain 2(France 1(Andorra 3
South-east coast 96,600 27 Spain 2
Languedoc coast 28 France 1
Common to Norway-S\-Ieden 29 (Norway 7(Sweden 2
Common to Norway-Finlond_ 30 (Norway 7USSR (finland 8
(USSR 9
Norway only 31 Norway 7
Common to Sweden-Finland 32 ( Sweden 2(Finland 8
( Sweden) 33 Sweden 2
(Denmark) 43,069 34 Denmark 9
Rhine 196,840 35 (Swi herland 9Moselle 27,100 36 (Austria 2
(at Cachero) (Germany, F.R. 3(France 1(Netherlands 4(Luxembourg 8
Wessel (Weser) 37,788 37 (Germany, F.R. 3(ot Intschede (German D.R. 6
North Sea coast 8,469 38 (Netherlands 4(including Ems) (Ems at Versen (Germany, F.R. 3
Rhone 95,600 39 (Swi herland 9( France 1
Elbe 131.951 40 (Czecholsovokia 1(at Neu.-Darchou) (German D.R. 6
(Germany, F.R. 3
*The WHO Code was adopted by Regional Association VI in September 1975,
64T bl 3 6 c ntda e , 0
Basin 11ajorApproximate }IMO* \-.'MO*
area code State/territory codesub_basin km2 (88) (ei)
~-
Baltic Sea Coast 41 (Germany, F.R. 3(German D.R. 6(Poland 4
Danube 815,850 42 (Germany, F.R. 3roo 25,700 43 (Switzerland 9Tisza-Mures 139,078 44 (Austria 2Sava 93,720 45 (Czechoslovakia 1Drovo 40,490 46 (Hungary 4Yel Morova 37,400 47 (Yugoslavia 5
( (Albanio) 6(Romania 7(Bu19.ario 8(USSR 9
Po 70,100 48 (Italy 3(Swi tzerland 9
Venetian Coast 49 (Itoly 3(Swi tzerland 9
Corsica) 50 (France 1
Sardinia) (Holy 3
(Southern Itoly) 51) Italy 352)53)
(Finland) 54) Finland 855)
Hest 801tic Coast 56 Poland 4
Odra 109,360 57 (Czechoslovakio 1(ot Gozdowice) (Poland 4
(German D.R. 6
Wista (Yistula) 196,840 58 (Czechoslovakia 1(Polond 4
Adriatic Coast (North) 59 Yugoslavia 5
Adriatic Coast (Sooth) 60 (Albania 6(Greece 2
(Greece) 61) Greece 262)
Vardar (Axios) 24,662 63 (Yugoslavia 5(Greece 2
Mesto (Nestos) ) 6,178 64 (Bulgaria B
Struma (Strimon)) 16,553 (Greece 2( (Yugoslavia) 5
Marica (Meric Nehri) 14,560 65 (Bulgaria B(Turkey 6( Greece 2
Block Sea Coast (East) 66 (Romania 7(Bulgario B(Turkey 6
*The WHO Code was adopted by Regional Association VI in September 1975.
65tdT bl 3 6a e , con
MajorApproximate WMO* WMO*
Basin area code State/territory codesub-basin km2 (BB) (ei)
67)68) (spare)69)
Northern district 70 USSR 9
Kola Peninsula 71 USSR 9
KoreUo, North-west and 72 USSR 9Estonia
West Dvino and rivers betweenWest Dvino and Neman 360,000** 73 USSR 9
Neman ond Koliningrad 74 (USSR 9(Poland 4
Upper Volga 75 USSR 9
Kama 76 USSR 9
Lower Volga 1,350,000(Volga at Volgogro:l 77 USSR 9
Don 429,940 78 USSR 9
Upper Dnl eper ond Bug 593,540+ 79 USSR 9
Middle and Lower Dnieper 80 USSR 9
Black "Sea -West of Dnieper 81 (USSR 9(Poland 4
Black Sea East of Dnieper 82 USSR 9
Sea of Azov 83 USSR 9
Northern Coueo.sus 84 USSR 9
Eastern Tronscaucasus 85 USSR 9
86 (spare)
Black Seo ) 87 Turkey 6(North and East Coast) )
53,700)
Block Sea (South Coast) ) 88 Turkey 6
Caspian Sea (\Iest) 89 Iran ( Region II) 4
KUTa-Araks 178, 000 90 (Turkey 6(Kura at Surra) (Iron (Region II) 4
Turkish Mediterranean Coast 91 (Turkey 6(Greece 2
Asi 7,800 92 (Lebanon 8(in Turkey) (Syrian Arab Rep. 3
(Turkey 6
*The WHO Code was adopted by Regional Association VI in September 1975.**Area of Ovina only
+Area of Dnieper
66ntdT bl 3 6a e co
MajorApproximate WMO* WMO*
Basin areo code State/territory codesub-basinkm2 (88) (Gi)
Eastern Mediterranean Coost 93 (Syrian Arab Rep. 3(Lebanon 8(Israel 5
Internal Basins and Gul f of 94 (Syrian Arab Rep. 3Aquaba (Lebanon 8
(Israel 5(Jordon 7(Saudi Arabia q{egion III) 6
Euphrates-Tigris 541,000 95 (Turkey 6(including Karun) (Syrian Arab Rep. 3
(Iron (Region II) 4(Iraq (Region II) 5
*Th e WMO Code was adopted by Regional Association VI in September 1975
68
TABLE 3.7 - INSTITUTIONALIZED CO-OPERATION IN INTERNATIONALRIVER AND LAKE BASINS
Region and basin
(1)
Africa
Chad
Gambia
Kagera
Mano
Niger
Niger (Upper)
Name of institution member countries
headquarters
(2)
Chad Basin Commission/Commission dubassin du Tchad - Cameroon, Chad,Niger, Nigeria - Ndjamena (Chad)
Gambia River Basin Co-ordinatingCommittee - Gambia, Senegal
Inter-state Organization for theDevelopment of Kagera River Basin Burundi, Rwanda, United Rep.of Tanzania
Mano River Union - Liberia l SierraLeone
River Niger Commission/Commission duFleuve Niger - Benin, United Rep. ofCameroon, Chad, Guinea, Ivory Coast,Mali, Niger, Nigeria, Upper Volta Niamey (Niger)
Technical Committee for Flood Forecasting and Warning System - Guinea r
Mali
Year ofagreement
(3)
1964
1976
1971
1976
19631964
1969
co
1.1- •.-j" ...,~
ID ...,Q. .,.,~...,
f- if>C.,.,
( 4)
A
C
C
B
A
C
co
4- •..,0""o
-u H.., ID
ID ~.,., 0"- I
oU
(5)
I
I
I
I
I
H
Nile (Lower)
Nile (Upper)
Senegal
Tanganyika
Permanent Joint Technical Commissionfor Nile Waters - Egypt, Sudan -Khartoum (Sudan) 1959
Technical Committee for the HydrometeoTological Survey of Lakes Victoria,Kyoga and Mobutu Sese Seko - Burundi,Egypt, Kenya, Rwanda, Sudan, UnitedRep. of Tanzania, Uganda 1967
Organisation pour la mise en valeur dufleuve du Senegal (OMVS) - Mali,Mauritania, Senegal - Dakar (Senegal) 1968
Inter-State Technical Committee for theDevelopment of the Water Resources ofLake Tanganyika Basin - Burundi, Rwandc r
United Rep. of Tanzania, Zambia, Zaire- Bujumbura (Burundi) 1975
B
B
A
B
I
H
I
I
Table 3 7, contd.
Region and basin
(1)
Asia
Amur, Argun
Ganges,Brahmaputra,Meghna
Helmand Delta
Indus
Mekong (Lower)
Kosi
Soutb America
Parana
Pilcomayo
Plata
Lake Titicaca
Uruguay
North and CentralAmerica
Central AmericanRiver Basins
Name of institution member countries
headquarters
( 2)
Joint Scientific Council - China, USSR
Joint Rivers Commission - Bangladesh,India
Helmand River Delta Commission Afghanistan, Iran
Permanent Indus Commission - India,Pakistan
Committee for Co-ordination of Investigations of the Lower Mekong Basin Dem. Kampuchea, Lao P.D.Ro, Thailand,Soc.Rep.of Vietnam - Bangkok(Thailand)
Co-ordination Committee - India, Nepal
Joint Argentina-Paraguayan TechnicalCommission - Argentina l Paraguay
Joint Technical Commission for Hydraulic Works on the River Pilcomayo -.Argentina, Paraguay
Intergovernmental Co-ordinating Committee of the Plata Basin Nations (ICC)Argentina, Bolivia, Brazil, Paraguay,Uruguay - Buenos Aires (Argentina)
Joint Commission - Bolivia, Peru
Joint Technical Commission - Argentina,Uruguay - Buenos Aires (Argentino)
Comite Regional de Recursos Hidraulico~
(CRRH) - Costa Rica, £1 Salvador,Guatemala, Honduras, Nicaragua, Panam9
Year ofagreement
(3)
1956
1972
1950
1960
1957
1954
1971
1945
1971
1955
1946
1969
t:o
l.I_ • ..-1o +'
::>" ;"0.. 0.--:>-+'
f-- '"t:OM
(4)
C
C
D
C
E
C
A
C
A
A
c
A
(;9
t:o
4- '...-1o +'
"-n ........~ QJ
" "OM 0'"'-I
oU
(5)
I
I
I
I
I
I
I
I
I
I
I
I
70'
Table 3 7, contd
Region and basin
(1)
Colorado, RioGrande, Tijuanaand others
Name of institution member countries
headquarters
(2)
International Boundary and WaterCommission - Mexico and United States El Paso (United States)
Year ofagreement
(3)
1944
"ol.t- -..-Io+'
=>(I)+'"- ....>-+'f- on
"....
(4)
A
"4- .~o +'
o"" H..... (I)
" ".~ au.. ,
au
(5)
I
..... ----
C IColumbia River
Great Lakes
St. Lawrence
United States Canadian boundarywaters
Lake of the Woods
-Europe
Albania Yugoslavia Frontier lakesand rivers
Angoustrine,Lli via
Araks
Lake Constance
Danube
Danube
Danube, Tisza andother boundarywaters
Permanent Engineering Board - United---- ---States, Canada
Great Lakes Fisheries Commission United States, Canada
St. Lawrence River Joint Board of Engineers _ United States/ Canada
International Joint Commission (IJC)- United States, Canada
International Lake of the Woods ControlBoard _ United States, Canada
Water Economy Commission - Albania,Yugoslavia
Commission administrative internatlonale- France, Spain
Mixed Commission - U.S.S.R., Turkey
Commission internationale permanentepour 10 protection des eauX du lac deConstance - Austria, German~, FaR.,Swi tzerland
La Commission du Danube - Austria,Bulgaria, Czechoslovakia, Germany, ·F .Ra,Hungary, Romania, U.S.S.R., YugoslaviJ,- Budapest (Hungary)
Jochenstein Joint-Stock Company ~
Austria; Germany, F.Ra
Joint Technical Commission Czechoslovakia, Hungary
1961
1954
1953
1909
1925
1956
1869
1927
1960
1948
1952
1954
C
C
A
C
C
A
C
B
A
F
C
I
NP
I
I
I
I
I
w
I
P
I
Table 3 7, contd
Region and basin
(1)
Doura
Drove
Franco-Spanishfrontier waters
German-Danishfrontier waters
German-Polishfrontier waters
Hungary-Yugoslaviaboundary waters
Lake Inari
Inn, Salzach
Lake Lugano
Lac du Mont-Cenis
Moselle
Moselle
Mure
Name of institution'member countries
headquarters
( 2)
Spanish-Portuguese InternationalCommission - Portugal, Spain
Joint Drove Commission - Austria,Yugoslavia
Commission internationale d'ingenieurs- France, Spain
Frontier Water Commission - Germany I
F.R., Denmark
Mixed Polish-German Commission _German D.R., Poland - Frankfurt on theOder (German D.R.)
Water Economy Commission - Hungary,Yugoslavia
Mixed Commission - U.S.S.R., Norway,Finland
Austrian-Bavarian Hydro-Electric Compon- Au"stria, Hav"aria
Commission de Surveillance - Italy,Swi tzerlond
Commission technique de surveillance- France, Italy
International Commission for the Protection of the Moselle against Pollution/Commission internationale pour 10 pratectian de 10 Moselle contre 10 pollution- France) Germany, F.R., Luxembourg
International Moselle Company/Societeinternationale de la Moselle (IMG) France, Germany F.R., Luxembourg _ Trie(Germany, F.R.)
Mixed Commission For the Mure - Austria,Yugoslavia
Year ofagreement
(3)
1951
1955
1866
1922
1952
1955
1959
1950
1955
1955
1961
1957
1956
ca
4- .~
a +'~
" +'Q. .~
>-+'t- m
c.~
( 4)
c
c
c
c
c
c
c
F
c
c
A
A
c
71
ca
4- .~
a +'a
-a ~
...; "" Q..~ au. I
au
(5)
P
I
I
I
I
I
I
P
I
P
N
I
72
Table 3 7, contd~:.:;..::c::':_-,,--------~~-"'--~-----r-----r---.--,
Region and basin
(1)
Netherlands-Germanboundary waters(excluding Rhine,Ems, Dollart)
Our
Name of institution nlernber countries
headquarters
(2)
Permanent Boundary Water Commission- Germany, F.R., Netherlands
Societe electrique de l'Our - Germany,F.R., Luxembourg
Yeor ofagreement
(3)
1960
1958
co
4- ,~
o +'
"'" +''" .~>.+'I- '"c
.~
( 4)
C
A
co
4- .~
o +'o
-0 ~
..-< '"'" ".~ 0u.. ;
oo
(5)
I
P
1869
1959
Puycerda
Rhine
Rhine
Rhine (Upper)
Rhine
Sarre
Vardar (Axios),Lakes Doiron andPre spa
Commission administrative internatio-nale - France, Spain
Central Commission for the Navigationof the Rhine/Commission centrale pourla navigation du Rhin (CCR) - Belgium,France l Germany, F.R.,.Netherlands ,Switzerland, United Kingdom -Strasbourg (France) 1963*
International Commission for theProtection of the Rhine againstPollution/Commission internationale pour10 protection du Rhin contre 10 pollution- France, Germany, F.R., Luxembourg t
Swi tzerland 1963
Mixed Commission of the Rhine - Austria l
Swi berland 1955
Commission internationale de l'hydrologiedu bassin du Rhin (CHR) - Austria, Franc~
Germany, F.R., Netherlands, Switzerland- The Hague (Netherlands) 1965
Commission for the Protection of the Sarreagainst Pollution/Commission internation~E
pour la protection de 10 Sarre contre lapollution - France, Germany, F.R. 1963
Commission permanente de l'hydro-economieGreece, Yugoslavia
A
A
A
A
B
B
C
I
N
w
I
H
w
I
*Established in 1815, conventian amended in 1963
73
Table 3 7 contd, .c c0 0
Name of institution '<- .~ '<- .~- Year of 0 +' 0 .;0
Region and basin member countries - ~ 0agreement ~ +' -0 H
headquarters CL .~ .-j ~
>-+' ~ CLf- '" .~ 0
C I.e. r.~ 0
u
(1) ( 2) (3) (4) (5).
Yarmuk Joint Syro-Jordanian Commission -Jordan, Syrian Arab Rep. 1953 A I
Yugoslav-Bulgar Water Economy Commi ssi on - Bulgaria,boundary waters Yugoslavi a 1959 C I(incI. Timok)
Yugoslav-Romanian Water Control Commission - Romania,frontier waters Yugoslavia 1955 C I
CHAPTER 4
NETWORKS OF HYDROLOGICAL OBSERVING STATIONS
Explanatory notes
4.1 Existing hydrological observing stations
4.1.1 The tables in this chapter contain information on existing hydrologicalstations. Most of the information was supplied by Members of WMO; the data obtainedfrom other sources are printed in parenthesis. Blank spaces in the tables generallymean that the corresponding pieces of information were not received. In some cases,however, when it is clear from the context, blank spaces mean 110 11
•
4.1,2 The information for each WMO Region is presented in four tables:
1 - Precipitation observation networks2 - Evaporation observation networks3 - Surface water observation networks4 - Groundwater observation networks (except for Africa)
4.1.3 As regards the precipitation observation networks in Asia, South-WestPacific and Europe, data on the distribution of stations according to theirelevation are also available and are presented in six additional tables as follows:
(a)(b)(c)(d)(e)(f)
below501
1001 15012001 -
above
500 m i1000 m1500 m2000 m2500 m
2500 m
In each of these additional tables, theentries in Column 4/ headed 11% of total area ll
,
indicate what percentage of the total areagiven in Column 2 falls in the elevationrange to which the table refers.
4~lQ4 Densities of the existing networks of stations are given for precipitation,evaporation and discharge, and are illustrated on separate maps for each Region.
4.2 Recommended minimum densities
4.2.1 In order to facilitate assessment of adequacy of networks of stations, therecommended minimum densities as given in the WMO Guide to Hydrological Practices(WMO-No. 168) are reproduced below. It should be noted that it is not possible todefine a uniform criterion of network densities for all countries. The internationalcharacter of the Guide allows a limited number of large categories which, becausethey comprise a variety of cases, have been defined in a more or less vague manner.When assessina the deficiencies of networks in each respective country, the recommendations given below must be applied with great caution taking into account numerousimportant factors which aTe outlined in the Guide.
4.2.2
75
Minimum density of networks of precipitation stations
Range ofRange of provisional normsnorms for tolerated
Type of region minimum network in di Hicul t)condi tions1
(km2
)Area
(km2
)Area
per station per station
I. Flat regions of tem-perate, mediterraneanand tropical zones 600-900 900-3,000
II. Mountainous regions oftemperate, mediterranean
250_1,0004)and tropical zones 100-250
Small. mountainous islandswi th very irregular pre-cipi tations; very densehydrographic network
III. Arid clnd polar2)
1,500_10,0003)zones
l)last figure of the range shoulddifficult conditions.
2)Oreat desert. are not included.3)Depending on feasibility.4)Under very difficult conditions
be tolerated only under exceptionally
2this may be extended to 2,000 km •
At least 10 per cent of the precipitation stations in warm climates and 5 per centin cold climates should be equipped with precipitation recorders.
4.2.3 Minimum density of networks of evaporation stations
The need for evaporation data increases with the degree of aridity. Inarid regions, one evaporation stations in each 30,000 km2 is a recommended minimum.In humid temperate regions one station in 50,000 km2 and in cold regions, onestations on 1000,000 km2 is recommended for the minimum net~ork.
4.2.4
76
Minimum density of ne_tworks of~rometric stations
I-
Range ofRange of provisional normsnorms for tolerated
Type of region minimum network in difficultcondi tions 1 )
2 Area(km
2)
Area(km ) per station per station
r. Flot regions of tem-perate, mediterraneanond tropical zones 1,000-2,500 3,000-10,000
II. Mountainous regions oftemperate, mediterranean
1,000_5,0004 )and tropical zones 300-1,000
Small mountainous islandswith very irregular pre-cipi tationsr very densestream netvJork 140-300
III. Arid and polar zones2
) 5,000_20,0003 )
l)last figure of the range shoulddifficult conditions.
2)Great deserts are not included.3)Depending on feasibility.4)Under very difficult conditions
be tolerated only for exceptionally
2this may be extended to 10,000 km
4.2.5 Minimum requirements for the measurement of sediment discharge andsedimentation
It is recommended that sediment transport be measured atpercentages of the stations in the minimum hydrometric network:
- Arid regions )- Mediterranean regions)
- Humid temperate
Non-arid, heavily populated tropical regions
- Non-arid, sparsely settled tropical regions
- Tundro ond taiga
the following
30 per cent
15 per cent
15 per cent
5 per cent
10 per cent
4.2.6
77
Minimum requirements for the measurement of water guality
Records of water quality should be obtained at least at the followingpercentage of stutions of hydrometric networks:
- Arid regions 25 per cent
Humid-temperate regions and tropical forests 5 per cent
- Cold humid regions 1 per cent
These percentages will, however, be found much too low in highlyindustrialized regions.
78TABLE 4.1.1 REGION I (AFRICA), PRECIPITATION OBSERVATION NETWORKS
Sub-column a - Records durQtion less than 5 yearsSub-column b - Records duration between 5 and 10 yearsSub-column c - Records duration mOTe than 10 yearsSub-column d ~ a + b + c
(1) (2) (3) (4) (5) (6)
STATE/TERRITORY km2 Year of No. of non-recording No. of DensityArea
reporting aau and totalizer din e, km2 xeo reco 90u_103/stn .,
j;LAla\o!~ ia 2,381,74);.. 1972 75 314 296 377 9B7 43 15 26 84 2,2
~?la 1 2·;6,700 185 167 212 564 23 1 22 46 2.0er.ll' 112,622 65 (14) 1.4~- • 600 372~~la
8UX-Un(,l 27 834 1972~73~
25 47 100 11 5 3 19 0.2_;;I~t;:d Afri;on Republic 622.984 1972 73 12 76 88 3 , 1 6 6.6':':'!~::.EY ls.lr:nus 7 JOO 1972-73 528 6 0.01
(1;".," Vzy2e i~ 4 033n(~'.:J 1 284 000 197?-73 14 3 77 94 8 4 12 2.1--_._-
19 11 50 3 8 0.04_,.;.,,][":-05 2 171 1972~73 20 5Cl~C:O
,342,000
~~~~~!iOl Guinea1 001,449 1972~73 1 4J 43 , 14 ". 14.'
* 56,102.Hi0nia 1 221 900 1972 73 241 204 86 531 24 20 1 45 2.1~~,~h ~('j?t. of Reunion 2 510 1972~73 14 33 77 124 9 9 10 28 0.01~.Elch lC!T. of Afars and 1550 2?,OGO 1972 73 5 3 14 22 0 1 1 2 1.0'CDC" 267 667 61 (91 3~~~~; 11 295 16 (4) O.~_,hana 238 537 . 1972 73 29 88 342 459 17 14 36 67 0.5HJinE'C' 245 857 (43) (6) 5.0Jui(\;'J' S'::'SSGU 36 125 17 121 1.2".'::" CC:C1St . 322.463
S~;PI-:g582 646 1972~73 178 166 605 949 4 7 27 38 0.6
30 355 1976 25 5 9 39 7 7 0.8_:'.<: '.:~- ie III 369 (30) (1) 3.6._~__~',""G~' .":rcS ~_ublic 1 759 540 1972-73 4 32 III 147 1 1 11.9,,!:::::j~,'5c()r 587 041 1972~73 42 8 509 599 0 a 27
- 27 1.0
~~~r~:G118,484 1972 73 172 63 175 410 2 1 17 20 0.3
1 240 000 1972~73 15 9 148 172 5 1 6 12 6.7
* 1 030 700 33 6 26.02 045 1912 73 257 257 3 3 6 0.008
~550 300 24 1.4<'czc,:::,ic;ue 783 030 1972~73 164 77 653 894 13 7 26 46 0,8,:£--,~-ibi::1 * 824 292~;'.'r. l,?67,000 1972 73 6 26 68 100 0 11 11 IJ .4
';!.L;'2 r La 923 168 1972-73 20 600 430 1050 '0 20 30 50 0.81\',!Qr;rja 26 338 1972-73 66 33 58 157 33 9 1 43 0.1-e-n-GC'o 1 196 192 1972 73 3 35 68 106 3 0 7 10 1.7"7=" L * 71 740~~l'~ eone -~:;;'::111a * 637 657~~--,-rh f\f-rica +.* 1 221 037 1972-73 61 110 841 10)? 11 12 61 84 1.1~thern Rhodesia 390 580 1111 37 0.3Sut:l:::n 2 505 813 1972-73 125 199 847 1171 10 29 1Y 0" 2.0~<£aLil(Jnd 17 363 1451 0.4;:)]':: 56 000 1972-73 1 25 05 <;>1 '7 9 11 0.5
10"" .163 610 1972-73 92 2"4 2/4 677 100 0."lunlsia
~~da 236,036 1972 73 204 II m '575 38 0.4United Reo. of Cameroon 475 422 1972~73 0 /0 0 '"5 " 6 " ".0
Unit<=d Rep, of Tanzonia 945 087 1972 73 327 180 443 950 8 2 10 .0U.£;..:::.~ Vel to 274 200 1972-73 65 33 "7 '"5 / 3 3 10 1.'
\·!es 1:<2 r-n Sahara 266 000 1972~73 2 2 66.5
70 1re 2 345 409 1972~73 228 228 0 0 .44 44 8.6Z0"<)io 752 614 1972 73 129 150 435 714 5 W 27 61 1.0
* Information not received M( ) f "'t' ht d nJ'oy'ng priveleges as a Member of W 0** Suspended by Resolutipn 38 Cg-VII rom exerc~slng 1 s r19 5 an e ~
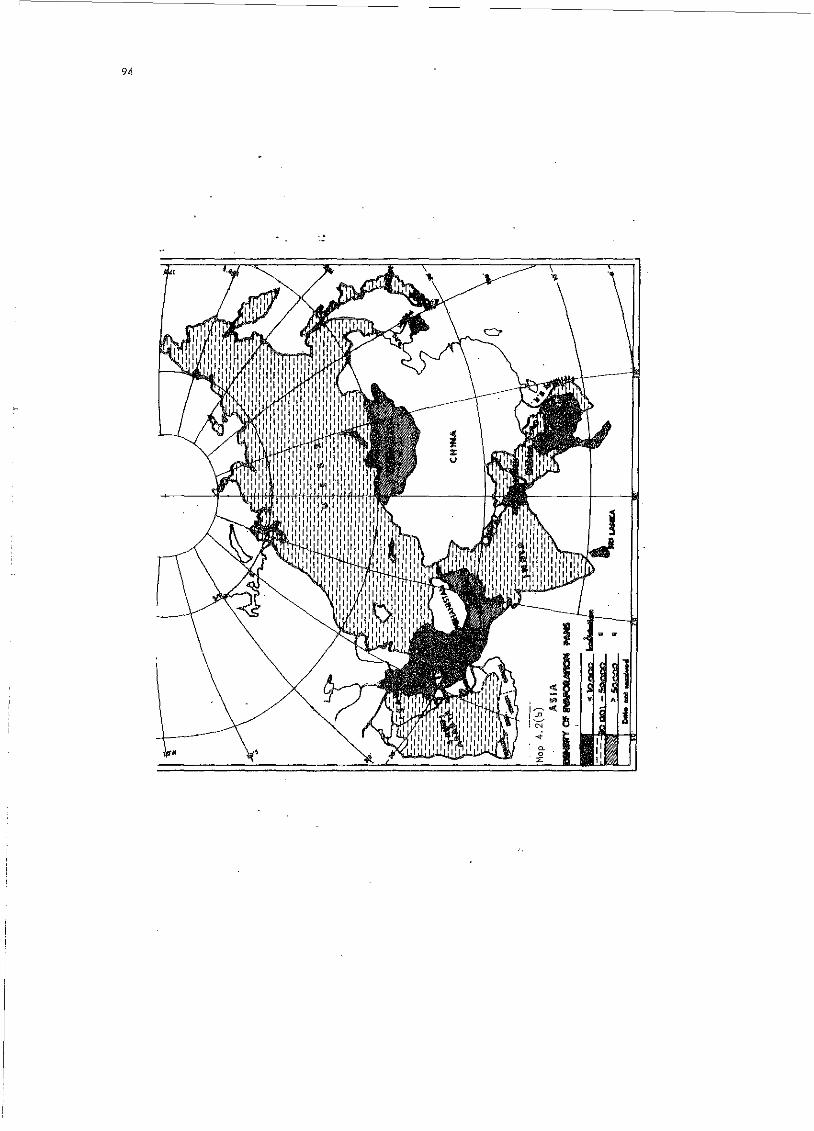
80
TABLE 4.1.2 - REGION I (AFRICA) , EVAPORATION OBSERVATION NETWORKS
Sub-col~mn a - Records duration less thun 5 yearsSub-column b - Records duration between 5 and 10 yearsSub_column c - Records duration more than 10 yearsSub-column d ~ a + b + c
(1) I (2) (3) (4) I (5) (6) (7)
km2 Year of No. of stations \~i th Den§ity:STATE/TERRITORY Area
reportin No. of US "AU panpan.;; other than ' 4)
Total km2 x03/stn
Alaeria 2 381 741 1972-75 • 22 4 3 29 29 82.0Anqola 1 246,700 iL 3u ov ".JBonin 112 622 (17, 6.6~~\"..ona • 600 372Burundi 27 834 1972-73 1 2 3 3 9.3Control African Reoublic 622 984 1972-73 1 1 2 2 1 3 5 24.4~Z!:'ary ~slonds 7 300 1972 73 4 4 1.8Cop~ Verde * " 4 033Chad 1 281~ 000 19/2-73 5 5 7 7 12 07.0~~,(1~.?s 2 III 1972-73 1 1 1 2.2Conoo .. 342 000Eavpt 1 001 449 1972 73 4 5 9 5 5 14 71.0Euuator-ial Guinea "* 56 102Ethiopia 1 221 geO 1972 73 21 5 20 0 0 I.i 01 oo.U~~h Dept. of Reunion 2 510 1972-73 3 3 V.O
F'.'I3:V::h Te~r. o-f Afors ond 1sso 22,000 1972-73 1 1 3 3 4 5.75~E.9n 267 667 \2 134.0Gmnbio 11 295
.1 11.3
hona 238,537 1972 73 13 13 3 9 2 3 Oi 4.1Q~i-ne;J * 245 857~..:):?a 8issau 36 125 (1) 36.0Tvcrv Coost • 3?2 463
~~b582 646 1972 73 7 15 54 76 76 7.7
30 355 1976 3 5 8 1 1 9 3.34l;Jeria * 111 369"ih"T!~ Arob Republic 1 759540 1972-73 4 14 18 ISH-
~~~:ocar
587 041 1972-73 8 73.7118 484 1972-73 1 5 8 14 1 3 25 29 43 2.7
l,240-,OCO 1972-73 7 7 6 6 13 95.4~~lr.it"1.ml':l
. 1 030,700'1"~'-J;:-i tilJS 2 045 1972-73 6 6 6 0.31')ro~co 446 550 28 16.0i~::::~"~"b~..?1Je 783,030 1972-73 17 5 14 36 36 21.7
~~ia • 824,2921,267 000 1972 73 5 5 5 5 10 126.7
;JLGe~i;] 923 768 1972-73 2 5 1" 2 1 1 26 35.0",o..:r.:r.aIJ 26,338 1972-73 1 1 L 2 1 3 5 5.2
~:'196 192 1972_73 (3)
-~'--"-~.::r.::r;o Leone • II 740lS-or;-.alia- * 637 657~~U"~·~ Africa H 1 221 037 1972-73 31 29 31 91 42 22 47 111 202 6.0::2_~the!.""n Rhodesia 390 580 \46 8 5
'J'J"J{\ 2 505 813 1972-73 3 8 11 22 1 1 23 108.9,;-.niland 17 363 6 2.8000 56 000 1972-73 4 1 5 3 1 4 9 6.2unisia 163 610 1972-73 8 6 1 15 2 1 3 18 9.1
's-::::ndc 236 036 1972-73 38 6.2'ni ted Reo. of Cc~eroon 475 422 1972-73 10 10 47.5n;t~d Rep, of Tanzania 945 087 1972-73 38 26 64 14.8~olta 274 200 1972 73 8 2 10 2 1 3 13 21.1"!eS';:€'rn Sor.era 266 000 1972-73 0 0Zai.re 2 34-5 409 1972-73 1 1 21 21 22 106.6
(w:bic 752 614 1972 73 27 27 .2l.L* 1nformatlon not rece~ved
** Suspended by Resolution 38 (Cg-VI1) from exercising its rights and enjoying priveleges as a Member of WMO*** Including modified type piche
82
TABLE 4.1.3(0) - REGION I (AFRICA), SURFACE WATER OBSERVATION NETWORKS - DISCHARGE
Sub-column a - Records duration less than 5 yearsSub-column b - Records duration between 5 and 10 yearsSub-column c - Records duration more than 10 yearsSub-collJmn d "" a + b + c
12
United Reo. of Cameroon 475 422U:1ited Reo, of Tanzania 945 087Upper Volta 274 200He-stern Sahara 266 000
Zaire 2 345 409Z,,~bio 752 614
1972-731972-731972-731972-731972 731972 731972-73
1972 731972-73
5 5- 23 5
6 21 29 20
12 --4 4
1 , B 55
25
9 1310 2238 26
2 9
37 42 1.397 D.tl
41 63 73 3.237 69 81 5.961 125 174 5.4
11 30 9.1o
LU LU~:r.r-121' 3.6
* Informatlon not received** Su~pended by Resolution 38 (Cg-VII) from exercising its rights and enjoying priveleges as a Member of WMO
84TABLE 4.1.3(b) - REGION I (AFRICA) , SURFACE WATER OBSERVATION NETWORKS
STAGE, SEDIMENT AND WATER QUALITY
Sub-column a - Records duration less than 5 yearsSub-column b - !(ecurds duration between 5 and 10 yearsSuh-column c - Records duration more than 10 yearsSuh-column d a + b + c
(1 ) (2) (3) (4) (5) (6)
Year of Stations measuring stage only Stations Statiol)sSTATE/TERRITORY AI'eo km2
Record~ng No. Non-recording Nomeasuring lie measun.n~
reporting sediment ater uql~t
a b c d a b c I d 0 b c d a i b c d10e1'io 2 3Bl,741 1972-75 65 20 35 120 65 20 45 J.30 65 2( 35 20 65 20 35 20
Anqola 1 246JOD 9 11 6 26 4 10 6 208enin* 112 622Botswana "J!" 600 372Burundi 27 834 1972 73 10 10 16 16Cent 1'0 1 Afr' can Republic 622 984 1972-73 1 1 3 3Canary Islands 7 300 1972-73Cape Verde * 4 033Chad 1 284 000 1972-73 5 50 55 7 7 4 4Comoros 2 III 1972 73 o river or lakesConc~o * 34? 000Eavot 1 001,449 1972-73 9 9 293 311 3 B8 18 109 6 3 15 18Enuatoxicl Guinea * 56 102Ethiopia 1 221 900 1972-73 4 2 6 13 2 15 25 1 35 16 16French Deat, of Reunion 2 510 1972-73 1French Terr. of Afars and 1S50 22 000 1972 73 1Gabon 267 667 0 1
Gambia '* 11 295Ghana 238 537 1972-73 45 5 1 51 67 45 45 157 1 56 31 2 09Guinea 245 857 0 1Guinea Bissau * 36 125Ivory Coast * 322 463I<envg 582 646 1972-73 4 7 2 13 26 33 82 141 Random silt so,!,ple ..Rondom SLlmple
Lesotho 30 355 1976 2 2 5 5Liberia • III 369Libvan Arab Reoublic 1 759 540 1972-73 a perennial surface-water flowt1adaqascar 587 041 1972 73 8 39 3 0 8 27 80 115 2Mala~li 118 484 1972-73 3 3 1 2 27 30 4 9/107Mali 1 240 000 1972 73 7 1 8 29 3 50 82 1 1f'lau.'-i tGmia 1 030 700 0 mMauri Hus 2 045 1972-73 1 1 2 2Morocco 446 550 (37) (0)Mozambique 783 030 1972 73 2 5 27 34 37 38 159 234 46 9Namibia '* 824 292Niger 1,267 000 1972 73 5Nigeria 923 768 1972-73 3 14 17 29 57 127 213 1 10 12 10 22Rwanda 26 338 1972 73 1 6 7 4 4Senegal 196 192 1972-73 9 6 15 12 22 34 2Sierra Leone * 11 740Somalia * 637 657South Africa •• 1 221,037 1972-73 2 2 5 8 10 23 19 32 40 49Southern Rhodesia 390 580 (Q USudan 2 505 813 1972 73 4 4 9 2 60 71 1 6 3S\~aziland * 17 363Toao - 56 000 1972-73 10 1 11 3 3Tunisia 163 610 1972 73 32 26 34 92 160Uaanda 236 036 1972-73 6 1 3 10 4 12 17 33United Rep. of Cameroon 475 422 1972 73 3 2
United Rep. of Tanzania 945 087 1972-73 4 5 2 16 2Y YU YOUooer Volte 274 200 1972-73 1 1 2
estern Sahara 266 000 1972-73 3/
Zaire 2 345 409 1972 73 10 49 49 (occasional) (occasional)
Zambia '* 752 614 1972-73 I
* Information not received** Suspended by Resolution 38 (Cg-VII) from exercising its rights and enjoying priveleges as a Member of WMO
TABLE 4.2.1 - REGION II (ASIA) 1 PRECIPITATION OBSERVATION ~rnTWORKS
85
Sub-column a Sub-column b Sub-column 0 Sub-column d
Records duration less than 5 yearsRecords duration between 5 and 10 yearsRecords duration more than 10 yearsa + b + c
(1 ) (2) (, ) (4 ) (, ) (6)
YeoI' of No. of non- No. of Densi ty
STATE/TERRITORY Area. k.m2
reportingrecording gauges recording km2 Xand totalizers Ilau as 103 /;tn
a b , d a b 0 d
Afghanistan • 647.497
Ban;;rladesh 14'.998 1974-70 7 287 294 , 1 4 8 0.'
Burma 694 120 1974-7, 64 162 187 1413 , 68 14 8 , .4
China* 0.'61 000
Democ ....atic Kamnuchea 181 0" 1974-7' 1'8 161 122 4<1 ° 22 22 '3 O.d
Dem.Peonlets Ren.of Korea* 220 2B4
Democratic Yemen• 287 68'
HOrJQ Konq 1 046 1974-70 13 22 B lOB 6 19 l' 40 0.01
India , 280.48' 1°74_7 ' 20' '02 IA074 4581 132 122 92 046' 0.7
Iran 1 6d8 000 1074_7' 067 10'B 470 '4Bd* 42 17 , 62 0.6
Iran 446 000 1974_7' " l' '8 84 4 1 14 19 A~8W 04'H
Jauan ,,,.,,' 1974-7' 1O 6 ,8 "8 290 080 728 0.1
Kuwait* 16 000
Lila PaonIa's Dem.Ren. 2% 000 1974_75 , 2' ," 1 lA A 10 4.7
Monllolia 1. '6466' 1974_7' 2 12 ., '0 2 4 17 2' 10.1
Neual* 140.797
Oman* 212.457
Palcistan 776 260 107A_7' 1 117 640 761 12 I 53 20 8, 0.9
Clatar * 11 000
Renublic of Kor~a ....'1!h.41L U74-7' 02 14 '81 4B7 8' 2B 140 2'1 0.1
Saudi Arabia 2 lA9 690 1974-7S 04 210 7S '42 '6 71 22 129 4.6
Soc.Rep. of Vietnam** "2. "0 107A_", 49 23 58 130 7 11 7 25 1.1
Sri Lanka 6'.610 '074_", 16 q dAd A60 12 36 20 77 0.1
Thailand '1d. 000 1974_", 194 21' 021 '''0 78 80 80 2'6 0.' -USSR h7,881 000 1974_7S 1'91 604 '084 0'0 78 '16 6'0 0" 2.9
Yemen * 191),000
* Information not recQived** Data for 173,809 km2: of the country+ Information on duration of records not received
TABLE 4. 2.1(a) - REGION II CASTA): PRECIPITATION OBSERVATION NETI10RKS
Stations ~ith elevation belay 500 m
87
Sub-oolumn aSub-column bSub-oolumn cSub-column d
Records duration leSB than 5 yearsRecords duration between 5 and 10 years
- Records duration more than 10 years=a+b+c
(1 ) 12' I~) (4) ( ,) (6 ). 2
Year of %of No. of non_recording No. of recordingArea kmSTATE/TERRITORY reporting total I~u~es and totalizers O'aUlZes
oreo Ia , Ib' 10' Id' la' Ib' 10 Id'
Af,;rhanistan* 6",497
Banuoladesh* 14,,998
Burma 694 120 1974-7' 27 '8 1'1 179 '88 , 62 12 79
China* 19,'61 000
Demooratic Kamlluchaa 181 03' 1974-75 154 1,6 118 428 9 20 20 49
Dem. Peonle 1 s Ran. of Kare 2?0 284
Democratic Yemen* 287 683
l?ng Kong 1 046 1974-70 97,' 12 22 71 la' 6 18 14 ,8
India 1,.280,48~ 1974-7' 65 6' ~116 '244 78 75 '2 20'
Iran 1 648 000 107 '_75 168 184 1" '0' l' " 2 22
Iran ..6 000 197A_7' 20 l' 28 71 , 1 11 16
7~~t '1186 +Janan 372 313 1974_7' 71.' 9 2 53 2'9 180 8'1 1200
uwait* 16 000
Lao Peoula I B Dem.Ren. 2>6 000 1974-7' ", 2' ,
" 1 14 4 19
allRolia 1.,64 66~ 1974-7' a
enal * 1'0. 797
• 212.A07man
akistan 776~qO _ 1974-7' 6' d88 '" 6 24 11 41
atar• 11 000
Reuublic of Korea 98.477 1974-7' 91 14 '81 486 82 28 140 2'0
Saudi Arabia 2 140.690 107'_", 24 78 l' 117 U 18 , '4
Soc. Ren, of Vietnam* "2. "9 1974_7' "' 10 " 107 7 8 , 20
ri Lanka 6_ 610 1974_7' 16 9 '22 '47 11 '1 2' 6'
Thailand '14 000 1974-7' 194 210 921 U2' 78 89 89 206
SSR 17, BBl 000 107'_7' 72 181 262 2771 ~214 '4 209 466 729
Yemen* lq<;,OOO
* Information not reClilived** Data for 173,809 km2 of the country+ Information on duration of records not received
88
TABLE 4..2 ,leb) REGION II CASTA) : PRECIPITATION OBSERVATION NE'I'J,.lORKS
Stat~on8 with elevation between 501 and 1000 ill
Sub-column aSub-column bSub-column cSub-oolumn d
- Records duration less than 5 years- Records duration between 5 and 10 years- Records duration more than 10 years
a + b + c
(, \ (2) (, ) (4) (5 ) (6)No. of non-recording No. of reoording
STATE/TERRITORY Area kIT? Year of % or gauges and totalizers gaugesreporting total
~rea I a) Ib\ Ie) (d) la) Ib) fe) Id)
r"'hanistan * 6d7 d07
fRanlZ'ladesh* 140.008
lEu""" 604,120 1074-75 7 6 2 , 11 2 2 ,bhina* o ~ _61. 000
emocratlc Kamnuchea 181 0" 10,"-7_ d - ," 2 2 ,
em.Peonle's Ren.of Ko,.ea* 220 28'
emooratic Yemen* 287.68'
Ron... Kon&<' 1 0'6 1074-75 2.5 1 2 3 1 1 2
India '~280~'8' 107'_7_ 7 0 -00 606 '2 12 7 "r·an 1 648 000 1074-7' 112 110 67 2q8 6 1 7
Iraa 446 000 1074-75 2 7 0 2 250·
'~6ranan 372.'" 1074-7' 20.4 1 , , 7 66 62 181
uwait* 16 000
ao Peonle I 8 Dem. Ren. 2% 000 107'_7'
onlZolia 1. '6', 66' lQ74-7' ," 17 2 , 7
lNensl* lAO.707
bman* 212.457
akistan 776 260 1074-7 _ 22 6- 87 ", I.
atar* 11 000
Renubl i c of Korea 98.477 197A-7' 1 1 1 1
Saudi 1\rabia 2 149.690 197A-7' 20 72 '0 122 10 22 6 '8
Soc. Ren. of Vietnam** 332.559 1974-75 4 3 9 16 3 2 ,Sri Lanka 6' 610 107A-7' '7 '"
, 2 ,hailand 51',000 197A_7' , , 1 1
SSR 17.8810ao 197A_7' 16.7 52 88 : "0 680 n '6 119 188
emen* 191), 000
* Information not received
** Data for 173,809 km2 of the country+ Information on duration of records not received
TABLE4.2.1(c) -REGION IT (ASIA): PRECTPI'l'ATTON OBSERVATION NETWORKS
stations with elevation between 1001 and 1500 m
Sub-column a - Records duration less than 5 yearsSub-column b - Records duration between 5 and 10 yearsSub-column c - Records duration more than 10 yearsSub-oolumn d ;:; a + b + c
89
11\ 12\ I,\ 14) (5 ) ( 6)
Area km2 Year of 'fo of No. of non-recording No. of recording
STATE/TERRITORY total vau 8S and totalizers -"'au 8Sreporting area (a) (b) (c) (d) (a) (b) (0\ (d)
AfD'hanlstan * 6A7. d07
Ban.Q'ladesh* lA'.008
Burma: 694 120 1974_7' 26 , , 7 1 1
China* 9.561 000
Demooratic Karnnuchea 181 0'5 1974-75 0,Dam.Pea Ie's Re • of Korea* 220 28A
Democratio Yemen* 287 68'
rJ!Qug ICor'g' 1 046 1974_7' 0
India 3 280 483 1974-75 2 4 120 129 1 7 4 '2
r""an 1 648 000 1974-75 2.2 271 140 6'3 0 6 1 16
IraQ 446,000 197<_70 1 , 4 1 ,!''[2~'' , 197<_70 0.0
13+ 78+Janan 2 1
-,16 27 '2 70
Kuwait* 16 000
Lao Peoula r s Dem Rell. 2% 000 1974-75
Mon/2,'olia 1.o6A 66' 1'07 _75 , 20 25
Nenal* lAO. 707
Oman* 212.l1li7
Pakistan 776 260 1074_75 21 40 61 1 8 0 l'
I Qatar* 11 000
Renublic of Korea 98.477 1974-75 0
Saudi Arabia 2 149 690 197<-75 5 26 .10 41 7 9 1 17
Soc. RaTl. of Vietnam** "2.059 l"H_75 2 1 A 7
Sri Lanka 65 610 1974-7' 57 '7 1 2 , 6
Thailand 514 000 1974-75 0
USSR 17 881 000 1974-75 7.0 '6 56 18' 275 6 2' '2 61
Yemen ol(- lQ<iQOO
* In£ormation not received
** Data for 173,809 km2 of the country+ Information on duration of records not received
90
TABLE 4.2 .le d) - REGION TI CASTA2.: PRECIPITAfi1ION OBSERVA.TTON NETI-TORKS
Stations with elevation between 1501 and 2000 m
Sub-column a Sub-column b Sub-column c Sub-column d
Records duration less than 5 yearsRecords duration between 5 and 10 yearsRecords duration more than 10 yearsa + b + 0
(1 ) (2) ( ,) ( 4) (, ) (6 \
% ofNo. of non-recording No. of recordine
Area km2 Year at" «au~es and tota izera au"'es
STATE/TERRITORY reportingtotal
(a) (b) (e) (d) (a) (b) (e) (d)0'"0
Afl'rhanistan* 6d7 d07
Banu-ladesh* "'.ooaBl17'ma 694.120 1074,70 "
, ,C' . a* 0,061 000
K 181 0" 'Q7',", 0
he .• e' Ron Qf K,,"'ea* 220 28d
DemnnrRtip. YflIDp.n* 287.68'
HOlll:l: KonlJ:' 1 046 197d-70 a
I dia '·280 '8' 107,,", 1 , Q7 107 0 1 6
Iran 1 6"8 000 10"_70 1'07 22' 87 617 7 0 12
Irao 446 000 197d_7O a
'72.'" 1974-7, 1.7 ," "
30+Jauen 1 1 1 11 40
K wait* 16 000
I Lao Peonla I s Dem. Ren. 2'6 000 lQ7'_7O
1Mnnllol 'fa 1.064 66' lOU_7O 2 1 10 13 1 1 10 12
INeDal * 140.797!
212.407I Oman"*
Pakistan 776 260 lQ74_70 1 ,'8 44 1 , 1 7
: Oatar* 11 000
Renub'ic of Korea 98.477 1974_70 a
Saudi Arabia 2 149 690 1974-7, , 13 17 " 4 13 9 26
Soc. Ren. of Vietnam** 332,"9 1974-7' 0
Sri Lanka 60.610 1074_70 21 21
Thailand 014.000 1974_70 0
USSR 17.881000 1974_7, 2.0 38 32 114 184 4 10 0 "Yemen* 19'.000
* Information not received
** Data for 173,809 km2 of the country+ Information on duration of reoords not received
TABLE 4.2.1(e)-REGION II (ASIA): PRECIPITATION OBSERVATION NETWORKS
Stations with elevation between 2001 and 2500 ill
91
Sub-column aSub-column bSub-column cSub-column d
- Records duration less than 5 years- Records duration between 5 and 10 :rears- Records duration more than 10 years
a + b + c
(1) (2) (3 ) ( 4) ( 5) (6 )
%ofNo. of non-recording No. of recording
Area km2 year of pau as and totalizers pan asSTATE/TERRITORY reporting total
( a) (b) (e) (d) (a) I (b) I (c) (d)area
Afghanistan* 6d7. A07
Band1 adesh* 1O'.ooB
Burma 60A.120 197'-70 n
China* 9.061 000
Demooratic Kamnuchea IBl A'" 10"_7, 0
Dem. Peonle's Ren, of Korea 220 28d
Democratic Yemen* 287.68'
Hon>:!' Kon". 1 OA6 197'-70I
0
Tndia '.280.dB' 197d-7, 1 1 36 '8 - , d 9
Iran 1 648 000 1974-7, 169 109 " "3 4 - - 4
"6 197 4-7 'I
IraQ 000 a !
Janan "2·'1' 197'-70 0.5 6 , 1 10
Kuwait* 16 000
Lao Peonle's Dem.Ren. 236 000 1974-7,
Moh/il:olia. '.'6A.66' 107'_70 2 2 A 1 1 2 A
Nepal * 100.797
Oman * 212.407
Pakistan 776 260 1974-7, , 10 13 2 2 <\
G.ata:r* 11 000
Renublic of' Korea 08.A77 1974-7' 0
Saudi Arabia 2 149.690 19U-70 2 2' 3 28 2 7 , 12
Soc. Re'D, of Vi etnam*{{. ;;2. "0 1974-7, 0
Sri Lanka 6,.610 1974-7, 7 7 1 1
Thailand 'lA.OOO 1974-7< 0
USSR 17.881 aoo 10U_7< 0.0 " 67 112 210 1 " 11 ,6-Yemen * 19'i.OOO
* Information not received
** Data for 173,809 km2 of the country
92
TABLE 4.2.1(f)-REGION TI (ASIA) : PRECIPITATTON OBSERVATION NETWORKS
Stations with elevation above 2500 m
Sub-column a - Records du:ration less than 5 yearsSub-colU!lln b - Records duration between 5 and 10 yearsSub-oolumn 0 - Records dUration more than 10 yearsSUb-oolumn d ~ a + b + 0
(1 ) (2 ) (3) (4) (5 ) (6)
%ofNo. of non recording N~ of recording
Area km2 Year of gau""ss and totalize:rs gauges
STATE/TE1h~ITORYreportinp; total
( a) (b) (0 ) (d) (a) (b) (0) (darea
Afllhanistan* 647.497
BanD'1 adesh* 1" .008
BuJ;'IIl'" 60d.120 10"_" 12
OhinR* 9 ,61 000
n. atic Kamnuchea 181 0" 1974-7, ·0
Dem "Peo 18_ 1 s Rei) of Korea* 220 284
Demonratic Yemen* 287.68'
Hong KonB:' 1 046 1974-7, 0
India , 2BO.483 107'_7' 1 2 39 42
Iran 1 648 000 19"-7' 69 " 7 108 1 1
Iraa 446 000 19"-70 0
Jan~n '72.313 1974-70 0.1 4 4
Kuwait* 16 000
Lao PeonIe's Dem.Ren , 2'6 000 19"_7'
Monolrolia 1. '6" 66' 1974-70
Nenal* 140.797
Oman* 212.457
Pakistan 776 260 19"_70 1 2 , 1 1
Q.ata:r* 11 000
Reuublic of Korea 98 477 1974-70 ·0
Saudi Arabia 2 149,690 1974-70 1 1 2 2
Soc. Re n , of Vletnam** "2. "q 1974-75 a
Sri Lanka 6'.610 1Q74-7'
Thailand '14. 000 1974_7' 0
USSR 11.881 000 1974-70 1.4 '2 149 206 408 , 2 7
Yemen* 19'j,OOO
* Information not received
** Data for 173,809 km2 of the country
TABLE.4.2.Z - REGION II (ASIA): EVAPORATION OBSERVA~TON ~rnTWORKS
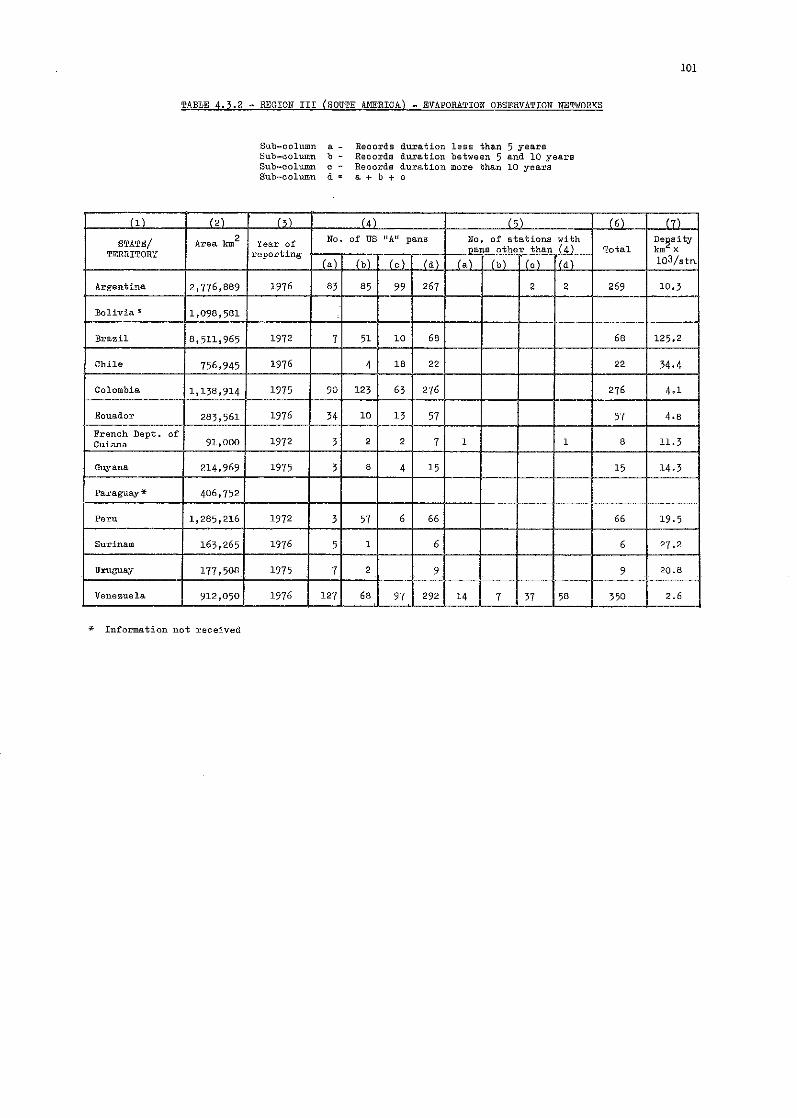
93
Sub-colwnn a Sub-oolumn b Sub-column 0 _Sub-column d
Records duration les8 -that'. 5 yearsRecords duration between 5 and 10 yearsRecords duration more than 10 yearsa + b + c
(1) (al ~ 8
No. of US "A" No. of~ro. of Density
Area km2 stations withSTATE/TERRITORY Year of pan stations GGI-3000
pans other ('))TOTAL km2 x
reportingjpan stations than (.1.' and 103/s tn.
a b 0 d a b 0 d a b 0 d
Afgohanistan* 647.497
Ban,IGladesh 1"· 9q8 197A_7, 4 ,8 42 42 '.4
Burma 694 120 1974-7, 6 9 12 2 27 25.7
China* 9.561 000
memooratic Kamuuchea 181 0" 1974-70 2' 18 18 61 61 '.0
mem.PaonIa's Ran.of Korea 220 284
Democrat· Q Y", * 707 <0'
Y. 1 ",< 10'11_'7<; , 2 0.5
India , 280 '8' 1"'-"' 149 % 72 157 1 1 1 1 159 20.6
Iran 1 648 000 1974-75 '46 2' ,0 295 299 5.5
Iraa 446 000 1974-75 6 11 17 17 26,2
'72. '" 1974-75++ +++
oo.BJapan '11 11
Kuwai t * 16 000
Lao Peonle I s Dem.Ren. 2% 000 1974-70 4 1 2 4 7 11 21.5
Mongolia 1.,6466' 1974_75 I, 4 , 10 10 156.5
Nenal-l!- 140.797
Oman* 212.11."7
Pakistan+ 776 260 1974-7' 1 , 4 4 lQa. 1
atar 11 000
Reuublic of Korea 9BA77 1974_7' 51 4 ,c I" B 6 100 '" " <Saudi Arabia 2 149,690 ,q74_7' 10 0 , A, 6 6 '0 ".0Soo.Ren. of Vietnam* 002.05' 1974-75 , 12 1 17 10.2
Sri Lanka 65,610 1974-75 , 6 10 1 1 1 18 ,.6
Thailand '14.DOO 1974-75 li5 09 I 'B 62 1 1 26, 2.0
S:;J:R 17.881 000 1974-75 07 BO IBI 28B 57 "9I" 157i+445 An.?
• I'll),OOOemen
* Information not received** Data for 173/809 km2 af the country+ Information is not available on stations maintained by provincial agencies++ Including 20 m2 tank and evaporation from soil and snow+++ Information on duration of records not received
TABLE 4.2 •.3(a) - REGION II (ASIA) : SURFACE ~TATER OBSERVATION NETiofORKS _ DTSCHARGE
95
Sub-column aSub-oolumn bSub-column cSub-column d
- Records duration less than 5 years- Records duxa tion be tween 5 and 10 years- Records duration more than 10 years
a + b + c
1 2 {31
Sta~e-Discharge StQtions Densi ty
STATE/TERRITORY Area km2 Year of Recordin No. Non- acor in~ Nn Totalkm2 x
renortina:lal bl I0\ • (d \ ' la\ Ib \ I c I Id 103/stn.
Afli:hanistan* 647.497
Bangoladesh 1'3.008 10"_7< 49 69 118 118 1.2
Burma 604 120 1074_7< 3 11 14 46 9 <, 60 '0 n
China* 0.<61 000
Democratic Kamnuchea• 181 A'"Dem.PeDula's Rep.of Kore 220 28A ,Democratic Yemen * 287,683
Honr, Kono!<' 1 046 10"_7< 1 1 2 2 0.5
India 1',280,48' 10"_7< 574 182 73 829 820 4.0
Iran 1 648 000 1074-7< 82 7, '0 207 290 203 '19 621 828 2.0
Iraa 446 000 1974-7< 9 9 20 16 8 120 129 '.4Janan 372.313 1974-70 173 109 1.,6 1768 135 117 248 '00 1268 0.3
Kuwait-ll- 16 000
Lao PaonIa's Dem. Ren. "6 000 1074_7< " ", " " 40 <.9
101onO''olia 1. ,64. 663 I 1074_" ? 2 20 8 12 40 42 37.3
Neual* 140.797
Oman* 212. AS7,
Pa..lcistan "*" 776 260
Q.atar * 11 000
Renublic of Korea 98.477 1974""'20 22 42 10 11 - 21 63 1.6
Saudi A.rabi a 2 lA9.690 1974-75 10 " 1 34 4 2 1 .7 AI <2.4
Soc.Ren. of Vietnam •• "2. "9 19'4-70 27 10 1 " " U--
Sri Lanka 6<.610 1074_7< , , % 27 71 1'4 >'7 0.,
Thailand ". 000 1974-70 90 n 14 177 122 116 65 '0 , 480 1.1
USSR 17,881 aaa 1974-70 ,"0 214 600 1964 100 100 1079 B29 2293 7.8
Yemen* 19').QOO
* Information not received** Data for 173,tl09 km2 of the country
TABLE 4.2.3(b) - REGION II (ASIA) = SURFACE WATER OBSERVATION NE~WORKSS~AGE, SEDII4ENT AND WATER QUALITY
97
Sub-column a Sub-column b Sub-column c Sub-column d
Records duration less than 5 yearsRecorda duration between 5 and 10 yearsRecords duration more than 10 yearsa + b + 0
1 2 6
Stations measuringStations Stations
. stan'!'! .onlv . measuringSTATE/TERRITORY Area km2 Year of Recording Non- Measuring waterrenorting No. ecordinlZ No. sediment auall t,
a b 0 a • (b " a) (. (b (0 ) (a) (.) (b' I (c , (a)
Af,qhanistan* 647 497
Banaladesh 140.998 1974-7' .2 21 2' " '47 279 , 20 2' 11 11
Burma 604 120 197,_7, 6 10 42 91 9~48 5 5+
China'*" 0,,61 000
Democr.<lti" K * 181.0"
n. 0, ~" I D, r Kare 220 28A.
Democratic Yemen 287,68'
lIQnp; Konp. 1 046 1974-75 2 11 6 21 10 10+ 20 1 21
India '.280 48' 197,_7, 62 16 48574
Iran 1 6liB 000 1074_7< ", 100 522 1'2 17 601
Irao «6 000 1074_7' 9 9 20 16 8 20 ", 40 72 72
Janan '72.'11 1974-7' 18 l4, "7 66'91 ldl 68 00 2 10 '" 4lJ 19' 17' 779
Kmfai t* 16 000
Irao Peonle's Dem. Ren, 2'6 000 107,_7, 1 101 ~O 5 5+
Mon.<>"olia 1 ,6' 66' 1074_7, 1 , 26 20 ?, 21 66
Nena1* 140.797
Oman *" 212.1\.')7
Pakistan* 776 260
Qatar 11 000
Renublic of' Koraa 98 A77 107'_7, 7 2. '" 8 1 1 141 71 1'1 " 86 , S9
Saudi Arabia 2 149.690 1974-70 1 1 3 1 1
Soo.Ren. of Vietnam** "2.,,9 1974-7S S 8 2 40 6 2 I 91 2 2 4 "Sri Lanka 6, 610 107A_7, , 1 1 " 17' g 9
Thailand 514,000 1974-75 1 lE 1 46 6 6 7 213 86 57 28 16" 124 40 14-7 311,++USSR 7,881,000 1974-75 2 4 79 3 7 4'" 570 lOC 95 368 1""3+ 214 3381"55 1207
48 15 , 68*
Yeman "* 1" 000
* Information not reoeived
~* Data for 173,809 km2 only+ Suspended load++ Bed load
96
TABLE 4.2.4 - REGION IT (ASIA) GROUND\1.ILTER OB.8ERVATTON llE'l'lilORKS
Sub-column a - No. of boreholesSub-column b - No. of wells
(1) (2) I (,) I ( A) (,) (6 ) (7) (8 )
Area km2 Year of l Water Piezometric Water Chemical OtherSTATE/TERRITORY reuortinp, level nressure temneratu'r'e om-posi tion
(a) (b) (a) (b) (a) (b) (.J (b) I (a) I(b)
fghanistan* 647 .407
Ban!2'ladesh 143·00a 107A-7' 480 101
urma 60A 120 197A-7' No " roundwater observati n networks exist
hina* 9.061 000
emocratic KaIll:Duohea* lal 03,
em.Peonle 1 s Ran.of Korea 220 28A
emocratic Yemen* 287.6a3
onll: Kong 1 OA6 197A-7, 19
Ind1a* 3.280.483
Iran 1 6.d8 000 107A_7' 81' AI" 6" 2702
xan* AA6 000
aDan 372 313 1974-7' 'II '" 0 18 '" " '" AI 13 8
uwait* 16 000
ao Peonie' s Dam.Ren , 236 000 107A_7' 1207 11<;0
Monuolia* 1.'64.663
enal* "0.797
man* 212.457
akistan* 776 260 .. -.atar* 11 000
Renublic of Kaxea 98.477 1974-75 23 7
Saudi Arabia 2 149.690 1974-7, 229 301 24 143 195 "9 139 163
Soc.Ren. of VietuaIll** "2.559 1974-75 200 200 200
Sri Lanka 6' 610 107A_7' 100 7A
Thailand 'H. 000 107.<-7' 16" AD 3 "0' I AOOO
USSR 17.881000 197A_7' '19 Ad A82 A3 8
Yemen* 19'1, 000
* Information not received
** Data for 113,809 km2
of the country
TABLE 4.3.1 - REGION III (SOUTH AMERICA) - PRECIPITATION OBSERVATION NETWORKS
99
Sub-column aSub-column bSub-oolumn cSub-column d
- Records duration le88 than 5 years- Reoords duration between 5 and 10 yeaxs- Reoords duration more than 10 years;:;; a+b+o
(1) (2) (,) ( 4) (0 ) (6 )
STATE/ Area km2 Year of No. of non-reoording Ho. of reoording ]Je~8ity
TERRITORY reporting uau ee and totalhexs aUUBS kID xa b a d e b c d 103/~tn
Argentina 2,776,889 1916 100 200 2344 2644 5 0 no H5 1.0
Bolivia* 1,098,581
Bra.zil 8,511,965 1912 532 1321 2175 4028 53 126 86 265 2.0
Chile 756,945 1916 58 124 451 639 4 6 5 15 1.2
Colombia 1,138,914 1915 332 316 330 979 139 229 48 416 0.8
Eouador 283,561 1916 55 76 49 180 21 16 26 63 1.2
French Dept. 0<Guiana 91,000 1912 15 2 26 43 17 2 5 24 1.3
Guyana. 214,969 1915 26 41 174 241 4 24 9 37 0.8
Paraguay* 406,152
Peru , 285,216 1912 28 687 15 730 10 82 6 98 1.6
Surinam 163,265 1916 51 40 100 191 19 9 - 28 0.7
Uruguay 177,508 1915 40 100 140 3 5 2 10 0.2
Venezuela 912,050 1916 48 45 93 439 302 511 1258 0.1
* Information not received
TABLE 4.3.2 - REGION III (SOUTH AMERTCA) _ EVAPORATION OBSERVA'I'ION NETI·rORKS
101
Sub-oolumn aSub-oolumn bSub~column cSub-column d"
Records duration less than 5 yearsRecords duration between 5 and 10 yearsReoords duration more than 10 yearaa + b + c
(1) (2) (,) (4 ) (, ) (6) (7)
STATE! Area km2Year of No. of US IIA" pans No. of stations '1i~h De~sity
TERRITORY reporting pans other than 4 Total kID x
(a) (b) (c) (d) (a) (b) (0 ) r(d) lO3/s tn..
Argentina 2,776,889 1976 83 85 99 267 2 2 269 10.3
Bolivia * 1,098,581
Brazil 8,511,965 1972 7 51 10 6B 6B 125.2
Chile 156,945 1976 4 18 22 22 34.4
Colombia 1,138,914 1975 90 123 63 276 276 4.1
Eouador 283,561 1976 34 10 1) 57 57 4.B
French Dept. ofGuiana 91,000 1972 ) 2 2 7 1 1 8 11.3
Guyana 214.969 1975 3 B 4 15 15 14.3
Paraguay* 406,752
Peru 1,285,216 1972 3 57 6 66 66 19.5
Surinam 163,265 1976 5 1 6 6 27.2
Uruguay 177,508 1975 7 2 9 9 20.8
Venezuela 912,050 1976 127 6B 97 292 14 7 • 37 5B 350 2.6,
* Information not received
102
•---------- ---------....:-_-~-----
...
- ---:-------:....--------- - ----------------------------
,.
".
,•. ". ...
SOUTH AMERICA,Map 4.3(b)
DENSITY OF EVAPORATION PANS
TABLE 4.3.3 fa) - REGION III (SOUTH AMERICA) - SURFACE WATER OBSERVATION NETWO~~S - DISCHARGE
103
Sub~column a Sub-column b Sub-column c _Sub-oolumn Ii
Reoords duration leS8 than 5 yearsReoords duration between 5 and 10 yearsReoorda duration more than 10 yearsa + b + 0
(11 (2' (,1 (, , (,1 (61
STATE/ Area km2 Stage-Discharge StationsDaRsi tyYear of TotalTERRITORY reporting Reoording No. Non-reoording No. km x
• b c a b c d 103/s tn.
Argentina 2,176,889 1916 22 13 13 48 101 14 132 247 295 9.4
Bolivia* 1,098,581
Brazil 8,511,965 1972 285 309 878 1472 1472 5.8·
Chile 756.945 1976 104 119 223 3.4
Colombia 1,138,914 1975 136 28 65 229 129 20 33 182 411 2.8
Ecuador 283.561 1976 45 13 31 89 14 6 9 29 118 2.3
French Dept.of91,000 1975 2 3 18 23 7 7 30Guialla 3
Guyana 214,969 1975 11 10 13 34 3 2 5 39 5.5
Paragua.y* 406,752
Peru 1,285,216 1972 20 75 9 104 124 124 228 5.6
Surinam 163,265 1976 2 11 20 33 33 4.9
Uru·guay 111,508 1975 3 1 4 8 4 2 B 14 22 8.5
Venezuela -912,-050 1976 50 130 84 264 100 60 ].60 424 2_~2
* Information not received
'l'AIlLE 4.3.3 (b) - REGION III (SOUTH AMERICA) - SURFACE WATER OBSERVATIONNETi'IORKS - STAGE , SEDIMENT AND \ofATER QUALITY
105
Sub-column a Sub-column b Sub-column 0 Sub-column d
Records duration le8S than 5 yearsRecords duration between 5 and 10 yearsRecords duration more than 10 yearsa + b + 0
II) (2) I' ) (4) I,) (6)Stations
Area km2Stations meas-uring shage only Stations measuring
STATE/ Year of Recording No. Non-Recording No. meaSuring waterTERRITORY reporting sediment ouali~,.
.) b) 10 lid) la) lib) I(c) Id) (a Ib) (c' ·1 d , la' 'Ib' c l<!.l
Argentina 2,116,889 1976 28 50 7 85 237 70 205 512 23 12 46 81 61 5 0 661
Bolivia * 1,098,581
Brazil 8,511,965 1972 52 72 100 224 335 470 755 560 4 19 32 55
Ohile 756,945 96 361 457 35 233 268.-
Colombia 1,138,~~ 2 2 4 14 9 18 41 81 81 15 15f-.
Ecuador 283,561 1976 54 25 23 102 82 63 41 186 20 9 3 32 4 8 12-
French Dept. of91,000 1975 3 3 2 2
Guiana
Guyana 214,969 1975 7 3 2 12 1 1 39 39
Paraguay * 406,752
Peru 1,285,216 1972 4 4 8
Surinam 163,265 1976 15 22 31 68 4 4 4 4 8 4 4 1 9
Uruguay 177.508 1975 3 6 9 7 8 41 56
Vene~;le1a 912,050 1976 16 4 1 21 28 14 42 150 130 144 424 302 50 352-
* Information not received
106
TABLE d.3.4 _ REGION III (SOUTH AMEliTC!) - GROUNDWATER O~SERVATION NETWORKS
Sub_Column a _ Number of boreholesSub_Column b - Number of wella
(1) (2) I,) IAl (5) (6) (7) (8 \
STATE! Area km2
Year of \ofater Piezometrio Water Chemioal OthersTERRITORY reporting level nreBl'Iure amne .!?ture Comnosition
(a) Ih' lal 11,) lal Ib) la l (b) (a) Ib)
Argentina 2,776._889 1976 - 30000 - 2522 - 653 - 653 - -Bolivia * 1,098,581
Brazil * 8,511.965
Chile* 156,945-
Colombia* 1,138,914
Eouador 283,561 1976 150 Random
F:renoh Dept. 091,000 1972 No groundwater observation networksGu1 na- .
Guyana 214.969 1975 17 11 7 Random Random Random
Paraguay * 406,152
Peru 1,285,216 1972 320
Surinam * 163, 265
Uruguay 177,508 1975 345 345 345 345
Venezuela 912,050 1972
* Information not received
TABLE 4.4.1 - REGION IV (NORTH AND CENTRAL AMERICA) - PRECIPITATION OBSERVATION NETWORKS
Sub-column a - records duration less that 5 yearsSub-column b - records duration between 5 and 10 yearsSub-column c - Records duration more than 10 yearsSub-column d = a + b + c
( 1) (2) (3 ) (4) ( 5) (6)
Area km2 Year of No. of non-recording No. of reo ord ing Denaity
STATE/TERRITORY reoording augaa and tota izers EaUgeS km2 x(a) (b) (0) (d) (a) ! (b) (0) ! (d) 103/otn .
Bahamas 10. ,00 1970 '4 77 24 10, 1 1 2 98.,
Barbados "0 1976 9 1 62 72 d , 7 "d
British Car. Ter.*
Canada .976 18, 1"76 ' 72' '2' 1'1' 276' 176 19' '''' 1'2Q '0'2
Colombia '* NfA
Costa. Hi as. ,0.900 197, 10' 68 2dO "" d9 2' 6d 1% 88
Cuba)!- 11'-'2A
Dominioan ReTl. d8."'2 197' , 61 66 129 3 20 9 '2 '01
__El Salvador 20 000 1976 '" 70 no 2'" 1) 27 28 6a 62French Depts. of 1,090 '7 '5 30 62 6 6 3 15 14Martinique and 1,700 1973Guadeloupe 24 20 49 93 7 3 12 22 15
Guatemala. l~l 800 197' ,a '" 10' 20d 00 42 , 100 4li,_._
Haiti* 27.7'0 .--.J!2!!.2,uras* 112 088
Jamaioa 11,400 1976 6' 8, 392 '''0 9 12 6 27 20
~!OD 1·972·547 107' ,7, 462 1132 2169 80 88 116 28A aDd
Neth. Antilles 006 1076 , 21 % 62 , 1 4 1,-Ni car9.=a. BO 000 ill' 1'8 '" 127 "0. " 2 " ,0 3"
Panama 77·0a2 1976 101 19 76 196 49 11 42 102 2,8St. Pierre and
242Mi uelon*
Trinidad and Toba~o 1l.1?1 1976 '3 " 160 2'6 20 16 '7 82 16
United States - 19,305 610 1976 202 017 ·7808 8;>37 "2 2'6 2212122~j ...JE._
* Information not received
107
108
INSET
INSET 2
Map 4.4(0)
NORTH AND CENTRAL
AJ!;tH:RICA
DENSITY Of PREC!1ITATlQN STATIONS
'.
120·
TABLE 4.4.2 - REGION IV (NORTH AND CENTRAL AMERICA) ~ EVAPORATION OBSERVATION NETWORKS
109
Sub-oolumn a Sub-column bSub-oolumn cSub-oolumn d
Records duration leBs than 5 yearsReoords duration between 5 and 10 yearsRecords duration more than 10 yearsa + b + c
(1 , (2' (,' (A' (,' (6 , 17)
STATE/TERRI'roRY Area km2 Year of No. of US "A" No. of stations (i~h Total Density.,
an stations pane other than ",,2 xrecording
la Ib (c) Id) la) Ib) 10' rId) 103/stn.
" •.h.m•• n.'oo '0" a 1 , , 2.7
.. _",_. ,," '076 , , , 0.14
, .• ,,""e. m *0., •• , o 0""8' 1076 '2 60 " "7 1'7 67,0
{trl mld, *
00'" .'OR '0.000 '0" 22 2 2 26 26 2.0
Ouba!' IlA <;2A
Dominican Ran. 48 "2 107' 2 18 , 26 0 2' , '0 ,6 0.9
E' S 1 ad 20 oao 1076 11 8 1 20 20 1.0French Depta. of 1,090 2 1 3l1artinique and 1,700 1973 2 1 3
6 0.5'uadf!lounp.
Guatemala l~l 800 10" 10 1 l' 27 10 1 '8 '1 2.6
Haiti * 27.7'0
Hondurae* 112 088 --Jamaioa 11· aOO 1076 , 10 6 19 , , 22 0.5
Mexico 1.972 547 1973 660 1%1 536 1557 1557 I 1.3.__
~"Antillee 996 1916 1 1 1 1.-0
Nicara&ma l~O 000 197> 57 2 4 6' 57 - - 57 120 1.1
Panama 77082 1076 24 8 '2 >2 2.4
St. Pierre a.nd 242Miaue10n * -Trinidad and 5121 1976 4 3 7 7 0.7Tobago
Uni ted States9. '" 610 1976 25 118 '57 ,00 '00 18.7
* Information not received
no
'",.
'. INSla
~~=~"",,~-----1--.'
Map 4.4(b)
NORTH AND CENTRAL
AMERICA
DENSITY Of EVAPOIATJON PANS
>
.INSET 2
00'
III
TABLE 1I.,4.3 (a) ~ REGION TV (NORTH AND CENTRAL AI1ERTCJ\.) _ SURFACE \{ATER OBSERV4.TIONS NETI'IURKS - DISCHARGE
Sub-column a - Reoords duration leas than 5 yearsSub-column b - Records duration between 5 and 10 yearsSub-oolumn c - Records duration more than 10 yearsSub-column d = a + b + c
(1) (2 ) (3) (4 ) i;, ..16\
Area km2
Year of Sta"'e - Disc ar0'8 Stations De~~lity
STATE/TERRITORY :repo ....tingReQording No. Non-recording No, Total km x
1031~
Bahamas ". '00 IQ7' 0
Barbados ",0 lQ76 No uermanent rivers hence no network 0
British Car. Ter.·~
Canada .Q76 18' 1076 '18 '1' '78 IAll 100 1" '" '87 1 008 ',0
Colombia* -
Costa Rica '0.900 107' 21 26 " 72 2 , , 77 0,7
Cuba* 114. ,,.
Dominican Ren. 48.442 197' - - - '2 - - - 42 74 o "
El Salvador 20 000 1976 24 '0 19 7' "' O. 'French Depts. of 1,090 10 6 1 17 1 1MartiniQue and 1973 35 0.1Guadel.oupe 1,700 7 4 5 16 1 1
Guatemala 1">1 800 107' 62 28 0 00 " 6 '0 1"8 1.0
Haiti* 27.7'0
Honduras* 112 OB8
.Jamaica 11.400 1976 22 " " 88 40 20 n 82 170 0,07
Mexioo 1.972,047 19"' 77 146 246 469 12' dO Jd6 '09 978 2.0
I 006 1076Hath. Antilles °Nicarag1l a 1"iO 000 107' " 1 11 d6 !. 4 '0 2.6
Panama 77.082 1976 2d 11 22 '7 12 d 12 28 8' 0.9St. -Pierre and
242,Trinidad and Toba~o 5.121 1 076 0
United States ~.'''.61' 1076 10 9Al 100 "1 0. 0
* Inforlllatiull not reclolived
TABLE 4,,4.3 (b) - REGTQN IV (NORTH AND OENTRAL AMERICA)~ SURFACE WATER OBSERVATIONS NET\ofORKS
STAGE. SEDIMENT AND WATER QUALITY
113
Sub-oolumn a Sub-column b Sub~column 0 Sub-oolumn d
Reco~da duration leas than 5 yearsRecorda duration between 5 and 10 yearsReoorda duration more than 10 yearsa + b + a
(1 ) i 2) 13) I, ) (5 ) In
Year ofStations measuring stal':e only Stations Stations
STATE/TERRITORY Area km2 Non-recording measuring measuring
Reoordin.o' No. No. sediment water nualitreportinga b 0 d a b 0 d a b 0 d a b 0 d
Bahamas 10.500 1975
Barbados 430 1976 No narmana t rivers hence no network
British Car. Ter;.*
Canada .076 18' 1076 66 7' la' 2do Al 20 "Q 212 7, 6' l' 1'2 272 202 A8 522
Colombia*
Costa Ri°lt 50.900 1975 , 4 , , 2 26 " 72 11 14 11 >6
Cuba* 114.524
Dominioan Ren • A8442 107' Ra.ndom Random
El Salvado.... 20 000 , 076 '7 16 - " 27 28 18 75
french Depts. of 1,0901973
2 2~arti3.ique and 1700 7uada au e 16 1 1
Guatemala rn 800 lq73 2 2 , 1 , 2 8 2 ?, 26 26
Haiti* 2L750
Handuras* 112 088
Jamaica 11.400 1976 , , 1 , , 92 02
Mexico . Q'72 'dO 1973 88 lS2 240 50 80 126 208
Heth. Antilles 006 1076 -Nicara~a 130 000 107' , 1 6 1 1 1 , 2 6 8
Panama 77,082 1076 6 6 I? 11 , 11 30 '0St. Pierre andMi ",1"... *" 242
Trinidad and Toba~o i:;.121 1976 10 12 " 2 , 2 , 5 5 20 20
Illnited "t tes 2.2.2..lli. lQ76 10.979 1.306 12.568
* Information not received
114
'rABtE 4.4~4 - REGION IV (NORTH AND CENTRAL AMERICA) ~ GROUNDWATE~ OBSERVATION NE'l"1l0RKS
Sub-oolunul a - No. of boreholesSub-oolumn b No. of wella
"7, )~
(, , «, I, ) (6) 17) (8) 19 )i
(z.L .2 ''later Piezometrio Water Chemioal Others RemarksSTATE/TERRITORY Axea kIn Year of leyal ""rSBBure tem-narature comuos!tion
reporting ~-, t.\ 1,;, r;;\ la) Ib' la' lib) a' b'
Bahamas 1"00 107" lIone
Bar'bados "0 1076 28
British Car. Ter.*
Canada 9,976,185 1976 500
Colombia*Area of
Costa Rioa 50,900 1975 45 160 45 160 45 160 45 160 l~jtudy 2000 km
Cuba* 11L'2ANo syst;e-
Dominican Rep. 48,442 1973 mationetwork
Ell Salvador 20 000 1076 182 lOS 10,
French Depts. of 1,090 No~~rt~~ique and 1,700 1973 network
u °
Guatemala 17;1 800 10" 10 10 10
Ho.iti* 2" ""0
Honduras*" , 12 OB8
Jamaioa 11- ADO 1°76 "6 B" 77
Mexioo 1.072.'" 10" None
Neth. Antil1 as 006 1076 None
Nioa,ra~'" 12.0 000 1°"' 6A6 2126
Panama* 77 082
St',,~~erre and2'2Mi"u l~n:*-
T~inidad and Tobano , 121 10" ,8 20
United States 10 ,"" 61" 10"6 28"6" "dO "6Q
* Information not received
TABLE 4.5.1 - REGION V (SOUTH-WEST PACIFIC): PRECIPITATION OBSERVATION NET\'IORKS
Total
115
Sub-oolumn a Sub-column b Sub-oolumn 0
Sub-column d
Reoords duration less than 5 yearsRecords duration between 5 and 10 yearsReoords duration more than 10 yearsa + b + a
fi\ -72\ -(;1 {:;\ (;, (Ii\
Area km2 Year QfNo. 0< non-recording No. of reoording Density
STATE/TERRITORY : ~au as and totalizer &'&u as km2. Xreporhng(., (b' (0 \ (d' i(s' (b (0 I (d' lO"/otn.
Australia 7,686,449 1975 1479 819 6286 8584 228 294 346 868 0.8
French PQ~neBia 4,000 1975 17 13 19 49 29 0.05
Indonesia 1,904,345 1975 660 292 1958 2910 75 75 0.6
Malaysia 332,000 1975 82 133 689 1008* 58 94 91 274 0.3
Naw Caledonia 19,000 1975 53 21 78 152 31 7 8 46 0.1
New Zealand+ 268,675 1975 274 533 1138 1945 82 139 221 0.2
Papua New Guinea 466,200 1975 114 122 308 544 13 11 12 36 0.8
l'hilippinee 300,000 1975 150 14 365 528 54 27 8 89 0.5
Singapore 518 1975 42 6 11 21 38 0.006
~~14,925 1974 5 4 53 62 5 5 0.2
United States** 19,300 1975 38 270 314 23 71 51 145 0.04
+ Includes Western Samoa, Cook Island, Fiji, Tonga Western Pacific High Commission "Territories.
* Inoluding 104 non-reoording and 31 reoording unclassified gauges.
** Hawaii, Samoa, Guam, T.T. of Paoific, Wake, Johnston.
116
I ----------------------
I
~LL
~
U ~ L« t; 10.. ~
~
l- ii(/)
~
I;
0
IJ.j~3=
I l'l:r: -.'C.I- ~
,..::> ..;
~
,.0 ~ I
0
(/)0
'"
•,0
•
~
,•
.'~~
, ~~
",p
~
~ ~
TABLE 4.5.1 (a) - REGION V (SOUTH_WEST PACIFIC): PRECIPITA~ION OBSERVATION NETWORKS
Stations with elevation below 500 m
Sub-column a - Reoords duration leae than 5 yearsSub-column b - Recorda duration between 5 and 10 yearsSub-oolumn c - Records duration more than 10 yearsSub-column d "'" a + b + 0
117
'1 ' '2' I,' I. , I, , --16'STATE/TERRITORY Area km2
Year of %of No. of non-recording No. of recordingtotol au~e8 and totalizers ;ra.~,Q'eB
reportingarea -,;;:-, 1", (~) 'd \ la\ Ib \ 10\ Id
Australia 7,686,449 1975 87.08 1234 686 4846 6766 189 244 267 700
Frenoh Polynesia 4,000 1975 90.00 9 13 19 41 1 1 8 10
Indonesia 1,904,345 1975 612 249 1674 2535 67 67
Ms..lay-eia 332,000 1975 69.2 80 131 661 872 56 87 88 231~-
Ne'/i Caledonia 19,000 1975 84 51 16 76 143 23 6 8 37
New Zealand+ 268,675 1975 221 408 1010 1639 60 120 180
Papua New Guinea 466,200 1975 48 75 69 178 322 8 6 7 21
Philippines 300,000 1975 80.0 148 11 347 506 54 27 7 8B
Singapore 518 1975 100 42 6 11 21 3B
Timor 14,925 19'(4 4 3 29 36 3 3
United States* 19,300 1975 50 5 36 212 253 21 52 38 111
+ Inoludes Western Samoa, Cook Island, Fiji, Tonga Western Pacifio High Commission Territories.
* Hawaii, Samoa, Guam, T.T. of Paoifio, Wake, Johnston.
118
T~BLE 4.5.1 (b) ~ REG TON V (SOUTH-vmST PACI~IC): PRECIPITATION OBSERVATION NETWORKS
Stations with elevation between 501 and 1000 m
Sub-coltt!!L'l. a - Records duration less than 5 yearsSub-ool1unu b - Records duratio:Q. between 5 and 10 yearsSub-colu.mll 0 Records duration mol'S than 10 yearsSub~column d ~ a + b + c
(- , ,- , '" 'd' « ) (6 )~-
STATE/TERRITORY Area km2
Year of %of No. of non~reccrding No. of reoordingtotal auves and totalizers aU.!I'es
reportingarea la ;; (b) 10 \ I d \ la) lb.) 10 \ Id)
AUBtralia 7,686,449 1975 12.53 245 133 1251 1629 39 50 69 158
French Polynesia 4.000 1975 2 2 1 1
Indonesia 1,904,345 1975 37 29 198 264 7 7
PIalaysia 332,000 1975 18.0 2 2 8 12 1 7 1 9
Nei~ Caledonia 19,000 1975 14 2 5 2 9 7 1 8
New Zealand+ 268,675 1975 30 86 114 230 16 18 34
Papua New Guinea 466,200 1975 26 13 15 25 55 2 1 1 4
Philippines 300,000 1975 ILl 2 3 13 18
Singapore 518 1975 0
Timor 14,925 1974 1 16 17 2 2
United States 19.300 1975 19 1 23 24 2 10 4 16
+ Inoludes Western Samoa.Co~k Island, Fiji, Tonga Western Pacific High Commission Territories.
* Hawaii, Samoa, Guam, T.T. of pacifio, Wake, Johnshon
TABLE 4.5.1 (a) - REGION V (SOUTH-WEST PACIFIC): PRECIPITATION OBSERVATION NETWORKS
Stations with elevation below 500 m
117
Sub-oolumn a Sub-oolumn b Sub~column c Sub-column d
Reoorda duration less than 5 yearsRecords duration between 5 and 10 yearsRecords duration more than 10 yearsa + b + 0
", 12 , I" IA\ 1,\ 16 ,
STATE/TERRITORY Area km2 Year of %of No. of non-recording No. of reoording
totol au~es and totalizers "''''·U'''8Sreporting
area 1a \ Ib \ 10' I.' 'a' 'b' 'e \ "Australia 1,686,449 1975 87 .. 08 1234 686 4846 6766 189 244 267 700
Frenoh Polynesia 4,000 1975 90.00 9 13 19 41 1 1 8 10
Indonesia 1,904,345 1975 612 249 1674 2535 67 67
Ma.l3y31 a 332,000 1975 69.2 80 131 661 872 56 87 88 23 '
New Caledonia 19,000 1975 84 51 16 76 143 23 6 8 37
Ne\'1 Zealand+ 268,615 1975 221 408 10lD 1639 60 120 180
Papua New Guinea 466,200 1975 48 75 69 178 322 8 6 7 21
Philippines 300,000 1975 80,,0 148 11 347 506 54 27 7 88
Singapore 518 1975 100 42 6 11 21 38
Timor 14,925 1974 4 3 29 36 3 3
United States* 19,300 1975 50 5 36 212 253 21 52 38 111
+ Includes Western Samoa, Cook Island, Fiji, Tonga Western Pacific High Commission Territories.
* Hawaii, Samoa, Guam, T.T. of Paoifio, Wake, Johnston.
118
TABLE 4.5.1 (b) - ~GION V (SOUTH-~®ST PACIFIC): ?RECTPITATION OBSERVA~ION NETWORKS
Stations with elevation between 501 and 1000 m
S1.1b~colUDL'1 a - Recoxds duration leB8 then 5 yearsSub-oolunm b - Recoxds duration between 5 and 10 yearsSub-column e - Recorda duration mo:re than 10 yea:rsSub-column d = a+ b + c
" , I~ \ I" I, , I,) 16 )-
STATE/TERRITORY Area km2
Year of %of No. of non-recording No. of recordingtotd! oau~es and totalizers aU""ea
reportingarea ~\ Ib) Ie' Id' la' lb·' (~ ) (d'
Australia 7,686,449 1975 12.53 245 133 1251 1629 39 50 69 158
Frenoh Polynesia 4,000 1975 2 2 1 1
Indonesia jll,904.345 1975 37 29 198 264 7 7
Nalaysia 332,000 1975 18.0 2 2 8 12 1 7 1 9
New Caledonia 19.000 1975 14 2 5 2 9 7 1 8
New Zealand+ 268,675 1975 30 86 114 230 16 18 34
Papua New Guinea 466,200 1975 26 1) 15 25 55 2 1 1 4
Philippinea 300,000 1975 ILl 2 ) 1) 18-
Singapore 518 1975 0
Timor 14.925 1974 1 16 17 2 2
United States 19,300 1975 19 1 2) 24 2 10 4 16
+ Includes Western Samoa,Cook Island, Fiji, Tonga Western Pacific High Commission Territories.
* Hawaii, Samoa, Guam, T.T. of Pacifio, Wake, Johnston
TABLE 4.5.1 (0) - REGION V (SOUTH-WEST PACIFIC): PRECIPITATION OBSERVATION NETWORKS
Stations with elevation between 1001 and 1500 m
119
Sub-column a Sub-oolUJlll1 b Sub-oolumn 0 Sub-column d ...
RecordsRecordsReoordaa + b
duration less thanduration between 5duration more than+ 0
5 yearsand 10 years10 years
(1 ) (2) (, ) (4) (,) (6)
Area km2 Year of%of No. of non-recording No. of recording
STATE/TERRITORY total ~au£es and totalizars augssrepo:riing Areala) Ib) (0) (d) (a) Ib) , Ie) (d)
Australia 7,686,449 1975 0.34 189 189 10 10
Frenoh Polynesia 4,000 1975 4 4 2 2
Indonesia 1,904,345 1975 4 8 57 69 1 1;--.
Malaysia 332,000 1975 8.0 15 15 1 2 3
New C&ledonia. 19,000 1975 1 1 1
Hew Zealand+ 268,675 1975 16 37 13 66 5 1 6
Papua New Guinea 466,200 1975 8 10 7 35 52 1 1 1 3
Philippines 300,000 1975 7.0
Singallore 518 1975 0
Timor 14,925 1914 1 1 8
Uni ted States* 19,300 1915 1 1 12 13 8 6 14
+ Includes WeBte~n Samoa, Cook Island, Fiji, Tonga Western Paoifio High Commission Territories.
* Hawaii, Samoa, Guam, T.T. of Pacific, Wake, Johnston.
120
1'ABLE 4.5.1 Cd) - REGION V (SOUTH_\'fEST PACIFTC): PRECIPT'I'ATION O]S~RVA'T'ION NETWORKS
Stations with elevation between 1501 and 2000 m
Sub-column a - Records duration less than 5 yearsSub-uolumn b - Reoorda dura",;ion between 5 and 10 yearsSub-column 0 - Reoo:rds duration more than 10 yearsSub-column d a t b + 0
I w 12\ 1;\ lA' I' \ 16\
f::""""'~~. k 2 Year of
%of No. of non-reoording No. of recordingArea _1l1 total au~eB and totalizers /l:RUI'.:6areporting
area Ia) Ib) (0 ) (d) (a) Ib) (0) ( d)
Auatralia 7,686,449 1975 0.04
Frenoh Polynesia 4,000 1975 2 2 1 1
Indonesia 1 1 904,345 1975 6 4 23 33
Malaysia 332,000 1975 2.5 3 3
New Caledonia 19,000 1975
New Zealand + 268,675 1975 6 2 1 9 1 1
Pap';lR New Guinea 466,200 1975 15 15 24 56 95 2 2 2 6
Philippines 300.000 19'75 1.34 1 1
Singapore 518 1975 0
Timor 14,925 1974 1 1
United 5tote5* 19,300 1975 9 12 12 1 1
+ Includes ~~stern S~moa, Cook Island, Fiji, Tonga Western Pacific High Commission Territories.
* Hawaii, Samoa, Guam,T.T. of Pacifio, Wake, Johnston.
121
TABLE 4.5.1 (9) - REGION V (SOUTH-WEST PACIFIC): PRECIPITATION OBSERVATION NETWORKS
Stations with elevation between 2001 and 2500 m
duration less than 5 yearsduration between 5 and 10 yearsduration more than 10 years+ 0
ReOOTdeReooxds
o Reoordad = a + b
Sub-oolumn aSub-column bSub-oolumnSub-column
(1) (2) (3 ) (0) (0) 16\
Area km2 % of No. of non-reoording No.of ~eoording
STATE/TERRITORY Year of total 6&UOes and total sera "'auDssreportJ.ng
area fa) I" ) (~, 1d \ la' Ib \ I~\ 1d'
Australia 7,686,449 1975 0,01
Frenoh po~ne8ia 4,000 1975 1 1
Indonesia 1,904,345 1975 1 2 3 6
lo1a.laysia 332,000 1975 2.3 2 2
New Caledonia 19,000 1975
New Zealand + 268,675 1975 1 1
Papua New Guinea 466,200 1975 2 1 7 12 20 1 1 i-Philippines 300,000 1975 0.54
Singapore 518 1975 0
IfIimor 14,925 1974
United Stotes * 19,300 1975 5 1 5 6
+ Includes Western Samoa, Cook Island, Fiji, ~onga Western Pacif~o High Commission ~erritories.
* Hawaii, Samoa, Guam, T.T. of Paoifio, Wake, Johnston.
122
TABLE 4.2.1 (f) - REGIOn v (SOUTH-HEST PACIFIC): PRECIPTTA'l'ION OBSERVATION NETWORKS
Stations with elevation above 2500 m
Sub-colum..'1 e Sub-oolumn b Sub-oolumn 0 Sub-oolumn d
RecordaRecordsRecordaa. + b
duration less than 5 yeaTSduration between 5 and 10 yearsduration more than 10 years
+ c
(1) (2 ) () ) , (4) (5) (6)
·2 %of No. of non-reoording No. oI reoordingSTATE/TERRITORY Area km Year of
total 0'9." as and totalize:!'ll "'au""esreporting
area 1,;, (b' (c' (d) (a) (b) (c) (d)
Australia 7.686,449 1975 0
Frenoh Polynesia 4,000 1975 0
Indonesia 1,904,345 1975 ) )
Halaysia 332,000 1975 0
New Caledonia 19,000 1975
New Zealand+ 268,675 1975
Papua New Guinea 466,200 1975 1
Philippines 300,000 1975 0.02
Singapore 518 1975 0
Timor 14,925 1974
United States * 19.300 1975 6 6 6 - 1 2 )
+ Includes Western Samoa, Cook Island, Fiji, Tonga Western Pacifio High Commission Territories.
* Hawaii" Sa!lloa, Guam, T.T. of Paoific, '-fake, Johnston.
TABLE 4.5.2 - REGION V (SOUTH:'HEST PACIFIC): EVAPORATTON OBSERVATION HETi'fOF.KS
Sub~oolumn a - Records duration lesa than 5 yearsSub-column b - Reoords duration between 5 and 10 yearsSub-oolumn a - Records dura;hion more than 10 yearsSub-oolumn d ;: a + b + 0
123
(1) 12L- 13' (4) (5 ) (6) (7)
Area km2 Year- ·of No. of US "A" No. of stations (~~h Density
STATE/TERRITORY Da:!l stations nans other the. Total km2 xreporting (a) (b) (o ) (d) (a) (b) (0 ) (d) 103/s tn.
Australia 7,686,449 1975 2BB 2BB 26.7
French Polynesia 4,000 1975 23 23 0.2
Indonesia 1,904,345 1975 14 14 14 136.0
Malaysia 332,000 1975 40 f 49 15 104 2 2 4 lOB 3.1
INew Caledonia 19,000 1975 1 , , 1 5 1 6 7 2. "(
New Zealand+r-
268,675 1975 21 13 11 I 45 1 10 11 56 4.B
466,2001 BPapua :tTe,.; Guinea 1975 4, 4 B 58,2
I
Philippines 300,000 1975 20 45 14 79 79 3.8
Singapore 51B 1975 2 2 1 1 3 0.2-
Timor 14,925 1974 0
United States * 19,300 1975 2 4 6 6 3.2
+ Includes Western Samoa, Cook Island, Fiji, Tonga Western Paoi£io High Commission Territories.
* Hawaii, Samoa, Guam, T.T. of Pacific, Wake, Johnston.
TABLE 4.5.3 fa.} ~ REGION y (SQUTR~WEST PACDIC): SURFACE WATER OBSERVATION NETWORKS _ DISCRARGE
125
Sub~oolumn a.Sub~aolumn b Sub-oolumn c Sub~oolumn d
Records duration less than 5 yearaReoords duration between 5 and 10 yearsRecorda duration more than 10 yearaIi + b + 0
(1) (2) I,) I" ) " \ f<\
Area km2 Year Qf Sil.<i.gA ~ n~ "'che.rJ7e Stationi.'l Densi ty
STATE/TEfL~ITORY Record inlJ: Na.. Non-reoord;n~ No. Total km2 xreportL~g
(.) I(b) (0 ) Id) la) Ib \ (0) I' \ 103/stn.
Aus-tralia 7,686,449 1975 818 687 824 2329 123 132 406 661 2991 2.6
French PolyneBia 4,000 1975 11 11 0.4~-
Indonesia 1,904,345 1975 131 31 34 196 102 48 74 224 420 4.5
1>i...alayaia 332,000 1975 41 34 48 123 51 14 18 37 160 2.1
liew Caledonia 19.000 1975 3 1 12 16 16 1.2
I- --
Ifsw Zee.land 268.675 1975 30 70 251 351 10 15 51 76 427 0.6
Papua New Guinea* 466,200
-Philippines 300~OOO 1975 2 4 231 237 I
132 132 369 0.8
ISinga.p_or_6 518 1975 5 5 1 5 6 11 O~O5
Timor 14.925 1974-r
0
United States + ·17,831 1975 - ~ ~ 168 - - - 240 408 0.04 --
• Information not received
+ Hawaii, T.T. of Pacific, nuam, Samoa
126
~- ..
/f!:- ~
~
f..u..
Iu<i :1ll..~
I 1u
I- ~
•
(j) .;
-
~lIV • . 1
JI l'll !I
jI-::::l0VJ
I;'.0-
I ;-,,. ~
".P
~
TABLE 4.5.3 (b) - REGION V (SOUTH-WEST PACIFIO): SURFACE WATER OBSERVATION NETWOFKS _STAGE, SEDIMENT AlfD WATER QUALITY
127
Sub-oolumn aSub-oolumn b Sub-oolumn 0
Sub~colum.n d
Reoorda duration lass than 5 yearsReoords duration between 5 and 10 yearsRecorda duration more than 10 yearsa I- b + c
1" (? \ I' \ (A ) (.;) (6 )
Stations measurin!l ata..<te onlv- Sta.Hona StationsSTATE/TERRITORY Area km2 Year of measuring measuring
repoI'.ting Recordin Ha. Uon-:r.eoordin No aediment water Quali tv
(a) (b I (0 lid) (a I (b) rio ) Ird ira fib 0 I(d I(a I (b \ 1(0 \ I Id)
Auetralia 7.686~449 1975 79 59 53 191 82 102 382 566 230 1 23 254 462 20 3'< 203
Frenoh Polynesia. 4,000 1975 5 5 13 13 1 1
Indonesia 1,904,345 1975 7 6 13 11 6 2 19 151 151
Malayaigl, . 332.,000 1975 19 11 4 34 22 18 40 6 17 3 26 2 2
New Caledonia. 19,000 1975
New Zealand 268,615 1975 2 6 60 68 2 2 56 60 35 14f 11 186 80 2 2 184
Papua New Guinea-l(- 466,200
Philippines 300,000 1975 11 11 46 46 17 117 87 87
Singapore 518 1975 22 8 30
Timor 14,925 1974".•-
United States+ 17,831 1975 - - - 5 - - - 15 - - - 65
* lfiformation not received
+ Hawaii, T.T. of Pacific, Guam, Samoa
128
'T'ABLE 4.5.4 _ REG-IOH V (SOuTH-WEST PACTFIC): GROmmWATER OBSERVATION NETWORKS
Sub-oolumn a No. of boreholesSub-column b - No. crf weI-Is
(1 \ (2 \ (,\ (4 \ (" \ (6\ -17 \ (8 \Years
2 of Water Piezometrio Water Chemical OthersSTATE/TERRITORY Area lcm Report- level 'tn'eS!:lure teID-neratuJ.'e com....oaition
ina I a \ Ib\ (a \ (b\ (a\ (b' la\ (b) ( ~\ (b)
Australia 1,686 1 449 1975 6668 405 2947 2047 30 7757 350 257 30
French Polyneela 4,000 1975 About 60 wells or pumping stationA
Indonesia* 1,904 1 345-
Malaysia 332,00C 1975
New Caledonia 19,000 1975 38 33
New Zealand 268,675 1975 25 22 300 120 10 30 6 10
Papua New :}uinea * 466,200
Philippines 300,000 1975 210 2B9
Singapore * 518
USA (Hawaii) 151939 1975 3B 10 13 0 41 10 24 6
* Information not received
129
TABLE 4.6.1 - REGION VI (EUROPE) PRECIPITATION OBSERVATTON NETWORKS
Sub-column aSub-column bSub-column cSub-column tl
Total- Recorus-auration laes than- Recorda duration between 5- Recorda duration more than
+ h + c
5 yearsand 10 years10 yearfi
STATE/'l'ERRITORY
YeOI' ofArea km2 reporting
No.of non-recording",aU"'88 & ot.~lize"'8
a b) (0 d
no.of... e'.,...·r1il",. J:l'au~"'"abc (d)
j)ens~ty
kru 2/Btn
lhania 28,748 1972 - 73 27 13 185 ?25 14 8 23 45 106
uetria 83.849 197? - 73 ;:>5 850 875 3 77 80 88
!Belgium 30,513 1972 - 73 30 280 310 29 4 6 39 87
~uIJlaria*
9~251 1972 - 73 14 53 72 139 7 7 6 20 58
zechoslovakia 127.r.69 1972 - 73 41 180 401 1622 32 79 184 295 67
Denmark 43,069 1972 - 73 83 103 397 583 2 1 2 5 73
inland 337,009 1972 - 73 65 151 460 676 10 11 42 63 456
ranee 547.026 1972 - 73 366 464 2676 3500 64 65 191 320 143
perman D .R. 108,178 1972 - 73 24 131 1172 1327 22 96 93 211 70
Germany, F.R. 248,577 1972 - 73 149 132 2665 2946 22 15 210 247 78
reeee 131.944 1972 - 73 136 199 444 779 47 92 99 238 130
ungary 93.030 1972 - 73 19 32 859 910 513642 98
Iceland 103,000 1972 - 73 26 28 90 144 1 1 1 3 701
Ireland 50 67 689 806 7 22 61 90 78
Ierael 20,700 1972 - 73 126 112 445 623 29 24 37 90 29
Italy 301.225 1972 - 73 4 59 1700 1763 21 87 1729 1837 84
51
86
389
23259
5 5
4402458
20 39-}-+--+-----I
41 145
47 183 134 364
12 92
98,060 1972 - 73ordan
Norway
Lebanon 10.400 1972 - 13--f--
Luxembourg 2~586 1972 - 73 25 25
40;844 1972 - 73 31 36 338 405 14 1 34 49 90f----+---'--f----+--+--+-+-+--f---I-1--+-'--.--
324.219 1972 - 73 120 144 517 784
Poland 35 100 115 250 110
Port'Ugalf--Romania
Sweden
15 19 10 38 53.f-._-._._--
5 9 34 45 681185,180 1972 - 73
Swi tzerland 41,288 1972 - 73I----f-----
Turkey 780,576 1972 - 73 211 427 561 1199
iu.S~S.R.*
nitedKingdom
* Information not received
131
TABLE 4.6.1 (8.) - REGION VI (EUROPE): PRECIPITATION OBSERVATION NETWORKS
Stations with elevation below 500 m
Sub-column a _ Records duration Ieee than 5 yearsSub-column b - Records duration between 5 and 10 yearsSub-column c _ Records duration more than 10 yearaSub-column d = a + b + 0
Austria B~ B.d.!)
d
'0"
No. of recording;l:8.U BS
a. b 0
6
7 , '"
" I ,
of non-reoording~e and totalizersbed
No.••
8•
'0
35
;. oftotolarea
1972-",
Year ofreportin
1972-",
2
Area km21
STATE/TERRITORY
Ibania 28.7~8
:Bul~aria* 110· q12
German D.R.
I"C",z,"ec",h"0"e",,,ov,,a,,,k,,i,,,a,--_+~lg7.86q lQ72_7"i 65.33 23 105 1022 1150 25 54 137 216
I'D",e"nma","r"k~ +_",d,,~.,,06",9'-1r".9~'7!c2"-:l7234,"0~0.:..0~0+-,8~3,-+~1,,0,"3_+-23:z91.7-if-d.S8",3,-+--,2,--+-.-e!1~+_",2_t-_L5_1I"F"""n'o,·"n",d~ +_.3,"3u7-,-,,,00",9'-lr'9=7'2,,,-"-'.B-t",9b9".2'-1-,6",S,--+..:1"5""_t-,,d,,60,--+-_6".7L6'--t-.:l,,0e-f-1L-t-_4ot2,--+--,6o;3y
France __-+_~,.d'7~.0,,-269-~'9/.li7"=-7J.2..'+__!_"1.<22-'-+_2:"8~6,-+,,~9Jl7L+-2~6,,2~6-+_'1.<;'dL+' _A:i."9_t-""'"9'8'--t-,,2\LOly1"""""'----108 178 1972-7' 18 118 10'" 1190 21 70 87 178
Ireland 70 28' 1972-", 99 '0 6' <70 70' 7 " 1<1 AO
Ieraal 20:700 1972-", 176.5 79 0' 'OR '70 '0 '0 " 7'
Italv '012" 1972-", ,,, OR' 'OlA 17 i '0 1077 n"
nited Kin.<n1om 2"-4 OA6 lq72-13 91.4 178 110'" 28Q 6')70 :>:1 "'<;; 10<> lQ1
* Information not received
132
TABLE 4.6.1 (b) - REGION VI (EUROPE): PRECTPITA~ION OBSERVATION NETWORKS
Stations with elevation between 501 and 1000 m
Sub-column aSub~column bSub-oolumn cSub-column d
_ Records du:ration less than 5 years_ Records duxation between 5 and 10 years- Reoord.s duration more than 10 years
a + b + c
1 2 6
Area km2 Year of %of No. of non-recording No. of recording
STATE/TERRITORY reporting total Ira L!l:es and totalizers /tau aa
• b c d • b c d
_lbaula 28.7d8 1972-73 18 1 68 87 , 1 , 0
uatria 8'8do 1972-7' 28 7 286 20' ,'il! '"
Bel«h'lm '0.'1' 1972_70 '7 " , ,BullZa.... ia* 110.912
,ICvprus 9,2'1 '972_70 "
, H H 'n ---L.- 7 ,Czeohoslovakia ~F7.860 1072_70 " Of 10 64 "9 4B 7 2d .2 "'Denmark 40060 1072-70 0
Finland "7,000 1072_7'
rwranoe "7,026 1072_7' 27 6, '24 '1' , 12 '" 60
German D.R. lOB 178 1072_", 6 11 112 120 1 2' '0
German;V'_ F.R. 2"8.'77 1972-", '" 8 '0 25 '" 607 7 , , '6 68
G:reece 1'1.044 1072_7' dO 77 140 2'6 12 " '2 76
unl1'aT'V 0'·0'0 1072_", 2 2 l' 16
Ioeland 10-" 000 1072_"' d , , 12 1 1
Ireland 70 28' 1072_7' 1 2 '0 12 1 1
Israel 20.700 1072-7' 7' n A2 10 '7 108 0 , , 17
ItalV' '01 22' 1072-70 1 17 d68 d86 , 28 'Bo '20
Jordan 98 060 1072-73 8'.' '0 117 81 2'8 l' ,."
Lebanon 10 400 1072-7' , '6 '6 ",
",
'"Luxembour.!r 2 586 lG72_7' 7 7
dO 844 lG72-70 n,
letherlanda r
lNorwav "d,no 1072-" h20 26 " on 17Q 7 ,Poland 012 677 1072-70 '.8 , 12 12' 1'0 8 16 2'f1:>ortu.!Z'9.1 q2 082 1972-" 19.0 lJ. 1" 1" , 28 '1
Romania 2'7.'00 1072-7' 27 74 120 2'0 12 2 "Snain '0"-782 1072-" '" 1'1' ,q, 112<; 287;.11 1 , 11 l'
Swed.en Ad9.06d 1072_7' 17 1 S 28 '"Swit2ierland dl 288 1072_"' 7 10 201 21B , , 6 '"ISvrian A.R. 181:;·180 1q72-73 33 n lG " 76 1 1 7 9
Turkev 780,076 1972-13 27 SO 1'd 1SA "B 70 8 ?J '8~SSR* s.sn 000
TInited Kin.,.dom· 244 046 1972-13 8,6 8 u 8' 107
Ivun-oalavia 255.804 1972-13 q1 h ,c
*Information not received
TABLE 4.6.1 (0) - REGION VI (EUROPE): ~RECIPITATION OBSERVATION NETWORKS
Stations with elevation between 1001 and 1500 m
133
Sub-column a Sub-oolumn b _Sub-column c _Sub-oolumn d =
Records duration lese than 5 yearsRecorda duration between 5 and 10 yearsRecords duration more than 10 yearsa + b + c
1 2 6
Araa. km2 Year of %of No. of non-reoording No. of reoordingSTATE/TERRITORY total lZ'a 19oes and totali~ers lZ'ILuQ'en
reporting dreo a b 0 d • b c d
Iban~a 28.7A8 1072_7' 1 1 11 l', 1 2 6
ustI'la 83,8'0 1072_7' 11.0 1 154 155 9 q
BalRium 30. >13 1972-7 3 0Bulga.ria* 1l0.912
9.,Y.£.rus 9,2>1 1972-73 4.0 1 4 7 12 1 , 2
Czeohoa1ovakia .. 127,869 1972-73 2." 6 7 20 42 1 , 6
enma.rk ".060 1072-7' 0
~~nd "7 000 1072-7'
li'.,.anoe '''.026 1072_73 _7 12 '01 '20 , , '6 "German D.R. loa 178 1972-7' 2 6 8 .1 ? ,Germanv. F.R. 208,'77 1072-7' 1.7 1 , " '8 , ,
G2?~~a__._.__ 1'l.oH 1072-7' 16 11 l' °, 4 " 21
iHunqary 0'030 1072-7' 0 1 1 1 1
Ioeland 10~.OOO 1072-7' n
Ireland 70 28' 1072-7' 0Ia:ra.el 20,700 1972-7' 0,4 h h 1 1
Ita~v '01 22' 1072-7' 1 4 161 "" 1 " "" 1 "
Jordan 08 060 1972-737 ° 4 " " '0 , < 7 "
Lebanon 10 . .100 '972-73 , 27 9 30 II 1 12
L-m:=em-bouX'Q' 2.'.6 1.072-70 0
!Netherla.nds AO 844 1072-7 3 0
NorwR.v '2_4.. 210 1972-73 1'.0 ,10 7 20 1 1
!Poland '12 677 1072-70 0,00 1 1 '0 '2,
6 6
!PortulZal Q2,082 1072-7 3 1.- 1 12 l' 1 P 2 ,Romania 2'7.'00 1072_70 8 l' --.l5 ,6 " 1 ,Snain '04,782 1072-70 U.O '"6 12.A-- ,74 °'4 1 1 2
Sweden 440.064 1072-70 0
Switzerland AI 288 1072_70 , , "8 "0 , < , A
Svrian A.R. 16"'.180 1072_70 , 7 , 14 24 1 ,'J1nrkay 780 '"6 1072_70 ,0 6Q '" 142 '26 18 14 7 '0
SSR * ",'571 000
nlted KinD'dom· 2" 046 1972-73 0,0' 1 1
U-"'OL'llavie. 2" 804 1972-73 "6 A
* Information not received
,
r
13A
TABLE 4.6.1 (d) - REGION VI (EUROPE): PRECIPITATION OBSERVATION NETWORKS
Stations with elevation between 1501 and 2000 m
Sub-column a. - Recoxds duration less thli..<' 5 j-earsSub-column b - Reco:rdB duration between 5 and 10 yearsSub-column c - Reoo:rda duration mo:re than 10 yearsSub-colllIDl1 a a + b + c
1 2 6
Area. km2 Year of I% of No. of non-recording No, of racording
STATE/TERRITORY total a:a ~eB and total i zerB «aU."\'8Breporting a b c d a b 0 d
Ibania 28.748 1072-7'
us tria 8' Sdo 1072_7' 11.0 0 S8 67 , ,Bel&'lum '0.'13 10U-7' aBul.Q"aria* 110.'-H2
ICvurlls ~. 1072_7' , n , , ,Czechosloya.kia 127860 10'2_7' 0.16 2 A 8 ,Denmark 43 060 1072_7' 0
!Finland 327.009 1972-73 0
F::t'ance '47.026 1972-73 2 , " " n n
German .l'.R. 108 178 1972-73
Germany, F.R. 248,577 1972-73 O.d 1 1 2 26
reeee 131,944 1972-73l 2 2
un,l<ar:Y 9,,030 1972-73 0
Ioeland 10,,000 1972-73 n
Treland 70 28' 1072-7 3 0
Israel 20· 700 1072_"
Italy '01 22' 1072_7' c 00 0' n <'Jordan 08 060 1072_7' d 2 6 1 1
Lebanon lO·AOO 1072_7' 2 2 8 2 1 ,LuxembourQ' 2.'86 1072_7< 0
etherlanda "0 8'" 1072_" 0
orwav '2d21o 1072_7' 2.' 1 1
oland 012 677 lq72_7 3 0.0 l' l', ,
ortuSl'al q2 082 1072_" 0.1 1 , , 1 1
Romania 237.500 1972-73 12 d 7 23 2 2
S ain '0"-782 1072_" d.3 12 0 2 '8 2 2
Sweeten "Q,06A 1972-73 0
Switzerlanet 41 288 1972-73 0 11 70 80 1 1 2
ISyrian A.R. 18"i,180 1972-70 1.0 1 1 2
Turkey 780,076 1972_70 16,0 28 dO AS In 1 , 2 6
m-SSR * 0.071 000
m-ni ted Kin,g:dom. 244 046 1072_7< 0
ulZoelavia 2"i"i,80.d 1072-7< 28 1
*Information not received
TABLE 4.6.1 (8) - REGION VI (EUROPE): PRECIPITATION OBSERVATION NETWORKS
Stations with elevation between 2001 and 2500 m
Sub-column a - Records duration lees than 5 yearsSub~column b - Records duration between 5 and 10 yearsSub-column 0 - Records duration more than 10 yearsSub-column d = a + b + c
135
1 2 6
Area km2 Year of ! ~ of No. of non-recording No. of recordingSTATE/TERRITORY reporting total Q:a u,.,es and totalizers G"au~es
a b c d a b c d
Ibania. 28.H8 1972_"
Austria. 8' 8"' 107 2-7:LJ 6.0 2 28 30Bello!ium 30,5I' 1072_1' °Bulgaria.* 110- Q12
,
C:vllrua 9.251 1972-73 ICzechoslovakia In869 _1972-73 0.02 1 1 I
enmark R069 1972-73 0 I"Finland '''.009 1972-" 0 i""'anoa S47.026 1972-" 1 1 2 A 1 ! 1 2
German D.R. 108 178 1972-70 [
GermanV'. F.R. 248.S17 1972_73 ° 1[
Greece 131 ,2A1 1972-70 !iHUIWB.T'lI" 03 0'0 1972-70 n ,,Tceland lO~. 000 1372-7] . 0 IIreland 10 283 1072-" 0 1Iarael 20_ 700 1072-" 0 IItal"" '01 22' 1072_73
J-ordan 98,060 1072-"
Leba.non 10 . .100 1072-" 1Luxembourll' 2.. ,B6 1972-" 0
etherlands '0 8AA 1972-" 0 r
!Norway '2A 219 1972-" 2 , 1 1
Poland '12 677 1970-" ° 00
Portuna1 q2 082 1972_7' 0
Romania 237 .'00 1972_7' ? 1 --Snaiu 'OL782 1972_" n < ,
" -Sweden <Ag. e6A 1972-" 0
Switzerland Al 2BB 1972_" R q " Sl 1 1
Syrian A.R. 1B'), 180 1972_"
Turkey 780.076 , g7 2_70 70 7 , 7 17 1 1
SSR* '.'71 000
nltad Kin.,.dom' 24'.046 1972-70 0
up:osiavia 200 804 1972-73 6
* Information not received
136
TABLE 4.6.1 (r) - REGION VI (EUROPE): PRECIPITATION OBSERVATION NETWORKS
Stations with elevation above 2500 m
Sub-colUlJL.""1. a ~
Sub-oolumn lJ _Sub-column c _Sub-column d '=
Records duration le~B than 5 yearsRecords duration be~ween 5 and 10 yearsReoords duration more than 10 yearsa + b + c
1 2 (3 (4) (, : 6
Area km2 '~ of No. of non-recording No. of recordingSTATE/TERRITORY Year Qf totol ~a l~eB and totalizers "au ee
report~ng area a (b 0) (d (a 1. b (0 d
Albania 28.748 1972-73
Austria 83.849 1972-73 '.0 ? ?A '0 , ,BelRium. 30.513 1972-73 0
.,Bulg-aria'l< llO.912 iCyurus 9 2" 1972-73 •Czechoslovakia 127,869 1972-73 I 2 2
lnenmark 43 069 1972-73 0
Finland 337. 009 1972-73 10 j
France <47,026 1972-73 1 1 I 1 1
German D.R. 108.178 1972-73 I
Germanv. F.R. U8.577 1972-73 ,000 ? ? !
Greece 131.9d4 1972-73
unllarv 93.030 1072_73 n
Iceland lO'i.OOO 1972_73 0
Ireland 70 283 1972-73 0 iIarael 20.700 1972-73 n iItalv 301 22' 1972-73
Jordan 98 060 1972-73
Lebanon 10.400 1972-73
Luxembourg 2.,86 1972-73 n
etherlands 40 844 1972-73 0 ,orway 3U 219 1972-73 I
Poland 312,677 1972-73
ortuoral 92 082 1972-7' n
Romania 237. ,00 1972-70 , ,Suain 'Od.782 1972-73 o. , 1 , ,Sweden 449.964 1972-73 0
Switzerland !I.l 288 1972_73 , , 1 ,0
ISyrian A.R. 18~.180 1972_7'
Turkey 780.'76 1072_70 1'.0
hJSSR~ '.'71 000
hni ted KinO'dom, 2" od6 1972_"' 0
lvul2'oslavia 25 0 .80' 1Q72_"' ,
* Information not received
TABLE 4.6.2 - REGION VI {EUROPE} - EVAPORATION OBSERVATION NETWORKS
Sub-column a - Recorda duration leaa than 5 yearaSub-column b - Recorda duration between 5 and 10 yearaSub-oolumn c - Reoorda duration more than 10 yearsSub-column d :: a + b + c
137
1 2) I' In I, 6) 17) 18
STA'rE/ Area km2 Year of No. of ITS No.of GGI-3000No. of stations
DanaHyTERRITORY reporting II A" a , 'Dans ~~;h f~~" 0"11\ Total
km2 x 103jstn.a b c d a b c d a b c d
Ibania 28,748 1972 - 73 2 2 1 1 3 9.6
ustl.'ia 83,849 1972 - 73 5 5 1 1 2 7 12.0
~elgium 30,513 1972 - 73 1 1 11 11 12 2.5
~ulgaria* 110,912
pyprus 9,251 1972 - 73 7 7 2 2 9 1.0
!czechoslovakia 127,869 1972 - 13 1 2 2 5 55 3 4 62 2 3 5 12 1.8
~enmark 43.069 1972 - 73 21 21 21 2.0
lFinland 337,009 1972 - 13 4 8 22 4 4 1 1 27 12.5
iFrance 547,026 1972 - 73 48 10 58 9.4
-arman D.R. 108,178 1972 - 73 1 1 1 1 1 3 2 4 22 28 32 3.4
Germany, F.R. 248 ,517 1912 - 73 6 2 8 2 1 3 11 22.6
Greece 131,944 1972 - 73 17 1 1 25 24 49 40 113 138 1.0-
Hungary 93,030 1972 - 13 31 31 9 9 13 13 53 1.8-
Iceland 103,000 1972 - 13 1 1 1 103.0
Ireland 70,283 19'12 - 73 7 20 1 28 1 1 29 2.4- -Israel 20,700 1972 - 13 18 15 6 39 1 1 40 0.5
Italy* 301,225
Jordan 98,060 1972 - 13 323
2±"":':_',.Lebanon 10,400 1972 - 13 10 8 18 0.6
Luxembourg 2,586 1972 - 73 --Netherlands 40,844 1972 - 73 12 2 14 2.9
~rorway 324,219 1972 - 73 42 42 42 7.7
Poland 312,677 1912 - 73 4 18 6 28 11.2
Portugal 92,082 1912 - 13 12 12 7.7
Romania 237,500 1972 - 13 1 1 5 31 14 50 51 4.7.._--Spain 504,182 1912 - 73 44 1 45 11.2
Swaden 449,964 1972 - 73 5 3 1 9 50,,0
Switzerland 41,288 1912 - 73 12 12 3.4
Syrian A.R. 185,180 '1972 - 73 3 3 56 62 3.0
Turkey 780 ,576 1972 - 73 11 55 66 1 3 8 12 78 10.0
U.S.S.R. • 5,571,000
United --Kingdom 244,046 1972 - 73 3 9 64 76 3.2
Yugoslavia 255,804 1972 - 13 4 9 10 23 1 2 3 1 1 21 9.5
~ Information not received
TABLE 4.6.3(a) - REGION VI (EUROPE) - SU~FACE WATER OBSERVATION NETWORKS _ DISCEL~GE
J39
Sub-column a Sub-oolumn b _Sub~colUlllIl c Sub~colwnn d
Records duration lSS6 than 5 yearsReoorda duration between 5 and 10 yearsRecords duration more than 10 yearsa + b + c
.C' --'2
km2 Year ofDischar e stations
Total De12sitySTATE/TERRITORY Areo Recordin No. Ron-reoordin No.reoorting 'a b c d a b c d
km /stn .-Ibania. 28 "'8 10'2_"' 8 2 1 11 ' " , "'"uatI.'ia 8' 8'" 10'2_"' 8° 17,. ,,, '00
Bel""ium '0 51' la72_7' 1,0 h" 0'0 "0
BulO"B.:t'ia* 110,a12
I~·"ru, 'a 2'1 la72_7' 86 '" I," p< <0
Czechoslovakia 127.B6Q la72.7' 60 '1 3541.'8' '0 " 1,"< ~, <7< , 00
enmark 43 06a la'2_7' 2' 6 28 '8 , a I '0 '" '"binland ''" 000 1072."' 20 10 a, 1', 7 17 80 h" '4< , <70 - -France • "', 026 1--~p. n,R. lOB 1'78 1072_" 80 20 200 1.'00- ,"0 10° '"0 '00 '00 >e.
Germa~'~ 1<'.R. "8 '77 19"-"' 200 <00 '000 no
Greece 1'1 0" 10'2."' '2 "'" "a 00'
Iuun~aro' a, 0'0 10'2_"' 2' '2' 70<
Iceland IO::! 000 1072_"' 1"' 26 '80 ,70
Trela-nd 70 28' l'iE::1l- ' 01 I. 7'" 70'
Israel 20 "00 107 2_73 6"> I" a, 0.0
Ita1'~* 301 22<:.
Jordan "8 060 1°"2-"' 8 '8
Leba.non 10. ADO 1°72_"' 8' 171 "4 68
Luxembour~ 2 "86 1°'2-'3 3 ," 100 0' "0
I..'etherlanda '0 8" 1072_'" 12 hoo 2l? ,0>" ,
b.'orwa~· "2' no 1072_'3 88 6"" 1281,00 °0 1»" I" 70> .00
boland '12 6" 1972-"' 0" k '07 '0'"
Iuortu~al °2.082 1072_"' 2° •..2.° " 00
Romania 2" '00 1072_"' ko ---!i0' '0
Snain '0' '82 1072_"' 282 2 "0" 10"0
Sweden "a 06' 1072_"' 1 "ao '" PI?
Switzerland Al 288 19°2-"' 228 2°8 180
IS··rian A.R. 18c IBO 1072_" 2' 20 6385
780."°6 10°2_".
hh<urke·· " R"< a68
SSR c 571 000 1072_"' 100 h'N 2'"" 222A
nited Kin -" om' 2,;~ 0'6 la72_" 171', , 79" '*0
u-oalavia 2°0 80' 1072_7< b, ,,, <"0
* Information not received
TABLE 4.6'2 (b).- REGION VI (EUROPE): SURFACE WATER OBSERVATIOlf NETWORKS _STAGE. SEDIMENT·AND WATER·QUALITY
Sub-column a - Recorda duration less than 5 yearsSub-oolumn b - Recorda duxation between 5 and 10 yearsSub-column 0 - Records duration more than 10 yearsSub~oclumn d a + b + 0
141
2 4 - 6
km2 Stations measuring stage only Stations stations
STATE/TElL~ITORYArea Year of measuring measuring
re Recordin No. Non-recordin No. sedi ant ~rater nualit1Ta b c d e, b c d a b c d • b c d
Ibanie. 28,748 1972-7' 7 2 10 19 18 8 38 6 28 20
us tria 83,849 1972-7' 146 21 19 1
Belg-ium '0, ,n 1972_7' 1
llulgar-ia * llO.Q12
~~pruB 0,2'1 1072_7' 7 136 1
z8choslovakia 127 860 1012_7' 7 4 2l 32 10 6 85 10 17 4558n.rrl8rk 4'060 1972-7 ' 8 9 3 20 2 1 "inland "7 000 1 072-73 10 6 39 55 55 34 267 35 37 irance* ,,~ -e""man D.R. 108.118 1972·73 5 20 25 '70 75 630 8l- 3 48;<:
e;cmanv. F.R. lli,077 1072.7' 500 70 60 50
reees BI-Qi 1°12-7' 46 12 25 - 3.lunQ'arv 9':),0"0 1972-7' 117 22 2J 280
Iceland 10:<',000 1072_7' 20
Ireland 70 28' 1972",7' 2'( 2 510
Terasl 20.700 1972-", 2 83
Itab/" ";01 225 1972_7' -ordan 08 060 12-73::7 , 3; 3 22 38
ebanon 10 ,ADD 1972·7'
Luxembour.Q' 2"86 ; 072-7' 2 2 3
29~- - -ethe ...1ands 40 8AA 1072.7' 178 21 10
0rwa,v ,24,210 1072_7' 5 6 l} 24 102 ,4 140 276 -- 9 ~
012 677 ;072_7',-
Poland 71 157 . 102 _7201972_7,
-Portu.!tal g2 082 50 6 1 4
omania 2"71-1)00 1972_7' 128 103 236 261
Spain '04.782 1.972-7' 47 21 58 50
!Sweden 14g.964 197'·"' ;" 113 20 20
Swi-tzerland .dl 288 1972.7' 292 3 22 4
Svrian A.R. 181).180 1272-7 3 3J
Turkev 780_'76 1972.7' 3 83 445 715
SSR !" '71 000 1972-73 llOO ""0 750
nited King-dam 2AA,046 1972_7' ,17
u,9,'oslavia 2" 80' 1972·7' 314 43' 59 204
* Information not -received
14-2TABLE 4,6.4 - REGION VI (EUROPE): GROUNDWATER OBSFRVATION ~ETWORKS
Sub-column a no. of boreholesSub-column b - no. of wells
(1) ( 2) (3) ( 4) (5) (6) (7) (8)
2 Year ofWater Piezometric Water Chemical Other
STATE/TERRITORY Area km level pxessUXa ltemperature compositionre-porting (a) (b) ( a) (b) (a) ( b) ( a) ( b) ( a) ( b)
Albania 28,748 1972_73 196 317 17 8 55 50 22
Austria 83,850 1972-73 352 917 15 98
Belgium 30 1 447 1972-73 183 115
* 110,251Bulgaria
Cyprus 9,251 1972-73 130 1800 130 800 5
Czechoslovakia 127,869 1972-73 3133 148 3 687 2081 1011
Denmark 44.069 1972-73 (122) (72) (72) (12 (11) (5) (1)
Finland 337,009 303 906 H1 12 10 49 5
France* 547,026
German D.R. 108,178 1972-73 4000 6000 50 80 70
Germany/ F.R. 248.,577 Total about 10..,000
Greece 131,944 1972-73 82 596 88 83 21 10 80 260
Hungary 93,030 1972-73 155 2940 25 16 3
Iceland 103/000 1972-73 3 5 3
Ireland 70,283 1972-73 5 50 6 12
Israel 20,700 1972-73 1385 2700 300 3000 2200
Italy* 301,225
Jordan 98,060 1972-73 156 156 30 130
Lebanon 10,400 1972-73 325 25 1 1 325 25 50
Luxembourg 2,5-86 1972-73
Netherlands 401 84-4 1972-73 7323 8990 6260 8708 1701 2176 900 900
Norway 324,219 1972-73 800 100 30 25 138 26 39 1
Poland 312,677 1972-73 258 713 28 72
Portugal 92.,082 19.72-73 37 80 3
Romania 237,500 1972-73 2043 2043 868 532
Spain 504,782 1972-73 1978 282
Sweden 449,964 1972_73 365 35 35 35
Swi tzerland* 41,288
Syrian A.R. 185,180 1972_73 74 161
Turkey 780,576 1972-73 1000 350 185 200
U.S.S.R. '* 5,571,000
Uni ted Kingdom 244,046 1972-73 ,. 1200 ,. 100 none '. 200
Yugoslavia 255,804 1972-73 686 38 81 26 81 26
*Information not received
CHAPTER 5
COSTS AND MANPOWER FOR OPERATION OF HYDROMETRIC NETWORKS
Explanatory notes
5.1 Source of information
The information was collected on sample representative regions from 19 WMOMember countries. Two countries also supplied information an the entire country.Four countries supplied intofmation for the entire country only. The data arecompiled in two tables.
5.2 Contents of tables
Table 5~1 gives the names, characteristics, capital costs and costs ofmanpower, equipment and transport. To give an indication of the general level ofdevelopment of the area concerned, the annual income per capita is also included.The actual manpower used to operate the hydrometric network in each of the sampleregions listed in Table 5.1 is given in Table 5.2. The two tables should thereforebe considered together. In connexion with Table 5.1 it should be noted that allsums of money which were given in local currency aTe converted to U.S. dollars atthe UN rate of exchange as at 1 January 1974, when the information was collected.
TABLE 5.1 - ESTIMATED COST FOR OPERATING HYDROMETRIC NETWORK
Area AnnualCost as % of
AnnualPopulation No. of budget per
annual budge·tincome
Country Sample regionkm
2x 10
3(in thousands)
Climate Topographystations station equipment and per
US$manpower
maintenance capitaUS~
(1) (2) (3) (4) ( 5) (6) (7) (8) (9) (10) (11)
Australia Pilbara 244 30 semi-arid mixed 29 3,783 71.5 28.5 3,190
------------- ----- ------- ----- ------- - - - -- ----- ---- --_._--- ----Victoria 228 3,502 semi-arid mixed 486 1,530 74.4 25.6 8,032
Canada Columbia river 75 160 semi-humid mountainous 135 963-l(' 88.5 11.5 9,000------------- ------ ------- ----- ------- ----- ----- ---- ------- ----
Churchill river 1.8 30 cold hilly 19 2/105 62.0 38.0~,~O~ _ \------------- ------ ------- ----- ------- - - --- - ---- -------
Mackenzie 1,250 27 semi-arid flat 56 11,607 34.6 65.4 *·x·
------------- ------ ------- --- -- ------- ----- ----_. -------New Brunswick 75 650 semi-humid mixed 91 2,205 62.8 37.2 2,793
France Dordogne 24 " .. mixed 77 1,160* 82.1 17.9 "11"*
------------- ------ ------- ----- f------- ----- - ---- -- -- ------- ----Loire-Bretagne 155 10,340 humid mixed 12 76' 52.4 47.6 1,630
------------- ------ ------- ----- ------- 1------ ------ ---- ------- ----Seine-Normandie 100 18,000 semi-humid mixed 73 1,489 '* '* ..
------------- ----- ------- ----- ------- ---- ----- ---- ------- -- --Whole country*** 500 50,000 semi-humid mixed 230 1,796 70.0 30.0 "l!""l<
Germany,F.R. Bayern 70 10,489 semi-humid mixed 1,604 456* 69.4 30.6 4,104
------------ ------ ------- ----- ------- ----- ------ ---- ------- - ---Schleswig-Holstein 16 2,500 semi-humid mixed 567 678"](- 97.1 2.9 2,985
Greece Acheloos river basin 3.6 " wet mixed 9 2,864* 84.0 16,,0 ,,,'------------- ----- ------- ----- ------- ---- ----- ---- ------ ----
A1iakmon river basin 5.0 ,,,, semi-humid mixed 17 658* 81.7 18.3 ..Guyana ** 10 560 wet mixed 21 474 88.8 11.2 89
Hungary Fehert6/Majsa 0_3 .. semi-arid flat 47 174* 91.2 8,,8 ,,,'------------- ----- ------- ----- ------- 1------ ------ ---- ------ -- --
Whole country 93 10,500 semi-arid mixed 2,595 69 55.3 44.7 1,205
* Annual budget assumed to be the total of manpower and transport etc. costs** Information not received*** Network ~perated by Electricite de France only
~
~.
~.
Table 5.1, (contd.)
Area AnnualCost as % of
Annual
Country Somple regionkm
2x 10
3 Population Climate Topography No. of budget per annual budget income{in tho'Usands) stations station equipment and per
US$ manpower maintenance copi toUS$
(1 ) (2) (3 ) (4) (5) (6) (7) (8) (9 ) (10) 11
Indio Berhompore (one of 6 34 19,620 humid flat 35 3,523 86.3 13.7 66regions of Ganges)
----------- -- --- ------- ----- ------, ----- ------1--- -- ------- ----Dehradun (one of 6 116 30,000 semi-humid mixed 33 2,998 84.3 15.7 63
regions of Gangea)
Israel Northern and Western 1.1 82 semi-arid mixed 12 I, 587iC• 62.5 37.5 ••drainage of LakeTiberias
------------ ----- f----~--- ----- - ------ ----- f------1---- ------ ---Negev Mts. and Arava 7.9 38 arid mountainous 11 4,702* 54.5 45.5 ••
Valley
Japan The Upper Tone river 51 I, '700 humid mixed 38 309 64.4 35.6 2,036f------------. ----- ---~--- ----- ------ ----- 1------ ---- ------ ---
Yodo river basin 8 7,950 humid hilly 96 149 62.5 37.5 2,570
Southern Whole country 151 5,000 semi-arid mixed 729 1,110 40.3 59.7 ••Rhodesia
Sudan Northern region 1,600 10,000 semi-orid flot 83 3,981 82.6 17.4 115f------------ .~-----I----~-------- ------ ----- 1------ ---- ------ -- _.
Southern region I 800 4,000 semi-arid flat 221 6,501 60.0 40.0 115
Sweden Whole country. 450 8,040 humid mixed 708 241 90.2 9.8 3,304
5wi tzerland Whole country 41 6,300 humid mixed 263 4,244 64.6 35.4 5,000
Thailand Kanchanoburi 30 250 semi-humid mixed 9 937 58.8 41.2 ••f------------ ----- ------- ----- ------ ----- -----f---- ------ ---
Northern region 30 4,000 semi-humid mixed 85 2,353 50.0 50.0 150f------------ -- --- ------- ----- ------ ----- 1------1---- ------ t-----
Western region 48 1,517 humid mixed 41 1,294 62.1 37.9 198
United Kingdom Whole country 244 56.000 semi-humid mixed 1,090 1,208 50.9 49.1 2,186
* Annual budget assumed to be the totol of monpower and t~ansport etc. costs** Information not received
~
t;
Table 5.1, (cantd.)
Area Annual Cast CIS %of AnnualPapulation No. of budget per annual budget
incomeCountry Sample region km2 x 103 (in thousands)Climate Topography
stotians station equipment and perUS$ manpower maintenance co pi ta
US$
(1) (2) (3) (4) (5) (6) (7) (8) (9) (10) (11)
Upper Volta Whole country 278 5,889 arid flat 35 283* 94.3 5.7 52
U.S.A. S.E. (Tennessee) 109 3,924 humid mixed 364 1,168 57.2 42.8 3,300
r----------- ------ -- .... ---- ----- ------ ----- ------ ---- ------- ----State of New York 128 18,241 humid mixed 1,159 651 49.7 50.3 4,797r----------- ------ ------- ----- ------ -..,..--- ----- ---- ------ ----
State of Houston 16 1,621 humid flat 748 294 68.2 31.8 3,6741------------------ ------- ----- ------ ----- ----- ---'----- ----
State of Idaho 216 713 semL-arid mixed 776 812 58.7 41.3 3,634
------------ .... --..,.-- ------- ----- f------- ----- ----- --- - -_._---- ----State of New England 172 11,598 semi-humid mixed 41 732 83.3 16.7 3,000------------ ----_ .... -------- ----- f------- ----- ------ ---- ------- ----
Columbia river basin 568 6,000 semi-arid mixed 430 1,000 75.6 24.4 ...semi-humid
U.S.S.R. Byelorussian S.S.R. 271 9,002 wet mixed 189 1,631 87.0 13.0 2,011
* Annual budget assumed to be the total of. manpower ~nd transport etc. costs** Information not received
....t:::
TABLE 5.2 - MANPOWER USED TO OPERATE HYDROMETRIC NETWORKS
No. of personnele;mp!oved
Types of personnel
Country Sample regionfield*'
operationoffice**
operation
observers
number I years ofeducation+
technicians
number I years.ofeducot~on
seniortechnicians
I years ofnumber educotion i
professionals
number I years ofeducotion+
-------------------------- -----2~--"-- ------------1----~7--1~6----Aliakmon river basin
Guyana Whole country 14 2 13 10
Hungary Fehert6/Majsa 6
-~~~~~-~~:~;~~------------~----;79--~--1---~-1;-----1---;5~--1-----~----
Germany, F.R.I Bayern
75 I +++
(1 )
Australia
Canada
France
Greece
(2)
Pilbara
Victoria
Columbia
Churchill river
Mackenzie
--------------------------New Brunswick
Dordogne
Loire-Bretagne
Seine-Normandie
Schleswig-Holstein
Acheloos river basin
(3)
6
40
73
5
13
84
62
6
79
391
374
14
(4)
1
15
7
2
1
19
7
(5)
2
65
3
50
6
70
350
350
9
(6)
10
9
+++
+++
7
+++
+++
+++
6
(7) (8) (9) (10) (11) I (12)
5 12--- --------- ------- ---------- ------- -----------1
52 10 3 16
6 14 1 15 I 16---------- ------- ----------f-------- -----------
2 14---------- ------- ---------- ------- -----------1
19 14 1 16--- ---------- ------- ---------- ------- -----------6 13 2 15 1 17
9 10 2 12 3 17--- ----------f-------- ----------f-------- -----------,1 +++--- ---------- ------- ----------r-----~- -----------18 +++ +++
.. -30 11 19 12 11 17---- ---------- ------- ---------- ------- -----------124 5 7 9
3 12 1 15--------- ------- ---------- ------- -----------1
3 12 1 15
2 12 1 13
2~-+--~~---1 12 1 17
------- ---------- ------- ----------15 13 2 19
~
~
Table 5.2, (contd~
No,. of' personnelType of pers?nnel
emoloved
Country I Sample region I observers technicians seniorprofessionalsfield* office** technicians
operation operationnumber years of number years of number years of
number years ofeducation+ education+ educotion+ education+
(1) (2) I (3) (4) (5) (6) (7) (8) (9) (10) (11) (12)
Indio Berhompore (one of 6
----~~=~~:~-~~-~::=~~~--__l----=~:-_---l-_-_-==______l-_===--l-----:----l---==--l-----~----t-------J----------l ____::_l_____=~____Dehradun (one of 6
regions of Ganges) I 163 I 23 I 123 I 5 I 10 I 8 I I I 53 I 14
Israel I Northern and Westerndrainage of LakeTiberias 5 1 ___--___l__________l____=__l____ ==____ l____~__l_____=~___l_____=_l_____=:____,------------------------- ------------- ------------
Negev Mts. and AravaVolley 4 1 4 14 1 16
Japan I The Upper Tone river 436 215 1++ 167 2++ 54 3-<+
------------------------- ------------- ------------ -------- ---------- ------- ---------- ------- ---------- ------- -----------Yodo river basin 270 38 250 2++ 2l 3++ 37 4++
Southern Whole country 115 11 80 4 32 9 4 11 10 15Rhodesia
Sudan Northern region 138 23 75 _____~____l___==__l_____~____l___=~ __J_____~~___l____::_1_____::____------------------------- ------------- ------------ --------Southern region+++
Sweden I Whole country 706 7 700 +++ 7 I 10 I 3 I 13 I 3 I 16
Swi tzerlond Whole country 234 32 210 +++ 32 I 13 I 9 I 15 I 5 I 18
Thailand
~~~~~~~~~~~~~~~~:~~~~~~~~j~~~~~~~~~~~~~~~~~~~~~~~~~_-~~~~~~~~~~~~~~~~ ~~~~~~~t~~~~~~~~~t~~~~~~~j~~~~~~::~~t~~~~~~~t~~~~~~~~~~~Western region+++
UnitedKingdom Whole country I 70 I 30 I I I 60 I 14 I I I 40 I 16
~...00
Table 5.2, (conid.)
No. of persornnelenjploved
Type of personnel
field* office**operatiori operation
(3) (4)
26 3-25 I 1
observers
4 6 1 14 4 18
13 13 4 13 4 19---- ---------- ------- ---------- ------- -----------26 14 2 15 11 17--- ---------- ------- ---------- ------- -----------6 13 4 14 9 17--- ---------- ------- ---------- ------- -----------5 +++--- ---------- ------- ---------- ------- -----------4 14 14 16
technicians
(12)
professionals
(11)
number I years ofeducation+
(10)
seniortechnicians
(9)
numberl years ofeducation+
( 8)(7)
number I years,ofeducabon+
3
2++
(6)
years ofeducation+
5
20
(5)
number
1
11
5
17
19
28
(2)
Sample region
State of New York
State of Houston
Columbia river basin
Whole country
S.E. (Tennessee)
State of New England
(1)
Country
United States
Upper Volta
U.S.S.R. +++ Byelorussian S.S.R.
*Including some office operations
**Including some administrative operations
+Average number of years of education including prilTior)/ education
++Minimum number of years of education including pri'mary education
+++ - Information not received
~
~
CHAPTER 6
HYDROLOGICAL DATA BANKS
Explanatory notes
6.1 Contents of tables and source of information
This chapter provides information on facilities for hydrological datacollection, processing and archiving which was supplied by the Members. For eachWMO Region, the data are presented in three tables. The first table concerns theexistence of computer facilities and national hydrological data banks; the secondcontains some details of the status of collection and automatic processing of hydrological data, and the third one relates to archiving of hydrological data. At theend of the chapter, tables (6.7.1, 6.7.2 and 6.7.3) provide regional and world totalsfor each of these three types of information. The notes which follow give thedefinition of the terms appearing in the tables and' describe the contents of thetables.
6.2 Hydrological data
"Hydrological data ll implies data related to surface water and groundwater(levels, flows J suspended sediment, ice cover, physical qnd chemical quality ofwater, etc.).
6.3 National hydrological data bank
6.3.1 National hydrological data bank is not necessarily one data bank controlledby one agency at one site. If the related data in different banks can easily beobtained, transferred, and utilized using standardized computer programmes and formats,etc., one could consider that a national data bank exists at a certain level ofdevelopment. A complete national hydrological data bank would be made up of statisticscovering all hydrological parameters for all parts of a country and would permit anypotential user to easily extract and treat these data without extensive manipulationaimed at making different formats compatible for computer treatment. With respect toTables 6.1.1, 6.2.1, 6.3.1, 6.4.1, 6.5.1, 6.6.1 and 6.7.1, three types of nationalhydrological data banks are defined as follows:
Centralized - Ideal data bank as described above
Co-ordinated - Several data banks covering most hydrological parameterswith some type of co-ordinating action between banks oragencies
Limited A centralized data bank but covering only one or two of themany hydrological parameters.
151
6.3~2 In the above-mentioned tables the column reporting on the number of agenciesindicates the number of agencies listed by Members involved in hydrological datacollection. In parenthesis is indicated the number of agencies for which informationwas received concerning the status of hydrological data collection, processing andarchiving. The two subsequent tables for each region (6 .••• 2 and 6.... 3) includethis information for the number of agencies indicated in parentheses only.
6.4 Digi tal form
Data recorded on a standard medium such as magnetic tape, paper tape andpunch cards, ready for automatic treatment by computer are considered to be indigital form. These do not include data in numerical or graphical form which needto be converted either manually ar automatically into computer compatible format.
6.5 Digital archives
Digital archives consist of magnetic tapes, magnetic discs, punch cards etc.Hydrological yearbooks and registers are not considered as part of digital archives.
6.6 Basic and analysed data
Basic data are those observed in the field: for example, water levels,stream velocities (including streamflow), water quality parameters as determinedfrom laboratory examination of field samples or as recorded by an automaticrecorder, etc. Data such as monthly and yearly averages, duration curves and unithydrographs are termed as analysed data.
6.7 Catalogues
A catalogue contains information regarding the data available from adigital archive for past and present hydrological observing stations. The informa-tion usually includes period of record, type of data, location, formats (standardmedium), etc. The data themselves do not normally form a part of the catalogue.
152
TABLE 6.1,1 - NATICN,Ll.1. HYDROLOGICAL DATA* BANKS - ORGANIZATION Al'-D FACILITIES
REGION I (AFRICA)
~tate/ ~ g Computer Number of datao ''''i processing
collecting agencies NationalInter agency co-ordination~
reported hydrological" " and and plans for futureterri tory g ~ Number described data bank*>- • archiving" in fJCiI'entheses
Algeria 75 exists 2(2) co-ordinated
Angola**
Benin**
Botswana 76 none 2(0) none No immediate plans
Burundi**
Canary Islonds**
Cope Verde**
Central African Rep~*
Chad 75 eXists+ 1(1) limi tedCollection and archiving doneby O~STCM. National Servicebeinc created
Comoros**
Congo 73 eXists+ 1(1) limi tedCollection and archiving doneby ORSTOM
Egypt**
IEquatorial Guinea**
Ethiopia 75 3(1) Data centre established, banknone none
beinc plannedFrench Dept-. of 74 exists 4(1) limitedReunionFrench Terr. of 73 eXists+ 1(1) centralized
CoIled ion pnd archiving doneAfars and Isso b ORSTOM
Gabon**
GambiaH
Ghana*-*
Guinea**
Guinea Bissau**
Ivory Coast** .
Kenya 73 exists 1(1) none
Lesotho 76 none 2(0) none No plans for using computers
Liberia**
Libyan Arab Republic 75 none 0(0) none Being planned
Madagascar 73 foreseen 1(1) Automatic treatment ofnone
surface flo", nlanned
Mala\~i 73 exists 3(3) none
Fot footnotes, see end of table.
Table 6.1.1, contd. 153
~ g Computer Number of dota
Statelo ,_
processing collecting agencies NationalInter agency co-ordination
terri tory k 1:: ond rel'Jorted hydrologicaland plans for futureg ~ archiving Number described data bank*>- •
in oarenthesesk
Mali**
Mauritania**
Mauritius 75 exists 2(2) co-ordinated
Morocco 75 exists 3(2) limi ted
Mozambique 73 exists 1(1) none
Namibio**
Niger 73 exists+ 1(1) Collection and archiving donenone bv ORSTOH
Nigeria 75 none 14(1) none Planned
Rwanda 75 none 1(1) none
Senegal 75 none 1(1) none Planned
Sierra Leone 73 none 2(0) none No plans for using computers
Somalia**
South Africa*** 73 exists 4(1) none
Southern Rhodesia**
Sudan**
Swaziland**
Togo 75 + « Collected by DRSTOMnone none
Tlmisia**
Uganda 73 exists 2(2) limi tedExtensive plans for automaticcollection, .pro.c.essing., st.orageand retrieval
U.K. (Seychelles) 75 none 0(0) none No plans
Uni ted R'i!Public ofICameroon**
United Republic of 75 exists 1(1) limi tedTanzania
Upper Volta 75 exists 4(3) limited
Western Sahara**
Zaire 75 exists 2(2) none
Zambia 75 none 2(2) none Plans for 1976
<
•••••+
See Explanatory Notes.Information not received•Suspended by Resolution 38 CCg-VII) from exercising its rights and enjoying privileges as a Member of WMO,Computer facilities may not be available in the ·country itself,
~
~~
T.A:BLE 6.1.2 - RY!lROLOGICAL DATA COLLECTION liNJ) AUTOMATIC PROCESSING
REGION I (AFRICA)-J.
ITydr,- l-=l~~
HydrologicalweteorolQ~ical _
State / ""Water Flows Grou.nd.- ~Jater Suspended Other Pre~;Pita- Ev~~oration! Remarks
territory g~ levels wate:r clUa.litv Sediment :Lon
• .b , a b , • b , a b , a b , a b , a b , a b ,1geria 5 yes 0 yea yea 0 yea yes 0 yas ye' 0 y.. yea 0 yea - - - ya. 0 y" ye. 0 C
lAngGlaolt IeniJ¥'
otswana 176 yes 0 0 y.. 0 0 yea 0 0 yea 0 0 yea 0 0 y.. 0 0 yea 0 0 y.. 0 0
Iurundi*
Canary Islands'"- - ._~
~C1pe Verde'" IIentral ifrican
nellublic
had 75 yes 0 y.. y.. O. ye, - - - - - - - - - - - - y" - - - - -
amaros *
ougohives I "eS _ 1ves-- 0 100 0 100 - - - - - - ~ - -_.-
J
-++++-H~......
'gypt*
~ql!atorialu~neo*
tbiopia 75 yes 0 0 y.. 0 0 - - - y.. 0 0 ye. 0 0 - - - y.. 0 - y.. 0 0French Dept. 74 - - - - - - - - - - - - - - - - 100of Reunion - - yee 100 y.. 100 00~~:nCh Territ.of
ara & lasa
abon * I Iambia* Ihana * I I,uinea*
uinea-]1 saau* Ivary Coast* Isnya :3 yes 0 10 y.. 0 1 o yes 0 - y.. 0 - yea 0 - - - - yea - - y.. - -
yes!~
Lesotho 6 yes 0 0 yes 0 o yes 0 0 0 0 0 yes 0 0 0 o Iv..1 0 0 .. 0 0
!Liberia *
Libyan Al:ab Rep. 75 - - - - - - - - - - - - - - - - - - - - - - - -~adaga8car 73 yes 0 0 y.. 0 0 - - - - - - - - - - - - - - - - -!Malawi 73 - - - - - - - - - - - - - - - - - - - - I - - -
-For footnotes, see end of table.
~~~
TABLE 6.1.2. n. 2-
fo~Hydrological Hydro-
meteorolo~ical
51:3o,:;e/ ~t "rate:t' Flows Ground- vTater Suspended Othe:rPrecipita- Evaporation Remarks
territory .0 levels water uali·tv Sediment tionP".
'" a b 0 a b 0 a b c a b c a b c a b 0 a b c a b c
~li oil-
-j&uri tania oil-
Mauritius 75 yoo - - y.. 20 30 yes - - ye, - - - - - - - - yea - - ye, - -
Morocco "(5 ye, y's $0 y" ,yea 90 yes y,. 100 - - - - - - - - - y•• 0 100 y•• 0 0
/Mo20ambique n y.' 0 - ye, 0 y.. y" 0 - yea 0 - yea 0 - - - - yea 0 - ye. 0 --
Namibia*
iger 73 ;)"e8 0 30 yea 0 30 .,- - - - I - - yea 0 - - - - yoo 0 100 yo. 0 -
Nigreria 75 ~res 0 0 ya, 0 0 yoo 0 0 no - - no - - y., 0 100 yo. -0 0
Rwanaa 75 ye. 0 0 yoo 0 0 no - - no - - yeo 0 0 - - - y.. - - y., "'" -Senegal 75 - - - - - - - - - - - - - - - - - - - - - - - -Sierra Leone n - - - - - - - - - - - - - - - - - - - - - - - -
Somalia *
South Africa** 73 yes 0 0 y•• 0 75 yea 0 • y.. 0 0 ye, 0 0 - - - yes - - y.. - --SOUth~rn .
IRhodesia'"SW"oziland':'
Sudan*
ogo 75 - - - - - - - - - - - - - - - - - - - - - - Org~~f~,ed
l'unisia
ganda 73 yoo 0 50 y.' 0 50 y.' 0 - - - - y.' 0 - - - - yeo 0 - y.. 0 -fU'.K.
75 - - - - - - - - - - I~YChelles) - - - - - - - - - - - - - -m"feal<.ep" of'
I iI
-i-- ICame.rQQn** I -United Republic
75 yeo 0 - yeo 0 - I no y.. 0 - yoo 0 - - - - yea 0 - yes 0 -of Tanzen'
pper Volta 75 y•• 0 ,.e, y•• 0 ya, y.. - - no - - no 0 - - - - y•• 0 ya. yesl 0 ...Western.5ahara** ._. ~.aire 75 - - - - - - - - - - - - - - - - - - yea 0 - ya. 0 -
ambia 75 ye. 0 0 ye, 0 0 yes 0 0 y.. 0 0 yoo 0 0 - - - yeo 0 100 yes 0 0
* Information not received** Suspended by Resolution 38 (Cg~VII) from exercising its rights and enjoying privileges as a Member of WHO.a - Whether data are collec~ed by ogency(ies) indicated in parenthesis in Table 6.1.1b - Percenroge of data recetived from the field in digitcl form ready for automatic treatment. When only "yes" or "no" response
is available, "yes" is shown arid "no" is shown as "0"c - Percentage of date processed using automatic methods and computers. When only "yes" or "no" response is available, "yes" is
shown and "no" is shoun as "0"Information not i~dicot~d or not aFplicable
TABLE 6.1.3 - HYDROLOGICAL DATA AHCHIVING
REGION I (AFRICA)
RemaJ:'ks
Qatasupply
GhE.rgEfor
..:;IIo
-~
o~
p:Jata1iistri!;luted
Cata109'"..le
I·1 ]
I ~I~, :::j !,r-;o rn> -,~ A
(mo) i (IllO)~•o~
l~~
o-,rn
~
§.,-~
~ooo~
It:,P'€-+-----;-re~uencyITg2-6f
Digital.archives wi:" of ·le:::est.5 of" of total data"" 11da ~p-dE.tingld2.ta~ I Ii.~ c ," 'o • 0Q) r-l~' .....
~~ ~ 'd ~
b j ~ l' ]·ffi ~I-< I-< III I:l ..... <ll S .....o III :;c ;:::I ,-oj Pl·.... 0Q) "'"' 0 0 til 01 <d Q)
>- ~ &: ~ & gJ.: &:
I I
State /territory
Algeria yes' yas lyea yes ye. yes ~yes ye~es 0_ 6 yealno ye e. so
y.Botswana l7a - I -I - I - l - ! 15 I 15
IAngola" I I \ I I \--l-l-l I I I I I I I I ' Ir;,~nin" II "TTl I I- I I I TTl 1----1 I-IjBurundi **Canary hland,-- I I I I I. I I I too+ I I I-f-: I I I I
Cape Verde**
Central African**,,'h1<
Chad
ComoroG.
5bres ye' ye e. 6-12 24- brea i ve " ~
g;
-I \Congo ** - It+=-- - ~yesl ;1e_1- 1 no : IEIro--'----_ J LLL...-.L- __ I..
II_
lEquatoriol Guinea** 1 I ! \ I __ 1 I
Being plannedno
no
-1-IYo95 ~yesl yesi -
I I
11_ 6y.
\
100110014' -
--\\-+\- ,.._--,._-
rench Dept.of Reunionrenc~TeJ:'ritory 0
Afa:rs and 1sso **
Ethiopia
Gabon*""
Fa-nibion
'.._LGhana**
IGuinee.**
GUinea-Bissau**
yes Iyes! yesl -
Ivory Ooast**
IKenya.
Lesotho
31
17,
10 I 10 I -
01 01 0 o o o oy.esiyes
yeSI ye
6-12
1
24-
1
y.. not YIaS~eSl "..
'0 r~78~~97~Of~~e~dcoveringthe period
Liberia **Libyan Arab Rep. - i Being planned
For footnotes, see end of table
~ 6.1.3. ~.'2
Remarks
'"••'"~
o~•,:g
'"•~i:'0
"~•'0A
•~
':l~
'0
"1;;
(mo) I (mo)
'"•o I~'0 ~• •. "~ ~
]
""oIi'~
TyPe lFreOUenCY!_.j,ge of ChargeDidi;a.l ArcJ:.liveI6 ' of of latest for
05 ~i'-of total data ili i::tata !up-dating, data data
t .:III!! supplyo • 0III ,...1 >l ...-l
"': ~ '0-:~ ql Ill+> of"
"0..:1 .a t" 'g§"¢.!-I III .: ...-l III EI -.-I
'" ([l )= ;:l ..-< >:too,", tl
g ~ ~ ~ ~ ~~ ~>-:;. l'=< 0 ~ I7:l o::l p.,
Stll:/;;cjterritlnY
M4dagascar Foreseen
Malawi i'~~ -
Mali'lI'i!-
MalU"i tania ....
Mauritius 30 '... il yeS/ysa 6-12111 2Lil no ;reaIYes I no
Morocco 60 90 I 100 100 ye~yeel 0 - 6 o - 6!yeslno I yetEYss no
MOlla:mbique
Nanibia**
Niger 30 100 ,e (, 12 - 12 - 241 no no
Nigeria 100 i 20 lye 1 - 1 - ;resina I ye~ea I yea
Rwanda '5' - no
Senegal ,os no
Sierra. :j:.eone No plane yet
So:taa1ia **~
"lS6iJtnAWca~ 75 I - I - I- I· I I I I ISouthern Rhodesi~;* I' - 1 -jl'96 - 0 6 I 0 - 6~~""esJ no II • i t !
i Swaziland**
Sudan .j(.*
Togo t-'- --Data co1lectf,td and archived by ORS'l'OM
'l'p,ieia**
Uganda 1'131 50 50 yesH - 6 - 12 o - 6 ~yeB i no ~ ysslfes no
U.K. (Seychelles)
UriilecrRep.of Cameroon**(Jni ted 0 Repub ic of _ I. I _ yeaTanzanJ.a
No plans
Upper' Volta 'lOa 1100 i 100 I - lyeel ,-e8112 - I 0 - 6 I no] no
Wes tern sanora**
Zaire
Zambia
~-'-1--+LI-+--I-~.I~r~ 6 ~ 12124 ~ !~ ,'-j
******
When only "yes" or "no" response is available, "yes" is shown and "no" is shown as "0"Infonnation not receivedSuspended by Resolution 38 (Cg.VIJ) fir'om eXr!J>cising its rights and enjoying privileges as a Member of WMOInformation not indicated or not applicable
158TABLE 6.2.1 NATIONAL HYDROLOGICAL DATA* BANKS
REGION II (ASIA)ORGANIZATION AND FACILITIES
Computer Number of data-
'" collecting NationalState / ~ . processing
0°" oqencies reported hydrological Inter_agency co-ordinationte!rri tory ~ ondk k data bonk* ond plans fa< futureo 0 archiving Number described.0
in paronthesis>-.k
Afghanistail *
Bangladesh 75 none ** none UNDP assistance has been sought
Burma
China
Democratic Kampuchea
Oem. People' 5 Rep.of Korea
Democratic Yemen
Hong Kong 75 exi sts 2 (2) none databank planned
Indio 75 exists 4 (3) none plans exist to establish a notional....ater data bonk where all data woulbe processed, archived ond retrieve
Iran 76 exists 2 (1) none dato bank planned
Iraq 75 none •• none
Japan 75 exists many (1) none hydrological data call ected by manyorganizations and used on a district
basis
Ku_woi t
Lao Peo:ple '-sOem. Reo,
Mongolia
Nepal 75 none •• -none no plans so far
Oman
Pakistan
.Qata-r
Republic of Korea 75 none 2 (1) none planned for 1976
Saudi Arabia 75 none 1 (1) none
*** 73.Soc. Rep. af Vietnam none 3 (3) none
Sri Lanka 75 nOne 0 (0) none
Thailand 73 exists 3 (3) limi teddifferent agencies at
different stOQe~
USSR+ 75 exists many (mony) co-ordinated extensive plans for establishmentof complete hydrological data borl<
Yemen
••••••+
See explanatory notesInformation not rec~ived
Data for 173,809 km of the countryAlso included under Region VI (Europe)
TABLE 6.2.2 - HYDROLOGICAL OATA COLLECTION ANO AUTOMATIC PROCESSING
REGION .11 (ASIA)
HydrologicalHydro
meteoroloaicalState / " Water Ground- Weier Suspended Precipi ta-o Flows Other Evaporation• levels 'W.ater uoE tv sediment ticn Remarksterri tory >-
0 b c 0 b c 0 b c 0 b c 0 b c 0 b c 0 b c 0 b c
Afghanistan ..
Bangladesh 7 - - - - - - - - - - - - - - i- - - - - - - - - -Burma * ,
I
China * I I
Delll~~~atic ...Kern uellea
Dellll. People 's *Reo. of Korea
DemocraticYelllen •
Hong Kong 75 yes 0 100 00 0 0 ye 0 0 ye. 0 - ye 0 0 - - - ye, 0 3 ye, 0 28
India 75 yes 0 10 ye 0 10 0 - - yes 0 0 ye 0 0 - - - - - - - - -
Iran 7 yes 0 20 ye 0 20 - - - 00 - - 0 - - - - - 00 - - 00 - -
Iraq 7 - - - - - - - - - - - - - - - - - - - - - - - -
Japan 7 yes 15 J( ye 0 0 ye 0 0 yes 5 0 0 0 0 - - - ye' 15 10 00 - -
Kuwait ...
Lao People's *"Delli. Reo.
Mongolia *
Nepal 7 - - - - - - - - - - - - - - - - - - - - - - - -Oman *
Pakistan *
Qatar •ReJ;!ublic
7 Plannedof Korea - - - - - - - - - - - - - - - - - - - - - - - -Saudi Arabia 7 ye, - - ye - - ,yes - - ye. - - yo; - - - - - ye. - - os - -
For footnotes, see end of table.~
~
TobIe 6.2.2, contd.
HydrolpgicalHydro_
meteoroloaicalStatel k Water
FlowsGround- Water Suspended Other
Precipi ta-Evaporation RemarksTerritory a levels water ualitv sediment tion•>-
a b c a b c a b c a b c a b c a b c a b c a b c .
Soc. Rep. of3 yes 0 0 0 0 0 0 0 0 0 0 0 0 0 0Vietnam"'''' ye ye yes ye, - - - ye' YI,s
Sri Lanka 175 - - - - - - - - - - - - - - - - - - - - - - - -
Thailand 3 yes y~s ye ye ye a - yeo a - ye' 0 - - - - ye, 80 yes - -USSR+ 175 y~s yes yes ye ye, ye n - - ye' yes yes ye' ye' "es es - - ye, - - yes - - Note 1
Yemen"
No'tes
* Information not received** Data for 173,809 km2 of the country+ Also included under Region VI (Europe)a - Whether dato ore collected by agency(ies) indicated in parenthesis in Table 6.2.1b - Per~entage of data received flL'om the field in digital form ready for automatic treatment. When only "yes" or "no" response is
available, "yes" respOnse is shown and ~Ino" response is shown as "a"c - Percentage of dato processed using automatic methods and computers. When only "yes" or "no" response is availalbe, "yes '! response
is shown and "no" response is shown as "0"1 - Mcuh of automatic collection and treatment on on experimental basis. Data c~llected regarding ice phenomena
Information not indicatQd or not opplic~ble
~
g;
TABLE 6.2.3 - HYDROLOGICAL DATA ARCHIVING
REGION II (ASIA)Ty,e requencylAge of Cata- ata ChargeDigi tal archives of of latest logue ist::i- for
c %of total dcto~ data p-dating data utea data" supply" "Statel0, m 0a. ~ " ~ " '" Remarksterri tory• m • ~ "0 (mo) (mo) •" > ~ ~ • "" • ~
to, .% • .~ ~ ~ '" ~ " '"," ~ c "" • • ,0 ,0 I ~'" ~ c • a. " m • ~
" " m " "-• E ~ 0 0 " ~ " 0 "• > " n a. "" 0 Po ...... ~ ~ ~ ~ ~
0~ 0 0 • .~ • • " • • m m •• ~
~ " & ' . " ~ • .!;i -" "" • .!;i>- '" "~~ '"
,
" A "Afghanistan**
Bangladesh 17' - - - - - - - - - - - - - - - - Proposed
Burma **
China**
Democratic ..,Kampuchea
Dem. People I s **Rep. of Korea
••Democratic Yemen
Hong Kong 100 - I - - - 6 28 yes yes o - 20 o - 2 no - yes ye no
Indio 101 10 - - - - - yes - - 12 - 2 no - yes ye no
Iran 20 20 - @ 0 0 o yes yes 6 - 12 6 - 1, no - yes ye no
Iraq - - - - - - - - - - - - - - -, -Japan 10 - - 10 yes yes 12 - o _ 6 es yes yes ye yes Many organizations
Kuwai t *.."Lao People's **
Oem. Reo,
Mongolia •• ,J
Nepal - - - - - - - - - - - - - - - -Omon ••Pakistan ••Qatar ** I
Republic of V, - - - .:L' - - - - - - - - - - - Plannned for 1975Korea
For footnotes, see end of table.
~
'"~
Table 6.2.3, (eootd.)
Type requencYI~ge of Cata- ata Charge I ' -Digital archives
'" %of total aata *of of ],atest logue jiistri- for ic data p-dating data uted
Oata I- ~ supply..I~ "• 0
'"State / ~ .. '" "" • • '" 0(mo) (mo) • Re~afk5> '" ~ " ," • '"Terri tory • " .'" '" '" '"
~ " '"0 "', ", ~ c ~ " • .c .c •'" '" c • p, " • " ~ •
" " • " ~ • e ~ 0 0 ", ~ " 0 ",,0 • > " ~ P,O" 0 P, 0" ~ '" '" ~ ~
• '" 0 0 " .~ • " • m " • •~:11 ~ " & ' . " ~ " ~ .':; 0" m
~ ~ ~~ '" , " R "Saudi Arabia - - - - - - - - - - - - - - - no
S~f'V~:~hom*H - - - - - - - - - - - - - - - -Sri Lanka
I Hyd~ologi,~ci. dd~ti, , '- - - - - - - - - - - - - - - - arc i yes being.,..sto',rt;ed "
Thailand 10 10 - - - 80 - ye yeo 12 - 12 - ye,, ye ye ye, no
USSR+ 7 ye' 100 - 80 - - - - ye' 12 - 12 - ye' no ye ye yes,
Yemen ••"
~
R;
••••••+ -
When only "yes" or "no" response is available, "yes" is shown arid "no" is shown as "0"Information not receivedData for 173,809 km2 of the countryAlso included under Region VI (Europe)Information not indicated or not applicable
TABLE 6.3.1 - NATIONAL HYDROLOGICAL DATA BANKS
ORGANIZATION AND FAC1LITIESREGION III (SOUTH AMERICA)
163
~'"Number of data
Sto~e/00 Computer collecting agencies'. National"~ -processingTerritory ok hydrological Inter agency co-ordination." ond Number described><gj- data bank** and plans for future
k Clrchivinq in oorentheses
Argentina 15 exists 3(3 ) co-ordinated
Bolivia ..Brazil 13 exists 4(1) none A hydroloqical data bonk with
capacitr TO centralize allnetiana data is underconstruction
Chile 15 exists 3(3) none National data bank planned
Colombia 15 exists 1(1) centralized
Ecuador 13 foreseen 4(1) none Automatic treatment and archivin!2' fo ....e~een in near future
br~nch Dept. of 15 exists 1(1) centralized Collection and archiving doneu~ana " Anom"
••Guyana
Paraguay J 15 foreseen 1(1) none Combined service beingconsi-dered
Paru 73 foreseen 1(1) none Automatic treatment" and archivinu nlanned
Surinam 15 exists 3(2) oentralized Not yet in fulloperation
Uruguay 15 ' foreseen 1(1) none Studies for the or~ation of anationFl.l organization to 001:1,-lect, treat and store hydro-lodeal data
IVenezuela **
*SeeExplanatory notes
**Informotion not received
TilLE 6.3.2 HYDROLOGICAL DATA COLLECTION AND AUTOMJTIC PROCESSINGREGION ill (SOUTH AMER!C.A)
~
C>.,-
Hydrological Hydro-meteorolosrical
STATE/ " Water Ground- Water <;)uspended Precipita';'Evaporation0 Flows Other. Remarks• levels water cuali ty Sediment tion
TERRITORY >-a b c a b c a b c a b c a b c a b c a b c a b c
Argentina 5 yes 0 50 yes 0 60 yee 0 ;0 ye 0 60 yes 0 85 yes - .. ;'{8S .. 80 yos - - .L IBolivia * i:
Brazil 73 yes 0 yos yos 0 yos yes 0 - os 0 - yes 0 - - - .. yee 0 yes yes 0 -Chile 75 yes 0 80 yes 0 95 yes 0 100 es 0 90 yes 0 80 • 0 0 yos 0 - yos 0 - f' 't::tow COUIsesyes
Colombia 75 yes 0 100 yes 0 100 - .. - os 0 a yes 0 0 - - - yee - 0 yee .. 0
Ecuador 73 yee 0 - yos 0 - no 0 - " 0 - yes 0 - - .. .. yes 0 - yee 0 -French Dept. of
/75 es 0 100 yes 0 100 no 0 - os 10 - yos 0 - - - - yos 0 o. yos 0 ..Guiana
Guyana
Paraguay > - - - .. - - - .. .. - - - - - .. - - .. - .. - - - -Pe= 73 - - .. - - .. - - - .. .. - - - .. - - - .. - - .. - ..
Surinam 5 yes 1 75 yes 0 95 no - - os 0 80 yes 0 0 .. - - - - - - - -Uruguay 5 .. - .. - - - - - - - .. - - - .. - - - - - - .. - -Venezuela '*
Notes:
'* Information not receivedo - Whether data are collected by agency(ies) indicated in parenthesis in Table 6.3.1b - Percentage of data received from the field in digital form ready for automatic treatment. When only "yes" or "no" response is available,
"yes" is shown, and "nou is sho",n as "0"c - Percentage of data processed using automotic methods and computers. When only "yes" or "no" response is cvailobl'e, "yes" ~s shown end
"no" is shown as "0"Information not indicated or not applicable
TABLE 6.3.3 - HYDROLOGICAL DATA ARCHIVING
REGION II! (SOUTH AMERICA)
T3r~e I?re qUI!:J,cy ;'5: wi: :::a;"a- pate. Cha:rgeDi~ital archivea
~~~p. 'of la~e5t logue -ist;[°i- f:Jr
0%-of total data" ~'P-dating data utec "lata,- s'l:.pply
~
" "STATE /
0 • 0
'".. " ~ "• • • ~ 0 0 RemarksTERRITORY' " > ~ 0 • ~ (mo) (mo) • ~
'"• • .~ ~ ~ '".. "H > ... o 0 ~ • • p " 0
0 '" ~ o • P, " • • ,- 0 0
" 0 " "~• e ," 0 0 ... .. " 0 h
" 0 > " ... a. 'rl 0 P, ,- ~~ ~ ~ ~
• ~ 0 0 ~. 00 0"
0 d d 0 0 d0 d ~ " ~'5- ' . " ,. • " "
~ • "'" '" " " "'''' ~ ~ " < " " <
Argentina 5 50 60 30 60 85 eo - y,s yes 6 - 12 12 - 2 es no yes yes yes
Bolivia**
Brazil yes - - - - fes. - y,s y,s 12 - o -- 6 ,s no yes yes yos
Chile 80 95 00 90 - - - y,s yes 1 - 6 1 - 2 no no - -
001olll.bia 100 100 - 100 100 100 100 y,s yos 12 - 6 - 1 no no yos y,s yos
Bcuador - - - - - - - - - - - - - - - - Foreseen
Frencn Dept. of 100 100 - - - 100 - yes yes 6 - 12 o - 6 es no yes yes yos Rapid development in progressGuiana
Guyana** , ,
Paraguay 5 - - - - - - - - - - - - - - - - Being planned
Peru - - - - - - - - - - - - - - - - Planned
Surin..m 15 0 - 80 0 - - y,s - o - 6 o - 10 no no 'yes y,s no
lJruo!Uay, ~ - - - - - - - - - - - - - - - - Foreseen .
Venezuela **
.. When only "yes" or "no" response is available, "yes" is shown and "no" is shown as "0"** Information not received
Information not indicated or not applicable
....eoo
166 TABLE 6.4.1 - NATIONAL HYDROLOGICAL DATil' BANKS - ORGANIZATION AND FACILITIES
REGION IV (NORTH AND CENTRAL AMERICA)
'" ComupterNumber of data-
~ c collecting NationalStete / 0'" processin
~ oqencies reoorted hydrological Inter-agency co_ordinationterri tory H oadH 0 number described dahl banks*" and plans for future, etc.0 ~ archivin• •>- H ia parentheses
Bahamas 75 none 1 (0) none small islands - 00 permanent rivers
Barbados 75 none 1 (0) none 00 pIons Clnd none envisagedfor the future
Sri Ush Car. Terr. 75 none o (0) none
Canada 73 exists many (1) co-ordinoted proposal for overall interactivedato bank being examined
Colombia **
Costa Rico 75 exists 3 (1 ) none
Cuba**"
Dominican Republic 73 exi sts 2 (2) limited
El Salvador 75 exists 1 (1 ) co-ordinated hydrological and meteorologicalcomputer centre being organized
French Dept. of 73 exists 1 (1) centralized collection and archivingMartinique andGuadeloupe done by ORSTOM
Guatemala 75 exists 4 (4) co-ordinated ca_ordinated through a committee
HaiH**
Honduras 73 foreseen 3 (0) none planning for automatic processingand archiving now taking place
Jamaica 75 exists 1 (1) limited automatic treatment of streamflowdata is implemented (1974)
Mexico ••
Netherlands Antilles 75 none 0 (0) none national hydrologi col service doesnot existj no rivers or lakes, etc.
Nicaraguo**
Panoma**
St. Pierre and **Miquelon
Trinidad oadTobago 73 exi sts many (1) none
Uni ted States 75 exi sts 5 (3) co-ordinoted extensive plans for expansion ofautomatic processing t co-ordination
oad centralization
*See explanatory naie**Informotion not received
TABLE 6.• 4.2 - 'HYDROLOGICAL DATA COLLECTION AND AUTOMATIC PROCESSING
REGION IV (NORTH AND CENTRAL AMERICA)
Hydrological Hydro_meteorological
State / " Water Water Suspended Other Precipi- Evaporation Remarks0 Flo:ws Groundwaterterri tory :. levels uaH tv sediment totion
0 b c 0 b c 0 b c 0 b c 0 b c 0 b c a b c a b c
Bahamas 75 - - - - - - - - - - - - - - - - - - - - - - - -Barbados 5 - - - - - - - ~ - - - - - - - - - - - - - - - -British Carib. 75 - - - - - - - - - - -Territories - - - - - - - - - - - - -Canada 73 yes 0 10C ye, 0 100 - - - ye 0 9 yes 0 20 - - - ye' ye, - ye' 0 -
Colombia*
Costa Rica 75 yes 0 lOC . yesl 100 100 yes 0 0 ye 0 0 ye' 0 0 - - - ye 0 10 ye' 0 0
Cuba * i7~ ye
I0 100 0 100Dominican Rep. 0 10 ye - 10 ye 0 0 ye' - - ye - - - - - ye' ye'
El Salvador 7 ye 0 - yes D yes yes 0 - ye 0 - yes 0 - - - - 00 - - 00 - -French Dept. of
Martinique 7, ye 00 60 yes 00 60 - - - ye 0 - ye 0 - - - - yes 0 60 yes 0 -and Guadeloup:!
Guatemala 75 ye D 0 yes 0 100 yes 0 0 yes 0 0 yes 0 0 - - - ye, 65 40 yes 0 0
Hai ti *
Honduras 73 - - - - - - - - - - - - I - - - - - - - - - - - -Jamaica 5 yes 0 60 0 10C 0 0 0 0 0 0 0 toe . - - - - - ** Soilye ye ye'$ yes ye - moisture
Mexico •Netherlands 5 - - - - - - - - - - - - - - - - - - - - - - - -Antilles
Nicaragua *
Panama ..
For footnotes, see end of table.
>-g;
~
~
00
Table 6.4.2, (cantd. )
Hydrological Hydro-meteorological
" SuspendedState/ c Water Flows GroLindwate Water Other Precipi_ Evaporation Remarks•>- levels uoHtv sediment totionterri tory
c b c Q b c Q 6 c Q b c Q b c a b c Q b c Q b c
St. Pierre *,arid Hiauelan
Trini~~~ and 3 yes 0 - yeS 0 95 yes 0 -, yes - 0 y.' 0 - y.' 0 - ye, 0 - y.' 0 - ,
lobo a
United Stdtes 75 yes 80 90 ye , 80 90 ye 10 20 ye 101 100 ye, 0 80 ye, - - ye' 5 90 ye, 0 80
Notes:
* Information not receiveda - Whether data are collected by agenty(ies) indicated in parenthesis in Table 6.4.1b _ Percentage of data received from the field in digital form ready for automatic treatment. When only "yes" or "no;' response is
available, "yes" is shown and "no" is shown as "0"c _ Percentage of data pro<;:essed using autoniatic methods and computers. When only "yes" or "no" response is availabie; i'yes;' is shown
and "no" is shown as "0"Information not inaicated or not applicable
TABLE 6.4.3 _ HYDROLOGICAL DATA ARCHIVINGREGION IV (NORTH AND CENTRAL A~IERICA)
Digital archives TypeCota- Data
'" of distri-c %of totol date data logue buted
"-~ Frequenc Age of Charge" • " >- c0 of latest for~
~ 0 ~ 0 cRemarksState/ 0" 0 +' "-
~
"-0
up-datin data·0
data" > • 0 ~ .~ +'
"-~ • 0 ~
terri tory 0 > > 0 ~ c 0 +' 0 • ( mo) (mo)~ +' •~
~ 0 ~, c • +' 0
"- • .a , 0 • supply0 ~ c ~ • E
"- " • >- 0 .a"- >-
" .... ,~"-
"- 0 0 ~ ~
"- • ~
" • 0 " .~
"-~ '" 0 ",' " 0 0
0 +' " • , 0 0 0 c 0 +' '" c• 0 '" +' ~ . • > "" , > • "">- '" 0 " w "" "-:> ~ "
Bahamas 75 - - - - - - - - - - - - - - - - not needed
Barbados 75 - - - - - - - - - - - - - - - - not envisaged
British Caribbean 75 - - - - - - - - - - - - - - - - envisaged with WMO assistanceTerri tories
Canada 73 20 100 - 80 100 100 100 ye, - 6 - 12 2 - 24 ye, ye, ye, - no
Colombic '*
Costa Rica 73 - 80 - - - - - ye' yo' 6 - 12 6 - 12 yo, yo, ye, yo, no
Cuba 'IE<
Dominican Rep. 73 100 100 0 - - 100 - ye, - o - 6 o - 6 ye, no - ye, no
El Solvador 75 0 0 0 0 0 - - - - - - no no ye, ye, ye,
~rench.DePt. ~f73 100 100 100 12 - 2 - rapid development in progress35d~~6S~~ an - - - ye, ye' ye, ye, ye, ye' ye'
Guatemala 75 100 100 0 0 o 100 100 ye, ye, 6 - 12 6 _ 12 no no ye, yo, no
Hai ti .Il-
Honduras 73 - - - - - - - - - - - - - - - being established
.. Jamaica 75 5 95 0 0 0 - - ye, - 6 - 12 6 - 12 no no ye, - no
~lexico*
Netherlands 75 - - - no hydrological service -Antilles - - - - - - - - - - - - - not needed
Nicaragua *
Panama*
St. Pierre and *MiQuelon
Trinidad and 73 - 95 - - - - - ye' - 6 - 12 6 - 12 ye' - ye, ye, noTobago
Uni ted States 75 • 95 10 50 40 40 40 o - 6 o - 6 ye, y.' ye'*for opr:cational. u~) onlyye, ye, ye, ye, foreco$t~nQ
~
~
* Information not received _ _ Information not indicated or not cpplicaole
TABLE 6.5.1 - NATIONAL HYDROLOGICAL DATA* BANKS - ORGANIZATION AND FACILITIES
REGION V (SOUTH-IJEST PACIFIC)
..... g ComputerNumber of doto-
Stote / o .... collecting National.... processingter:ri tory H agencies reported hydrologicol Inter-agency co~orqinptiQn
E: ~ andnumber ~escribeq data bank* and plans for future'" '" archiving>- H in parentheses
...Australia 73 exists 27 (27) co-ordinated data collected by different
limi ted organizations i~ epch stqte
French Polynesia 73 exists 1 (1) centralized collecting and archiv~ng dOn~ byORSTROM
"'e,",'
Indonesia 75 exists 1 (1) limi ted computers used for bqsi~ p"91y~i§
and mathematic91 models,.',.
Malqysia 76 exists 2 (2) limi ted automatic treatment qn~ stqrggeprogramme expanding
New Caledonia 73 exists 1 (1) centralized collecting and archiving don~ ~y
ORSTROM
New Zealand 73 exists 1 (1) limited only one national agency,
Philippines 75 foreseen 1 (1) none automatic treatment and qrchtvingplanned
Singapore **
**",',
United States (Hawai~~ .-,".-
*See explanatory notes
**Information not received
H"'l<;1
TABLE 6.5.2 - HYDROLOGICAL DATA COLLECTION AND AUTOMATIC PROCESSING
REGION V (SOUTH-WEST PACIFIC)
Hydrological Hydro-- meteoroloqicalo·State! Water
FlowsGround- Water Suspended
OtherPrecipi-
Evaporation Remarksterri tory " levels water veli ty sediment tation0••>-" b b b b b b b b0 c a c a c 0 c a c a c a c 0 c
Australia 75 yes 5 90 yes 1 75 yes 5 70 yes 10 75 yes 0 50 - - - yes 5 BO yes 0 80
F-rench 73 o yes o yes 0 0 o yes o yesPolynesia yes yes - - - yes - yes - - - - yes yes
Indonesia 73 yes 0 o yes 0 o yes 0 o yes 0 o yes 0 0 - - - yes 0 o yes 0 0
Malaysia 76 yes yes yes yes yes yes 00 0 o yes o yes yes 0 0 - - - yes yes yes yes o yes
INew Caledonia 73 yes 0 20 yes 0 20 - - - yes 0 - yes 0 - - - - yes 0 o yes 0 -New Zealand 73 yes 60 99 yes - - yes - - yes - - yes - - - - - yes 5 5 yes - -
Philippines 75 yes 0 o yes 0 o yes 0 o yes 0 o yes 0 0 - - - yes 0 o yes 0 0
Singopore*
United States(Howaii)**
Notes:
* Informatio n not availablea - Whether data are collected by agency(ies) indicated in parenthesis in Table 6.5.1b _ Percentage of data received from the field in digital form ready for automatic treatment. When only "yes" or "no" response is available,
"yes" is shown and "no" is shown as "0"c - Percentage of data processed using automatic methods and computers. When only "yes" or "no" response is available, "yes" is shown,
and "no" is shown as "0"Information not indicated or not applicable
~
"~
TABLE 6.5.3 -HYDROLOGICAL DATA ARCHIVING
REGION V (SOUTH-WEST PACIFIC)
Digital archives TYRe Cat9-Data
of distri-%of total data·1< data 10 ue buted
~g'"
cc
Frequenc Age of Charge• " a0·.-.1 ~ • ~ '0 0 of latest • ~ for
State/ ~ • ~ '0 ~~ ~ '0 ~ ~ • ~ Remarks" > • 0 ~ • c 0 ~ u • up-datin data ~ ~ u • data
~~ • > > 0 ~ . ~ 0 '0 • 0 0 '0 •territory ~ a ~ 0 C E '0 " • '" (mo) (rna) ~ ~ • '" supply•• ~ C ~ .'0 ~ 0 0 ~ '0 '0 0 ~>-" " ~ 0 ~~ '0 ~ "' 0 0 " "' 0• 0 " • • u 0 C > ~ C~ " • o • • > « « • «c '" ~ ~ " w '0
'" a ~ C>
'"Australia 75 80 90 70 75 50 80 80 ye, ye, 6 - 12 6 - 12 ye' 00 ye, ye' ye' see "Standards for Jnterchal1,<!e of
Surface Hyd. Doto on CompwterMedia"
French Polyne~io 75 100 100 - - - 100 yeo ye' 12 - 12 - 24 ye, yeo yes y~s yee rapid development in progress
Indonesia 73 - - - - - - - - - - - - - - - - to start in 1976
Malaysia 76 ye, ye' - - - ye, - - - - 24 - ye' 00 ye, ye, yes
New Caledonia 73 100 100 - - - 100 - ye, ye' 12 _ 12 - 24 ye, ye' yee yes yee rapid develqpment in progress
New Zealand 73 99 - - - - 5 yes - a - 6 o - 6 yes ye, yes - ye,
Philippines 75 - - - - - - - - - - - - - - - - planned
Singapore **
:Yrited States 73 - 95 lC 50 4C - - yee - a _ 6 a - 6 yes yee ye, yes y!!'sHawaii) **
.. When only "yes" response is available, it is indicated in the table-ll.* Information not il1dicated or not applicable
Information not received
~
~
TABLE 6.6.1 - NATIONAL HYDROLOGICAL DATA* BANKS _ ORGANIZATION AND FACILITIES
REGION VI (EUROPE)
173
~,Computer Number of data
State/t-erritoryo· .processing colle~ting agencies National
" ondreported hydrological Inter agency co-ordination
0• 'archiving Number described data banks** and plans for futu-re->~ in parentheses
Albania ••Austria 73 exists 1('1) limited
Belgium 75 exists 5(5) oo-ordinated Ivery active programme foreseen
Bulgaria 73 foreseen 1(0) none Creation of independent oomputingoentre for processing and fore-castinO' foreseen
Byeloru8sian SSR **
Cyprus 75 none 1(0) none Storing and retrieval of hydrologidata in computer under considera-tion
Czechoslovakia 75 exists 1(1) oentralized Hydrometeorological lnst. seouresall data inoluding water quality
Denmark 75 exists 2(1) noneResponse ooncerns only groundwaterPlans for computer processing andarchivinQ' in nrenaration
Finland 75 exists 1(1) centralized
Franoe 75 exiets (3) co-ordinated Basin agencies and other organiza-tions collect and archive data
German Democratio 75 exists 1(1 )Preoipitation and evaporation data
Renublic oentralized col~;~ted by Meteorological
Germany, Fedaral 75 exists many (3) co-ordinatedRellublio of
Greeoe 75 exists 4(4) co-ordinatedOne central serVice co-ordinatesactivities between relevanta.r:rencies
Hungary 73 exists 1(1) centralized Extensive data bank being develope
Ioeland 73 exists 1(1) limited
Ireland 75 foreseen 1(1) none Automatio "treat~ent of ~u~face flodata beinl<' inau~rated
Israel 75 exists 4(1) oo-o:t"dinatedCentralized complete data bank innear future
Italy 75 foreseeii 2(2) none -Hydxogr-oPh,i,.C "Se:rvicepJ:!epari-ng -pro-gramme to oolleot, store andretrieve data using comnuter
Jordan 73 •• 1(1 ) ••Lebanon ••Luxombourg 75 none 1(1) none
Netherlands 73 exists 4(4) noneSurface water data bank being des-igned and links with meteorologicaland ~roundwater archives foreseen
Norway 75 exists 4(4) co-ordinate Hydrologic archive very advanoed
Poland 73 exists 1(1) limi tedMore complete data bank underdevelonment
Portugal 75 exists 1(1) none Computer use started in 1975,extensive plans under study
Romania 73 fores"een 2(1) none It is proposed to automate oollec-tion treatment and archiving ofhydrologic data
Spain 75 exists 2(1) limi ted
For footnotes, see end of table.
Table 6.6.1, (oontd)
174
ComputerNumber of dota
>< ,processingcollecting agencies National ,1 Inter agency co-ordination
5tatelterri tory a te" hydrological• and and plans for future>- Number described data banks4-ltarchiving
in narentheses
Sweden 15 foreseen 2(2) noneNo sale national agency for hydrologioal and water quality datacollection - Computer usage inthis domain under inve8ti~ation
Swi tzerland 15 exists 2(2) limited Studies presen~ly being made re-;~ardinq national hvd. data bank
Syrian Arab Republic 15 none--
none
Turkey 15 foreseen 2(2) none Data bank projected for 1974
Ukrainian SSR**
USSR + 1 exists many (many) co-ordinated Extensive plans for establishmentof comnlete hvd. data banks
United Kingdom 15 exists 1 centralized
Yugoslavia 1 exists 1(7) Go-ordinated Plans for more extensiveautomation
+
See Explanatory notesInformation not receivedAlso included under Region II (Asia)
TABT~ 6.6,2. - HYDROLOGICAL DATA COLLECTION AND AUTOMATIC PROCESSING
REGION VI (E1J!l0!'.!l
H'ylh'ological Hydro-meteorolo2ical
Statel tl \la.ter Flows Ground:'" Watex Suspended Other Precipita- Evaporation• levels water ualitv Sediment tion Remarksterritory >-!a b 0 a b I 0 • b 0 a b 0 • b 0 • b 0 • b 0 • b 0
Albania •Austria ; no - - no - - yes 0 00 no - - no - - no - - ye, o 100 no - - Note 1
Belgium 5 yes o 100 yes 0 100 yes 0 00 no 0 0 no 0 0 - - - yes o 100 yes a 100 Note 2
BUlgaria ; - - - - - - - - - - - - - - - - - - - - - - - -••Byelorusaian SSE
Cyprus ; - - - - - - - - - - - - - - - - - - - - - - - -Czechoslovakia 5 yes 2 yes yes 0 80 ye ; 80 es 5 50 no 0 a yes a 100 yes - - no - - Note 3
Denmark 5 - - - - - - ye 01"00 yes a 100 - - - - - - 0 - - 0 - -Finland 5 yes - 90 yea - 90 ye - - "ee - 60 - - - yee yee yee yes - - yes - - Note 4
France 5 yes 75 75 yes 75 75 ye - - es 100 100 no - - - - - yes a 100 yee a 100
German Democra-5 yes 70 100 100 100 7 100 IYes 20 100tic R ,un' - yes ye - - - yes yes ye, - - - - - -
Germany, Federal5 yes 50 100 yes a 100 ye 00 IYes 20 100 no - - no - - yes 0 80 yes - -,,", - "'
Greece 5 yes 20 20 yes 20 20 yea a IYes 0 0 es ;0 ;0 yes ;0 ;0 yes ;0 30 yes 20 20 Note 5
Hungary 3 yes a 100 ye, 0 40 ye 00 lYes 0 0 es 0 a yes a 100 yes 0 - yes 0 - Note 6
Iceland 3 yea 0 75 yes 0 95 ye - lYes 0 - es 0 90 yes 0 - - - - - - -Ireland 5 yes a yes yes a yes - - - - - - - - - - - - - - - - - -Israel 5 yes 0 70 yes 0 70 YO' 100 yes 0 90 e. 0 a ~res a 100 yes a 100 yes a 100 Note 7
Italy 5 - - - - - - - - - - - - - - - - - - yes yes yes - - -,Jordan 3 yes - - yes - - yef - - yes - - e' - - yes - - yes - - yes - 100 Note 8
Lebanon **
Luxembourg 5 yes 0 o yea 0 o yO' o yes 0 0 - - - - - - yes 0 0 no - -Netherlands 3 yes yes 70 yes - - ye' 1 100 yes - - es - - no - - yes 10 100 no - -Norway 5 yes 5 95 yes o 100 yO, 95 yes 5 95 es 5 95 yes 0 95 yes yes 100 yes o 100 Note 9
Poland 3 yes 0 - yes 0 80 yO, - es 0 - lves 0 - yes 0 - yee a 100 yes 0 - Note 10
Portugal 5 yes - - yee - - - - - - 'I - - - - - - - - yes - - - - -For footnotes, see end of table.
~
"'"
Table 6.6.2,(contd.)
,',", -'"",,,.-,,
Hydrologica.l B¥dro-meteorolo"ical
State/ " 'Water Flows Ground- Water . Suspended Precipita-c ualit". Other Evaporatj,on• levels water Sed.1ment tiQn ~!'l;~a,r~s:territory >-• b c • b c • b c • b c • b c • b c • b c • b c
"-0" ",,">, ..,.... -" "",,,.' ,
Romania 73 ye 0 0 "' 0 a yes 0 a yes 0 a yes 0 0 ye 0 0 yes 0 0 yes 0 0 Note 11_ .. ~ ..,.
Spain 75 ye 40 00 es a 100 yeo - - yes 0 a yes - - - - - y~s - - ye!" - -..".
Sweden 75 ye 5 80 Ives 0 90. yes a 100 yes - - yes 0 0 ye 0 0 no - - no - - Note.--.......,.".<."....... -
Switzerland 75 ye 0 es Ives a yes ye, 0 - ye, 0 - ye, 0 - - - - ye 0 00 no - -""."',...,,' -
Syrian Arab Rep 75 - - - - - - - - - - - - - - - - - - - - - - - -17~
,'.".. "'" '.',,,; ~~. ,,,,.Turkey - - - - - - - - - - - - - - - - - - - - - - - -Ukrainian SSR"
USSR+ Ives Ives--." ,.. ".. """
7 ye IYes ye, yeo no yes yes yes yes yss yes ye - - ye - - yes - - Note 12
United Kingdom 7 ye 60 100 ye, 100 100 ye' a 100 ye, 0 95 - 0 - ye 0 - n - - no - -" ........_-,." .. " -"
Yugoslavia 7 ye - 50 yes - 50 ye, - o yes - o yes 0 0 - - - ye, - - yEJ:S - -Notes:~nformation not received+ Also included under Region II (Asia)
a - Whether data are collected by agency(ies) indicated in parenthesis in Table 6.6.1b - Pe:t'centage of data :t'eceived from the field in digital form ready for automatic treatment. when only 1'y!=,S'! or '1 no '! re;:.ponse is availqp+~
"yes" is shown and "no" is shown as "0"c _ Percentage of data processed using automatic methods and computers. When only "yes" or "no" response is available, "ye:s q
, is sho~n qnp"no" is shown as "0"
- Information not indicated or not applicable
1 - Collection of water levels and flows planned for 19752 - See TlLa banque beIge de donnees hydrologiques"
3 - Water temperature and ice phenomena observed. All water tem~erature data processed automatically since 19754 - Soil moisture, water temperature, lake currents, snow cover, ice depth, freeze-~p and bre~k-up observed. Lake curre~ts
observed and processed automatically (100%)5 - Water temperature data collected
6 - Data collected and treated automatically (100%) regarding water temperature, ice cover, ~oundwater, temperature diacha~ge,water temperature and specific electric resistivity of spring waters
7 Data collected regarding discharge and quality of springs
8 - Spring flow data collected
9 - Data collected regarding river and lake ice conditions
10 - Data collected regarding ice conditions
11 - Data collected regarding snow and ice cover
12 _ Much of automatic collection and treatment on an experimental basiS e Data collected regarding ice phenomena
';:l
'"
TilLE 6.6.3 - E.YDB.OLOGICAL DATA. ARCEIVING
REGION VI (EUROPE)
I I i - A.ge of Cata- ate.Digital ~chives IType ~equenc;;' Charge
I , %of total data;\'; of of ::!.atest logue istri- for0 dote p-dating data uted data'"
" I ~ I supply.," "State/0 m 0
~ ~ " ~
territory m m m ~ ~ 0(mo) (mo) m
m Remarks" > ~ 0 -0 • '" ~
• • . 0 .~ ~ ~ '" ~ " '"~ H , ~ -0 0 ~ • • ~p •0 '" o • 0, " m '" m
" m " " m E '" 0 0 .... ~ " 0 ...." • ,
" • ~'" 0 ~ 'M ~ ~ ~ '" ~0 ~ 0 0 ~ 0" m • m • • m • •m • ~ " 0 o • " > • " "'
'M • ">- '" .. " :> "'''' 0< :=:: "' « " " «
Albania** !
Austria - - 100 - - 100 - yes ye, 6 - 12 6 - 1 iYos !yes yea ye. ye. Hydrographic year-book
:Belgium 75' 100 100 100 a o 100 , 100 yes ye. 6 - 12 6 - 1 e, "aa yaa yes no Updating varies for different eleme~ts
:Bulgaria 15 Foreseen
••Byelorussian SSR
Cyprus 15 Under consideration
Czechoslovakia f1i a laC 100 100 0 - - yes y•• 12 - 12 - 24- e. no ye' yes ye.
Denmark 15· - - 20. - I - - I - yea - a - 6 o - 6 no - - - - Groundwater banks started in 1915
I Finland 15 90 9 - 60 - - - yaa ye,a a - 6 0-6 e. no ye. y•• yes Lake currents - 100%.France 75 75 - 100 - 100 100 yes yea 12 60 e. IYe-s - yes no
German Democratic100 100 100 100 0 - - yeiB - 6 - 12 12 - 24 no no 'yes -Renublic yea
Germany, Federal75 100 100 100 100 - 80 - yes yes 12 - a ., 24 es no yes yas yea Some banks charge for dataRe"Dublic of
Greece 20 2C - - 0 ?O 20 yea - 12 - 0-6 no - yes y~Jia RO
Eungary 7 100 4C 100 °i ° - ., YElS yea 12 - 12 - 24 no - yes yea yee
Iceland 15 75 9 - - 90 - - yea yes 6 - 12 6 - 1 x no yss ya. no
Ireland 75 I I I Being inaugurated
Israel 7 70 70 100 90 a 100 100 yes - a - 6 a - 6 no - yes yes y"
Italy 15 - - I . - . yes - yes· - a - 6 6 - 1 no - ye. - yes Being inaugurated
Jo:r:dan - - - - - - - - - - - ye no yea - no
•• !Lebanon iLuxembourg 15 a 0 0 0 a a a - - - - no no - - -Netherlands 3 0 - 35 - - 25 - yes - 12 - 24 12 - 24 ye no ye, - yes Further improvement foreseen,
For footnotes, see end of table.
t:j
"
Table 6.6.3. (contd. )
I I Digital Archives I Tyoe FreC!uency.Age of Cata lData Charge I. %of total data 'It •• ot of l.:::test logue istri- for
I t: I .data p_dating data uted rlata !·M su:pply
I t til to § II 0..-; I'-t'rl 'M ~ 'd
State ill W <ll"-; +> 0 () () $ RemarksTerri tory 1-, ~ ~ ffi ~ ..p ~ ~ 'd mo mo ~::I 'd
...... 0-:1 ::> o''dl=i'rl <l! W ,o..Cl <ll
o f.l [Il '"g f.l ~~.~ ~ 0 ~ ~ .~ 0 ~I'-t <ll )< ;:l O,l Pi'rl 0 p.,'rl,-l ·M +" ...-I .-I
% ~ .:: ~ ~ ~,~ ~ ~ ~ ~ ~ .~ ~ ~"..::=:. I'=-l 0 :=:: (f,ll;r.l '""' >=:I ~ <: <: A L"=1 <:
Norway 15 95 60 95 95 100 10 - yes yes a - 6 a - 6 ye ye yes yes ;y:es
Poland 73 - 100 - - - 10 - yea yes 6 - 12 6 - 12 no - yes yes no++---+-++--+-+-+-----1----------1
Portugal 75 - - - - - .. - - - - - - - - - - Under study
Romania lTI _ _ _ _ _ _ _ _ - - - _.. - - .. Planned
S};lain 95 100 - _ - - - yes yes 6 - 12 24 - ye ye yes yes no
Sweden 80 90 100 - 0 _ - yes yes a - 12 a _ 12 ye no yes yes yes Planned
Swiherland 100 100 _ _ _ 100 _ yes yes a - 12 a - 12 no - yes ye.s yes
Syria:.n A-"abRenublic - - - - - - - - .. - - - - .. - - None
Turkey 75 .. - - - - - - - - - - - - - - - Planned
••'crkrainian SSR
USSR + 7 yes 100 - 80 - - - - Y8s1
12 - 12 '- ye no !yes yes yes
. . Comprehensive water archive systemUn:!. ted Klngdom 75 100 100 100 85 - 10 - yes yes a - 6 a - 6 ye ye yes yes yes ~der construc:t;ion
\ Yugoslavia 7 100 100 100 100 100 _ _ yes yes 6 - 12 6 - 12 ye no yes yes yes No' charge to governmental organLwtions
~
:;j
,.
**
+ -
When only "yes" or "no" response is available,Information not receivedInformation not indicated or applicable~lso included under ~egion II (Asia)
"yes" is shown and "no" is shown as "0"
TABLE 6.7.1 - SUMMARY: NATIONAL HYDROLOGICAL DATA BANKS- ORGANIZATION AND FACILITIES
Number of states/territories
Using computersHaving national hydrological Wi thout
Region iii processing nationalReporting and archiving data banks hydrological
existing I;data
planned limi ted co-ordinated centralized bank
I Africa 28 16 1 7 2 1 18
II Asia 13 6 - 1 1 - 11
III South America 10 6 4 - 1 3 6
IV North andCentral America 14 ':i' 1 2 4 1 7
V South-WestPacific 7 6 1 4 - 2 1
VI Europe 31 21 6 5 8 5 13
Total 103 64 13 19 16 12 56
....:;3
TABLE 6.7.2 - SUMMARY: HYDROLOGICAL DATA COLLECTION AND AUTOMATIC PROCESSING. '" -- .'"'' .,- ",':
.. " .,
No. of states/territori~s
,-,",. .' "~ .. ' .", ., " .". ""., , ..,,-, 'N""_'" .•",.._,,,,,,,,,,,,,., '.,,'.<'
RelfJi onWater flows G~o!·md Wqter S.uspen_qe~
OtherPrecipi.,,-
,E¥9porationlevels wat-er quali ty seqiment totion
,,~, ,.. .......,., '-'.'. , ,'...
a b a b a b a b q b a b a b a b,,,,,,,.,, .' ,-., '
I Africa 1 8 2 11 1 2 0 1 0 1 0 0 1 7 1 3
II Asia 2 5 1 4 0 0 2 1 1 1 0 0 1 3 Q 1
III South America 1 6 0 6 0 2 1 3 0 2 0 Q 0 2 0 0
IV North andCentral America 1 6 2 9 1 1 1 2 0 2 0 1 3 5 Q 2
V South-WestPacific 3 5 2 4 1 1 1 ' 2 0 1 0 0 3 4 0 3
VI Europe 11 19 ., 5 19 3' ·12 6 10 2 4 3 7 4 12 1 7
... , .",. -" ''''',-",'' "." "..,....,.. ,.. , .... -. "-,,' ., .' ....",
Total 19 49 12 53 6 18 11 19 3 11 3 8 12 ~:3 2 16","",,"- "-'",n''' '-"""''''«'' """'0_",_ ""/' ,"" ",": ,
a - Spme degree of vtilization of automatic equipment fqr collecting information in digitql form repqy forqirect Qutomqtic treatment.
b - Some degree of automatic proc~ssing of dotq,
,coo
TABLE 6.7.3 - SUMMARY: HYDROLOGICAL DATA ARCHIVING
181
No. of states/territories
Some degree of Type of Frequenoy ofdigital arohives data up-dating
'"Region +' ..<:~ ~ '" +'
'" ID 0 " .G cr< '" S 'n ~ .G +' 0Q) Q) 'n +' 0 +' ~ EP +' <0 oj 'n " 0Q) oj
..: ID +' +' <0 0 S Nr< .EJ rn 'n oj Q) S -i
P, '" " N
'" '" S H .... . 'n 0 0 p, '" r< HQ) ,. Q)-i P, 0 p, 'n r< "+' 0 0 +' " " ID oj " oj I I >~
r< '" ~~ " '" p oj !l 0
'"' '" rn '" '" P1 0 '"
I Africa 11 8 2 1 1 9 5 15 7 5 6 3
II Asia 5 4 0 1 0 3 1 4 4 0 2 3
III South America 6 4 2 4 2 4 1 6 5 2 2 2
IV North and 5 8 1 2 2 5 3 8 4 2 3 1Central America
V South-West 5 5 2 2 2 5 1 5 3 2 1 2Paci fic
VI Europe 16 18 13 10 3 12 4 21 16 6 9 7I
Total 48 47 20 20 10 38 15 59 39 17 25 18