Disclaimer : The views expressed are those of Paul Gipe and are not necessarily those of the sponsor. Disclosure : Paul Gipe has worked with Aerovironment, ANZSES, APROMA, ASES, AusWEA, AWEA, BWEA, BWE, CanWEA, CAW, CEERT, DGW, DSF, EECA, ES&T, GEO, GPI Atlantic, IREQ, KWEA, MADE, Microsoft, ManSEA, MSU, NRCan, NRG Systems, NASA, NREL, NZWEA, ORWWG, OSEA, PG&E, SeaWest, SEI, TREC, USDOE, WAWWG, WE Energies, the Folkecenter, the Izaak Walton League, the Minnesota Project, the Sierra Club, and Zond Systems, and written for magazines in the USA, Canada, France, Denmark, and Germany. Paul Gipe, wind-works.org
Transcript
Disclaimer: The views expressed are those of Paul Gipe and are not necessarily those of the sponsor.
Disclosure: Paul Gipe has worked with Aerovironment, ANZSES, APROMA, ASES, AusWEA, AWEA, BWEA, BWE, CanWEA, CAW, CEERT, DGW, DSF, EECA, ES&T, GEO, GPI Atlantic, IREQ, KWEA, MADE, Microsoft, ManSEA, MSU, NRCan, NRG Systems, NASA, NREL, NZWEA, ORWWG, OSEA, PG&E, SeaWest, SEI, TREC, USDOE, WAWWG, WE Energies, the Folkecenter, the Izaak Walton League, the Minnesota Project, the Sierra Club, and Zond Systems, and written for magazines in the USA, Canada, France, Denmark, and Germany.
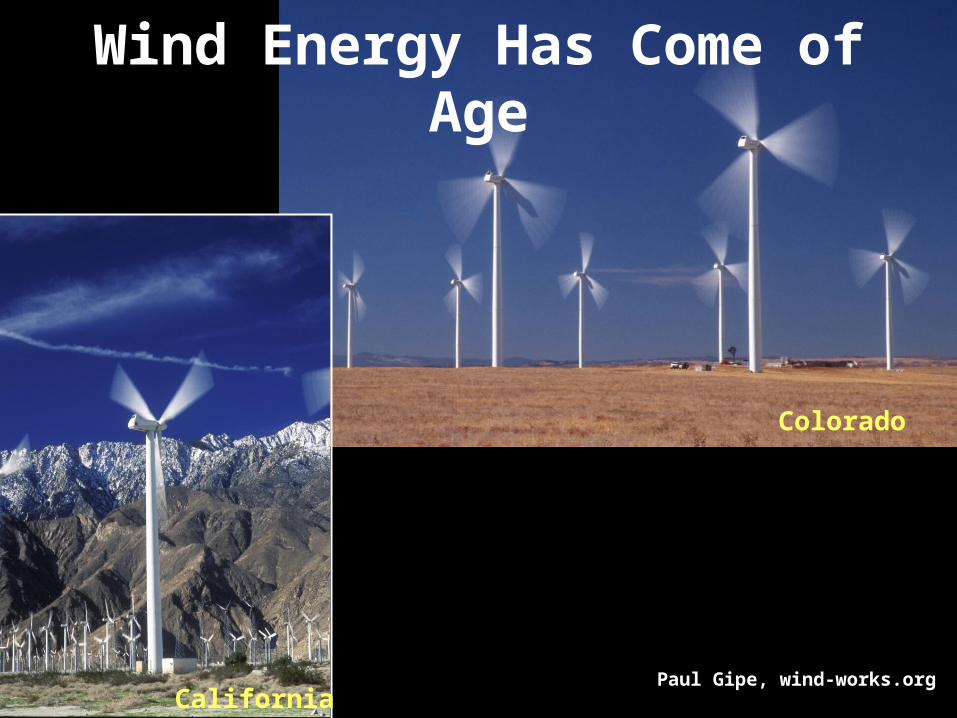
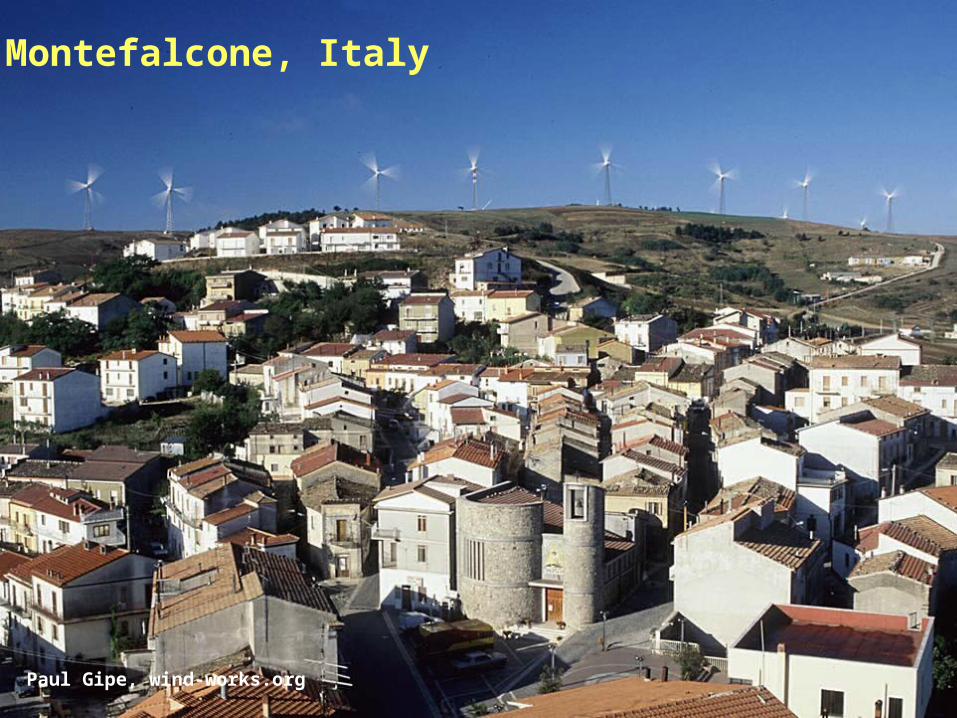
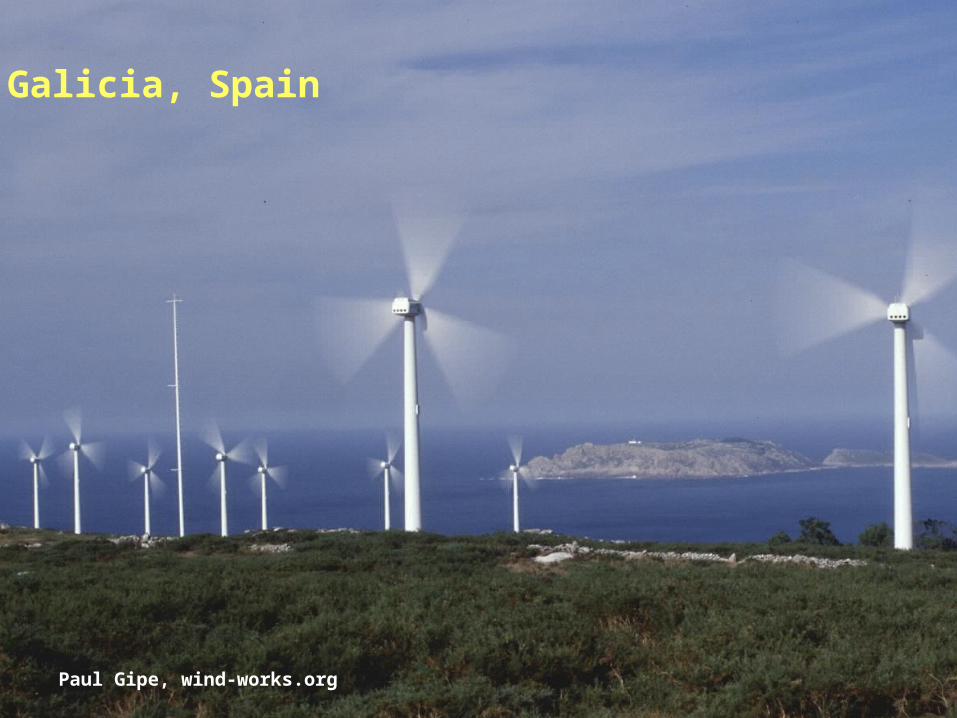
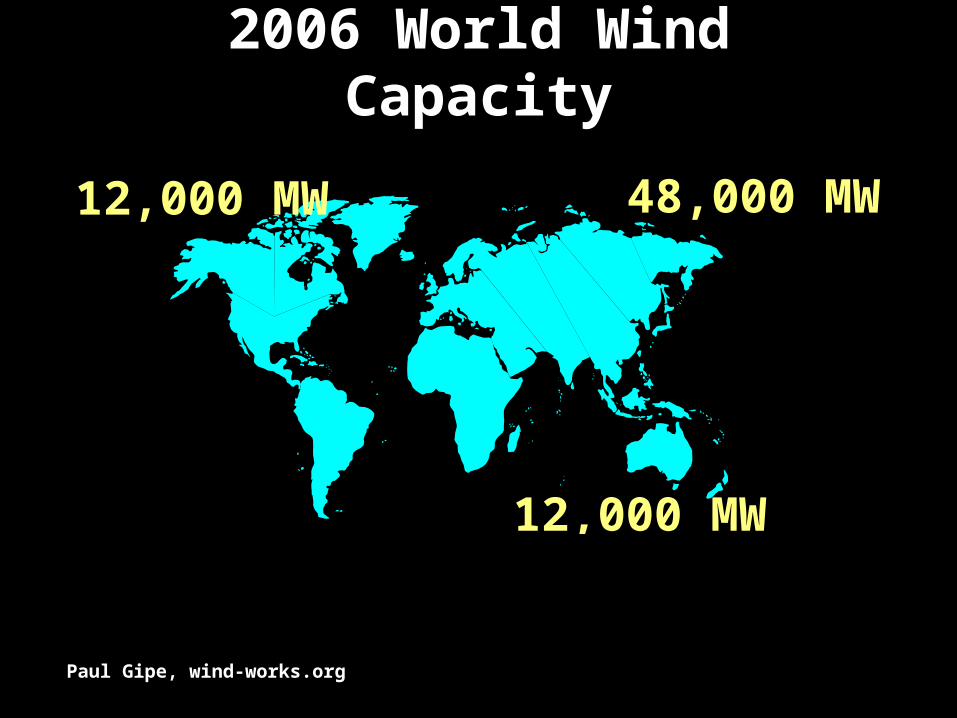
Paul Gipe, wind-works.org
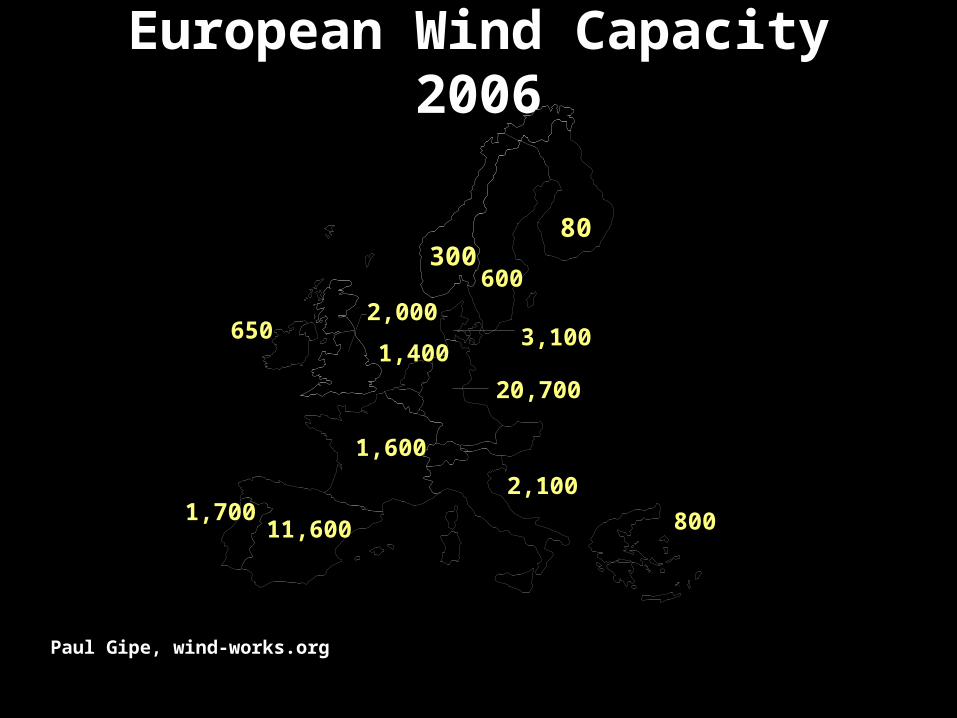
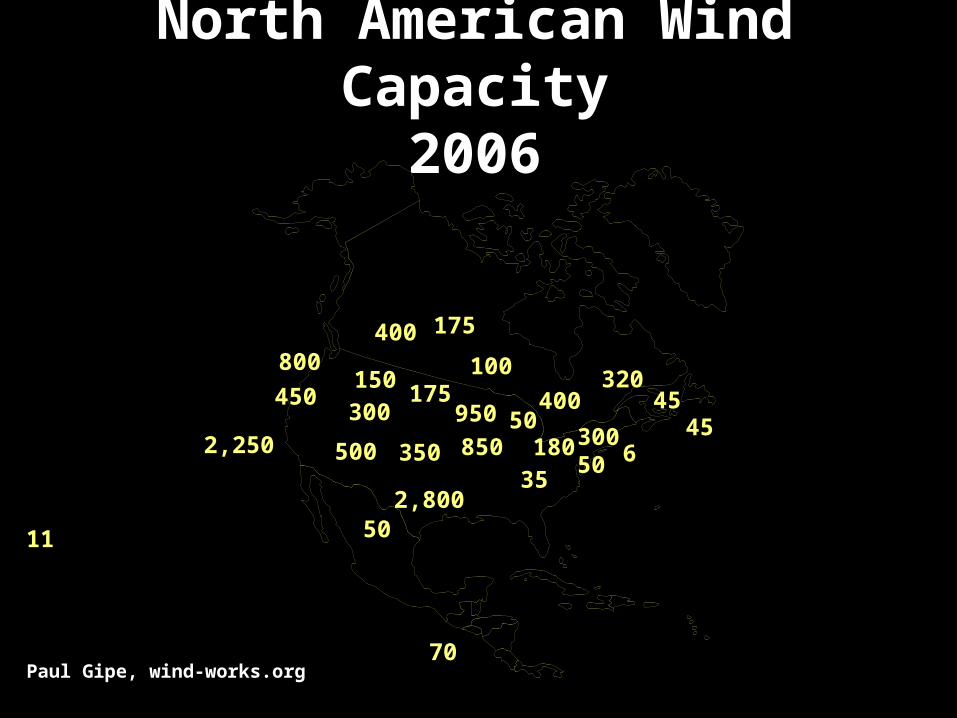
Overview of Worldwide Wind Development
By Paul Gipe
North American Energy Policy
North Americans are Dabbling Around the Edges of Renewable
Energy Policy
Little Recognition of the Crisis Facing the Continent
Paul Gipe, wind-works.org
Skibsted Fjord, Denmark
Complacency is Not a Policy
Inaction is Not an Option
Paul Gipe, wind-works.org
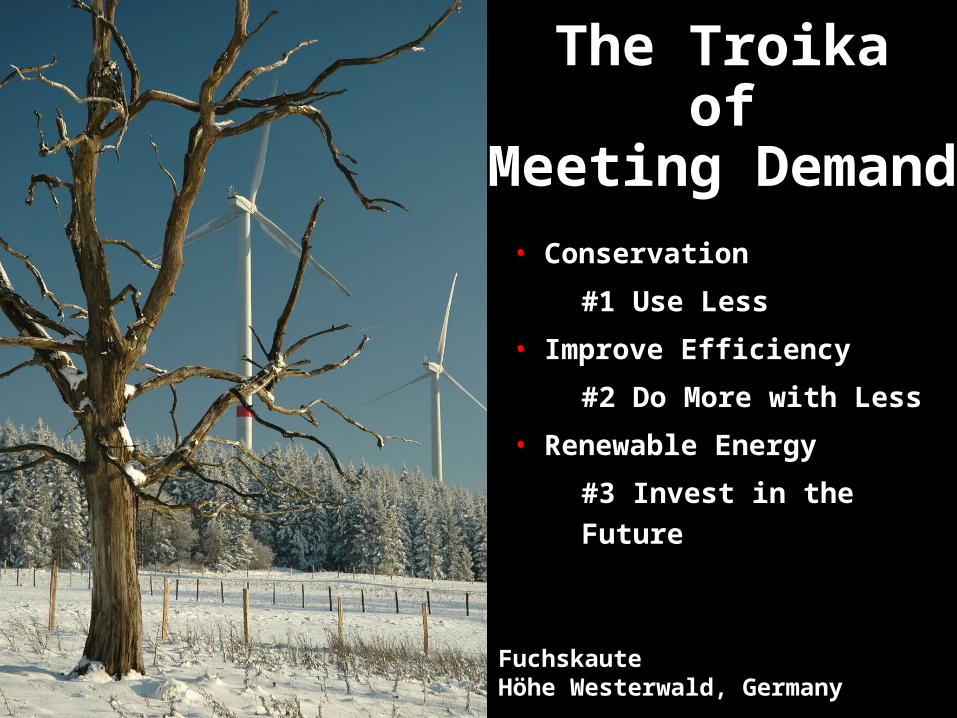
FuchskauteHöhe Westerwald, Germany
The Troika of
Meeting Demand
• Conservation
#1 Use Less
• Improve Efficiency
#2 Do More with Less
• Renewable Energy
#3 Invest in the Future
Typical Household Consumption
Paul Gipe, wind-works.org
kWh/yr/home
Texas 14,000
Ontario 10,000
California 6,500
Netherlands 3,000
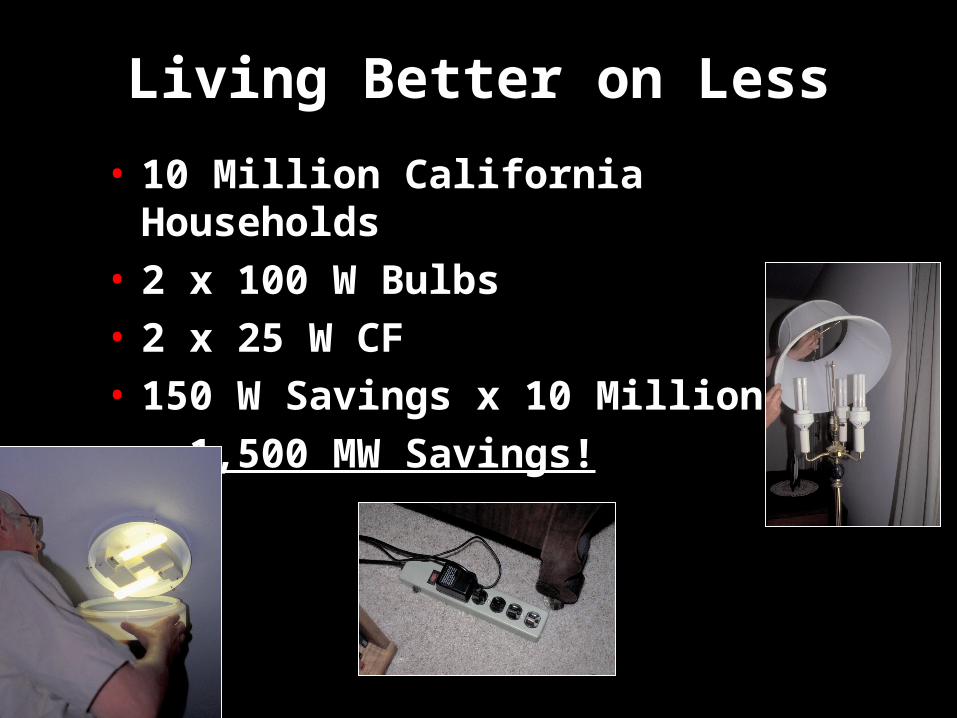
Living Better on Less
• 10 Million California Households
• 2 x 100 W Bulbs
• 2 x 25 W CF
• 150 W Savings x 10 Million
• = 1,500 MW Savings!
Many More Opportunities
• Task Lighting
• Notebooks = 90% Savings!
The Result in the Nies-Gipe Household
Jan Feb March April May June July Aug Sept Oct Nov Dec
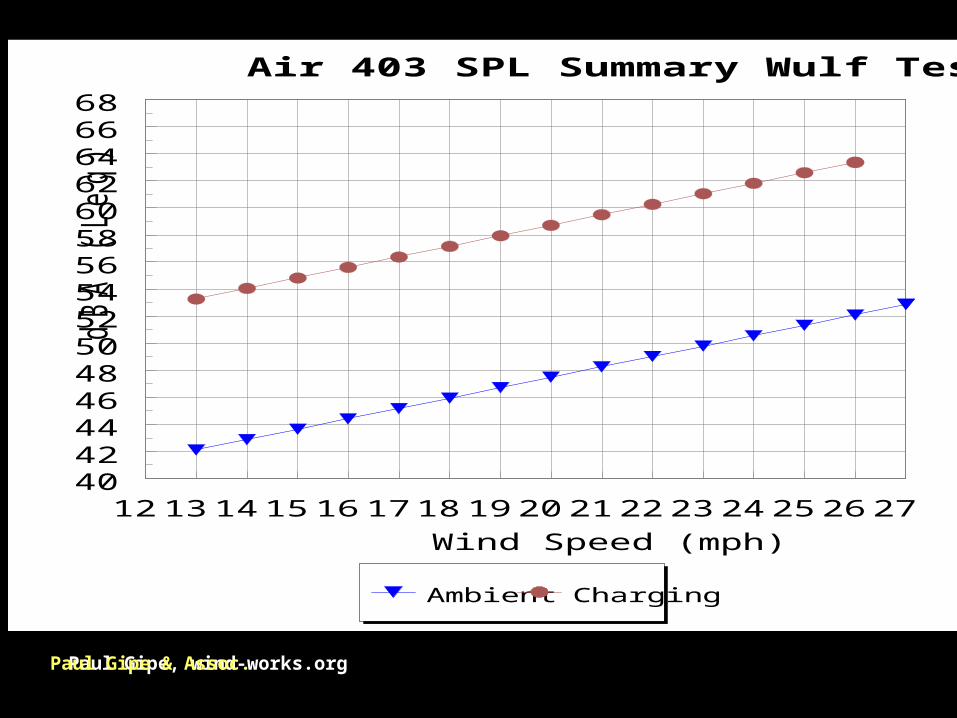
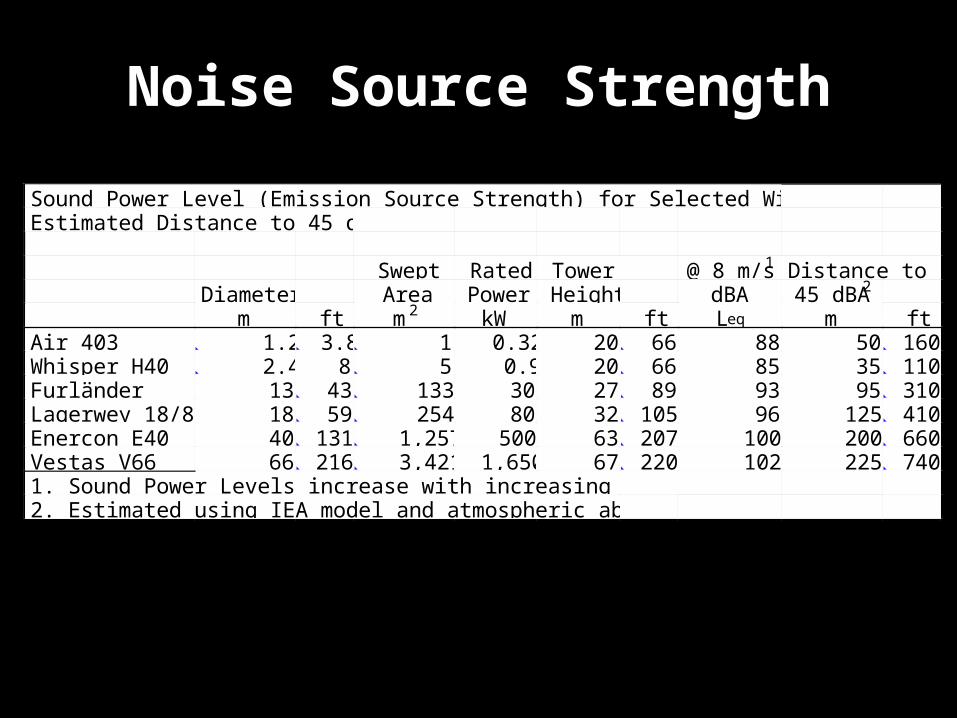
1. Sound Power Levels increase with increasing wind speed.2. Estimated using IEA model and atmospheric absorption.
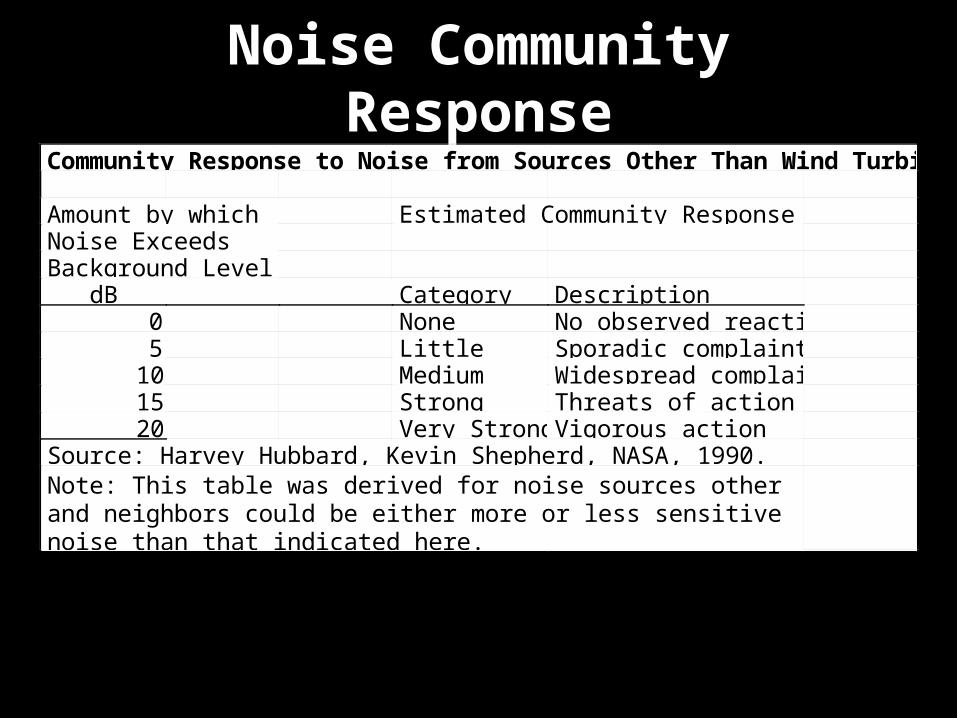
Noise Community Response
noise than that indicated here.and neighbors could be either more or less sensitive to wind turbineNote: This table was derived for noise sources other than wind turbines,
Community Response to Noise from Sources Other Than Wind Turbines
Estimated Community ResponseAmount by whichNoise ExceedsBackground Level
DescriptionCategorydBNo observed reactionNone0Sporadic complaintsLittle5Widespread complaintsMedium10Threats of actionStrong15Vigorous actionVery Strong20
Source: Harvey Hubbard, Kevin Shepherd, NASA, 1990.
Noise LimitsSelected Noise Limits, Sound Pressure Levels in dBA
40L50Low speed60606575L50DayMinnesota50506575L50Night65657080L10DayMinnesota55557080L10Night4545L8.3Kern County, Calif.3
45L90Riverside County, Calif.6050L90Palm Springs, Calif.4
1. Not to exceed 45 dBA beyond 400 m from wind turbine.2. L50 approx. 350 m from the nearest turbine.3. L8.3., not to exceed 50 dBA.4. 50 dBA if lot is actually used as residential.
Paul Gipe & Assoc.
Birds & Bats• Before & After Studies
of Big Projects
• Studies Necessaryfor Small Projects?
Cros de Gerand, France
Birds & Bats• Bats
Appalachian Mts & Bufalo Ridge (MN)
Bat Conservation Society Report
Cause Unkown & Further Research In Doubt
US Wind Industry Uncooperative
Seasonal Shut Down Possible
• Birds, Altamont PassIssue Unresolved
California Wind Industry Uncooperative
Disaster for Raptors & Wind Energy
Paul Gipe & Assoc.
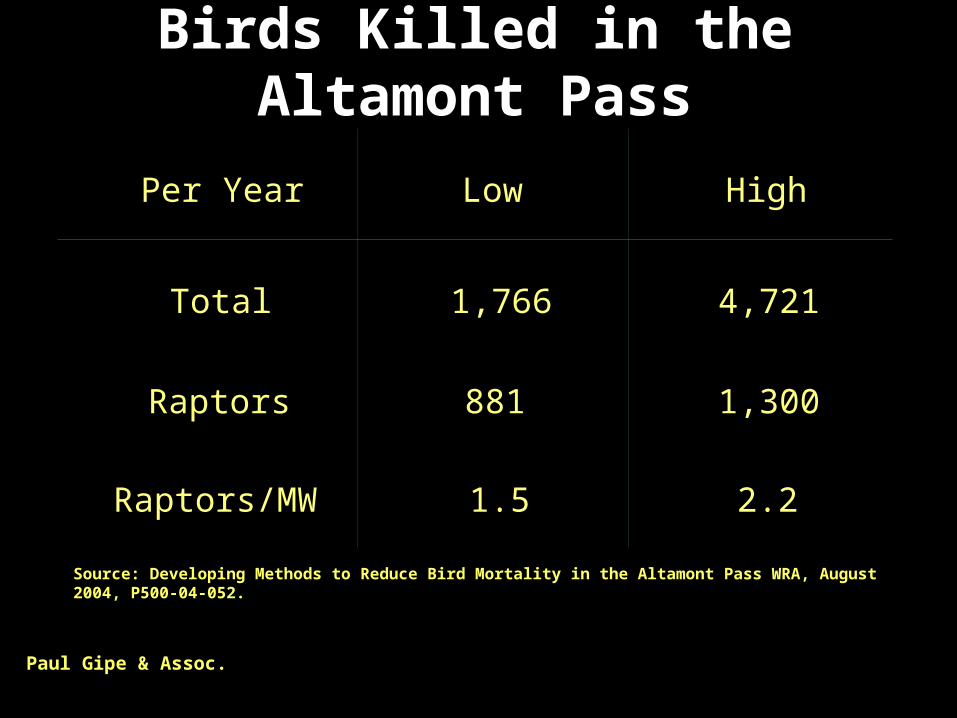
Birds Killed in the Altamont Pass
Paul Gipe & Assoc.
Source: Developing Methods to Reduce Bird Mortality in the Altamont Pass WRA, August 2004, P500-04-052.