Discontinuity in Jupiter’s main auroral oval A. Radioti, 1 J.-C. Ge ´rard, 1 D. Grodent, 1 B. Bonfond, 1 N. Krupp, 2 and J. Woch 2 Received 27 June 2007; revised 11 September 2007; accepted 10 October 2007; published 30 January 2008. [1] On the basis of a series of FUV Hubble Space Telescope images obtained between 1997 and 2007 it is shown that there is a segment of the main auroral oval where the emission drops significantly from a few hundreds to a few tens of kiloRayleigh, forming a discontinuity in the oval. It is shown that the discontinuity is present in both hemispheres and confined in magnetic local time. Its equatorial source is located in the prenoon and early noon sector. The main auroral oval is associated with the ionosphere-magnetosphere coupling current system which is related to the breakdown of corotation in the middle magnetosphere. Necessary for the electron precipitation in the ionosphere and the formation of the main auroral oval is the presence of upward field-aligned currents, carried by downward moving electrons. Field-aligned currents inferred by Pioneer, Voyager and Galileo in situ observations in the near equatorial plane showed evidence of reduced or/and downward field-aligned currents in the prenoon and early afternoon sector, the location of the equatorial source of the discontinuity. Additionally, we estimate the precipitation energy flux in the ionosphere, for a typical reduced upward field-aligned current value at that region, which is found to be within the range of the observed brightness of the discontinuity. Field aligned current distributions in the ionosphere based on magnetohydrodynamic simulations of the interaction between the solar wind and the magnetosphere have predicted a region of downward currents implying a discontinuity at the main auroral oval emission, in very good agreement with the HST observations presented in this work. Citation: Radioti, A., J.-C. Ge ´rard, D. Grodent, B. Bonfond, N. Krupp, and J. Woch (2008), Discontinuity in Jupiter’s main auroral oval, J. Geophys. Res., 113, A01215, doi:10.1029/2007JA012610. 1. Introduction [2] Analysis of Hubble Space Telescope (HST) ultravio- let images has shown that Jupiter’s auroral emissions, according to their locations, physical regions, precipitation processes [Grodent et al., 2003a, 2003b] and time variations [Clarke et al., 1998] are divided into three main regions. With increasing latitude these three regions, indicated in Figure 1, are: the satellite footprints, the main oval and the polar emissions. The satellite footprints together with their trailing tails are magnetically connected to the orbits of the moons Io, Europa and Ganymede and therefore easy to identify [Clarke et al., 2002a; Grodent et al., 2006; Ge ´rard et al., 2006; Bonfond et al., 2007]. The polar emissions, located poleward of the main oval are magnetically connected to the outer magnetosphere and open field lines [Cowley et al., 2003b; Grodent et al., 2003b]. Their morphology and brightness show large variations on time- scales ranging from seconds to days [Grodent et al., 2003b] and in some cases particular structures such as bright flares are observed [Waite et al., 2001]. [3] The main auroral oval forms a relative stable strip of emission around the magnetic pole. Observations of the main oval emissions demonstrated that they corotate with the planet [Ge ´rard et al., 1994; Ballester et al., 1996] and they show temporal variations on timescales of tens of minutes and hours. Grodent et al. [2003a] performed a long term comparison of HST images and showed that the auroral morphology is fixed in system-III longitude (SIII). They produced a reference oval for comparison with images taken on different days, which is used later in this work. The main auroral oval emission [Grodent et al., 2003a] is estimated to contribute to 75% of the Jovian auroral brightness integrated over the pole and its brightness was shown to vary between 50 and 500 kR (with a few exceptions where the main oval brightened up to 1 MR). Furthermore a statistical analysis of the main oval as a function of CML (Central Meridian Longitude in SIII) exhibits a modulation of the brightness which, for some sectors increases from noon to dusk and then decreases again in the magnetic evening [Grodent et al., 2003a]. A recent study of the morphology of the main aurora emis- sions [Grodent et al., 2008] reveals several individual details of the main oval in terms of local time: the dawnside portion forms a relatively narrow arc, appearing almost continuous in UV images, the post-noon portion consists of auroral patches and the dusk portion appears to broaden and break from the main oval. These recent observations JOURNAL OF GEOPHYSICAL RESEARCH, VOL. 113, A01215, doi:10.1029/2007JA012610, 2008 Click Here for Full Articl e 1 LPAP, Institut d’Astrophysique et de Ge ´ophysique, Universite ´ de Lie `ge, Belgium. 2 Max-Planck-Institut fu ¨r Sonnensystemforschung, Katlenburg-Lindau, Germany. Copyright 2008 by the American Geophysical Union. 0148-0227/08/2007JA012610$09.00 A01215 1 of 11
Transcript
Discontinuity in Jupiter’s main auroral oval
A. Radioti,1 J.-C. Gerard,1 D. Grodent,1 B. Bonfond,1 N. Krupp,2 and J. Woch2
Received 27 June 2007; revised 11 September 2007; accepted 10 October 2007; published 30 January 2008.
[1] On the basis of a series of FUV Hubble Space Telescope images obtained between1997 and 2007 it is shown that there is a segment of the main auroral oval where theemission drops significantly from a few hundreds to a few tens of kiloRayleigh, forming adiscontinuity in the oval. It is shown that the discontinuity is present in both hemispheresand confined in magnetic local time. Its equatorial source is located in the prenoon andearly noon sector. The main auroral oval is associated with the ionosphere-magnetospherecoupling current system which is related to the breakdown of corotation in the middlemagnetosphere. Necessary for the electron precipitation in the ionosphere and theformation of the main auroral oval is the presence of upward field-aligned currents, carriedby downward moving electrons. Field-aligned currents inferred by Pioneer, Voyager andGalileo in situ observations in the near equatorial plane showed evidence of reducedor/and downward field-aligned currents in the prenoon and early afternoon sector, thelocation of the equatorial source of the discontinuity. Additionally, we estimate theprecipitation energy flux in the ionosphere, for a typical reduced upward field-alignedcurrent value at that region, which is found to be within the range of the observedbrightness of the discontinuity. Field aligned current distributions in the ionosphere basedon magnetohydrodynamic simulations of the interaction between the solar wind and themagnetosphere have predicted a region of downward currents implying a discontinuity atthe main auroral oval emission, in very good agreement with the HST observationspresented in this work.
Citation: Radioti, A., J.-C. Gerard, D. Grodent, B. Bonfond, N. Krupp, and J. Woch (2008), Discontinuity in Jupiter’s main auroral
oval, J. Geophys. Res., 113, A01215, doi:10.1029/2007JA012610.
1. Introduction
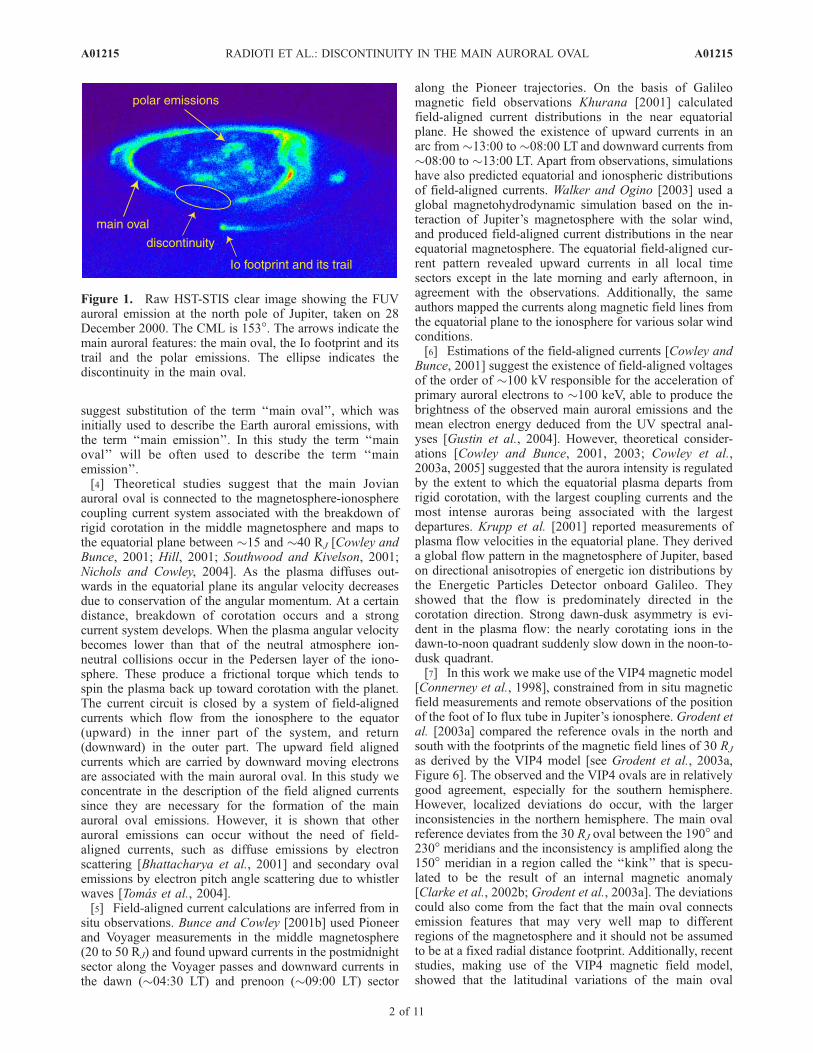
[2] Analysis of Hubble Space Telescope (HST) ultravio-let images has shown that Jupiter’s auroral emissions,according to their locations, physical regions, precipitationprocesses [Grodent et al., 2003a, 2003b] and time variations[Clarke et al., 1998] are divided into three main regions.With increasing latitude these three regions, indicated inFigure 1, are: the satellite footprints, the main oval and thepolar emissions. The satellite footprints together with theirtrailing tails are magnetically connected to the orbits of themoons Io, Europa and Ganymede and therefore easy toidentify [Clarke et al., 2002a; Grodent et al., 2006; Gerardet al., 2006; Bonfond et al., 2007]. The polar emissions,located poleward of the main oval are magneticallyconnected to the outer magnetosphere and open field lines[Cowley et al., 2003b; Grodent et al., 2003b]. Theirmorphology and brightness show large variations on time-scales ranging from seconds to days [Grodent et al., 2003b]and in some cases particular structures such as bright flaresare observed [Waite et al., 2001].
[3] The main auroral oval forms a relative stable strip ofemission around the magnetic pole. Observations of themain oval emissions demonstrated that they corotate withthe planet [Gerard et al., 1994; Ballester et al., 1996] andthey show temporal variations on timescales of tens ofminutes and hours. Grodent et al. [2003a] performed a longterm comparison of HST images and showed that theauroral morphology is fixed in system-III longitude (SIII).They produced a reference oval for comparison with imagestaken on different days, which is used later in this work. Themain auroral oval emission [Grodent et al., 2003a] isestimated to contribute to �75% of the Jovian auroralbrightness integrated over the pole and its brightness wasshown to vary between 50 and 500 kR (with a fewexceptions where the main oval brightened up to 1 MR).Furthermore a statistical analysis of the main oval as afunction of CML (Central Meridian Longitude in SIII)exhibits a modulation of the brightness which, for somesectors increases from noon to dusk and then decreasesagain in the magnetic evening [Grodent et al., 2003a]. Arecent study of the morphology of the main aurora emis-sions [Grodent et al., 2008] reveals several individualdetails of the main oval in terms of local time: the dawnsideportion forms a relatively narrow arc, appearing almostcontinuous in UV images, the post-noon portion consistsof auroral patches and the dusk portion appears to broadenand break from the main oval. These recent observations
JOURNAL OF GEOPHYSICAL RESEARCH, VOL. 113, A01215, doi:10.1029/2007JA012610, 2008ClickHere
for
FullArticle
1LPAP, Institut d’Astrophysique et de Geophysique, Universite deLiege, Belgium.
suggest substitution of the term ‘‘main oval’’, which wasinitially used to describe the Earth auroral emissions, withthe term ‘‘main emission’’. In this study the term ‘‘mainoval’’ will be often used to describe the term ‘‘mainemission’’.[4] Theoretical studies suggest that the main Jovian
auroral oval is connected to the magnetosphere-ionospherecoupling current system associated with the breakdown ofrigid corotation in the middle magnetosphere and maps tothe equatorial plane between �15 and �40 RJ [Cowley andBunce, 2001; Hill, 2001; Southwood and Kivelson, 2001;Nichols and Cowley, 2004]. As the plasma diffuses out-wards in the equatorial plane its angular velocity decreasesdue to conservation of the angular momentum. At a certaindistance, breakdown of corotation occurs and a strongcurrent system develops. When the plasma angular velocitybecomes lower than that of the neutral atmosphere ion-neutral collisions occur in the Pedersen layer of the iono-sphere. These produce a frictional torque which tends tospin the plasma back up toward corotation with the planet.The current circuit is closed by a system of field-alignedcurrents which flow from the ionosphere to the equator(upward) in the inner part of the system, and return(downward) in the outer part. The upward field alignedcurrents which are carried by downward moving electronsare associated with the main auroral oval. In this study weconcentrate in the description of the field aligned currentssince they are necessary for the formation of the mainauroral oval emissions. However, it is shown that otherauroral emissions can occur without the need of field-aligned currents, such as diffuse emissions by electronscattering [Bhattacharya et al., 2001] and secondary ovalemissions by electron pitch angle scattering due to whistlerwaves [Tomas et al., 2004].[5] Field-aligned current calculations are inferred from in
situ observations. Bunce and Cowley [2001b] used Pioneerand Voyager measurements in the middle magnetosphere(20 to 50 RJ) and found upward currents in the postmidnightsector along the Voyager passes and downward currents inthe dawn (�04:30 LT) and prenoon (�09:00 LT) sector
along the Pioneer trajectories. On the basis of Galileomagnetic field observations Khurana [2001] calculatedfield-aligned current distributions in the near equatorialplane. He showed the existence of upward currents in anarc from �13:00 to �08:00 LT and downward currents from�08:00 to �13:00 LT. Apart from observations, simulationshave also predicted equatorial and ionospheric distributionsof field-aligned currents. Walker and Ogino [2003] used aglobal magnetohydrodynamic simulation based on the in-teraction of Jupiter’s magnetosphere with the solar wind,and produced field-aligned current distributions in the nearequatorial magnetosphere. The equatorial field-aligned cur-rent pattern revealed upward currents in all local timesectors except in the late morning and early afternoon, inagreement with the observations. Additionally, the sameauthors mapped the currents along magnetic field lines fromthe equatorial plane to the ionosphere for various solar windconditions.[6] Estimations of the field-aligned currents [Cowley and
Bunce, 2001] suggest the existence of field-aligned voltagesof the order of �100 kV responsible for the acceleration ofprimary auroral electrons to �100 keV, able to produce thebrightness of the observed main auroral emissions and themean electron energy deduced from the UV spectral anal-yses [Gustin et al., 2004]. However, theoretical consider-ations [Cowley and Bunce, 2001, 2003; Cowley et al.,2003a, 2005] suggested that the aurora intensity is regulatedby the extent to which the equatorial plasma departs fromrigid corotation, with the largest coupling currents and themost intense auroras being associated with the largestdepartures. Krupp et al. [2001] reported measurements ofplasma flow velocities in the equatorial plane. They deriveda global flow pattern in the magnetosphere of Jupiter, basedon directional anisotropies of energetic ion distributions bythe Energetic Particles Detector onboard Galileo. Theyshowed that the flow is predominately directed in thecorotation direction. Strong dawn-dusk asymmetry is evi-dent in the plasma flow: the nearly corotating ions in thedawn-to-noon quadrant suddenly slow down in the noon-to-dusk quadrant.[7] In this work we make use of the VIP4 magnetic model
[Connerney et al., 1998], constrained from in situ magneticfield measurements and remote observations of the positionof the foot of Io flux tube in Jupiter’s ionosphere. Grodent etal. [2003a] compared the reference ovals in the north andsouth with the footprints of the magnetic field lines of 30 RJ
as derived by the VIP4 model [see Grodent et al., 2003a,Figure 6]. The observed and the VIP4 ovals are in relativelygood agreement, especially for the southern hemisphere.However, localized deviations do occur, with the largerinconsistencies in the northern hemisphere. The main ovalreference deviates from the 30 RJ oval between the 190� and230� meridians and the inconsistency is amplified along the150� meridian in a region called the ‘‘kink’’ that is specu-lated to be the result of an internal magnetic anomaly[Clarke et al., 2002b; Grodent et al., 2003a]. The deviationscould also come from the fact that the main oval connectsemission features that may very well map to differentregions of the magnetosphere and it should not be assumedto be at a fixed radial distance footprint. Additionally, recentstudies, making use of the VIP4 magnetic field model,showed that the latitudinal variations of the main oval
Figure 1. Raw HST-STIS clear image showing the FUVauroral emission at the north pole of Jupiter, taken on 28December 2000. The CML is 153�. The arrows indicate themain auroral features: the main oval, the Io footprint and itstrail and the polar emissions. The ellipse indicates thediscontinuity in the main oval.
A01215 RADIOTI ET AL.: DISCONTINUITY IN THE MAIN AURORAL OVAL
2 of 11
A01215
location could be the result of internal variation of thecurrent sheet parameters [Grodent et al., 2008].[8] In the present study we will concentrate on a region of
the main oval close to magnetic noon, where a clear drop ofthe intensity is frequently observed. In the first part,examples of the observed discontinuity for the north andsouth hemispheres are shown, followed by statistical resultsand the determination of its location in the equatorial plane.In the second part, observations, theoretical considerationsand simulations of the field-aligned currents in the Jovianmagnetosphere are discussed in association with theobserved discontinuity.
2. HST Observations of the Discontinuity inJupiter’s Main Auroral Oval
2.1. Data Reduction
[9] In this work we analyze images that were taken withthe photon-counting detector MAMA (MultiAnode MicroChannels Array) of the STIS (Space Telescope ImagingSpectrograph) and ACS (Advanced Camera of Survey) onboard the Hubble Space Telescope (HST). The MAMAarray consists of 1024 � 1024 pixels providing a field ofview (FOV) of 24.700 � 24.700 with a �0.0800 full width athalf maximum point spread function (PSF). Four differentfilters are used: clear and SrF2 from STIS and F115LP andF125LP from ACS. The brightness derived in this paperconsiders a conversion factor of count per pixel per secondfor 1 kiloRayleigh (kR) of H2 emission plus Lyman-adifferent for each filter. In particular, a factor of 0.0015,0.0005, 0.0049 and 0.00347 is used for clear, SrF2, F115LPand F125LP filters, respectively. In the image processing is
not taken into account the limb brightening effect. So as toproject the images a limb-fitting procedure is needed todetermine the center position of the planet. By this proce-dure the initial image is projected on a SIII map on whichfeatures corotating with planet, leading or lagging corota-tion are easy to detect. However, in this method there is agrowing uncertainty toward the limb and the pixels arestretched. For a detailed description of the data set and datareduction see Grodent et al. [2003a].[10] The viewing geometry for the southern Jovian aurora
is less favorable for the Earth-based observations. Thevicinity of the magnetic south pole to the rotation axisrestricts the view of the southern aurora compared to thenorthern. The stretching of the southern aurora emissionnear the limb persists and the location of the auroralemission in the south remains less accurate. Therefore weemphasize more the analysis of images in the northernhemisphere.
2.2. Discontinuity in the Main Auroral Oval:Observations
[11] Figure 1 shows an HST-STIS image of the FUVauroral emission at the north pole of Jupiter. The three mainauroral features: the main oval, the Io footprint togetherwith its trail and the polar emissions poleward of the mainoval are indicated by the arrows. In this study we concen-trate on a region along the main oval where the brightnessdrops forming a discontinuity. The location of this discon-tinuity is marked by the ellipse in Figure 1.[12] We view the aurora image in a polar projection in
system III polar coordinate system, where features thatcorotate, lead or lag corotation are easy to detect. Figure 2,
Figure 2. Left panel: Polar projection of an aurora image in System III polar coordinate system (dots)taken by HST-STIS on 28 December 2000 in the north hemisphere. The CML is 153�. The circleindicates the morphological center of the main oval (l = 185� and f = 74�) [Grodent et al., 2004]. Thedashed lines show the meridians starting from the center and define the position of the discontinuity. Themain auroral features and the magnetic noon are indicated. The raw image is shown in Figure 1. The colorscale shows the brightness in kR. Note that in deriving the brightness the limb brightening effect is nottaken into account. Right panel: Brightness profile of the main oval in kR (above the backgroundemission), as a function of the longitude (deg) of meridians with respect to the morphological center ofthe main oval, the longitude in SIII (deg) and the magnetic local time (hh:mm) derived by the magneticfield model VIP4. The horizontal dotted line indicates the threshold of 10% of the maximum brightnessalong the main oval and the vertical dashed lines show the boundaries of the discontinuity.
A01215 RADIOTI ET AL.: DISCONTINUITY IN THE MAIN AURORAL OVAL
3 of 11
A01215
left panel shows a polar projection in SIII of the image takenon 28 December 2000 in the north Jovian hemisphere. TheCML is 153� and the color bar indicates the brightness inkR. The main auroral features and the magnetic noon areindicated. The circle in the center of the auroral emissionshows its morphological center of the main oval, which islocated in SIII longitude l = 185� and latitude f = 74�[Grodent et al., 2004]. The morphological center is derivedgeometrically and it is independent of any magnetic fieldmodel. From the morphological center we draw meridiancuts along which we measure the emission of the main oval.The meridians between which the discontinuity is observedare indicated by the dashed lines. The right panel of Figure2 shows the brightness profile above the backgroundemission along the main oval as a function of longitudewith respect to the morphological center. The associated SIIIlongitude (deg) as well as the magnetic local time, MLT(hh:mm), derived by the magnetic field model VIP4 areshown for reference. It is evident that the brightness dropsand remains low for several tens of degrees in the prenoonlocal time sector. We define the discontinuity as the regionalong the main oval, where the emission drops below 10%of the maximum emission of the visible portion of the mainoval. The ‘‘10%’’ boundary is set empirically to represent
the drop of the emission along the oval. The same criterionis used for all the images examined in this study. When theemission near the discontinuity is changing less abruptly anuncertainty in defining the boundary of the discontinuitycan appear. This is in the order of a few degrees whichcorresponds to a few tens of minutes in MLT. For example adeviation of 5 deg will change the location of the discon-tinuity in MLT by 10 to 30 min depending on its SIIIposition.[13] We locate the discontinuity in the main oval in other
aurora images, based on the same method. We analyze HSTimages taken on the same day but at different CML, in orderto examine the origin of the discontinuity. Figure 3 showsaurora polar projections in SIII taken on 16 December 2000at different CML in the northern hemisphere. The arrowsindicate the magnetic noon and the dashed lines perpendic-ular to the main oval the edges of the discontinuity, derivedthe same way as described in Figure 2. It is evident that thediscontinuity is not observed in a fixed position in SIII.However, it appears fixed in magnetic local time, betweenthe prenoon and noon sector. The width of the discontinuityis shown to vary from image to image, as it is revealed bythe statistical study below (Table 1). On the top panels of
Figure 3. Polar projections of 4 HST STIS images in the north hemisphere in system III polarcoordinate system. The images are taken at the same day, 16 December 2000, at different CML. Thearrows show the magnetic noon and the dashed lines perpendicular to the main oval show the edges of thediscontinuity. Ganymede footprints are indicated in the top panels. The color bars in each panel indicatethe brightness emission with maximum at the top and minimum at the bottom of the scale.
A01215 RADIOTI ET AL.: DISCONTINUITY IN THE MAIN AURORAL OVAL
4 of 11
A01215
the same figure the Ganymede footprint is indicated. Itappears close to the discontinuity and slightly equatorward.It will be later used as reference for mapping the disconti-nuity to the equatorial plane. Ganymede footprints at thetwo bottom images could not be identified.[14] It is necessary to map the position of the disconti-
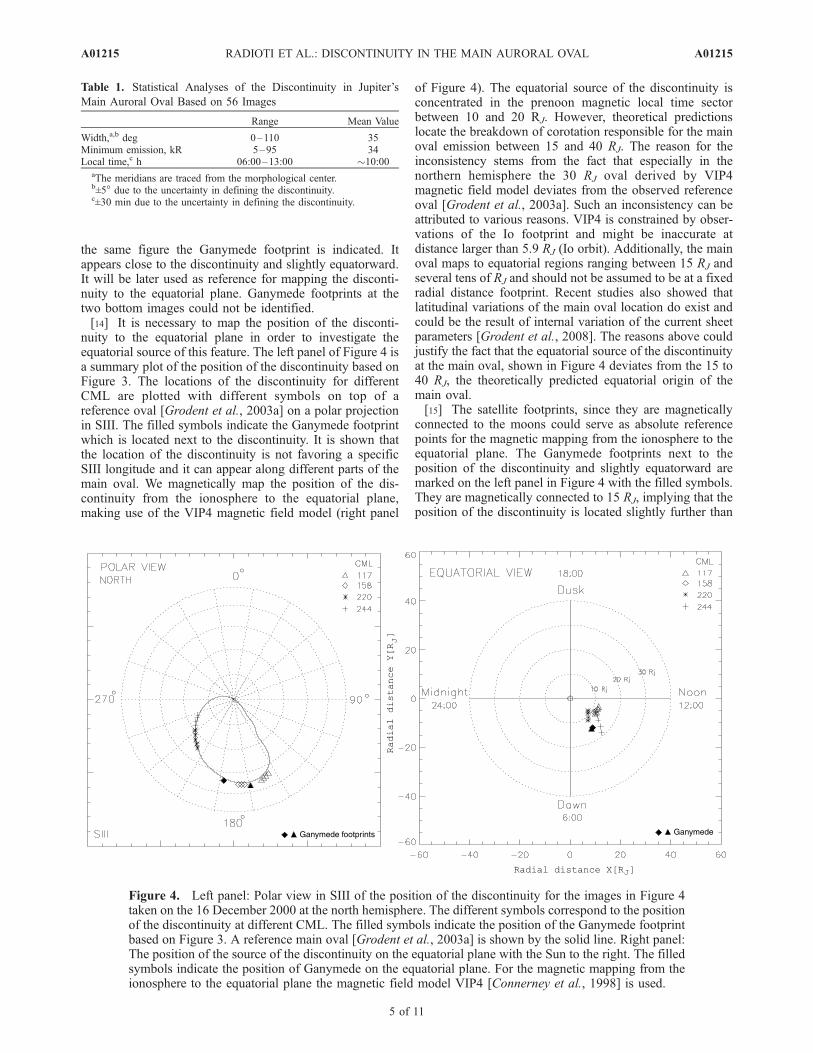
nuity to the equatorial plane in order to investigate theequatorial source of this feature. The left panel of Figure 4 isa summary plot of the position of the discontinuity based onFigure 3. The locations of the discontinuity for differentCML are plotted with different symbols on top of areference oval [Grodent et al., 2003a] on a polar projectionin SIII. The filled symbols indicate the Ganymede footprintwhich is located next to the discontinuity. It is shown thatthe location of the discontinuity is not favoring a specificSIII longitude and it can appear along different parts of themain oval. We magnetically map the position of the dis-continuity from the ionosphere to the equatorial plane,making use of the VIP4 magnetic field model (right panel
of Figure 4). The equatorial source of the discontinuity isconcentrated in the prenoon magnetic local time sectorbetween 10 and 20 RJ. However, theoretical predictionslocate the breakdown of corotation responsible for the mainoval emission between 15 and 40 RJ. The reason for theinconsistency stems from the fact that especially in thenorthern hemisphere the 30 RJ oval derived by VIP4magnetic field model deviates from the observed referenceoval [Grodent et al., 2003a]. Such an inconsistency can beattributed to various reasons. VIP4 is constrained by obser-vations of the Io footprint and might be inaccurate atdistance larger than 5.9 RJ (Io orbit). Additionally, the mainoval maps to equatorial regions ranging between 15 RJ andseveral tens of RJ and should not be assumed to be at a fixedradial distance footprint. Recent studies also showed thatlatitudinal variations of the main oval location do exist andcould be the result of internal variation of the current sheetparameters [Grodent et al., 2008]. The reasons above couldjustify the fact that the equatorial source of the discontinuityat the main oval, shown in Figure 4 deviates from the 15 to40 RJ, the theoretically predicted equatorial origin of themain oval.[15] The satellite footprints, since they are magnetically
connected to the moons could serve as absolute referencepoints for the magnetic mapping from the ionosphere to theequatorial plane. The Ganymede footprints next to theposition of the discontinuity and slightly equatorward aremarked on the left panel in Figure 4 with the filled symbols.They are magnetically connected to 15 RJ, implying that theposition of the discontinuity is located slightly further than
Table 1. Statistical Analyses of the Discontinuity in Jupiter’s
aThe meridians are traced from the morphological center.b±5� due to the uncertainty in defining the discontinuity.c±30 min due to the uncertainty in defining the discontinuity.
Figure 4. Left panel: Polar view in SIII of the position of the discontinuity for the images in Figure 4taken on the 16 December 2000 at the north hemisphere. The different symbols correspond to the positionof the discontinuity at different CML. The filled symbols indicate the position of the Ganymede footprintbased on Figure 3. A reference main oval [Grodent et al., 2003a] is shown by the solid line. Right panel:The position of the source of the discontinuity on the equatorial plane with the Sun to the right. The filledsymbols indicate the position of Ganymede on the equatorial plane. For the magnetic mapping from theionosphere to the equatorial plane the magnetic field model VIP4 [Connerney et al., 1998] is used.
A01215 RADIOTI ET AL.: DISCONTINUITY IN THE MAIN AURORAL OVAL
5 of 11
A01215
15 RJ. On the right panel of Figure 4 the position ofGanymede for both CML is indicated, for reference, onthe equatorial plane.[16] Similar analysis has been performed for the emis-
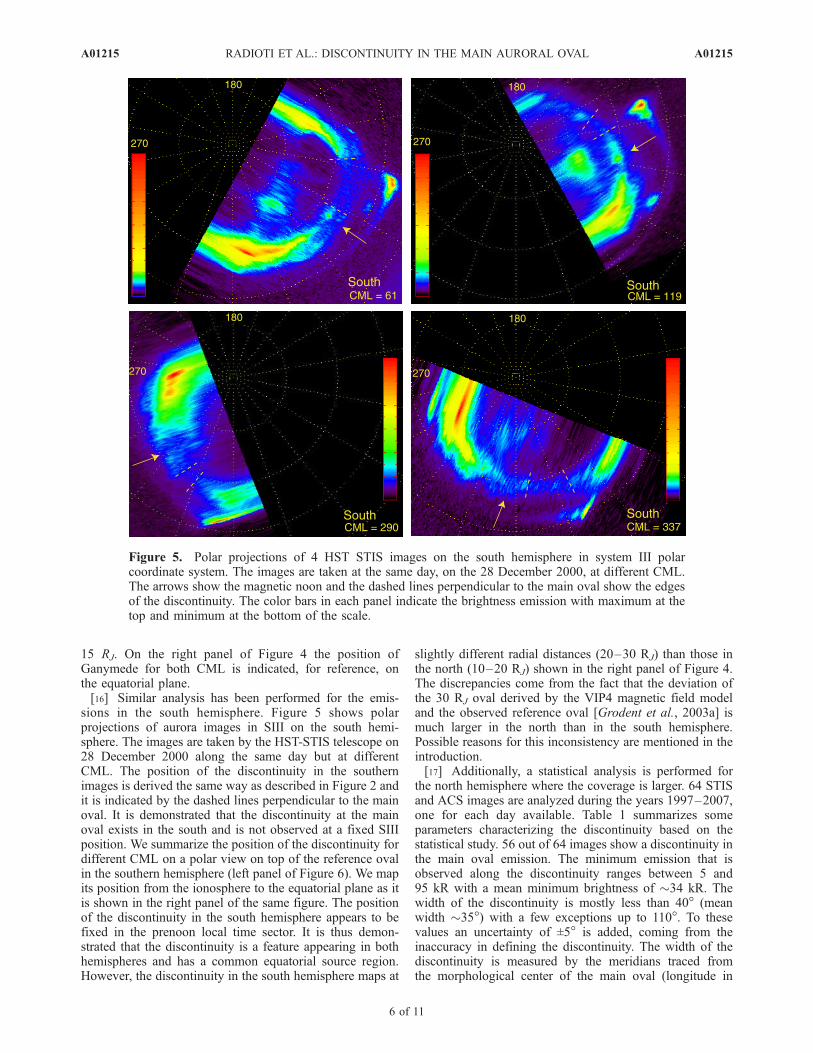
sions in the south hemisphere. Figure 5 shows polarprojections of aurora images in SIII on the south hemi-sphere. The images are taken by the HST-STIS telescope on28 December 2000 along the same day but at differentCML. The position of the discontinuity in the southernimages is derived the same way as described in Figure 2 andit is indicated by the dashed lines perpendicular to the mainoval. It is demonstrated that the discontinuity at the mainoval exists in the south and is not observed at a fixed SIIIposition. We summarize the position of the discontinuity fordifferent CML on a polar view on top of the reference ovalin the southern hemisphere (left panel of Figure 6). We mapits position from the ionosphere to the equatorial plane as itis shown in the right panel of the same figure. The positionof the discontinuity in the south hemisphere appears to befixed in the prenoon local time sector. It is thus demon-strated that the discontinuity is a feature appearing in bothhemispheres and has a common equatorial source region.However, the discontinuity in the south hemisphere maps at
slightly different radial distances (20–30 RJ) than those inthe north (10–20 RJ) shown in the right panel of Figure 4.The discrepancies come from the fact that the deviation ofthe 30 RJ oval derived by the VIP4 magnetic field modeland the observed reference oval [Grodent et al., 2003a] ismuch larger in the north than in the south hemisphere.Possible reasons for this inconsistency are mentioned in theintroduction.[17] Additionally, a statistical analysis is performed for
the north hemisphere where the coverage is larger. 64 STISand ACS images are analyzed during the years 1997–2007,one for each day available. Table 1 summarizes someparameters characterizing the discontinuity based on thestatistical study. 56 out of 64 images show a discontinuity inthe main oval emission. The minimum emission that isobserved along the discontinuity ranges between 5 and95 kR with a mean minimum brightness of �34 kR. Thewidth of the discontinuity is mostly less than 40� (meanwidth �35�) with a few exceptions up to 110�. To thesevalues an uncertainty of ±5� is added, coming from theinaccuracy in defining the discontinuity. The width of thediscontinuity is measured by the meridians traced fromthe morphological center of the main oval (longitude in
Figure 5. Polar projections of 4 HST STIS images on the south hemisphere in system III polarcoordinate system. The images are taken at the same day, on the 28 December 2000, at different CML.The arrows show the magnetic noon and the dashed lines perpendicular to the main oval show the edgesof the discontinuity. The color bars in each panel indicate the brightness emission with maximum at thetop and minimum at the bottom of the scale.
A01215 RADIOTI ET AL.: DISCONTINUITY IN THE MAIN AURORAL OVAL
6 of 11
A01215
SIII l = 185� and latitude f = 74�). One of the mostinteresting results of the statistical study is the location ofthe discontinuity in the equatorial plane. The result of thestudy is shown in the histogram in Figure 7. It is evident thatthe position of the discontinuity is localized in the prenoonand early noon sector between 08:00 and 13:00 LT(±30 min, due to the uncertainty in defining the disconti-nuity) with very few exceptions starting from 06:00 LT. Thisstudy establishes the existence of the discontinuity at themain auroral oval as a frequently observed feature, with anequatorial source region in the prenoon and noon sectormainly between 08:00 and 13:00 LT. In the next section wediscuss the origin of this discontinuity.
3. Field-Aligned Current Observations andSimulations: Comparison With AuroraObservations
[18] The main auroral oval is formed in the ionosphere bythe precipitation of energetic electrons. A requirement forthe presence of precipitating electrons since they are carry-ing a net current, is an upward field-aligned current to flowalong the field lines. Downward field-aligned currents willprohibit electron precipitation in the ionosphere and implythe absence of auroral emissions. In this section we comparethe equatorial source of the discontinuity with the field-aligned currents estimations based on in situ spacecraftobservations. Bunce and Cowley [2001b] found upwardcurrents along the postmidnight outbound trajectories ofVoyager 1 and 2 (�03:30 and 01:00 LT, respectively) anddownward currents along the Pioneer 10 outbound(�4:30 LT) and Pioneer 11 inbound (�9.00 LT) trajectories,
making use of Pioneer and Voyager measurements in themiddle magnetosphere (20 to 50 RJ). In particular, thePioneer 11 measurements showed current values close tozero at and beyond 25 RJ. The discrepancies between thedifferent trajectories are attributed to the distribution of theazimuthal currents. The azimuthal currents are estimated inprevious studies [Bunce and Cowley, 2001a] to be larger onthe nightside and decrease continuously toward noon, viadawn. Bunce and Cowley [2001b] showed that for thePioneer 10 and 11 passes, the divergence of the azimuthal
Figure 6. Left panel: Polar view in SIII of the position of the discontinuity for the images at Figure 6taken on the 28 December 2000 at the south hemisphere. A reference main oval [Grodent et al., 2003a] isshown by the solid line. Right panel: The position of the source of the discontinuity on the equatorialplane with the sun to the right. For the magnetic mapping from the ionosphere to the equatorial planeVIP4 [Connerney et al., 1998] is used. The position of the discontinuity at different CML is shown bydifferent symbols in the both panels.
Figure 7. Histogram showing the location of the dis-continuity in local time. The statistical analysis is based on56 STIS and ACS images during the years 1997–2007,each of them on a separate day. The dotted line indicates themean value. The VIP4 magnetic field model [Connerney etal., 1998] is used for the magnetic mapping.
A01215 RADIOTI ET AL.: DISCONTINUITY IN THE MAIN AURORAL OVAL
7 of 11
A01215
current is larger than the increase in the radial currentsuggesting the presence of reversed field-aligned currenton their pass flowing from the current sheet to the iono-sphere (downward currents). For the Voyager trajectories,however, the azimuthal current can provide only half of thesource needed, requiring the formation of upward field-aligned currents. Calculations of the angular velocity profiles(for the same value of Pedersen conductivity, S*p = 0.5 mho)revealed that along the Pioneer passes the angular velocityof the inner part of the region seems to fall less abruptlywith distance compared to that along Voyager passes. Theauthors attributed these discrepancies to magnetosphericdynamics: differing Io mass loading rate and compressionof the plasma by the magnetopause as it sweeps aroundfrom the nightside to the dayside (solar wind inducedasymmetry effects). Alternatively, decreasing the conduc-tivity with the equatorial distance could lead to similarvelocity profiles for all spacecraft trajectories [Bunce andCowley, 2001b]. The same authors related it to the reducedand reversed directions of the inferred field-aligned current.[19] The presence of downward currents estimated along
the Pioneer 10 and 11 passes in the prenoon and dawnsector, respectively, would prohibit electron precipitation inthe ionosphere and imply discontinuity in Jupiter’s mainauroral oval. It is worth investigating thoroughly themeasurements along the Pioneer 11 outbound trajectory(�9:00 LT) since it lies within the equatorial source of thediscontinuity based on HST images (between 08:00 and
13:00 LT, see Figure 7). From the field-aligned currentdensity values along the Pioneer 11 pass, we aim to derivethe precipitated energy flux in the ionosphere and compareit with the observed aurora brightness along the discontinu-ity in Jupiter’s main oval. For this purpose we will also usethe Voyager measurements for comparison.[20] The field-aligned current density jk/B values derived
from Voyager varied from �2 � 10�13 Am�2nT�1 (at20 RJ) to �1 � 10�13 Am�2nT�1 (at 50 RJ) while thePioneer 11 values were less than 10�13 Am�2nT�1
approaching zero [Bunce and Cowley, 2001b]. From thejk/B along the Voyager passes Bunce and Cowley [2001b]calculated the precipitating energy flux in the ionosphere,based on Knight’s kinetic theory [Knight, 1973] and usingplasma measurements by Voyager (plasma density of N �0.01 cm�3 and thermal energy of Wth � 2.5 keV). Thus theenergy flux in the ionosphere was calculated Ef �38 mWm�2 and consequently the auroral brightness�380 kR, a typical value for the main oval emissions[Grodent et al., 2003a]. For the Pioneer 11 pass, with jk/B <10�13 Am�2nT�1 we calculate in a similar way theprecipitating energy flux in the ionosphere, using howeverthe Voyager density and temperature parameters. Theenergy flux in the ionosphere is estimated to be Ef �1.56 mWm�2, which corresponds to �15 kR. This bright-ness value is near the lower limit but within the range of theobserved emission along the discontinuity, as revealed bythe statistical study (mean value 34 kR, see Table 1).[21] Field-aligned currents are also estimated based on
Galileo magnetic field observations covering all local timesand larger radial distances. From the divergence of theheight-integrated current flowing in the equatorial plane ofJupiter’s magnetosphere Khurana [2001] inferred field-aligned current distributions. The field-aligned current Jkis related to the divergence of the height-integratedperpendicular current (r � (J0?)), by integration of thecurrent continuity equation over the thickness of the currentsheet:
�2JkBZ
BL
¼ r: J�?ð Þ ¼ r: J�r þ J�f� �
; ð1Þ
where BZ is assumed to remain constant over the thicknessof the current sheet and BL is the field strength in the lobejust outside the current sheet. J0r and J0f are the height-integrated radial and azimuthal currents which are calcu-lated based on magnetic field observations [Khurana, 2001].It is obvious that a positive current divergencer � (J0?) in theequatorial plane implies a negative field-aligned current, Jk(directed southward in the northern lobe) in other words anupward flowing field-aligned current.[22] Figure 8 shows the divergence of the height-integrat-
ed perpendicular current (r � (J0?)), based on computationsof the J0r and J0f , flowing in the equatorial plane of Jupiter’smagnetosphere with the sun to the right [Khurana, 2001].The locations of the magnetopause and bow shock are alsoindicated. The data are averaged over 10 RJ � 3 h. Thewarm colors show the positive current divergence, meaninga current flowing into the current sheet from the ionospherein both hemispheres (upward current). The cold colorsindicate the negative current divergence, implying a currentflowing out of the sheet toward the ionosphere in both
Figure 8. Divergence of the height-integrated perpendi-cular currents (r(J?) / �Jk) based on Galileo observationsand projected on the equatorial plane of Jupiter’s magneto-sphere [Khurana, 2001]. The locations of the magnetopauseand the bow shock are shown. The data are averaged over10 RJ � 3 h. The warm colors indicate the positivedivergence and the cold colors the negative. The dashedlines indicate the starting and ending local times of thediscontinuity’s position in the equatorial plane 08:00 and13:00 LT as derived by the statistical analyses.
A01215 RADIOTI ET AL.: DISCONTINUITY IN THE MAIN AURORAL OVAL
8 of 11
A01215
hemispheres (downward current). At all local times exceptfor the early prenoon and noon sector between 10 and 30 RJ
upward field aligned currents (warm colors) are present,along which electrons can precipitate and create auroralemission. However, there is a region between early prenoonand noon that the field-aligned currents are directeddownward, prohibiting electron precipitation.[23] Such a local time asymmetry in the field-aligned
current pattern is not surprising. Khurana [2001] reportedlocal time variations of J0r and J0f . Both quantities appear tobe strong near midnight and systematically weak towardnoon. As a consequence their divergence J0r and J0f exhibitslocal time asymmetries. More specific between the radialdistances 10 to 30 RJ all local times except for the noonsector have positive radial current divergence (r � J0r)implying that field-aligned currents are flowing into theplasma sheet in this region. Additionally, calculations of thedivergence of the azimuthal current (r � J0f) demonstrated astrong dawn-dusk asymmetry, indicating that electriccurrent is drawn from the ionosphere into the equatorialplane in the dusk sector and returned to it in the dawnsector. The author argued that such a current distributionresults from the solar wind driven magnetospheric convec-tion. The r � (J0?) a combination of the divergence of J0fand J0r demonstrates accordingly asymmetries leading todownward field-aligned currents in the noon and prenoonsector.[24] On top of Figure 8 by dashed lines, we show the
statistical view of the equatorial source of the discontinuity.The 08:00 and 13:00 LT meridians, drawn by dashed lines,indicate the starting and ending local times of the disconti-nuity’s position in the equatorial plane, based on thehistogram in Figure 7. It is evident that the equatorial sourceregion lies at the same local time sector where field-alignedcurrents are flowing from the ionosphere into the currentsheet (downward currents). The presence of downwardfield-aligned currents implies that electrons can not precip-itate in the ionosphere and the main oval emissions are notproduced. However, given that the data in Figure 8 areaveraged over 10 RJ �3 h small variations of the currentcan be canceled out, such as those inferred by Pioneer 11 at09:00 LT that could produce faint emission along thediscontinuity. This is in agreement with the observationsalong the discontinuity region, where the emission lowers to<10% of the maximum emission and reaches values of�34 kR (see Table 1). Thus the field-aligned current patterncan predict well the observed position of the discontinuity inJupiter’s main auroral oval.[25] Theoretical studies suggest that the auroral intensity
is regulated by the extent to which the equatorial plasmadeparts from rigid corotation with the largest couplingcurrents and the most intense auroras related to the largestdepartures [Cowley and Bunce, 2001, 2003; Cowley et al.,2003a, 2005]. Plasma flow measurements based on Galileoobservations have shown strong dawn-dusk asymmetries inthe plasma flow [Krupp et al., 2001]: between 15 to 40 RJ inthe dawn-to-noon sector the plasma is nearly corotating,while it slows down in the noon-to-dusk sector. This wouldrequire weaker corotation enforcement currents, weaker/reversed field-aligned currents and consequently fainteraurora emissions in the prenoon magnetic local time. Sucha consideration is in accordance with the downward currents
and reduced field-aligned currents observed by Pioneer andGalileo in the prenoon and early noon sector and couldaccount for justifying the faint auroral emission at the mainoval. However, a derivation of the precipitated energy fluxin the ionosphere from the plasma flow velocities andcomparison with the observed aurora brightness is notincluded in the present work. Such a study would requirethe knowledge of the equatorial magnetic field, plasmadensity and ionospheric conductivity as a function of theradial distance and it is outside the scope of this study.[26] Walker and Ogino [2003] used a global magnetohy-
drodynamic simulation of the interaction of Jupiter’s mag-netosphere with the solar wind, which created a field-aligned current pattern in the near equatorial magneto-sphere. They showed that the currents in the middlemagnetosphere are predicted mostly upwards except in thelate morning and early afternoon local time sector inagreement with the field-aligned current pattern inferredby Galileo observations [Khurana, 2001]. Azimuthal cur-rents simulations [Walker and Ogino, 2003] showed anasymmetric current system as a result of the outflowingrotating plasma on the day side, constrained in the magne-topause until it rotates past noon. The asymmetric azimuthalcurrent system requires downward field-aligned currents atdawn and upwards at dusk as discussed by Bunce andCowley [2001b] and could account for the downward field-aligned currents in the prenoon and early afternoon sector,predicted by the simulations. Additionally Walker andOgino [2003] mapped the field-aligned currents just outsidetheir inner boundary (21 RJ) along magnetic field lines inthe ionosphere. Their simulations, for various solar windconditions, show that a band of upward currents is present atlatitudes which correspond to 20–40 RJ at all local timeswith an exception in the late prenoon sector, in accordancewith our observations.[27] Reversed field-aligned currents at other local times
such as those inferred by Pioneer 10 at 04:30 LT [Bunce andCowley, 2001b] are not shown in the average field-alignedcurrent pattern derived from Galileo data and the simulatedcurrents by Walker and Ogino [2003]. Possibly at localtimes outside the range of 08:00 to 13:00 LT reducedupward currents or downward currents could appear ran-domly and result in fainter emission along the main oval.Such decreases of the emission are occasionally formedalong the main oval but are not observed frequently in manyimages implying a temporal origin rather than one fixed at aspecific local time sector inferred by the magnetosphericplasma flows and current distribution of the Jovian magne-tospheric system. An example of such a random decrease ofthe main oval emission can be seen in Figure 3 for theimage taken at 158� CML. The emission drop is observed atlIII � 195�, which corresponds to the predawn sector.However, this drop is not as distinct as the discontinuitymarked by the dashed lines and is not observed constantlyin other images at a fixed magnetic local time. It couldoriginate from an occasionally downward field-alignedcurrent such as the one inferred by Pioneer 10.
4. Summary and Conclusions
[28] The present study is based on the analysis of HSTimages obtained during the years 1997–2007. We report the
A01215 RADIOTI ET AL.: DISCONTINUITY IN THE MAIN AURORAL OVAL
9 of 11
A01215
presence of a discontinuity in Jupiter’s main oval. Theemission along the main oval drops abruptly to less than10% of the maximum emission, forming a discontinuity inthe main oval. The feature is present in the north and southhemispheres. Images taken at different CML in both hemi-spheres show that the discontinuity appears fixed in mag-netic local time. We magnetically map its position from theionosphere to the equatorial plane, in order to investigate itsorigin. For the northern hemisphere the Ganymede footprintis also used as a reference for the magnetic mapping. Theposition of the discontinuity for both hemispheres is locatedin the prenoon sector. We perform a statistical analysisbased on images in the north for the years 1997–2007. Itis shown that the discontinuity is a frequently observedfeature, along which the emission varies between 5 and95 kR (with mean emission �34 kR) and its equatorialsource is located between 08:00 and 13:00 LT.[29] Pioneer and Voyager observations revealed the pres-
ence of reduced and reversed currents along the prenoonand predawn sectors, and upwards currents along themidnight [Bunce and Cowley, 2001b]. These discrepancieswere attributed to magnetospheric dynamics and alterna-tively to conductivity changes. From the close to zero field-aligned current along the Pioneer 11 pass (09:00 LT) wederive the precipitated energy flux in the ionosphere and wefind it in very good agreement with the observed faintemissions along the discontinuity as derived by the statis-tical study (minimum emission of 5 to 95 kR with meanvalue �34 kR). Field-aligned current calculations based onGalileo measurements covering all local times, showed theexistence of downward field-aligned currents in the nearequatorial plane between 08:00 and 13:00 LT [Khurana,2001]. The author argued that the current distributions arethe result of the solar wind driven magnetospheric convec-tion. Additionally, plasma flow measurements in the Jovianmagnetosphere, inferred by Galileo [Krupp et al., 2001]show evidence of nearly corotating plasma in the dawn-to-dusk sector. According to theoretical studies [Cowley andBunce, 2001, 2003; Cowley et al., 2003a, 2005] this wouldrequire weaker field-aligned currents (or reversed) andconsequently fainter aurora emissions in the prenoon mag-netic local time. Field-aligned current pattern in the nearequatorial plane based on magnetohydrodynamic simula-tions [Walker and Ogino, 2003] confirmed the observationsby predicting downward field-aligned currents in the pre-noon and early afternoon local time sector in the nearequatorial plane. It was additionally shown that field-aligned currents in the ionosphere predict an area ofdownward field-aligned currents in the region where thediscontinuity is observed.[30] In this work we report the presence of a discontinuity
in Jupiter’s main oval in both hemispheres, a featurefrequently observed in the prenoon and early afternoonsector. We associate its origin with the reduced or/anddownward field-aligned currents in that region, inferredby observations, theoretical considerations and magnetohy-drodynamic simulations. We base our conclusions on theconsistency of the location of its equatorial source with thelocation of the upward or/and reduced downward field-aligned currents. Finally, the precipitating energy flux in theionosphere calculated for a typical reduced field-aligned
current at the location of the equatorial source of thediscontinuity is found to be within the range of the observedfaint emission.
[31] Acknowledgments. This work is based on observations with theNASA/ESA Hubble Space Telescope, obtained at the Space TelescopeScience Institute (STScI), which is operated by AURA, inc. for NASAunder contract NAS5-26555. The research was supported by the PRODEXProgramme managed by the European Space Agency in collaboration withthe Belgian Federal Science Policy Office and by the Belgian Fund forScientific Research (FNRS).[32] Wolfgang Baumjohann thanks the reviewers for their assistance in
evaluating this paper.
ReferencesBallester, G. E., et al. (1996), Time-resolved observations of Jupiter’s far-ultraviolet aurora, Science, 274, 409–412.
Bhattacharya, B., R. M. Thorne, and D. J. Williams (2001), On the energysource for diffuse Jovian auroral emissivity, Geophys. Res. Lett., 14,2751–2754.
Bonfond, B., J.-C. Gerard, D. Grodent, and J. Saur (2007), Ultraviolet Iofootprint short timescale dynamics, Geophys. Res. Lett., 34, L06201,doi:10.1029/2006GL028765.
Bunce, E. J., and S. W. H. Cowley (2001a), Local time asymmetry ofequatorial current sheet in Jupiter’s magnetosphere, Planet. Space Sci.,49, 261–274.
Bunce, E. J., and S. W. H. Cowley (2001b), Divergence of the equatorialcurrent in the dawn sector of Jupiter’s magnetosphere: Analysis of Pio-neer and Voyager magnetic field data, Planet. Space Sci., 49, 1089–1113.
Clarke, J. T., et al. (1998), Hubble Space Telescope imaging of Jupiter’s UVaurora during the Galileo orbiter mission, J. Geophys. Res., 103, 20,217–20,236.
Clarke, J. T., et al. (2002a), Ultraviolet auroral emissions from the magneticfootprints of Io, Ganymede and Europa on Jupiter,Nature, 415, 997–1000.
Clarke, J. T., D. Grodent, and J. E. P. Connerney (2002b), The distortedshape of Jupiter’s northern auroral oval-A possible magnetic anomaly,paper presented at the 34th Annual Meeting, Div. for Planet Sci., Bir-mingham, Ala., October.
Connerney, J. E. P., M. H. Acuna, N. F. Ness, and T. Satoh (1998), Newmodels of Jupiter’s magnetic field constrained by the Io flux tube foot-print, J. Geophys. Res., 103, 11,929–11,939.
Cowley, S. W. H., and E. J. Bunce (2001), Origin of the main auroral ovalin Jupiter’s coupled magnetosphere-ionosphere system, Planet. SpaceSci., 49, 1067–1088.
Cowley, S. W. H., and E. J. Bunce (2003), Modulation of Jovian middlemagnetosphere currents and auroral precipitation by solar wind-inducedcompressions and expansions of the magnetosphere: Initial response andsteady state, Planet. Space Sci., 51, 31–56.
Cowley, S. W. H., E. J. Bunce, and J. D. Nichols (2003a), Origins ofJupiter’s main oval auroral emissions, J. Geophys. Res., 108(A4),8002, doi:10.1029/2002JA009329.
Cowley, S. W. H., E. J. Bunce, T. S. Stallard, and S. Miller (2003b),Jupiter’s polar ionospheric flows: Theoretical interpretation, Geophys.Res. Lett., 30(5), 1220, doi:10.1029/2002GL016030.
Cowley, S. W. H., I. I. Alexeev, E. S. Belenkaya, E. J. Bunce, C. E. Cottis,V. V. Kalegaev, J. D. Nichols, R. Prange, and F. J. Wilson (2005), Asimple axisymmetric model of magnetosphere-ionosphere coupling cur-rents in Jupiter’s polar ionosphere, J. Geophys. Res., 110, A11209,doi:10.1029/2005JA011237.
Gerard, J.-C., D. Grodent, R. Prange, J. H. Waite, G. R. Gladstone, V. Dols,F. Paresce, A. Storrs, L. Ben Jaffel, and K. A. Franke (1994), A remark-able aurora event on Jupiter observed in the ultraviolet with HubbleSpace Telescope, Science, 266, 1675–1678.
Gerard, J.-C., A. Saglam, D. Grodent, and J. T. Clarke (2006), Morphologyof the ultraviolet Io footprint emission and its control by Io’s location,J. Geophys. Res., 111, A04202, doi:10.1029/2005JA011327.
Grodent, D., J. T. Clarke, J. Kim, J. H. Waite Jr., and S. W. H. Cowley(2003a), Jupiter’s main auroral oval observed with HST-STIS, J. Geo-phys. Res., 108(A11), 1389, doi:10.1029/2003JA009921.
Grodent, D., J. T. Clarke, J. H. Waite Jr., S. W. H. Cowley, J.-C. Gerard, andJ. Kim (2003b), Jupiter’s polar auroral emissions, J. Geophys. Res.,108(A10), 1366, doi:10.1029/2003JA010017.
Grodent, D., J.-C. Gerard, J. T. Clarke, G. R. Gladstone, and J. H. Waite Jr.(2004), A possible auroral signature of magnetotail reconnection processon Jupiter, J. Geophys. Res., 109, A05201, doi:10.1029/2003JA010341.
Grodent, D., J.-C. Gerard, J. Gustin, B. H. Mauk, J. E. P. Connerney, andJ. T. Clarke (2006), Europa’s FUV auroral tail on Jupiter, Geophys. Res.Lett., 33, L06201, doi:10.1029/2005GL025487.
A01215 RADIOTI ET AL.: DISCONTINUITY IN THE MAIN AURORAL OVAL
10 of 11
A01215
Grodent, D., J.-C. Gerard, A. Radioti, B. Bonfond, A. Saglam (2008),Jupiter’s changing auroral location, J. Geophys. Res., 113, A01206,doi:10.1029/2007JA012601.
Gustin, J., J.-C. Gerard, D. Grodent, S. W. H. Cowley, J. T. Clarke, andA. Grad (2004), Energy-flux relationship in the FUV Jovian auroraeduced from HST-STIS spectral observations, J. Geophys. Res., 109,A10205, doi:10.1029/2003JA010365.
Hill, T. W. (2001), The Jovian auroral oval, J. Geophys. Res., 106, 8101–8107.
Khurana, K. K. (2001), Influence of the solar wind on Jupiter’s magneto-sphere deduced from currents in the equatorial plane, J. Geophys. Res.,106(A11), 25,999–26,016.
Knight, S. (1973), Parallel electric fields, Planet. Space Sci., 21, 741.Krupp, N., A. Lagg, S. Livi, B. Wilken, J. Woch, E. C. Roelof, and D. J.Williams (2001), Global flows of energetic ions in Jupiter’s equatorialplane: First-order approximation, J. Geophys. Res., 106, 26,017–26,032.
Nichols, J. D., and S. W. H. Cowley (2004), Magnetosphere-ionospherecoupling currents in Jupiter’s middle magnetosphere: Effect of precipita-tion-induced enhancements of the Pedersen conductivity, Ann. Geophys.,22, 1799–1827.
Southwood, D. J., and M. G. Kivelson (2001), A new perspective concern-ing the influence of the solar wind in the Jovian magnetosphere,J. Geophys. Res., 106, 6123–6130.
Tomas, A. T., J. Woch, N. Krupp, A. Lagg, K.-H. Glassmeier, and W. S.Kurth (2004), Energetic electrons in the inner part of the Jovian magne-topshere and their relation to auroral emissions, J. Geophys. Res., 109,A06203, doi:10.1029/2004JA010405.
Waite, J. H., Jr., et al. (2001), An auroral flare at Jupiter, Nature, 410, 787–789.
Walker, R. J., and T. Ogino (2003), A simulation study of currents in theJovian magnetosphere, Planet. Space Sci., 51, 295–307.
�����������������������B. Bonfond, J.-C. Gerard, D. Grodent, and A. Radioti, LPAP, Institut
d’Astrophysique et de Geophysique, Universite de Liege, Belgium.([email protected])N. Krupp and J. Woch, Max-Planck-Institut fur Sonnensystemforschung,
Katlenburg-Lindau, Germany.
A01215 RADIOTI ET AL.: DISCONTINUITY IN THE MAIN AURORAL OVAL