16
Discover In-Demand STEM Jobs and Career Pathways Labor Market Information on STEM Occupations in the Metro North Region
| Date post: | 29-Dec-2015 |
| Category: |
Documents |
| Upload: | neil-barnett |
| View: | 222 times |
| Download: | 2 times |

Discover In-Demand STEM Jobs and Career Pathways
Labor Market Information on STEM Occupations in the Metro North Region

0
10
20
30
40
50
60
70
80
90
26
46
15
74
28
74
54
85
26
72
Female
Male
*Based on U.S. Bureau of Labor Statistics, Household Data 2014 Annual Averages, www.bls.gov/cps/cp-saat11.pdf
Women in STEMPercent of Women in STEM Jobs in MA 2014

STEM Workforce Projections
•Executive Office of Labor and Workforce Development Labor Market Information ▫Employment in the Professional, Scientific, and Technical
Services sector in Metro North is projected to grow by 21% between 2012 and 2022.
▫That’s 11,054 jobs!▫http://lmi2.detma.org/Lmi/Industry_Projection.asp?
area=15000009long&cmd=Go

STEM Employment Projections
•From 2014 – 2016: Metro North▫4.8% increase in employment ▫An additional 2,676 jobs (http://lmi2.detma.org/Lmi/Industry_Projection_ST.asp)
•August 14th – September 13th, 2015: Metro North▫1,764 job openings were posted in the STEM Sector
(Professional, Scientific, and Technical Services, HWOL)

Professional and Technical ; 57553; 15%
Health Care and Social As-sistance; 56069; 14%
Educational Services; 43266; 11%
Retail Trade; 37497; 9%
Accommodation and Food Services, 30564, 8%
Manufacturing, 23543, 8%
Administrative and Waste Services; 25716; 6%
Information; 16766; 4%
Wholesale Trade; 17688; 4%
All Other; 87443; 22%
Metro North Total Employment by Industry
Professional and Technical
Health Care and Social Assistance
Educational Services
Retail Trade
Accomodation and Food Services
Manufacturing
Administrative and Waste Services
Information
Wholesale Trade
All Other
* Based on third quarter for 2014, utilizing 2-digit NAICS code, Employment and Wage (ES-202) data, Executive Office of Labor and Workforce Development.
Total Employment in Metro North is 396,123


Computer and Mathematical ; 27140; 26%
Life, Physical, and Social Science, 14690, 14%
Architecture and Engineering; 15050; 14%
Healthcare Practitioners and Technical Occupations; 29930;
29%
Production Occupations; 17630; 17%
STEM using Five High-Level OccupationsNumber of STEM Jobs in May 2014
Computer and Mathematical
Life, Physical, and Social Science
Architecture and Engineering
Healthcare Practitioners and Technical Occupations
Production Occupations
* Executive Office of Labor and Workforce Development Occupational Employment and Wage Statistics, Annual Data for Metro North WIA, May 2014.
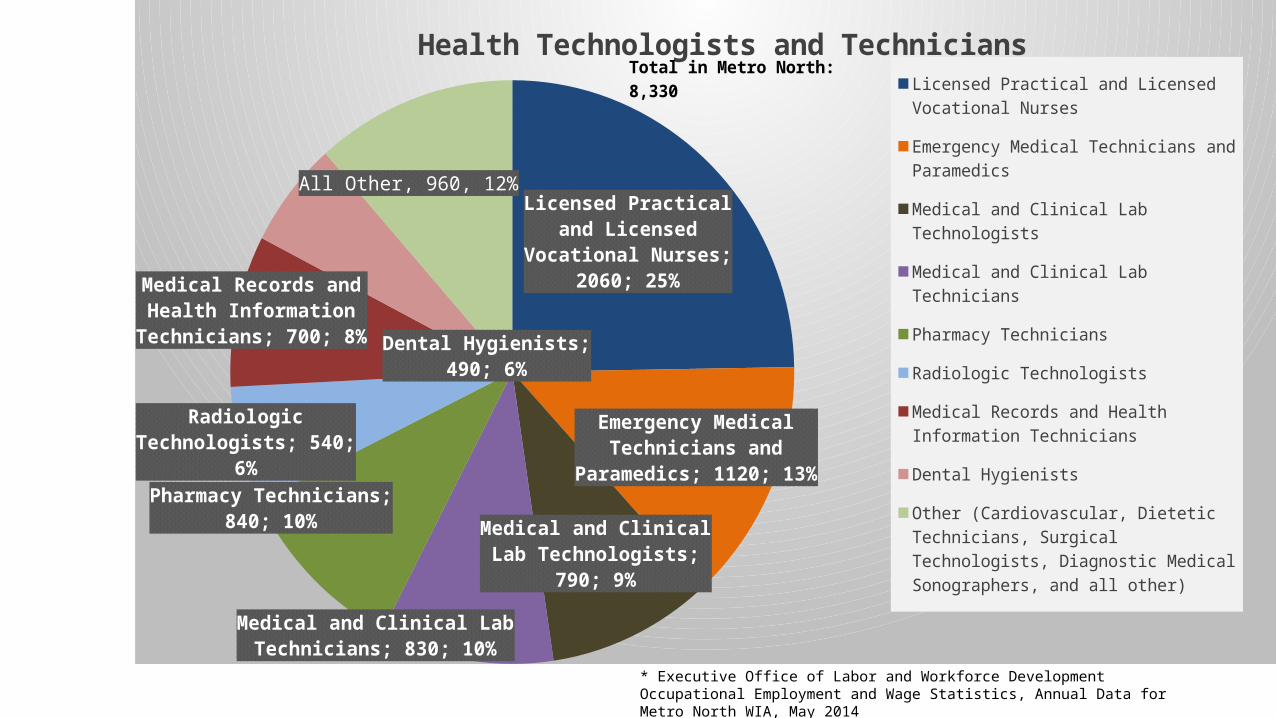
Licensed Practical and Licensed Vocational Nurses; 2060; 25%
Emergency Medical Technicians and Paramedics; 1120; 13%
Medical and Clinical Lab Technologists; 790; 9%
Medical and Clinical Lab Technicians; 830; 10%
Pharmacy Technicians; 840; 10%
Radiologic Technologists; 540; 6%
Medical Records and Health In-formation Technicians; 700; 8%
Dental Hygienists; 490; 6%
All Other, 960, 12%
Health Technologists and Technicians
Licensed Practical and Licensed Vocational Nurses
Emergency Medical Technicians and Paramedics
Medical and Clinical Lab Technologists
Medical and Clinical Lab Technicians
Pharmacy Technicians
Radiologic Technologists
Medical Records and Health Information Tech-nicians
Dental Hygienists
Other (Cardiovascular, Dietetic Technicians, Surgical Technologists, Diagnostic Medical Sonographers, and all other)
Total in Metro North: 8,330
* Executive Office of Labor and Workforce Development Occupational Employment and Wage Statistics, Annual Data for Metro North WIA, May 2014

Software Developers, Systems Software; 5430; 20%
Software Developers, Applications; 6260; 23%
Computer Systems Analysts; 4010; 15%
Computer Support Specialist; 2230; 8%
Computer Programmers; 1870; 7%
Network and Computer Systems Administrators; 1470; 5%
Computer Network Architects; 780; 3%
Database Administrators; 820; 3%
All Other, 4230, 16%
Computer and Mathematical Occupations
Software Developers, Systems Software
Software Developers, Applications
Computer Systems Analysts
Computer Support Specialist
Computer Programmers
Network and Computer Systems Administrators
Computer Network Architects
Database Administrators
Others (Web Developers, Computer Network Support Specialist, Operations Research Analysts, Statisticians, Information Security Analysts, and all other)
* Executive Office of Labor and Workforce Development Occupational Employment and Wage Statistics, Annual Data for Metro North WIA, May 2014
Total in Metro North: 27,140

Team Assemblers; 1960; 11%
Helpers - Production Workers; 1460; 8%
First-Line Supervisors of Produc-tion and Operating Workers;
1270; 7%
Electrical and Electronic Equipment Assemblers; 1260;
7%
Machinists; 1010; 6%
Packaging and Filling Machine Operators and Tendors, 1010,
6%
Inspectors, Testers, Sorters, Samplers, and Weighers; 930; 5%
Welders, Cutters, Solderers, and Brazers; 320; 2%
All Other, 5840, 39%
Production Occupations
Team Assemblers
Helpers - Production Workers
First-Line Supervisors of Production and Operating Workers
Electrical and Electronic Equipment Assemblers
Machinists
Packaging and Filling Machine Operators and Tendors
Inspectors, Testers, Sorters, Samplers, and Weighers
Welders, Cutters, Solderers, and Brazers
All Other (Cutting and Press Machine Setters, Multiple Machine Tool Setters, Electromechanical Equipment Assemblers, Com-puter-Controlled Machine Operators, and all other)
Total in Metro North: 17,630
* Executive Office of Labor and Workforce Development Occupational Employment and Wage Statistics, Annual Data for Metro North WIA, May 2014

Medical Scientists, Except Epidemiologists; 3660;
30%
Chemists; 1290; 11%
Biological Scientists, All Other; 690; 6%
Environmental Scientists and Specialists, Includ-ing Health; 690; 6%
Microbiologists; 630; 5%
Clinical, Counseling, and School Psychologists; 610;
5%
Economists; 460; 4%
Urban and Regional Planners; 440; 4%
All Other, 3750, 31%
Life, Physical, and Social Science Occupations
Medical Scientists, Except Epidemiologists
Chemists
Biological Scientists, All Other
Environmental Scientists and Specialists, Including Health
Microbiologists
Clinical, Counseling, and School Psychologists
Economists
Urban and Regional Planners
All Other (Materials Scientist, Conservation Scientist, Epidemiologists, Zoologists, Wildlife Biologists, and all other)
* Executive Office of Labor and Workforce Development Occupational Employment and Wage Statistics, Annual Data for Metro North WIA, May 2014
Total in Metro North: 12,220
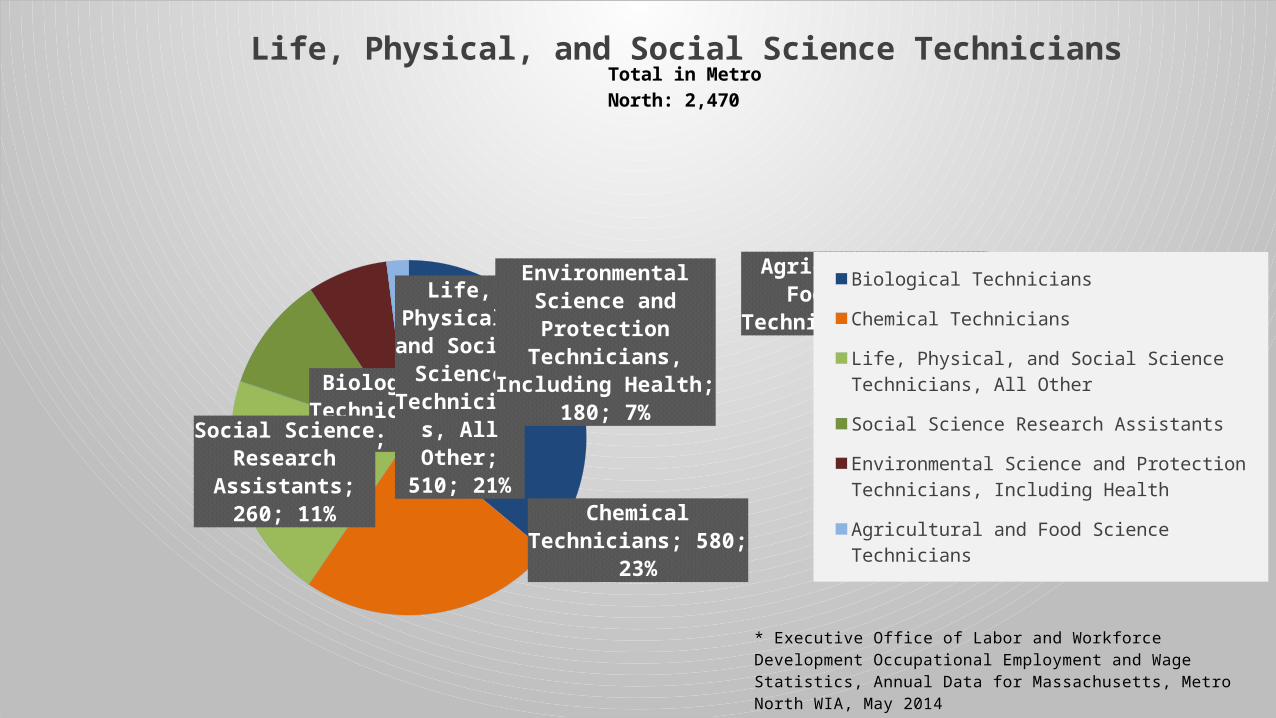
Biological Tech-nicians; 890; 36%
Chemical Technicians; 580; 23%
Life, Physical, and Social Science
Technicians, All Other; 510; 21%
Social Science Research Assis-tants; 260; 11% Environmental Science and
Protection Technicians, In-cluding Health; 180; 7%
Agricultural and Food Science Technicians; 50; 2%
Life, Physical, and Social Science Technicians
Biological Technicians
Chemical Technicians
Life, Physical, and Social Science Technicians, All Other
Social Science Research Assistants
Environmental Science and Protection Technicians, Including Health
Agricultural and Food Science Technicians
* Executive Office of Labor and Workforce Development Occupational Em-ployment and Wage Statistics, Annual Data for Massachusetts, Metro North WIA, May 2014
Total in Metro North: 2,470

Civil Engineers; 1850; 15%
Electronic Engineers, except Computer; 1750; 14%
Environmental Engineers; 1340; 11%
Mechanical Engineers; 1570; 13%
Electrical Engineers; 1110; 9%
Industrial Engineers; 1020; 8%
Computer Hardware Engineers ; 780; 6%
Architects, Except Landscape and Naval; 750; 6%
All Others, 1670, 14%
Architecture and Engineering Occupations
Civil Engineers
Electronic Engineers, except Computer
Environmental Engineers
Mechanical Engineers
Electrical Engineers
Industrial Engineers
Computer Hardware Engineers
Architects, Except Landscape and Naval
All Others (Biomedical, Chemical, Aerospace, Health/Safety, and all others)
Total in Metro North: 12,100
* Executive Office of Labor and Workforce Development Occupational Employment and Wage Statistics, Annual Data for Metro North, May 2014

Electrical and Electronic Engi-neering Technicians; 1080; 37%
Architectural and Civil Drafters; 430; 15%
Mechanical Engineering Tech-nicians; 330; 11%
Industrial Engineering Tech-nicians; 270; 9%
Electro-Mechanical Technicians; 240; 8%
Engineering Technicians, Except Drafters, All Other; 170; 6%
Engineering Technicians, 150, 5%
All Other, 330, 12%
Electrical and Electronic Engineering Technicians
Architectural and Civil Drafters
Mechanical Engineering Technicians
Industrial Engineering Technicians
Electro-Mechanical Technicians
Engineering Technicians, Except Drafters, All Other
Civil Engineering Technicians
All Other (Mechanical Drafters, Electrical and Electronic Drafters, and all other)
* Executive Office of Labor and Workforce Development Occupational Em-ployment and Wage Statistics, Annual Data for Metro North WIA, May 2014
Engineering and Mapping TechniciansTotal in Metro North: 2,950


Keep in Touch!
Meelynn WongAssociate Director
Metro North Regional Employment Board/Metro North STEM Network
617-871-1115, [email protected]
Like us on Facebook!Metro North STEM Network
https://www.facebook.com/pages/Metro-North-STEM-Network/982518531765946


