52
CISCO SYSTEMS, INC. 2000 ANNUAL REPORT DISCOVER ALL THAT’S POSSIBLE ON THE INTERNET

C I S C O SYS T E M S , I N C .
2 0 0 0 A N N UA L R E P O R T
DISCOVER ALL THAT’S POSSIBLE ON THE INTERNET

3 C I S C O S Y S T E M S , I N C . 2 0 0 0 A n n u a l R e p o r t
C I S C O S Y S T E M S , I N C . is the worldwide leader in networking for the Internet. Cisco hardware, software, and service
offerings are used to create Internet solutions so that individuals, companies, and countries have seamless access to
information—regardless of differences in time and place. Cisco solutions provide competitive advantage to our customers
through more efficient and timely exchange of information, which in turn leads to cost savings, process efficiencies,
and closer relationships with their customers, prospects, business partners, suppliers, and employees. These solutions
form the networking foundation for companies, universities, utilities, and government agencies worldwide.
The company was founded in 1984 by a small group of computer scientists from Stanford University seeking an
easier way to connect different types of computer systems. Cisco Systems shipped its first product in 1986. Since
then, Cisco has grown into a multinational corporation with more than 34,000 employees around the world. We
invite you to learn more about Cisco Systems at www.cisco.com.
TABLE OF CONTENTS
F I N A N C I A L H I G H L I G H T S 1
L E T T E R T O S H A R E H O L D E R S 2
D I S C O V E R A L L T H AT ’ S P O S S I B L E 6
C U S T O M E R C A R E 8
C O M M E R C E 10
S U P P LY– C H A I N M A N A G E M E N T 12
W O R K F O R C E O P T I M I Z AT I O N 14
F I N A N C I A L R E V I E W 16
S H A R E H O L D E R I N F O R M AT I O N 48
PROFILE
This report may contain projections or other forward-looking statements regarding future events or the future financial performance of the Company that involve risks anduncertainties. Readers are cautioned that these forward-looking statements are only predictions and may differ materially from actual future events or results. Readers arereferred to the documents filed by Cisco with the Securities and Exchange Commission, specifically the most recent reports on Forms 10-K, 8-K, and 10-Q, including amendmentsthereto, which identify important risk factors that could cause actual results to differ from those contained in the forward-looking statements, including risks associatedwith acquisition strategy, dependence on new product offerings, competition, patents, intellectual property and licensing, future growth, rapid technological and marketchange, manufacturing and sourcing risks, Internet infrastructure and regulation, international operations, volatility of stock price, financial risk management, and potentialvolatility in operating results, among others.

C I S C O S Y S T E M S , I N C . 1
FINANCIAL HIGHLIGHTS (1)
N E T S A L E S(Dollars in billions)
N E T I N C O M E(Dollars in billions)
D I L U T E D N E T I N C O M E P E R S H A R E(In dollars)
CONSOLIDATED BALANCE SHEETS DATA(1)
(In millions)
J u l y 2 9 , 2 0 0 0 J u l y 3 1 , 1 9 9 9 J u l y 2 5 , 1 9 9 8
Working capital $ 5,914 $ 1,723 $2,057
Total assets $32,870 $14,893 $9,043
Shareholders’ equity $26,497 $11,811 $7,197
(1) All historical financial information has been restated to reflect the acquisitions of StratumOne Communications, Inc. and TransMedia Communications, Inc. in the first quarterof fiscal 2000, Cerent Corporation and WebLine Communications Corporation in the second quarter of fiscal 2000, and ArrowPoint Communications, Inc., InfoGear TechnologyCorporation, and SightPath, Inc. in the fourth quarter of fiscal 2000, which were accounted for as poolings of interests. In addition, the historical financial information has beenrestated to reflect the acquisition of Fibex Systems, which was completed in the fourth quarter of fiscal 1999 and accounted for as a pooling of interests.
CONSOLIDATED STATEMENTS OF OPERATIONS DATA(1)
(In millions, except per-share amounts)
Y e a r s E n d e d J u l y 2 9 , 2 0 0 0 J u l y 3 1 , 1 9 9 9 J u l y 2 5 , 1 9 9 8
Net sales $18,928 $12,173 $8,489
Income before provision for income taxes $ 4,343 $ 3,203 $2,271
Net income $ 2,668(a) $ 2,023(b) $1,331(c)
Net income per common share—diluted* $ 0.36(a) $ 0.29(b) $ 0.20(c)
Shares used in per-common share calculation—diluted* 7,438 7,062 6,658
* Reflects the two-for-one stock split effective March 2000.
(a) Net income and net income per common share include in-process research and development expenses of $1.37 billion, amortization of goodwill and purchased intangible assets of$291 million, acquisition-related costs of $62 million, payroll tax on stock option exercises of $51 million, and net gains realized on minority investments of $531 million. Proforma net income and diluted net income per common share, excluding these items net of tax of $0, were $3.91 billion and $0.53, respectively.
(b) Net income and net income per common share include in-process research and development expenses of $471 million, amortization of goodwill and purchased intangible assets of$61 million, and acquisition-related costs of $16 million. Pro forma net income and diluted net income per common share, excluding these items net of related tax benefits of $54 million,were $2.52 billion and $0.36, respectively.
(c) Net income and net income per common share include in-process research and development expenses of $594 million, amortization of goodwill and purchased intangible assets of$23 million, and net gains realized on minority investments of $5 million. Pro forma net income and diluted net income per common share, excluding these items net of related taxbenefits of $67 million, were $1.88 billion and $0.28, respectively.
4.1
6.5
8.5
12.2
18.9
’96 ’97 ’98 ’99 ’00
0.91.0
1.3
2.0
2.7
’96 ’97 ’98 ’99 ’00
.15.17
.20
.29
.36
’96 ’97 ’98 ’99 ’00
2 W W W . C I S C O . C O M
TO OUR SHAREHOLDERS
J O H N T. C H A M B E R S
P R E S I D E N T A N D C H I E F E X E C U T I V E O F F I C E R
J O H N P. M O R G R I D G E
C H A I R M A N O F T H E B O A R D
D O N A L D T. VA L E N T I N E
V I C E C H A I R M A N O F T H E B O A R D

C I S C O S Y S T E M S , I N C . 3
Over the next two decades, the Internet economy will bring about more dramatic changes in the way we work, live,
play, and learn than we witnessed during the last 200 years of the Industrial Revolution. Cisco is well-positioned to
help our customers survive the Internet Revolution by turning these changes into competitive advantage. We provide
the Internet solutions that will help our customers generate new revenue, reduce costs, increase productivity, and
empower their employees.
For the past two years, Cisco has been asking business and government leaders around the world, “Are you ready?”
Using our company as an example, our focus has been on educating customers about how effective use of the Internet
can increase productivity and revolutionize their business models. Today, our customers are not only ready, but
are turning to Cisco to show them how to capture the power of the Internet by implementing open standards-based
Internet business models.
During the last decade, our passion has been to increase customer satisfaction and to achieve our stretch goal of
maintaining the number-one or -two market share position in every market in which we compete. Today, Cisco holds
a leadership position in 16 of our 17 key markets. Cisco’s success is the result of our solutions that provide data, voice,
and video over a single network and our ability to blend internal development, acquisitions, and partnerships.
Cisco benefited from exceptional returns this past year because we successfully increased our customers’ satisfaction.
For fiscal 2000, Cisco reported revenue of $18.93 billion, a 55-percent increase when compared with revenue of
$12.17 billion in fiscal 1999. Pro forma net income was $3.91 billion or $0.53 per share for fiscal 2000, compared
with pro forma net income of $2.52 billion or $0.36 per share for fiscal 1999, increases of 56 percent and 47 percent,
respectively. Actual net income for the year was $2.67 billion or $0.36 per share, compared with fiscal 1999 net
income of $2.02 billion or $0.29 per share.
Cisco has been one of the fastest-growing and most profitable companies in the history of the computer industry.
We are widely accepted as the Internet expert and the Internet company, which is an obvious advantage when we talk
to customers about their futures. Our success has been rewarded with one of the highest market capitalizations in the
world. This achievement is the result of our commitment to help customers become successful in today’s ever-changing,
competitive landscape.
The Internet economy has grown more rapidly than even our most optimistic predictions and fuels the strongest
period of economic prosperity in history. In the United States alone, this economy added 650,000 jobs and generated
revenue in excess of half a trillion dollars in 1999. To put this in perspective, the Internet economy’s workforce now
surpasses the entire active U.S. military, insurance, communications, and public utilities industries and is twice the size
of the airline, chemical and allied products, legal, and real-estate industries.

There is a direct correlation between the strength of this economy and the unprecedented productivity gains we are
witnessing today. We refer to this phenomenon as the “Network Effect,” which is the result of information technology
becoming networked and Internet applications being used to re-engineer business processes. Companies that understand
the Network Effect can gain competitive advantage by quickly detecting and responding to situations such as real-time
changes in customer demand.
Cisco has become a trusted technology partner and business advisor to many of the largest companies in the world.
We are not only a technology advisor, but also an advanced user of Internet technology to run our own business. The
adoption of Internet applications in each of Cisco’s functional areas is an integral part of our business-planning process and
results in tremendous productivity benefits and cost savings. During this past fiscal year, for example, 90 percent of
our customer orders were transacted over the Internet. We have created world-class e-commerce, customer support, and
workforce optimization applications and are the leader in virtual manufacturing, virtual close, and e-learning solutions.
Our goal is to help customers develop similar, Internet-centric business models so that they can benefit from productivity
improvements. For example, our Internet Business Solutions Group has consulted with executives in more than 50 percent
of the Fortune 250 companies, 45 percent of the top companies in Europe, the Middle East, Africa, and Asia, and
65 percent of the leading service providers. This group provides business-strategy consulting and helps move our
relationships with customers from that of a vendor to a strategic partner.
Successful companies in the 1980s achieved their leadership positions with a vertical
business model and an internal focus. In the 1990s, Cisco changed the dynamics of market
leadership by focusing on a combination of internal development and acquisitions. This
decade, leading companies will develop internally, acquire effectively, and form an
“ecosystem” of partnerships in a horizontal, rather than a vertical, business model.
Companies participating in an ecosystem—an open standards-based community that
works toward a common goal—will emerge as the market and industry leaders of the
future. Customers are the real beneficiaries of our ecosystem model because it allows
us to remain agile, quickly enter new markets, and provide both breadth and depth of
solutions through the ecosystem community.
In addition to expanding our ecosystem, we also increased our investment in internal
product development by 61 percent and continued to grow through acquisitions. Since
1993, we have acquired or announced our intent to acquire 65 companies. Moving
forward, our technology strategy will continue to be driven by internal development
complemented by acquisitions and strategic alliances.
4 W W W . C I S C O . C O M
Five years ago it took Cisco
14 days to close its books
each quarter. Now, with
the “virtual close,” using
powerful Internet technology,
Cisco executives have real-
time, daily access to company
financial information,
empowering them and their
employees to instantly react
to market shifts and changing
business requirements.
I N S I D E C I S C O

C I S C O S Y S T E M S , I N C . 5
Following the lead of business, we saw governments from around the world begin to recognize the strong correlation
between the Internet and economic success. This past year, we met with government leaders from many countries, including
Argentina, Chile, China, France, Germany, Italy, Japan, Jordan, Korea, South Africa, Taiwan, and the United Kingdom.
They all realized the Internet’s potential impact on their country’s future and were eager to learn how to use the
Internet more effectively.
The Industrial Revolution of 200 years ago divided society by creating a gap between the “haves” and “have-nots.”
Today’s Internet Revolution has the potential to unite everyone by combining the strength of the Internet and education,
the two great equalizers in life. By applying what we’ve learned in business to all aspects of society, we have the power
to use technology to create an Internet gateway that has the potential to positively change people’s lives.
Cisco is in a unique position to be a pioneer in embracing this digital opportunity and closing the gap. As such, our
philanthropy strategy focuses on education, workforce development, and basic human needs. We continue to invest and
grow the Cisco Networking Academy Program, which has enrolled more than 81,000 students in 83 countries.
These academies provide networking skills to a broad range of students, including those in high school, community
colleges, homeless shelters, and juvenile centers and outgoing military personnel.
In addition, our employees contributed more than $1 million to the Second Harvest Food Bank this past year. Cisco
gave more than $2.5 million in grants to our global community and committed another $5 million to Habitat for
Humanity over the next five years. We also launched the Netaid.org Web site and movement, a joint initiative with
the United Nations Development Program, a number of talented musicians, and several technology companies, to
help end the cycle of extreme poverty. Our employees supported additional programs such as the Special Olympics,
InnVision, the National Teacher Training Institute, and a variety of global relief efforts. These efforts are Cisco’s way
of preparing future generations and less-developed nations to participate in the Internet economy.
In our opinion, the radical business transformations taking place around the world will accelerate, making the
opportunities ahead of Cisco far greater than ever before. We believe that Cisco has the potential to be the most
influential and generous company in history. We are in the fortunate position to be at the center of the Internet economy,
and we recognize that although this position gives us confidence, we must balance this confidence with healthy paranoia.
We are proud of our accomplishments and want to thank our shareholders, customers, employees, partners, and suppliers
for their continued commitment and confidence in our ability to execute. Together, we are only beginning to explore
all that’s possible on the Internet.
J O H N T. C H A M B E R S
P R E S I D E N T A N D
C H I E F E X E C U T I V E O F F I C E R
J O H N P. M O R G R I D G E
C H A I R M A N O F T H E B O A R D
D O N A L D T. VA L E N T I N E
V I C E C H A I R M A N O F T H E B O A R D

6 W W W . C I S C O . C O M
For several years we have asked our customers, “Are you ready?” for the Internet.
Today, they are ready and they want to know how to get there, quickly and successfully.
Organizations and governments are rethinking their business models.They are looking
for a road map to chart their company’s course through the Internet economy. And they
are turning to Cisco to help them discover all that’s possible on the Internet.
To transform a “bricks-and-mortar” organization into an Internet organization takes
more than just adding an e-commerce veneer. It takes rethinking the entire business
from the inside out and making investments in your Internet technology portfolio to
bring home the best return. It impacts groups across the entire organization, changing
the way companies work internally and how they work with their customers, partners,
suppliers, and employees. In the near future, a business not on the Internet will not be
in business. On the following pages, we have highlighted a few examples of how the
Internet has changed the way that people work, live, play, and learn.
Cisco itself often serves as the best example of a business that has changed itself by
using the Internet. We have always believed that technology could help us do things
that our competitors could not. Customer service was the first application to go on line.
This was quickly followed by operations in manufacturing, commerce, finance, recruiting,
marketing, training, and sales. It has given us a competitive advantage in our industry.
It has allowed us to remain agile and responsive, and it is based on employee and customer
empowerment through the Internet. We provide this same expertise to our customers,
helping them create Internet solutions for their organizations.
DISCOVER ALL THAT’S POSSIBLE ON THE INTERNET...

C I S C O S Y S T E M S , I N C . 7
THE INTERNET IS CHANGING EVERYTHING, INCLUDING EVERY IDEA OF WHAT IS POSSIBLE.
...FROM THE COMPANY THAT CAN SHOW YOU HOW
8 W W W . C I S C O . C O M
Building strong customer loyalty is important for organizations in today’s ever-changing
Internet economy. Good customer service is just as critical for online services as it is with
a personal sales call or in a retail environment. An online customer-care strategy that
focuses on consumer needs can ensure high customer satisfaction and retention while
also reducing sales, marketing, and service costs.
Casual clothing and home retailer Lands’ End knows this firsthand. Being the first direct
merchant to offer a toll-free number to customers and also one of the first to establish an
online presence, the company was no stranger to new technologies. While competitors
were eliminating live customer service phone calls to reduce costs, Lands’ End wanted to
make online shopping more personal. In September 1999, it launched Lands’ End Live,
an interactive site where customers and service representatives can communicate in real
time while shopping on line. Shoppers ask questions and get instant answers, via either
text-based Internet chat or an instant telephone callback, making the experience more
personal. They can also use the “Shop With A Friend” tool to browse the site with
anyone, anywhere in the world, or shop along with a service representative.
To implement the solution, Lands’ End put together a team with members from all areas of
the organization. The team set deadlines, established procedures, and evaluated several
solutions. It chose an easy-to-use, reliable system that would integrate into its existing
call-center infrastructure. With the help of Cisco, Lands’ End also established a customized
training program for all online service representatives and conducted usability tests
before launching the new site features. All of this was done in just four months.
Since the introduction of Lands’ End Live, the company has received several hundred
chat and callback requests each week. Today, its Web sales comprise more than 10 percent
of its total business—$138 million in fiscal 2000. Customers say they are getting better
service and enjoy the human touch provided by Lands’ End Live. The bottom line is
that Lands’ End is paying attention to the most important element of its business—the
customer. And it shows.
C U S T O M E R C A R E : LANDS ’ END www.landsend.com
FROM CUSTOMER SUPPORT TO CUSTOMER DELIGHT
The Cisco Technical
Assistance Center (TAC)
Web site was one of the first
to add real-time assistance
for its customers, enhancing
the company’s ability to
close out inquiries with one
customer interaction.
Approximately 80 percent
of all support questions
are answered on line.
Customer-care solutions
across the company saved
Cisco $270 million and
increased customer
satisfaction by 25 percent.
I N S I D E C I S C O

C I S C O S Y S T E M S , I N C . 9
WHEN WE MOVED OUR CUSTOMERS FROM “ON HOLD” TO “ON LINE,” WE MOVED FROM
CUSTOMER SUPPORT TO CUSTOMER DELIGHT.

Moving from a successful “bricks-and-mortar” retailer to an equally successful “clicks-
and-mortar” strategy can be daunting. But recent studies from the University of Texas
and the U.S. Department of Commerce predict that e-commerce will comprise 4.4 percent
of the U.S. gross domestic product by 2002. Canadian-based book retailer Chapters, Inc.
recognized the possibilities that the Internet provides and launched Chapters Online.
Chapters, Canada’s largest book retailer, operates 70 superstores and 243 smaller stores.
When the retailer expanded into the online world, the company knew that it had to
stick to its original mission of providing a world-class selection emphasizing products
and content of interest to Canadians. Chapters designed its site with a focus on Canadian
books, music, and movies, with reviews by Canadian critics and Canadian best-seller
lists. It also extended the online experience to its retail stores. Its 70 superstores house
kiosks that conveniently provide online ordering when a book is out of stock. The
company teamed up with established technology leaders Cisco and AT&T (a Cisco
Powered Network provider) to maximize time and resources to quickly launch the best
possible site. Chapters Online launched its Web site, www.chapters.ca, three months
after concept, in April 1999.
While planning an e-commerce strategy, network reliability and redundancy are crucial
for the best customer experience. To address reliability issues, Chapters Online deployed
Cisco software to prevent any bottlenecks, giving online shoppers quick access to all
areas of the site at all times. To successfully handle redundancy concerns, Chapters
erred on the side of caution and added backup systems to ensure uninterrupted service.
It knew even the smallest degree of visitor frustration might prompt potential customers
to flee the site. To date, the site has yet to experience any downtime.
Today, Chapters Online is Canada’s most popular online retailer. In its holiday quarter,
revenue was 2,000 percent higher over the same quarter just one year earlier. In 1999,
Chapters sold Canadian-focused merchandise to more than 400,000 online customers.
Industry experts say that the company is at least one year ahead of the country’s other
online retailers. This example shows that with careful planning and the right alliances, a
bricks-and-mortar company can transform itself into an e-commerce powerhouse.
10 W W W . C I S C O . C O M
C O M M E R C E : CHAPTERS ONLINE www.chapters.ca
FROM CORNER STORE TO ONLINE STORE
Cisco operates the world’s
largest e-commerce site,
with 90 percent of its orders
placed on line. Using net-
worked applications, orders
are 99-percent accurate the
first time they are entered,
saving time and money.
Cisco gains a financial
contribution of $60 million in
operating cost savings from
its e-commerce applications.
I N S I D E C I S C O

C I S C O S Y S T E M S , I N C . 11
REAL ESTATE WAS LIMITING OUR GROWTH. SO WE WENT FROM BUILDING NEW STORES ON EVERY CORNER,
TO OPENING ONLINE STORES IN EVERY HOME.

12 W W W . C I S C O . C O M
In today’s economy, implementing a “virtual” supply-chain system is a vital element
of success. From aerospace and automotive to construction and manufacturing
organizations, companies worldwide are taking advantage of the Internet to create
electronic marketplaces where customers, suppliers, and business partners collaborate
with real-time results.
Honeywell International, one of the world’s most successful and established manufacturing
companies, is reshaping itself in the Internet economy. Honeywell’s management vowed
to increase its use of the Internet to expand its business. In July 1999, it launched
MyPlant.com, a business-to-business Web site that connects customers and suppliers
in the manufacturing industry. At the site, large and small companies from around
the world share procurement and manufacturing strategies, download software, and
participate in valuable industry discussions. The site has huge potential for Honeywell
since it caters to virtually any industry that manufactures goods in a factory.
When MyPlant.com was first launched, the site offered only Honeywell software
products. Now 400 software suppliers provide 650 manufacturing applications on the
site for a small transaction fee. In the past, solving a recurring manufacturing problem
could take days or weeks. With MyPlant.com, users take matters into their own hands
in real time. The practice is revolutionary, saving companies time, money, and risk.
Recently, MyPlant.com hosted 60,000 user sessions, and the company estimates that
one-third of the site’s users are new Honeywell customers.
The advantage of creating a single electronic marketplace is that everyone emerges a
winner. For example, two rival companies that both build engines, but don’t make
the same replacement parts, can ultimately share resources. Collaborating over the
Internet also results in economies of scale. In the next year, Honeywell plans to implement
MyAircraft.com, a joint venture with United Technologies and I2, to focus on supply-
chain management for the aerospace industry, and MyFacilities.com for the facilities
management industry. Both sites will match customers and suppliers, providing instant
results with improved inventory turns, corrected purchasing inefficiencies, and reduced
overhead. It is exactly what customers and companies need in today’s fast-paced economy.
S U P P L Y – C H A I N M A N A G E M E N T : HONEYWELL INTERNATIONAL www.honeywel l .com
FROM JUST IN TIME TO REAL TIME
By implementing its own
virtual supply chain, Cisco
reduced inventory levels by
45 percent over the past
six years and decreased the
time to market for its products
by as much as 12 weeks.
“Virtual manufacturing” saves
Cisco upward of $175 million
in annual operating costs.
Cisco will also provide
networking products in a
quick-start kit for suppliers
to give component makers
immediate and secure
access to the site.
I N S I D E C I S C O

C I S C O S Y S T E M S , I N C . 13
THE MOST EXPENSIVE BOX OF ANYTHING IS THE ONE SITTING STILL. FORGET JUST IN TIME.
WE‘RE MANAGING INVENTORY IN REAL TIME.

Streamlining business practices translates to all areas of the organization, not just
those that touch customers. From human resources to training, companies can use the
Internet to optimize their workforce and make themselves more agile in response to
rapidly changing market conditions. Electronic-based learning, or e-learning, is one critical
Internet application that yields significant results for Genuity Inc., a newly independent
Internet service provider (ISP), formerly a division of the GTE Corporation.
Genuity faced a training challenge in April 1998 due to the sweeping changes brought on
by the GTE acquisition. The company’s sales force was expected to grow from 200 to
1,000 and was now responsible for selling a new product set and a full spectrum of Internet
services. Not only was the sales team rapidly expanding, but it was also moving into new
worldwide territories. Genuity had to quickly find an efficient, scalable solution that
would reduce time spent in a classroom and increase effectiveness with customers.
Genuity leveraged the power of the Internet and created an e-learning solution with the
assistance of the GTE Learning Systems group’s 30 years of experience in training
government agencies and corporations. In July 1998, Genuity launched Virtual University,
which allowed salespeople to obtain real-time virtual instruction along with the latest
product information on their highly secure Web site. Genuity had an end-to-end Cisco
network that was immediately deployed to support the multimedia-rich applications
based on integrated data, voice, and video networking technologies.
To measure the effectiveness of Virtual University, Genuity trained a pilot sales group on
the new e-learning system and another group using traditional instruction. The benefits
were immediately evident. Those trained using the e-learning system made their first
sale 25 percent faster than those who didn’t, and their revenue numbers were twice
the dollar amount of the “traditional” group. Virtual University was so effective
that the company is planning more Internet-optimized learning programs to increase
productivity. As far as Genuity is concerned, empowering employees through e-learning
allows them to do the best job possible. It has had a clear effect on sales, productivity,
and customer satisfaction.
14 W W W . C I S C O . C O M
W O R K F O R C E O P T I M I Z A T I O N : GENUITY www.genuity.com
FROM TRAINING DOWNTIME TO LEARNING ANYTIME
By the end of 2000, 100
percent of Cisco sales
and technical staff will
participate in online training.
The e-learning program
has reduced the company’s
training expenses by 60
percent. Cisco can train up
to 3,000 people worldwide
in a single online session
for $250,000. It also means
more time spent with
customers and less time
in a classroom—perhaps
the biggest benefit of all.
I N S I D E C I S C O

C I S C O S Y S T E M S , I N C . 15
TRAINING WASN‘T DELIVERING HUGE LEAPS IN PRODUCTIVITY, SO WE MADE THE LEAP FROM TRAINING DOWNTIME TO
LEARNING ON LINE ANYTIME, ANYWHERE.

16 W W W . C I S C O . C O M
FINANCIAL REVIEW
S E L E C T E D F I N A N C I A L D ATA 1 7
M A N A G E M E N T ’ S D I S C U S S I O N A N D A N A LY S I S O F
F I N A N C I A L C O N D I T I O N A N D R E S U LT S O F O P E R AT I O N S 1 8
Q U A N T I TAT I V E A N D Q U A L I TAT I V E D I S C L O S U R E S A B O U T M A R K E T R I S K 2 3
C O N S O L I D AT E D S TAT E M E N T S O F O P E R AT I O N S 2 5
C O N S O L I D AT E D B A L A N C E S H E E T S 2 6
C O N S O L I D AT E D S TAT E M E N T S O F C A S H F L O W S 2 7
C O N S O L I D AT E D S TAT E M E N T S O F S H A R E H O L D E R S ’ E Q U I T Y 2 8
N O T E S T O C O N S O L I D AT E D F I N A N C I A L S TAT E M E N T S 2 9
R E P O R T O F I N D E P E N D E N T A C C O U N TA N T S 4 6
S U P P L E M E N TA R Y F I N A N C I A L D ATA 4 7
S T O C K M A R K E T I N F O R M AT I O N 4 7
S H A R E H O L D E R I N F O R M AT I O N 4 8

J u l y 2 9 , J u l y 3 1 , J u l y 2 5 , J u l y 2 6 , J u l y 2 8 ,2 0 0 0 1 9 9 9 1 9 9 8 1 9 9 7 1 9 9 6
Net sales $18,928 $12,173 $ 8,489 $ 6,452 $ 4,101
Net income $ 2,668(2) $ 2,023(3) $1,331(4) $1,047(5) $ 915(6)
Net income per commonshare—basic $ 0.39 $ 0.30 $ 0.21 $ 0.17 $ 0.16
Net income per commonshare—diluted $ 0.36(2) $ 0.29(3) $ 0.20(4) $ 0.17(5) $ 0.15(6)
Shares used in per-common sharecalculation—basic* 6,917 6,646 6,312 6,007 5,758
Shares used in per-common sharecalculation—diluted* 7,438 7,062 6,658 6,287 6,008
Total assets $32,870 $14,893 $9,043 $5,504 $3,647
* Reflects the two-for-one stock split effective March 2000.
(1) All historical financial information has been restated to reflect the acquisitions that were accounted for as poolings of interests (see Note 3 to the Consolidated Financial Statements).
(2) Net income and net income per common share include in-process research and development expenses of $1.37 billion, amortization of goodwill and purchased intangible assets of $291 million, acquisition-related costs of $62 million, payroll tax on stock option exercises of $51 million, and net gains realized on minority investments of $531 million. Pro forma net income and diluted net income per common share, excluding these items net of tax of $0, were $3.91 billion and $0.53, respectively.
(3) Net income and net income per common share include in-process research and development expenses of $471 million, amortization of goodwill and purchased intangible assets of $61 million, and acquisition-related costs of $16 million. Pro forma net income and diluted net income per common share, excluding these items net of tax benefits of $54 million, were $2.52 billion and $0.36, respectively.
(4) Net income and net income per common share include in-process research and development expenses of $594 million, amortization of goodwill and purchased intangible assets of $23 million, and net gains realized on minority investments of $5 million. Pro forma net income and diluted net income per common share, excluding these items net of tax benefits of $67 million, were $1.88 billion and $0.28, respectively.
(5) Net income and net income per common share include in-process research and development expenses of $508 million, amortization of goodwill and purchased intangible assets of $11 million, and net gains realized on minority investments of $152 million. Pro forma net income and diluted net income per common share, excluding these items net of tax benefits of $7 million, were $1.42 billion and $0.23, respectively.
(6) Net income and net income per common share include amortization of goodwill and purchased intangible assets of $14 million. Pro forma net income and diluted net income per common share, excluding this item net of a tax benefit of $2 million, were $927 million and $0.15, respectively.
C I S C O S Y S T E M S , I N C . 2 0 0 0 A n n u a l R e p o r t 17
SELECTED FINANCIAL DATA(1)
Five Years Ended July 29, 2000 (In millions, except per-share amounts)
73.1494_fin_9.0.qxd 9/25/00 11:33 AM Page 17
All historical financial information has been restated to reflect the acquisitions that were accounted for as poolings of interests(see Note 3 to the Consolidated Financial Statements).
FORWARD-LOOKING STATEMENTS
Certain statements contained in this Annual Report, including, without limitation, statements containing the words “believes,”“anticipates,” “estimates,” “expects,” “projections,” and words of similar import, constitute “forward-looking statements.” You should not place undue reliance on these forward-looking statements. Our actual results could differ materially from thoseanticipated in these forward-looking statements for many reasons, including risks faced by us described in the Risk Factors sections, among others, included in the documents we file with the Securities and Exchange Commission (“SEC”), including our most recent reports on Form 10-K, Form 8-K, and Form 10-Q, and amendments thereto.
COMPARISON OF FISCAL 2000 AND FISCAL 1999
Net sales in fiscal 2000 were $18.93 billion, compared with $12.17 billion in fiscal 1999, an increase of 55.5%. The increase in net sales was primarily a result of increased unit sales of switch, router, and access products; growth in the sales of add-onboards that provide increased functionality; optical transport products; and maintenance, service, and support sales (see Note 12to the Consolidated Financial Statements).
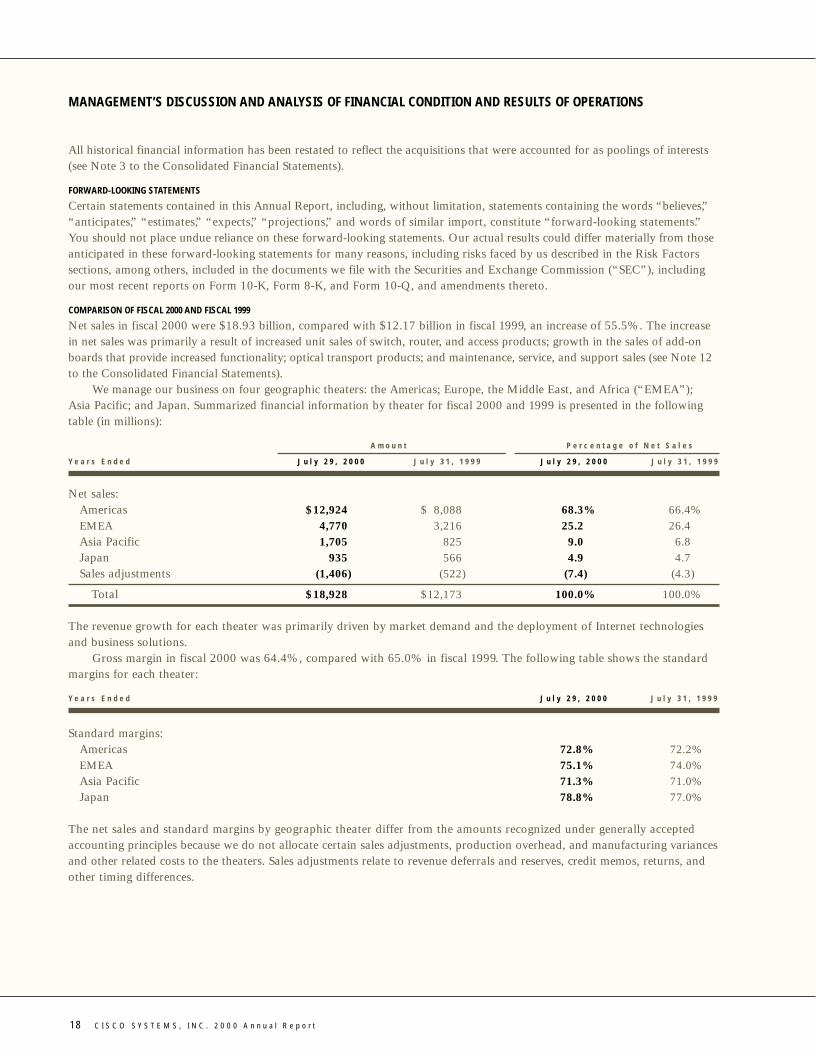
We manage our business on four geographic theaters: the Americas; Europe, the Middle East, and Africa (“EMEA”); Asia Pacific; and Japan. Summarized financial information by theater for fiscal 2000 and 1999 is presented in the followingtable (in millions):
A m o u n t P e r c e n t a g e o f N e t S a l e s
Y e a r s E n d e d J u l y 2 9 , 2 0 0 0 J u l y 3 1 , 1 9 9 9 J u l y 2 9 , 2 0 0 0 J u l y 3 1 , 1 9 9 9
Net sales:Americas $12,924 $ 8,088 68.3% 66.4%EMEA 4,770 3,216 25.2 26.4Asia Pacific 1,705 825 9.0 6.8Japan 935 566 4.9 4.7Sales adjustments (1,406) (522) (7.4) (4.3)
Total $18,928 $12,173 100.0% 100.0%
The revenue growth for each theater was primarily driven by market demand and the deployment of Internet technologiesand business solutions.
Gross margin in fiscal 2000 was 64.4%, compared with 65.0% in fiscal 1999. The following table shows the standardmargins for each theater:
Y e a r s E n d e d J u l y 2 9 , 2 0 0 0 J u l y 3 1 , 1 9 9 9
Standard margins:Americas 72.8% 72.2%EMEA 75.1% 74.0%Asia Pacific 71.3% 71.0%Japan 78.8% 77.0%
The net sales and standard margins by geographic theater differ from the amounts recognized under generally acceptedaccounting principles because we do not allocate certain sales adjustments, production overhead, and manufacturing variancesand other related costs to the theaters. Sales adjustments relate to revenue deferrals and reserves, credit memos, returns, andother timing differences.
18 C I S C O S Y S T E M S , I N C . 2 0 0 0 A n n u a l R e p o r t
MANAGEMENT’S DISCUSSION AND ANALYSIS OF FINANCIAL CONDITION AND RESULTS OF OPERATIONS
73.1494_fin_9.0.qxd 9/25/00 11:33 AM Page 18
Standard margins increased for all geographic theaters as compared with fiscal 1999. The decrease in the overall grossmargin was primarily due to shifts in product mix, introduction of new products, which generally have lower marginswhen first released, higher production-related costs, the continued pricing pressure seen from competitors in certain productareas, and the above-mentioned sales adjustments, which were not included in the standard margins.
We expect gross margin may be adversely affected by increases in material or labor costs, heightened price competition,increasing levels of services, higher inventory balances, introduction of new products for new high-growth markets, andchanges in channels of distribution or in the mix of products sold. We believe gross margin may additionally be impacteddue to constraints relating to certain component shortages that currently exist in the supply chain. We may also experience a lower gross margin as the product mix for access and optical product volume grows.
We have recently introduced several new products, with additional new products scheduled to be released in the future.Increase in demand would result in increased manufacturing capacity, which in turn would result in higher inventory balances.In addition, our vendor base is capacity-constrained, and this could result in increased cost pressure on certain components.If product or related warranty costs associated with these new products are greater than we have experienced, gross marginmay be adversely affected. Our gross margin may also be impacted by geographic mix, as well as the mix of configurationswithin each product group. We continue to expand into third-party or indirect-distribution channels, which generally results ina lower gross margin. In addition, increasing third-party and indirect-distribution channels generally results in greater difficultyin forecasting the mix of our product, and to a certain degree, the timing of orders from our customers. Downward pressures on ourgross margin may be further impacted by other factors, such as increased percentage of revenue from service provider markets,which may have lower margins or an increase in product costs, which could adversely affect our future operating results.
Research and development (“R&D”) expenses in fiscal 2000 were $2.70 billion, compared with $1.66 billion in fiscal 1999,an increase of 62.6%. R&D expenses, as a percentage of net sales, increased to 14.3% in fiscal 2000, compared with 13.7%in fiscal 1999. The increase reflected our ongoing R&D efforts in a wide variety of areas such as data, voice, and video integration,digital subscriber line (“DSL”) technologies, cable modem technology, wireless access, dial access, enterprise switching,optical transport, security, network management, and high-end routing technologies, among others. A significant portion ofthe increase was due to the addition of new personnel, partly through acquisitions, as well as higher expenditures on prototypesand depreciation on additional lab equipment. We also continued to purchase technology in order to bring a broad range of products to the market in a timely fashion. If we believe that we are unable to enter a particular market in a timely manner withinternally developed products, we may license technology from other businesses or acquire businesses as an alternative tointernal R&D. All of our R&D costs are expensed as incurred. We currently expect that R&D expenses will continue toincrease in absolute dollars as we continue to invest in technology to address potential market opportunities.
Sales and marketing expenses in fiscal 2000 were $3.95 billion, compared with $2.46 billion in fiscal 1999, an increaseof 60.1%. Sales and marketing expenses, as a percentage of net sales, increased to 20.8% in fiscal 2000, compared with 20.2%in fiscal 1999. The increase was principally due to an increase in the size of our direct sales force and related commissions,additional marketing and advertising investments associated with the introduction of new products, the expansion of distributionchannels, and general corporate branding. The increase also reflected our efforts to invest in certain key areas, such as expansionof our end-to-end networking strategy and service provider coverage, in order to be positioned to take advantage of futuremarket opportunities. We currently expect that sales and marketing expenses will continue to increase in absolute dollars.
General and administrative (“G&A”) expenses in fiscal 2000 were $633 million, compared with $381 million in fiscal 1999,an increase of 66.1%. G&A expenses, as a percentage of net sales, increased to 3.3% in fiscal 2000, compared with 3.1% in fiscal 1999. G&A expenses for fiscal 2000 and 1999 included acquisition-related costs of approximately $62 million and$16 million, respectively. Excluding the acquisition-related costs, the increase in G&A expenses was primarily related to theaddition of new personnel and investments in infrastructure. We intend to keep G&A expenses relatively constant as a percentageof net sales; however, this depends on the level of acquisition activity and our growth, among other factors.
Amortization of goodwill and purchased intangible assets included in operating expenses was $291 million in fiscal 2000,compared with $61 million in fiscal 1999. Amortization of goodwill and purchased intangible assets primarily relates to variouspurchase acquisitions (see Note 3 and Note 4 to the Consolidated Financial Statements). Amortization of goodwill and purchased intangible assets will continue to increase as we acquire companies and technologies.
C I S C O S Y S T E M S , I N C . 2 0 0 0 A n n u a l R e p o r t 19
73.1494_fin_9.0.qxd 9/25/00 11:33 AM Page 19
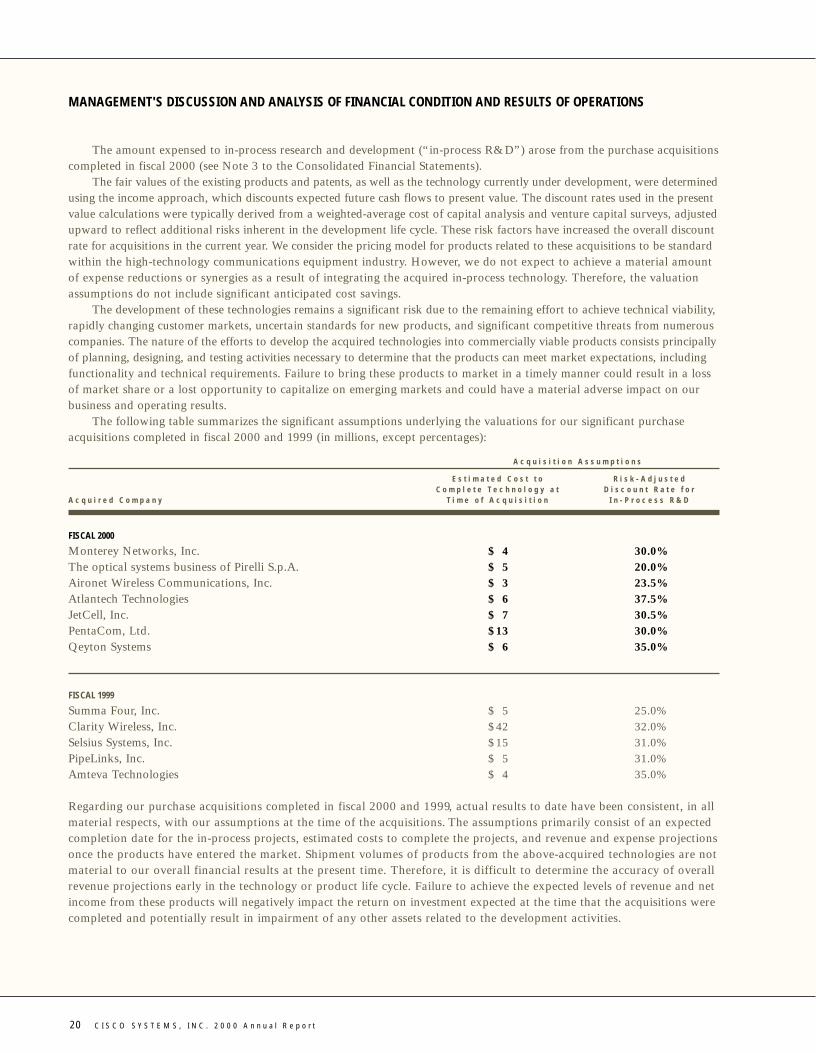
The amount expensed to in-process research and development (“in-process R&D”) arose from the purchase acquisitionscompleted in fiscal 2000 (see Note 3 to the Consolidated Financial Statements).
The fair values of the existing products and patents, as well as the technology currently under development, were determinedusing the income approach, which discounts expected future cash flows to present value. The discount rates used in the presentvalue calculations were typically derived from a weighted-average cost of capital analysis and venture capital surveys, adjustedupward to reflect additional risks inherent in the development life cycle. These risk factors have increased the overall discountrate for acquisitions in the current year. We consider the pricing model for products related to these acquisitions to be standardwithin the high-technology communications equipment industry. However, we do not expect to achieve a material amount of expense reductions or synergies as a result of integrating the acquired in-process technology. Therefore, the valuationassumptions do not include significant anticipated cost savings.
The development of these technologies remains a significant risk due to the remaining effort to achieve technical viability,rapidly changing customer markets, uncertain standards for new products, and significant competitive threats from numerouscompanies. The nature of the efforts to develop the acquired technologies into commercially viable products consists principallyof planning, designing, and testing activities necessary to determine that the products can meet market expectations, includingfunctionality and technical requirements. Failure to bring these products to market in a timely manner could result in a lossof market share or a lost opportunity to capitalize on emerging markets and could have a material adverse impact on ourbusiness and operating results.
The following table summarizes the significant assumptions underlying the valuations for our significant purchaseacquisitions completed in fiscal 2000 and 1999 (in millions, except percentages):
A c q u i s i t i o n A s s u m p t i o n s
E s t i m a t e d C o s t t o R i s k - A d j u s t e d C o m p l e t e T e c h n o l o g y a t D i s c o u n t R a t e f o r
A c q u i r e d C o m p a n y T i m e o f A c q u i s i t i o n I n - P r o c e s s R & D
FISCAL 2000
Monterey Networks, Inc. $ 4 30.0%The optical systems business of Pirelli S.p.A. $ 5 20.0%Aironet Wireless Communications, Inc. $ 3 23.5%Atlantech Technologies $ 6 37.5%JetCell, Inc. $ 7 30.5%PentaCom, Ltd. $13 30.0%Qeyton Systems $ 6 35.0%
FISCAL 1999
Summa Four, Inc. $ 5 25.0%Clarity Wireless, Inc. $42 32.0%Selsius Systems, Inc. $15 31.0%PipeLinks, Inc. $ 5 31.0%Amteva Technologies $ 4 35.0%
Regarding our purchase acquisitions completed in fiscal 2000 and 1999, actual results to date have been consistent, in allmaterial respects, with our assumptions at the time of the acquisitions. The assumptions primarily consist of an expectedcompletion date for the in-process projects, estimated costs to complete the projects, and revenue and expense projectionsonce the products have entered the market. Shipment volumes of products from the above-acquired technologies are notmaterial to our overall financial results at the present time. Therefore, it is difficult to determine the accuracy of overallrevenue projections early in the technology or product life cycle. Failure to achieve the expected levels of revenue and netincome from these products will negatively impact the return on investment expected at the time that the acquisitions werecompleted and potentially result in impairment of any other assets related to the development activities.
20 C I S C O S Y S T E M S , I N C . 2 0 0 0 A n n u a l R e p o r t
MANAGEMENT'S DISCUSSION AND ANALYSIS OF FINANCIAL CONDITION AND RESULTS OF OPERATIONS
73.1494_fin_9.0.qxd 9/25/00 11:33 AM Page 20

Interest and other income, net, was $577 million in fiscal 2000, compared with $330 million in fiscal 1999. Theincrease was primarily due to interest income related to the general increase in cash and investments, which was generatedfrom our operations. Net gains realized on minority investments were $531 million in fiscal 2000. The net gains realizedon minority investments were not material in fiscal 1999.
Our pro forma effective tax rate for fiscal 2000 was 30.0%. The actual effective tax rate was 38.6%, which includedthe impact of nondeductible in-process R&D and acquisition-related costs. Our future effective tax rates could be adverselyaffected if earnings are lower than anticipated in countries where we have lower effective rates or by unfavorable changesin tax laws and regulations. Additionally, we have provided a valuation allowance on certain of our deferred tax assetsbecause of uncertainty regarding their realizability due to expectation of future employee stock option exercises (see Note 11to the Consolidated Financial Statements).
COMPARISON OF FISCAL 1999 AND FISCAL 1998
Net sales in fiscal 1999 were $12.17 billion, compared with $8.49 billion in fiscal 1998, an increase of 43.4%. The increasein net sales was primarily a result of increased unit sales of LAN switching products, access servers, high-performance WANswitching and routing products, and maintenance service contracts.
Gross margin in fiscal 1999 was 65.0%, compared with 65.6% in fiscal 1998. The decrease in the overall gross marginwas primarily due to our continued shift in revenue mix toward our lower-margin products and the continued pricing pressureseen from competitors in certain product areas.
R&D expenses in fiscal 1999 were $1.66 billion, compared with $1.05 billion in fiscal 1998, an increase of 58.1%. R&Dexpenses, as a percentage of net sales, increased to 13.7% in fiscal 1999, compared with 12.4% in fiscal 1998. The increasereflected our ongoing R&D efforts in a wide variety of areas such as data, voice, and video integration, DSL technologies, cablemodem technology, wireless access, dial access, enterprise switching, security, network management, and high-end routingtechnologies, among others. A significant portion of the increase was due to the addition of new personnel, partly throughacquisitions, as well as higher expenditures on prototypes and depreciation on additional lab equipment.
Sales and marketing expenses in fiscal 1999 were $2.46 billion, compared with $1.58 billion in fiscal 1998, an increaseof 56.1%. Sales and marketing expenses, as a percentage of net sales, increased to 20.2% in fiscal 1999, compared with 18.6%in fiscal 1998. The increase was principally due to an increase in the size of our direct sales force and related commissions,television advertising campaigns to build brand awareness, additional marketing and advertising costs associated with theintroduction of new products, and the expansion of distribution channels. The increase also reflected our efforts to invest in certainkey areas, such as expansion of our end-to-end networking strategy and service provider coverage, in order to be positioned totake advantage of future market opportunities.
G&A expenses in fiscal 1999 were $381 million, compared with $247 million in fiscal 1998, an increase of 54.3%.G&A expenses, as a percentage of net sales, increased to 3.1% in fiscal 1999, compared with 2.9% in fiscal 1998. The increasewas primarily related to additional personnel and acquisition-related costs of $16 million.
Amortization of goodwill and purchased intangible assets included in operating expenses was $61 million in fiscal 1999,compared with $23 million in fiscal 1998. Amortization of goodwill and purchased intangible assets increased as we acquiredcompanies and technologies.
Interest and other income, net, in fiscal 1999 was $330 million, compared with $196 million in fiscal 1998. Interestincome rose primarily as a result of additional investment income on our increased investment balances.
C I S C O S Y S T E M S , I N C . 2 0 0 0 A n n u a l R e p o r t 21
73.1494_fin_9.0.qxd 9/25/00 11:33 AM Page 21
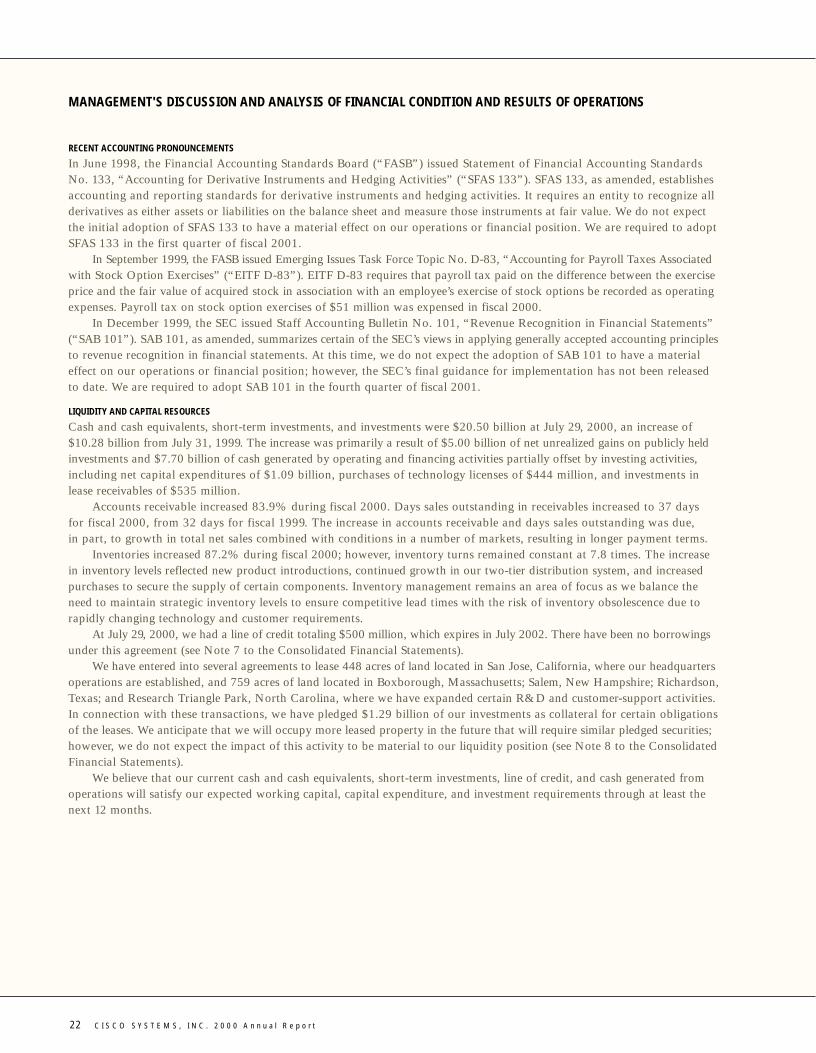
RECENT ACCOUNTING PRONOUNCEMENTS
In June 1998, the Financial Accounting Standards Board (“FASB”) issued Statement of Financial Accounting StandardsNo. 133, “Accounting for Derivative Instruments and Hedging Activities” (“SFAS 133”). SFAS 133, as amended, establishesaccounting and reporting standards for derivative instruments and hedging activities. It requires an entity to recognize allderivatives as either assets or liabilities on the balance sheet and measure those instruments at fair value. We do not expectthe initial adoption of SFAS 133 to have a material effect on our operations or financial position. We are required to adoptSFAS 133 in the first quarter of fiscal 2001.
In September 1999, the FASB issued Emerging Issues Task Force Topic No. D-83, “Accounting for Payroll Taxes Associatedwith Stock Option Exercises” (“EITF D-83”). EITF D-83 requires that payroll tax paid on the difference between the exerciseprice and the fair value of acquired stock in association with an employee’s exercise of stock options be recorded as operatingexpenses. Payroll tax on stock option exercises of $51 million was expensed in fiscal 2000.
In December 1999, the SEC issued Staff Accounting Bulletin No. 101, “Revenue Recognition in Financial Statements”(“SAB 101”). SAB 101, as amended, summarizes certain of the SEC’s views in applying generally accepted accounting principlesto revenue recognition in financial statements. At this time, we do not expect the adoption of SAB 101 to have a materialeffect on our operations or financial position; however, the SEC’s final guidance for implementation has not been releasedto date. We are required to adopt SAB 101 in the fourth quarter of fiscal 2001.
LIQUIDITY AND CAPITAL RESOURCES
Cash and cash equivalents, short-term investments, and investments were $20.50 billion at July 29, 2000, an increase of$10.28 billion from July 31, 1999. The increase was primarily a result of $5.00 billion of net unrealized gains on publicly heldinvestments and $7.70 billion of cash generated by operating and financing activities partially offset by investing activities,including net capital expenditures of $1.09 billion, purchases of technology licenses of $444 million, and investments inlease receivables of $535 million.
Accounts receivable increased 83.9% during fiscal 2000. Days sales outstanding in receivables increased to 37 days for fiscal 2000, from 32 days for fiscal 1999. The increase in accounts receivable and days sales outstanding was due, in part, to growth in total net sales combined with conditions in a number of markets, resulting in longer payment terms.
Inventories increased 87.2% during fiscal 2000; however, inventory turns remained constant at 7.8 times. The increasein inventory levels reflected new product introductions, continued growth in our two-tier distribution system, and increasedpurchases to secure the supply of certain components. Inventory management remains an area of focus as we balance theneed to maintain strategic inventory levels to ensure competitive lead times with the risk of inventory obsolescence due torapidly changing technology and customer requirements.
At July 29, 2000, we had a line of credit totaling $500 million, which expires in July 2002. There have been no borrowingsunder this agreement (see Note 7 to the Consolidated Financial Statements).
We have entered into several agreements to lease 448 acres of land located in San Jose, California, where our headquartersoperations are established, and 759 acres of land located in Boxborough, Massachusetts; Salem, New Hampshire; Richardson,Texas; and Research Triangle Park, North Carolina, where we have expanded certain R&D and customer-support activities.In connection with these transactions, we have pledged $1.29 billion of our investments as collateral for certain obligationsof the leases. We anticipate that we will occupy more leased property in the future that will require similar pledged securities;however, we do not expect the impact of this activity to be material to our liquidity position (see Note 8 to the ConsolidatedFinancial Statements).
We believe that our current cash and cash equivalents, short-term investments, line of credit, and cash generated fromoperations will satisfy our expected working capital, capital expenditure, and investment requirements through at least thenext 12 months.
22 C I S C O S Y S T E M S , I N C . 2 0 0 0 A n n u a l R e p o r t
MANAGEMENT'S DISCUSSION AND ANALYSIS OF FINANCIAL CONDITION AND RESULTS OF OPERATIONS
73.1494_fin_9.0.qxd 9/25/00 11:33 AM Page 22

C I S C O S Y S T E M S , I N C . 2 0 0 0 A n n u a l R e p o r t 23
We maintain an investment portfolio of various holdings, types, and maturities. These securities are generally classified asavailable for sale and, consequently, are recorded on the balance sheet at fair value with unrealized gains or losses reported asa separate component of accumulated other comprehensive income, net of tax. Part of this portfolio includes minority equityinvestments in several publicly traded companies, the values of which are subject to market price volatility. For example, as a resultof recent market price volatility of our publicly traded equity investments, we experienced a $111 million after-tax unrealizedloss during the third quarter of fiscal 2000 and a $1.83 billion after-tax unrealized gain during the fourth quarter of fiscal 2000on these investments. We have also invested in numerous privately held companies, many of which can still be considered in thestart-up or development stages. These investments are inherently risky as the market for the technologies or products they haveunder development are typically in the early stages and may never materialize. We could lose our entire initial investment in thesecompanies. We also have certain real estate lease commitments with payments tied to short-term interest rates. At any time, asharp rise in interest rates could have a material adverse impact on the fair value of our investment portfolio while increasingthe costs associated with our lease commitments. Conversely, declines in interest rates could have a material impact on interestearnings for our investment portfolio. We do not currently hedge these interest rate exposures.
INVESTMENTS
The following table presents the hypothetical changes in fair values in the financial instruments held at July 29, 2000 thatare sensitive to changes in interest rates. These instruments are not leveraged and are held for purposes other than trading.The modeling technique used measures the change in fair values arising from selected potential changes in interest rates.Market changes reflect immediate hypothetical parallel shifts in the yield curve of plus or minus 50 basis points (“BPS”),100 BPS, and 150 BPS over a 12-month horizon. Beginning fair values represent the principal plus accrued interest and dividendsof the interest rate-sensitive financial instruments at July 29, 2000. Ending fair values are the market principal plus accruedinterest, dividends, and reinvestment income at a 12-month horizon. The following table estimates the fair value of the portfolioat a 12-month horizon (in millions):
V a l u a t i o n o f S e c u r i t i e s V a l u a t i o n o f S e c u r i t i e sG i v e n a n I n t e r e s t R a t e F a i r V a l u e G i v e n a n I n t e r e s t R a t e
D e c r e a s e o f X B a s i s P o i n t s a s o f I n c r e a s e o f X B a s i s P o i n t s
I s s u e r ( 1 5 0 B P S ) ( 1 0 0 B P S ) ( 5 0 B P S ) J u l y 2 9 , 2 0 0 0 5 0 B P S 1 0 0 B P S 1 5 0 B P S
U.S. government notes and bonds $2,350 $2,329 $2,307 $2,285 $2,262 $2,240 $2,218State, municipal, and county
government notes and bonds 3,666 3,632 3,598 3,564 3,529 3,494 3,459Corporate notes and bonds 3,296 3,266 3,235 3,204 3,173 3,141 3,110
Total $9,312 $9,227 $9,140 $9,053 $8,964 $8,875 $8,787
A 50 BPS move in the Federal Funds Rate has occurred in nine of the last 10 years; a 100 BPS move in the Federal FundsRate has occurred in six of the last 10 years; and a 150 BPS move in the Federal Funds Rate has occurred in four of the last 10 years.
QUANTITATIVE AND QUALITATIVE DISCLOSURES ABOUT MARKET RISK
73.1494_fin_9.0.qxd 9/25/00 11:33 AM Page 23
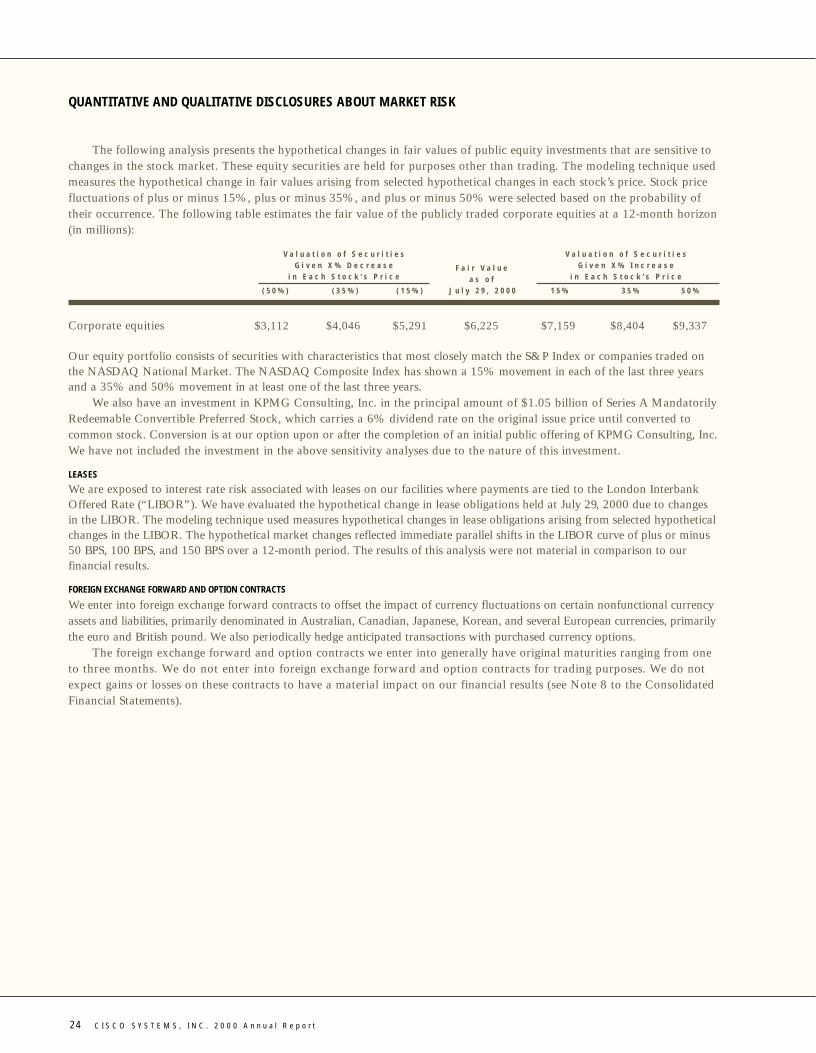
The following analysis presents the hypothetical changes in fair values of public equity investments that are sensitive tochanges in the stock market. These equity securities are held for purposes other than trading. The modeling technique usedmeasures the hypothetical change in fair values arising from selected hypothetical changes in each stock’s price. Stock pricefluctuations of plus or minus 15%, plus or minus 35%, and plus or minus 50% were selected based on the probability oftheir occurrence. The following table estimates the fair value of the publicly traded corporate equities at a 12-month horizon(in millions):
V a l u a t i o n o f S e c u r i t i e s V a l u a t i o n o f S e c u r i t i e sG i v e n X % D e c r e a s e F a i r V a l u e G i v e n X % I n c r e a s e
i n E a c h S t o c k ’ s P r i c e a s o f i n E a c h S t o c k ’ s P r i c e
( 5 0 % ) ( 3 5 % ) ( 1 5 % ) J u l y 2 9 , 2 0 0 0 1 5 % 3 5 % 5 0 %
Corporate equities $3,112 $4,046 $5,291 $6,225 $7,159 $8,404 $9,337
Our equity portfolio consists of securities with characteristics that most closely match the S&P Index or companies traded on the NASDAQ National Market. The NASDAQ Composite Index has shown a 15% movement in each of the last three yearsand a 35% and 50% movement in at least one of the last three years.
We also have an investment in KPMG Consulting, Inc. in the principal amount of $1.05 billion of Series A MandatorilyRedeemable Convertible Preferred Stock, which carries a 6% dividend rate on the original issue price until converted tocommon stock. Conversion is at our option upon or after the completion of an initial public offering of KPMG Consulting, Inc.We have not included the investment in the above sensitivity analyses due to the nature of this investment.
LEASES
We are exposed to interest rate risk associated with leases on our facilities where payments are tied to the London InterbankOffered Rate (“LIBOR”). We have evaluated the hypothetical change in lease obligations held at July 29, 2000 due to changes in the LIBOR. The modeling technique used measures hypothetical changes in lease obligations arising from selected hypotheticalchanges in the LIBOR. The hypothetical market changes reflected immediate parallel shifts in the LIBOR curve of plus or minus50 BPS, 100 BPS, and 150 BPS over a 12-month period. The results of this analysis were not material in comparison to ourfinancial results.
FOREIGN EXCHANGE FORWARD AND OPTION CONTRACTS
We enter into foreign exchange forward contracts to offset the impact of currency fluctuations on certain nonfunctional currencyassets and liabilities, primarily denominated in Australian, Canadian, Japanese, Korean, and several European currencies, primarilythe euro and British pound. We also periodically hedge anticipated transactions with purchased currency options.
The foreign exchange forward and option contracts we enter into generally have original maturities ranging from one to three months. We do not enter into foreign exchange forward and option contracts for trading purposes. We do notexpect gains or losses on these contracts to have a material impact on our financial results (see Note 8 to the ConsolidatedFinancial Statements).
24 C I S C O S Y S T E M S , I N C . 2 0 0 0 A n n u a l R e p o r t
QUANTITATIVE AND QUALITATIVE DISCLOSURES ABOUT MARKET RISK
73.1494_fin_9.0.qxd 9/25/00 11:33 AM Page 24

C I S C O S Y S T E M S , I N C . 2 0 0 0 A n n u a l R e p o r t 25
Y e a r s E n d e d J u l y 2 9 , 2 0 0 0 J u l y 3 1 , 1 9 9 9 J u l y 2 5 , 1 9 9 8
N E T S A L E S $18,928 $12,173 $8,489Cost of sales 6,746 4,259 2,924
G R O S S M A R G I N 12,182 7,914 5,565
Operating expenses:Research and development 2,704 1,663 1,052Sales and marketing 3,946 2,465 1,579General and administrative 633 381 247Amortization of goodwill and purchased intangible assets 291 61 23In-process research and development 1,373 471 594
Total operating expenses 8,947 5,041 3,495
O P E R A T I N G I N C O M E 3,235 2,873 2,070Net gains realized on minority investments 531 – 5Interest and other income, net 577 330 196
I N C O M E B E F O R E P R O V I S I O N F O R I N C O M E T A X E S 4,343 3,203 2,271Provision for income taxes 1,675 1,180 940
N E T I N C O M E $ 2,668 $ 2,023 $1,331
Net income per common share—basic $ 0.39 $ 0.30 $ 0.21
Net income per common share—diluted $ 0.36 $ 0.29 $ 0.20
Shares used in per-common share calculation—basic 6,917 6,646 6,312
Shares used in per-common share calculation—diluted 7,438 7,062 6,658
See Notes to Consolidated Financial Statements.
CONSOLIDATED STATEMENTS OF OPERATIONS (In millions, except per-share amounts)
73.1494_fin_9.0.qxd 9/25/00 11:33 AM Page 25

26 C I S C O S Y S T E M S , I N C . 2 0 0 0 A n n u a l R e p o r t
J u l y 2 9 , 2 0 0 0 J u l y 3 1 , 1 9 9 9
A S S E T S
Current assets:Cash and cash equivalents $ 4,234 $ 913Short-term investments 1,291 1,189Accounts receivable, net of allowances for doubtful
accounts of $43 at 2000 and $27 at 1999 2,299 1,250Inventories, net 1,232 658Deferred tax assets 1,091 580Prepaid expenses and other current assets 963 171
Total current assets 11,110 4,761
Investments 13,688 7,032Restricted investments 1,286 1,080Property and equipment, net 1,426 825Goodwill and purchased intangible assets, net 4,087 460Lease receivables 527 500Other assets 746 235
T O T A L A S S E T S $32,870 $14,893
L I A B I L I T I E S A N D S H A R E H O L D E R S ’ E Q U I T Y
Current liabilities:Accounts payable $ 739 $ 374Income taxes payable 233 630Accrued compensation 1,317 679Deferred revenue 1,386 724Other accrued liabilities 1,521 631
Total current liabilities 5,196 3,038
Commitments and contingencies (Note 8)
Deferred tax liabilities 1,132 –Minority interest 45 44
Shareholders’ equity:Preferred stock, no par value: 5 shares authorized;
none issued and outstanding – –Common stock and additional paid-in capital, $0.001 par value:
20,000 shares authorized; 7,138 and 6,821 shares issued and outstanding at 2000 and 1999, respectively 14,609 5,731
Retained earnings 8,358 5,782Accumulated other comprehensive income 3,530 298
Total shareholders’ equity 26,497 11,811
T O T A L L I A B I L I T I E S A N D S H A R E H O L D E R S ’ E Q U I T Y $32,870 $14,893
See Notes to Consolidated Financial Statements.
CONSOLIDATED BALANCE SHEETS(In millions, except par value)
73.1494_fin_9.0.qxd 9/25/00 11:33 AM Page 26
C I S C O S Y S T E M S , I N C . 2 0 0 0 A n n u a l R e p o r t 27
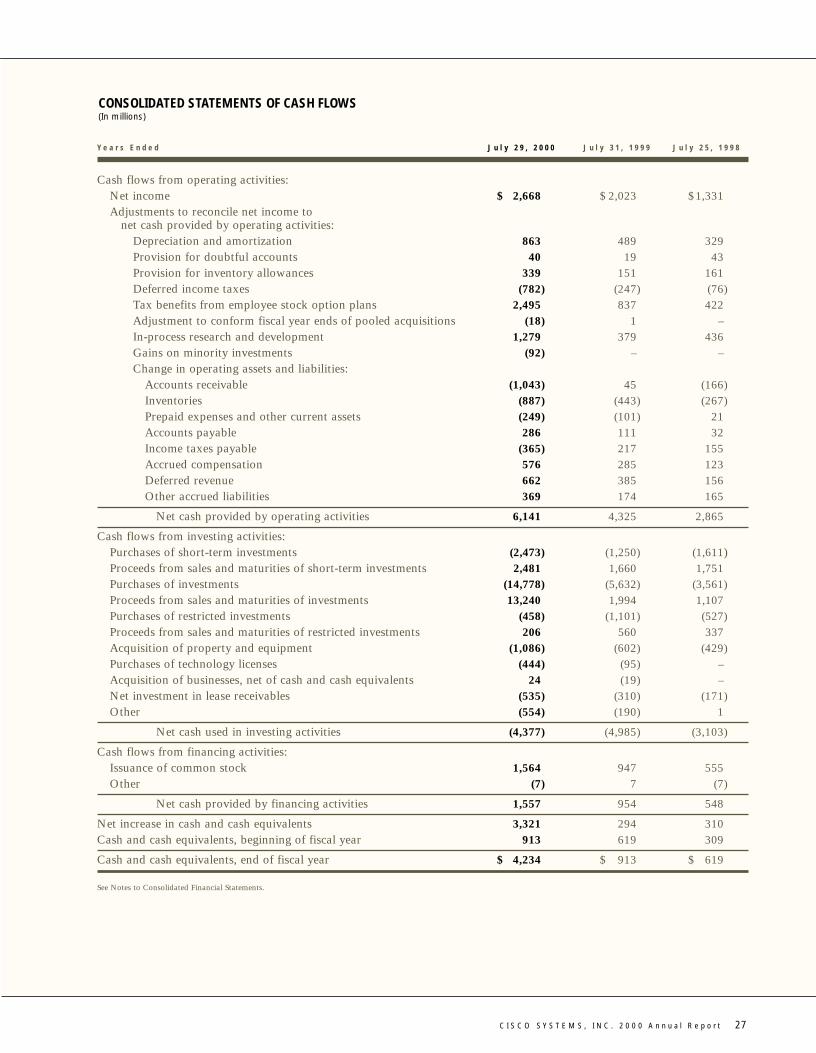
Y e a r s E n d e d J u l y 2 9 , 2 0 0 0 J u l y 3 1 , 1 9 9 9 J u l y 2 5 , 1 9 9 8
Cash flows from operating activities:Net income $ 2,668 $ 2,023 $1,331Adjustments to reconcile net income to
net cash provided by operating activities:Depreciation and amortization 863 489 329Provision for doubtful accounts 40 19 43Provision for inventory allowances 339 151 161Deferred income taxes (782) (247) (76)Tax benefits from employee stock option plans 2,495 837 422Adjustment to conform fiscal year ends of pooled acquisitions (18) 1 –In-process research and development 1,279 379 436Gains on minority investments (92) – –Change in operating assets and liabilities:
Accounts receivable (1,043) 45 (166)Inventories (887) (443) (267)Prepaid expenses and other current assets (249) (101) 21Accounts payable 286 111 32Income taxes payable (365) 217 155Accrued compensation 576 285 123Deferred revenue 662 385 156Other accrued liabilities 369 174 165
Net cash provided by operating activities 6,141 4,325 2,865
Cash flows from investing activities:Purchases of short-term investments (2,473) (1,250) (1,611)Proceeds from sales and maturities of short-term investments 2,481 1,660 1,751Purchases of investments (14,778) (5,632) (3,561)Proceeds from sales and maturities of investments 13,240 1,994 1,107Purchases of restricted investments (458) (1,101) (527)Proceeds from sales and maturities of restricted investments 206 560 337Acquisition of property and equipment (1,086) (602) (429)Purchases of technology licenses (444) (95) –Acquisition of businesses, net of cash and cash equivalents 24 (19) –Net investment in lease receivables (535) (310) (171)Other (554) (190) 1
Net cash used in investing activities (4,377) (4,985) (3,103)
Cash flows from financing activities:Issuance of common stock 1,564 947 555Other (7) 7 (7)
Net cash provided by financing activities 1,557 954 548
Net increase in cash and cash equivalents 3,321 294 310Cash and cash equivalents, beginning of fiscal year 913 619 309
Cash and cash equivalents, end of fiscal year $ 4,234 $ 913 $ 619
See Notes to Consolidated Financial Statements.
CONSOLIDATED STATEMENTS OF CASH FLOWS(In millions)
73.1494_fin_9.0.qxd 9/25/00 11:33 AM Page 27
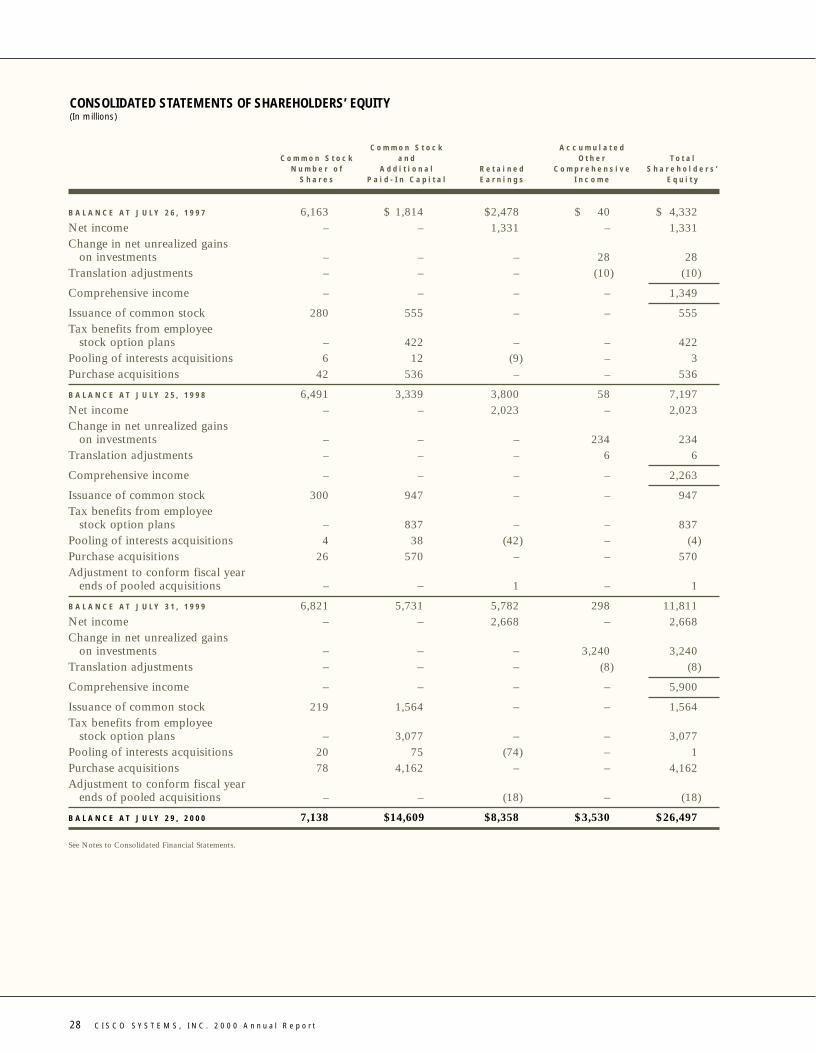
28 C I S C O S Y S T E M S , I N C . 2 0 0 0 A n n u a l R e p o r t
C o m m o n S t o c k A c c u m u l a t e dC o m m o n S t o c k a n d O t h e r T o t a l
N u m b e r o f A d d i t i o n a l R e t a i n e d C o m p r e h e n s i v e S h a r e h o l d e r s ’S h a r e s P a i d - I n C a p i t a l E a r n i n g s I n c o m e E q u i t y
B A L A N C E A T J U L Y 2 6 , 1 9 9 7 6,163 $ 1,814 $2,478 $ 40 $ 4,332Net income – – 1,331 – 1,331Change in net unrealized gains
on investments – – – 28 28Translation adjustments – – – (10) (10)
Comprehensive income – – – – 1,349
Issuance of common stock 280 555 – – 555Tax benefits from employee
stock option plans – 422 – – 422Pooling of interests acquisitions 6 12 (9) – 3Purchase acquisitions 42 536 – – 536
B A L A N C E A T J U L Y 2 5 , 1 9 9 8 6,491 3,339 3,800 58 7,197Net income – – 2,023 – 2,023Change in net unrealized gains
on investments – – – 234 234Translation adjustments – – – 6 6
Comprehensive income – – – – 2,263
Issuance of common stock 300 947 – – 947Tax benefits from employee
stock option plans – 837 – – 837Pooling of interests acquisitions 4 38 (42) – (4)Purchase acquisitions 26 570 – – 570Adjustment to conform fiscal year
ends of pooled acquisitions – – 1 – 1
B A L A N C E A T J U L Y 3 1 , 1 9 9 9 6,821 5,731 5,782 298 11,811Net income – – 2,668 – 2,668Change in net unrealized gains
on investments – – – 3,240 3,240Translation adjustments – – – (8) (8)
Comprehensive income – – – – 5,900
Issuance of common stock 219 1,564 – – 1,564Tax benefits from employee
stock option plans – 3,077 – – 3,077Pooling of interests acquisitions 20 75 (74) – 1Purchase acquisitions 78 4,162 – – 4,162Adjustment to conform fiscal year
ends of pooled acquisitions – – (18) – (18)
B A L A N C E A T J U L Y 2 9 , 2 0 0 0 7,138 $14,609 $8,358 $3,530 $26,497
See Notes to Consolidated Financial Statements.
CONSOLIDATED STATEMENTS OF SHAREHOLDERS’ EQUITY(In millions)
73.1494_fin_9.0.qxd 9/25/00 11:33 AM Page 28

C I S C O S Y S T E M S , I N C . 2 0 0 0 A n n u a l R e p o r t 29
1. DESCRIPTION OF BUSINESS
Cisco Systems, Inc. and its subsidiaries (“Cisco” or the “Company”) is the worldwide leader in networking for the Internet.Cisco hardware, software, and service offerings are used to create Internet solutions so that individuals, companies, andcountries have seamless access to information—regardless of differences in time and place. Cisco solutions provide competitiveadvantage to our customers through more efficient and timely exchange of information, which in turn leads to cost savings,process efficiencies, and closer relationships with their customers, prospects, business partners, suppliers, and employees.These solutions form the networking foundation for companies, universities, utilities, and government agencies worldwide.
2. SUMMARY OF SIGNIFICANT ACCOUNTING POLICIES
Fiscal Year The Company’s fiscal year is the 52 or 53 weeks ending on the last Saturday in July. Fiscal 2000, 1999, and 1998 were52-week, 53-week, and 52-week fiscal years, respectively.
Pr inciples of Consol idat ion The Consolidated Financial Statements include the accounts of Cisco Systems, Inc. and its subsidiaries.All significant intercompany accounts and transactions have been eliminated.
Cash and Cash Equivalents The Company considers all highly liquid investments purchased with an original or remaining maturity ofless than three months at the date of purchase to be cash equivalents. Substantially all cash and cash equivalents are custodied withthree major financial institutions.
Investments The Company’s investments comprise U.S., state, and municipal government obligations; corporate debt securities; andpublic corporate equity securities. Investments with maturities of less than one year are considered short-term and are carried atfair value. All investments are primarily held in the Company’s name and custodied with two major financial institutions. Thespecific identification method is used to determine the cost of securities disposed. At July 29, 2000 and July 31, 1999, substantiallyall of the Company’s investments were classified as available for sale. Unrealized gains and losses on these investments are includedas a separate component of shareholders’ equity, net of any related tax effect.
The Company also has certain other minority investments in nonpublicly traded companies. These investments areincluded in other assets on the Company’s balance sheet and are generally carried at cost. The Company monitors theseinvestments for impairment and makes appropriate reductions in carrying values when necessary.
Inventor ies Inventories are stated at the lower of cost or market. Cost is computed using standard cost, which approximatesactual cost on a first-in, first-out basis.
Restr icted Investments Restricted investments consist of U.S. government obligations with maturities of more than one year.These investments are carried at fair value and are restricted as to withdrawal. Restricted investments are held in theCompany’s name and custodied with two major financial institutions.
Fair Value of F inancial Instruments Carrying amounts of certain of the Company’s financial instruments, including cash and cashequivalents, accrued compensation, and other accrued liabilities, approximate fair value because of their short maturities. The fairvalues of investments are determined using quoted market prices for those securities or similar financial instruments.
Concentrat ions Cash and cash equivalents are primarily maintained with three major financial institutions in the United States.Deposits held with banks may exceed the amount of insurance provided on such deposits. Generally, these deposits may beredeemed upon demand and, therefore, bear minimal risk.
The Company performs ongoing credit evaluations of its customers and, with the exception of certain financing transactions,does not require collateral from its customers.
The Company receives certain of its components from sole suppliers. Additionally, the Company relies on a limitednumber of hardware manufacturers. The inability of any supplier or manufacturer to fulfill supply requirements of theCompany could materially impact future operating results.
NOTES TO CONSOLIDATED FINANCIAL STATEMENTS
73.1494_fin_9.0.qxd 9/25/00 11:33 AM Page 29
30 C I S C O S Y S T E M S , I N C . 2 0 0 0 A n n u a l R e p o r t
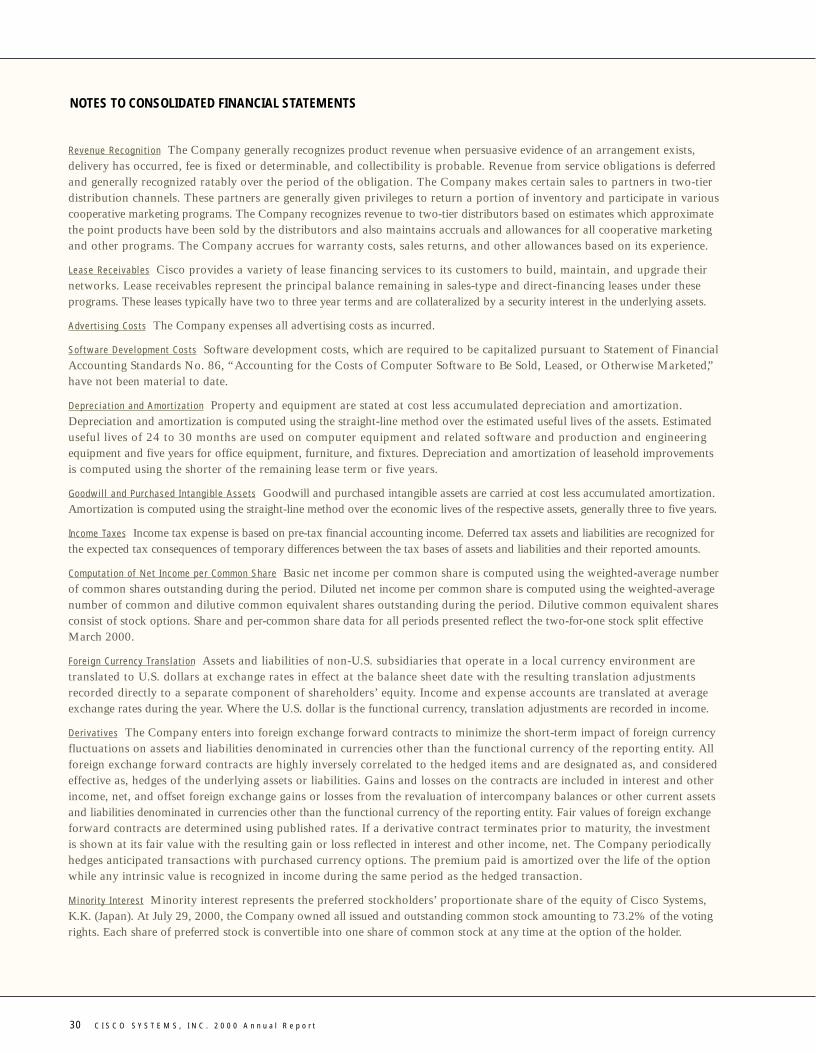
Revenue Recognit ion The Company generally recognizes product revenue when persuasive evidence of an arrangement exists,delivery has occurred, fee is fixed or determinable, and collectibility is probable. Revenue from service obligations is deferredand generally recognized ratably over the period of the obligation. The Company makes certain sales to partners in two-tierdistribution channels. These partners are generally given privileges to return a portion of inventory and participate in variouscooperative marketing programs. The Company recognizes revenue to two-tier distributors based on estimates which approximatethe point products have been sold by the distributors and also maintains accruals and allowances for all cooperative marketingand other programs. The Company accrues for warranty costs, sales returns, and other allowances based on its experience.
Lease Receivables Cisco provides a variety of lease financing services to its customers to build, maintain, and upgrade theirnetworks. Lease receivables represent the principal balance remaining in sales-type and direct-financing leases under theseprograms. These leases typically have two to three year terms and are collateralized by a security interest in the underlying assets.
Advert is ing Costs The Company expenses all advertising costs as incurred.
Software Development Costs Software development costs, which are required to be capitalized pursuant to Statement of FinancialAccounting Standards No. 86, “Accounting for the Costs of Computer Software to Be Sold, Leased, or Otherwise Marketed”,have not been material to date.
Depreciat ion and Amort izat ion Property and equipment are stated at cost less accumulated depreciation and amortization.Depreciation and amortization is computed using the straight-line method over the estimated useful lives of the assets. Estimateduseful lives of 24 to 30 months are used on computer equipment and related software and production and engineeringequipment and five years for office equipment, furniture, and fixtures. Depreciation and amortization of leasehold improvementsis computed using the shorter of the remaining lease term or five years.
Goodwil l and Purchased Intangible Assets Goodwill and purchased intangible assets are carried at cost less accumulated amortization.Amortization is computed using the straight-line method over the economic lives of the respective assets, generally three to five years.
Income Taxes Income tax expense is based on pre-tax financial accounting income. Deferred tax assets and liabilities are recognized forthe expected tax consequences of temporary differences between the tax bases of assets and liabilities and their reported amounts.
Computat ion of Net Income per Common Share Basic net income per common share is computed using the weighted-average numberof common shares outstanding during the period. Diluted net income per common share is computed using the weighted-averagenumber of common and dilutive common equivalent shares outstanding during the period. Dilutive common equivalent sharesconsist of stock options. Share and per-common share data for all periods presented reflect the two-for-one stock split effectiveMarch 2000.
Foreign Currency Translat ion Assets and liabilities of non-U.S. subsidiaries that operate in a local currency environment aretranslated to U.S. dollars at exchange rates in effect at the balance sheet date with the resulting translation adjustmentsrecorded directly to a separate component of shareholders’ equity. Income and expense accounts are translated at averageexchange rates during the year. Where the U.S. dollar is the functional currency, translation adjustments are recorded in income.
Derivat ives The Company enters into foreign exchange forward contracts to minimize the short-term impact of foreign currencyfluctuations on assets and liabilities denominated in currencies other than the functional currency of the reporting entity. Allforeign exchange forward contracts are highly inversely correlated to the hedged items and are designated as, and consideredeffective as, hedges of the underlying assets or liabilities. Gains and losses on the contracts are included in interest and otherincome, net, and offset foreign exchange gains or losses from the revaluation of intercompany balances or other current assetsand liabilities denominated in currencies other than the functional currency of the reporting entity. Fair values of foreign exchangeforward contracts are determined using published rates. If a derivative contract terminates prior to maturity, the investmentis shown at its fair value with the resulting gain or loss reflected in interest and other income, net. The Company periodicallyhedges anticipated transactions with purchased currency options. The premium paid is amortized over the life of the optionwhile any intrinsic value is recognized in income during the same period as the hedged transaction.
Minor i ty Interest Minority interest represents the preferred stockholders’ proportionate share of the equity of Cisco Systems, K.K. (Japan). At July 29, 2000, the Company owned all issued and outstanding common stock amounting to 73.2% of the votingrights. Each share of preferred stock is convertible into one share of common stock at any time at the option of the holder.
NOTES TO CONSOLIDATED FINANCIAL STATEMENTS
73.1494_fin_9.0.qxd 9/25/00 11:33 AM Page 30

C I S C O S Y S T E M S , I N C . 2 0 0 0 A n n u a l R e p o r t 31
Use of Est imates The preparation of financial statements and related disclosures in conformity with accounting principles generallyaccepted in the United States requires management to make estimates and assumptions that affect the amounts reported in theConsolidated Financial Statements and accompanying notes. Estimates are used for, but not limited to, the accounting for theallowance for doubtful accounts, inventory allowances, depreciation and amortization, sales returns, warranty costs, taxes,and contingencies. Actual results could differ from these estimates.
Impairment of Long-Lived Assets Long-lived assets and certain identifiable intangible assets to be held and used are reviewed forimpairment whenever events or changes in circumstances indicate that the carrying amount of such assets may not be recoverable.Determination of recoverability is based on an estimate of undiscounted future cash flows resulting from the use of the asset andits eventual disposition. Measurement of an impairment loss for long-lived assets and certain identifiable intangible assets thatmanagement expects to hold and use are based on the fair value of the asset. Long-lived assets and certain identifiable intangibleassets to be disposed of are reported at the lower of carrying amount or fair value less costs to sell.
Recent Account ing Pronouncements In June 1998, the Financial Accounting Standards Board (“FASB”) issued Statement ofFinancial Accounting Standards No. 133, “Accounting for Derivative Instruments and Hedging Activities” (“SFAS 133”).SFAS 133, as amended, establishes accounting and reporting standards for derivative instruments and hedging activities. Itrequires an entity to recognize all derivatives as either assets or liabilities on the balance sheet and measure those instrumentsat fair value. Management does not expect the initial adoption of SFAS 133 to have a material effect on the Company’s operationsor financial position. The Company is required to adopt SFAS 133 in the first quarter of fiscal 2001.
In September 1999, the FASB issued Emerging Issues Task Force Topic No. D-83, “Accounting for Payroll Taxes Associatedwith Stock Option Exercises” (“EITF D-83”). EITF D-83 requires that payroll tax paid on the difference between the exerciseprice and the fair value of acquired stock in association with an employee’s exercise of stock options be recorded as operatingexpenses. Payroll tax on stock option exercises of $51 million was expensed in fiscal 2000.
In December 1999, the Securities and Exchange Commission (“SEC”) issued Staff Accounting Bulletin No. 101, “RevenueRecognition in Financial Statements” (“SAB 101”). SAB 101, as amended, summarizes certain of the SEC’s views in applyinggenerally accepted accounting principles to revenue recognition in financial statements. At this time, management does notexpect the adoption of SAB 101 to have a material effect on the Company’s operations or financial position; however, theSEC’s final guidance for implementation has not been released to date. The Company is required to adopt SAB 101 in thefourth quarter of fiscal 2001.
Reclassi f icat ions Certain reclassifications have been made to prior year balances in order to conform to the current year presentation.
3. BUSINESS COMBINATIONS
P o o l i n g o f I n t e r e s t s C o m b i n a t i o n s
In fiscal 2000, the Company acquired StratumOne Communications, Inc. (“StratumOne”); TransMedia Communications, Inc.(“TransMedia”); Cerent Corporation (“Cerent”); WebLine Communications Corporation (“WebLine”); SightPath, Inc. (“SightPath”);InfoGear Technology Corporation (“InfoGear”); and ArrowPoint Communications, Inc. (“ArrowPoint”), which were accountedfor as poolings of interests. All historical financial information has been restated to reflect these acquisitions. In addition, the historicalfinancial information has been restated to reflect the acquisition of Fibex Systems (“Fibex”), which was completed in the fourthquarter of fiscal 1999 and accounted for as a pooling of interests. These transactions are summarized as follows (in millions):
S h a r e s o f C i s c o S t o c kI s s u e d, I n c l u d i n g F a i r V a l u e o f
A c q u i s i t i o n D a t e A c q u i r e d C o m p a n y O p t i o n s A s s u m e d A c q u i s i t i o n
May 1999 Fibex 11.5 $ 314September 1999 StratumOne 13.3 $ 435September 1999 TransMedia 13.9 $ 407November 1999 Cerent 200.0 $6,900November 1999 WebLine 8.6 $ 325May 2000 SightPath 11.4 $ 800June 2000 InfoGear 4.7 $ 301June 2000 ArrowPoint 90.2 $5,700
73.1494_fin_9.0.qxd 9/25/00 11:33 AM Page 31
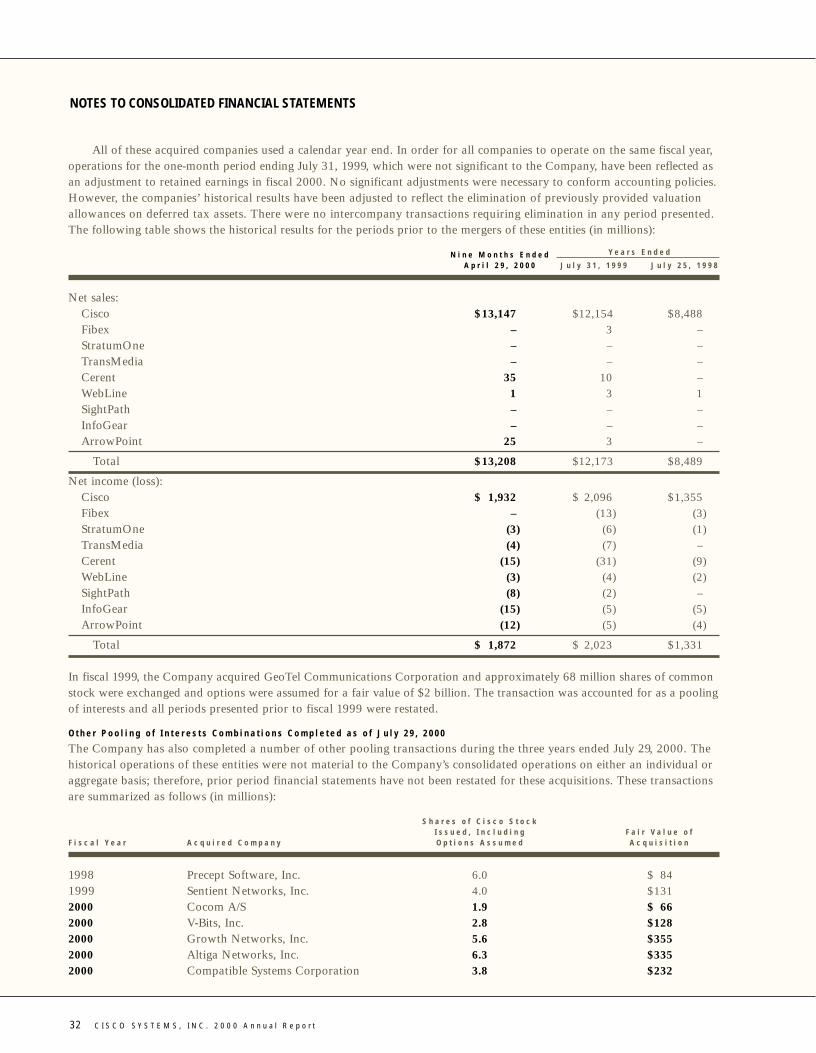
32 C I S C O S Y S T E M S , I N C . 2 0 0 0 A n n u a l R e p o r t
All of these acquired companies used a calendar year end. In order for all companies to operate on the same fiscal year,operations for the one-month period ending July 31, 1999, which were not significant to the Company, have been reflected asan adjustment to retained earnings in fiscal 2000. No significant adjustments were necessary to conform accounting policies.However, the companies’ historical results have been adjusted to reflect the elimination of previously provided valuationallowances on deferred tax assets. There were no intercompany transactions requiring elimination in any period presented.The following table shows the historical results for the periods prior to the mergers of these entities (in millions):
N i n e M o n t h s E n d e d Y e a r s E n d e d
A p r i l 2 9 , 2 0 0 0 J u l y 3 1 , 1 9 9 9 J u l y 2 5 , 1 9 9 8
Net sales:Cisco $13,147 $12,154 $8,488Fibex – 3 –StratumOne – – –TransMedia – – –Cerent 35 10 –WebLine 1 3 1SightPath – – –InfoGear – – –ArrowPoint 25 3 –
Total $13,208 $12,173 $8,489
Net income (loss):Cisco $ 1,932 $ 2,096 $1,355Fibex – (13) (3)StratumOne (3) (6) (1)TransMedia (4) (7) –Cerent (15) (31) (9)WebLine (3) (4) (2)SightPath (8) (2) –InfoGear (15) (5) (5)ArrowPoint (12) (5) (4)
Total $ 1,872 $ 2,023 $1,331
In fiscal 1999, the Company acquired GeoTel Communications Corporation and approximately 68 million shares of commonstock were exchanged and options were assumed for a fair value of $2 billion. The transaction was accounted for as a poolingof interests and all periods presented prior to fiscal 1999 were restated.
O t h e r P o o l i n g o f I n t e r e s t s C o m b i n a t i o n s C o m p l e t e d a s o f J u l y 2 9 , 2 0 0 0
The Company has also completed a number of other pooling transactions during the three years ended July 29, 2000. Thehistorical operations of these entities were not material to the Company’s consolidated operations on either an individual oraggregate basis; therefore, prior period financial statements have not been restated for these acquisitions. These transactionsare summarized as follows (in millions):
S h a r e s o f C i s c o S t o c kI s s u e d , I n c l u d i n g F a i r V a l u e o f
F i s c a l Y e a r A c q u i r e d C o m p a n y O p t i o n s A s s u m e d A c q u i s i t i o n
1998 Precept Software, Inc. 6.0 $ 841999 Sentient Networks, Inc. 4.0 $1312000 Cocom A/S 1.9 $ 662000 V-Bits, Inc. 2.8 $1282000 Growth Networks, Inc. 5.6 $3552000 Altiga Networks, Inc. 6.3 $3352000 Compatible Systems Corporation 3.8 $232
NOTES TO CONSOLIDATED FINANCIAL STATEMENTS
73.1494_fin_9.0.qxd 9/25/00 11:33 AM Page 32

C I S C O S Y S T E M S , I N C . 2 0 0 0 A n n u a l R e p o r t 33
P u r c h a s e C o m b i n a t i o n s
During the three years ended July 29, 2000, the Company completed a number of purchase acquisitions. The ConsolidatedFinancial Statements include the operating results of each business from the date of acquisition. Pro forma results of operationshave not been presented because the effects of these acquisitions were not material on either an individual or an aggregate basis.
The amounts allocated to in-process research and development (“in-process R&D”) were determined through establishedvaluation techniques in the high-technology communications equipment industry and were expensed upon acquisition becausetechnological feasibility had not been established and no future alternative uses existed. Amounts allocated to goodwill andpurchased intangible assets are amortized on a straight-line basis over periods not exceeding five years. A summary of purchasetransactions is outlined as follows (in millions):
I n - P r o c e s s R & D F o r m o f C o n s i d e r a t i o nA c q u i r e d C o m p a n y C o n s i d e r a t i o n E x p e n s e a n d O t h e r N o t e s t o A c q u i s i t i o n
F I S C A L 2 0 0 0
Monterey Networks, Inc. $ 517 $354 Common stock and options assumed; $14 in liabilities assumed; goodwill and other intangibles recorded of $154
The optical systems business $2,018 $245 Common stock; $362 in liabilities assumed; goodwill and other of Pirelli S.p.A. intangibles recorded of $1,717
Aironet Wireless $ 835 $243 Common stock and options assumed; $34 in liabilities assumed; Communications, Inc. goodwill and other intangibles recorded of $589
Atlantech Technologies $ 179 $ 63 Cash of $92; common stock and options assumed; $1 in liabilitiesassumed; goodwill and other intangibles recorded of $140
JetCell, Inc. $ 203 $ 88 Cash of $5; common stock and options assumed; $2 in liabilitiesassumed; goodwill and other intangibles recorded of $137
PentaCom, Ltd. $ 102 $ 49 Cash of $26; common stock and options assumed; goodwill and other intangibles recorded of $40
Qeyton Systems $ 887 $260 Common stock; goodwill and other intangibles recorded of $567 Other $ 228 $ 71 Cash of $31; common stock and options assumed; $5 in liabilities
assumed; goodwill and other intangibles recorded of $155
F I S C A L 1 9 9 9
Summa Four, Inc. $ 129 $ 64 Common stock and options assumed; $16 in liabilities assumed; goodwill and other intangibles recorded of $29
Clarity Wireless, Inc. $ 153 $ 94 Common stock and options assumed; goodwill and other intangibles recorded of $73
Selsius Systems, Inc. $ 134 $ 92 Cash of $111; options assumed; goodwill and otherintangibles recorded of $41
PipeLinks, Inc. $ 118 $ 99 Common stock and options assumed; goodwill and other intangibles recorded of $11
Amteva Technologies, Inc. $ 159 $ 81 Common stock and options assumed; $9 in liabilities assumed; goodwill and other intangibles recorded of $85
Other $ 58 $ 41 Common stock and options assumed; goodwill and other intangibles recorded of $18
F I S C A L 1 9 9 8
Dagaz Technologies, Inc. $ 130 $127 Cash of $108; $18 in common stock; liabilities assumed of $4LightSpeed International, Inc. $ 161 $143 Common stock and options assumed; other intangibles
recorded of $15 WheelGroup Corporation $ 124 $ 97 Common stock and options assumed; goodwill and other
intangibles recorded of $38 NetSpeed International, Inc. $ 252 $179 Cash of $12; common stock and options assumed; liabilities
assumed of $18; goodwill and other intangibles recorded of $76 Other $ 51 $ 48 Cash of $38 and options assumed
73.1494_fin_9.0.qxd 9/25/00 11:33 AM Page 33

34 C I S C O S Y S T E M S , I N C . 2 0 0 0 A n n u a l R e p o r t
Other Purchase Combinations Completed as of July 29, 2000
In fiscal 2000, the Company acquired Maxcomm Technologies, Inc.; Calista, Inc.; Tasmania Network Systems, Inc.; InternetEngineering Group, LLC; Worldwide Data Systems, Inc.; and Seagull Networks, Ltd. for a total purchase price of $228 million,paid in common stock and cash. Total in-process R&D related to these acquisitions amounted to $71 million.
Total in-process R&D expense in fiscal 2000, 1999, and 1998 was $1.37 billion, $471 million, and $594 million,respectively. The in-process R&D expense that was attributable to stock consideration for the same periods was $1.28 billion,$379 million, and $436 million, respectively.
4. BALANCE SHEET DETAIL
The following tables provide details of selected balance sheet items (in millions):
J u l y 2 9 , 2 0 0 0 J u l y 3 1 , 1 9 9 9
I N V E N T O R I E S , N E T :
Raw materials $ 145 $ 143Work in process 472 198Finished goods 496 282Demonstration systems 119 35
Total $1,232 $ 658
P R O P E R T Y A N D E Q U I P M E N T , N E T :
Leasehold improvements $ 607 $ 289Computer equipment and related software 908 639Production and engineering equipment 407 238Office equipment, furniture, and fixtures 1,083 685
3,005 1,851Less, accumulated depreciation and amortization (1,579) (1,026)
Total $1,426 $ 825
G O O D W I L L A N D P U R C H A S E D I N T A N G I B L E A S S E T S , N E T :
Goodwill $2,937 $ 157Purchased intangible assets 1,558 395
4,495 552Less, accumulated amortization (408) (92)
Total $4,087 $ 460
The following table presents the details of the amortization of goodwill and purchased intangible assets as reported in theConsolidated Statements of Operations:
Y e a r s E n d e d J u l y 2 9 , 2 0 0 0 J u l y 3 1 , 1 9 9 9 J u l y 2 5 , 1 9 9 8
Reported as:Cost of sales $ 25 $ 1 $ –Operating expenses 291 61 23
Total $316 $62 $ 23
NOTES TO CONSOLIDATED FINANCIAL STATEMENTS
73.1494_fin_9.0.qxd 9/25/00 11:33 AM Page 34
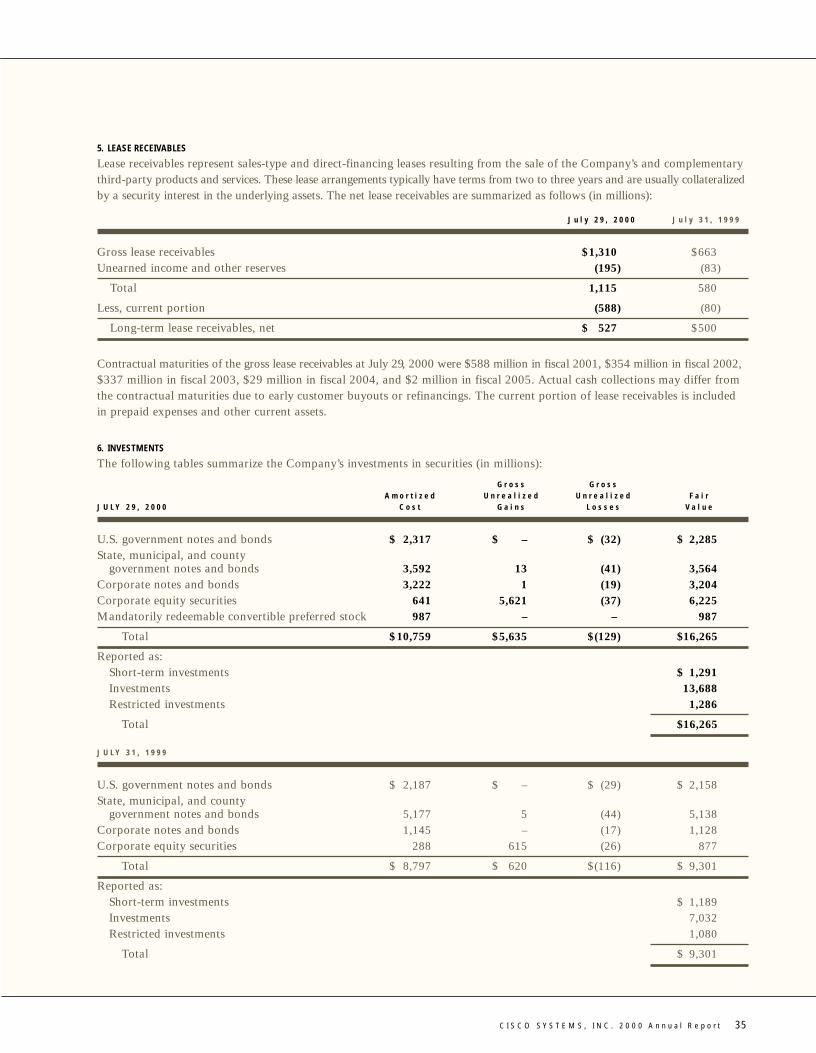
C I S C O S Y S T E M S , I N C . 2 0 0 0 A n n u a l R e p o r t 35
5. LEASE RECEIVABLES
Lease receivables represent sales-type and direct-financing leases resulting from the sale of the Company’s and complementarythird-party products and services. These lease arrangements typically have terms from two to three years and are usually collateralizedby a security interest in the underlying assets. The net lease receivables are summarized as follows (in millions):
J u l y 2 9 , 2 0 0 0 J u l y 3 1 , 1 9 9 9
Gross lease receivables $1,310 $663Unearned income and other reserves (195) (83)
Total 1,115 580
Less, current portion (588) (80)
Long-term lease receivables, net $ 527 $500
Contractual maturities of the gross lease receivables at July 29, 2000 were $588 million in fiscal 2001, $354 million in fiscal 2002,$337 million in fiscal 2003, $29 million in fiscal 2004, and $2 million in fiscal 2005. Actual cash collections may differ fromthe contractual maturities due to early customer buyouts or refinancings. The current portion of lease receivables is includedin prepaid expenses and other current assets.
6. INVESTMENTS
The following tables summarize the Company’s investments in securities (in millions):
G r o s s G r o s sA m o r t i z e d U n r e a l i z e d U n r e a l i z e d F a i r
J U L Y 2 9 , 2 0 0 0 C o s t G a i n s L o s s e s V a l u e
U.S. government notes and bonds $ 2,317 $ – $ (32) $ 2,285State, municipal, and county
government notes and bonds 3,592 13 (41) 3,564Corporate notes and bonds 3,222 1 (19) 3,204Corporate equity securities 641 5,621 (37) 6,225Mandatorily redeemable convertible preferred stock 987 – – 987
Total $10,759 $5,635 $(129) $16,265
Reported as:Short-term investments $ 1,291Investments 13,688Restricted investments 1,286
Total $16,265
J U L Y 3 1 , 1 9 9 9
U.S. government notes and bonds $ 2,187 $ – $ (29) $ 2,158State, municipal, and county
government notes and bonds 5,177 5 (44) 5,138Corporate notes and bonds 1,145 – (17) 1,128Corporate equity securities 288 615 (26) 877
Total $ 8,797 $ 620 $(116) $ 9,301
Reported as:Short-term investments $ 1,189Investments 7,032Restricted investments 1,080
Total $ 9,301
73.1494_fin_9.0.qxd 9/25/00 11:33 AM Page 35
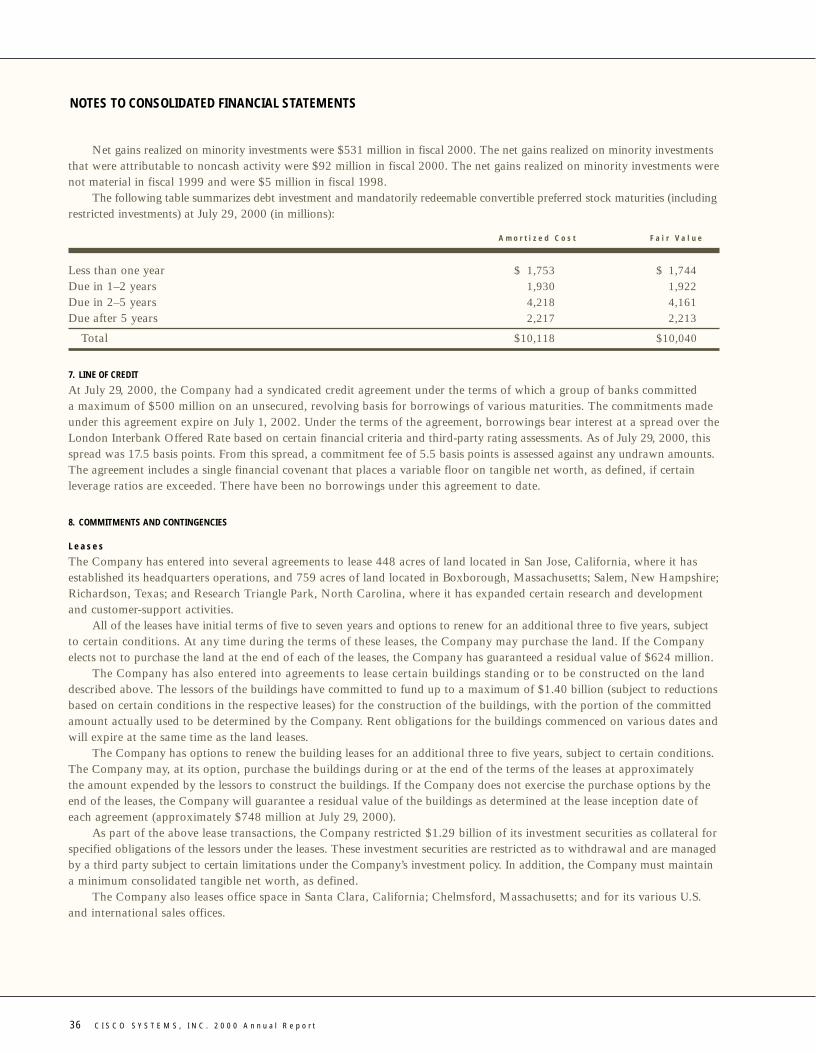
36 C I S C O S Y S T E M S , I N C . 2 0 0 0 A n n u a l R e p o r t
Net gains realized on minority investments were $531 million in fiscal 2000. The net gains realized on minority investmentsthat were attributable to noncash activity were $92 million in fiscal 2000. The net gains realized on minority investments werenot material in fiscal 1999 and were $5 million in fiscal 1998.
The following table summarizes debt investment and mandatorily redeemable convertible preferred stock maturities (includingrestricted investments) at July 29, 2000 (in millions):
A m o r t i z e d C o s t F a i r V a l u e
Less than one year $ 1,753 $ 1,744Due in 1–2 years 1,930 1,922Due in 2–5 years 4,218 4,161Due after 5 years 2,217 2,213
Total $10,118 $10,040
7. LINE OF CREDIT
At July 29, 2000, the Company had a syndicated credit agreement under the terms of which a group of banks committed a maximum of $500 million on an unsecured, revolving basis for borrowings of various maturities. The commitments madeunder this agreement expire on July 1, 2002. Under the terms of the agreement, borrowings bear interest at a spread over theLondon Interbank Offered Rate based on certain financial criteria and third-party rating assessments. As of July 29, 2000, thisspread was 17.5 basis points. From this spread, a commitment fee of 5.5 basis points is assessed against any undrawn amounts.The agreement includes a single financial covenant that places a variable floor on tangible net worth, as defined, if certainleverage ratios are exceeded. There have been no borrowings under this agreement to date.
8. COMMITMENTS AND CONTINGENCIES
L e a s e s
The Company has entered into several agreements to lease 448 acres of land located in San Jose, California, where it hasestablished its headquarters operations, and 759 acres of land located in Boxborough, Massachusetts; Salem, New Hampshire;Richardson, Texas; and Research Triangle Park, North Carolina, where it has expanded certain research and developmentand customer-support activities.
All of the leases have initial terms of five to seven years and options to renew for an additional three to five years, subjectto certain conditions. At any time during the terms of these leases, the Company may purchase the land. If the Companyelects not to purchase the land at the end of each of the leases, the Company has guaranteed a residual value of $624 million.
The Company has also entered into agreements to lease certain buildings standing or to be constructed on the landdescribed above. The lessors of the buildings have committed to fund up to a maximum of $1.40 billion (subject to reductionsbased on certain conditions in the respective leases) for the construction of the buildings, with the portion of the committedamount actually used to be determined by the Company. Rent obligations for the buildings commenced on various dates andwill expire at the same time as the land leases.
The Company has options to renew the building leases for an additional three to five years, subject to certain conditions.The Company may, at its option, purchase the buildings during or at the end of the terms of the leases at approximately the amount expended by the lessors to construct the buildings. If the Company does not exercise the purchase options by theend of the leases, the Company will guarantee a residual value of the buildings as determined at the lease inception date ofeach agreement (approximately $748 million at July 29, 2000).
As part of the above lease transactions, the Company restricted $1.29 billion of its investment securities as collateral forspecified obligations of the lessors under the leases. These investment securities are restricted as to withdrawal and are managedby a third party subject to certain limitations under the Company’s investment policy. In addition, the Company must maintaina minimum consolidated tangible net worth, as defined.
The Company also leases office space in Santa Clara, California; Chelmsford, Massachusetts; and for its various U.S.and international sales offices.
NOTES TO CONSOLIDATED FINANCIAL STATEMENTS
73.1494_fin_9.0.qxd 9/25/00 11:33 AM Page 36

C I S C O S Y S T E M S , I N C . 2 0 0 0 A n n u a l R e p o r t 37
Future annual minimum lease payments under all noncancelable operating leases as of July 29, 2000 are as follows (in millions):
F i s c a l Y e a r
2001 $ 3022002 2992003 3102004 2512005 237Thereafter 1,506
Total $2,905
Rent expense totaled $229 million, $123 million, and $90 million for fiscal 2000, 1999, and 1998, respectively.
F o r e i g n E x c h a n g e F o r w a r d a n d O p t i o n C o n t r a c t s
The Company conducts business on a global basis in several major currencies. As such, it is exposed to adverse movements inforeign currency exchange rates. The Company enters into foreign exchange forward contracts to reduce the impact of certaincurrency exposures. These contracts hedge exposures associated with nonfunctional currency assets and liabilities denominatedin Australian, Canadian, Japanese, Korean, and several European currencies, primarily the euro and British pound.
The Company does not enter into foreign exchange forward contracts for trading purposes. Gains and losses on thecontracts are included in interest and other income, net, and offset foreign exchange gains or losses from the revaluation ofintercompany balances or other current assets and liabilities denominated in currencies other than the functional currency of the reporting entity. The Company’s foreign exchange forward contracts generally range from one to three months inoriginal maturity.
The Company periodically hedges anticipated transactions with purchased currency options. A purchased currency option’spremium is amortized over the life of the option while any intrinsic value is recognized in income during the same period as thehedged transaction. The deferred premium and intrinsic value from hedging anticipated transactions were not material atJuly 29, 2000. In the unlikely event that the underlying transaction terminates or becomes improbable, the remaining premiumor deferred intrinsic value will be recorded in the Consolidated Statements of Operations. The Company does not purchasecurrency options for trading purposes. Foreign exchange forward and option contracts as of July 29, 2000 are summarizedas follows (in millions):
N o t i o n a l C a r r y i n g F a i rA m o u n t V a l u e V a l u e
Forward contracts:Assets $1,377 $ (5) $(15)Liabilities $1,500 $12 $ 37
Option contracts:Assets $ 561 $12 $ 14
The Company’s foreign exchange forward and option contracts contain credit risk to the extent that its bank counterparties maybe unable to meet the terms of the agreements. The Company minimizes such risk by limiting its counterparties to major financialinstitutions. In addition, the potential risk of loss with any one party resulting from this type of credit risk is monitored. Managementdoes not expect any material losses as a result of default by other parties.
L e g a l P r o c e e d i n g s
The Company is subject to legal proceedings, claims, and litigation arising in the ordinary course of business. While the outcome of these matters is currently not determinable, management does not expect that the ultimate costs to resolve these matters willhave a material adverse effect on the Company’s consolidated financial position, results of operations, or cash flows.
73.1494_fin_9.0.qxd 9/25/00 11:33 AM Page 37

38 C I S C O S Y S T E M S , I N C . 2 0 0 0 A n n u a l R e p o r t
9. SHAREHOLDERS’ EQUITY
A u t h o r i z e d S h a r e s
On November 10, 1999, the shareholders of the Company approved an increase to the authorized number of shares of commonstock from 5.40 billion to 10 billion shares. On March 20, 2000, the Board of Directors of the Company approved an increaseto the authorized number of shares of common stock from 10 billion to 20 billion shares relating to the two-for-one stocksplit distributed on March 22, 2000.
S t o c k S p l i t
The Board of Directors authorized the splitting of the Company’s common stock on a two-for-one basis for shareholders of record on February 22, 2000 and the resulting shares from the split were distributed on March 22, 2000. All references to share and per-share data for all periods presented have been adjusted to give effect to this two-for-one stock split.
S h a r e h o l d e r s ’ R i g h t s P l a n
In June 1998, the Board of Directors approved a Shareholders’ Rights Plan (“Rights Plan”). The Rights Plan is intended toprotect shareholders’ rights in the event of an unsolicited takeover attempt. It is not intended to prevent a takeover of theCompany on terms that are favorable and fair to all shareholders and will not interfere with a merger approved by the Boardof Directors. Each right entitles shareholders to buy a unit equal to a portion of a new share of Series A Preferred Stock ofthe Company. The rights will be exercisable only if a person or a group acquires or announces a tender or exchange offer toacquire 15% or more of the Company’s common stock.
In the event the rights become exercisable, the Rights Plan allows for Cisco shareholders to acquire, at an exercise price of$108 per right owned, stock of the surviving corporation having a market value of $217, whether or not Cisco is the survivingcorporation. The rights, which expire in June 2008, are redeemable for $0.00017 per right at the approval of the Board of Directors.
P r e f e r r e d S t o c k
Under the terms of the Company’s Articles of Incorporation, the Board of Directors may determine the rights, preferences,and terms of the Company’s authorized but unissued shares of preferred stock.
C o m p r e h e n s i v e I n c o m e
The components of comprehensive income, net of tax, are as follows (in millions):
Y e a r s E n d e d J u l y 2 9 , 2 0 0 0 J u l y 3 1 , 1 9 9 9 J u l y 2 5 , 1 9 9 8
Net income $2,668 $2,023 $1,331Other comprehensive income (loss):
Change in net unrealized gains on investments,net of tax of $1,762, $144, and $17 in fiscal 2000, 1999, and 1998, respectively 3,240 234 25
Reclassification for net unrealized gainspreviously included in net income, net of tax of $2 in fiscal 1998 – – 3
Net unrealized gains 3,240 234 28Change in accumulated translation adjustments (8) 6 (10)
Total $5,900 $2,263 $1,349
10. EMPLOYEE BENEFIT PLANS
E m p l o y e e S t o c k P u r c h a s e P l a n
The Company has an Employee Stock Purchase Plan (the “Purchase Plan”) under which 222 million shares of common stockhave been reserved for issuance. Eligible employees may purchase a limited number of shares of the Company’s common stock at 85% of the market value at certain plan-defined dates. The Purchase Plan terminates on January 3, 2005. In fiscal 2000, 1999,and 1998, seven million, 10 million, and 14 million shares, respectively, were issued under the Purchase Plan. At July 29, 2000, 123 million shares were available for issuance under the Purchase Plan.
NOTES TO CONSOLIDATED FINANCIAL STATEMENTS
73.1494_fin_9.0.qxd 9/25/00 11:33 AM Page 38
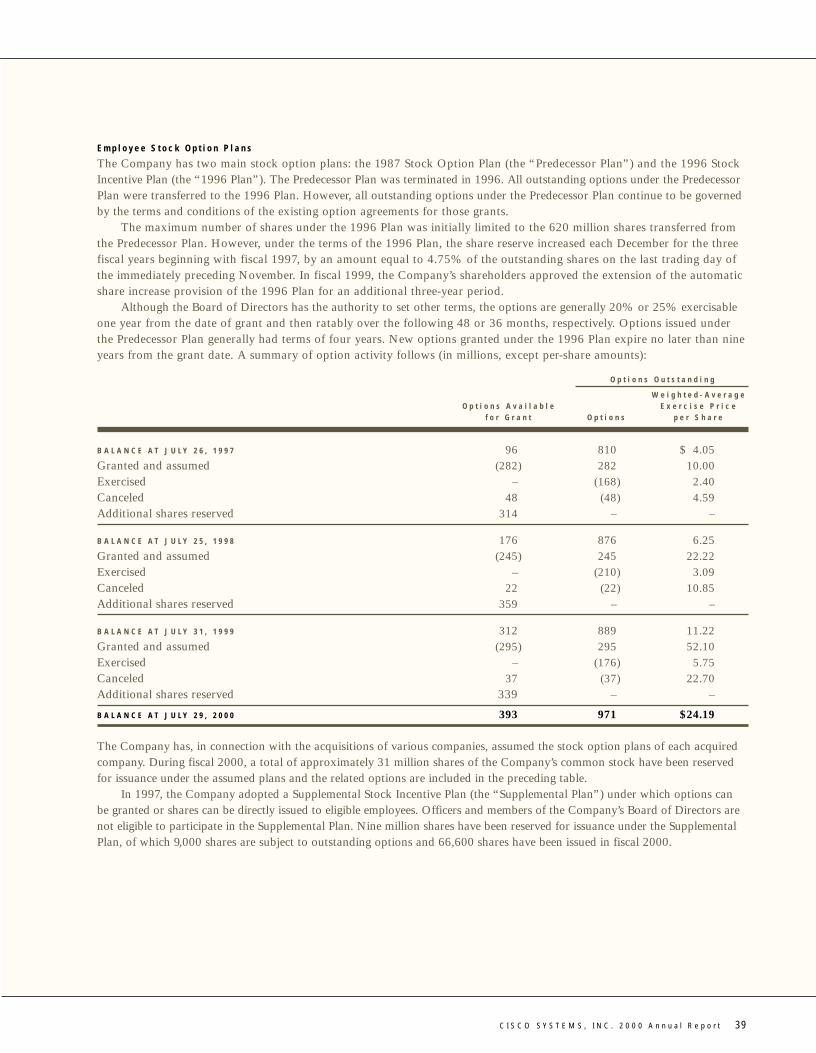
C I S C O S Y S T E M S , I N C . 2 0 0 0 A n n u a l R e p o r t 39
E m p l o y e e S t o c k O p t i o n P l a n s
The Company has two main stock option plans: the 1987 Stock Option Plan (the “Predecessor Plan”) and the 1996 StockIncentive Plan (the “1996 Plan”). The Predecessor Plan was terminated in 1996. All outstanding options under the PredecessorPlan were transferred to the 1996 Plan. However, all outstanding options under the Predecessor Plan continue to be governedby the terms and conditions of the existing option agreements for those grants.
The maximum number of shares under the 1996 Plan was initially limited to the 620 million shares transferred fromthe Predecessor Plan. However, under the terms of the 1996 Plan, the share reserve increased each December for the threefiscal years beginning with fiscal 1997, by an amount equal to 4.75% of the outstanding shares on the last trading day ofthe immediately preceding November. In fiscal 1999, the Company’s shareholders approved the extension of the automaticshare increase provision of the 1996 Plan for an additional three-year period.
Although the Board of Directors has the authority to set other terms, the options are generally 20% or 25% exercisableone year from the date of grant and then ratably over the following 48 or 36 months, respectively. Options issued underthe Predecessor Plan generally had terms of four years. New options granted under the 1996 Plan expire no later than nineyears from the grant date. A summary of option activity follows (in millions, except per-share amounts):
O p t i o n s O u t s t a n d i n g
W e i g h t e d - A v e r a g eO p t i o n s A v a i l a b l e E x e r c i s e P r i c e
f o r G r a n t O p t i o n s p e r S h a r e
B A L A N C E A T J U L Y 2 6 , 1 9 9 7 96 810 $ 4.05Granted and assumed (282) 282 10.00Exercised – (168) 2.40Canceled 48 (48) 4.59Additional shares reserved 314 – –
B A L A N C E A T J U L Y 2 5 , 1 9 9 8 176 876 6.25Granted and assumed (245) 245 22.22Exercised – (210) 3.09Canceled 22 (22) 10.85Additional shares reserved 359 – –
B A L A N C E A T J U L Y 3 1 , 1 9 9 9 312 889 11.22Granted and assumed (295) 295 52.10Exercised – (176) 5.75Canceled 37 (37) 22.70Additional shares reserved 339 – –
B A L A N C E A T J U L Y 2 9 , 2 0 0 0 393 971 $24.19
The Company has, in connection with the acquisitions of various companies, assumed the stock option plans of each acquiredcompany. During fiscal 2000, a total of approximately 31 million shares of the Company’s common stock have been reservedfor issuance under the assumed plans and the related options are included in the preceding table.
In 1997, the Company adopted a Supplemental Stock Incentive Plan (the “Supplemental Plan”) under which options can be granted or shares can be directly issued to eligible employees. Officers and members of the Company’s Board of Directors arenot eligible to participate in the Supplemental Plan. Nine million shares have been reserved for issuance under the SupplementalPlan, of which 9,000 shares are subject to outstanding options and 66,600 shares have been issued in fiscal 2000.
73.1494_fin_9.0.qxd 9/25/00 11:33 AM Page 39

40 C I S C O S Y S T E M S , I N C . 2 0 0 0 A n n u a l R e p o r t
The following table summarizes information concerning outstanding and exercisable options at July 29, 2000 (in millions,except number of years and per-share amounts):
O p t i o n s O u t s t a n d i n g O p t i o n s E x e r c i s a b l e
W e i g h t e d - A v e r a g e W e i g h t e d - A v e r a g e W e i g h t e d - A v e r a g eR a n g e o f N u m b e r R e m a i n i n g C o n t r a c t u a l E x e r c i s e P r i c e N u m b e r E x e r c i s e P r i c e
E x e r c i s e P r i c e s O u t s t a n d i n g L i f e ( i n Y e a r s ) p e r S h a r e E x e r c i s a b l e p e r S h a r e
$ 0.01 – 5.56 229 5.20 $ 5.23 188 $ 4.445.57 –12.27 258 6.16 9.56 162 8.95
12.28 –28.61 194 7.49 23.59 63 22.4728.62 –54.53 241 8.34 49.91 5 31.0254.54 –72.56 49 8.64 65.65 – –
Total 971 6.87 $ 24.19 418 $ 9.22
At July 31, 1999 and July 25, 1998, approximately 370 million and 312 million outstanding options, respectively, were exercisable.The weighted-average exercise prices for outstanding options were $5.75 and $3.64 at July 31, 1999 and July 25, 1998, respectively.
The Company is required under Statement of Financial Accounting Standards No. 123, “Accounting for Stock-BasedCompensation” (“SFAS 123”), to disclose pro forma information regarding option grants made to its employees based on specified valuation techniques that produce estimated compensation charges. These amounts have not been reflected in the Company’sConsolidated Statements of Operations because no compensation charge arises when the price of the employees’ stock optionsequals the market value of the underlying stock at the grant date, as in the case of options granted to the Company’s employees. Pro forma information under SFAS 123 is as follows (in millions, except per-share amounts):
Y e a r s E n d e d J u l y 2 9 , 2 0 0 0 J u l y 3 1 , 1 9 9 9 J u l y 2 5 , 1 9 9 8
Net income—as reported $2,668 $2,023 $1,331Net income—pro forma $1,549 $1,487 $1,074Basic net income per common share—as reported $ 0.39 $ 0.30 $ 0.21Diluted net income per common share—as reported $ 0.36 $ 0.29 $ 0.20Basic net income per common share—pro forma $ 0.22 $ 0.22 $ 0.17Diluted net income per common share—pro forma $ 0.21 $ 0.21 $ 0.16
The fair value of each option grant is estimated on the date of grant using the Black-Scholes option pricing model with thefollowing weighted-average assumptions:
E m p l o y e e S t o c k O p t i o n P l a n s E m p l o y e e S t o c k P u r c h a s e P l a n
J u l y 2 9 , 2 0 0 0 J u l y 3 1 , 1 9 9 9 J u l y 2 5 , 1 9 9 8 J u l y 2 9 , 2 0 0 0 J u l y 3 1 , 1 9 9 9 J u l y 2 5 , 1 9 9 8
Expected dividend yield 0.0% 0.0% 0.0% 0.0% 0.0% 0.0%Risk-free interest rate 6.4% 5.1% 5.7% 5.3% 4.9% 5.4%Expected volatility 33.9% 40.2% 35.6% 43.3% 47.2% 44.8%Expected life (in years) 3.1 3.1 3.1 0.5 0.5 0.5
NOTES TO CONSOLIDATED FINANCIAL STATEMENTS
73.1494_fin_9.0.qxd 9/25/00 11:33 AM Page 40

C I S C O S Y S T E M S , I N C . 2 0 0 0 A n n u a l R e p o r t 41
The Black-Scholes option pricing model was developed for use in estimating the fair value of traded options that haveno vesting restrictions and are fully transferable. In addition, option pricing models require the input of highly subjectiveassumptions including the expected stock price volatility. The Company uses projected volatility rates which are based uponhistorical volatility rates trended into future years. Because the Company’s employee stock options have characteristics significantly different from those of traded options, and because changes in the subjective input assumptions can materiallyaffect the fair value estimate, in management’s opinion, the existing models do not necessarily provide a reliable single measureof the fair value of the Company’s options. The weighted-average estimated fair values of employee stock options grantedduring fiscal 2000, 1999, and 1998 were $19.44, $8.40, and $3.57 per share, respectively.
The above pro forma disclosures under SFAS 123 are also not likely to be representative of the effects on net incomeand net income per common share in future years, because they do not take into consideration pro forma compensationexpense related to grants made prior to fiscal 1996.
E m p l o y e e 4 0 1 ( k ) P l a n s
The Company sponsors the Cisco Systems, Inc. 401(k) Plan (the “Plan”) to provide retirement benefits for its employees. As allowed under Section 401(k) of the Internal Revenue Code, the Plan provides tax-deferred salary deductions for eligibleemployees. The Company also has other 401(k) plans that it sponsors. These plans arose from acquisitions of other companies and are not material to the Company on either an individual or aggregate basis.
Employees may contribute from 1% to 15% of their annual compensation to the Plan, limited to a maximum annualamount as set periodically by the Internal Revenue Service. The Company matches employee contributions dollar for dollarup to a maximum of $1,500 per year per person. All matching contributions vest immediately. In addition, the Plan providesfor discretionary contributions as determined by the Board of Directors. Such contributions to the Plan are allocated amongeligible participants in the proportion of their salaries to the total salaries of all participants. The Company’s matching contributions to the Plan totaled $34 million, $20 million, and $15 million in fiscal 2000, 1999, and 1998, respectively. No discretionary contributions were made in fiscal 2000, 1999, or 1998.
1 1 . I N C O M E TA X E S
The provision for (benefit from) income taxes consisted of (in millions):
Y e a r s E n d e d J u l y 2 9 , 2 0 0 0 J u l y 3 1 , 1 9 9 9 J u l y 2 5 , 1 9 9 8
Federal:Current $1,843 $ 1,164 $855Deferred (652) (221) (54)
1,191 943 801
State:Current 282 112 87Deferred (118) (24) (8)
164 88 79
Foreign:Current 332 151 74Deferred (12) (2) (14)
320 149 60
Total provision for income taxes $1,675 $ 1,180 $940
73.1494_fin_9.0.qxd 9/25/00 11:33 AM Page 41

42 C I S C O S Y S T E M S , I N C . 2 0 0 0 A n n u a l R e p o r t
The Company paid income taxes of $327 million, $301 million, and $440 million in fiscal 2000, 1999, and 1998, respectively.Income before provision for income taxes consisted of (in millions):
Y e a r s E n d e d J u l y 2 9 , 2 0 0 0 J u l y 3 1 , 1 9 9 9 J u l y 2 5 , 1 9 9 8
United States $2,544 $2,092 $1,950International 1,799 1,111 321
$4,343 $3,203 $2,271
The items accounting for the difference between income taxes computed at the federal statutory rate and the provision forincome taxes consisted of:
Y e a r s E n d e d J u l y 2 9 , 2 0 0 0 J u l y 3 1 , 1 9 9 9 J u l y 2 5 , 1 9 9 8
Federal statutory rate 35.0% 35.0% 35.0%Effect of:
State taxes, net of federal tax benefit 1.9 2.2 2.2Foreign sales corporation (1.9) (1.6) (2.4)Foreign income at other than U.S. rates (1.6) (1.0) –Nondeductible in-process R&D 8.1 3.9 6.4Tax-exempt interest (1.8) (1.9) (1.6)Tax credits (1.6) (1.2) (1.4)Other, net 0.5 1.5 3.2
Total 38.6% 36.9% 41.4%
U.S. income taxes and foreign withholding taxes were not provided for on a cumulative total of approximately $411 millionof undistributed earnings for certain non-U.S. subsidiaries. The Company intends to reinvest these earnings indefinitely inoperations outside the United States. The components of the deferred tax assets (liabilities) follow (in millions):
J u l y 2 9 , 2 0 0 0 J u l y 3 1 , 1 9 9 9
A S S E T S
Allowance for doubtful accounts and returns $ 418 $ 185In-process R&D 265 163Inventory allowances and capitalization 94 57Accrued state franchise tax – 32Depreciation 41 28Deferred revenue 177 65Credits and net operating loss carryforwards 1,023 –Other 451 256
Gross deferred tax assets 2,469 786Valuation allowance (299) –
Total deferred tax assets 2,170 786
L I A B I L I T I E S
Purchased intangible assets (257) (88)
Unrealized gain on investments (1,954) (192)
Total deferred tax liabilities (2,211) (280)
Total $ (41) $ 506
The noncurrent portion of the deferred tax liabilities, which totaled $74 million at July 31, 1999, is included in other assets.
NOTES TO CONSOLIDATED FINANCIAL STATEMENTS
73.1494_fin_9.0.qxd 9/25/00 11:33 AM Page 42

C I S C O S Y S T E M S , I N C . 2 0 0 0 A n n u a l R e p o r t 43
The Company has provided a valuation allowance on certain of its deferred tax assets because of uncertainty regardingtheir realizability due to expectation of future employee stock option exercises. Deferred tax assets of approximately $963 millionat July 29, 2000 pertain to certain tax credits and net operating loss carryforwards resulting from the exercise of employeestock options. When recognized, the tax benefit of these credits and losses will be accounted for as a credit to shareholders’equity rather than as a reduction of the income tax provision.
As of July 29, 2000, the Company’s federal and state net operating loss carryforwards for income tax purposes wereapproximately $496 million and $865 million, respectively. If not utilized, the federal net operating loss carryforwards willbegin to expire in fiscal 2020, and the state net operating loss carryforwards will begin to expire in fiscal 2005. As of July 29, 2000,the Company’s federal and state tax credit carryforwards for income tax purposes were approximately $678 million and$197 million, respectively. If not utilized, the federal and state tax credit carryforwards will begin to expire in fiscal 2005.
The Company’s income taxes payable for federal, state, and foreign purposes have been reduced, and the deferred taxassets increased, by the tax benefits associated with dispositions of employee stock options. The Company receives an incometax benefit calculated as the difference between the fair market value of the stock issued at the time of exercise and the optionprice, tax effected. These benefits were credited directly to shareholders’ equity and amounted to $3.08 billion, $837 million,and $422 million for fiscal 2000, 1999, and 1998, respectively. Benefits reducing taxes payable amounted to $2.49 billion,$837 million, and $422 million for fiscal 2000, 1999, and 1998, respectively. Benefits increasing gross deferred tax assetsamounted to $582 million in fiscal 2000.
12. SEGMENT INFORMATION AND MAJOR CUSTOMERS
The Company’s operations involve the design, development, manufacture, marketing, and technical support of networkingproducts and services. The Company offers end-to-end networking solutions for its customers. Cisco products include routers,LAN and ATM switches, dial-up access servers, and network-management software. These products, integrated by the Cisco IOS® software, link geographically dispersed LANs, WANs, and IBM networks.
The Company conducts business globally and is managed geographically. The Company’s management relies on aninternal management system that provides sales and standard cost information by geographic theater. Sales are attributed toa theater based on the ordering location of the customer. The Company’s management makes financial decisions and allocatesresources based on the information it receives from this internal management system. The Company does not allocate research anddevelopment, sales and marketing, or general and administrative expenses to its geographic theaters as management does not usethis information to measure the performance of the operating segments. Management does not believe that allocating theseexpenses is material in evaluating a geographic theater’s performance. Information from this internal management systemdiffers from the amounts reported under generally accepted accounting principles due to certain corporate level adjustments notincluded in the internal management system. These corporate level adjustments are primarily sales adjustments relating torevenue deferrals and reserves, credit memos, returns, and other timing differences. Based on established criteria, the Companyhas four reportable segments: the Americas; Europe, the Middle East, and Africa (“EMEA”); Asia Pacific; and Japan.
73.1494_fin_9.0.qxd 9/25/00 11:33 AM Page 43

44 C I S C O S Y S T E M S , I N C . 2 0 0 0 A n n u a l R e p o r t
Summarized financial information by theater for fiscal 2000, 1999, and 1998, as taken from the internal management systemdiscussed previously, is as follows (in millions):
Y e a r s E n d e d J u l y 2 9 , 2 0 0 0 J u l y 3 1 , 1 9 9 9 J u l y 2 5 , 1 9 9 8
Net sales:Americas $12,924 $ 8,088 $5,732EMEA 4,770 3,216 2,114Asia Pacific 1,705 825 535Japan 935 566 459Sales adjustments (1,406) (522) (351)
Total $18,928 $12,173 $8,489
Gross margin:Americas $ 9,412 $ 5,836 $4,261EMEA 3,581 2,380 1,565Asia Pacific 1,215 586 395Japan 737 436 340
Standard margins 14,945 9,238 6,561Sales adjustments (1,406) (522) (351)Production overhead (455) (255) (207)Manufacturing variances and other related costs (902) (547) (438)
Total $12,182 $ 7,914 $5,565
The standard margins by geographic theater differ from the amounts recognized under generally accepted accountingprinciples because the Company does not allocate certain sales adjustments, production overhead, and manufacturingvariances and other related costs to the theaters. The above table reconciles the net sales and standard margins by geographictheater to net sales and gross margin as reported in the Consolidated Statements of Operations by including such adjustments.
Enterprise-wide information provided on geographic sales is based on the ordering location of the customer. Propertyand equipment information is based on the physical location of the assets. The following table presents net sales andproperty and equipment information for geographic areas (in millions):
J u l y 2 9 , 2 0 0 0 J u l y 3 1 , 1 9 9 9 J u l y 2 5 , 1 9 9 8
Net sales:United States $ 12,013 $ 7,454 $5,232International 8,321 5,241 3,608Sales adjustments (1,406) (522) (351)
Total $ 18,928 $12,173 $8,489
Property and equipment, net:United States $ 1,242 $ 711 $ 537International 184 114 72
Total $ 1,426 $ 825 $ 609
NOTES TO CONSOLIDATED FINANCIAL STATEMENTS
73.1494_fin_9.0.qxd 9/25/00 11:33 AM Page 44

C I S C O S Y S T E M S , I N C . 2 0 0 0 A n n u a l R e p o r t 45
The following table presents net sales for groups of similar products and services (in millions):
Y e a r s E n d e d J u l y 2 9 , 2 0 0 0 J u l y 3 1 , 1 9 9 9 J u l y 2 5 , 1 9 9 8
Net sales:Routers $ 7,611 $ 5,196 $3,856Switches 7,509 5,167 3,613Access 2,396 1,127 630Other 2,818 1,205 741Sales adjustments (1,406) (522) (351)
Total $18,928 $12,173 $8,489
Substantially all of the Company’s assets at July 29, 2000 and July 31, 1999 were attributable to U.S. operations. In fiscal 2000,1999, and 1998, no single customer accounted for 10% or more of the Company’s net sales.
13. NET INCOME PER COMMON SHARE
The following table presents the calculation of basic and diluted net income per common share (in millions, except per-share amounts):
Y e a r s E n d e d J u l y 2 9 , 2 0 0 0 J u l y 3 1 , 1 9 9 9 J u l y 2 5 , 1 9 9 8
Net income $2,668 $2,023 $1,331
Weighted-average shares—basic 6,917 6,646 6,312Effect of dilutive securities:
Employee stock options 521 416 346
Weighted-average shares—diluted 7,438 7,062 6,658
Net income per common share—basic $ 0.39 $ 0.30 $ 0.21
Net income per common share—diluted $ 0.36 $ 0.29 $ 0.20
14. SUBSEQUENT EVENTS (UNAUDITED)
P e n d i n g B u s i n e s s C o m b i n a t i o n s
The Company announced definitive agreements to acquire HyNEX, Ltd.; Netiverse, Inc.; Komodo Technology, Inc.;NuSpeed Internet Systems, Inc.; IPmobile, Inc.; and PixStream Incorporated for a total purchase price of approximately$1.76 billion, payable in common stock and cash. These acquisitions will be accounted for as purchases and are expected to close in the first quarter of fiscal 2001.
73.1494_fin_9.0.qxd 9/25/00 11:33 AM Page 45

46 C I S C O S Y S T E M S , I N C . 2 0 0 0 A n n u a l R e p o r t
To the Board of Directors and Shareholders of Cisco Systems, Inc.
In our opinion, the accompanying consolidated balance sheets and the related consolidated statements of operations and of shareholders’ equity and of cash flows present fairly, in all material respects, the financial position of Cisco Systems, Inc.and its subsidiaries at July 29, 2000 and July 31, 1999, and the results of their operations and their cash flows for each ofthe three years in the period ended July 29, 2000, in conformity with accounting principles generally accepted in the United States.These financial statements are the responsibility of the Company’s management; our responsibility is to express an opinionon these financial statements based on our audits. We conducted our audits of these statements in accordance with auditingstandards generally accepted in the United States, which require that we plan and perform the audit to obtain reasonableassurance about whether the financial statements are free of material misstatement. An audit includes examining, on a testbasis, evidence supporting the amounts and disclosures in the financial statements, assessing the accounting principles usedand significant estimates made by management, and evaluating the overall financial statement presentation. We believe thatour audits provide a reasonable basis for the opinion expressed above.
San Jose, California August 8, 2000
REPORT OF INDEPENDENT ACCOUNTANTS
73.1494_fin_9.0.qxd 9/25/00 11:33 AM Page 46

C I S C O S Y S T E M S , I N C . 2 0 0 0 A n n u a l R e p o r t 47
J u l y 2 9 , A p r i l 2 9 , J a n . 2 9 , O c t . 3 0 , J u l y 3 1 , M a y 1 , J a n . 2 3 , O c t . 2 4 , 2 0 0 0 2 0 0 0 2 0 0 0 1 9 9 9 1 9 9 9 1 9 9 9 1 9 9 9 1 9 9 8
Net sales $5,720 $4,933 $4,357 $3,918 $3,558 $3,172 $2,845 $2,598Gross margin $3,662 $3,172 $2,818 $2,530 $2,297 $2,059 $1,857 $1,701Net income $ 796(2) $ 641(3) $ 816(4) $ 415(5) $ 605(6) $ 632(7) $ 279(8) $ 507(9)
Net income per commonshare—basic* $ 0.11 $ 0.09 $ 0.12 $ 0.06 $ 0.09 $ 0.09 $ 0.04 $ 0.08
Net income per commonshare—diluted* $ 0.11(2) $ 0.08(3) $ 0.11(4) $ 0.06(5) $ 0.08(6) $ 0.09(7) $ 0.04(8) $ 0.07(9)
* Reflects the two-for-one stock split effective March 2000.
(1) All historical financial information has been restated to reflect the acquisitions that were accounted for as poolings of interests (see Note 3 to the Consolidated Financial Statements).
(2) Net income and net income per common share include in-process research and development expenses of $461 million, payroll tax on stock option exercises of $26 million, amortization of goodwilland purchased intangible assets of $169 million, acquisition-related costs of $37 million, and net gains realized on minority investments of $344 million. Pro forma net income and diluted net incomeper common share, excluding these items net of tax of $53 million, were $1.20 billion and $0.16, respectively.
(3) Net income and net income per common share include in-process research and development expenses of $488 million, payroll tax on stock option exercises of $25 million, amortization of goodwilland purchased intangible assets of $51 million, and net gains realized on minority investments of $156 million. Pro forma net income and diluted net income per common share, excluding these itemsnet of tax benefits of $44 million, were $1.01 billion and $0.13, respectively.
(4) Net income and net income per common share include in-process research and development expenses of $43 million, amortization of goodwill and purchased intangible assets of $47 million, acquisition-related costs of $25 million, and net gains realized on minority investments of $31 million. Pro forma net income and diluted net income per common share, excluding these items net of tax benefits of$3 million, were $897 million and $0.12, respectively.
(5) Net income and net income per common share include in-process research and development expenses of $381 million and amortization of goodwill and purchased intangible assets of $24 million.Pro forma net income and diluted net income per common share, excluding these items net of tax benefits of $6 million, were $814 million and $0.11, respectively.
(6) Net income and net income per common share include in-process research and development expenses of $81 million, amortization of goodwill and purchased intangible assets of $19 million, and acquisition-related costs of $16 million. Pro forma net income and diluted net income per common share, excluding these items net of tax benefits of $11 million, were $710 million and $0.10, respectively.
(7) Net income and net income per common share include amortization of goodwill and purchased intangible assets of $19 million. Pro forma net income and diluted net income per common share,excluding this item net of a tax benefit of $6 million, were $645 million and $0.09, respectively.
(8) Net income and net income per common share include in-process research and development expenses of $349 million and amortization of goodwill and purchased intangible assets of $12 million. Pro forma net income and diluted net income per common share, excluding these items net of tax benefits of $34 million, were $606 million and $0.09, respectively.
(9) Net income and net income per common share include in-process research and development expenses of $41 million and amortization of goodwill and purchased intangible assets of $11 million. Pro forma net income and diluted net income per common share, excluding these items net of tax benefits of $3 million, were $556 million and $0.08, respectively.
STOCK MARKET INFORMATION
Cisco common stock (NASDAQ symbol CSCO) is traded on the NASDAQ National Market. The following table sets forth therange of high and low closing prices for each period indicated, adjusted to reflect the two-for-one split effective March 2000:
2 0 0 0 1 9 9 9 1 9 9 8
H i g h L o w H i g h L o w H i g h L o w
First quarter $37.00 $29.38 $17.32 $10.97 $ 9.37 $ 7.75Second quarter $57.63 $35.00 $26.67 $15.19 $10.05 $ 8.10Third quarter $80.06 $54.75 $29.69 $23.78 $12.31 $ 9.44Fourth quarter $71.44 $50.55 $33.53 $26.09 $17.20 $11.74
The Company has never paid cash dividends on its common stock and has no present plans to do so. There wereapproximately 60,150 shareholders of record at July 29, 2000.
SUPPLEMENTARY FINANCIAL DATA(1) (Unaudited)(In millions, except per-share amounts)
73.1494_fin_9.0.qxd 9/25/00 11:33 AM Page 47

48 C I S C O S Y S T E M S , I N C . 2 0 0 0 A n n u a l R e p o r t
DIRECTORS AND OFFICERS
D i r e c t o r s
Carol A. Bartz (2) (4) (5) (6) (8)
Chairman and Chief Executive Officer Autodesk, Inc.
Larry R. Carter Senior Vice President, Finance and Administration Chief Financial Officer and SecretaryCisco Systems, Inc.
John T. Chambers (1) (4) (5) (6) (8)
President and Chief Executive Officer Cisco Systems, Inc.
Mary Cirillo (3) (7)
Chairman and Chief Executive OfficerOPCENTER, LLC
James F. Gibbons, Ph.D. (2) (4)
Reid Weaver Dennis Professor of Electrical Engineering andSpecial Consul to the President for Industrial RelationsStanford University
Edward R. Kozel (7) (8)
Managing MemberOpen Range Ventures
James C. Morgan (2)
Chairman and Chief Executive Officer Applied Materials, Inc.
John P. Morgridge (1) (5) (6) (7)
Chairman of the Board Cisco Systems, Inc.
Arun Sarin (3) (5)
Chief Executive Officer InfoSpace, Inc.
Donald T. Valentine (1) (5) (7)
General Partner Sequoia Capital
Steven M. West (3)
President and Chief Executive Officer Entera, Inc.
Jerry Yang Cofounder and Chief Yahoo!Yahoo!
(1) Member of the Executive Committee(2) Member of the Compensation/Stock Option Committee(3) Member of the Audit Committee(4) Member of the Nomination Committee(5) Member of the Acquisition Committee(6) Member of the Special Stock Option Committee(7) Member of the Investment/Finance Committee(8) Member of the Special Acquisition Committee
O f f i c e r s
Larry R. Carter Senior Vice President, Finance and Administration Chief Financial Officer and Secretary
John T. Chambers President and Chief Executive Officer
Gary J. Daichendt Executive Vice PresidentWorldwide Operations
Charles H. GiancarloSenior Vice PresidentSmall/Medium Business Line of Business Consumer Line of Business
Richard J. JusticeSenior Vice PresidentWorldwide Field Operations
Carl RedfieldSenior Vice President, Manufacturing and Worldwide Logistics
James RichardsonSenior Vice President, Enterprise Line of Business and Internet Communications Software Group
Michelangelo VolpiSenior Vice President, Chief Strategy Officer
OTHER SENIOR VICE PRESIDENTS
Douglas C. AllredSenior Vice President, Customer Advocacy
Vernon E. AltmanSenior Vice President, Strategic Business Partnerships
Barbara BeckSenior Vice President, Human Resources
Susan L. BostromSenior Vice President, Internet Business Solutions Group
Howard S. CharneySenior Vice President, Office of the President
William G. ConlonSenior Vice PresidentCustomer Advocacy Global Support Operations
Doug DennerlineSenior Vice PresidentU.S. Enterprise and Federal Sales
Kevin A. DeNuccioSenior Vice PresidentWorldwide Service Provider Field Operations
Richard FreemantleSenior Vice President, Asia Pacific
Kevin J. KennedySenior Vice PresidentService Provider Line of Business andCisco IOS® Technologies Division
David KirkSenior Vice President Internet Communications Software Group
Mario MazzolaSenior Vice President, New Business Ventures
William R. NutiSenior Vice President, EMEA Operations
Randy PondSenior Vice President, Operations
Daniel ScheinmanSenior Vice President, Corporate Affairs
Cas SkrzypczakSenior Vice PresidentCustomer Advocacy for Service Provider andConsumer Lines of Business
Peter SolvikSenior Vice President, Chief Information Officer
SHAREHOLDER INFORMATION
Online Annual Report
We invite you to visit our online interactive report atwww.cisco.com/annualreport/2000. In this versionyou will find our shareholders’ letter in multiplelanguages, a financial section, and additionalcompany and product information. This Web-basedreport complements our printed report, giving youa comprehensive understanding of Cisco Systems.
Cisco recently introduced the iQ Web site andiQ magazine with additional information to helpbusiness executives implement effective Internetbusiness solutions. iQ magazine is the seniorexecutive’s atlas to the Internet economy. Usingthe successful models of Cisco and its customers,the site and magazine detail how businesses can harness the power of the Internet to gain acompetitive advantage and increase profitability.Visit the site at www.cisco.com/go/iqmagazine.
I n v e s t o r R e l a t i o n s
For further information on the Company, additionalcopies of this report, Form 10-K, or other financialinformation, contact:
Investor RelationsCisco Systems, Inc.170 West Tasman DriveSan Jose, CA 95134-1706(408) 227-CSCO (2726)
You may also contact us by sending an e-mail [email protected] or by visiting theInvestor Relations section on the Company’s Website at www.cisco.com.
Tr a n s f e r A g e n t a n d R e g i s t r a r
Fleet National Bank(f/k/a BankBoston, N.A.)c/o EquiServe Limited PartnershipP.O. Box 8040Boston, MA 02266-8040www.equiserve.com(800) 730-6001
I n d e p e n d e n t A c c o u n t a n t s
PricewaterhouseCoopers LLPSan Jose, CA
L e g a l C o u n s e l
Brobeck, Phleger & Harrison LLP Palo Alto, CA
N o t i c e o f A n n u a l M e e t i n g
Paramount’s Great AmericaParamount Theater1 Great America ParkwaySanta Clara, CANovember 14, 200010 a.m. Pacific Standard Time
SHAREHOLDER INFORMATION
73.1494_fin_9.0.qxd 9/25/00 11:33 AM Page 48
Copyright © 2000 Cisco Systems, Inc. All rights reserved. The iQ logo is a trademark, Empowering the Internet Generation and The Internet Is Changing the Way We Work,Live, Play, and Learn are service marks, and Cisco, Cisco IOS, Cisco Systems, and the Cisco Systems logo are registered trademarks of Cisco Systems, Inc. or its affiliatesin the U.S. and certain other countries. All other trademarks mentioned in this document are the property of their respective owners. The use of the word partner doesnot imply a partnership relationship between Cisco and any other company. (0005R)
WORLDWIDE OFFICES
C O R P O R AT E H E A D Q U A R T E R S
San Jose, California, USA
E U R O P E A N H E A D Q U A R T E R S
Issy les Moulineaux, France
A M E R I C A S H E A D Q U A R T E R S
San Jose, California, USA
A S I A PA C I F I C H E A D Q U A R T E R S
North Sydney, Australia
Cisco Systems has offices in the following countries. Addresses, phone numbers, and fax numbers are listed at
www.cisco.com/go/offices.
A R G E N T I N A • A U S T R A L I A • A U S T R I A • B E L G I U M • B R A Z I L • B U L G A R I A • C A N A D A • C H I L E • C H I N A • C O L O M B I A • C O S T A R I C A
C R O A T I A • C Z E C H R E P U B L I C • D E N M A R K • D U B A I , U A E • F I N L A N D • F R A N C E • G E R M A N Y • G R E E C E • H O N G K O N G • H U N G A R Y
I N D I A • I N D O N E S I A • I R E L A N D • I S R A E L • I T A L Y • J A P A N • K O R E A • L U X E M B O U R G • M A L A Y S I A • M E X I C O • T H E N E T H E R L A N D S
N E W Z E A L A N D • N O R W A Y • P E R U • P H I L I P P I N E S • P O L A N D • P O R T U G A L • P U E R T O R I C O • R O M A N I A • R U S S I A • S A U D I A R A B I A
S C O T L A N D • S I N G A P O R E • S L O V A K I A • S L O V E N I A • S O U T H A F R I C A • S P A I N • S W E D E N • S W I T Z E R L A N D • T A I W A N • T H A I L A N D
T U R K E Y • U K R A I N E • U N I T E D K I N G D O M • U N I T E D S T A T E S • V E N E Z U E L A • V I E T N A M • Z I M B A B W E

Corporate HeadquartersCisco Systems, Inc.170 West Tasman DriveSan Jose, CA 95134-1706USA
Tel: (408) 526-4000(800) 553-NETS (6387)www.cisco.com
Lit# 954965Printed on recycled paper. SKU# 1028-AR-00


