29
| Date post: | 15-Apr-2017 |
| Category: |
Business |
| Upload: | irina-dzhambazova |
| View: | 153 times |
| Download: | 0 times |

Number of products growing quickly
New more complex products
Number of features growing exponentially
Moving to common software platform
Demand far exceeded ability to supply
2Copyright Applying Lean Inc.
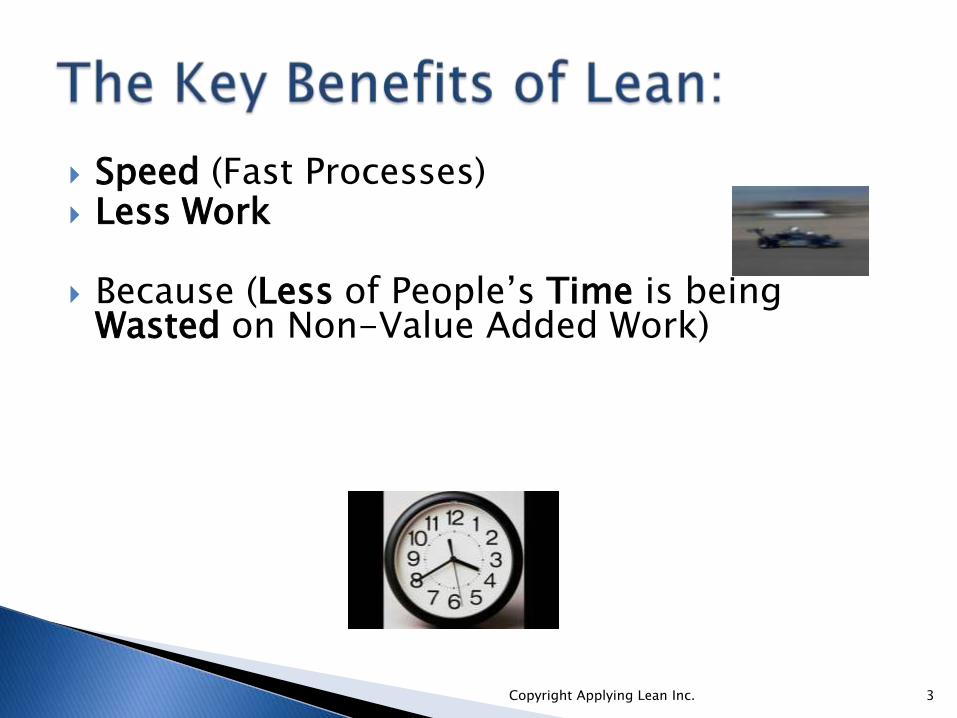
Speed (Fast Processes) Less Work
Because (Less of People’s Time is being Wasted on Non-Value Added Work)
3Copyright Applying Lean Inc.

4Copyright Applying Lean Inc.

Corporate Value $70 million program
cost avoidance in 20 months on Edgeline
$27 million in annual savings (FW lab budget reduction) going forward
Program TTM reduced by 1 year
7.4x productivity improvements sustained during staff & budget reductions
5Copyright Applying Lean Inc.

Theory of Constraints - Eliyahu Goldratt
Global Optimization
Queuing Theory – Don Reinertsen
Continuous Improvement
Value Stream Maps + Information Flow
Discovered the Laws that make Lean work
6Copyright Applying Lean Inc.
Natural Law’s&
Human Psychology
7Copyright Applying Lean Inc.
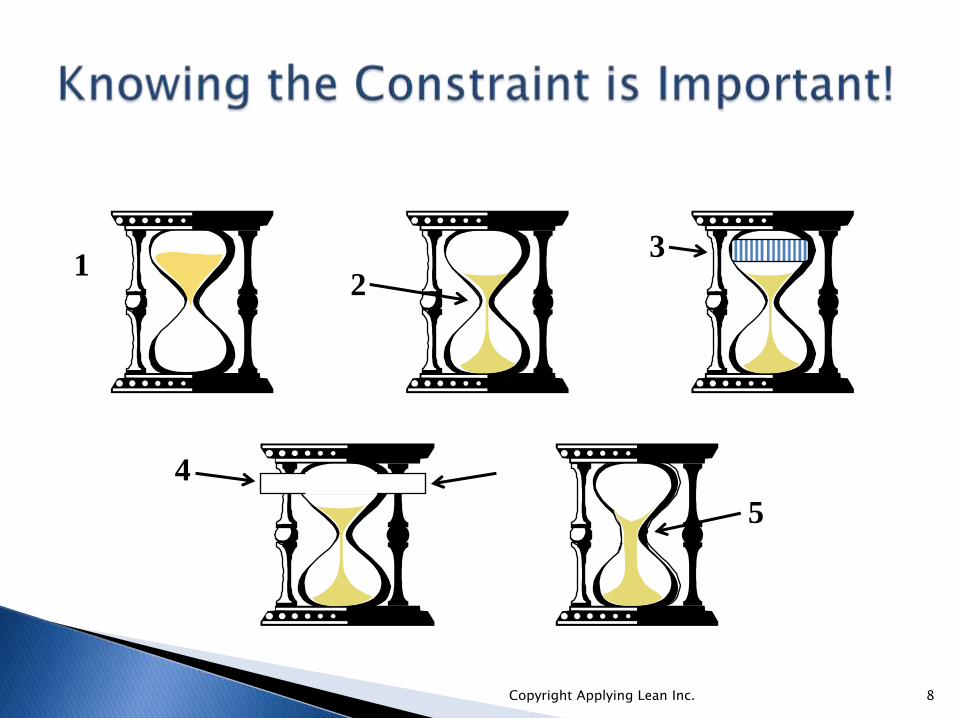
21
3
5
4
8Copyright Applying Lean Inc.
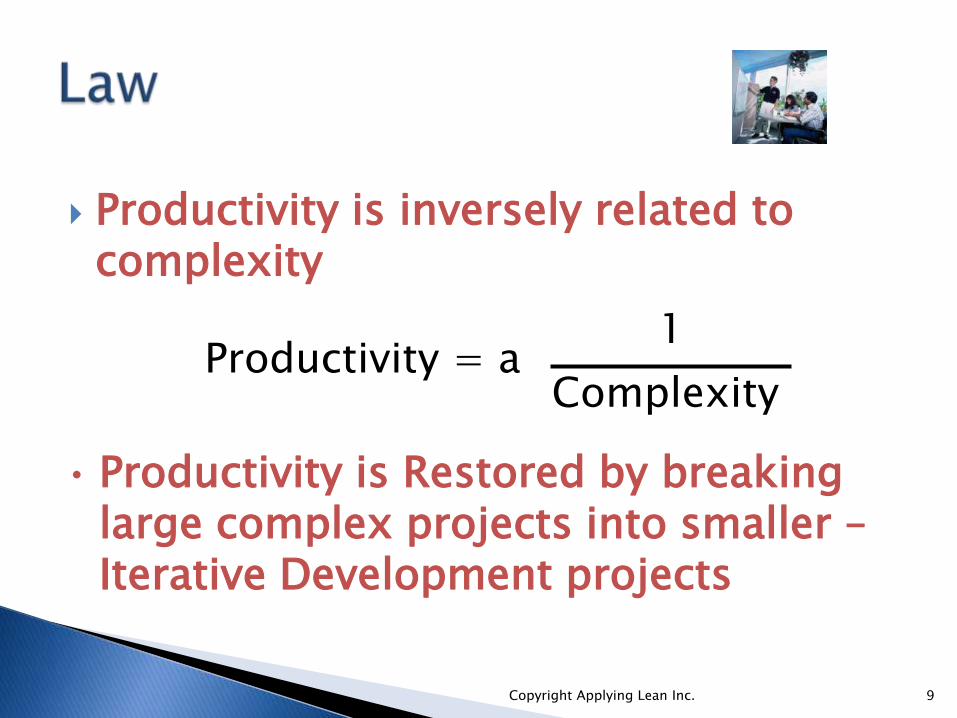
Productivity is inversely related to complexity
• Productivity is Restored by breaking large complex projects into smaller –Iterative Development projects
Productivity = aComplexity
1
9Copyright Applying Lean Inc.
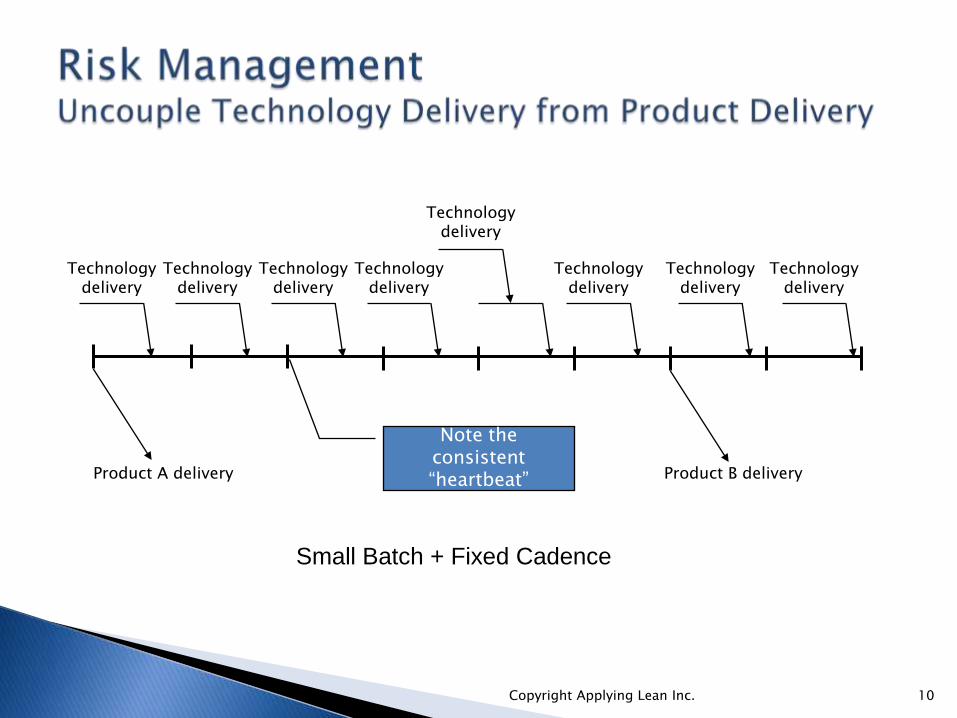
Technology delivery
Technology delivery
Note the consistent “heartbeat”
Small Batch + Fixed Cadence
Technology delivery
Technology delivery
Technology delivery
Technology delivery
Technology delivery
Technology delivery
Product A delivery Product B delivery
10Copyright Applying Lean Inc.
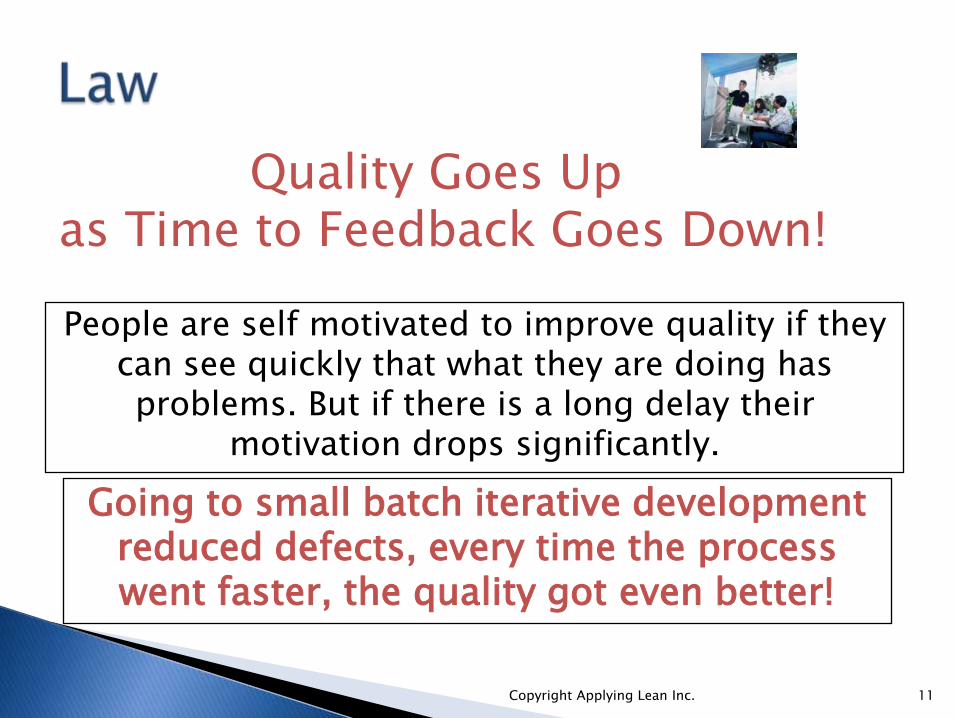
Going to small batch iterative development reduced defects, every time the process went faster, the quality got even better!
Quality Goes Up as Time to Feedback Goes Down!
People are self motivated to improve quality if they can see quickly that what they are doing has problems. But if there is a long delay their
motivation drops significantly.
11Copyright Applying Lean Inc.
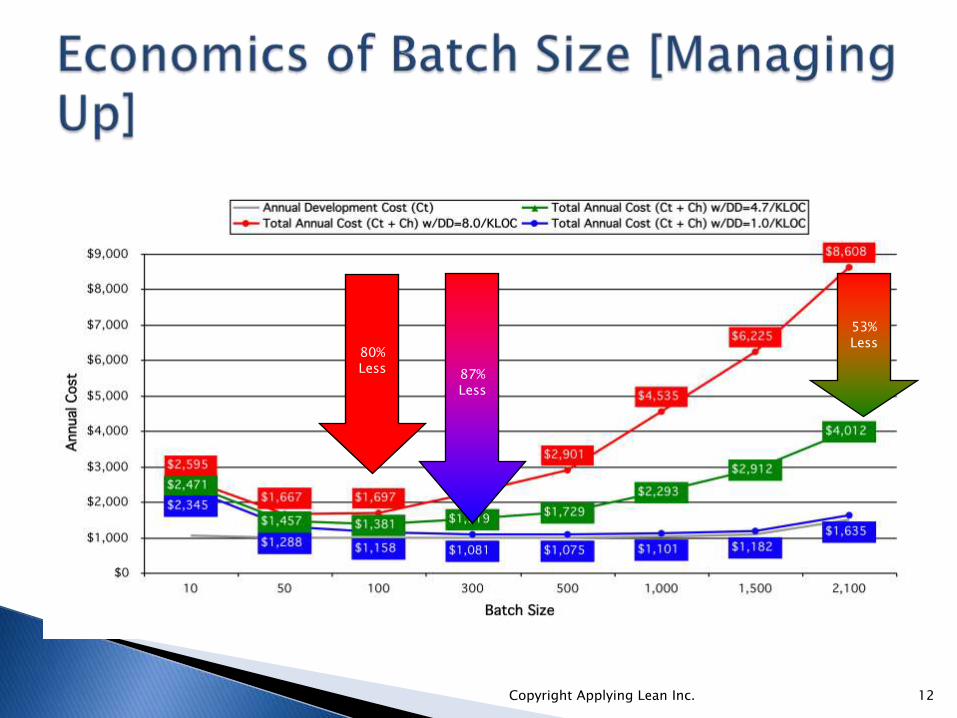
53% Less
80% Less 87%
Less
12Copyright Applying Lean Inc.
Too much WIP (Work In Process) is the greatest source of waste
•Use a Kanban system to keep the WIP constant•A constant WIP delivers a consistent r te of delivery, which makes planning and status more easy and accurate
13Copyright Applying Lean Inc.
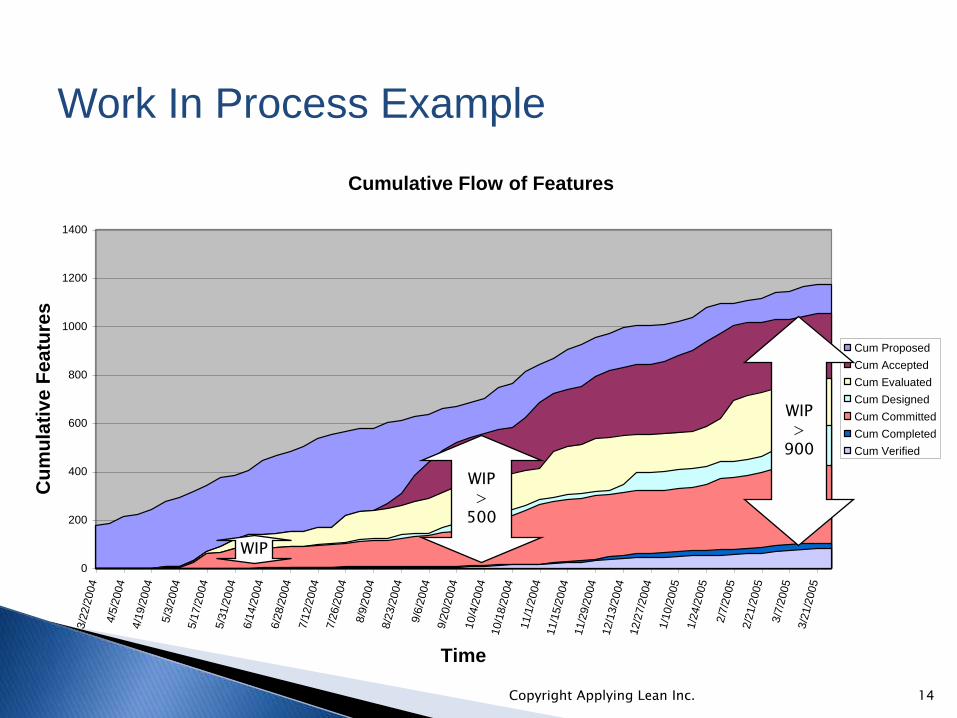
Cumulative Flow of Features
0
200
400
600
800
1000
1200
1400
3/2
2/2
004
4/5
/2004
4/1
9/2
004
5/3
/2004
5/1
7/2
004
5/3
1/2
004
6/1
4/2
004
6/2
8/2
004
7/1
2/2
004
7/2
6/2
004
8/9
/2004
8/2
3/2
004
9/6
/2004
9/2
0/2
004
10/4
/2004
10/1
8/2
004
11/1
/2004
11/1
5/2
004
11/2
9/2
004
12/1
3/2
004
12/2
7/2
004
1/1
0/2
005
1/2
4/2
005
2/7
/2005
2/2
1/2
005
3/7
/2005
3/2
1/2
005
Time
Cu
mu
lati
ve F
eatu
res
Cum Proposed
Cum Accepted
Cum Evaluated
Cum Designed
Cum Committed
Cum Completed
Cum Verified
WIP
WIP >
500
WIP >
900
Work In Process Example
14Copyright Applying Lean Inc.
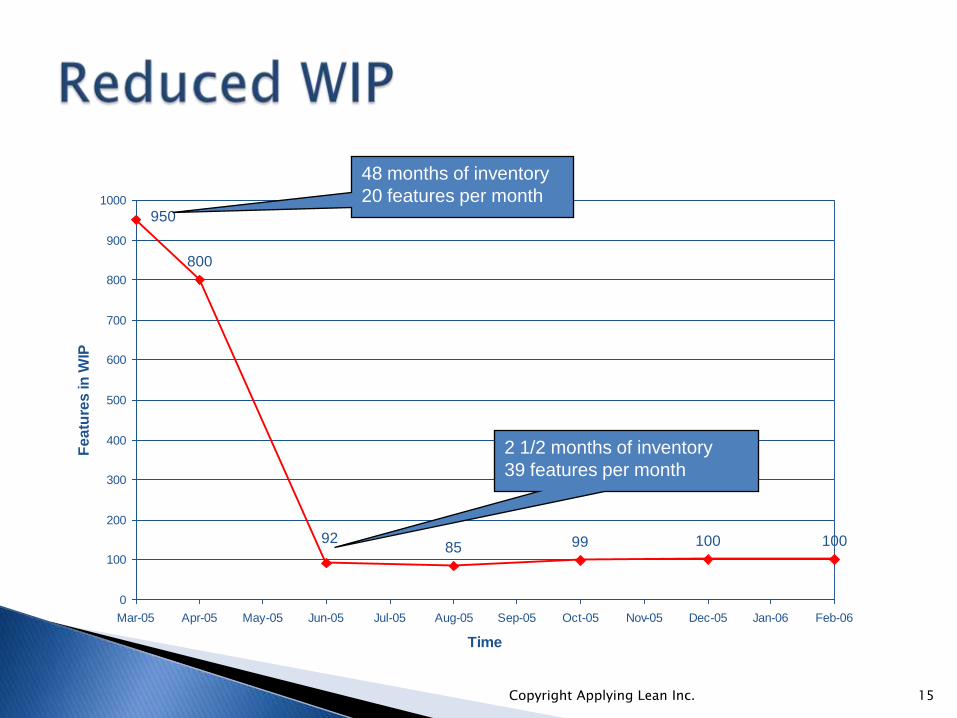
800
85 99 100 100
950
92
0
100
200
300
400
500
600
700
800
900
1000
Mar-05 Apr-05 May-05 Jun-05 Jul-05 Aug-05 Sep-05 Oct-05 Nov-05 Dec-05 Jan-06 Feb-06
Time
Fe
atu
res
in
WIP
48 months of inventory
20 features per month
2 1/2 months of inventory
39 features per month
15Copyright Applying Lean Inc.
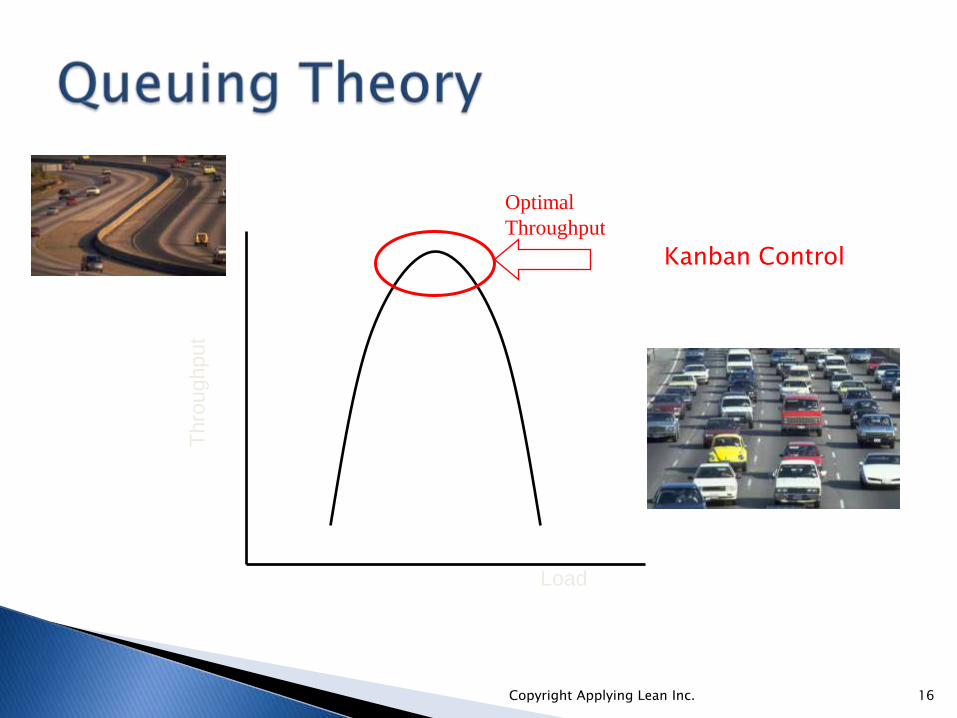
Thro
ughput
Load
Optimal
Throughput
Kanban Control
16Copyright Applying Lean Inc.
Work on small chunks of work
Take the work to completion
Use Kanban system to control total WIP
17Copyright Applying Lean Inc.
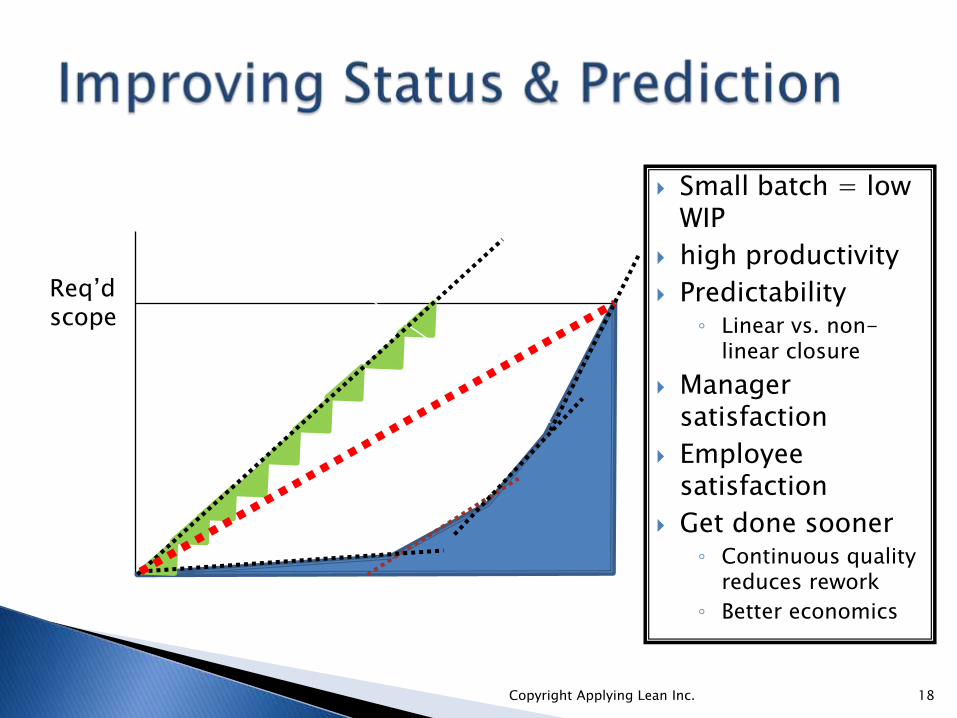
Small batch = low WIP
high productivity
Predictability◦ Linear vs. non-
linear closure
Manager satisfaction
Employee satisfaction
Get done sooner◦ Continuous quality
reduces rework
◦ Better economics
Req’d scope
18Copyright Applying Lean Inc.

1. Product Development is Learning
2. Product Development is high variability
3. Learning doesn’t happen in nice, phased steps
4. Risk reduction requires accelerating learning in high risk areas
5. Rate of learning = f(1/time to feedback)
19Copyright Applying Lean Inc.
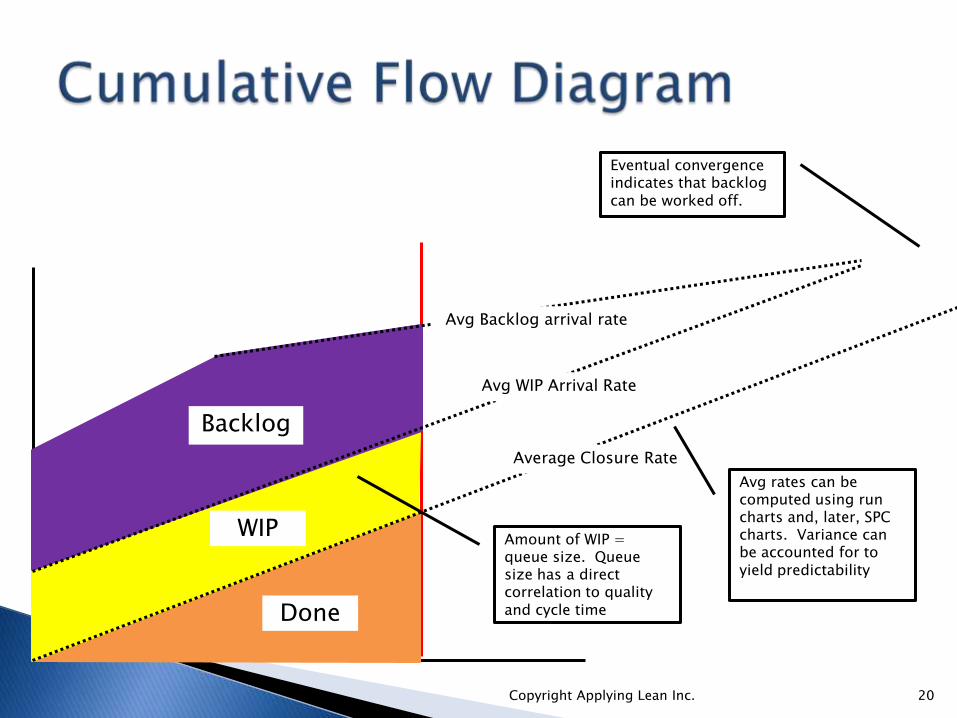
Done
WIP
Backlog
Average Closure Rate
Avg WIP Arrival Rate
Avg Backlog arrival rate
Eventual convergence indicates that backlog can be worked off.
Amount of WIP = queue size. Queue size has a direct correlation to quality and cycle time
Avg rates can be computed using run charts and, later, SPC charts. Variance can be accounted for to yield predictability
20Copyright Applying Lean Inc.
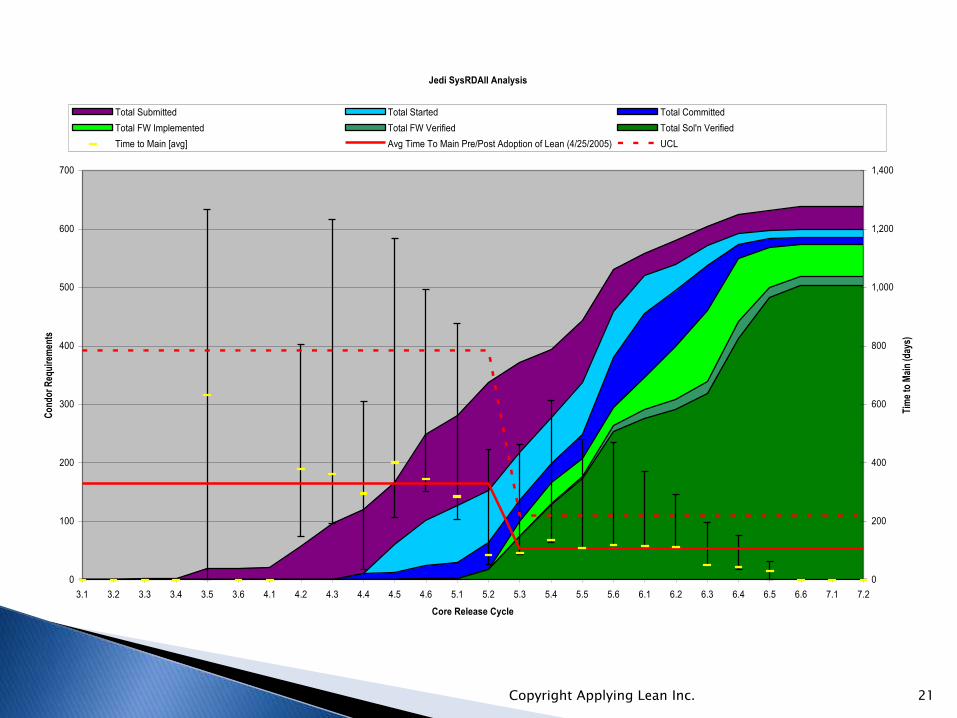
Jedi SysRDAll Analysis
0
100
200
300
400
500
600
700
3.1 3.2 3.3 3.4 3.5 3.6 4.1 4.2 4.3 4.4 4.5 4.6 5.1 5.2 5.3 5.4 5.5 5.6 6.1 6.2 6.3 6.4 6.5 6.6 7.1 7.2
Core Release Cycle
Co
nd
or
Req
uir
emen
ts
0
200
400
600
800
1,000
1,200
1,400
Tim
e to
Mai
n (d
ays)
Total Submitted Total Started Total Committed
Total FW Implemented Total FW Verified Total Sol'n Verified
Time to Main [avg] Avg Time To Main Pre/Post Adoption of Lean (4/25/2005) UCL
21Copyright Applying Lean Inc.
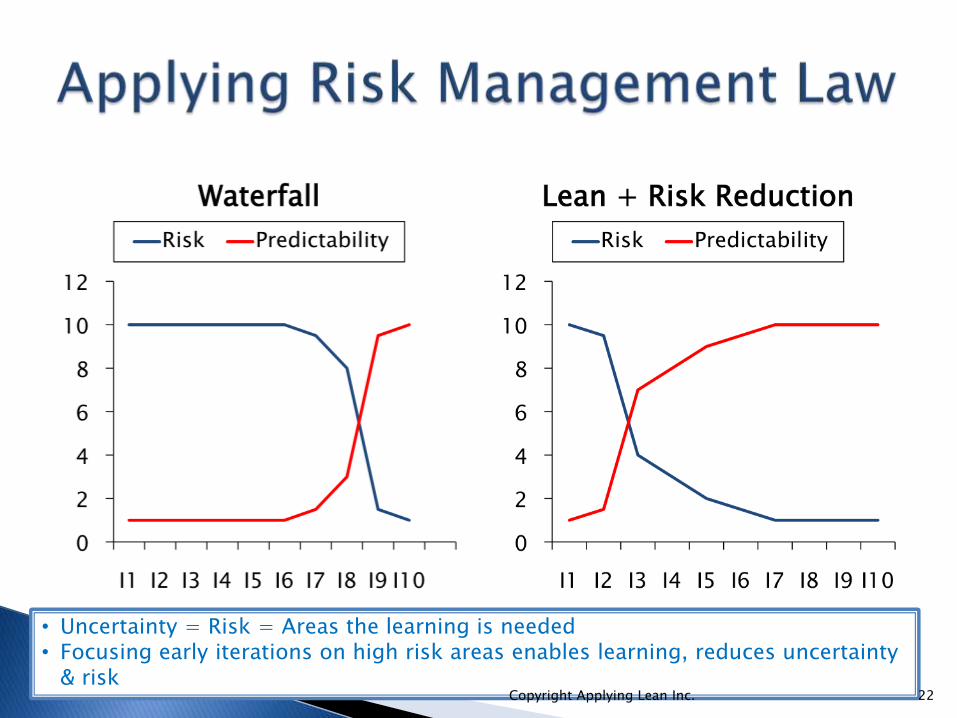
• Uncertainty = Risk = Areas the learning is needed• Focusing early iterations on high risk areas enables learning, reduces uncertainty
& risk22Copyright Applying Lean Inc.

A requirement or feature chunk is not doneuntil it has passed ALL tests◦ This means that tests have been run, defects fixed
◦ Demos if used are done and changes made based on feedback
◦ Then the tests are rerun
◦ Learning is complete once ALL tests pass and demo approved!
◦ No Credit is given until it is completely done!
23Copyright Applying Lean Inc.

“Continuous Flow is the Ultimate Objective of lean production, and creating continuous flow has been the goal of countless kaizen projects. We work at a wide range of manufacturing facilities and see many commendable efforts to create flow. Unfortunately, we see very little of it actually achieved.” Mike Rother & Rick Harris from the book “Creating Continuous flow”
24Copyright Applying Lean Inc.
0
20
40
60
80
100
120
140
160
180
Cumulative Demand
Total Tasks Completed
Cumulative Actual
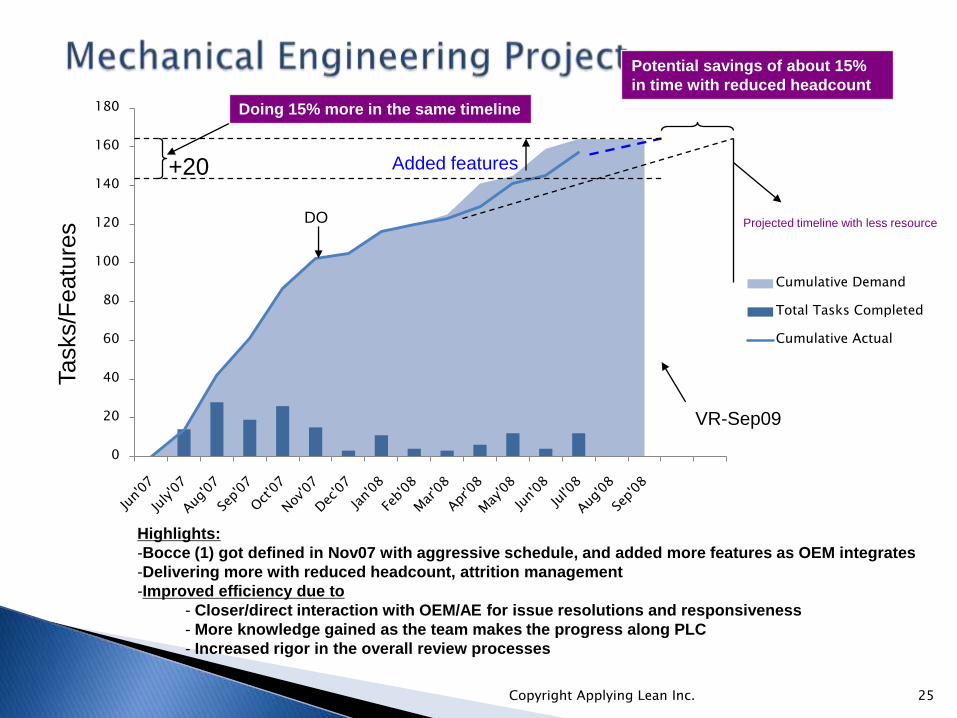
Potential savings of about 15%
in time with reduced headcount
Projected timeline with less resource DO
Added features
Doing 15% more in the same timeline
+20
VR-Sep09
Tasks/F
eatu
res
Highlights:
-Bocce (1) got defined in Nov07 with aggressive schedule, and added more features as OEM integrates
-Delivering more with reduced headcount, attrition management
-Improved efficiency due to
- Closer/direct interaction with OEM/AE for issue resolutions and responsiveness
- More knowledge gained as the team makes the progress along PLC
- Increased rigor in the overall review processes
25Copyright Applying Lean Inc.
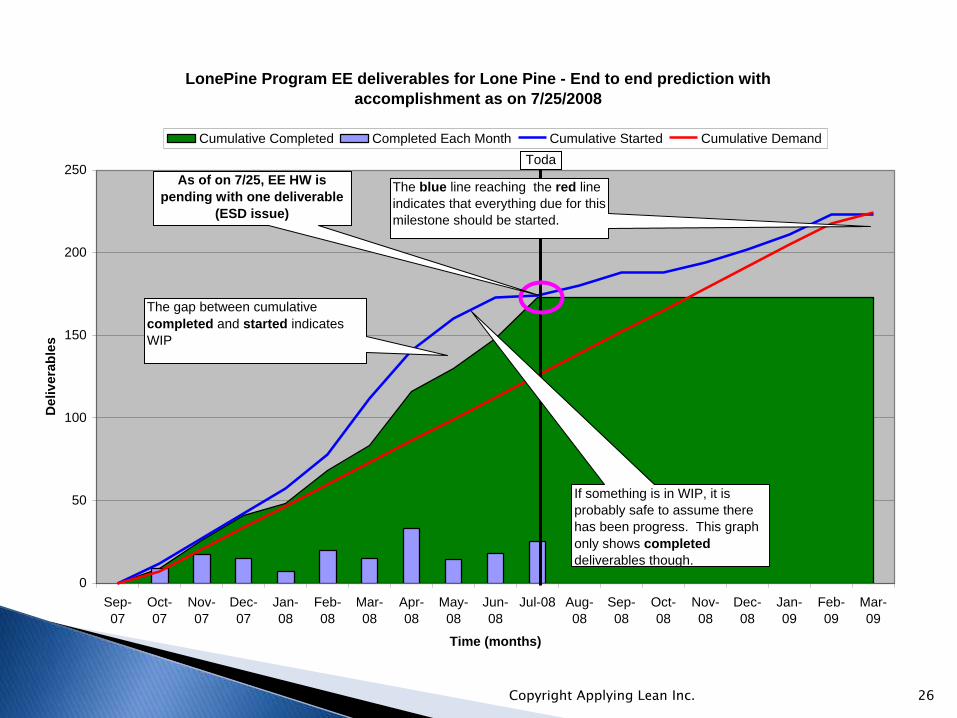
LonePine Program EE deliverables for Lone Pine - End to end prediction with
accomplishment as on 7/25/2008
0
50
100
150
200
250
Sep-
07
Oct-
07
Nov-
07
Dec-
07
Jan-
08
Feb-
08
Mar-
08
Apr-
08
May-
08
Jun-
08
Jul-08 Aug-
08
Sep-
08
Oct-
08
Nov-
08
Dec-
08
Jan-
09
Feb-
09
Mar-
09
Time (months)
De
livera
ble
s
Cumulative Completed Completed Each Month Cumulative Started Cumulative Demand
Toda
y
If something is in WIP, it is
probably safe to assume there
has been progress. This graph
only shows completed
deliverables though.
The blue line reaching the red line
indicates that everything due for this
milestone should be started.
The gap between cumulative
completed and started indicates
WIP
As of on 7/25, EE HW is
pending with one deliverable
(ESD issue)
26Copyright Applying Lean Inc.
Each improvement opens the way to find another improvement,
leading to continuous improvement
27Copyright Applying Lean Inc.

Measure only Items Done
Requirement chunks that are in process at the end of an iteration continue on into the next iteration, until they are done
Variability is natural.
28Copyright Applying Lean Inc.

29Copyright Applying Lean Inc.