Discovery of Genetic Linkage • Genes on non-homologous chromosomes assort independently, but genes on the same chromosome (syntenic genes) may instead be inherited together (linked), and belong to a linkage group.
Transcript
Discovery of Genetic Linkage
• Genes on non-homologous chromosomes assort independently, but genes on the same chromosome (syntenic genes) may instead be inherited together (linked), and belong to a linkage group.
Discovery of Genetic Linkage
• Classical genetics analyzes the frequency of allele recombination in progeny of genetic crosses– New associations of parental alleles are
recombinants, produced by genetic recombination.
– Tests crosses determine which genes are linked, and a linkage map (genetic map) is constructed for each chromosome.
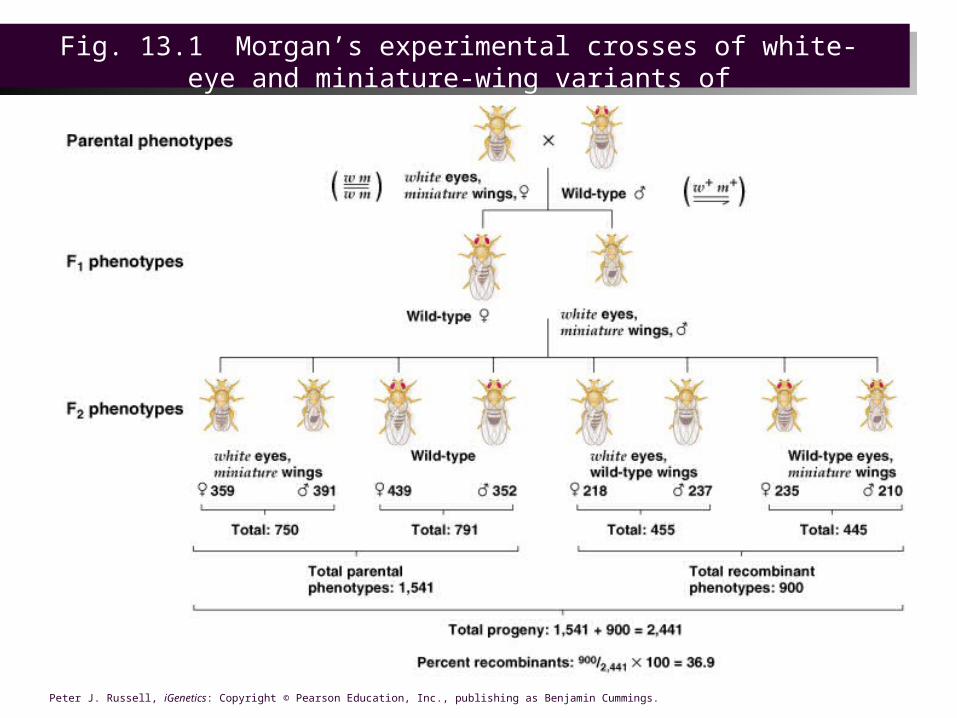
MORGAN’s EXPERIMENTS• Both the white eye gene (w) and a gene for miniature
wings (m) are on the X chromosome. • Morgan (1911) crossed a female white miniature (w
m/w m) with a wild-type male (w+ m+/ Y).– In the F1, all males were white-eyed with miniature wings
(w m/Y), and all females were wild-type for eye color and wing size (w+ m+/w m).
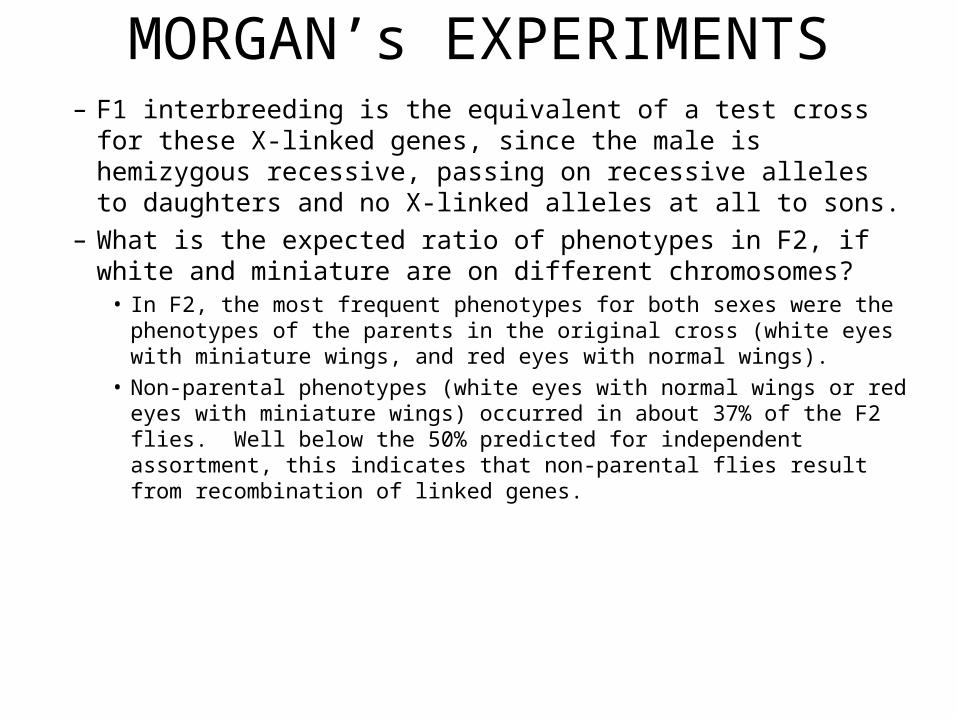
MORGAN’s EXPERIMENTS– F1 interbreeding is the equivalent of a test cross for these X-linked
genes, since the male is hemizygous recessive, passing on recessive alleles to daughters and no X-linked alleles at all to sons.
– What is the expected ratio of phenotypes in F2, if white and miniature are on different chromosomes?
• In F2, the most frequent phenotypes for both sexes were the phenotypes of the parents in the original cross (white eyes with miniature wings, and red eyes with normal wings).
• Non-parental phenotypes (white eyes with normal wings or red eyes with miniature wings) occurred in about 37% of the F2 flies. Well below the 50% predicted for independent assortment, this indicates that non-parental flies result from recombination of linked genes.
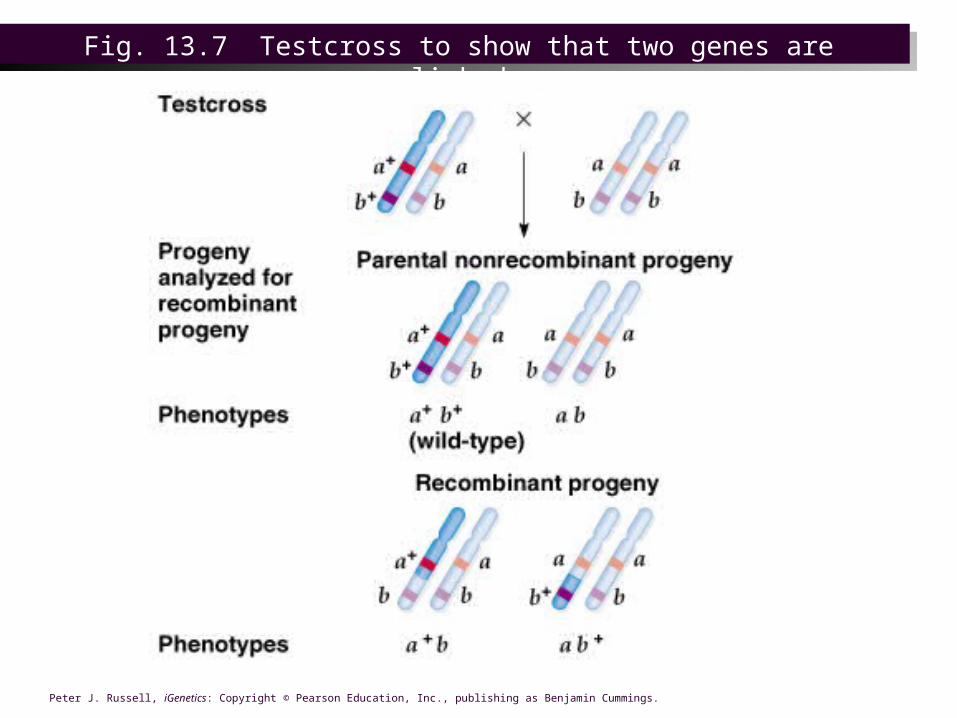
Fig. 13.7 Testcross to show that two genes are linked
Chi-square for analysis of linkage
• A null hypothesis (‘the genes independently assort’) is used because it is not possible to predict the phenotype frequencies produced by linked genes.– If two genes are not linked, a testcross should yield a
1:1 ratio of parentals: recombinants.– Formula is X2 = sum (Obs-Exp)^2/Exp– If P>0.05, deviation between Obs and Exp is not
significant– If P<=0.05, deviation is statistically significant; such
that genes may be linked.
Concept of Genetic Map
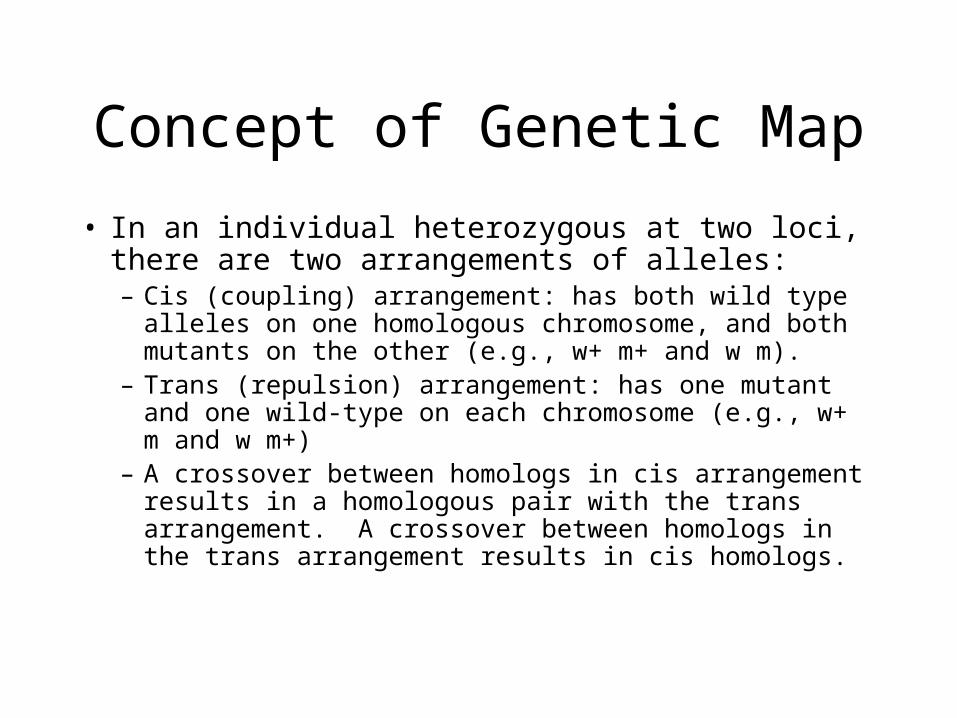
• In an individual heterozygous at two loci, there are two arrangements of alleles:– Cis (coupling) arrangement: has both wild type alleles
on one homologous chromosome, and both mutants on the other (e.g., w+ m+ and w m).
– Trans (repulsion) arrangement: has one mutant and one wild-type on each chromosome (e.g., w+ m and w m+)
– A crossover between homologs in cis arrangement results in a homologous pair with the trans arrangement. A crossover between homologs in the trans arrangement results in cis homologs.
Drosophila Crosses• They showed that cross over frequency
for linked genes (measured by recombinants) is characteristics for each gene pair. The frequency stays the same, whether the genes are in coupling or in repulsion.– Morgan and Sturtevant (1913) used
recombination frequencies to make a genetic map.
• A 1% crossover rate is a genetic distance of 1 map unit (mu). A map unit is also called a centimorgan (cM). Geneticists use recombination frequency as a way to estimate crossover frequency. The farther apart the two genes are on the chromosome, the more likely it is that crossover will occur between them, and therefore the greater their crossover frequency.
First Genetic Map
• Three X-linked genes– White (w): white eyes– Miniature (m): miniature wings– Yellow (y): yellow body
• Crosses gave the following recombination frequencies:– White x miniature was 32.6– White x yellow was 1.3– Miniature x yellow was 33.9
MAP: m-----------------------------------w---y
Gene Mapping Using Two-Point Testcrosses
• With autosomal recessive alleles, when a double heterozygote is testcrossed, four phenotypic classes are expected. If the genes are linked, the two parental phenotypes will be about equally frequent and more abundant than the two recombinant phenotypes.
• For autosomal dominants, a double heterozygotes (A B/A+B+) is testcrossed with a homozygous wildtype (recessive) individual (A+B+/A+B+)
• For X-linked recessives, a female double heterozygote (a+ b+/a b) is crossed with a hemizygous recessive male (a b/Y).
• For X-linked dominants, a female double heterozygote (A B/A+ B+) is crossed with a male hemizygous for the wild-type (A+ B+).
• Phenotypes obtained in these crosses will depend on whether the alleles are in cis or trans position.
GENETIC MAP
• Recombination frequency is used directly as an estimate of map units.– The measure is more accurate when alleles are
close together.– Scoring large numbers of progeny increases
accuracy.
GENERATING A LINKAGE MAP
• Genetic map is generated from estimating the crossover rate in a particular segment of a the chromosome. It may not exactly match the physical map because crossover is not equally probable at all sites on the chromosome.
• Recombination frequency is also used to predict progeny in genetic crosses. For example, a 20% crossover rate between two pairs of alleles in a heterozygote (a+ b+/a b) will give 10% gametes of each recombinant type (a+ b and a b+).
LINKED or NON-LINKED?
• A recombination frequency of 50% means that genes are unlinked. There are two ways in which genes maybe unlinked:– They may be on separate chromosomes.– They may be far apart on the same
chromosome.
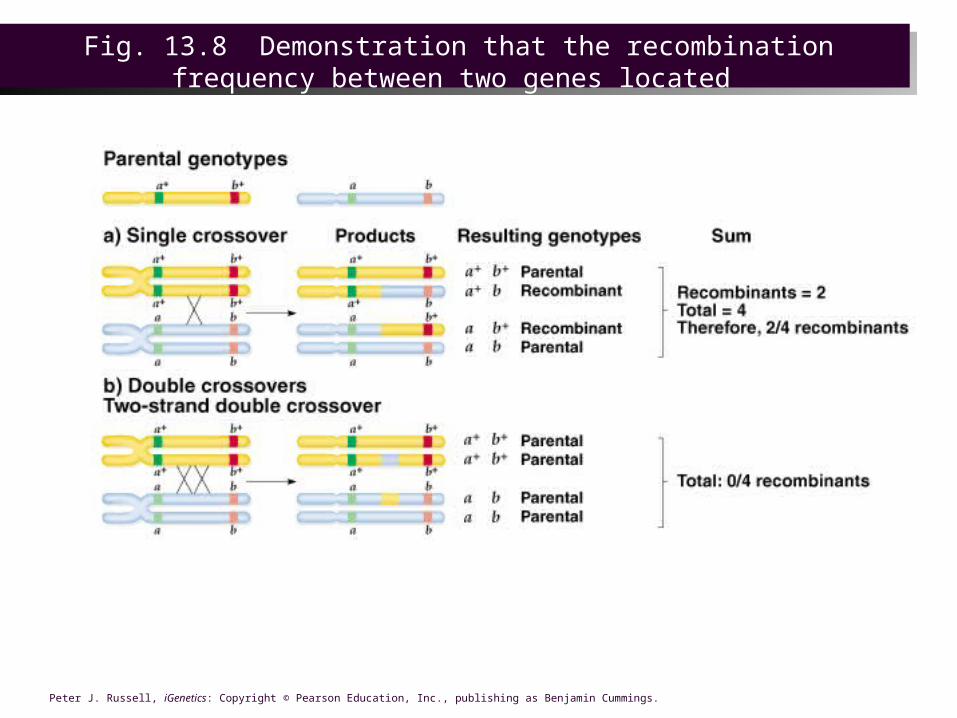
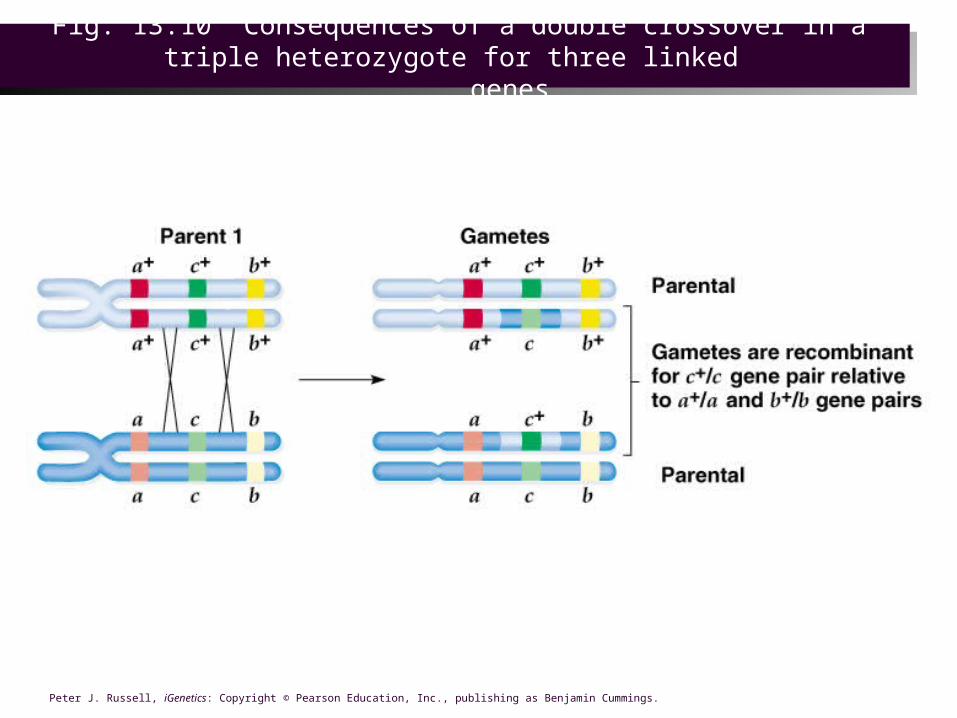
MULTIPLE CROSSOVERS
• If the genes are on the same chromosome, multiple crossovers can occur. The further apart two loci are, the more likely they are to have crossover events take place between them. The chromatid pairing is not always the same in crossover, so that 2,3, or 4 chromatids may participate in multiple crossover.
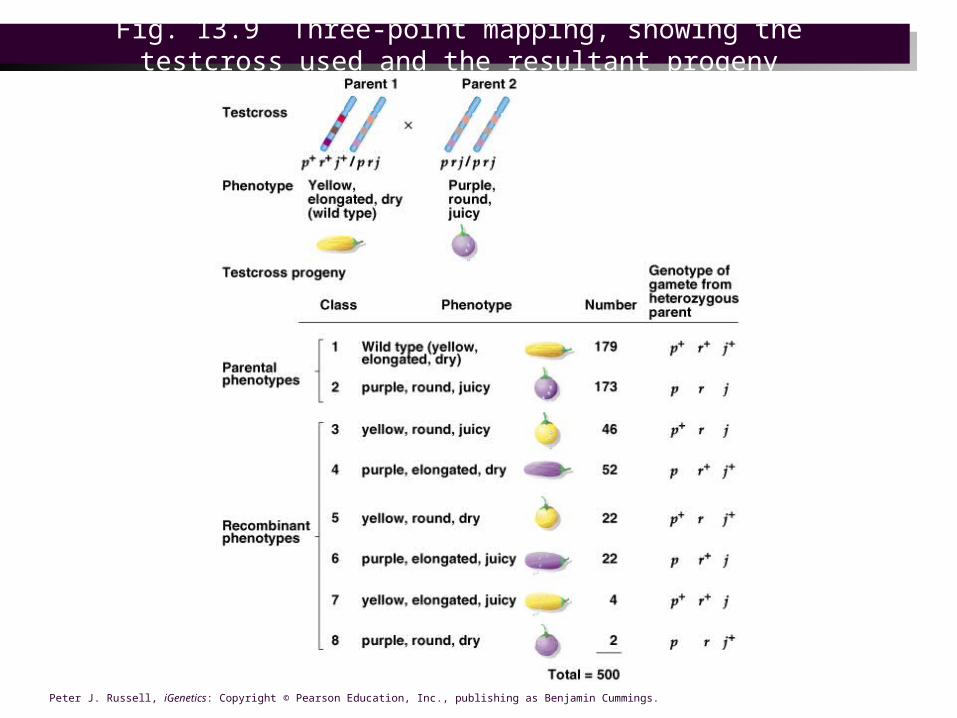
Fig. 13.9 Three-point mapping, showing the testcross used and the resultant progeny
Mapping using three-point testcrosses
• Geneticists design experiments to gather data on several traits in 1 testcross. An example of a three-point testcross would be– p+r+j+/p r j X p r j / p r j
– In the progeny, each gene has two possible phenotypes. For three genes there are (2)^3=8 expected phenotypic classes in the progeny.
Establishing the order of genes
• The order of genes on the chromosome can be deduced from results of the cross. Of the eight expected progeny phenotypes:– Two classes are parental (p+ r+ j+/ p r j and p r j / p r j)
and will be the most abundant.
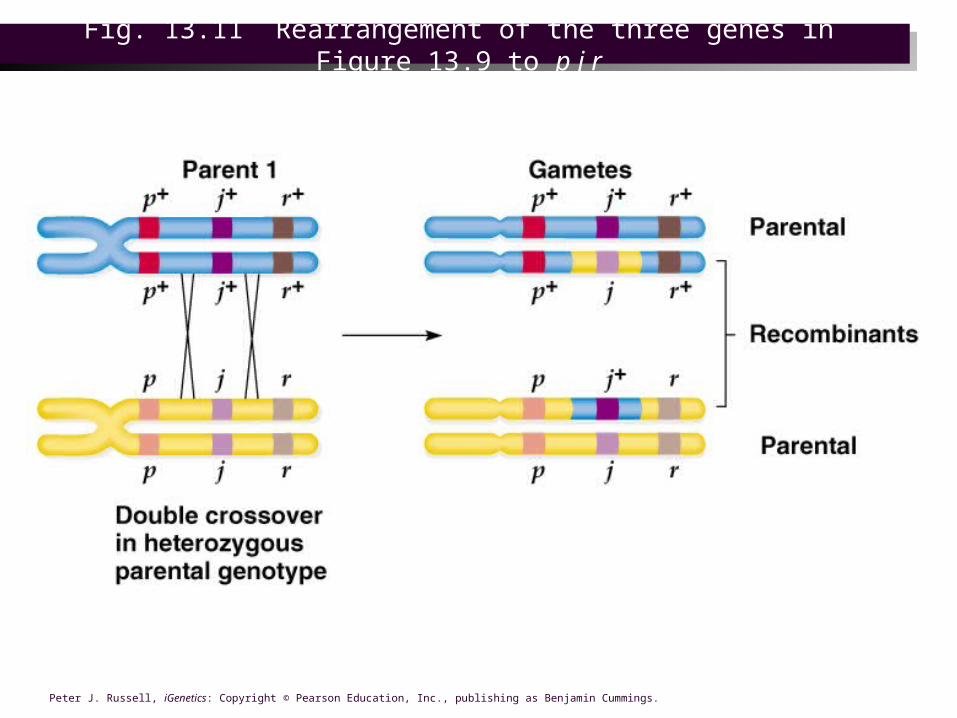
– Of the six remaining phenotypic classes, two will be present at the lowest frequency, resulting from apparent double crossover (p+ r+ j / p r j and p r j+ / p r j). This establishes the gene order as p j r.
Fig. 13.12 Rewritten form of the testcross and testcross progeny in Figure 13.9, based
on the actual gene order p j r
Calculating the recombination frequencies
• Cross data is organized to reflect the gene order, and this example the region between genes p and j is called region I, and that between j and r is region II.
Calculating recombination frequencies
• Recombination frequencies are now calculated for two genes at a time. It includes single crossovers in the region under study, and double crossovers, since they occur in both regions.
• Recombination frequencies are used to position genes on the genetic map (each 1% recombination frequency = 1 map unit) for the chromosomal region.
• Recombination frequencies are not identical to crossover frequencies, and typically underestimate the true map distance.
Fig. 13.13 Genetic map of the p-j-r region of the chromosome computed from the
recombination data in Figure 13.12
Interference and Coincidence
• Characteristically, double crossovers do not occur as often as expected from the observed rate of single crossovers. Crossover appears to reduce formation of other chiasmata nearby, producing interference. – Interference = 1 is total interference, with no
other crossover occuring in the region.
Coefficient of coincidence express the extent of interference• Interference = 1-coefficient of coincidence. The
values are inversely related.• A value of 1 means the number of double
crossovers that occurs is what would be predicted on the basis of two independent events, and there is no interference.
• A value of 0 means that none of the expected crossovers occurred, and interference is total.
Calculating accurate map distances
• Recombination frequency generally underestimates the true map distance:– Double crossovers between two loci will restore the parental
genotype, as will any even number of crossovers. These will not be counted as recombinants, even though crossovers take place.
– A single crossover will produce recombinant chromosomes, as will any odd number of crossovers. Progeny analysis assumes that every recombinant was produced by a single crossover.
– Map distances for genes that are less than 7 mu apart are very accurate. As distance increases, accuracy declines because more crosses go uncounted.
Fig. 13.14 Progeny of single and double crossovers
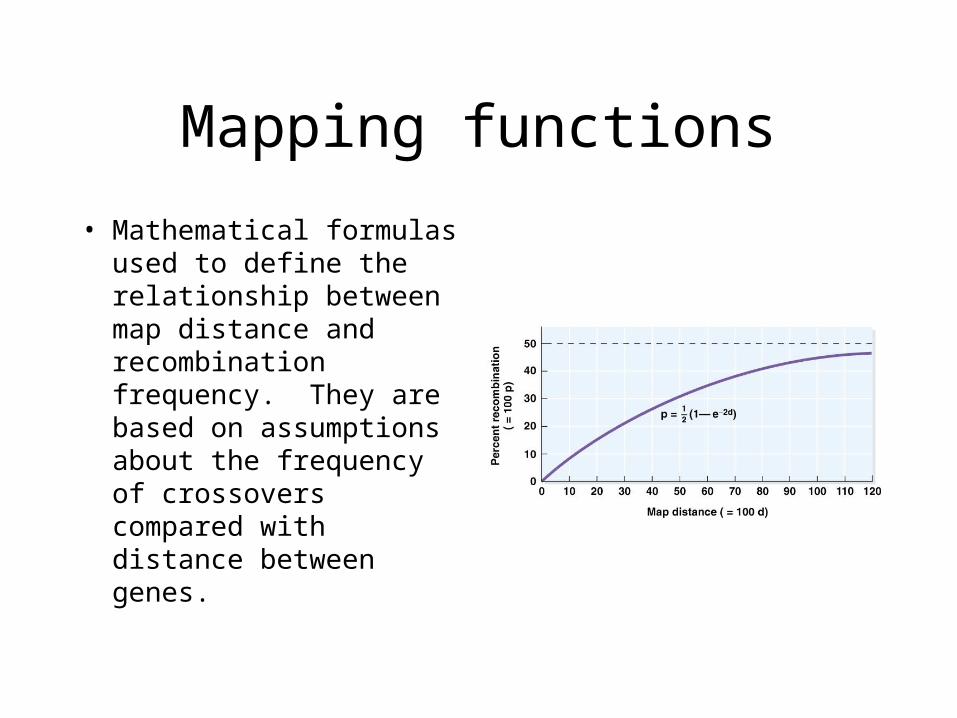
Mapping functions
• Mathematical formulas used to define the relationship between map distance and recombination frequency. They are based on assumptions about the frequency of crossovers compared with distance between genes.
Genetic markers• The number of physically observable genes in
humans is very small. Consequently, human genetic maps based on these were not useful.
• The development of genetic loci that could be observed at the level of DNA was essential to modern human genetics.
• Two alleles (ie, D vs d) needed to be detected, at the DNA level, to define a DNA “marker” locus.
• There are several technical solutions to the observation of DNA differences.
Genetic markers• In a DNA marker, somewhere in the 100-1000
bp amplified region there must be a DNA sequence difference (polymorphism) between individuals.
• The most common DNA marker systems examine the number of repeated units in a simple sequence repeat motif, such as CACACACACACACAC.
• Individuals can vary considerably in the number of CA blocks, making these types of DNA sequences very useful population markers.
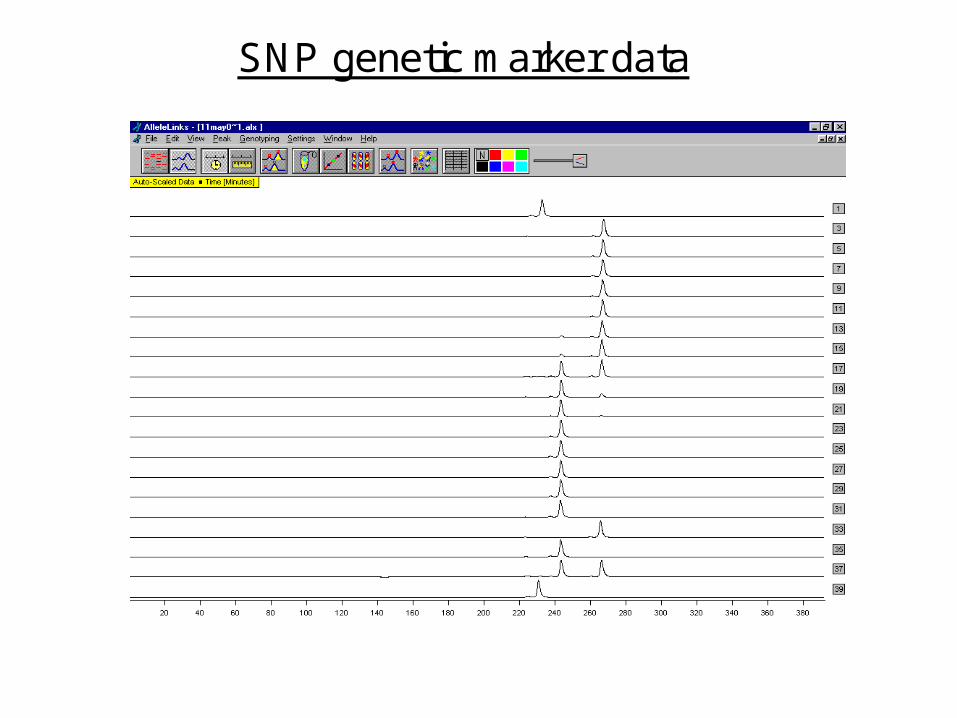
Genetic markers• Single basepair differences, however, are
much more common in the genome and so have great potential.
• Single basepair differences are often called SNPs (Single Nucleotide Polymorphisms).
• However, the frequency of individuals being different at a single base is much less than CACACACA repeat motifs.
• Genetic markers are simply “signposts” along the chromosomes that are readily detected and comparable between laboratory experiments.
Genetic markers• Ideally, genetic markers should be readily
available at a high density across the genome (>100,000).
• The markers should be easily communicated between lab groups and easily quality controlled.
• And, the work to obtain the marker information should be low error and inexpensive.
19119
10
41
51
55
60
221
185
46
5
36
182
63
100
35
129
76
26
64
57
19
167
158
33
46
38
105
168
289
29
156
83
2
14
134
230
15
40
80
151
12
110
104
42
112
301
51
190
47
253
91
25
76
198
149
102
186
268
95
25
205
79
48
170
155
84
55
171
86
42
73
2225
62
285
58
37
221
206
N2
253
22
167
293
99
173
47
42
48
63
326
20
265
17
318
249
223
81
55
71
105
54
88
71
191
110
144
56
43
34
241
31
176
75
158
19
126
78
147
264
8
198
94
91
178
95
71
143
98
251
37
9
46
290
224
61
149232
106
102
365
3
-120
-100
-80
-60
-40
-20
0
dis
tan
ce
fro
m c
en
tro
me
re, c
M
centromere
chromosome
markers used (84)markers in process (11)
available markers (55)
1 2 3 4 5 6 7 X19181716151413121098 11chr
Genetic marker map of the mouse
SNP genetic marker data
Mitotic recombination
• Crossing over during mitosis was first observed by Stern (1936) in Drosophila.– The alleles involved are sex-linked and
recessive to the wild type:• Y produces yellow body color instead of wild type
grey.• Sn produces short, twisty bristles (“signed”) rather
than the wild-type long, curved ones. Bristles follow body color (y+/- are black, and y/y are yellow.
Mitotic recombination• Female progeny from the cross • y+ sn / y+ sn x y sn+ /Y• Generally have wild type phenotype of grey bodies and
normal bristles, corresponding to their genetoype (y+ sn / y sn+). But exceptions:– Some flies had patches of yellow and/or signed bristles. This could
be explained by nondisjunction or chromosomal loss.– Other flies had twin spots, adjacent regions of bristles, one yellow
and the other signed, a mosaic phenotype. The spots are reciprocal products of the same genetic event, a mitotic crossing over.
– Mitotic crossover occurred either between the centromere and the sn locus or between the sn and the y locus.
Fig. 13.23 Production of the twin spot and single yellow spot shown in Figure 13.22 by
mitotic crossing-over
Mechanism of Mitotic Crossing over
• A rare event occurring only in diploid cells, mitotic crossover can result when replicated chromatids come together to form a structure similar to the four-strand stage in meiosis.
• If the starting genotype is d+ e / d e+, the two possible orientations of the resulting chromatids are:– One cell with d+ e+ / d+ e+, and one with the d e/ d e. These
are the ones that are useful for mapping, because the recessive phenotype can be observed in progeny of the d e / d e cells.
– Reversal of the alleles, d e+ / d+ e. Phenotypically indistinguishable from non-recombinant cells, there are not useful for mapping, but are nonetheless derived from a crossover event.
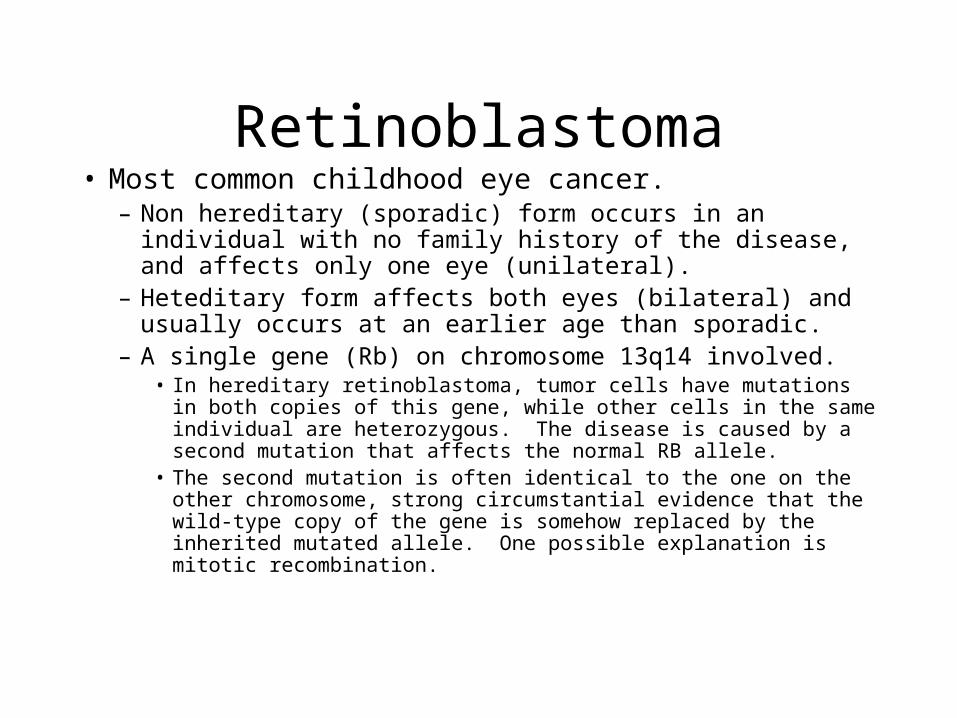
Retinoblastoma• Most common childhood eye cancer.
– Non hereditary (sporadic) form occurs in an individual with no family history of the disease, and affects only one eye (unilateral).
– Heteditary form affects both eyes (bilateral) and usually occurs at an earlier age than sporadic.
– A single gene (Rb) on chromosome 13q14 involved.• In hereditary retinoblastoma, tumor cells have mutations in both copies of
this gene, while other cells in the same individual are heterozygous. The disease is caused by a second mutation that affects the normal RB allele.
• The second mutation is often identical to the one on the other chromosome, strong circumstantial evidence that the wild-type copy of the gene is somehow replaced by the inherited mutated allele. One possible explanation is mitotic recombination.