Federal Emergency Management Agency Department of Homeland Security
800 N. Loop 288 Denton, TX 76209
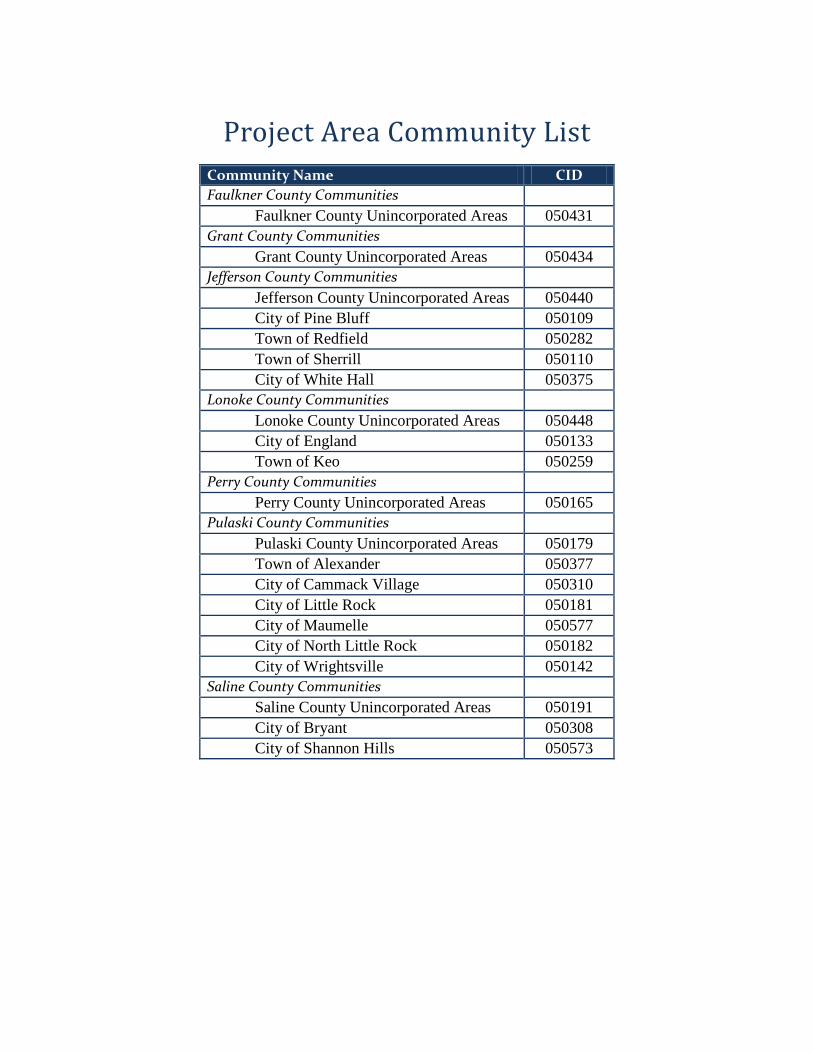
Project Area Community List
Community Name CID Faulkner County Communities
Faulkner County Unincorporated Areas 050431 Grant County Communities
Grant County Unincorporated Areas 050434 Jefferson County Communities
Jefferson County Unincorporated Areas 050440 City of Pine Bluff 050109 Town of Redfield 050282 Town of Sherrill 050110 City of White Hall 050375
Lonoke County Communities
Lonoke County Unincorporated Areas 050448 City of England 050133 Town of Keo 050259
Perry County Communities
Perry County Unincorporated Areas 050165 Pulaski County Communities
Pulaski County Unincorporated Areas 050179 Town of Alexander 050377 City of Cammack Village 050310 City of Little Rock 050181 City of Maumelle 050577 City of North Little Rock 050182 City of Wrightsville 050142
Saline County Communities
Saline County Unincorporated Areas 050191 City of Bryant 050308 City of Shannon Hills 050573
i
Table of Contents Acronyms and Abbreviations ............................................................................................... iii I. Discovery Overview ............................................................................................ 1
i. Watershed Selection ............................................................................................ 2
II. Discovery Efforts ............................................................................................... 12
i. Engagement Plan ............................................................................................... 12
ii. Pre-Discovery Efforts ........................................................................................ 13
iii. Discovery Meeting ............................................................................................. 14
iv. Data Gathering Overview .................................................................................. 15
III. Watershed Findings ........................................................................................... 25
i. Engineering Review of Community Comments ................................................ 25
ii. Post-Discovery Hydrology ................................................................................ 26
iii. Post-Discovery CNMS Analysis ....................................................................... 30
iv. Post-Discovery Hydraulics and Floodplain Analysis ........................................ 34
IV. Watershed Options ............................................................................................ 36
Tables Table 1 - Land Use Within the Watershed .......................................................................... 2Table 2 - Stream Miles Within the Watershed .................................................................... 4Table 3 - NVUE Approximate Stream Mileage in the Watershed ...................................... 6Table 4 - Disaster Declarations in the Watershed ............................................................... 7Table 5 - NFIP Insurance Claims by County and Community within the Watershed ........ 8Table 6 - Repetitive or Severe Repetitive Loss with the Watershed ................................... 9Table 7 - Watershed Risk Factor Rankings ....................................................................... 10Table 8 - Regional Project Team ....................................................................................... 12Table 9 - Data Collection Summary – Pre-Discovery Meeting ......................................... 17Table 10 - Data Collection Summary – During Discovery Meeting and Post-Meeting ...... 19Table 11 - Discharge Comparison at Community Limits .................................................... 28Table 12 - LOMRs that Revise Hydrology within the LAM Watershed ............................ 29Table 13 - Comparison of 1%-Annual-Chance Peak Flows of Gage Frequency Analysis
and Effective Discharges .................................................................................... 30Table 14 - CNMS Analysis ................................................................................................. 31Table 15 - CNMS Category Descriptions ............................................................................ 32Table 16 - LOMRs that Revise Hydraulics within the Watershed ...................................... 34Table 17 - Potential Watershed Needs and Actions ............................................................ 36Table 18 - Metrics and Rankings of Needs ......................................................................... 39
ii
Figures Figure 1 - Lower Arkansas-Maumelle Watershed and Communities .................................. 3Figure 2 - 10-Year View of Urban Change within the Watershed ....................................... 5Figure 3 - Risk Factors and Topographic data for the Watershed ...................................... 11
iii
Acronyms and Abbreviations BFE Base Flood Elevation
CAV Community Assistance Visit
CAW Central Arkansas Water
CEO Chief Elected Official
CERCLA Comprehensive Environmental Response, Compensation, and Liability Act
CFS Cubic Feet Per Second
CID Community Identification number
CNMS Coordinated Needs Management Strategy
CRS Community Rating System
CTP Cooperating Technical Partner
DEM Digital Elevation Model
eLOMA Electronic Letter of Map Amendment
FEMA Federal Emergency Management Agency
FIRM Flood Insurance Rate Map
FIPS Federal Information Processing Standards
FIS Flood Insurance Study
FPA Floodplain Administrator
FY Fiscal Year
G&S Guidelines and Standards for Flood Hazard Mapping Partners
GIS Geographic Information System
HEC-1 Hydrologic Engineering Center – Hydrologic model program
HEC-2 Hydrologic Engineering Center – Hydraulic model program
HEC-RAS Hydrologic Engineering Center – River Analysis System
HMP Hazard Mitigation Plan
HUC Hydrologic Unit Code
IDIQ Indefinite Delivery Indefinite Quantity
LAM Lower Arkansas-Maumelle Watershed
LiDAR Light Detection and Ranging System
LOMC Letter of Map Change
iv
LOMR Letter of Map Revision
MIP Mapping Information Platform
NFIP National Flood Insurance Program
NHD National Hydrologic Dataset
NVUE New Validated or Updated Engineering
PAGIS Pulaski Area GIS
PMR Physical Map Revision
RAMPP Risk Mapping, Assessment, and Planning Partners
RCRA Resource Conservation and Recovery Act
RSC Regional Service Center
Risk MAP Risk Mapping, Assessment, and Planning Program
RL/SRL Repetitive Loss / Severe Repetitive Loss
SFHA Special Flood Hazard Area
SHMO State Hazard Mitigation Officer
SHP ESRI Shape file
SQ MI Square Mile
TSDN Technical Support Data Notebook
UDF Hazus User Defined Feature
USACE U.S. Army Corps of Engineers
USDA U.S. Department of Agriculture
USGS U.S. Geological Survey
1
I. Discovery Overview The Federal Emergency Management Agency (FEMA) is currently implementing the Risk Mapping, Assessment, and Planning (Risk MAP) Program across the Nation. The purpose of Risk MAP is continued improvement of flood hazard information for the National Flood Insurance Program (NFIP), the promotion of increased national awareness and understanding of flood risk, and to support Federal, State, and local mitigation actions to reduce risk. The vision and intent of the Risk MAP program is, through collaboration with State and local entities, to deliver quality data that increases public awareness and leads to mitigation actions that reduce risk to life and property. To achieve this vision, FEMA has transformed its traditional flood identification and mapping efforts into an integrated process to more accurately identify, assess, communicate, plan for, and mitigate flood risks. The FEMA Region 6 office, in partnership with the State of Arkansas Natural Resources Commission (State of Arkansas), began the Discovery process in the Lower Arkansas-Maumelle (LAM) Watershed in February 2011. The Discovery process focuses on gathering local information and readily available data to determine project viability and the need for Risk MAP products to assist in the movement of communities to a more resilient path. FEMA, their contractor, RAMPP (Risk Analysis, Mapping, and Planning Partners), and the State of Arkansas partnered throughout the Discovery process to facilitate communications, meetings, risk identification, and final reporting and documentation. Through the Discovery process, FEMA can determine which areas of the Hydrologic Unit Code 8 (HUC-8) Discovery watersheds may be examined for further flood risk identification and assessment in a collaborative manner, taking into consideration the information collected from local communities. Discovery initiates open lines of communication and relies on local involvement for productive discussions about flood risk. The process provides a forum for a watershed-wide effort to understand how an individual community’s flood risks are related to flood risk throughout the watershed. In Risk MAP, projects are analyzed on a watershed basis. So, Discovery Meetings target numerous stakeholders from throughout the watershed on local, regional, State, and Federal levels. In June 2011, FEMA and the State held a series of four Discovery Meetings in this watershed. During Discovery, FEMA and the State reached out to local communities to:
• Gather information about local flood risk and flood hazards; • Review current and historic mitigation plans to understand local mitigation
capabilities, hazard risk assessments, and current or future mitigation activities; and,
• Include multi-disciplinary staff from within each community to participate and assist in the development of a watershed vision.
The results of the Discovery process are presented in a Discovery Report, a watershed scale Discovery Map, and the digital data that was gathered or developed during this process under FEMA IDIQ Contract HSFEHQ-09-D-0369, Task Order HSFE06-10-J-0002. The digital data submitted (on DVD) with this report contain correspondence, exhibits used at the Discovery Meetings, GIS data, mapping documents (PDF, shape files,
2
personal geodatabases, and ESRI ArcGIS 9.3.1 MXDs), or other supplemental digital information. Any graphics shown in this report are available in a larger format graphics file for printing, and as GIS data that may be printed and used at any map scale.
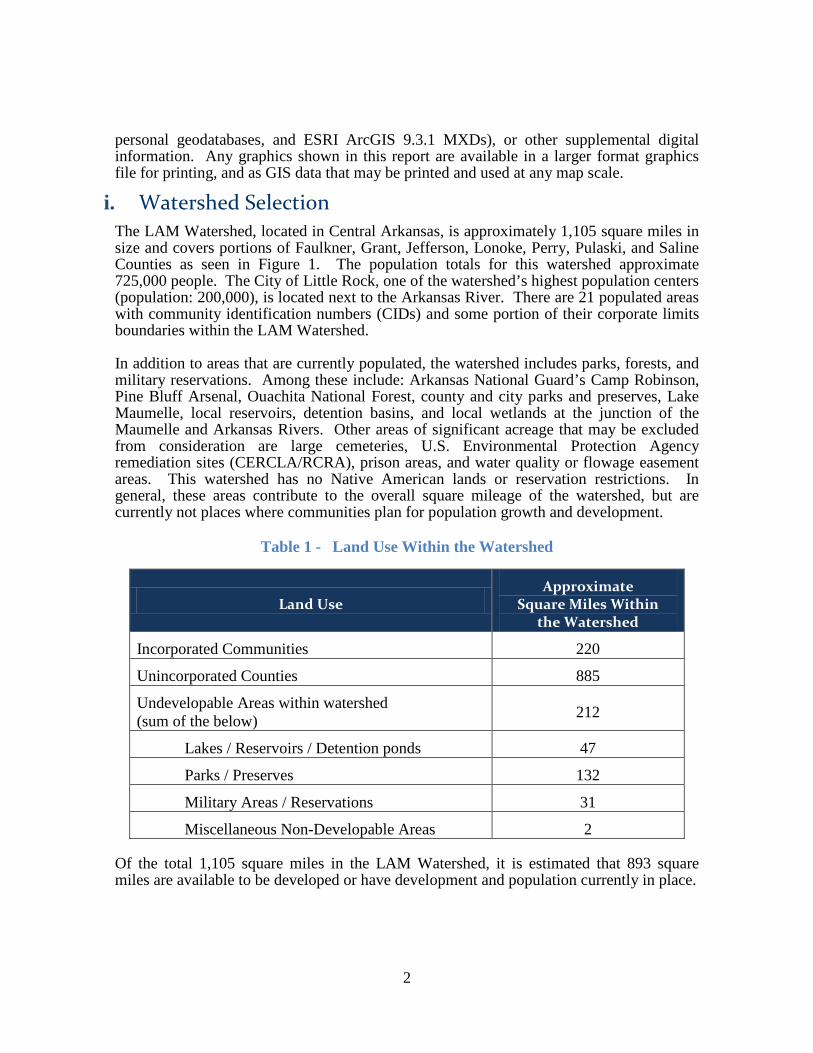
i. Watershed Selection The LAM Watershed, located in Central Arkansas, is approximately 1,105 square miles in size and covers portions of Faulkner, Grant, Jefferson, Lonoke, Perry, Pulaski, and Saline Counties as seen in Figure 1. The population totals for this watershed approximate 725,000 people. The City of Little Rock, one of the watershed’s highest population centers (population: 200,000), is located next to the Arkansas River. There are 21 populated areas with community identification numbers (CIDs) and some portion of their corporate limits boundaries within the LAM Watershed. In addition to areas that are currently populated, the watershed includes parks, forests, and military reservations. Among these include: Arkansas National Guard’s Camp Robinson, Pine Bluff Arsenal, Ouachita National Forest, county and city parks and preserves, Lake Maumelle, local reservoirs, detention basins, and local wetlands at the junction of the Maumelle and Arkansas Rivers. Other areas of significant acreage that may be excluded from consideration are large cemeteries, U.S. Environmental Protection Agency remediation sites (CERCLA/RCRA), prison areas, and water quality or flowage easement areas. This watershed has no Native American lands or reservation restrictions. In general, these areas contribute to the overall square mileage of the watershed, but are currently not places where communities plan for population growth and development.
Table 1 - Land Use Within the Watershed
Land Use Approximate
Square Miles Within the Watershed
Incorporated Communities 220
Unincorporated Counties 885
Undevelopable Areas within watershed (sum of the below) 212
Lakes / Reservoirs / Detention ponds 47
Parks / Preserves 132
Military Areas / Reservations 31
Miscellaneous Non-Developable Areas 2 Of the total 1,105 square miles in the LAM Watershed, it is estimated that 893 square miles are available to be developed or have development and population currently in place.
3
Figure 1 - Lower Arkansas-Maumelle Watershed and Communities
4
Significant streams in this watershed include the Arkansas River, Maumelle River, Little Maumelle River, Fourche Creek, Little Fourche Creek, Rock Creek, Dry Creek, Nowlin Creek, Fish Creek, Can Creek, and McHenry Creek. In addition to Lake Maumelle, Faulkner Lake, and Lake Langhofer, several Bayous (Ashley, Fourche, Mill, Pennington, Plum, and White Oak) are significant water resources within the watershed. The U.S. Geological Survey’s (USGS) National Hydrologic Dataset (NHD) can be used to identify stream miles with drainage areas of 1 square mile on available topographic data. The NHD stream mileage may be used to approximate the total potential stream miles for a watershed. Based on the NHD, there are approximately 1,037 miles of streams in the LAM Watershed. The Coordinated Needs Management Strategy (CNMS) Inventory provides a snapshot look at the status and attributes of currently studied streams existing within FEMA’s floodplain study inventory. In general, the stream mileage shown in CNMS reflects streams with an approximate 1-square-mile drainage area and that currently have effective Special Flood Hazard Areas (SFHAs) designated. CNMS does not reflect the total potential of streams to be studied within a watershed. Table 2 compares the NHD data to the CNMS data for the LAM Watershed.
Table 2 - Stream Miles Within the Watershed
Source Stream Miles
NHD Streams (streams with a drainage area of greater than one square mile) 1,037
CNMS Streams (streams with effective SFHA) 764
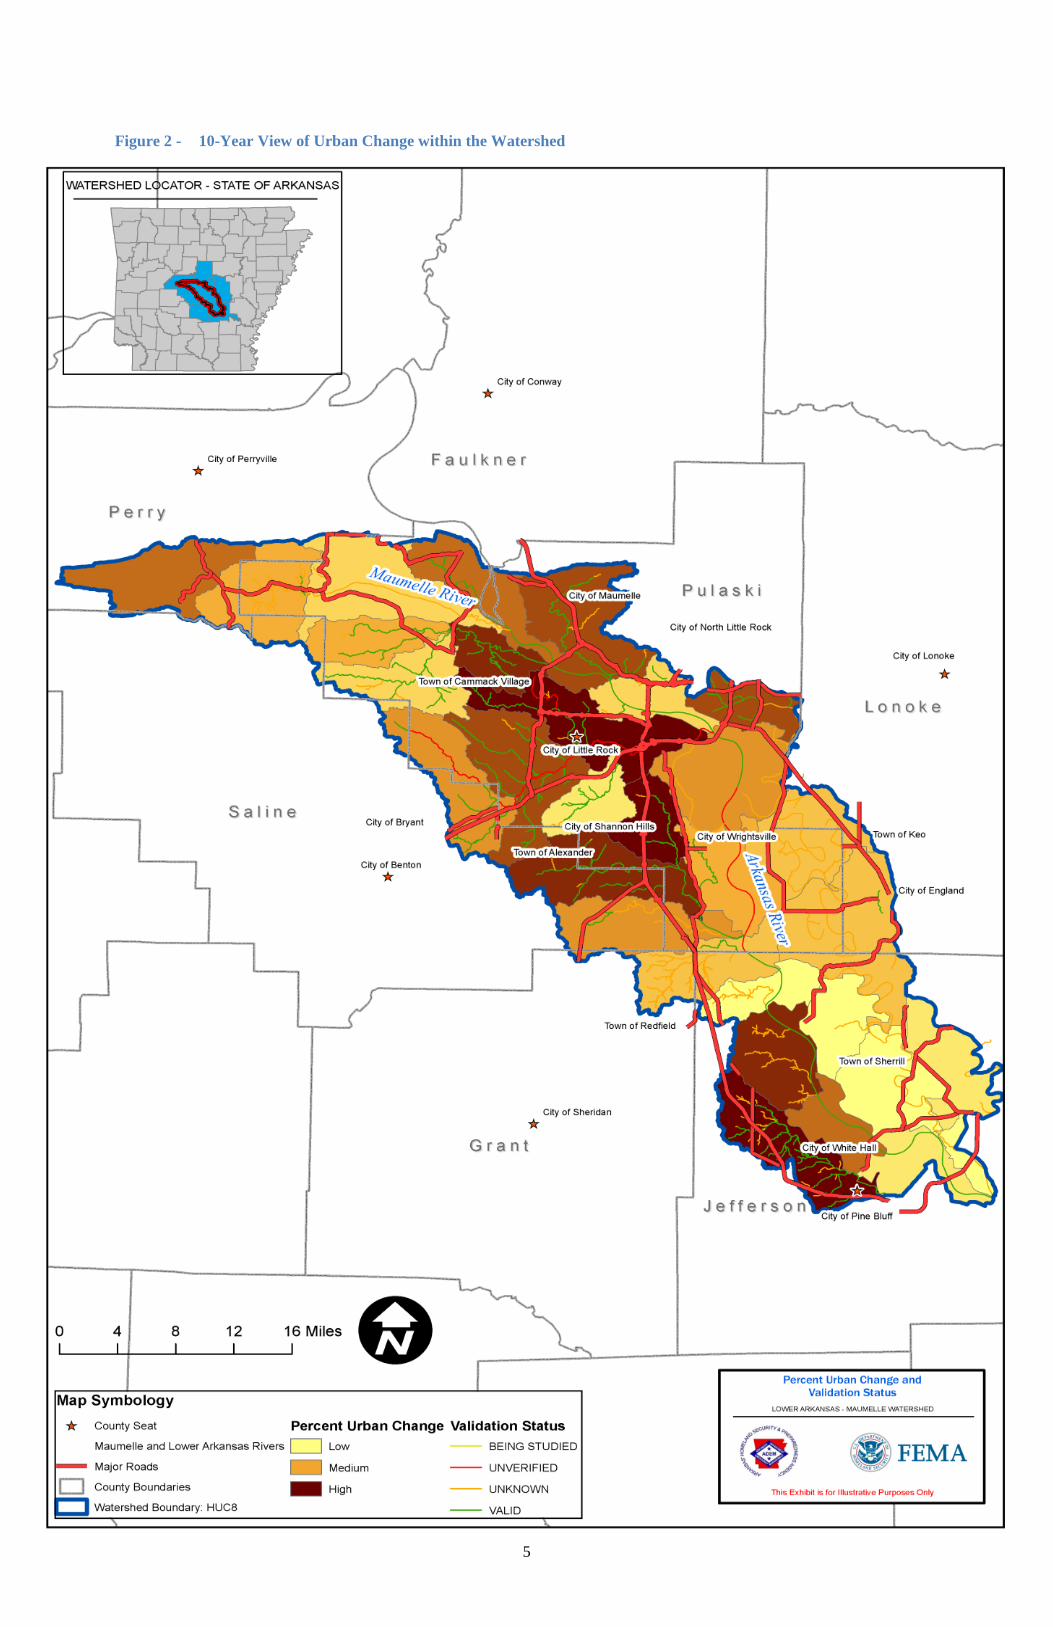
Stream Miles not accounted for in CNMS 273 In addition to listing the miles of studied streams within a watershed, CNMS documents certain physiological, climatological, or engineering methodological factors that may have changed since the date of effective studies. The stream miles shown in CNMS are attributed with an evaluation of a Validation Status and Status Type that allows an examination of the condition of a given study or group of studies. Studies which are considered Valid in CNMS are the only ones that contribute to the New Validated or Updated Engineering (NVUE) metric. Figure 2 shows areas of relatively higher urban change within the watershed that can be used to help determine whether streams are considered Valid. The NVUE metric is used to indicate the status of studies for FEMA's mapped SFHA inventory. Those studies, which are categorized as “Unverified”, typically indicate that some factor of change has occurred since the SFHA became effective; or there may be a deficiency, such as areas with over five new or removed hydraulic structures (bridge/culvert) in the SFHA area or hot spots of Repetitive Loss / Severe Repetitive Loss (RL/SRL), warranting restudy. CNMS stream mileage categorized as ‘Requires Assessment’ need further input to determine their validity – often because they represent paper inventory or non-modernized studies. CNMS aids in identifying areas to be considered for study during the Discovery process by highlighting needs on a map, quantifying them (mileage), and providing further categorization of these needs in order to differentiate factors that identify the needs.
5
Figure 2 - 10-Year View of Urban Change within the Watershed
6
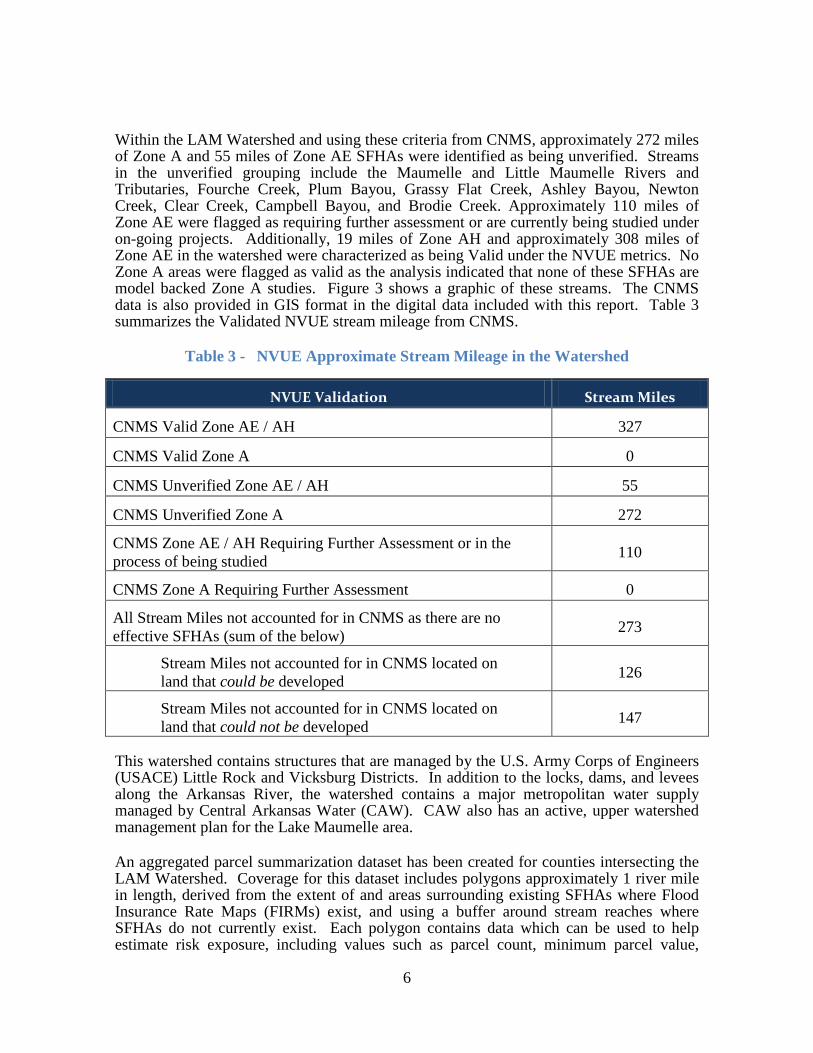
Within the LAM Watershed and using these criteria from CNMS, approximately 272 miles of Zone A and 55 miles of Zone AE SFHAs were identified as being unverified. Streams in the unverified grouping include the Maumelle and Little Maumelle Rivers and Tributaries, Fourche Creek, Plum Bayou, Grassy Flat Creek, Ashley Bayou, Newton Creek, Clear Creek, Campbell Bayou, and Brodie Creek. Approximately 110 miles of Zone AE were flagged as requiring further assessment or are currently being studied under on-going projects. Additionally, 19 miles of Zone AH and approximately 308 miles of Zone AE in the watershed were characterized as being Valid under the NVUE metrics. No Zone A areas were flagged as valid as the analysis indicated that none of these SFHAs are model backed Zone A studies. Figure 3 shows a graphic of these streams. The CNMS data is also provided in GIS format in the digital data included with this report. Table 3 summarizes the Validated NVUE stream mileage from CNMS.
Table 3 - NVUE Approximate Stream Mileage in the Watershed
NVUE Validation Stream Miles
CNMS Valid Zone AE / AH 327
CNMS Valid Zone A 0
CNMS Unverified Zone AE / AH 55
CNMS Unverified Zone A 272
CNMS Zone AE / AH Requiring Further Assessment or in the process of being studied 110
CNMS Zone A Requiring Further Assessment 0
All Stream Miles not accounted for in CNMS as there are no effective SFHAs (sum of the below) 273
Stream Miles not accounted for in CNMS located on land that could be developed 126
Stream Miles not accounted for in CNMS located on land that could not be developed 147
This watershed contains structures that are managed by the U.S. Army Corps of Engineers (USACE) Little Rock and Vicksburg Districts. In addition to the locks, dams, and levees along the Arkansas River, the watershed contains a major metropolitan water supply managed by Central Arkansas Water (CAW). CAW also has an active, upper watershed management plan for the Lake Maumelle area. An aggregated parcel summarization dataset has been created for counties intersecting the LAM Watershed. Coverage for this dataset includes polygons approximately 1 river mile in length, derived from the extent of and areas surrounding existing SFHAs where Flood Insurance Rate Maps (FIRMs) exist, and using a buffer around stream reaches where SFHAs do not currently exist. Each polygon contains data which can be used to help estimate risk exposure, including values such as parcel count, minimum parcel value,
7
maximum parcel value, and average parcel value. This data is presented as an aggregate for these areas, rather than at a single parcel resolution. Using this information can aid in the process of identifying unmapped streams adjacent to areas having a high level of risk exposure, or mapped streams with high levels of risk exposure just beyond existing SFHA bounds. For the LAM Watershed, this supplemental information was only available for Pulaski and Saline Counties. This data is represented as a graphic showing the areas of relative high-, medium-, and low-dollar risk exposure and can be found in the Supplemental Data folder included with this report (…/Supplemental Data/LAM_Discovery_Meeting_Map_Parcel_Value_Risk_WithNull_11x17.pdf). The LAM Watershed has a history of flooding as demonstrated by numerous presidential disaster declarations, with six issued in the last 3 years. The State Hazard Mitigation Plan (HMP) asserts that the Flood of 1927 was the most devastating in Arkansas’ history. All levees on the Arkansas River between Fort Smith and Little Rock failed. Breaks in the levees were responsible for flooding towns and vast farming areas. According to Grant County’s HMP (2007), the County experienced $800,000 in losses between 1997 and 2007. The Jefferson County HMP states that the County, including its incorporated areas, has experienced $3,242,000 in losses since 1994 with an average loss of $294,727 per year. As noted in the Perry County HMP, the County experienced nearly $3 million in direct damages, with $150,000 in crop damages, spread over the 27 previous floods of record. The recent flood events of May 2011 resulted in disaster declarations for all counties within the LAM Watershed. Table 4 lists recent disaster declarations for multiple hazards within the LAM Watershed. Table 4 - Disaster Declarations in the Watershed
Date of Disaster
Declaration Watershed Counties Declared For Hazard
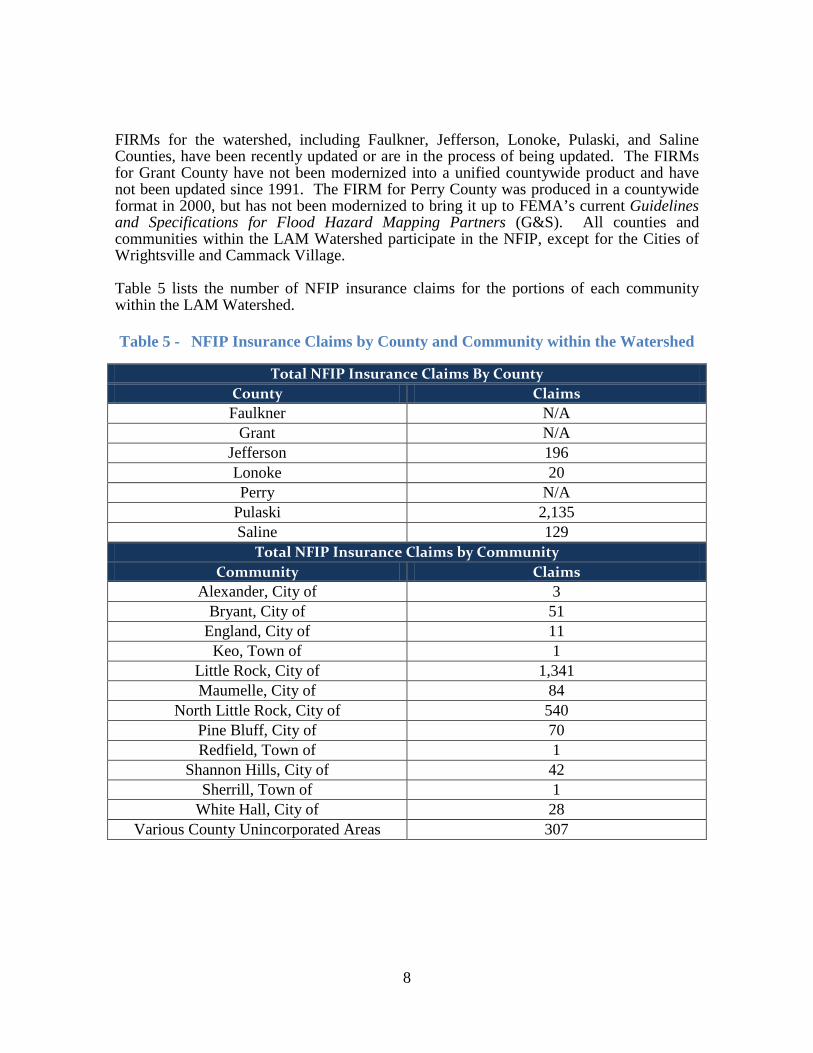
FIRMs for the watershed, including Faulkner, Jefferson, Lonoke, Pulaski, and Saline Counties, have been recently updated or are in the process of being updated. The FIRMs for Grant County have not been modernized into a unified countywide product and have not been updated since 1991. The FIRM for Perry County was produced in a countywide format in 2000, but has not been modernized to bring it up to FEMA’s current Guidelines and Specifications for Flood Hazard Mapping Partners (G&S). All counties and communities within the LAM Watershed participate in the NFIP, except for the Cities of Wrightsville and Cammack Village. Table 5 lists the number of NFIP insurance claims for the portions of each community within the LAM Watershed. Table 5 - NFIP Insurance Claims by County and Community within the Watershed
Total NFIP Insurance Claims By County County Claims Faulkner N/A
Grant N/A Jefferson 196 Lonoke 20 Perry N/A
Pulaski 2,135 Saline 129
Total NFIP Insurance Claims by Community Community Claims
Alexander, City of 3 Bryant, City of 51
England, City of 11 Keo, Town of 1
Little Rock, City of 1,341 Maumelle, City of 84
North Little Rock, City of 540 Pine Bluff, City of 70 Redfield, Town of 1
Shannon Hills, City of 42 Sherrill, Town of 1
White Hall, City of 28 Various County Unincorporated Areas 307
9
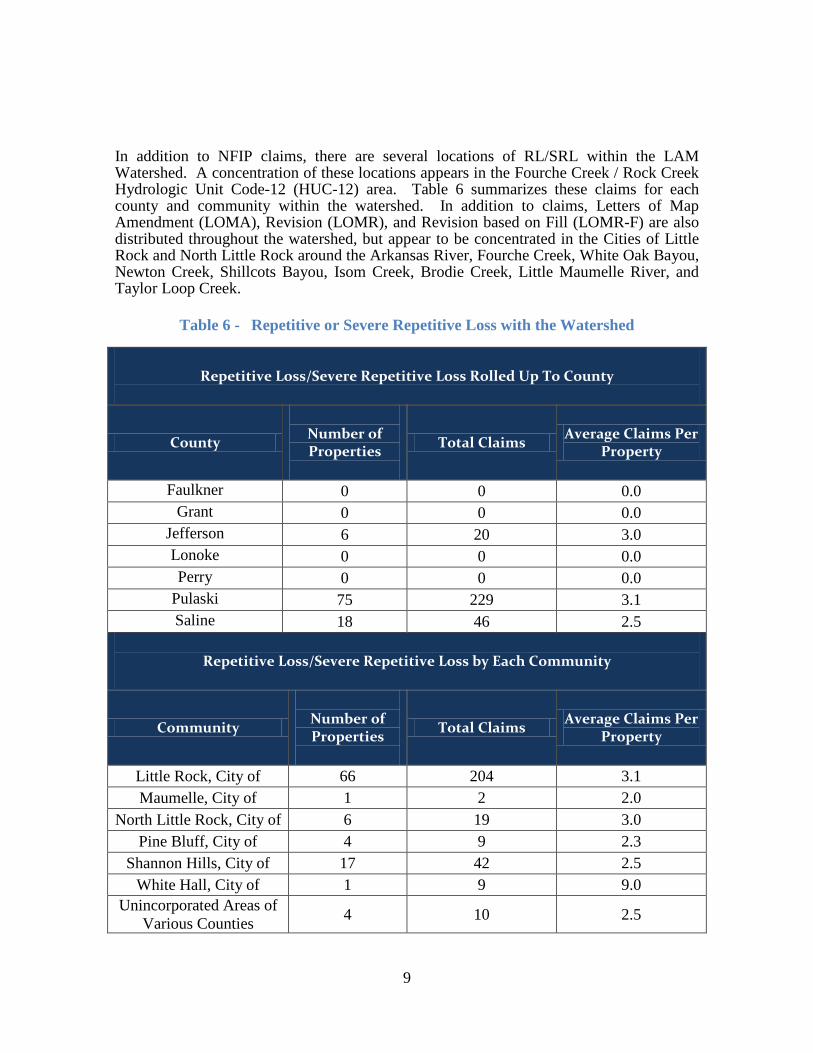
In addition to NFIP claims, there are several locations of RL/SRL within the LAM Watershed. A concentration of these locations appears in the Fourche Creek / Rock Creek Hydrologic Unit Code-12 (HUC-12) area. Table 6 summarizes these claims for each county and community within the watershed. In addition to claims, Letters of Map Amendment (LOMA), Revision (LOMR), and Revision based on Fill (LOMR-F) are also distributed throughout the watershed, but appear to be concentrated in the Cities of Little Rock and North Little Rock around the Arkansas River, Fourche Creek, White Oak Bayou, Newton Creek, Shillcots Bayou, Isom Creek, Brodie Creek, Little Maumelle River, and Taylor Loop Creek.
Table 6 - Repetitive or Severe Repetitive Loss with the Watershed
Repetitive Loss/Severe Repetitive Loss Rolled Up To County
County
Number of Properties
Total Claims Average Claims Per Property
Faulkner 0 0 0.0 Grant 0 0 0.0
Jefferson 6 20 3.0 Lonoke 0 0 0.0 Perry 0 0 0.0
Pulaski 75 229 3.1 Saline 18 46 2.5
Repetitive Loss/Severe Repetitive Loss by Each Community
Community
Number of Properties
Total Claims Average Claims Per Property
Little Rock, City of 66 204 3.1 Maumelle, City of 1 2 2.0
North Little Rock, City of 6 19 3.0 Pine Bluff, City of 4 9 2.3
Shannon Hills, City of 17 42 2.5 White Hall, City of 1 9 9.0
Unincorporated Areas of Various Counties 4 10 2.5
10
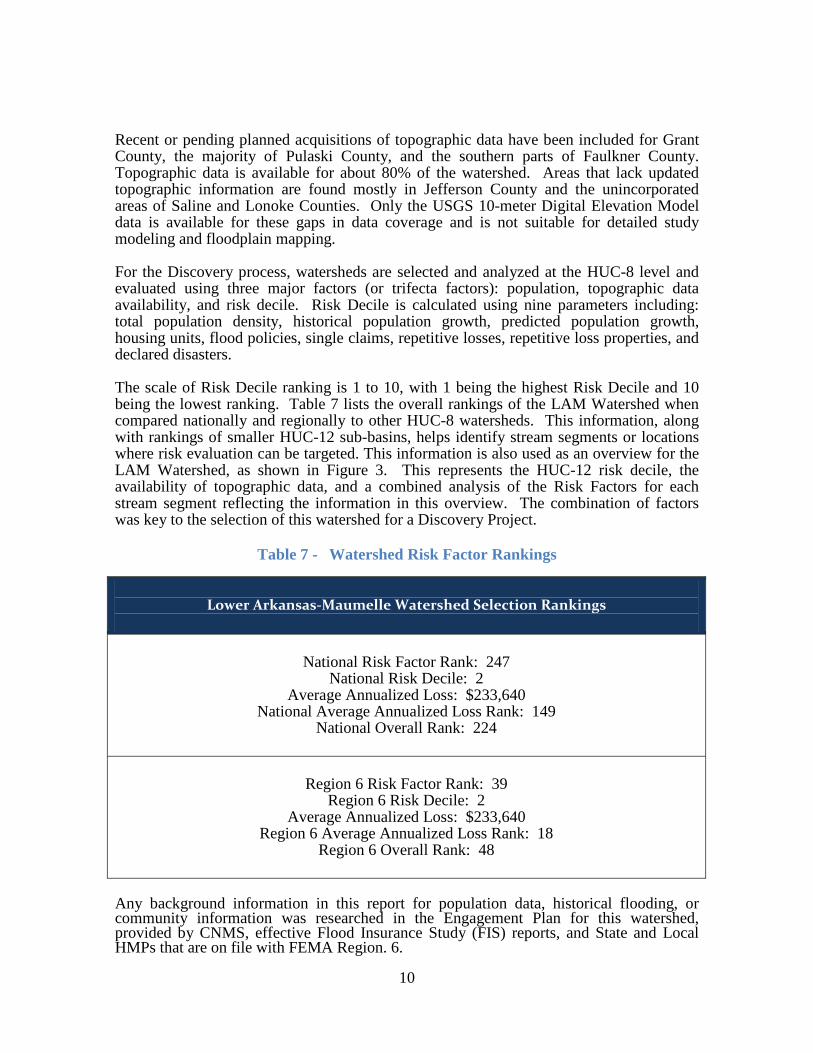
Recent or pending planned acquisitions of topographic data have been included for Grant County, the majority of Pulaski County, and the southern parts of Faulkner County. Topographic data is available for about 80% of the watershed. Areas that lack updated topographic information are found mostly in Jefferson County and the unincorporated areas of Saline and Lonoke Counties. Only the USGS 10-meter Digital Elevation Model data is available for these gaps in data coverage and is not suitable for detailed study modeling and floodplain mapping. For the Discovery process, watersheds are selected and analyzed at the HUC-8 level and evaluated using three major factors (or trifecta factors): population, topographic data availability, and risk decile. Risk Decile is calculated using nine parameters including: total population density, historical population growth, predicted population growth, housing units, flood policies, single claims, repetitive losses, repetitive loss properties, and declared disasters. The scale of Risk Decile ranking is 1 to 10, with 1 being the highest Risk Decile and 10 being the lowest ranking. Table 7 lists the overall rankings of the LAM Watershed when compared nationally and regionally to other HUC-8 watersheds. This information, along with rankings of smaller HUC-12 sub-basins, helps identify stream segments or locations where risk evaluation can be targeted. This information is also used as an overview for the LAM Watershed, as shown in Figure 3. This represents the HUC-12 risk decile, the availability of topographic data, and a combined analysis of the Risk Factors for each stream segment reflecting the information in this overview. The combination of factors was key to the selection of this watershed for a Discovery Project.
National Risk Factor Rank: 247 National Risk Decile: 2
Average Annualized Loss: $233,640 National Average Annualized Loss Rank: 149
National Overall Rank: 224
Region 6 Risk Factor Rank: 39 Region 6 Risk Decile: 2
Average Annualized Loss: $233,640 Region 6 Average Annualized Loss Rank: 18
Region 6 Overall Rank: 48
Any background information in this report for population data, historical flooding, or community information was researched in the Engagement Plan for this watershed, provided by CNMS, effective Flood Insurance Study (FIS) reports, and State and Local HMPs that are on file with FEMA Region. 6.
11
Figure 3 - Risk Factors and Topographic data for the Watershed
12
II. Discovery Efforts
i. Engagement Plan The LAM Engagement Plan was prepared throughout the Pre-Discovery efforts of the Regional Project Team. The Regional Project Team staff is shown in Table 8.
Table 8 - Regional Project Team
Name Organization Project Role
Guy Lowes FEMA Region 6 Project Monitor - Engineering And Mapping Lead
Matt Dubois FEMA Region 6 Deputy Project Monitor
David Reiff FEMA Region 6 Mitigation Planning Support Diana Herrera / Rob Connell FEMA Region 6 Compliance Support
Linda Delamare FEMA Region 6 Insurance Support
Carlenya Veasley FEMA Region 6 Grant Support
Michael Borengasser State of Arkansas State NFIP Coordinator
Josh Rogers State of Arkansas State Hazard Mitigation Officer
Chad Delaney USACE - Little Rock District
USACE Coordination with both Little Rock and Vicksburg Districts
Stephanie Routh RAMPP RAMPP Study Manager
Corey Garyotis RAMPP Regional Service Center (RSC6) Coordination
Rhonda Hurst RAMPP RSC6 and Meeting Coordination
The Engagement Plan is a tool that allows all Regional Project Team members to understand the history of the watershed and highlights recent engagements with the FEMA Region 6 Mitigation Division. In addition to contact information for key stakeholders and organizations within the watershed, the Engagement Plan captures media outlet information, the location and summary of recent articles or news releases, a strategy for keeping Congressional liaisons involved in the Discovery process, and a history of communications. The various team members use the Engagement Plan to strategize communications to the various groups within the watershed, to deliver the Discovery Meeting messages and vision, and to track hot topics or points of interest. The Engagement Plan served as the initial repository for summary information about the watershed. This data was previously discussed in the report as background for the selection process of the LAM Watershed to undergo the Discovery process. This plan served as a clearinghouse for information about mitigation planning, active and closed
13
grants, insurance policy information, socio-economic overviews of the communities, and a review of the recent mapping initiatives within the watershed. From this collective review of the watershed, the project team is able to identify how communities within a project area should be engaged and selects from a high-, medium-, or low-engagement strategy based on the risk, need, and political will of the communities within the watershed. The complete Engagement Plan is included with the supplemental digital data accompanying this report.
ii. Pre-Discovery Efforts FEMA and the Regional Project Team were in contact with all LAM Watershed stakeholders via letters, email, and phone calls before the Discovery Meetings to request local participation and assistance in identifying key people to include in the Discovery process. These communications also served to acquire any data that an organization may have that would assist in the risk identification and assessment of the LAM Watershed. In preparation for the Discovery Meetings, the Regional Project Team:
• Gathered information about local flood risk and flood hazards; • Reviewed mitigation plans to understand local mitigation capabilities, hazard risk
assessments, and current or future mitigation activities; • Encouraged communities in the watershed to develop a vision for the watershed’s
future; and • Used all information gathered to determine which areas of the watershed may
require further study through a Risk MAP project. The Regional Project Team then began outreach efforts to the local governments within the LAM Watershed, Congressional and Public officials, the USACE Little Rock and Vicksburg Districts, other Departments at the State of Arkansas, CAW, Planning Districts, the University of Arkansas, the Arkansas National Guard, local Chambers of Commerce, Port Authorities, and the Little Rock Airport to inform them of the Discovery process and to invite them to participate and contribute information about this watershed and any water resource concerns. The following are key steps that were taken before the Discovery meetings were held:
• An Initial Coordination meeting between FEMA and the State of Arkansas NFIP Coordinator and State Hazard Mitigation Officer was held to set the stage for co-participation and sharing of duties for the Discovery process, and to establish potential meeting times and locations for the watershed Discovery Meetings.
• RAMPP set logistics for the meeting date/locations/facilities. • Informational letters were mailed to communities and other interested groups such
as the Chamber of Commerce, Port Authority, airport, planning agencies, and Water Management Groups.
• Initial calls were made by the RAMPP Study Manager to Chief Elected Officials and Floodplain Administrators to inform them of the meeting and to request data.
• Invitation letters mailed.
14
• Project Monitor followed up with emails that provided meeting information. • Project Monitor followed up with phone calls to personally invite key stakeholders
and representatives from the communities and to remind them of the meeting details and logistics.
• Invited USACE to participate as an active member of the project team. • Project Monitor conducted Congressional briefing before the meeting. • Project Monitor conducted Media briefing before the meeting. • Dry run with FEMA, State, USACE, and RAMPP to distribute the meeting
materials for review and questions. Copies of key correspondence are included in the external files included with this report.
iii. Discovery Meeting Four LAM Watershed Discovery Meetings were held at the Willie L. Hinton Neighborhood Resource Center in Little Rock, Arkansas, on June 15, 2011, and the Water Front Recreation Center in the City of Pine Bluff, Arkansas on June 16, 2011. Two meetings were held each day with a scheduled duration of three hours per meeting. Meetings were held in the afternoon and evenings. It was anticipated that approximately 60 people would attend each meeting and the logistics for each meeting site were set-up to accommodate the expected number of attendees. Each meeting site was prepared for an initial presentation and a series of stations envisioned to provide an interactive setting between Regional Project Staff and Discovery Meeting attendees. After a short presentation by the FEMA Project Monitor, attendees rotated around four Discovery stations focused on Mapping/Engineering, NFIP/Mitigation, Grants, and Planning. Each station had a series of large format, watershed maps with an aerial photo of the watershed displayed, along with community boundaries and road names to assist with the location of information. Additionally, each station had several 11-inch by 17-inch laminated maps for the watershed with topical information related to that station’s content.
• Grant Station•
– map of current floodplain related grants Planning Station
•
– map of current Letters of Map Change (LOMCs), sample Risk MAP products, and a sample Depth grid for the Fourche Creek levee area NFIP/Mitigation Station
•
– map of RL/SRL loss areas, effective FIRM and FIS report, and a map showing current NFIP claims Mapping/Engineering Station
The USACE also assisted at the Planning station and provided informational materials related to USACE activities in the watershed.
– Risk/Need/Topographic data composite from CNMS information, Population Density in the watershed, Urban Change in the watershed, and the potential dollar exposure near SFHA areas, displayed on a parcel by parcel basis
At each station, attendees were asked to contribute information about concerns in the watershed by indicating the location on the large watershed map, and then providing a
15
short write-up recorded on a comment form. The activity at the stations was intended to be interactive, with attendees and staff working together to listen, discuss, and document any topical items for the watershed. Staff from the Regional Project Team (FEMA, State of Arkansas, and RAMPP) were at each station to answer questions and engage in conversation with everyone. After a period of time at each station, attendees were asked to rotate clockwise to the next station and begin the process again, focused on the topic that the next station was concerned with. During the meeting, any additional information that attendees indicated they could provide to the process was to be submitted within two weeks of the meetings. Information sheets were collected at each station and the Discovery watershed maps were labeled at locations within the watershed. These information sheets are included in the supplemental digital data that accompanies this report.
iv. Data Gathering Overview All four Discovery Meetings were attended by local participants. A full list of attendees is provided on the sign-in sheets located in the digital data that accompany this report. The meetings were well attended with 50-percent of all local communities represented in at least one of the meetings. Several non-community based groups, non-profit groups, or private entities attended as well, as shown in the list below:
• Local community elected officials and councilpersons • Local floodplain managers, emergency management staff, community planners,
public works staff • District Representative from Congressman Tim Griffin’s staff • Local Chamber of Commerce representatives • CAW • Regional Planning Organizations • Arkansas National Guard • Local Port Authorities • Little Rock Airport • General Public / Local engineering consultants
The meetings afforded personal, interactive communication with attendees at each station. The Regional Project Team interviewed and listened to concerns, areas of positive mitigation, and areas of continuing concern were discussed for the watershed as a whole. As attendees interacted at each station, they not only discussed their own local concerns, but listened to the concerns of others in the watershed. Often this turned into an interactive discussion among the different communities within the watershed. Attendees were polled by the FEMA Project Monitor as they exited the meeting and verbal feedback from the attendees indicated they felt this was a good opportunity to express their issues and concerns for the watershed. They also indicated they preferred the interactive stations rather than a lengthy presentation of information about the watershed. Many
16
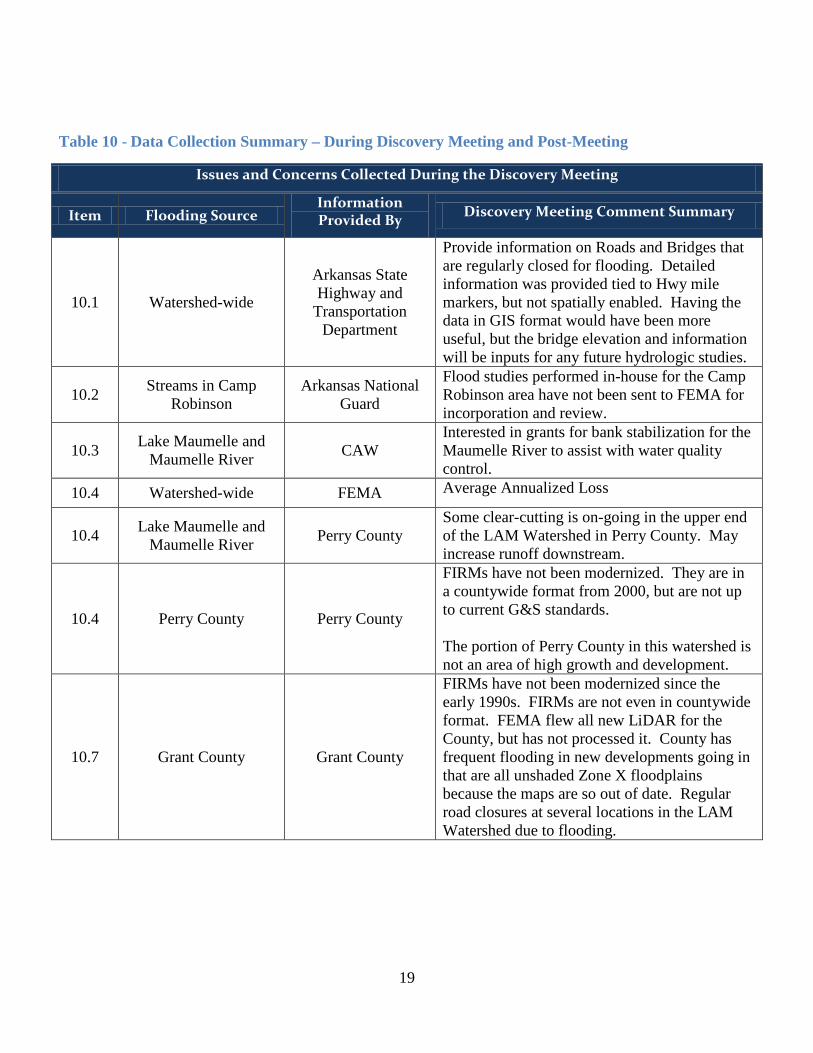
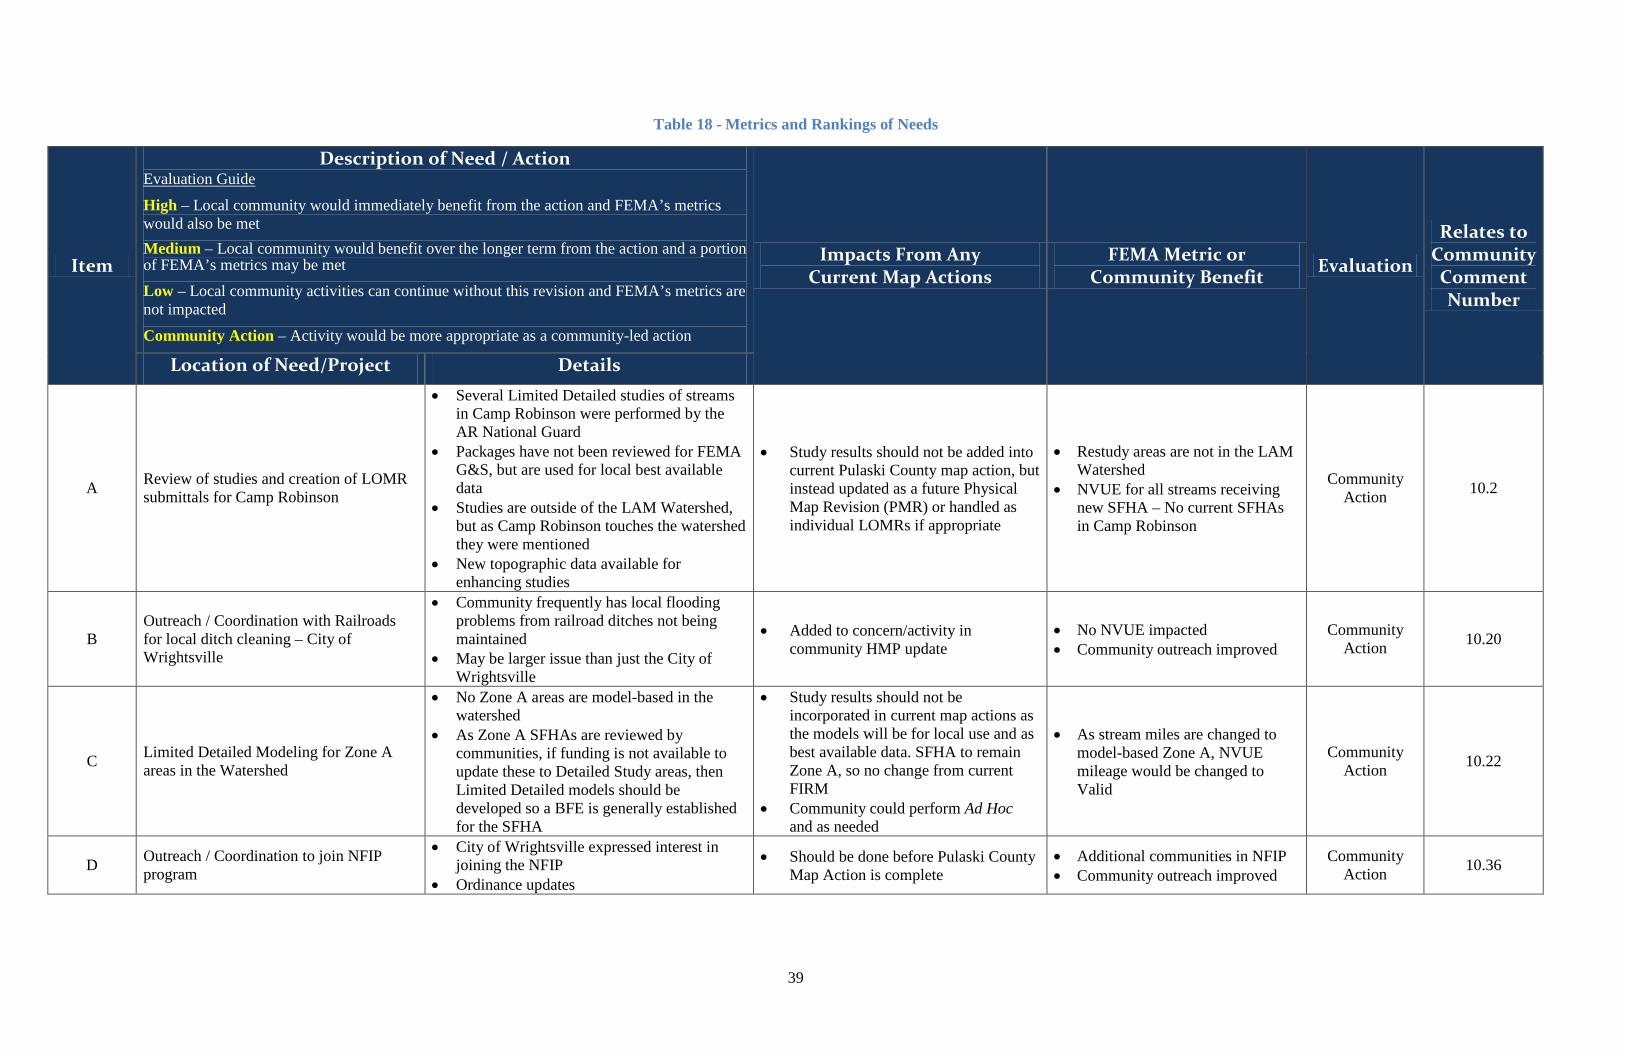
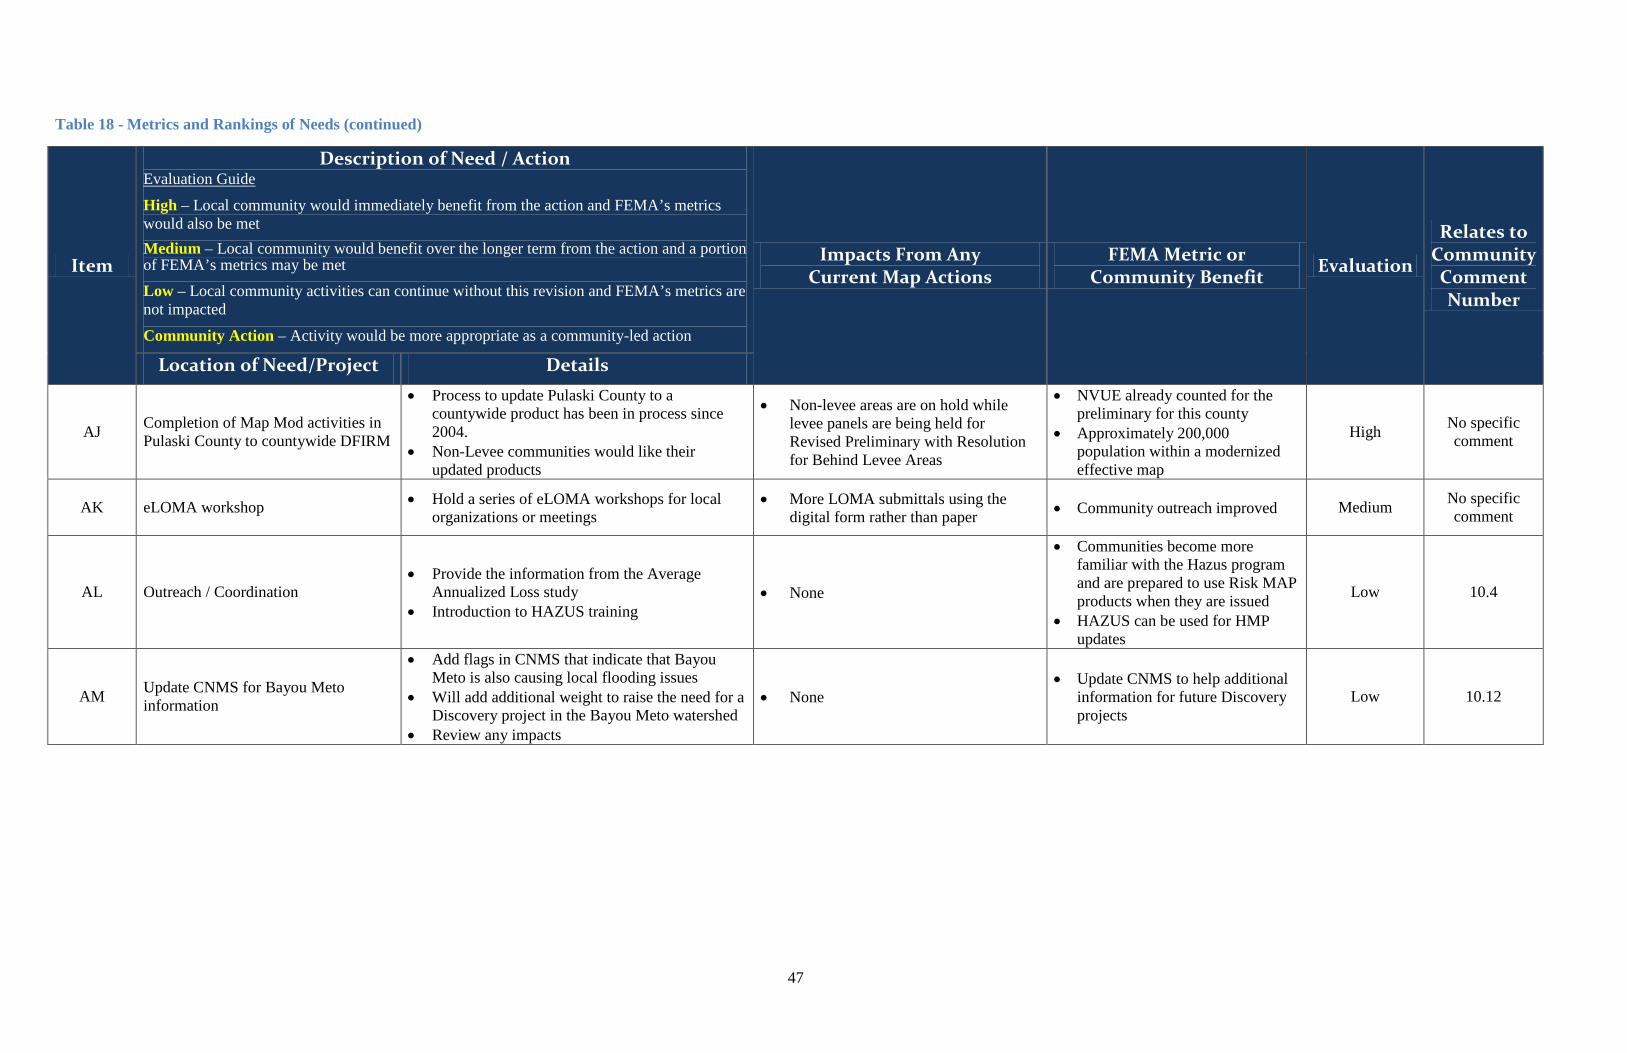
attendees were appreciative of the chance to speak with the various Regional Project Team members from FEMA, the State of Arkansas, and the USACE. Community perception was that the Discovery process was an improvement over the scoping activities that FEMA has performed in the past, and they stated they felt more engaged in the process of identifying needs and projects. Communities that discussed their HMP actions and pending actions in detail with the Regional Project Team are eligible to count these meetings toward stakeholder engagement activities during their next HMP update. Information about the watershed was gathered both prior to the Discovery Meetings and interactively at the meetings. At the Discovery Meeting stations, attendees were able to complete a data information sheet and place a sticker on the hard copy maps showing the approximate location of their concern within the watershed. This information was captured in a GIS format later, and the data from the forms was input for each point location on the watershed maps. Maps and data from all of the Discovery stations were compiled into a single dataset. All map exhibits, including scans of the watershed maps with the sticker locations, are included in the digital data that accompany this report. Table 10 summarizes the comments that were collected at each of the stations. Scans of all comment forms are included in the digital data that accompany this report. The comments are included in Table 10, as written, from the comment form; however, if the same comment was made by the same attendee at a different station, it is only listed once. If multiple attendees made the same comment, it is noted that a version of the comment was made several times. For this watershed, additional data was not submitted by communities prior to the Discovery Meeting as there are current FEMA Map Actions on-going in several of the counties in the LAM Watershed, and key background data had already been provided by the communities. Table 9 and Table 10 list any data that was gathered prior to the meeting, at the meeting, or that was sent in afterwards. Items listed in Table 10 that were collected at the Discovery Meeting were also mapped in a GIS ESRI shape file (SHP) to record the location in the watershed. The item column in Table 10 is linked to the resolution listed in the final table of this report (Table 18), where needs and watershed actions are gathered, ranked, and recommend as being assigned to FEMA or the local community for resolution.
17
Table 9 - Data Collection Summary – Pre-Discovery Meeting
Data Location Data Custodian Data Set Description
Watershed-wide FEMA Effective FIRM and FIS and backup information available on the Mapping Information Platform (MIP)
Watershed-wide FEMA LOMC locations
Watershed-wide FEMA Locations of RL/SRL
Watershed-wide FEMA Location of funded Grants
Watershed-wide U.S. Census Populated place and population characteristics
Watershed-wide FEMA, USGS, U.S. Department of Agriculture
Location of available or planned areas of updated Light Detection and Ranging System (LiDAR) or other topographic data
Watershed-wide State of Arkansas GIS Office
Corporate limits, parks, reserve boundaries, current transportation features, land use categories, Congressional boundaries, imagery
Watershed-wide USGS Watershed HUC boundaries, NHD streams, stream gage information
Arkansas River USACE Levee and structure locations with effective modeling
Fourche Creek RAMPP Draft depth of flooding analysis for Fourche Creek and overbank area around the airport
Watershed-wide FEMA Currently Accepted HMP
Watershed-wide FEMA Participation in the NFIP, Community Rating System (CRS) ratings
Watershed-wide FEMA Disaster Declarations
Watershed-wide FEMA CNMS information
Watershed-wide RAMPP Parcel values property/structure for Pulaski and Saline County
Watershed-wide Pulaski Area GIS Building footprints for Pulaski County and updated parcel boundaries
City of Bryant Saline County Available updated topographic information
18
Table 9 - Data Collection Summary – Pre-Discovery Meeting (continued)
Data Location Data Custodian Data Set Description
Lake Maumelle CAW Lake Maumelle Area - Upper LAM Watershed Management Plan
Pulaski County RAMPP All engineering backup from the FEMA library, and base map information to support the current countywide project in process
Jefferson County RAMPP All engineering backup from the FEMA library, and base map information to support the current countywide project in process
Saline County RAMPP All engineering backup from the FEMA library and MIP, and base map information to support the current countywide project in process
Grant County RAMPP All engineering backup from the FEMA library, and base map information to support the current countywide project in process
Lonoke County RAMPP Effective FIRM and FIS from the FEMA library and data available from the MIP
Perry County RAMPP Effective FIRM and FIS from the FEMA library and data available from the MIP
Faulkner County RAMPP Effective FIRM and FIS from the FEMA library and data available from the MIP
19
Table 10 - Data Collection Summary – During Discovery Meeting and Post-Meeting
Issues and Concerns Collected During the Discovery Meeting
Item Flooding Source Information Provided By Discovery Meeting Comment Summary
10.1 Watershed-wide
Arkansas State Highway and
Transportation Department
Provide information on Roads and Bridges that are regularly closed for flooding. Detailed information was provided tied to Hwy mile markers, but not spatially enabled. Having the data in GIS format would have been more useful, but the bridge elevation and information will be inputs for any future hydrologic studies.
10.2 Streams in Camp Robinson
Arkansas National Guard
Flood studies performed in-house for the Camp Robinson area have not been sent to FEMA for incorporation and review.
10.3 Lake Maumelle and Maumelle River CAW
Interested in grants for bank stabilization for the Maumelle River to assist with water quality control.
10.4 Watershed-wide FEMA Average Annualized Loss
10.4 Lake Maumelle and Maumelle River Perry County
Some clear-cutting is on-going in the upper end of the LAM Watershed in Perry County. May increase runoff downstream.
10.4 Perry County Perry County
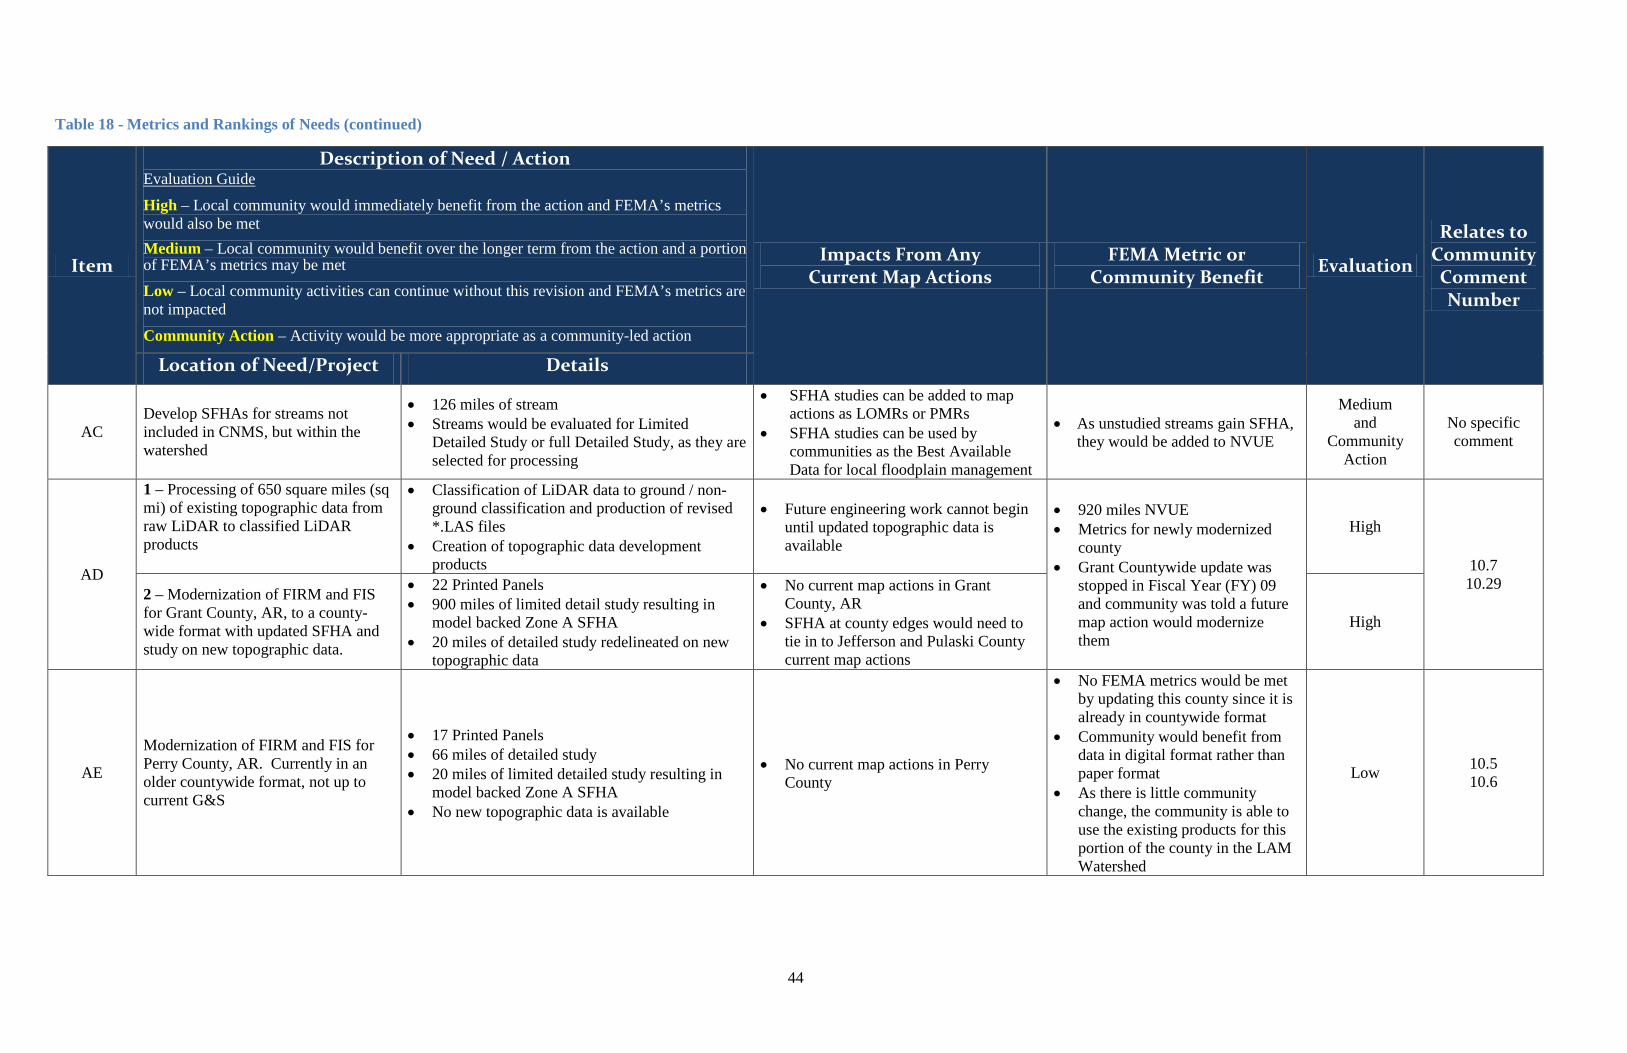
FIRMs have not been modernized. They are in a countywide format from 2000, but are not up to current G&S standards. The portion of Perry County in this watershed is not an area of high growth and development.
10.7 Grant County Grant County
FIRMs have not been modernized since the early 1990s. FIRMs are not even in countywide format. FEMA flew all new LiDAR for the County, but has not processed it. County has frequent flooding in new developments going in that are all unshaded Zone X floodplains because the maps are so out of date. Regular road closures at several locations in the LAM Watershed due to flooding.
20
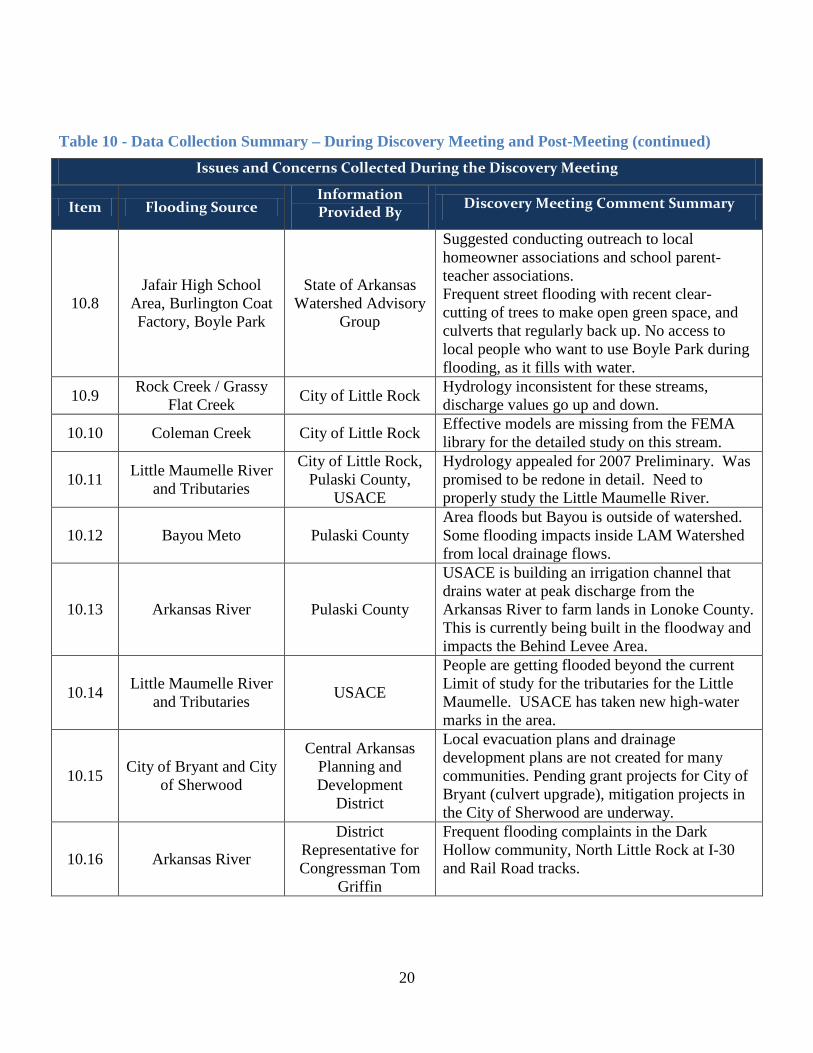
Table 10 - Data Collection Summary – During Discovery Meeting and Post-Meeting (continued) Issues and Concerns Collected During the Discovery Meeting
Item Flooding Source Information Provided By Discovery Meeting Comment Summary
10.8 Jafair High School
Area, Burlington Coat Factory, Boyle Park
State of Arkansas Watershed Advisory
Group
Suggested conducting outreach to local homeowner associations and school parent-teacher associations. Frequent street flooding with recent clear-cutting of trees to make open green space, and culverts that regularly back up. No access to local people who want to use Boyle Park during flooding, as it fills with water.
10.9 Rock Creek / Grassy Flat Creek City of Little Rock Hydrology inconsistent for these streams,
discharge values go up and down.
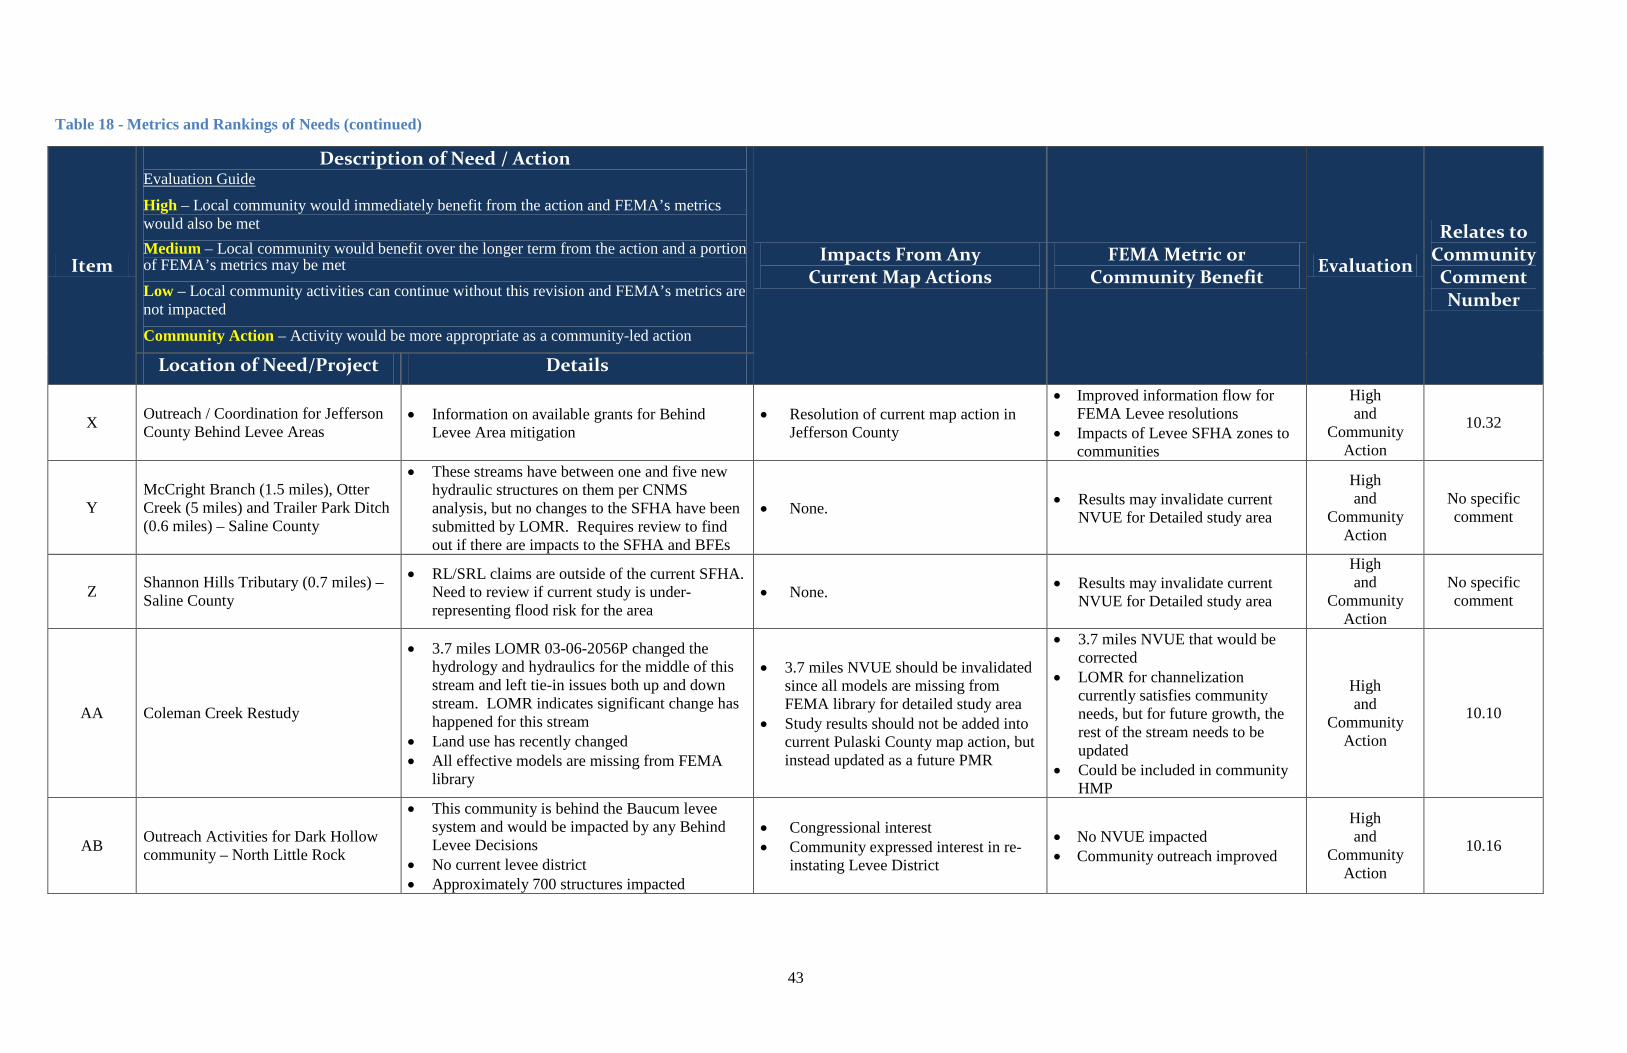
10.10 Coleman Creek City of Little Rock Effective models are missing from the FEMA library for the detailed study on this stream.
10.11 Little Maumelle River and Tributaries
City of Little Rock, Pulaski County,
USACE
Hydrology appealed for 2007 Preliminary. Was promised to be redone in detail. Need to properly study the Little Maumelle River.
10.12 Bayou Meto Pulaski County Area floods but Bayou is outside of watershed. Some flooding impacts inside LAM Watershed from local drainage flows.
10.13 Arkansas River Pulaski County
USACE is building an irrigation channel that drains water at peak discharge from the Arkansas River to farm lands in Lonoke County. This is currently being built in the floodway and impacts the Behind Levee Area.
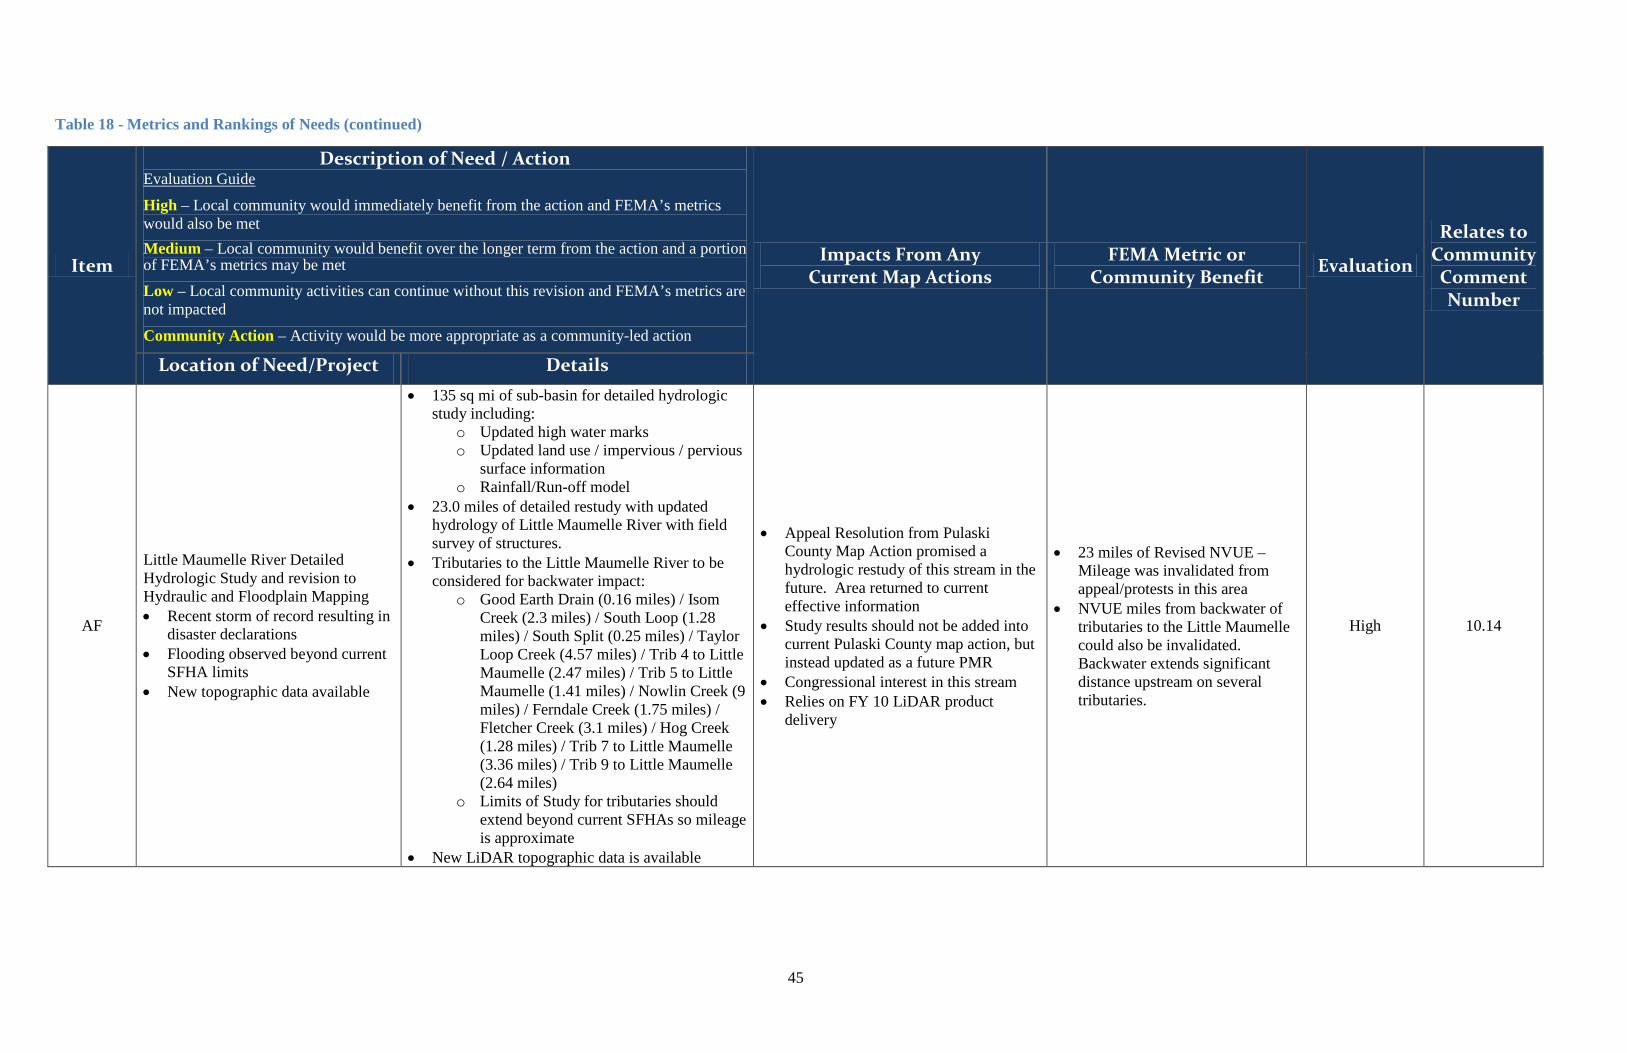
10.14 Little Maumelle River and Tributaries USACE
People are getting flooded beyond the current Limit of study for the tributaries for the Little Maumelle. USACE has taken new high-water marks in the area.
10.15 City of Bryant and City of Sherwood
Central Arkansas Planning and Development
District
Local evacuation plans and drainage development plans are not created for many communities. Pending grant projects for City of Bryant (culvert upgrade), mitigation projects in the City of Sherwood are underway.
10.16 Arkansas River
District Representative for Congressman Tom
Griffin
Frequent flooding complaints in the Dark Hollow community, North Little Rock at I-30 and Rail Road tracks.
21
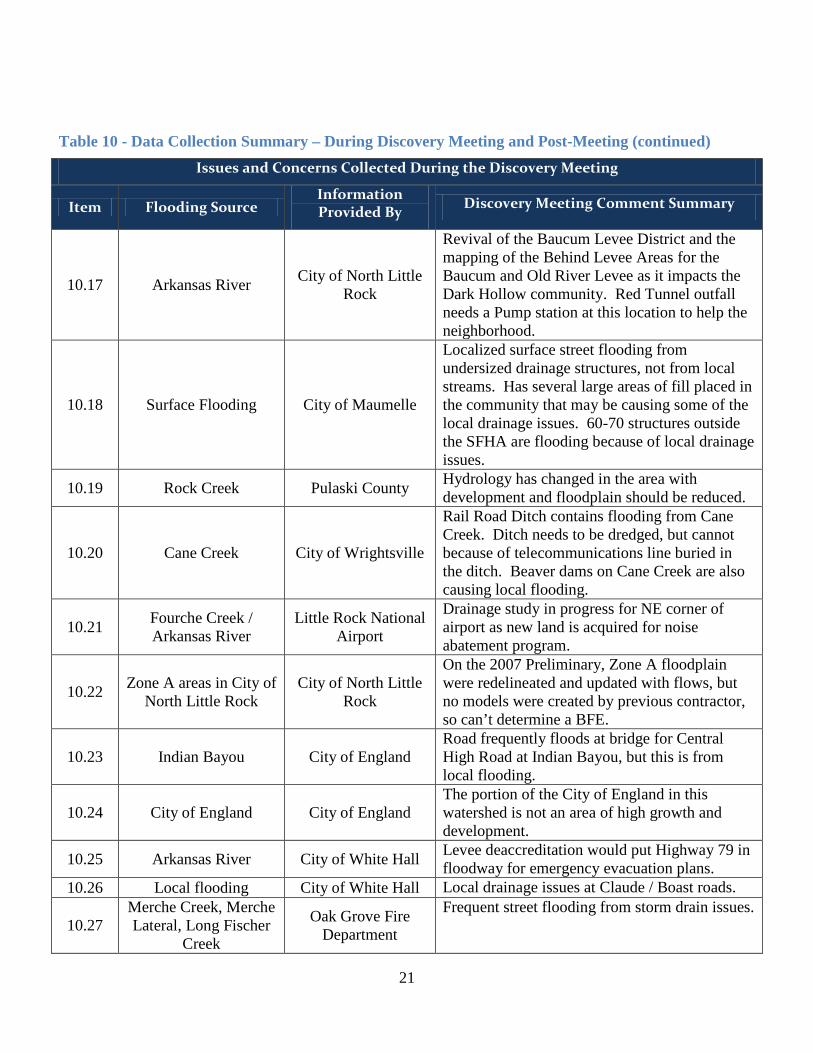
Table 10 - Data Collection Summary – During Discovery Meeting and Post-Meeting (continued) Issues and Concerns Collected During the Discovery Meeting
Item Flooding Source Information Provided By Discovery Meeting Comment Summary
10.17 Arkansas River City of North Little Rock
Revival of the Baucum Levee District and the mapping of the Behind Levee Areas for the Baucum and Old River Levee as it impacts the Dark Hollow community. Red Tunnel outfall needs a Pump station at this location to help the neighborhood.
10.18 Surface Flooding City of Maumelle
Localized surface street flooding from undersized drainage structures, not from local streams. Has several large areas of fill placed in the community that may be causing some of the local drainage issues. 60-70 structures outside the SFHA are flooding because of local drainage issues.
10.19 Rock Creek Pulaski County Hydrology has changed in the area with development and floodplain should be reduced.
10.20 Cane Creek City of Wrightsville
Rail Road Ditch contains flooding from Cane Creek. Ditch needs to be dredged, but cannot because of telecommunications line buried in the ditch. Beaver dams on Cane Creek are also causing local flooding.
10.21 Fourche Creek / Arkansas River
Little Rock National Airport
Drainage study in progress for NE corner of airport as new land is acquired for noise abatement program.
10.22 Zone A areas in City of North Little Rock
City of North Little Rock
On the 2007 Preliminary, Zone A floodplain were redelineated and updated with flows, but no models were created by previous contractor, so can’t determine a BFE.
10.23 Indian Bayou City of England Road frequently floods at bridge for Central High Road at Indian Bayou, but this is from local flooding.
10.24 City of England City of England The portion of the City of England in this watershed is not an area of high growth and development.
10.25 Arkansas River City of White Hall Levee deaccreditation would put Highway 79 in floodway for emergency evacuation plans.
10.26 Local flooding City of White Hall Local drainage issues at Claude / Boast roads.
10.27 Merche Creek, Merche Lateral, Long Fischer
Creek
Oak Grove Fire Department
Frequent street flooding from storm drain issues.
22
Table 10 - Data Collection Summary – During Discovery Meeting and Post-Meeting (continued) Issues and Concerns Collected During the Discovery Meeting
Item Flooding Source Information Provided By Discovery Meeting Comment Summary
10.28 White Oak Bayou City of Maumelle Wetland study is on-going in the area.
10.29 NE Grant County Grant County Grant 58/Delta Circle has frequent flooding FIRMs show no SFHAs in the area.
10.30 Arkansas River Jefferson County
Island Harbor Estates – Repetitive Loss Area – Bank Erosion and Wright/Broadie Bend homes flood, Knott’s Island Road flooded roads and homes, Richmond Core Road floods.
10.31 Arkansas River Jefferson County Mitigation Success – home elevated with grant.
10.32 N/A Jefferson County Would like info on Grants for outreach for Behind Levee analysis for the Arkansas River.
10.33 Jefferson County Jefferson County
The portions of the county in the LAM Watershed have very few concerns. It is mostly agricultural land and most mitigation actions have already been taken. Most of their concerns are to the watershed south of this one.
10.34 City of Pine Bluff City of Pine Bluff
The portions of the city in the LAM Watershed have very few concerns. The arsenal is on high ground and several mitigation actions have already been taken. Most of their concerns are to the watershed south of this one.
10.35 N/A Pine Bluff Chamber of Commerce
Would like more information regarding grants for commercial properties and how variances can work with the Community Assistance Visits (CAVs).
10.36 N/A City of Wrightsville Would like information on joining the NFIP
10.37 N/A City of Maumelle Would like information on how to participate in the Community Rating System (CRS) program.
10.38 N/A City of Maumelle Would like a grant to acquire GIS technology for the City to update the next HMP.
10.39 N/A City of England Would like more information on getting grants for Safe Rooms for Public Schools.
23
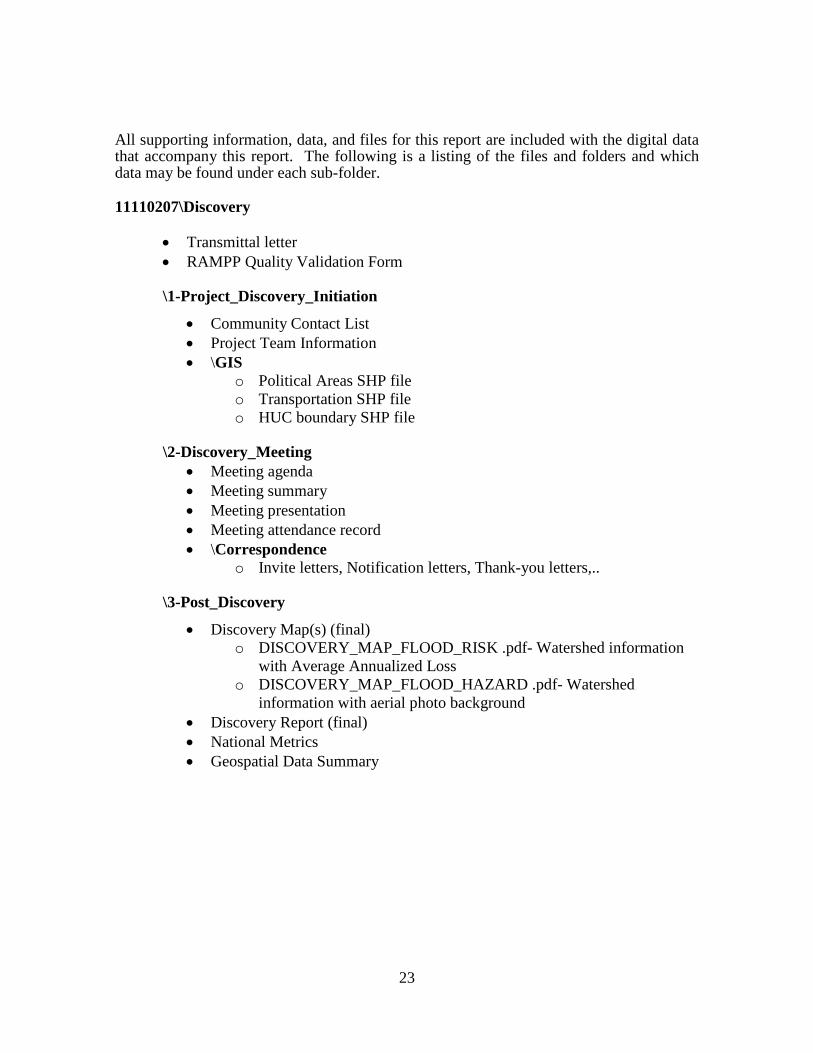
All supporting information, data, and files for this report are included with the digital data that accompany this report. The following is a listing of the files and folders and which data may be found under each sub-folder.
11110207\Discovery
• Transmittal letter • RAMPP Quality Validation Form
\1-Project_Discovery_Initiation
• Community Contact List • Project Team Information • \GIS
o Political Areas SHP file o Transportation SHP file o HUC boundary SHP file
o Invite letters, Notification letters, Thank-you letters,..
\3-Post_Discovery
• Discovery Map(s) (final) o DISCOVERY_MAP_FLOOD_RISK .pdf- Watershed information
with Average Annualized Loss o DISCOVERY_MAP_FLOOD_HAZARD .pdf- Watershed
information with aerial photo background • Discovery Report (final) • National Metrics • Geospatial Data Summary
24
\4-Supplemental_Data
• Engagement Plan • Discovery Meeting Exhibits • Discovery Meeting Data Collection Maps • Discovery Meeting Information Collection Sheets • Outreach Newsletters • Metadata file • \GIS (The following folders contain GIS Files to create Exhibits or
Discovery Maps (MXD, SHP or, PGDB/ fGDB) – ESRI ArcGIS 9.3.1) o \CNMS Maps o \Overview Maps o \Topic Maps
• \Photos o Meeting photos or video
25
III. Watershed Findings After the Discovery Meetings, additional engineering overview analysis helps focus on and more clearly identify key areas flagged as being of concern or of interest for future projects or actions in the watershed. The post-Discovery review is targeted to areas within the watershed that have been identified as having some type of mitigation action going forward. The Discovery process may have eliminated the need to further explore particular areas within the watershed, so a full analysis of all engineering concerns within the watershed is not performed after the initial Discovery process. The details provided in this section of the report add to the documents that support the need for further mitigation actions or studies in particularly streams, reaches, or communities within the watershed. For the LAM Watershed, it was apparent in the review of CNMS data and in discussion with the communities that there are concerns about particular and specific stream reaches within this watershed that are not related to the Arkansas River levee system. These areas are located primarily on the west side of the watershed in Pulaski and Saline Counties, with additional issues identified in the Grant and Lonoke areas. Perry, Faulkner, and Jefferson Counties had a limited set of engineering-related concerns noted for this watershed during the Discovery Meetings.
i. Engineering Review of Community Comments As a first step, any engineering-related comments provided by the communities during the Discovery Meetings were initially validated. Comments were reviewed in terms of hydrologic or hydraulic issues within the watershed and with any general floodplain or BFE related comments. Any supporting appeal or protest information, correspondence from communities, or anecdotal information was researched, and this report clarifies if an initial investigation of the community comments and the most recent ground conditions would warrant more detailed engineering investigation, as there may be an impact to effective SFHAs and BFEs. The most significant comment made during the LAM Discovery Meetings was that the hydrologic data for the Little Maumelle River area was incorrect and that there is often flooding beyond the currently designated SFHAs in the tributaries to the Little Maumelle River. An appeal submitted for the 2007 preliminary countywide FIRM was accepted by FEMA. An initial hydrologic study developed for the preliminary FIRM did not consider the storage effects in the downstream portions of the watershed. The preliminary discharge downstream of the Little Maumelle River was obtained using the drainage area and effective discharge ratio to extend downstream discharge. The communities felt that the discharges from this analysis were too high. In this analysis, discharges were calculated using a regression equation for this stream. For comparison, the discharge at confluence with the Arkansas River would be 18,834 cubic feet per second (cfs) from regression equation versus 43,884 cfs from the preliminary study. It would be beneficial if the effective HEC-1 model could be updated and modified at the downstream routing reach to include the effects of storage for future study and took into consideration any new high watermarks being collected by the Little Rock USACE in areas beyond the existing SFHAs. The City of Little Rock commented on the peak flow changes at the confluence of Rock Creek and Grassy Flat Creek. Effective information from these streams was also reviewed.
26
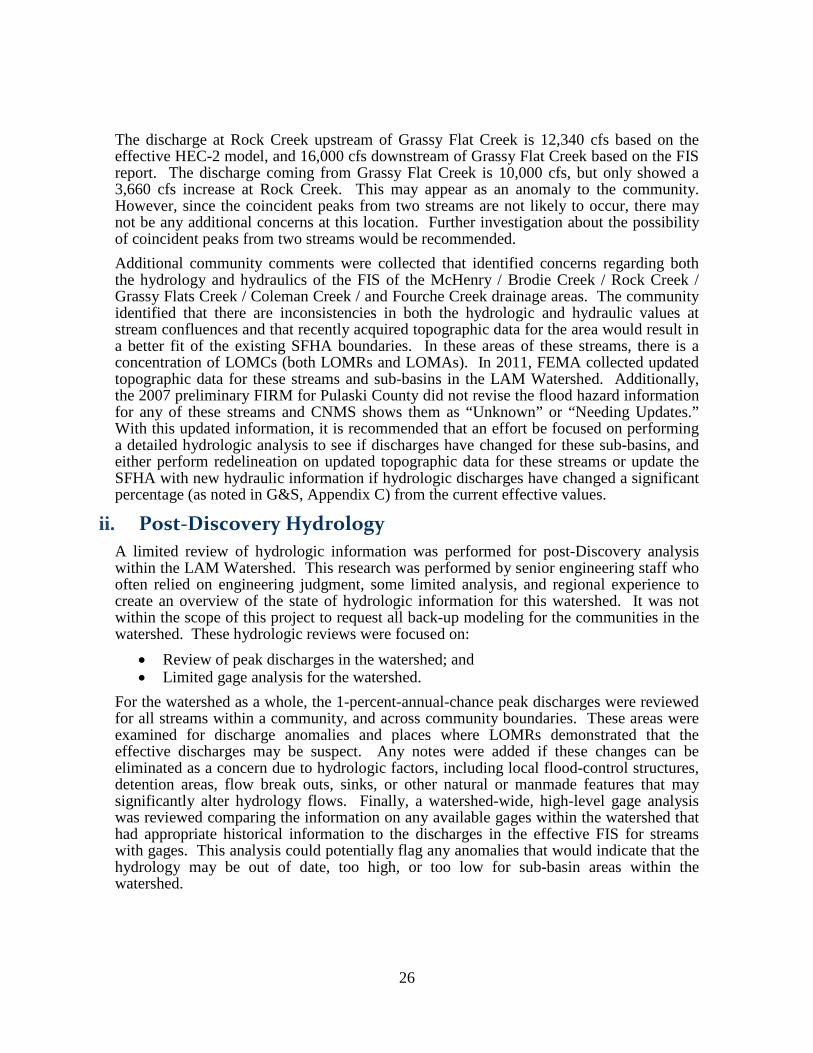
The discharge at Rock Creek upstream of Grassy Flat Creek is 12,340 cfs based on the effective HEC-2 model, and 16,000 cfs downstream of Grassy Flat Creek based on the FIS report. The discharge coming from Grassy Flat Creek is 10,000 cfs, but only showed a 3,660 cfs increase at Rock Creek. This may appear as an anomaly to the community. However, since the coincident peaks from two streams are not likely to occur, there may not be any additional concerns at this location. Further investigation about the possibility of coincident peaks from two streams would be recommended. Additional community comments were collected that identified concerns regarding both the hydrology and hydraulics of the FIS of the McHenry / Brodie Creek / Rock Creek / Grassy Flats Creek / Coleman Creek / and Fourche Creek drainage areas. The community identified that there are inconsistencies in both the hydrologic and hydraulic values at stream confluences and that recently acquired topographic data for the area would result in a better fit of the existing SFHA boundaries. In these areas of these streams, there is a concentration of LOMCs (both LOMRs and LOMAs). In 2011, FEMA collected updated topographic data for these streams and sub-basins in the LAM Watershed. Additionally, the 2007 preliminary FIRM for Pulaski County did not revise the flood hazard information for any of these streams and CNMS shows them as “Unknown” or “Needing Updates.” With this updated information, it is recommended that an effort be focused on performing a detailed hydrologic analysis to see if discharges have changed for these sub-basins, and either perform redelineation on updated topographic data for these streams or update the SFHA with new hydraulic information if hydrologic discharges have changed a significant percentage (as noted in G&S, Appendix C) from the current effective values.
ii. Post-Discovery Hydrology A limited review of hydrologic information was performed for post-Discovery analysis within the LAM Watershed. This research was performed by senior engineering staff who often relied on engineering judgment, some limited analysis, and regional experience to create an overview of the state of hydrologic information for this watershed. It was not within the scope of this project to request all back-up modeling for the communities in the watershed. These hydrologic reviews were focused on:
• Review of peak discharges in the watershed; and • Limited gage analysis for the watershed.
For the watershed as a whole, the 1-percent-annual-chance peak discharges were reviewed for all streams within a community, and across community boundaries. These areas were examined for discharge anomalies and places where LOMRs demonstrated that the effective discharges may be suspect. Any notes were added if these changes can be eliminated as a concern due to hydrologic factors, including local flood-control structures, detention areas, flow break outs, sinks, or other natural or manmade features that may significantly alter hydrology flows. Finally, a watershed-wide, high-level gage analysis was reviewed comparing the information on any available gages within the watershed that had appropriate historical information to the discharges in the effective FIS for streams with gages. This analysis could potentially flag any anomalies that would indicate that the hydrology may be out of date, too high, or too low for sub-basin areas within the watershed.
27
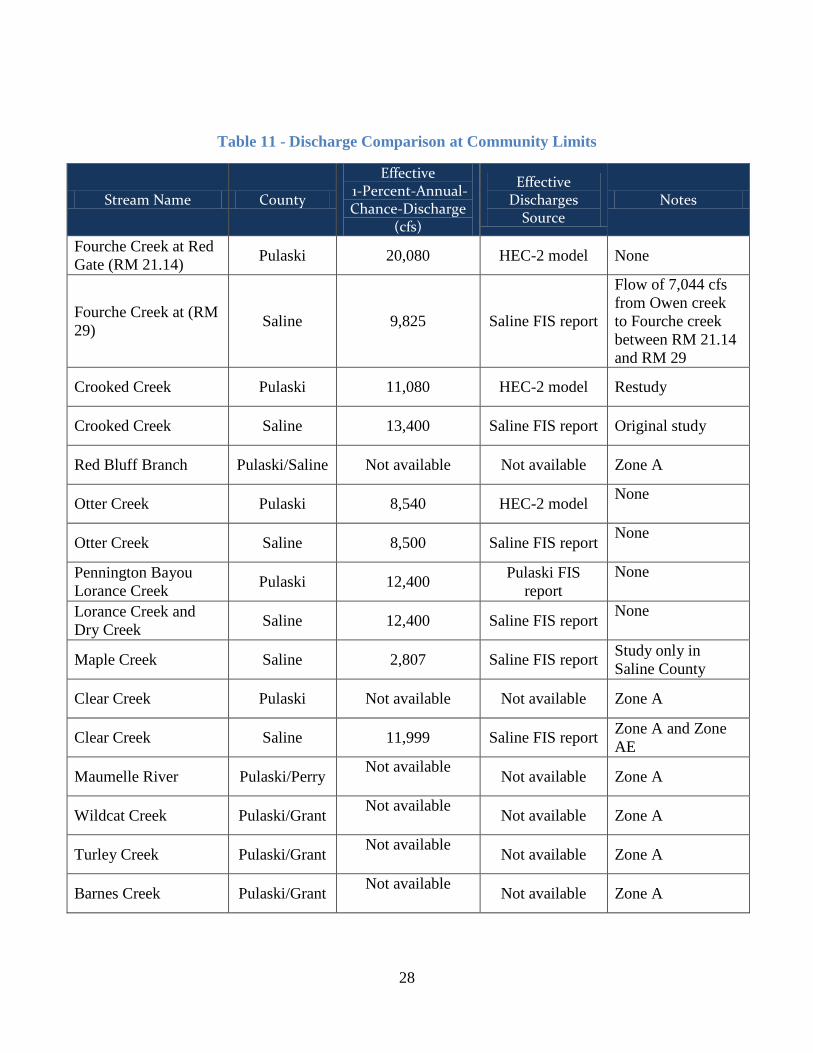
A. Review of Peak Discharges Peak discharges were reviewed based on available FIS reports, hydraulics models, flow gages, and available LOMRs within the watershed at the crossing of SHFA areas at corporate limits (County, City and Town). A comparison of discharges was made for the same streams across community boundaries in Table 11. With this analysis, it was revealed that there are discrepancies at the county boundary between Pulaski and Saline Counties at Fourche Creek and Crook Creek. No discharge discrepancies were found at streams crossing other corporate limits (City and Town) internal to each county in the watershed. Drainage areas were not included in Table 11 because the drainage areas at county boundaries are not available from FIS reports. In general, the discharges at most community and corporate limit boundaries in the LAM Watershed match well. No hydrology data is available for the streams with a Zone A designation, so these were not reviewed. Fourche Creek crosses both Pulaski and Saline Counties, with Saline County located upstream of Pulaski County. There is a concentration of LOMCs within the sub-basin of Fourche Creek in Pulaski County. An examination of the FIS for Pulaski and Saline Counties indicate that the 1-percent-annual-chance discharge is 20,080 cfs at the county boundary in Pulaski County, while the effective FIS lists this discharge as 9,825 cfs for Saline County. The 1-percent-annual-chance discharge is estimated to be 16,869 cfs at the county boundary in Saline County based on coincident peaks from Fourche Creek and Owen Creek. With this information, it is noted that the 1-percent-annual-chance discharge in Saline County may be over-estimated. Coincident peaks from Owen and Fourche Creeks are less likely to occur. However, even with this over-estimation, the 1-percent-annual-chance discharge in Saline County is lower than the discharge used in Pulaski County. Crook Creek in Pulaski County was restudied by detailed methods in 1986 and the discharges were revised. The peak 1-percent-annual-chance discharge decreased from the original study of 13,400 cfs to 11,080 cfs. However, Crook Creek in Saline County, which is upstream from Pulaski County, continues to show the original study values with a peak 1-percent-annual-chance discharge of 13,400 cfs. The mismatches seen in the hydrology for Fourche and Crook Creeks may be impacting the hydraulic analyses and may also result in floodplain and BFE mismatches that are present in the effective products at the county boundary within the LAM Watershed.
28
Table 11 - Discharge Comparison at Community Limits
Stream Name County
Effective 1-Percent-Annual-Chance-Discharge
(cfs)
Effective Discharges
Source Notes
Fourche Creek at Red Gate (RM 21.14) Pulaski 20,080 HEC-2 model None
Fourche Creek at (RM 29) Saline 9,825 Saline FIS report
Flow of 7,044 cfs from Owen creek to Fourche creek between RM 21.14 and RM 29
Crooked Creek Pulaski 11,080 HEC-2 model Restudy
Crooked Creek Saline 13,400 Saline FIS report Original study
Red Bluff Branch Pulaski/Saline Not available Not available Zone A
Otter Creek Pulaski 8,540 HEC-2 model None
Otter Creek Saline 8,500 Saline FIS report None
Pennington Bayou Lorance Creek Pulaski 12,400 Pulaski FIS
report None
Lorance Creek and Dry Creek Saline 12,400 Saline FIS report None
Maple Creek Saline 2,807 Saline FIS report Study only in Saline County
Clear Creek Pulaski Not available Not available Zone A
Clear Creek Saline 11,999 Saline FIS report Zone A and Zone AE
Maumelle River Pulaski/Perry Not available Not available Zone A
Wildcat Creek Pulaski/Grant Not available Not available Zone A
Turley Creek Pulaski/Grant Not available Not available Zone A
Barnes Creek Pulaski/Grant Not available Not available Zone A
29
Table 12 lists any LOMRs within the LAM Watershed that have an impact on hydrology. Each LOMR was reviewed. Coleman Creek was identified as having a potential mismatch between current LOMRs and the effective information. The hydrology for Coleman Creek was changed by a LOMR upstream of West 12th Street. The 1-percent-annual-chance discharge decreased from 5,650 cfs at mouth to 4,022 cfs at this location. However, this LOMR only revised Cross Section J at this location. The effective discharge of 5,650 cfs was still used upstream of Cross Section J, creating an inconsistency for this stream reach.
Table 12 -LOMRs that Revise Hydrology within the LAM Watershed
Stream Name
Case Number
LOMR Changes
Notes
Coleman Creek 03-06-2056P Hydrology and Hydraulics Channelization and two new culverts
Brodie Creek 08-06-2112P Hydrology and Hydraulics
New topography and Zone A to Zone AE at upstream end
Cloverdale Drain 03-06-697P Hydrology and Hydraulics
New topography, channelization, channel relocation, culvert, and fill
B. Frequency Analysis Frequency analyses were performed for all the gages within the LAM Watershed having more than 10 peaks. Frequency analyses was performed using PeakFQ computer software. The comparison between discharges from the FIS and the gage analysis was made and listed in Table 13. The discharges from gage analysis are significantly different from the effective FIS discharges. The number of peaks in record at gages ranges from 14 to 36. At this time, a gage frequency analysis is not recommended because of the relative low number of peaks on record.
30
Table 13 - Comparison of 1%-Annual-Chance Peak Flows of Gage Frequency Analysis and Effective Discharges
Stream Name
Drainage Area from
USGS Gage (square mile)
Effective discharges
Source
Effective 1% annual chance
discharge (cfs)
95% Confidence
limits Lower (cfs)
(Gage)
1% Annual Chance
Discharge from
PeakQ (Gage)
95% Confidence
limits Upper (cfs)
(Gage)
Number of peaks
on record
Fourche Creek at Red Gate (RM 21.14)
32.4 HEC-2 model 20,080 5,794 7,586 12,260 14
Rock Creek at 36th Street (RM 2.12)
20.5 Pulaski County
FIS report 25,000 8,811 11,520 17,570 28
Coleman Creek (RM 2.28) 1.08
Pulaski County
FIS report 4,022 1,084 1,379 2137 14
Little Maumelle River (STN 83,520)
15.0 Pulaski County
FIS report 9,110 8,472 12,130 20,060 36
Maumelle (STN 7,263,295) 46.1 N/A N/A
(Zone A) 11,110 15,370 25,800 20
Maumelle (STN 7,263,300) 137.0 N/A N/A
(Zone A) 5,762 9,454 21,940 15
iii. Post-Discovery CNMS Analysis Only Jefferson County was part of the detailed CNMS Phase 3 efforts. The other six counties were part of the Region 6 general CNMS pilot effort. Table 14 shows the detailed studied streams in the LAM Watershed that have failed one or more validation elements during the CNMS stream reach level validation process. The CNMS validation elements attempt to identify changes to the physical environment, climate, and engineering methodologies since the date of the effective analysis (different from the effective issuance date). Per the CNMS validation process, the study is considered as having an ‘Unverified’ status if one of seven critical elements fail, or if four or more of the 10 secondary elements fail during stream reach level validation. As a note, the Arkansas River is a heavily regulated stream and is excluded from this analysis.
31
Table 14 - CNMS Analysis
Stream Name County Validation Status Failed CNMS Elements Clark Bayou Pulaski Valid S4
Landmark Branch Pulaski Valid S4
Field Creek Pulaski Valid S2
Callahan Branch Pulaski Valid S3, S7
Young Creek Pulaski Valid S2
Haw Branch Pulaski Valid S3, S4, S7
Brodie Creek Pulaski Valid S2, S4
Coleman Creek Pulaski Valid S4
Rock Creek Pulaski Valid S2, S4
Panther Branch Pulaski Valid S3, S7
Rock Creek Tributary Pulaski Valid S3, S5, S7
Shilcotts Bayou Pulaski Valid S4, S5
White Oak Bayou Pulaski Valid S4
Mill Bayou Pulaski Valid S4
Otter Creek Pulaski Valid S4
Fourche Creek Pulaski Unverified C6, S2
Flat Bayou Jefferson Valid S1, S3, S10
McCright Branch Saline Valid S4
Otter Creek Saline Valid S4
Shannon Hills Tributary Saline Valid S2
Trailer Park Ditch Saline Valid S4
Arkansas River Faulkner Unverified C2
32
Table 15 provides a description of the validation elements that failed as identified in the CNMS database.
Table 15 - CNMS Category Descriptions
Element Name Issue being identified by the Element Element Description
C2 Updated and effective peak discharges differ significantly based on confidence limits criteria in FEMA G&S for Flood Hazard Mapping Partners?
This element identifies if the discharge used for the Effective studies are outside the 68 percent confidence interval for updated peak discharges based on USGS PeakFQ program using current gage data.
C6 More than five new or removed hydraulic structures (bridge/culvert) that impact BFEs?
This element identifies addition or removal of five or more hydraulic structures along the studied streams since the date of the Effective Study.
S1 Use of rural regression equations in urbanized areas?
This element attempts to flag studies in currently urban areas where rural regression equations were used for the Effective study hydrology.
S2 Repetitive losses outside the SFHA? This element fails when repetitive loses have been noted outside of the SFHA. Repetitive loses determined to be from an unmapped source, or due to local drainage issues are not considered.
S3 Increase in impervious area in sub-basin of more than 50 percent?
Failure of this element identifies a significant increase in impervious area (due to urban development since the study date) based on best available landuse-landcover data sources.
S4 More than one and less than five new or removed hydraulic structures (bridge/culvert) impacting BFEs?
This element identifies addition or removal of more than one, but less than five hydraulic structures along the studied streams since the date of the Effective Study.
S5 Channel improvements / Shoreline changes? Failure of this element identifies changes to the channel bathymetry (man-made or natural), not accounted for by a LOMC.
S7 Changes to vegetation or land use? Failure of this element identifies a significant change to overall land use changes on a HUC 12 level.
S10 New regression equations available? Failure of this element indicates updates to regression equations since the date of study for studies that used a regression analysis for hydrology.
33
A. Summary of CNMS Concerns With the above analysis, streams within the counties were further reviewed for specific concerns. In general for the LAM Watershed, the stream locations on aerial imagery were found to be within the mapped SFHAs. There has been no major addition or removal of hydraulic structures that might impact the BFEs. No significant channel fill/scour has been identified. In 2011, there have been several significant storms with Federal Disaster Declarations and research into new High Water Marks is recommended. Pulaski County:
• Clark Bayou, Landmark Branch, Haw Branch, Brodie Creek, Coleman Creek, Rock Creek, Shilcotts Bayou White Oak Bayou, Mill Bayou and Otter Creek were identified to have mismatches between the number of structures shown on the profile and imagery, thus failing element S4.
• Callahan Branch, Haw Branch, Panther Branch, and Rock Creek Tributary have experienced more than a 50 percent change to the impervious area.
• Field Creek / Fourche Creek / Young Creek / Brodie Creek / Rock Creek have RL claims outside of the SFHA. (NOTE: Exact numbers are not provided, as RL/SRL locations are protected by the Federal Privacy Act and with the limited number of residential homes in the area by these streams, it would be easy to identify these locations).
• Fourche Creek has seven new hydraulic structures added between Cross Sections D and F since the date of the effective study.
Jefferson County: • The following streams are identified to have used a non-FEMA approved
hydrologic or hydraulic method for riverine analysis: Caney Tributary No.1, Caney Tributary No.2, Carter Creek, Flat Bayou, Gamble Creek, Harding Drain, Henslee Creek, Oakland Heights Tributary, Park Creek, and School Drain. Unit hydrograph input method was used for hydrologic model estimates for all streams except Flat Bayou. Despite the fact that the unit hydrograph input is a non-standard hydrologic method, FEMA G&S identifies it to be an appropriate method to be used.
• Flat Bayou hydrology was based on regression equations. Land use around Flat Bayou has changed from rural to urban since it was studied in 1980. This may invalidate the existing rural regression equation. Additionally, updated regression equations in 1995 and large change in impervious area have rendered the hydrologic analysis invalid for Flat Bayou. These factors are attributed by failing elements S1, S3 and S10. Detailed description of these elements is provided in Table 15. NOTE: The FIS references Water Resources Circular Number 11 (Magnitude and Frequency Characteristics through 1968). Engineering judgment was used to determine that regression equations were used for hydrology.
Saline County: • McCright Branch, Otter Creek, and Trailer Park Ditch failed element S4. • Shannon Hills Tributary has RL claims outside the SFHA. (NOTE: Exact
numbers are not provided as RL/SRL locations are protected by the Federal Privacy
34
Act and with the limited number of residential homes in the area by these streams, it would be easy to identify these locations).
iv. Post-Discovery Hydraulics and Floodplain Analysis Hydraulics, floodplain, and floodways were reviewed based on the FIS reports, available hydraulic models, and FIRMs. Because of the limited scope of work for this project, a request was not made to the FEMA library to collect all hydraulic models available for this watershed. Instead, a limited search was performed for available models as stored on FEMA’s MIP. As a result of the research, no hydraulic modeling data was available for the streams in the Zone A floodplains within the watershed, and research could not conclude if any redelineated streams within the watershed were model based. Models that support Zone A areas and redelineated streams may be available in the FEMA library. The CNMS data also did not reflect any model backed Zone A areas or redelineated streams for this watershed. With this limited hydraulic analysis, and with engineering judgment, several disconnects in both BFEs and floodplain boundaries for few streams were identified, with the majority of these issues located at county boundaries. No floodway disconnects were identified in this research. Table 16 identifies any recent LOMCs in the watershed that have impacted hydraulics and may have created disconnects up and downstream.
Table 16 - LOMRs that Revise Hydraulics within the Watershed
Stream Name Case number Basis of request Notes
Rock Creek 02-06-2217P Hydraulics New Topography
Coleman Creek 03-06-2056P Hydrology and Hydraulics
Channelization and two new culverts
Brodie Creek
00-06-1210P Hydraulics Floodway boundary
08-06-2112P Hydrology and Hydraulics
New topography and Zone A to Zone AE at upstream end
Callaghan Branch 03-06-2526P Hydraulics New Topography
Cloverdale Drain 03-06-697P Hydrology and Hydraulics
New Topography, channelization, channel relocation, culvert, and fill.
Fourche Creek 06-06-B192P Hydraulics New Topography Little Maumelle River 10-06-1219P Hydraulics Floodway boundary and
New Topography Part of the Zone A floodplain upstream of Brodie Creek was changed to Zone AE by a new detailed study in LOMR Case 08-06-2112P. An effective Zone A area, which is a
35
reservoir area with open water, remains between the two LOMRs so it is reasonable to leave this disconnected area between the detailed studied floodplains. In addition to LOMRs generating disconnects in current floodplain mapping, mismatches at corporate limits or county boundaries often appear when community-based FIRMs and FISs are compiled together. Several mismatches at corporate limits are apparent including:
• Fourche Creek crosses the boundaries between Pulaski and Saline Counties at three locations. The hydraulics at the most downstream county boundary results in a discrepancy with the BFEs. The difference in BFE at the county boundary is approximately 2.5 feet. The difference in BFEs is also reflected in profiles and HEC-2 models. This discrepancy is consistent with observations in hydrology that the lower 1percent-annual-chance discharge of 16,869 cfs (estimated based on the coincident peaks of Fourche Creek and Owen creek) was used upstream at Saline County, and the higher 1-percent-annual-chance discharge of 20,080 cfs was used downstream at Pulaski County. The BFEs seem tied in well based on the FIRMs at two other places where the stream crosses county boundaries.
• Crooked Creek crosses the boundary between Pulaski and Saline Counties. The difference in BFE at the county boundary is approximately 2.0 feet. The difference in BFEs is also reflected in profiles and HEC-2 models for this stream in the two county FIS reports. This discrepancy is consistent with our observations in hydrology that a 1-percent-annual-chance discharge of 11,080 cfs was used downstream in Pulaski County, and a higher 1-percent-annual-chance discharge of 13,400 cfs was used upstream of the county line for Crooked Creek in Saline county.
• Lorance Creek crosses the boundary between Pulaski and Saline Counties at many locations. The BFE seems tied in well based on the FIRMs and profiles at the most upstream boundary between Pulaski and Saline Counties. However, the floodplain boundary does not match at this location. One boundary is slightly offset from the other boundary. The peak flows are consistent at this location.
• The Zone A floodplains do not match at the county boundary between Jefferson and Grant Counties for Turkey Creek and Barnes Creek. These two streams also have floodplains that do not match at the boundaries between Jefferson and Pulaski Counties. There are no hydrology and hydraulics data available to review for these two streams.
• The shaded Zone X-Protected by Levee floodplains do not match at the county boundary between Pulaski and Lonoke Counties. Shaded Zone X-Protected by Levee is on the Pulaski County side, and shaded Zone X is on the Lonoke County side. The floodplain needs to be revised on both sides of the county boundary based on future levee analysis.
36
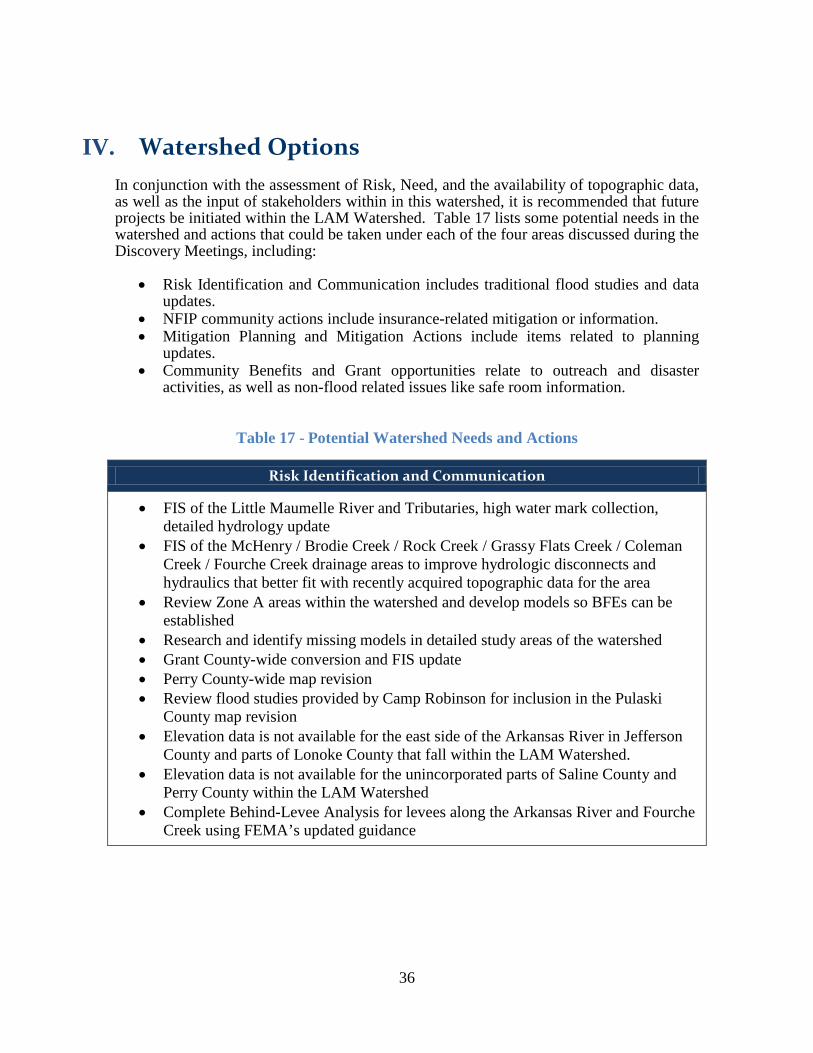
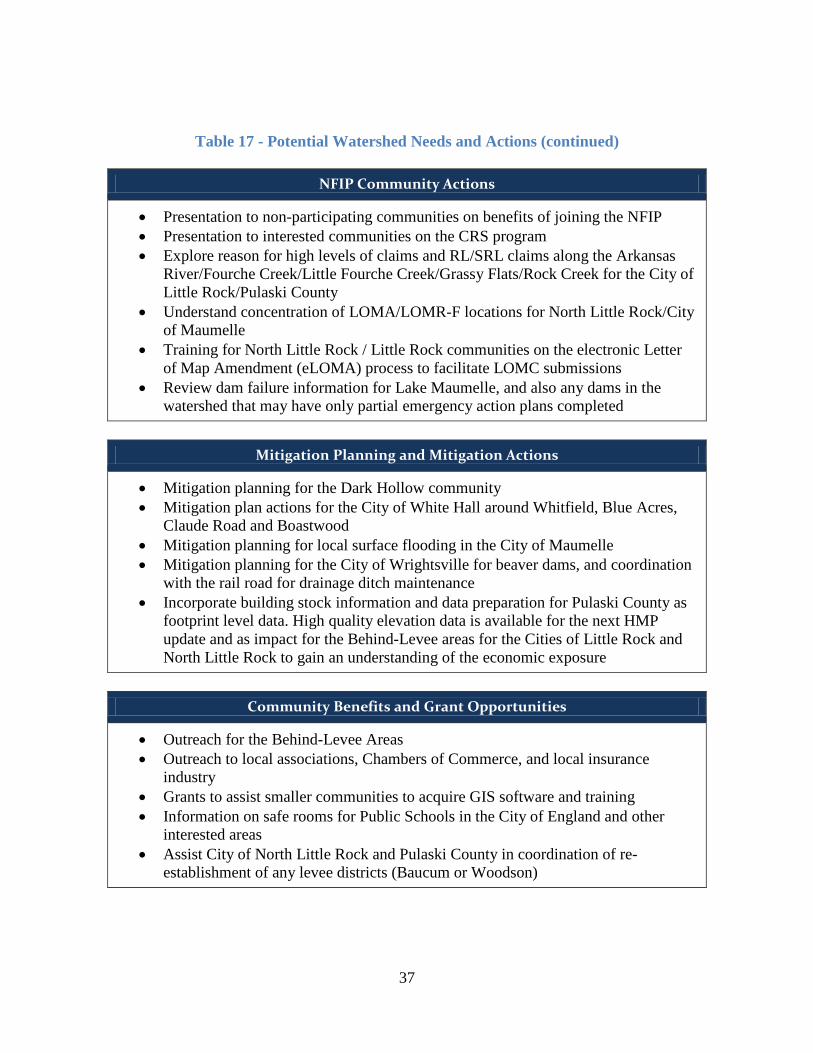
IV. Watershed Options In conjunction with the assessment of Risk, Need, and the availability of topographic data, as well as the input of stakeholders within in this watershed, it is recommended that future projects be initiated within the LAM Watershed. Table 17 lists some potential needs in the watershed and actions that could be taken under each of the four areas discussed during the Discovery Meetings, including:
• Risk Identification and Communication includes traditional flood studies and data updates.
• NFIP community actions include insurance-related mitigation or information. • Mitigation Planning and Mitigation Actions include items related to planning
updates. • Community Benefits and Grant opportunities relate to outreach and disaster
activities, as well as non-flood related issues like safe room information.
Table 17 - Potential Watershed Needs and Actions
Risk Identification and Communication
• FIS of the Little Maumelle River and Tributaries, high water mark collection, detailed hydrology update
• FIS of the McHenry / Brodie Creek / Rock Creek / Grassy Flats Creek / Coleman Creek / Fourche Creek drainage areas to improve hydrologic disconnects and hydraulics that better fit with recently acquired topographic data for the area
• Review Zone A areas within the watershed and develop models so BFEs can be established
• Research and identify missing models in detailed study areas of the watershed • Grant County-wide conversion and FIS update • Perry County-wide map revision • Review flood studies provided by Camp Robinson for inclusion in the Pulaski
County map revision • Elevation data is not available for the east side of the Arkansas River in Jefferson
County and parts of Lonoke County that fall within the LAM Watershed. • Elevation data is not available for the unincorporated parts of Saline County and
Perry County within the LAM Watershed • Complete Behind-Levee Analysis for levees along the Arkansas River and Fourche
Creek using FEMA’s updated guidance
37
Table 17 - Potential Watershed Needs and Actions (continued)
NFIP Community Actions
• Presentation to non-participating communities on benefits of joining the NFIP • Presentation to interested communities on the CRS program • Explore reason for high levels of claims and RL/SRL claims along the Arkansas
River/Fourche Creek/Little Fourche Creek/Grassy Flats/Rock Creek for the City of Little Rock/Pulaski County
• Understand concentration of LOMA/LOMR-F locations for North Little Rock/City of Maumelle
• Training for North Little Rock / Little Rock communities on the electronic Letter of Map Amendment (eLOMA) process to facilitate LOMC submissions
• Review dam failure information for Lake Maumelle, and also any dams in the watershed that may have only partial emergency action plans completed
Mitigation Planning and Mitigation Actions
• Mitigation planning for the Dark Hollow community • Mitigation plan actions for the City of White Hall around Whitfield, Blue Acres,
Claude Road and Boastwood • Mitigation planning for local surface flooding in the City of Maumelle • Mitigation planning for the City of Wrightsville for beaver dams, and coordination
with the rail road for drainage ditch maintenance • Incorporate building stock information and data preparation for Pulaski County as
footprint level data. High quality elevation data is available for the next HMP update and as impact for the Behind-Levee areas for the Cities of Little Rock and North Little Rock to gain an understanding of the economic exposure
Community Benefits and Grant Opportunities
• Outreach for the Behind-Levee Areas • Outreach to local associations, Chambers of Commerce, and local insurance
industry • Grants to assist smaller communities to acquire GIS software and training • Information on safe rooms for Public Schools in the City of England and other
interested areas • Assist City of North Little Rock and Pulaski County in coordination of re-
establishment of any levee districts (Baucum or Woodson)
38
To add more detail to the list of needs captured in Table 10 during the Discovery meeting and in any follow-up correspondence, Table 18 provides some specific evaluations of streams or areas that could benefit from additional study. Additionally, any FEMA-based metrics are noted that would be met if the need or issue was addressed and if any current FEMA map actions would impact the activity. Any comment or concern raised by a stakeholder during the Discovery process that could be tied to one of the Needs or Actions for the watershed is also noted. There are some Needs/Actions listed that were not noted by any particular community, but were improvements that could be made in the LAM Watershed to meet general FEMA Regional goals. Needs are identified as being on the critical path as high, medium, or low priority, or as something that a State or local community could be tasked with completing. These definitions are also included in Table 18.
• High – Local community would immediately benefit from the action and FEMA’s metrics would also be met
• Medium – Local community would benefit over the longer term from the action and a portion of FEMA’s metrics may be met
• Low – Local community activities can continue without this revision and FEMA’s metrics are not impacted
• Community Action – Activity would be more appropriate as a community-led action rather than a FEMA-led action
39
Table 18 - Metrics and Rankings of Needs
Item
Description of Need / Action
High – Local community would immediately benefit from the action and FEMA’s metrics would also be met
Evaluation Guide
Medium – Local community would benefit over the longer term from the action and a portion of FEMA’s metrics may be met Low – Local community activities can continue without this revision and FEMA’s metrics are not impacted
Community Action – Activity would be more appropriate as a community-led action
Impacts From Any Current Map Actions
FEMA Metric or Community Benefit Evaluation
Relates to Community Comment Number
Location of Need/Project Details
A Review of studies and creation of LOMR submittals for Camp Robinson
• Several Limited Detailed studies of streams in Camp Robinson were performed by the AR National Guard
• Packages have not been reviewed for FEMA G&S, but are used for local best available data
• Studies are outside of the LAM Watershed, but as Camp Robinson touches the watershed they were mentioned
• New topographic data available for enhancing studies
• Study results should not be added into current Pulaski County map action, but instead updated as a future Physical Map Revision (PMR) or handled as individual LOMRs if appropriate
• Restudy areas are not in the LAM Watershed
• NVUE for all streams receiving new SFHA – No current SFHAs in Camp Robinson
Community Action 10.2
B Outreach / Coordination with Railroads for local ditch cleaning – City of Wrightsville
• Community frequently has local flooding problems from railroad ditches not being maintained
• May be larger issue than just the City of Wrightsville
• Added to concern/activity in community HMP update
• No NVUE impacted • Community outreach improved
Community Action 10.20
C Limited Detailed Modeling for Zone A areas in the Watershed
• No Zone A areas are model-based in the watershed
• As Zone A SFHAs are reviewed by communities, if funding is not available to update these to Detailed Study areas, then Limited Detailed models should be developed so a BFE is generally established for the SFHA
• Study results should not be incorporated in current map actions as the models will be for local use and as best available data. SFHA to remain Zone A, so no change from current FIRM
• Community could perform Ad Hoc and as needed
• As stream miles are changed to model-based Zone A, NVUE mileage would be changed to Valid
Community Action 10.22
D Outreach / Coordination to join NFIP program
• City of Wrightsville expressed interest in joining the NFIP
• Ordinance updates
• Should be done before Pulaski County Map Action is complete
• Additional communities in NFIP • Community outreach improved
Community Action 10.36
40
Table 18 - Metrics and Rankings of Needs (continued)
Item
Description of Need / Action
High – Local community would immediately benefit from the action and FEMA’s metrics would also be met
Evaluation Guide
Medium – Local community would benefit over the longer term from the action and a portion of FEMA’s metrics may be met Low – Local community activities can continue without this revision and FEMA’s metrics are not impacted
Community Action – Activity would be more appropriate as a community-led action
Impacts From Any Current Map Actions
FEMA Metric or Community Benefit Evaluation
Relates to Community Comment Number
Location of Need/Project Details
E Outreach / Coordination to join NFIP program
• City of Cammack Village information to join the NFIP
• Ordinance updates
• Should be done before Pulaski County Map Action is complete
• Additional communities in NFIP • Community outreach improved
Community Action
No specific comment
F Outreach / Coordination to join CRS program
• Several communities expressed interest in joining CRS • None • Community outreach improved Community
Action 10.37
G Pulaski County Parcel information update for HAZUS
• Prepare local parcel footprints to run as User Defined Features (UDF) in HAZUS for future Risk MAP products
• None • HAZUS runs would benefit HMP update
Community Action
No specific comment
H State of Arkansas Road and Bridge Closures in GIS
• The State of Arkansas can provide historical road and bridge closure by Highway mile marker, date, and event information, but it is not in a geospatial format.
• None
• Engineering studies throughout the watershed would benefit from this historical information in a geospatial format to relate to streams
• Could be used to identify locations for mitigation projects
Community Action 10.1
I Outreach / Coordination for Grants program information
• Several communities expressed interested in finding out about all FEMA grants and the requirements for each grant in more detail
• Grants for HMP updates • Grants for Safe Rooms • Grants for software like GIS
• None • Community outreach improved Community Action
10.38 10.39
J Hazard Mitigation Plan Updates
• Communities should update their HMP any time flood hazard risks change
• Communities should develop mitigation strategies in an on-going fashion
• Update with mitigation successes to show work completed
• None
• Impacts all communities • Facilitate the application for HMP
Grants • Expedite the Grant approval
process
Community Action
10.24 10.25 10.30 10.31 10.33 10.34
41
Table 18 - Metrics and Rankings of Needs (continued)
Item
Description of Need / Action
High – Local community would immediately benefit from the action and FEMA’s metrics would also be met
Evaluation Guide
Medium – Local community would benefit over the longer term from the action and a portion of FEMA’s metrics may be met Low – Local community activities can continue without this revision and FEMA’s metrics are not impacted
Community Action – Activity would be more appropriate as a community-led action
Impacts From Any Current Map Actions
FEMA Metric or Community Benefit Evaluation
Relates to Community Comment Number
Location of Need/Project Details
K Outreach / Coordination for Grant opportunities
• Provide information to CAW on eligibility and process to apply for Grants to assist with bank stabilization for Lake Maumelle or the Maumelle River to support water quality control
• None • None Community Action 10.3
L Outreach
• Information to the neighborhoods around Boyle Park about the purpose of flood-control structures
• Information to people who want to use the park for activities, but cannot during flood events as it is full of water
• None
• Communities may benefit from fewer complaints in the area if neighborhoods are educated as to the role of flood-control structures
Community Action 10.8
M Outreach / Coordination for Emergency Managers
• City of Bryant update evacuation plans and drainage development as a result of recent grants for culvert upgrades
• None • Updated Emergency evacuation
plan as a result of completing activities funded by Grants
Community Action 10.15
N Outreach / Coordination for Emergency Managers
• City of Sherwood update evacuation plans and drainage development as a result of recent grants for culvert upgrades
• None • Updated Emergency evacuation
plan as a result of completing activities funded by Grants
Community Action 10.15
O Outreach / Coordination for Emergency Managers
• City of Whitehall update evacuation plans and drainage development as a result of recent grants for culvert upgrades
• None • Updated Emergency evacuation
plan as a result of completing activities funded by Grants
Community Action 10.25
P Baucum Levee
• Revival of the Baucum Levee District to manage Behind Levee areas and maintain levee
• Manage Red Tunnel outfall and pump station improvements
• None • None Community Action 10.17
Q Local flooding in the City of Maumelle
• Mitigate localized surface street flooding from undersized drainage structures
• Follow the LOMR process if any map changes result
• Community mitigate local flooding concerns from culverts or drainage issues
• Grant application for assistance in mitigation
• Update HMP to reflect issues
Community Action 10.18
42
Table 18 - Metrics and Rankings of Needs (continued)
Item
Description of Need / Action
High – Local community would immediately benefit from the action and FEMA’s metrics would also be met
Evaluation Guide
Medium – Local community would benefit over the longer term from the action and a portion of FEMA’s metrics may be met Low – Local community activities can continue without this revision and FEMA’s metrics are not impacted
Community Action – Activity would be more appropriate as a community-led action
Impacts From Any Current Map Actions
FEMA Metric or Community Benefit Evaluation
Relates to Community Comment Number
Location of Need/Project Details
R Little Rock Airport
• New drainage study in process for land to be acquired by the airport
• LOMR may be appropriate if any construction projects are started as a result of the drainage study
• Follow the LOMR process if any map changes result • None Community
Action 10.21
S Local flooding in the City of Whitehall • Mitigate localized surface street flooding from undersized drainage structures or roads
• Follow the LOMR process if any map changes result
• Community mitigate local flooding concerns from culverts or drainage issues
• Grant application for assistance in mitigation
• Update HMP to reflect issues
Community Action 10.26
T Local flooding in the City of North Little Rock
• Mitigate localized surface street flooding from undersized drainage structures, storm drains, or roads around Merche Creek and Merche Creek Lateral
• Follow the LOMR process if any map changes result
• Community mitigate local flooding concerns from culverts or drainage issues
• Grant application for assistance in mitigation
• Update HMP to reflect issues
Community Action 10.27
U Wetland areas in City of Maumelle • Complete on-going study of wetland management • None • Better data for local floodplain
management Community
Action 10.28
V Outreach / Coordination for the City of Pine Bluff and Chamber of Commerce
• Provide information on Grants a local business can apply for
• Information on how variances work and how they impact a CRS rating and CAVs
• None • Business side of community more
involved in the results of the floodplain mapping process
Community Action 10.35
W Outreach / Coordination • Communities to coordinate with USACE for
information regarding the irrigation channel from the Arkansas River to Lonoke County
• Examine impact to Behind Levee Analysis for the Arkansas River for any current Map Actions in Pulaski and Lonoke counties
• Community involved in the process for the irrigation channel from the Arkansas River to Lonoke County
Medium and
Community Action
10.13
43
Table 18 - Metrics and Rankings of Needs (continued)
Item
Description of Need / Action
High – Local community would immediately benefit from the action and FEMA’s metrics would also be met
Evaluation Guide
Medium – Local community would benefit over the longer term from the action and a portion of FEMA’s metrics may be met Low – Local community activities can continue without this revision and FEMA’s metrics are not impacted
Community Action – Activity would be more appropriate as a community-led action
Impacts From Any Current Map Actions
FEMA Metric or Community Benefit Evaluation
Relates to Community Comment Number
Location of Need/Project Details
X Outreach / Coordination for Jefferson County Behind Levee Areas
• Information on available grants for Behind Levee Area mitigation
• Resolution of current map action in Jefferson County
• Improved information flow for FEMA Levee resolutions
• Impacts of Levee SFHA zones to communities
High and
Community Action
10.32
Y McCright Branch (1.5 miles), Otter Creek (5 miles) and Trailer Park Ditch (0.6 miles) – Saline County
• These streams have between one and five new hydraulic structures on them per CNMS analysis, but no changes to the SFHA have been submitted by LOMR. Requires review to find out if there are impacts to the SFHA and BFEs
• None. • Results may invalidate current NVUE for Detailed study area
High and
Community Action
No specific comment
Z Shannon Hills Tributary (0.7 miles) – Saline County
• RL/SRL claims are outside of the current SFHA. Need to review if current study is under-representing flood risk for the area
• None. • Results may invalidate current NVUE for Detailed study area
High and
Community Action
No specific comment
AA Coleman Creek Restudy
• 3.7 miles LOMR 03-06-2056P changed the hydrology and hydraulics for the middle of this stream and left tie-in issues both up and down stream. LOMR indicates significant change has happened for this stream
• Land use has recently changed • All effective models are missing from FEMA
library
• 3.7 miles NVUE should be invalidated since all models are missing from FEMA library for detailed study area
• Study results should not be added into current Pulaski County map action, but instead updated as a future PMR
• 3.7 miles NVUE that would be corrected
• LOMR for channelization currently satisfies community needs, but for future growth, the rest of the stream needs to be updated
• Could be included in community HMP
High and
Community Action
10.10
AB Outreach Activities for Dark Hollow community – North Little Rock
• This community is behind the Baucum levee system and would be impacted by any Behind Levee Decisions
• No current levee district • Approximately 700 structures impacted
• Congressional interest • Community expressed interest in re-
instating Levee District
• No NVUE impacted • Community outreach improved
High and
Community Action
10.16
44
Table 18 - Metrics and Rankings of Needs (continued)
Item
Description of Need / Action
High – Local community would immediately benefit from the action and FEMA’s metrics would also be met
Evaluation Guide
Medium – Local community would benefit over the longer term from the action and a portion of FEMA’s metrics may be met Low – Local community activities can continue without this revision and FEMA’s metrics are not impacted
Community Action – Activity would be more appropriate as a community-led action
Impacts From Any Current Map Actions
FEMA Metric or Community Benefit Evaluation
Relates to Community Comment Number
Location of Need/Project Details
AC Develop SFHAs for streams not included in CNMS, but within the watershed
• 126 miles of stream • Streams would be evaluated for Limited
Detailed Study or full Detailed Study, as they are selected for processing
• SFHA studies can be added to map actions as LOMRs or PMRs
• SFHA studies can be used by communities as the Best Available Data for local floodplain management
• As unstudied streams gain SFHA, they would be added to NVUE
Medium and
Community Action
No specific comment
AD
1 – Processing of 650 square miles (sq mi) of existing topographic data from raw LiDAR to classified LiDAR products
• Classification of LiDAR data to ground / non-ground classification and production of revised *.LAS files
• Creation of topographic data development products
• Future engineering work cannot begin until updated topographic data is available
• 920 miles NVUE • Metrics for newly modernized
county • Grant Countywide update was
stopped in Fiscal Year (FY) 09 and community was told a future map action would modernize them
High
10.7 10.29
2 – Modernization of FIRM and FIS for Grant County, AR, to a county-wide format with updated SFHA and study on new topographic data.
• 22 Printed Panels • 900 miles of limited detail study resulting in
model backed Zone A SFHA • 20 miles of detailed study redelineated on new
topographic data
• No current map actions in Grant County, AR
• SFHA at county edges would need to tie in to Jefferson and Pulaski County current map actions
High
AE
Modernization of FIRM and FIS for Perry County, AR. Currently in an older countywide format, not up to current G&S
• 17 Printed Panels • 66 miles of detailed study • 20 miles of limited detailed study resulting in
model backed Zone A SFHA • No new topographic data is available
• No current map actions in Perry County
• No FEMA metrics would be met by updating this county since it is already in countywide format
• Community would benefit from data in digital format rather than paper format
• As there is little community change, the community is able to use the existing products for this portion of the county in the LAM Watershed
Low 10.5 10.6
45
Table 18 - Metrics and Rankings of Needs (continued)
Item
Description of Need / Action
High – Local community would immediately benefit from the action and FEMA’s metrics would also be met
Evaluation Guide
Medium – Local community would benefit over the longer term from the action and a portion of FEMA’s metrics may be met Low – Local community activities can continue without this revision and FEMA’s metrics are not impacted
Community Action – Activity would be more appropriate as a community-led action
Impacts From Any Current Map Actions
FEMA Metric or Community Benefit Evaluation
Relates to Community Comment Number
Location of Need/Project Details
AF
Little Maumelle River Detailed Hydrologic Study and revision to Hydraulic and Floodplain Mapping • Recent storm of record resulting in
disaster declarations • Flooding observed beyond current
SFHA limits • New topographic data available
• 135 sq mi of sub-basin for detailed hydrologic study including:
o Updated high water marks o Updated land use / impervious / pervious
surface information o Rainfall/Run-off model
• 23.0 miles of detailed restudy with updated hydrology of Little Maumelle River with field survey of structures.
• Tributaries to the Little Maumelle River to be considered for backwater impact:
o Good Earth Drain (0.16 miles) / Isom Creek (2.3 miles) / South Loop (1.28 miles) / South Split (0.25 miles) / Taylor Loop Creek (4.57 miles) / Trib 4 to Little Maumelle (2.47 miles) / Trib 5 to Little Maumelle (1.41 miles) / Nowlin Creek (9 miles) / Ferndale Creek (1.75 miles) / Fletcher Creek (3.1 miles) / Hog Creek (1.28 miles) / Trib 7 to Little Maumelle (3.36 miles) / Trib 9 to Little Maumelle (2.64 miles)
o Limits of Study for tributaries should extend beyond current SFHAs so mileage is approximate
• New LiDAR topographic data is available
• Appeal Resolution from Pulaski County Map Action promised a hydrologic restudy of this stream in the future. Area returned to current effective information
• Study results should not be added into current Pulaski County map action, but instead updated as a future PMR
• Congressional interest in this stream • Relies on FY 10 LiDAR product
delivery
• 23 miles of Revised NVUE – Mileage was invalidated from appeal/protests in this area
• NVUE miles from backwater of tributaries to the Little Maumelle could also be invalidated. Backwater extends significant distance upstream on several tributaries.
High 10.14
46
Table 18 - Metrics and Rankings of Needs (continued)
Item
Description of Need / Action
High – Local community would immediately benefit from the action and FEMA’s metrics would also be met
Evaluation Guide
Medium – Local community would benefit over the longer term from the action and a portion of FEMA’s metrics may be met Low – Local community activities can continue without this revision and FEMA’s metrics are not impacted
Community Action – Activity would be more appropriate as a community-led action
Impacts From Any Current Map Actions
FEMA Metric or Community Benefit Evaluation
Relates to Community Comment Number
Location of Need/Project Details
AG
Fourche Creek and Tributaries Detailed Hydrologic Study and revision to Hydraulic modeling and Floodplain Mapping
• Community concerns about hydrology
• Mismatch of hydrology at Pulaski/Saline County boundary
• Community concerns about disconnects in hydraulics
• New topographic data available • Concentration RL / SRL cases • Concentration of LOMC
activity
• Validation of current hydrology against regression equations 385 sq mi
• Detailed study of stream segments if hydrology shows significant change from effective discharges or redelineation of existing SFHA on updated topographic data
• Detailed Studied Streams o McHenry (18 miles) / Brodie Creek (12.7
miles) / Rock Creek (26 miles) / Grassy Flat Creek (10 miles) / Coleman Creek / Fourche Creek (50 miles)
• Multiple Protests from Pulaski County Map Action in this area
• Study results should not be added into current Pulaski County Map Action, but instead updated as a future PMR
• Relies on FY 09 LiDAR product
• 117 miles Revised NVUE – Mileage may need to be invalidated from current CNMS if discharges show significant differences from effective
• Local expertise and subject matter knowledge could make this a good joint project with Cooperating Technical Partner and FEMA sharing activities
High 10.9 10.19
AH
Resolve Hydrology mismatches at county boundaries (Jefferson, Pulaski, Saline) Terrain data is updated for Pulaski County only; Jefferson and Saline do not have updated topographic data
• Crook Creek – 12 sq mi hydrology / 7.4 miles hydraulics detailed study
• Lorance Creek – 14 miles hydraulic detailed study
• Turkey, Barnes and Wild Cat Creeks – 37 sq miles / Zone A areas not model-based
• Study results should not be added into current map action, but instead updated as a future PMR
• Results may invalidate current NVUE for Detailed study area
• Would create Limited Detailed Zone A models
• Should be updated if development or growth starts again in these areas
Medium 10.11
AI Pulaski / Lonoke / Jefferson Counties Behind Levee Zone mismatch • Old River Levee, Plum Bayou Levee systems
• Should be incorporated in current Map Actions for Pulaski and Jefferson Counties
• PMR should be initiated for Lonoke Behind Levee Floodplain Resolution that extends into that county for tie-in
• No NVUE is impacted • Would resolve any remapping or
disconnects with Behind Levee Floodplain analysis for the Arkansas River
High No specific comment
47
Table 18 - Metrics and Rankings of Needs (continued)
Item
Description of Need / Action
High – Local community would immediately benefit from the action and FEMA’s metrics would also be met
Evaluation Guide
Medium – Local community would benefit over the longer term from the action and a portion of FEMA’s metrics may be met Low – Local community activities can continue without this revision and FEMA’s metrics are not impacted
Community Action – Activity would be more appropriate as a community-led action
Impacts From Any Current Map Actions
FEMA Metric or Community Benefit Evaluation
Relates to Community Comment Number
Location of Need/Project Details
AJ Completion of Map Mod activities in Pulaski County to countywide DFIRM
• Process to update Pulaski County to a countywide product has been in process since 2004.
• Non-Levee communities would like their updated products
• Non-levee areas are on hold while levee panels are being held for Revised Preliminary with Resolution for Behind Levee Areas
• NVUE already counted for the preliminary for this county
• Approximately 200,000 population within a modernized effective map
High No specific comment
AK eLOMA workshop • Hold a series of eLOMA workshops for local organizations or meetings
• More LOMA submittals using the digital form rather than paper • Community outreach improved Medium No specific
comment
AL Outreach / Coordination • Provide the information from the Average
Annualized Loss study • Introduction to HAZUS training
• None
• Communities become more familiar with the Hazus program and are prepared to use Risk MAP products when they are issued
• HAZUS can be used for HMP updates
Low 10.4
AM Update CNMS for Bayou Meto information
• Add flags in CNMS that indicate that Bayou Meto is also causing local flooding issues
• Will add additional weight to raise the need for a Discovery project in the Bayou Meto watershed