70
Discrete Event Simulation of Outpatient Flow in a Phlebotomy Clinic Ajaay Chandrasekaran May 22, 2016

Discrete Event Simulation of
Outpatient Flow in a Phlebotomy Clinic
Ajaay Chandrasekaran
May 22, 2016

Agenda
• The Team
• UMHS Comprehensive Cancer Center
• Phlebotomy
– Overview
– Simulation Design
– Process Flow Scenarios
• Future Steps
2

The Team
3
Hassan Abbas Nursing Student
Jeremy Castaing, PhD Candidate Industrial and Operations Engineering
Chhavi Chaudhry Industrial and Operations Engineering
Amy Cohn, PhD Associate Director, CHEPS
Diane Drago Patient & Family Advisory Board (PFAB)
Marian Grace Boxer, MD Professor, Internal Med., Hematology/Oncology
Corinne Hardecki, RN Clinical Care Coordinator, Infusion
Madalina Jiga Nursing Student
John Li Industrial and Operations Engineering
Brittany Lopez Industrial and Operations Engineering
Pamela Martinez Villarreal, MSE Industrial and Operations Engineering
Jennifer Mathie Supervisor, Department of Pathology

Jonathon McCormick Industrial and Operations Engineering
Carol McMahon, RN Nurse Supervisor, Infusion
Harry Neusius Manager, Department of Pathology
Elizabeth Olin Industrial and Operations Engineering
Donald Richardson, PhD Pre-Candidate Industrial and Operations Engineering
Matthew Rouhana, MSE Industrial and Operations Engineering
Stephanie See, RN Nursing Graduate
Renee Stoklosa Associate Supervisor, Department of Pathology
Brooke Szymanski, RN Nursing Graduate
Irene Turkewycz, RN Nurse Manager, Infusion
Carolina Typaldos, MHSA Operations Manager, Infusion
Alon Zadok Weizer, MD, MS Medical Director, UMCCC
Jonathan Zhou Pre-Medical Student
The Team (Cont.)
4

– Home to 17 multidisciplinary and 10 specialty clinics, which are organized by cancer type
– In 2015, over 50% of outpatient visits in the UMCCC
resulted in chemotherapy infusion treatments: • 97,147 outpatient visits • 58,419 infusion treatments
– High outpatient demand for infusion causes:
• increased patient waiting times • overworked staff
Source:
U of M Comprehensive Cancer Center (2016)
http://www.mcancer.org
5
UMHS Comprehensive Cancer Center

Infusion Overview
6
Patient Flow
Information Flow
Material Flow
Phlebotomy Patient
Arrives Clinic Infusion
Patient
Discharged

Infusion Overview
Lab
Processing
Phlebotomy Patient
Arrives Clinic
Pharmacy
Infusion Patient
Discharged
Patient Flow
Information Flow
Material Flow 7

Potential Delays at Infusion
8
• Patient is late; no infusion chairs are available
• Infusion drugs are unavailable
Infusion
DELAY
DELAY
Pharmacy
DELAY
Patient Flow
Information Flow
Material Flow

Potential Delays at Clinic
9
Clinic DELAY
DELAY
DELAY
Patient Flow
Information Flow
Material Flow
• Patient is late; clinicians are meeting other patients
• Patient blood draw results are not ready for clinician
• Drug can’t be mixed until approval of patient’s infusion

Enter: Phlebotomy
10
Patient Flow
Information Flow
Material Flow
Phlebotomy DELAY
DELAY
DELAY
Causes for delays:
• Patient is late by their own volition
• The phlebotomy process itself
DELAY

Problem
Lab
Processing
Phlebotomy Patient
Arrives Clinic
Pharmacy
Infusion Patient
Discharged
DELAY
DELAY
DELAY
DELAY
DELAY
DELAY
DELAY
DELAY
11
Delays in phlebotomy can ripple through the system
Patient Flow
Information Flow
Material Flow

Our Goal
12
Reduce patient waiting times at
phlebotomy to alleviate overarching
system delays

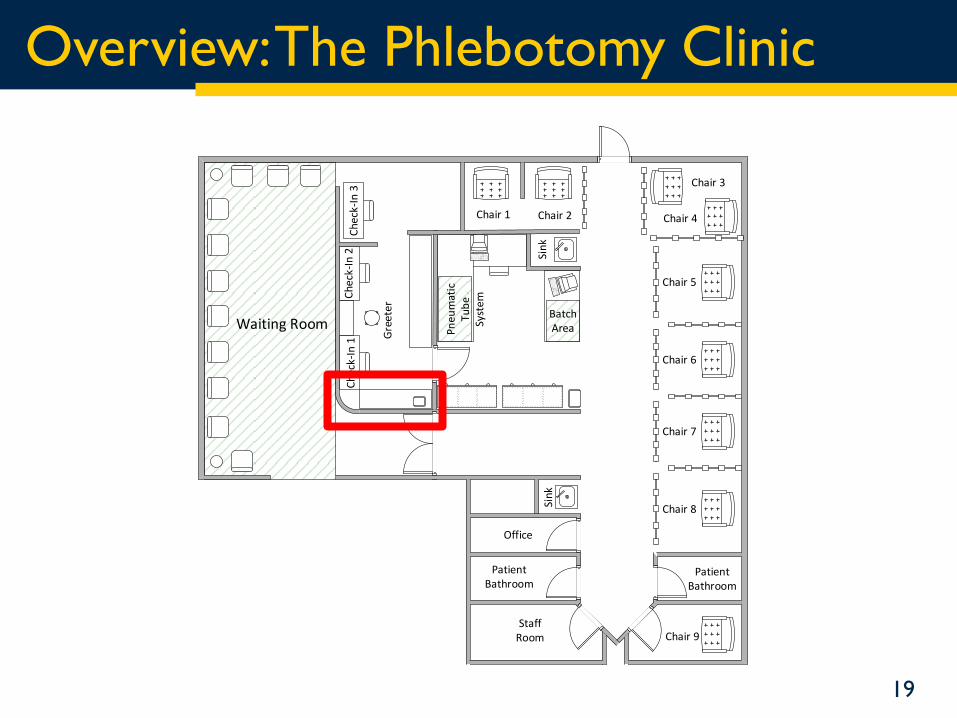
Overview: The Phlebotomy Clinic
Waiting Room
Chair 1 Chair 2
Batch AreaP
neu
mat
ic
Tub
e Sy
stem
Chair 3
Chair 4
Chair 5
Chair 6
Chair 7
Chair 8
Patient Bathroom
StaffRoom Chair 9
Office
Ch
eck-
In 1
Che
ck-I
n 2
Che
ck-I
n 3
Gre
eter
Sink
Sink
Patient Bathroom
13

Waiting Room
Chair 1 Chair 2
Batch AreaP
neu
mat
ic
Tub
e Sy
stem
Chair 3
Chair 4
Chair 5
Chair 6
Chair 7
Chair 8
Patient Bathroom
StaffRoom Chair 9
Office
Ch
eck-
In 1
Che
ck-I
n 2
Che
ck-I
n 3
Gre
eter
Sink
Sink
Patient Bathroom
Overview: The Phlebotomy Clinic
14

Waiting Room
Chair 1 Chair 2
Batch AreaP
neu
mat
ic
Tub
e Sy
stem
Chair 3
Chair 4
Chair 5
Chair 6
Chair 7
Chair 8
Patient Bathroom
StaffRoom Chair 9
Office
Ch
eck-
In 1
Che
ck-I
n 2
Che
ck-I
n 3
Gre
eter
Sink
Sink
Patient Bathroom
Overview: The Phlebotomy Clinic
15

Waiting Room
Chair 1 Chair 2
Batch AreaP
neu
mat
ic
Tub
e Sy
stem
Chair 3
Chair 4
Chair 5
Chair 6
Chair 7
Chair 8
Patient Bathroom
StaffRoom Chair 9
Office
Ch
eck-
In 1
Che
ck-I
n 2
Che
ck-I
n 3
Gre
eter
Sink
Sink
Patient Bathroom
Overview: The Phlebotomy Clinic
16

Waiting Room
Chair 1 Chair 2
Batch AreaP
neu
mat
ic
Tub
e Sy
stem
Chair 3
Chair 4
Chair 5
Chair 6
Chair 7
Chair 8
Patient Bathroom
StaffRoom Chair 9
Office
Ch
eck-
In 1
Che
ck-I
n 2
Che
ck-I
n 3
Gre
eter
Sink
Sink
Patient Bathroom
Overview: The Phlebotomy Clinic
17

Waiting Room
Chair 1 Chair 2
Batch AreaP
neu
mat
ic
Tub
e Sy
stem
Chair 3
Chair 4
Chair 5
Chair 6
Chair 7
Chair 8
Patient Bathroom
StaffRoom Chair 9
Office
Ch
eck-
In 1
Che
ck-I
n 2
Che
ck-I
n 3
Gre
eter
Sink
Sink
Patient Bathroom
Overview: The Phlebotomy Clinic
18
Waiting Room
Chair 1 Chair 2
Batch AreaP
neu
mat
ic
Tub
e Sy
stem
Chair 3
Chair 4
Chair 5
Chair 6
Chair 7
Chair 8
Patient Bathroom
StaffRoom Chair 9
Office
Ch
eck-
In 1
Che
ck-I
n 2
Che
ck-I
n 3
Gre
eter
Sink
Sink
Patient Bathroom
Overview: The Phlebotomy Clinic
19

Waiting Room
Chair 1 Chair 2
Batch AreaP
neu
mat
ic
Tub
e Sy
stem
Chair 3
Chair 4
Chair 5
Chair 6
Chair 7
Chair 8
Patient Bathroom
StaffRoom Chair 9
Office
Ch
eck-
In 1
Che
ck-I
n 2
Che
ck-I
n 3
Gre
eter
Sink
Sink
Patient Bathroom
Overview: The Phlebotomy Clinic
20

Overview: The Phlebotomy Clinic
Lab
Processing
Phlebotomy Patient
Arrives Clinic
Pharmacy
Infusion Patient
Discharged
Patient Flow
Information Flow
Material Flow 21

Patient Flow at Phlebotomy
22
Phlebotomy Patient
Arrives Clinic
Check-In Blood-Draw
Wait
Lab
Processing
Normal Patient:
~2 min, 48 sec
Extended Patient:
~7 min, 42 sec
Vein Draw:
~5 min, 7 sec
Port Draw:
~13 min, 17 sec
Patient Flow
Information Flow
Material Flow

Approach: Simulation
– Successfully utilized to expedite patient flow in clinics
throughout the country
– Users can: • manipulate input parameters and observe effect on
various metrics
• assess the impact of policy changes before actual
implementation
23

Implementation
– Developed in C++ • Directly usable by the Cancer Center management
• Adaptable for implementation of new scenario
24

Discrete Event Simulation Model
– Maintain a growing queue of events that occur
throughout the day, sorted by time of occurrence
– Three (3) main event types, each corresponding to
an availability queue:
• Patient Available for Check-In
• Patient Available for Blood Draw
• Phlebotomist Available
25

Simulation Design
26
Event Type Participant ID Time
PatientAvailCI 3948 7:03:42
PatientAvailCI 2084 7:06:12
PhlebAvail 0962 7:15:00
PatientAvailCI 5541 7:16:09
PatientAvailCI 8737 7:20:33
Event Queue
Participant ID Time
PatientAvailCI
Queue Participant ID Time
PhlebAvail
Queue
Clock

Simulation Design
27
Event Type Participant ID Time
PatientAvailCI 3948 7:03:42
PatientAvailCI 2084 7:06:12
PhlebAvail 0962 7:15:00
PatientAvailCI 5541 7:16:09
PatientAvailCI 8737 7:20:33
Event Queue
Participant ID Time
PatientAvailCI
Queue Participant ID Time
PhlebAvail
Queue
Clock

Simulation Design
28
Event Type Participant ID Time
PatientAvailCI 2084 7:06:12
PhlebAvail 0962 7:15:00
PatientAvailCI 5541 7:16:09
PatientAvailCI 8737 7:20:33
Event Queue
Participant ID Time
3948 7:03:42
PatientAvailCI
Queue Participant ID Time
PhlebAvail
Queue
Clock
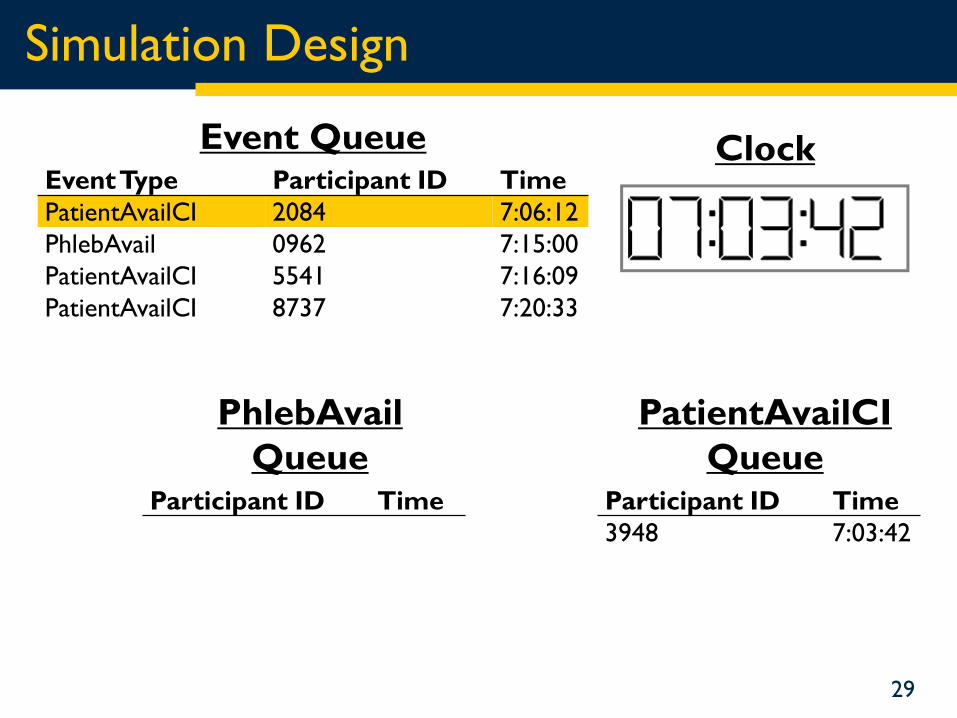
Simulation Design
29
Event Type Participant ID Time
PatientAvailCI 2084 7:06:12
PhlebAvail 0962 7:15:00
PatientAvailCI 5541 7:16:09
PatientAvailCI 8737 7:20:33
Event Queue
Participant ID Time
3948 7:03:42
PatientAvailCI
Queue Participant ID Time
PhlebAvail
Queue
Clock

Simulation Design
30
Event Type Participant ID Time
PhlebAvail 0962 7:15:00
PatientAvailCI 5541 7:16:09
PatientAvailCI 8737 7:20:33
Event Queue
Participant ID Time
3948 7:03:42
2084 7:06:12
PatientAvailCI
Queue Participant ID Time
PhlebAvail
Queue
Clock

Simulation Design
31
Event Type Participant ID Time
PhlebAvail 0962 7:15:00
PatientAvailCI 5541 7:16:09
PatientAvailCI 8737 7:20:33
Event Queue
Participant ID Time
3948 7:03:42
2084 7:06:12
PatientAvailCI
Queue Participant ID Time
PhlebAvail
Queue
Clock
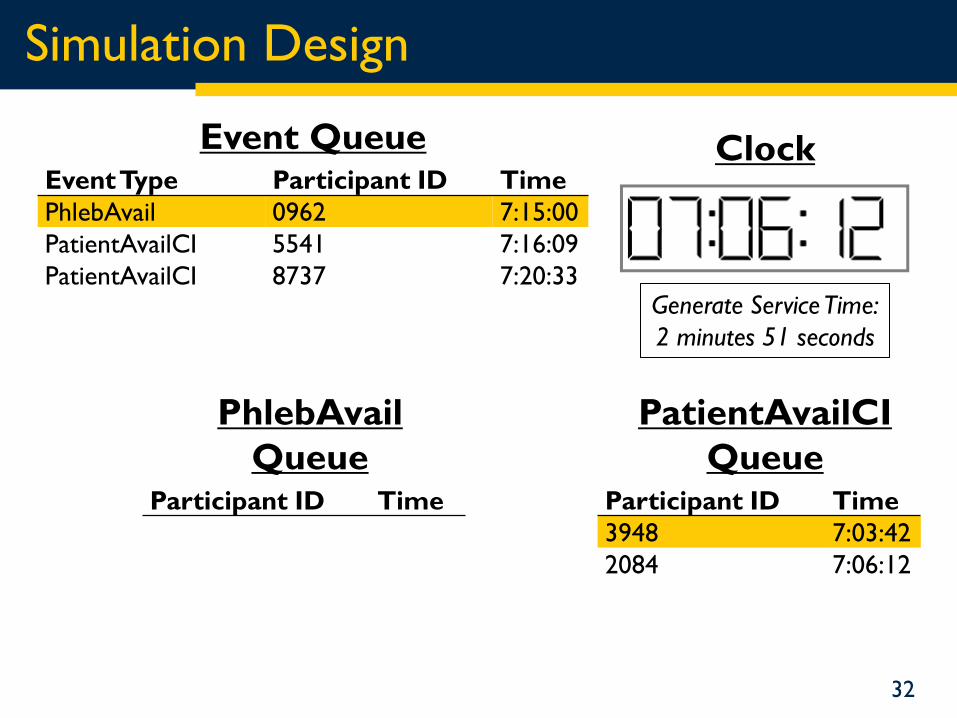
Simulation Design
32
Event Type Participant ID Time
PhlebAvail 0962 7:15:00
PatientAvailCI 5541 7:16:09
PatientAvailCI 8737 7:20:33
Event Queue
Participant ID Time
3948 7:03:42
2084 7:06:12
PatientAvailCI
Queue Participant ID Time
PhlebAvail
Queue
Generate Service Time:
2 minutes 51 seconds
Clock

Simulation Design
33
Event Type Participant ID Time
PatientAvailCI 5541 7:16:09
PatientAvailCI 8737 7:20:33
PatientAvailBD 3948 7:17:51
PhlebAvail 0962 7:17:51
Event Queue
Participant ID Time
2084 7:06:12
PatientAvailCI
Queue Participant ID Time
PhlebAvail
Queue
Clock

Initialize Event Queue
Simulate Day
Store Metrics
Initialize Patient Arrival Rates
Initialize Phlebotomist
Schedules
Initialize Additional Parameters
Report Patient Metrics
Generate Summary Statistics
Generate Graphs
Simulation Procedure Run Engine Read Simulation
Parameters Report Metrics X Iterations
34

Base Case
35

0
5
10
15
20
6:30 8:30 10:30 12:30 14:30 16:30
Pat
ien
ts/h
ou
r
Time of Day
AVERAGE PATIENT ARRIVAL RATE
Arrival Rate Data
36

Staffing Model
1200 1230 1300 1330 1400 1430 1500 1530 1600 1630 1700 1730
2 2 2 2 2 2 2 2 2 1 1 1
2 2 2 2 1 1 2 1
7 7 7 7 7 7 7 2 1 1 2 2
645 700 730 800 830 900 930 1000 1030 1100 1130
Check-In 1 2 3 3 3 3 2 2 2 2 2
Break/Lunch 1 2 2 2 2 2 2
Available to Draw
0 5 6 6 7 6 7 7 7 7 7
37

Service Time Data
Mean Std. Dev Proportion of
Patients
Check-In Duration (Minutes)
Extended* 7.71 4.12 9%
Regular 2.81 0.94 91%
Mix 3.25 1.53
Blood Draw Duration (Minutes)
Port 13.28 4.64 28%
Vein 5.11 3.75 72%
Mix 7.40 4.02
*Extended defined as check-in that takes > 5 minutes. 38

Base Case Results
39
0.03
0.13
0.37
0.46
0.01 0.00 0.00 0.00 0%
10%
20%
30%
40%
50%
15 20 25 30 35 40 45 More
Pe
rce
nta
ge
Minutes
Maximum Total Wait Times N=300 iterations

15
4
1 2
4
2 3
1 0 0
1 0
0
5
10
15
20
6:00 AM 8:00 AM 10:00 AM 12:00 PM 2:00 PM 4:00 PM
Wai
t Ti
me
(M
inu
tes)
Time of Day
Mean Total Wait Times
Base Case Results (Cont.)
40

Preliminary Validation
• Simulation run under current configuration
of clinic
• Results used for preliminary model validation with the hospital management
Check In Wait Times Draw Wait Times Total Wait Times mean median sd mean median sd mean median sd
0:02:32 0:00:22 0:04:08 0:00:16 0:00:00 0:01:18 0:02:49 0:02:49 0:04:37

What if…?
43
Possible Process Flow Scenarios
• Staffing Model Change
• Arrival Rate Increase
• Patient Population Change
44

What if…? One Draw to CI!
1200 1230 1300 1330 1400 1430 1500 1530 1600 1630 1700 1730
3 3 2 2 3 3 3 2 2 1 1 1
2 2 2 2 1 1 2 1
6 6 6 7 6 6 6 2 1 1 2 2
645 700 730 800 830 900 930 1000 1030 1100 1130
Check-In 1 3 4 4 4 4 2 2 3 3 3
Break/Lunch 1 2 2 2 2 2 2
Available to Draw
0 4 5 5 6 5 6 6 6 6 6
45

0
5
10
15
20
6:00 AM 8:00 AM 10:00 AM 12:00 PM 2:00 PM 4:00 PM
Wai
t Ti
me
(M
inu
tes)
Time of Day
Mean Total Wait Times n=300 iterations
Base Case
New Case
Comparison (Cont.)
46
Total Wait Times mean sd
New Case 0:02:12 0:04:25 Base Case 0:02:49 0:04:37

Comparison (Cont.)
Check In Wait Times Draw Wait Times
mean sd mean sd
New Case 0:01:16 0:03:07 0:00:56 0:02:34
Base Case 0:02:32 0:04:08 0:00:16 0:01:18
47

Summary
48
– Simulation may be adjusted to account
for vary intricacies of the clinic
–Hospital management can find optimal
input parameters for improving patient
wait times

Future Steps
49
–Continued improvement towards
representing current state, which
involves: • Accurate Service Time Distributions
• Non-instantaneous Service Transitions
• Additional Roles
–Obtain better arrival rate data for
analysis and formal validation

Acknowledgements
50
–U of M Center for Healthcare
Engineering and Patient Safety
–The Seth Bonder Foundation
–The Doctors Company Foundation
–UMHS Comprehensive Cancer Center
–U of M College of Engineering SURE
Program

QUESTIONS?
Thank you!
51
CONTACT INFORMATION:
Ajaay Chandrasekaran – [email protected]
Amy Cohn – [email protected]

Phlebotomy Staff Schedule
52

Appendix
0
5
10
15
20
25
Average Weekly Arrivals
Monday Tuesday Wednesday Thursday Friday Average
53

Simulation Overview
Main
1 Read Simulation Parameters
2 Run Engine
3 Report Metrics
Initialize internal simulation parameters with inputs from user-provided text files
Simulate day for multiple iterations
Output user-friendly metrics
54

Read Simulation Parameters
Read Simulation Parameters
1.1 Initialize Patient Arrival Rates
1.2 Initialize Phlebotomist Schedules
1.3 Initialize Additional Parameters
55

Run Engine
Run Engine
Simulate Iteration
• 2.1 Initialize Event Queue
• 2.2 Simulate
• 2.3 Store Metrics
X Iterations
56

Patient Arrival Rates
57

Phlebotomist Schedules
58

Additional Parameters
59

Report Metrics
60

Appendix
• Phlebotomy – 253 patients per day
• Clinic (7 Total) – 311 patients per day
• Infusion:
– Total of 51 infusion chairs
– 123 patients per day
– 20% of infusion appointments are coupled
61 61

Alternative Workflow A
62
Workflow A
Description Split current check-in process in two
Pros More patient interaction at check-in and no interruptions at order consolidation
Cons Additional space, change in layout, more hand-offs
Patient
Arrives Check-In
Lab Orders
Review
Blood
Draw
62

Alternative Workflow B
63
Workflow B
Description Order review and blood draw in the same area
Pros 2x verification and interaction with patient, fewer hand-offs
Cons Additional space and equipment/computers
Patient
Arrives Check-In
Lab Order and
Blood draw
63

Appendix
64
Infusion 13%
Lab Before Clinic 38% Lab
After Clinic 11%
Clinic & Infusion
20%
None 16%
Lab Before and After
Clinic 2%
Cancer Center Lab Patient Population Data Source: May & June 2014 Appointment Data (10,850 patients)
64

Appendix
65
• Phlebotomy Staff Schedule

Arrival Rate Data
66
0.00
5.00
10.00
15.00
20.00
25.00
6:30 7:00 7:30 8:00 8:30 9:00 9:30 10:00 10:30 11:00 11:30 12:00 12:30 13:00 13:30 14:00 14:30 15:00 15:30 16:00 16:30 17:00 17:30
Pat
ien
ts/h
ou
r
Time of Day
AVERAGE WEEKLY ARRIVALS
Monday

Arrival Rate Data
67
0.00
5.00
10.00
15.00
20.00
25.00
6:30 7:00 7:30 8:00 8:30 9:00 9:30 10:00 10:30 11:00 11:30 12:00 12:30 13:00 13:30 14:00 14:30 15:00 15:30 16:00 16:30 17:00 17:30
Pat
ien
ts/h
ou
r
Time of Day
AVERAGE WEEKLY ARRIVALS
Monday Tuesday

Arrival Rate Data
68
0.00
5.00
10.00
15.00
20.00
25.00
6:30 7:00 7:30 8:00 8:30 9:00 9:30 10:00 10:30 11:00 11:30 12:00 12:30 13:00 13:30 14:00 14:30 15:00 15:30 16:00 16:30 17:00 17:30
Pat
ien
ts/h
ou
r
Time of Day
AVERAGE WEEKLY ARRIVALS
Monday Tuesday Wednesday

Arrival Rate Data
69
0.00
5.00
10.00
15.00
20.00
25.00
6:30 7:00 7:30 8:00 8:30 9:00 9:30 10:00 10:30 11:00 11:30 12:00 12:30 13:00 13:30 14:00 14:30 15:00 15:30 16:00 16:30 17:00 17:30
Pat
ien
ts/h
ou
r
Time of Day
AVERAGE WEEKLY ARRIVALS
Monday Tuesday Wednesday Thursday

Arrival Rate Data
70
0.00
5.00
10.00
15.00
20.00
25.00
6:30 7:00 7:30 8:00 8:30 9:00 9:30 10:00 10:30 11:00 11:30 12:00 12:30 13:00 13:30 14:00 14:30 15:00 15:30 16:00 16:30 17:00 17:30
Pat
ien
ts/h
ou
r
Time of Day
AVERAGE WEEKLY ARRIVALS
Monday Tuesday Wednesday Thursday Friday


