This discussion paper is/has been under review for the journal Atmospheric Chemistryand Physics (ACP). Please refer to the corresponding final paper in ACP if available.
Discrimination of biomass burning smokeand clouds in MAIAC algorithm
A. Lyapustin1, S. Korkin2, Y. Wang3, B. Quayle4, and I. Laszlo5
1Laboratory for Atmospheres, NASA Goddard Space Flight Center, Greenbelt, Maryland, USA2Universities Space Research Association, Columbia, Maryland, USA3University of Maryland Baltimore County, Baltimore, Maryland, USA4USDA Forest Service, Salt Lake City, Utah, USA5NOAA/NESDIS/STAR, Camp Springs, Maryland, USA
Received: 29 June 2012 – Accepted: 15 July 2012 – Published: 31 July 2012
The multi-angle implementation of atmospheric correction (MAIAC) algorithm makesaerosol retrievals from MODIS data at 1 km resolution providing information about thefine scale aerosol variability. This information is required in different applications suchas urban air quality analysis, aerosol source identification etc. The quality of high reso-5
lution aerosol data is directly linked to the quality of cloud mask, in particular detectionof small (sub-pixel) and low clouds. This work continues research in this direction,describing a technique to detect small clouds and introducing the “smoke test” to dis-criminate the biomass burning smoke from the clouds. The smoke test relies on arelative increase of aerosol absorption at MODIS wavelength 0.412 µm as compared10
to 0.47–0.67 µm due to multiple scattering and enhanced absorption by organic carbonreleased during combustion. This general principle has been successfully used in theOMI detection of absorbing aerosols based on UV measurements. This paper providesthe algorithm detail and illustrates its performance on two examples of wildfires in USPacific North-West and in Georgia/Florida of 2007.15
1 Introduction
The multi-angle implementation of atmospheric correction (MAIAC) is a new MODISalgorithm which retrieves aerosol information over land simultaneously with param-eters of the bidirectional reflectance distribution function (BRDF) model (Lyapustinet al., 2011a,b, 2012a). MAIAC uses the time series (TMS) analysis and processing of20
groups of pixels which allows to impose physical constraints on the time-space variabil-ity of aerosols and surface reflectance captured with the MODIS daily global coverage:namely, aerosols vary slowly in space but may change between consecutive MODISobservations, whereas the land surface reflectance has a high spatial variability but lowrate of change at short time intervals (see also Dubovik et al., 2011; Govaerts et al.,25
2010). MAIAC features an independent cloud mask algorithm which uses TMS analysis
to identify clear conditions based on stable spatial pattern from surface over time asopposed to generally random pattern created by clouds (Lyapustin et al., 2008).
A distinctive feature of MAIAC is a high 1 km resolution of aerosol product. Whilehigh resolution is in great demand for urban air quality analysis and other applications,it also raises the standards for the accuracy of cloud detection. The recent paper of Lya-5
pustin et al. (2012b) explored ways to reduce cloud contamination in MAIAC aerosolretrievals. Specifically, we used analysis of spectral residuals between the measuredand computed (based on retrieved parameters) top of atmosphere (TOA) reflectancesto identify additional clouds. We have also adapted the histogram filtering approachof the current MODIS operational “Dark Target” algorithm MOD04 (Levy et al., 2007)10
which screens data below the 20th and above the 50th percentiles in a 10 km windowas probably contaminated by shadows and clouds, respectively. In MAIAC, similar filter-ing approach was applied to 1 km AOT retrievals in the 25 km window with the dynamicupper threshold being a function of the cloud fraction. A limited testing showed a dra-matic improvement in the aerosol product quality without big impact on retrievals with15
spatially variable aerosols.A subsequent large scale analyses of MODIS data, however, revealed a more com-
plex picture. First, it showed that the introduced “spectral residual” test is redundantand can be omitted in favor of a more universal and generic “histogram” test. Second,regardless of specific implementation, the histogram test was found to filter retrievals20
with high AOT gradient which often present a particular interest for analysis. In theend, this is not a surprise given that the histogram test implies a certain level of spatialhomogeneity of aerosol in the atmosphere, and its success in filtering clouds directlytranslates into its failure to preserve AOT data with high spatial variability. In general,high AOT gradients at a scale of several kilometers and less are generated by two main25
types of aerosol emission near its sources, namely fire smoke, usually associated withbiomass burning, and dust storms. This further work highlighted the need for develop-ing “smoke” and “dust” tests to help protect aerosol data with strong heterogeneity frombeing filtered out. The current paper presents further development of algorithm MAIAC:
it describes the new small cloud filter in Sect. 2 and the “smoke” test in Sect. 3. Sec-tion 4 provides an illustration of achieved data processing quality with two examples ofwildfires in US Pacific North-West and in Georgia/Florida of 2007.
2 Detection of small clouds
The MAIAC cloud mask (CM) algorithm was described earlier (Lyapustin et al., 2008).5
In brief, the CM algorithm is based on the notion that the spatial pattern of a given sceneis stable and reproducible for short time periods under cloud-free conditions, whereasclouds randomly disturb this pattern. The algorithm uses covariance analysis to identifycloud-free regions. On this basis, it builds a reference clear-sky image of the surface,which is used for pixel-level cloud masking. The reference image is updated each time10
clear conditions are detected, and thus it dynamically adapts to changing state of theland surface. The algorithm has an internal land-water-snow dynamic classification,which detects surface changes and guides MAIAC processing.
The reference clear-sky TOA reflectance, available for every 1 km pixel, significantlyincreases confidence of detecting both cloudy and clear pixels. This gives a particular15
advantage in difficult conditions, e.g. in tropical regions of Amazonia characterized byhigh cloudiness especially during the wet season (Hilker et al., 2012). Also as a conse-quence, MAIAC does not use “probably clear” and “probably cloud” categories whichare common to the operational cloud mask algorithms.
In general, it is easy to identify bright and cold clouds and difficult to detect the low20
and small (sub-pixel) clouds as they do not display sufficient brightness temperatureor reflectance contrast. In MAIAC CM algorithm, this problem may be exacerbated bythe use of 1 km gridded data obtained from the original MODIS 500 m measurements(nadir resolution). The 1 km gridding is required for the time series analysis used inboth aerosol retrieval and atmospheric correction algorithms of MAIAC as well as in25
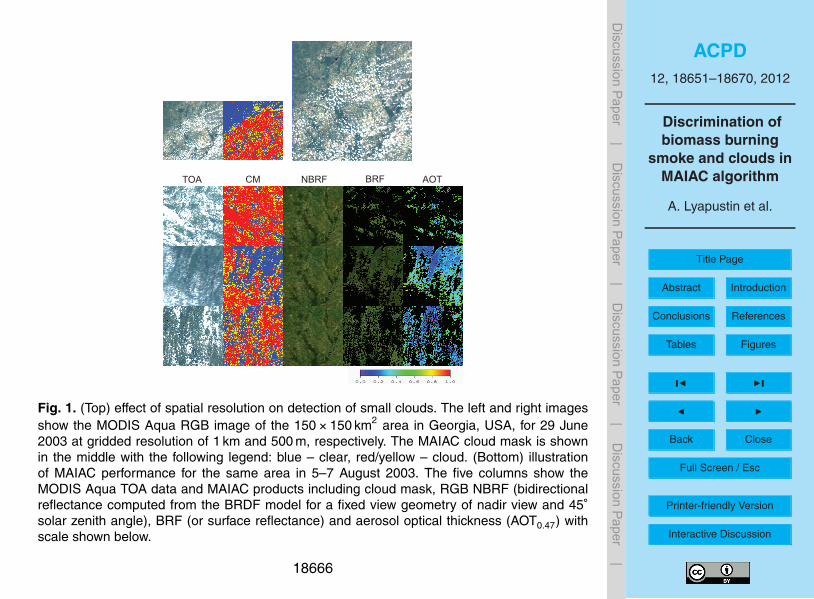
CM. However, it obviously reduces the reflectance contrasts which otherwise couldbe found in the original 500 m data. As an example, Fig. 1a illustrates the difference
between the 1 km and 500 m grid resolution in the RGB MODIS Aqua image for the150×150 km2 area in Georgia, USA, the latter showing significantly more contrast andfine level detail. The arrow points at a small cloud which is still observable at 500 mresolution but becomes indistinguishable at 1 km. This discussion highlights the idea ofusing the 500 m resolution data to improve cloud masking.5
After trial and error, we implemented an approach based on the standard deviationof four 500 m gridded pixels nested in each 1 km grid cell. Similarly to the referenceclear sky image, the standard deviation image (σi j ) is created for the clear conditionsand stored in the Queue memory (q.σ) for each 1 km pixel. The q.σ-image is dynam-ically updated with the latest data thus adapting to changing surface conditions over10
time. Using a pixel-specific value has a strong advantage over the use of generic globalthresholds as it automatically accounts for the surface heterogeneity helping cloud de-tection.
A specific σ-test is implemented for each 1 km pixel as follows:
If σi j >√µq.σi j +Thresh → Cloud. (1)15
Here, the multiplier√µ, where µ is a cosine of view zenith angle, approximately takes
into account the pixel growth with scan angle, higher overlap between scan lines, andthe resulting reduction of contrast. The term Thresh is a threshold value in the σ-test.It depends on surface variability, and is obtained as a function of the maximal contrastover a given pixel and its nearest neighbors (σmax):20
This approach mitigates the effect of the MODIS pixel growth with the scan angle whichbecomes important over heterogeneous regions, and helps avoid the impact of highcontrast borderlines such as seashore.
Figure 1 gives examples of the MAIAC cloud mask performance for selected days in25
June and August of 2003, characterized by complex cloudy conditions with large num-ber of small clouds. The bottom panel shows additional MAIAC products including the
RGB bidirectional reflectance factors (BRF), commonly called surface reflectance, andAOT images which allow a more complex evaluation of the total algorithm performanceincluding cloud mask. The lack of obvious cloud-related artifacts in the BRF and AOTdata indicates a good quality of cloud detection.
3 Smoke test5
3.1 Absorption and size parameters
The biomass burning aerosols contain carbonaceous compounds such as black carbon(BC) and organic carbon (OC) which are efficient absorbers of light in the atmosphere.While the BC absorption, e.g. imaginary part of refractive index, is known to be spec-trally neutral, different studies indicate that the OC absorption increases at short wave-10
lengths, namely in the Blue-UV spectral region (e.g. Kirchstetter et al., 2004; Bergstromet al., 2007; Russell et al., 2010). The UV wavelengths have been successfully usedin the OMI Aerosol Index (AI) algorithm to detect absorbing aerosols (smoke, min-eral dust, volcanic ash) and discriminate them from clouds and from weakly absorbingaerosols such as sea salt, sulphates etc. (e.g. Torres et al., 1998, 2007). This detection15
relies on the fact that adding absorbing aerosols in atmosphere reduces its TOA radi-ance as compared to that from the purely Rayleigh atmosphere. At short wavelengths,the number of scattering events is considerable due to high Rayleigh and aerosol op-tical thickness, with energy absorbed in each interaction with aerosol particle, whichultimately reduces the reflected radiance. In the case of smoke, an additional absorp-20
tion may be caused by an enhanced UV light absorption by OC.In this work, we are using a similar principle based on the MODIS Red, Blue and
Deep Blue (DB) bands B1 (0.646 µm), B3 (0.466 µm) and B8 (0.412 µm). The devel-oped test (1) isolates aerosol reflectance, and (2) compares the measured reflectanceat shortest wavelength (0.412 µm) with that predicted from the Red-Blue region. Specif-25
ically, an aerosol reflectance is first computed in the Red, Blue and DB channels by
subtracting the Rayleigh (path) reflectance and the full surface-reflected signal at TOAfrom the measurement:
RAerλ = RMeas
λ −RMolecλ −RSurf
λ (τa). (3)
The last term is evaluated using AOT (τa) initially retrieved with the background aerosolmodel and spectral surface BRDF known from the previous MAIAC retrievals. The so5
defined aerosol reflectance represents the atmospheric aerosol backscattering (pathreflectance) and aerosol-molecular interactions. Next, we assume that the aerosol re-flectance has a power law spectral dependence typical of the optical thickness,
RAerλ ∼ λ−b. (4)
While Eq. (4) is only an approximation because of the multiple scattering, aerosol-10
molecular interactions, and spectral dependence of both single scattering albedo andaerosol phase function, it is quite adequate for our purpose. With this assumption, theequivalent Angstrom exponent b is computed next using the Red and Blue channels.Finally, using parameter b, we compute predicted aerosol reflectance at 0.412 µm, andcompare it with the measured aerosol reflectance via the absorption parameter (AP):15
AP = RAer,Meas0.412 /RAer,Pred
0.412 , where RAer,Pred0.412 = RAer
0.466(0.4660.412
)−b. (5)
This test is implemented after the aerosol retrieval with the background aerosol modeland before the cloud filter. Despite the different implementation, the idea behind thisspectral test is similar to the one behind the OMI aerosol index: to the first order approx-imation, the clouds, which have spectrally neutral behavior, or non-absorbing aerosols,20
would give the AP values close to unity, whereas the absorbing aerosols would result inthe lower AP values. The reduction of AP for absorbing aerosols is expected becauseof the additional multiple scattering and, in case of smoke, additional OC absorption at0.412 µm as compared to the Red-Blue spectral region.
To understand the capability and sensitivity of the proposed test, we conducted a theo-retical analysis of smoke-cloud separability based on the introduced absorption param-eter. The liquid water cloud was modeled using a lognormal size distribution with radius5 µm and standard deviation 0.5 µm using refractive index of Hale and Querry (1973). It5
is worth noting that since clouds practically do not absorb solar radiation in the blue-redspectrum, the exact properties of clouds do not matter, and the selected cloud modelwill provide generally representative results. To model the biomass burning aerosol,we selected the value of Absorption Angstrom Exponent AAE=2 and the imaginaryrefractive index ni = 0.01 at 0.466 µm. While the value AAE=2 is slightly higher than10
those (∼1.4–1.5) based on several field campaign studies and AERONET data com-piled in Russell et al. (2010), it is well within the range of the reported AAE values (up to3–5) observed in the controlled burning experiments (see Russell et al., 2010 and refer-ences therein). For the selected MODIS channels (0.412, 0.466, and 0.646), this givesni = 0.0113, 0.01 and 0.0070, and the single scattering albedo SSA=0.9219, 0.924615
and 0.9245, respectively. In addition, we have also tested the case with spectrally-neutral imaginary index of 0.01 (more representative of BC) which gives SSA=0.9294,0.9246, and 0.8981, respectively.
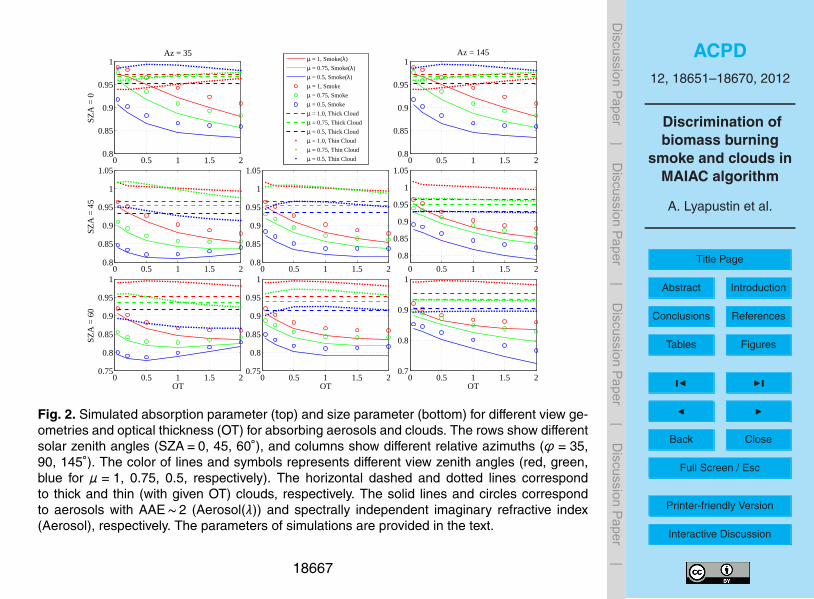
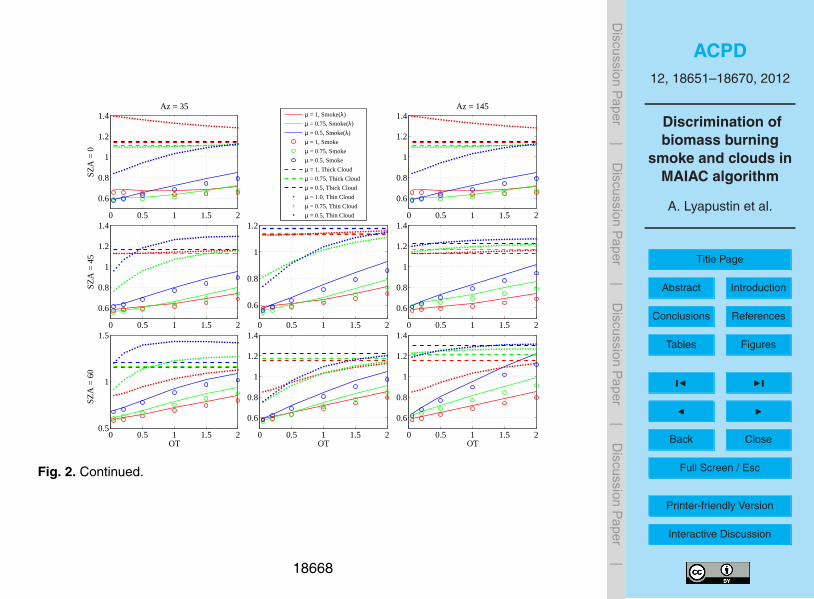
The results of simulations performed with the radiative transfer code SHARM (Lya-pustin and Wang, 2005) are shown in Fig. 2. The top panel (a) shows simulated ab-20
sorption parameter (AP) and the bottom one (b) shows the size parameter (SP) givenby the ratio SP = RAer
0.646/RAer0.466 which is equivalent to parameter b. The results are pre-
sented as a function of the optical thickness. In each panel, the rows show differentsolar zenith angles (SZA=0, 45, 60◦), and columns show different relative azimuths(ϕ = 35, 90, 145◦). The range of selected azimuthal angles is typical of MODIS obser-25
vation geometries. The line color represents different view zenith angles (red, green,blue for µ=1, 0.75, 0.5, respectively).
Each plot shows results for an optically thick cloud (horizontal dashed lines), thinclouds corresponding to a given optical thickness (dotted lines) and two aerosol typeswith solid lines representing aerosols with AAE=2 (Aerosol(λ)) and open circles show-ing simulations with constant ni = 0.01 (Aerosol). As expected, the “size parameter” forclouds is close to unity indicating a near-neutral spectral dependence, whereas the typ-5
ical aerosol values are in the range of 0.6–0.8 indicating much smaller particle size. Theaerosol SP values grow with AOT and atmospheric airmass, nevertheless the aerosolSP is distinguishably lower than the cloud value for the analyzed AOT range 0–2. Thetop panel (AP) shows a separation of non-absorbing clouds (e.g. horizontal dashedlines for optically thick clouds) and absorbing smoke (solid lines), which increases with10
aerosol optical thickness and airmass. A robust separation is achieved for all view ge-ometries at AOT0.47 > 0.5. At smaller AOT, especially with low SZA and VZA, this testbecomes less reliable due to additional uncertainties from the knowledge of spectralsurface BRDF.
As specific aerosol absorption is a function of many parameters including type of the15
burning material and smoldering to flaming fraction ratio, we implemented a smoke testbased on separation from the “cloud AP” as follows:
If APi j < APCloud −0.03 → Aerosol, (6)
where APCloud∼= 0.97−0.06(2−µ−µ0) is approximately parameterized in terms of
cosines of the view and solar (µ0) zenith angles. The size parameter is additionally20
used in the mineral dust detection, which will be described separately.
4 Examples of MODIS processing
A detailed example illustrating current MAIAC retrieval capability is shown in Fig. 3 forthe case of forest wildfires in the US Pacific North-West in 2007. Shown is the areaof 150 km in the Rocky Mountains centered at 45.5◦ N, 115.1◦ W. Fires started about25
DOY 193 and lasted for over two months. Figure 3 displays 10 different columns for18659
each of the 10 days shown, including MODIS Aqua RGB top of atmosphere (TOA)data, MAIAC cloud mask, RGB NBRF (theoretically computed Normalized BRDF fora fixed geometry of nadir view and SZA=45◦ which can be considered as a back-ground surface image) and BRF (bidirectional reflectance factor often called surfacereflectance), AOT0.47, absorption parameter (AP), brightness temperature (BT), re-5
flectance in MODIS cirrus channel (1.38 µm), and measured and predicted, based onBRDF model, reflectance in band 7 (2.1 µm).
The top three images (DOY 194, 199, 212) show initial fires of relatively low intensityin different conditions. Areas of enhanced smoke absorption are clearly identifiable bylow values of the absorption parameter (AP), in contrast to high AP values from clouds10
or the background aerosol. The last four columns are shown to help discriminate cloudsfrom smoke. For example, usually higher and colder clouds have lower brightness tem-perature and higher reflectance in the cirrus channel 1.38 µm as compared to a clearland or a near-ground smoke. The MODIS narrow cirrus channel (band 26) is located inthe water vapor band with strong absorption such that a small amount of column water15
vapor (0.3–0.5 cm) is usually sufficient to absorb most of radiation reflected by the sur-face and aerosols into space. Usually, this channel is very dark measuring a low signal,however it becomes bright when the scattering layer (aerosol or cloud) raises above thebulk of column water vapor. These effects are clearly visible in the top three rows of im-ages. The first day (194) shows a sub-visible thin cirrus with low optical depth detected20
based on lower BT and higher R1.38 as compared to the cloud-free background.The last two columns show the measured MODIS reflectance at 2.1 µm and pre-
dicted reflectance based on surface BRDF model retrieved by MAIAC. One can seethat in the absence of optically thick clouds the two fields (R2.1 and RTLS2.1) are spa-tially well correlated (e.g. DOY 194). The correlation at 2.1 µm usually remains robust25
even in conditions of thick smoke plumes. The biomass burning smoke is mostly rep-resented by the fine mode particles and thus has little effect on the 2.1 µm reflectance(Kaufman et al., 2005; Eck et al., 1999, 2009).
The fire reaches its maximal strength on days 224–225. On day 224, the BT and R1.38fields show that smoke rises well above the boundary layer. Based on the brightnesstemperature contrast of 25–35 ◦C, the height of the plume can be roughly evaluatedas 4–5 km above the ground. The AP index shows the lowest values among all daysindicating high absorption by carbonaceous (BC and OC) aerosols.5
The bottom images show the last four days of the fire, which were followed by thecloudy period and the onset of the cold season. These very interesting images (TOA,AOT0.47, and AP) show that a significant fraction of the smoke is concentrated alongthe mountain valleys making them visibly very bright. At the same time, the nearbyelevated areas often have a much better air quality with lower AOT.10
These examples show that with the introduction of smoke discrimination, MAIAC nolonger filters out fire plumes, including those with the high reflectance and AOT con-trast. The cloud mask images show that some excessive filtering (yellow color) may stilloccur on the plume boundaries, in transitional zones to clear areas with AOT0.47 ∼0.3–0.6, where smoke detection becomes less reliable.15
Figure 4 shows several large-scale examples of MAIAC aerosol retrievals for theSouth-Eastern USA using MODIS Aqua for 2007. The top two rows of images showtriplets of consecutive days for the Georgia–Florida fires of 2007, the largest fires inthe history of both states. These fires, caused by an extreme drought of 2007, startedin the second half of April and raged through the end of June (e.g. Christopher et al.,20
2009). Images for days 119–121 show several strong fire sources in the two states, andanother large fire in Alabama magnified in the inset. Days 141–143 illustrate conditionsof increasing cloudiness, and reliable identification of the source and of progressivelynorth-western transport of smoke under high cloudiness (DOY 142–143). Finally, thelast three days (230–232) show gradual removal of polluted air by the weather system25
High resolution aerosol data from space observations offer a unique prospective fordifferent disciplines and operational applications focusing on aerosol sources and theiremission power. One important application is detection and characterization of the wild-fires that affect global population, and the assessment of the air quality in affected5
areas. This work described a continued development of the MAIAC algorithm by im-proving the quality of the 1 km aerosol product with reliable cloud filtering.
MAIAC combines a specialized cloud masking approach with an aerosol screeningtechnique based on the histogram analysis following the MODIS Dark Target opera-tional algorithm (Levy et al., 2007). The histogram-based aerosol filter is a very robust10
tool based on an assumption that the spatial variability of aerosols is significantly lowerthan that from clouds. This assumption works well in most cases except when in closeproximity to strong aerosol sources, e.g. fire smoke plumes, resulting in filtering theareas of the real aerosol signal, usually the most interesting for analysis.
In the current work, we have augmented MAIAC cloud mask with the spatial variance15
analysis to improve detection of small sub-pixel clouds. The variance σ is computed forevery 1 km pixel from four original MODIS pixels at 500 m resolution, and is comparedto the dynamically updated clear-sky value for the same pixel stored in the memory.
We have also introduced a smoke test based on analysis of measured reflectancein the MODIS Red, Blue and Deep Blue channels. This test detects absorbing smoke20
aerosols based on higher absorption at shorter wavelengths, which is a result of multi-ple scattering and increased absorption by organic carbon released during combustion.Using two examples of forest fires in the US Pacific Northwest and Georgia/Floridain 2007, we show for the first time that robust discrimination of the biomass burningaerosol can be achieved using visible set of wavelengths rather than the UV range, the25
latter being the mainstream approach with long history of successful operational use.The developed smoke test fully leverages MAIAC synergistic processing by us-
ing available spectral BRDF information. This facilitates reliable smoke detection in
relatively clear conditions. It should be mentioned, however, that at high optical depth,sensitivity of TOA radiance to the surface is low, therefore the same approach can besuccessfully used to detect dense plumes without a priory knowledge of the surfacereflectance.
It should be noted that examples of AOT retrievals, presented above, give a low es-5
timate of the optical thickness for smoke regions and should be considered qualitativeas current MAIAC results were produced using a single low absorption aerosol modeltypical of the East Coast USA (Lyapustin et al., 2011b). With the developed smokediscrimination capability, however, the realistic biomass burning aerosol models will beincluded in MODIS MAIAC retrievals in the near future.10
Acknowledgements. The research of A. Lyapustin, Y. Wang and S. Korkin was funded by theNASA Terrestrial Ecology Program (D. Wickland) and in part by the NOAA GOES-R program(M. Goldberg). The work of I. Laszlo is supported by the NOAA GOES-R program.
References
Bergstrom, R. W., Pilewskie, P., Russell, P. B., Redemann, J., Bond, T. C., Quinn, P. K., and15
Christopher, S. A., Gupta, P., Nair, U., Jones, T. A., Kondragunta, S., Wu, Y., Hand, J., andZhang, X.: Satellite remote sensing and mesoscale modeling of the 2007 Florida/Georgiafires, IEEE J. Sel. Top. Appl., 26, 1–13, 2009.20
Dubovik, O., Herman, M., Holdak, A., Lapyonok, T., Tanre, D., Deuze, J. L., Ducos, F.,Sinyuk, A., and Lopatin, A.: Statistically optimized inversion algorithm for enhanced retrievalof aerosol properties from spectral multi-angle polarimetric satellite observations, Atmos.Meas. Tech., 4, 975–1018, doi:10.5194/amt-4-975-2011, 2011.
Eck, T. F., Holben, B. N., Reid, J. S., Dubovik, O., Smirnov, A., O’Neill, N. T., Slutsker, I., and25
Kinne, S.: Wavelength dependence of the optical depth of biomass burning, urban and desertdust aerosols, J. Geophys. Res., 104, 31333–31350, 1999.
Eck, T. F., Holben, B. N., Reid, J. S., Sinyuk, A., Hyer, E. J., O’Neill, N. T., Shaw, G. E., VandeCastle, J. R., Chapin, F. S., Dubovik, O., Smirnov, A., Vermote, E., Schafer, J. S., Giles, D.,
Slutsker, I., Sorokine, M., and Newcomb, W. W.: Optical properties of boreal region biomassburning aerosols in Central Alaska and seasonal variation of aerosol optical depth at anArctic coastal site, J. Geophys. Res., 114, D11201, doi:10.1029/2008JD010870, 2009.
Govaerts, Y. M., Wagner, S., Lattanzio, A., and Watts, P.: Joint retrieval of surface reflectanceand aerosol optical depth from MSG/SEVIRI observations with an optimal estimation ap-5
proach: 1. Theory, J. Geophys. Res., 115, D02203, doi:10.1029/2009JD011779, 2010.Hale, G. M. and Querry, M. R.: Optical constants of water in the 200 nm to 200 µm wavelength
region, Appl. Optics, 12, 555–563, 1973.Hilker, T., Lyapustin, A. I., Tucker, C. J., Sellers, P. J., Hall, F. G., and Wang, Y.: Remote sensing
of tropical ecosystems: atmospheric correction and cloud masking matter, Remote Sens.10
Environ., in review, 2012.Kaufman, Y. J., Boucher, O., Tanre, D., Chin, M., Remer, L., and Takemura, T.: Aerosol an-
Levy, R. C., Remer, L., Mattoo, S., Vermote, E., and Kaufman, Y. J.: Second-generation algo-15
rithm for retrieving aerosol properties over land from MODIS spectral reflectance, J. Geo-phys. Res., 112, D13211, doi:10.1029/2006JD007811, 2007.
Lyapustin, A.: Radiative transfer code SHARM for atmospheric and terrestrial applications,Appl. Optics, 44, 7764–7772, 2005
Lyapustin, A., Wang, Y., and Frey, R.: An automatic cloud mask algorithm based on time se-20
ries of MODIS measurements, J. Geophys. Res., 113, D16207, doi:10.1029/2007JD009641,2008.
Lyapustin, A., Martonchik, J., Wang, Y., Laszlo, I., and Korkin, S.: Multi-angle implementation ofatmospheric correction (MAIAC): Part 1. Radiative transfer basis and look-up tables, J. Geo-phys. Res., 116, D03210, doi:10.1029/2010JD014985, 2011a.25
Lyapustin, A., Wang, Y., Laszlo, I., Kahn, R., Korkin, S., Remer, L., Levy, R., and Reid, J. S.:Multi-angle implementation of atmospheric correction (MAIAC): Part 2. Aerosol algorithm,J. Geophys. Res., 116, D03211, doi:10.1029/2010JD014986, 2011b.
Lyapustin, A., Wang, Y., Laszlo, I., Hilker, T., Hall, F., Sellers, P., Tucker, J., and Korkin, S.: Multi-angle implementation of atmospheric correction for MODIS (MAIAC). Part 3: Atmospheric30
correction, Remote Sens. Environ., in review, 2012a.
Lyapustin, A., Wang, Y., Laszlo, I., and Korkin, S.: Improved cloud and snow screening in MA-IAC aerosol retrievals using spectral and spatial analysis, Atmos. Meas. Tech., 5, 843–850,doi:10.5194/amt-5-843-2012, 2012b.
Russell, P. B., Bergstrom, R. W., Shinozuka, Y., Clarke, A. D., DeCarlo, P. F., Jimenez, J. L.,Livingston, J. M., Redemann, J., Dubovik, O., and Strawa, A.: Absorption Angstrom Exponent5
in AERONET and related data as an indicator of aerosol composition, Atmos. Chem. Phys.,10, 1155–1169, doi:10.5194/acp-10-1155-2010, 2010.
Torres, O., Bhartia, P. K., Herman, J. R., Ahmad, Z., and Gleason, J.: Derivation of aerosolproperties from satellite measurements of backscattered ultraviolet radiation: theoretical ba-sis, J. Geophys. Res., 103, 17099–17110, 1998.10
Torres, O., Tanskanen, A., Veihelmann, B., Ahn, C., Braak, R., Bhartia, P. K., Veefkind, P., andLevelt, P.: Aerosols and surface UV products from ozone monitoring instrument observations:an overview, J. Geophys. Res., 112, D24S47, doi:10.1029/2007JD008809, 2007.
Fig. 1. (Top) effect of spatial resolution on detection of small clouds. The left and right imagesshow the MODIS Aqua RGB image of the 150×150 km2 area in Georgia, USA, for 29 June2003 at gridded resolution of 1 km and 500 m, respectively. The MAIAC cloud mask is shownin the middle with the following legend: blue – clear, red/yellow – cloud. (Bottom) illustrationof MAIAC performance for the same area in 5–7 August 2003. The five columns show theMODIS Aqua TOA data and MAIAC products including cloud mask, RGB NBRF (bidirectionalreflectance computed from the BRDF model for a fixed view geometry of nadir view and 45◦
solar zenith angle), BRF (or surface reflectance) and aerosol optical thickness (AOT0.47) withscale shown below.
Fig. 2. Simulated absorption parameter (top) and size parameter (bottom) for different view ge-ometries and optical thickness (OT) for absorbing aerosols and clouds. The rows show differentsolar zenith angles (SZA=0, 45, 60◦), and columns show different relative azimuths (ϕ = 35,90, 145◦). The color of lines and symbols represents different view zenith angles (red, green,blue for µ = 1, 0.75, 0.5, respectively). The horizontal dashed and dotted lines correspondto thick and thin (with given OT) clouds, respectively. The solid lines and circles correspondto aerosols with AAE∼2 (Aerosol(λ)) and spectrally independent imaginary refractive index(Aerosol), respectively. The parameters of simulations are provided in the text.
TOA CM NBRF BRF AOTTOA CM NBRF BRF AOT0.470.47 AP BT R AP BT R1.38 1.38 R R2.1 2.1 RTLS RTLS2.12.1
256256
Fig. 3. Illustration of MAIAC algorithm performance for case of forest wildfires in Pacific North-west, Rocky Mountains, USA, 2007. The images show MODIS Aqua RGB TOA data, MAIACcloud mask, RGB NBRF and BRF, AOT0.47, absorption parameter (AP), brightness tempera-ture (BT), reflectance in MODIS cirrus channel (1.38 µm), and measured and predicted, usingretrieved BRDF model, reflectance in B7 (2.1 µm). The results are shown for 150 km tiles fordays of year from 194 to 256, as indicated in the 4th column. The blue color of the cloud maskcorrespond to clear pixels, and red-yellow show detected clouds. The following scales wereused for columns 5–10 (based on displayed rainbow palette): 0–3 (AOT0.47), 0.7–0.91 (AP),273–305 (BT), 0–0.035 (R1.38), 0–0.3 (R2.1 and RTLS2.1).
Fig. 4. Examples of MAIAC large-scale aerosol retrievals for the South-Eastern US usingMODIS Aqua 2007 data. The numbers show the day of the year. The scale of AOT0.47 is 0–3.The top two rows of images show triplets of consecutive days for the Georgia–Florida fires of2007. An additional large fire on day 121 in Alabama is magnified in the inset. Days 141–143illustrate conditions of increasing cloudiness with reliable identification of the fire source andnorth-western transport of smoke. The last three days (230–232) show a gradual removal ofpolluted air by the weather system in the northern direction.