Discriminative Power of Chemically Sensitive Silicon Nanowire FieldEffect Transistors to Volatile Organic CompoundsRotem Ermanok, Ossama Assad, Keren Zigelboim, Bin Wang, and Hossam Haick*
The Department of Chemical Engineering and Russell Berrie Nanotechnology Institute, Technion-Israel Institute of Technology,Haifa 3200003, Israel
ABSTRACT: We report on the sensing of different polar and nonpolar volatileorganic compounds (VOCs) in an atmosphere with background humidity(relative humidity: 40%), using molecularly modified silicon nanowire fieldeffect transistors (SiNW FETs). In this endeavor, a systematic comparativeanalysis is performed with: (i) SiNW FETs that were functionalized with aseries of molecules having different electron-withdrawing and electron-donatingend groups; and (ii) SiNW FETs that are functionalized with a series ofmolecules having similar functional groups but different backbone lengths. Theanalysis of the sensing signals are focused on three main FET parameters:(i) changes in the threshold voltage, (ii) changes in the carrier mobility, and(iii) changes in the on-current, compared to the baseline values under vacuum.Using discriminant factor analysis, the performance of the molecularly modifiedSiNW FETs is further analyzed as sensors array. The combination of sensors having the best discriminative power between thevarious VOCs are identified and discussed in terms of their constituent surface modifications.
The demand for fast, low-cost detection and online monitoringof volatile organic compounds (VOCs) has increased over theyears in a variety of fields. For example, in the field of healthcare applications, the detection and identification of VOCsmay lead to the development of novel, noninvasive diagnosticmethods for a wide range of diseases, including different typesof cancer,1−10 tuberculosis,11,12 kidney failure,13,14 Parkinson’sdisease,15,16 and many others (cf. recent reviews and refer-ences 2, and 17−20). In this field, VOCs are used as diseasebiomarkers that are released from the infected area(s) to thebloodstream, from where they are emitted to the exhaledbreath, skin, and urine. In the fields of workplace safety andenvironmental monitoring, there is a growing need formonitoring VOCs from exogamic sources, mostly fromindustrial processes,21,22 that could be hazardous, even at verylow levels,21 to humans, animals, and plants.23
An emerging approach for the detection of VOCs is based on(semi-) selective recognition by means of silicon nanowire(SiNW) field effect transistors (FETs).24−29 Sensors based onSiNW FETs have clear advantages over other sensing platforms:• In comparison with nanomaterial-based chemiresistors,30−33
SiNW FETs provide additional degree(s) of freedom in oper-ation and/or sensing. More specifically, SiNW FETs allowtailoring the response not only by the voltage applied betweenthe adjacent (source and drain) electrodes, but also by a gatevoltage.27,34 Hence, SiNW FETs allow extracting multiple de-vice parameters that increase the number of independent sensingfeatures per sensor during each measurement.25−29
• In comparison to organic FETs, SiNW FETs offer a widerrange of carrier mobility.35,36 Although the carrier mobility ofmost ‘high-performance’ organic FETs fall in the range of 1−10cm2/(V s) (with the exception of single crystal structure, whichmay achieve higher values36), significantly higher carrier mo-bility values (1000−1350 cm2/(V s))35,37 have been reportedfor SiNW FETs. Additionally, the carrier mobility of SiNWFETs can be controlled by a deliberate modification of theconstituent synthesis,38,39 by the number of SiNWs that liebetween the source and drain electrodes,40 and by other factors.• In comparison to CNT-based sensors, SiNWs are always
semiconducting and the semiconducting-metallic transition isless affected by the chirality and the diameter.41 Furthermore,SiNWs can be more easily integrated into standard VLSI fabri-cation and processing than CNTs.42−44
In addition to these advantages, the ability to tailor thesurface chemistry of the SiNW surfaces by layers of (bio)chemical modification34,45−51 affects the device’s stability,48,52
enhances the electrical properties,25−29 and widens thepossibilities for the interactions between the SiNWs andthe VOCs.1−19,21,23,53 Despite these prominent advantages, thecurrently available SiNW FETs have drawbacks. The sensingcapabilities of SiNW FETs toward nonpolar VOCs are signifi-cantly reduced compared to the detection of polar VOCs.
Received: August 15, 2013Accepted: September 27, 2013Published: September 27, 2013
In previous studies, we have examined the effect of themolecular layer structure on the sensing properties of SiNWFETs.25−29 This examination included a systematic monitoringof the influence of the cross-linking between adjacent moleculesin the molecular layer,25−27 the influence of the functional (end)group of the molecular layer,28 and the influence of the chainlength of the molecular layer.29 These studies indicate that polarVOCs are usually detected through the change of dipolemoment of the molecular layer attached to the SiNW and/orelectrostatic effect of the polar VOCs on the SiNW channel.28,29
The sensing of nonpolar VOCs has been associated with indirect
interactions between the VOC molecules and the modifiedmolecules on the SiNW surface via molecular gating, including:(i) changes in the dielectric properties of the functional organicmonolayer; and (ii) changes in the density of charged surfacestates at the monolayer/SiO2 interface.25−27 In the event ofsensing nonpolar VOCs associated with indirect interactions, itwas found that the longer the chain length of the molecular layer,the higher VOC molecules adsorbed on SiNW surface, and thehigher the sensing response.29 It was also found that an organiclayer could detect both polar and nonpolar VOCs, and that theinteraction between electron-withdrawing or electron-donatingfunctional groups and VOC molecules may determine thedirection of threshold voltage change.28 In either case, the effectof the functional group on the shift direction of the thresholdvoltage was found to be more significant compared to theeffect of chain length.28,29 Moreover, it has been proven that
Table 1. List of Silane Molecules Used in This Study
Figure 1. (a) Scheme of SiNW sensor modified with silane monolayers that have either different functional groups or different alkyl chain lengths.(b) Image of the SiNW sensor arrays used in this study. Twenty sensors are loaded on a custom-made circuit board (green color) and VOC exposuremeasurements are performed in a stainless steel chamber. (c) Ids (at Vds = 2 V) as a function of Vg for sensor 5 at exposures to chlorobenzene. (d) Ids(at Vds = 2 V) as a function of time during an exposure cycle at Vg= −18 V.
ACS Applied Materials & Interfaces Research Article
eliminating the trap groups, such as hydroxyl groups (OH),decreases the hysteresis effect and improves the sensingproperties even at different levels of humidity.25
In the present study, we have explored the sensing perfor-mance of SiNW FETs with a variety of surface modificationsupon exposure to different polar and nonpolar VOCs in an at-mosphere of real-world background humidity (relative hu-midity: 40%). We have systematically analyzed and compared:(i) SiNW FETs that were functionalized with a series ofmolecules having different electron-withdrawing and electron-donating end groups; and (ii) SiNW FETs that were func-tionalized with a series of molecules having similar functionalgroups but different backbone lengths. The analysis focused onthe following sensing parameters of the SiNW FET sensors: (i)changes in the threshold voltage (ΔVth), (ii) changes in themobility (Δμh), and (iii) changes in the on-current (ΔIon),compared to the baseline values under vacuum. Furthermore,we have analyzed the discriminative power of sensor-arraysbased on different combinations of molecularly modified SiNWFETs, using discriminant factor analysis and leave-one-outcross-validation. The optimized sensor-arrays allowed excellentdiscrimination between polar and nonpolar VOCs, as well asbetween the separate VOCs inside each group (polar and non-polar), even in the presence of a realistic humidity back-ground. The discriminative power of the different sensor-combinations is discussed in terms of their constituent surfacemodifications.
■ EXPERIMENTAL SECTIONSiNW Synthesis. p-Type SiNWs having 8.5 ± 1.5 μm length and
40 ± 8 nm diameter were grown on Si substrates by means of chemicalvapor deposition, using Au as catalyst and a 1:20 000 gas mixture ofSiH4 and B2H6, as described in refs 28 and 54. The grown SiNWs hada single crystalline Si core covered by 5 ± 1 nm of SiOx and containedpronounced low index facets, such as (111), (100), and (112).48,55
SiNW FET Fabrication. The fabrication of FETs based on alignedarrays of Si NWs was described in ref 28. Briefly, the Au catalyst at theopposite end of the grown SiNW attached to the growth substrate, theSiOx layer coat each Si NW, and the residual Au contamination of theSiNW surface were carefully removed by immersing the SiNWs’growth substrate for 15 s in buffered HF, followed by 2 min ofKI:I2:H2O (mass ratio 4:1:40). The SiNWs’ growth substrate was thenplaced in a vial with 5 mL ethanol. The vial was introduced into anultrasonication bath for 6 s to distribute the SiNWs from the growthsubstrate to the ethanol. The ethanol containing SiNWs was then spray-coated on pre-cleaned SiOx/Si(100) (p-type; resistivity, 0.001 Ω cm;300 nm thermal oxide; 10 nm Ti/200 nm Au back gate). The spraycoating process (described in ref 55) generated well-aligned NWarrays (∼1 NW/100 μm2).The SiNWs/substrates were then rinsedwith acetone, methanol, and ethanol and followed with a treatmentof 1 min 50 W oxygen and 5 s buffered HF. Finally, 18 pairs of 10 nmTi/110 nm Au interdigitated source-drain (S/D) electrodes (length,1300 μm; width, 2 μm; spacing, 2 μm) were applied on top of theSiNWs by means of photolithography (using Karl Suss MA6MaskAligner) and lift-off processes, as described in more detail elsewhere.28
The number of contacted SiNWs with S/D electrodes was examinedby optical microscopy (Olympus BX51RF-5; dark field mode) andscanning electron microscopy (e-LiNE, Raith, Dortmund, Germany).
Figure 2. The ΔVth, Δμh, and ΔION of bare and molecularly-modified SiNW FETs upon exposure to nonpolar VOCs at pa/po = 0.4. (a−c) Display ofthe changes in the parameters for different end groups. (d−f) Display of the changes in the parameters for different chain length.
ACS Applied Materials & Interfaces Research Article
Modification of the SiNW FETs. The fabricated SiNW FETsunderwent a cleaning process which included several steps: (i)sonication in acetone, methanol, and isopropanol for 1 min foreach solvent; (ii) drying in spin coater for 1 min at 4000 rpm; (iii)plasma process (30 min, 50 W oxygen). A silane solution was madewith toluene solvent for NH2(CH2)3(OCH3)3Si, C8H9Cl3Si,C16H33(OCH3)3Si modifications. For the other modifications, thesolvent was chloroform. The reaction time for the most of themodifications was 40 min. C8H9Cl3Si and C16H33(OCH3)3Si werethe exceptional cases, in the sense that the reaction time was 70 min.At the end of the reaction time, all the samples were washed with thesame solvent from the preparation solution and were sonicated for10 min and dried with a spin coater for 1 min at 4000 rpm. Thesamples were stored in vacuum oven (0.1 mtorr) at 100 °C. Table 1presents the studied modifications. As seen in the table, the molecularmodifications were divided into two main groups: (i) a series ofmolecules having different electron-withdrawing and electron-donatingend groups but with equivalent chain lengths and different linkinggroups; except for sensor 5, which had a different configuration of thebackbone; and (ii) a series of modifications with the same end groups(CH3) but with different backbone lengths.Surface Analysis. XPS analysis was performed to verify the pre-
sence of the relevant modification on the device’s surface. Bare andmolecularly modified SiNW arrays on 200 nm Al/Si(100) substrateswere tested by X-ray photoelectron spectroscopy (XPS) for surfacecharacterization (Thermo VG Scientific, Sigma Probe, England;monochromatized X-ray Al Kα 1486.6 eV source), as described
elsewhere.28,29 The XPS spectra was analyzed by a peak fitting software(XPSPEAK version 4.1) after subtraction of a Shirley background,while using C 1s (C−C) peak at 285.0 eV as a reference for bindingenergy calibration. Evaluation of the surface layer thickness was madeby spectroscopic ellipsometer (SE, M-2000 V, J. A. Woollam Co.,Inc.). Bare and molecularly modified SiOx/Si substrates were tested at60, 65, 70, 75, and 80° incidence angles on an open sample stage, asdescribed elsewhere.28 The molecular layer thickness was determinedby a three-phase functional layer/native oxide/Si(111) model. Anabsorption-free Cauchy dispersion of the refractive index with values ofn (1.46 at 1000 nm, 1.61 at 250 nm) was assumed for all molecularcap-layers. Thickness assessment was made by examining the samplesbefore and after modification.
Sensing Measurements of the Modified SiNW FETs. Thefabricated SiNW FET devices were bonded to TO-5 holders andloaded to a custom-made circuit board. The circuit board was theninserted into a stainless steel chamber (total volume of ∼100 mL)connected to a set of device analyzers. The sensing measurements toVOCs’ exposures were performed using Keithley 2636A systemSourceMeter and Keithley 3706 system Switch/Multimeter. ALabview-controlled automated flow system delivered pulses of VOCsat controlled concentrations. In a typical experiment, sensors werekept for 15 min in vacuum, followed by 20 min of VOC vapor in air,followed by another 5 min of vacuum environment to purge thesystem. Electrical measurements of source−drain current (Ids) vs. backgate voltage (Vg) at source−drain voltage (Vds) of 2 V were recordedprior, during, and after the exposure. The VOC vapor was generated
Figure 3. ΔVth, Δμh, and ΔION of bare and molecularly modified SiNW FETs on exposure to polar VOCs at pa/po = 0.4. (a−c) Display of thechanges in the parameters for different end groups. (d−f) Display of the changes in the parameters for different chain length.
ACS Applied Materials & Interfaces Research Article
through a bubbler system. Air was bubbled into VOCs liquid phase. Asa result, vapors from the VOCs were formed. Four increasing concen-trations of vapor in air were tested, pa/po= 0.02, 0.04, 0.1, and 0.4 (paand po represent VOC’s partial pressure and the total vapor pressure,respectively). The measurements were performed at ambient humiditybackground of 40% relative humidity. The background humiditywas introduced as a real-world confounding factor. Table 2 lists theexamined VOCs in the experiment.Data Analysis. The following parameters were extracted for each
sensor response: (i) changes in the threshold voltage (ΔVth), (ii) changesin the carrier mobility (Δμh), and (iii) changes in the on-current(ΔION), compared to the baseline values under vacuum. DiscriminantFactor Analysis (DFA)56 was performed for an advanced discrim-ination between different VOCs. DFA is a supervised, linear methodbased on a training set of classified information. In this method, neworthogonal axes (canonical variables) are found as a linear combi-nation of the input variables. These factors are calculated to: (i)minimize the variance inside each class, (ii) maximize the variancebetween the different classes. Leave one out cross-validation methodcalculates the discrimination accuracy. Given n measurements, theDFA was computed n times using n − 1 training vectors. The vectorleft out during the training part is projected onto the DFA modelwhich was built, creating a discrimination result. The discriminationaccuracy is valued as the averaged performance over the n tests.Statistically significant differences (p-values) between canonical
variables of the different classes were studied using the Wilcoxon test, anon-parametric statistical test for data that is not normally distributed.
Values p < 0.05 were considered to be a significant statisticalseparation between the two tested classes.
■ RESULTS
General Electrical Characteristics of the FETs. Two setsof SiNW FETs were prepared as described in the ExperimentalSection. The first set incorporated a series of molecules withdifferent end groups but with equivalent chain lengths anddifferent linking groups; except for sensor 5, which had a dif-ferent configuration of the backbone. The second setincorporated a series of modifications with the same endgroups (CH3) but with different backbone lengths and differentlinking groups. The XPS and ellipsometry results agreed wellwith the results reported previously28,29 and confirmed the pre-sence of a monolayer on the surface for all the sensors.Figure 1a presents a schematic illustration of the molecularly
modified SiNW FETs and Figure 1b presents a photo of SiNWFET arrays used in this study. Figure 1c shows the recorded Idsvs. Vg data of sensor 5 at exposures to chlorobenzene as arepresentative example. As seen in Figure 1c, the Ids values weresimilar for all vacuum steps. At the same Vg, on exposure tochlorobenzene, the Ids increased compared to the vacuum steps(Figure 1d). The higher was the pa/po of chlorobenzene thehigher the Ids. On the basis of the series of measured Ids vs.Vg curves, ΔVth, Δμh, and ΔION (ION is defined as the Ids at
Figure 4. ΔVth (V) for all the studied sensors at various pa/po values: (a) pa/po = 0.02; (b) pa/po = 0.04; (c) pa/po = 0.1; (d) pa/po = 0.4. The valueswere calculated by subtracting the average value of the initial vacuum step from the average value of the exposure to VOC.
ACS Applied Materials & Interfaces Research Article
Vg = −40 V) were calculated on exposure to VOCs. The resultswere plotted in Figures 2 and 3.Effect of the End Group on the Responses to
Nonpolar VOCs. As a control, the responses of SiNW FETwithout molecular layer modification (bare SiNW FET) weretested. The bare SiNW FET showed the largest response inΔVth on exposure to hexane (Figure 2a). Of all examinedmodifications, the bare SiNW FET showed the smallestresponses in ΔVth on exposure to all tested nonpolar VOCs.Moreover, the bare SiNW FET exhibited the smallest responsesin Δμh and ΔION on exposure to octane amongst all examinedVOCs (see Figures 2b and c).Sensor 1 exhibited negative ΔVth on exposure to all nonpolar
VOCs; sensors 2−5 exhibited positive ΔVth on exposure to allnonpolar VOCs (see Figure 2a). Among the tested sensors,sensor 5 displayed the largest ΔVth for all the examined VOCs.The ΔVth of sensors 3 and 5 exhibited a decreasing trend withthe increased chain length of the nonpolar VOCs. In contrast,sensors 1 and 2 showed the largest ΔVth on exposure to octane,compared to the other examined VOCs.All tested sensors exhibited positive Δμh values to all non-
polar VOCs (see Figure 2b). For the nonpolar VOCs, sensors1, 4, and 5 exhibited the largest Δμh when exposed to octane,whereas sensors 2 and 3 showed the lowest Δμh to octane.All examined sensors exhibited positive ΔION values to all
nonpolar VOCs (see Figure 2c). Sensor 2 showed the smallestΔION on exposure to all nonpolar VOCs, compared to other
sensors. For nonpolar VOCs, sensors 1, 3, and 4 displayed thesmallest ΔION on exposure to octane, while sensor 5 displayed adecreasing trend in ΔION as the chain length of the nonpolarVOCs increased.
Effect of Chain Length on the Responses to NonpolarVOCs. Sensor 6 exhibited negative ΔVth values, whereas sen-sors 7−9 exhibited positive ΔVth values on exposure to all non-polar VOCs (see Figure 2d). ΔVth of sensor 6 increased withthe chain length of the nonpolar VOCs. In contrast, the ΔVth ofsensor 7 decreased as the chain length of the VOCs increased.On exposure to octane, the ΔVth of sensors 7−9 decreased asthe alkyl chain length of the molecular layers increased.Sensors 6−9 exhibited positive Δμh on exposure to all non-
polar VOCs (see Figure 2e). Moreover, sensors 7 and 9exhibited increased Δμh values as the chain length of thenonpolar VOCs increased. On exposure to octane and decane,the Δμh of sensors 7, 8 and 9 showed an increasing trend as thealkyl chain length of the molecular layers increased.Similar to the trend observed in ΔVth, sensor 6 exhibited
negative ΔION values, whereas sensors 7−9 exhibited positivevalues ΔION on exposure to all nonpolar VOCs (see Figure 2f).Moreover, the ΔION of sensors 7−9 exhibited an increasing trendwith increased alkyl chain length of the molecular layers onexposure to all nonpolar VOCs.
Effect of the End Group on the Sensing Signals toPolar VOCs. As shown in Figure 3a, the bare SiNW FETexhibited negative ΔVth on exposure to ethanol and octanol
Figure 5. Δμh (cm2/(V s)) for all the studied sensors at various pa/po values: (a) pa/po =0.02; (b) pa/po = 0.04; (c) pa/po = 0.1; (d) pa/po = 0.4.
ACS Applied Materials & Interfaces Research Article
Figure 6. ΔION(A) for all the studied sensors at various pa/po values: (a) pa/po =0.02; (b) pa/po =0.04; (c) pa/po = 0.1; (d) pa/po = 0.4.
Table 3. Classification Accuracy and p-Value of theDiscrimination between Polar and Nonpolar Groups withDifferent Sensor Combinations And with a Bare Sensor Alone
and nil ΔVth on exposure to hexanol. Exposure of the bareSiNW FET for the rest of the VOCs exhibited positive ΔVth.The largest ΔVth (−2.4 ± 0.39 V) was obtained on exposure ofthe bare SiNW FET to ethanol.The bare SiNW FET exhibited negative Δμh (−0.14 ±
0.04 cm2/(V s)) on exposure to water and positive Δμh on ex-posure to all other examined VOCs (see Figure 3b). The largestΔμh (1.38±0.05 cm2/(V s)) was observed on exposure toethanol. The Δμh of bare SiNW FET decreased as the chainlength of alcohol VOCs increased.The bare SiNW FET exhibited the largest changes in ΔION
(1 × 10⁻⁵ ± 1.03 × 10⁻⁷ A) on exposure to ethanol and thesmallest ΔION on exposure to decanol (2.54 × 10⁻⁶ ± 1.54 ×10⁻⁷ A). The ΔION value for the water exposure was negative(−2.91 × 10⁻⁶ ± 1.33 × 10⁻⁷ A). For this sensor, a decreasingtrend of ΔION was observed as the chain length of alcoholVOCs increased (see Figure 3c).Sensor 5 exhibited the largest ΔVth for all the VOCs, com-
pared to other sensors (see Figure 3a). Sensors 2, 3, and 5presented positive ΔVth values for all examined polar VOCs.Sensor 1 displayed positive ΔVth values upon exposure tocyclohexanone, while it showed negative responses to the restof the polar VOCs. Sensors 1 and 4 were the only sensors thatpresented a negative ΔVth on exposure to water. Sensor 1exhibited an increasing trend in ΔVth with the chain length ofalcohol VOCs: i.e., ethanol (−0.62 ± 0.2 V), hexanol (−1.29 ±0.24 V) and octanol (−5.12 ± 0.29 V). In contrast, sensor 2exhibited a decreasing trend in ΔVth as the chain length of thesealcohols increased. A similar decreasing trend in ΔVth asobserved in sensor 2 was shown in sensor 5 with the exceptionof ethanol (i.e. hexanol, octanol and decanol).Sensors 2−4 exhibited negative Δμh for water, while positive
for all the other VOCs (see Figure 3b). Among the tested polarVOCs, sensors 1−4 displayed the largest Δμh value on exposureto buthylether. As the chain length of alcohol VOCs increased(i.e. ethanol, hexanol and octanol), the Δμh of sensor 2 showedan increasing trend. However, no clear chain length dependenttrend was observed in the other sensors.Sensor 2 showed the smallest ΔION on exposure to all
polar VOCs, compared to sensors 1 and 3−5 (see Figure 3c).Sensor 5 was the only sensor that exhibited positive ΔION onexposure to all polar VOCs. Sensors 2−4 presented negativeΔION on exposure to water and possible values for all other
VOCs. Buthylether presented the largest ΔION for sensors 2−4,compared to all other examined polar VOCs. ΔION of sensor 3presented an increasing trend as the chain length of alcohol VOCsincreased (i.e. ethanol, hexanol and octanol). Sensor 5 exhibitedthe largest positive ΔION values for ethanol (9.57 × 10⁻⁶ ± 9.45 ×10⁻⁸ A) and buthylether (9.31 × 10⁻⁶ ± 1.85 × 10⁻⁷ A) and thesmallest ΔION on exposure to octanol (3.2 × 10⁻⁶ ± 1.85 ×10⁻⁷ A) compared to other polar VOCs. As the chain length ofalcohol VOCs increased (i.e. ethanol, hexanol and octanol), theΔION of sensor 5 showed a decreasing trend.
Effect of the Chain Length on the Sensing Signals toPolar VOCs. Sensor 9 exhibited the most negligible ΔVthcompared to sensors 6−8 (see Figure 3d). Sensor 6 exhibitednegative ΔVth for all examined polar VOCs, except for hexanol,which showed a small positive ΔVth. Moreover, sensor 6displayed the largest ΔVth (−3.76 ± 0.51 V) on exposure toethanol, compared to the other polar VOCs. Upon exposure tohexanol, trimethylbenzene, buthylether, and water, ΔVth ofsensors 7−9 exhibited a decreasing trend as the alkyl chainlength of the molecular layers increased. In addition, sensor 7showed the largest ΔVth (7.22 ± 0.65 V) on exposure to water,compared to all other examined polar VOCs. As the chainlength of alcohol VOCs increased (i.e. hexanol, octanol anddecanol), the ΔVth of sensor 8 showed a decreasing trend.Sensors 6 exhibited the positive Δμh in response to all polar
VOCs (see Figure 3e). On exposure to water, sensor 6exhibited a positive Δμh value, whereas sensors 7−9 exhibitednegative Δμh value. Sensor 6 displayed the largest Δμh (1.38 ±0.05 cm2/(V s)) on exposure to ethanol, compared to the otherpolar VOCs. Likewise, sensor 9 exhibited the largest Δμh (0.79 ±0.08 cm2/(V s)) for buthylether and the smallest Δμh on exposureto decanol (0.17 ± 0.03 cm2/(V s)). As the chain length of thealcohol VOCs increased (i.e. hexanol, octanol and decanol), theΔμh of sensor 8 showed a decreasing trend. Additionally, sensor 8showed the smallest Δμh value for trimethylbenzene andchlorobenzene exposures (0.44−0.67 cm2/(V s)) and the largestΔμh value for hexanol (1.53 ± 0.08 cm2/(V s)). Sensors 7 and 9exhibited an increasing trend in Δμh as the chain length of alcoholVOCs increased (i.e. ethanol, hexanol and octanol).
Figure 8. Discrimination accuracy between groups of polar VOCs,nonpolar VOCs and water by a combination of all the sensors. Thearrow direction indicates an increasing concentration of water frompa/po = 0.02 to pa/po= 0.4. For the polar and nonpolar groups, thistrend was not evidenced.
Table 5. Discrimination Accuracy of Alcohols, Polar andNonpolar VOCs, with Individual Sensors and SensorCombinations at RH = 40%
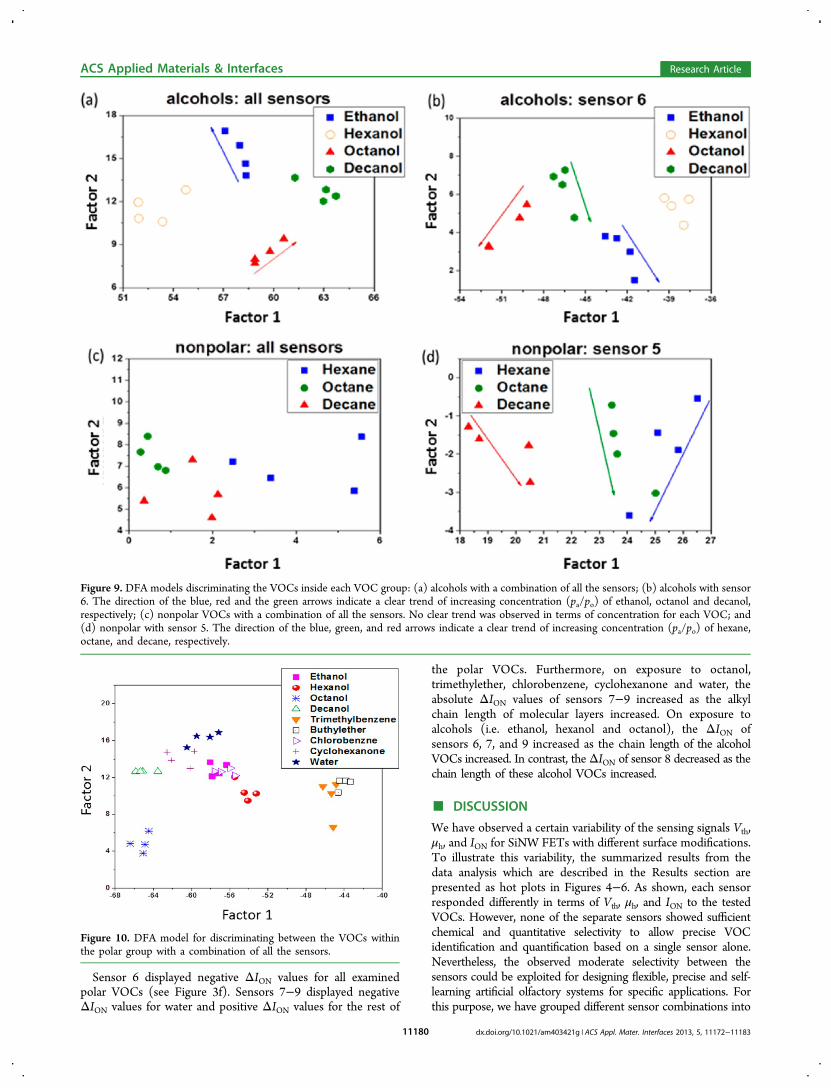
Sensor 6 displayed negative ΔION values for all examinedpolar VOCs (see Figure 3f). Sensors 7−9 displayed negativeΔION values for water and positive ΔION values for the rest of
the polar VOCs. Furthermore, on exposure to octanol,trimethylether, chlorobenzene, cyclohexanone and water, theabsolute ΔION values of sensors 7−9 increased as the alkylchain length of molecular layers increased. On exposure toalcohols (i.e. ethanol, hexanol and octanol), the ΔION ofsensors 6, 7, and 9 increased as the chain length of the alcoholVOCs increased. In contrast, theΔION of sensor 8 decreased as thechain length of these alcohol VOCs increased.
■ DISCUSSION
We have observed a certain variability of the sensing signals Vth,μh, and ION for SiNW FETs with different surface modifications.To illustrate this variability, the summarized results from thedata analysis which are described in the Results section arepresented as hot plots in Figures 4−6. As shown, each sensorresponded differently in terms of Vth, μh, and ION to the testedVOCs. However, none of the separate sensors showed sufficientchemical and quantitative selectivity to allow precise VOCidentification and quantification based on a single sensor alone.Nevertheless, the observed moderate selectivity between thesensors could be exploited for designing flexible, precise and self-learning artificial olfactory systems for specific applications. Forthis purpose, we have grouped different sensor combinations into
Figure 10. DFA model for discriminating between the VOCs withinthe polar group with a combination of all the sensors.
Figure 9. DFA models discriminating the VOCs inside each VOC group: (a) alcohols with a combination of all the sensors; (b) alcohols with sensor6. The direction of the blue, red and the green arrows indicate a clear trend of increasing concentration (pa/po) of ethanol, octanol and decanol,respectively; (c) nonpolar VOCs with a combination of all the sensors. No clear trend was observed in terms of concentration for each VOC; and(d) nonpolar with sensor 5. The direction of the blue, green, and red arrows indicate a clear trend of increasing concentration (pa/po) of hexane,octane, and decane, respectively.
ACS Applied Materials & Interfaces Research Article
an array and studied their discriminative power for polar andnonpolar VOCs.We have evaluated systematically the discriminative power of
different combinations of the nine molecularly modified SiNWFETs in this study (see Table 1). For this purpose, we builtpredictive models for the different sensor arrays, usingdiscriminant function analysis (DFA). The classification successof the DFA models was tested using leave-one-out crossvalidation.Discrimination between Polar vs. Nonpolar by SiNW
FET Array. We started our systematic comparative study bydiscriminating between polar and nonpolar groups. We com-pared the performance of the bare SiNW FET alone to theimproved performance of four different sensor combinations:(i) all ten sensors together (nine molecularly modified SiNWFETs and 1 bare Si NW FET); (ii) five SiNW FETs that werefunctionalized with a series of molecules having differentelectron-withdrawing and electron-donating end groups; (iii)four Si NW FETs that were functionalized with a series ofmolecules having similar functional groups but differentbackbone lengths; and (iv) a selection of four molecularlymodified SiNW FETs that contained different end-groups anddifferent chain lengths.Table 3 lists the p-values of the separation in the various DFA
models (calculated using Wilxocson test for data that is notnormally distributed) and the discrimination accuracy after cross-validation. Foreseeably, combining all ten sensors gave the mostaccurate results with 94% classification success, whereas the
classification by the bare (SiNW FET) sensor was almostrandom. Clearly, the molecularly modified SiNW FETs showedsignificantly improved discrimination accuracy between polarand nonpolar groups, compared to the bare sensor. Figure 7compares the DFA map for these two extreme cases. Combiningthe sensors that were functionalized with monolayers of differentchain length provided a discrimination accuracy of 92%. On theother hand, combining the sensors that were modified withdifferent functional groups produced clearly inferior results inthis application (classification accuracy: 67%).
Discrimination between Polar VOCs, Nonpolar VOCs,and Water. In the next step, we have refined the previousapplication to discriminate polar from nonpolar VOCs otherthan water. For this purpose we have attempted a three-folddiscrimination, treating water vapor samples of different RHlevels as separate group of VOCs. The classification accuraciesafter cross-validation of the different sensor arrays are given inTable 4. The discriminative power was greatly enhanced byincluding the modified SiNW FETs. As before, the full arrayof 10 sensors gave the best, near perfect discrimination (seeFigure 8), whereas the bare sensor alone produced entirelyrandom results in this case. The discrimination by sensorshaving different chain length was slightly better than by sensorshaving different end-groups, but in this application, the dif-ferences were less pronounced than for the polarity separationwithout considering water as a separate group. Indeed, thethree sensor combinations (ii), (iii), and (iv) yielded compar-able classification accuracy for the present application.
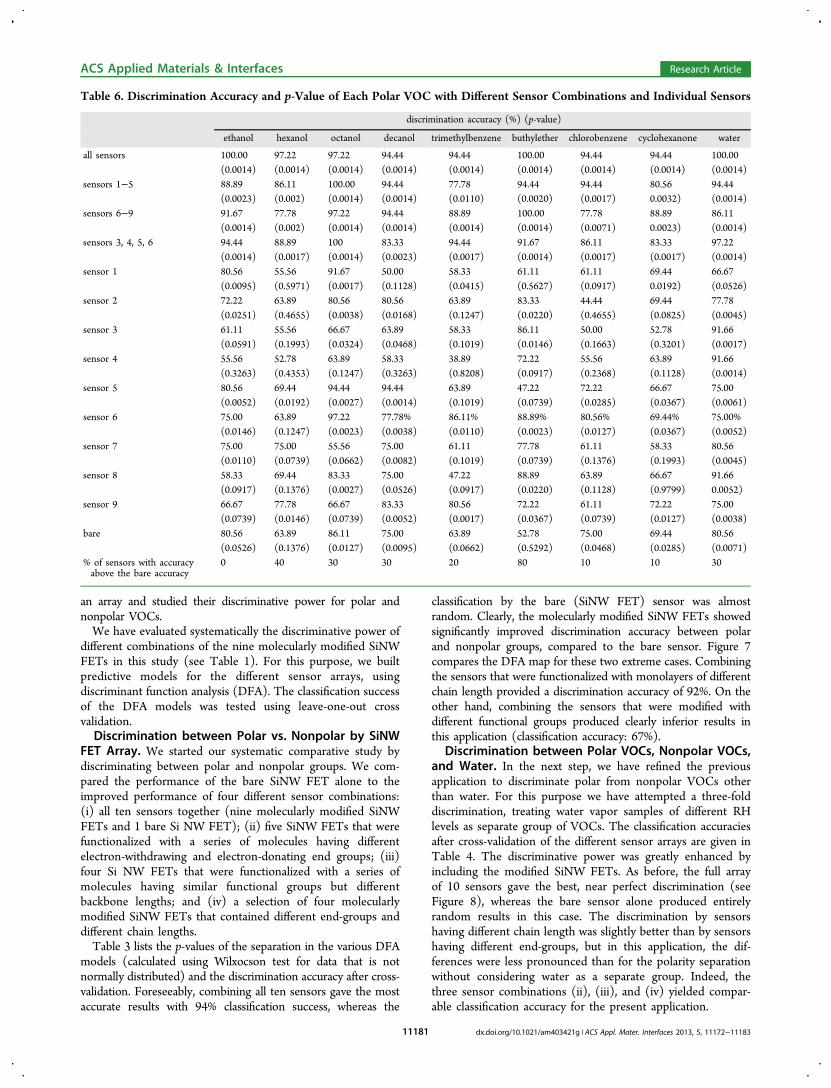
Table 6. Discrimination Accuracy and p-Value of Each Polar VOC with Different Sensor Combinations and Individual Sensors
discrimination accuracy (%) (p-value)
ethanol hexanol octanol decanol trimethylbenzene buthylether chlorobenzene cyclohexanone water
Subclassification of VOCs. Further DFA models werederived to investigate the discrimination accuracy of separateVOCs within well-defined chemical groups (alcohols, otherpolar and nonpolar compounds) with individual sensors andcombinations of the modified sensors. The discriminationaccuracy within each group is listed in Table 5. The results fordiscriminating different polar VOCs from each other variedamong the different sensor arrays and showed the same trendthat was observed in the previous two applications. However,the discrimination among the alcohols and among the nonpolarVOCs did not vary at all among the different sensor combina-tions. Perfect classification (100% accuracy) was achieved forthe alcohols with all tested combinations, and very good, stableresults (83% accuracy) were obtained for the nonpolar VOCs.Interestingly, optimal classification results could be reached fordiscrimination alcohols (sensor 6) and nonpolar VOCs (sensor5) with particular single sensors, but not for separating thepolar VOCs. Figure 9 compares the DFA models based on allsensors and on the respective single best sensor for the alcoholsand nonpolar VOCs. It should be noted that in some of theDFA maps, a clear trend can be seen in terms of the VOCconcentration (pa/po). Figure 10 shows the best result (all 10sensors) for the polar subgroup.Identification of a Specific Polar VOC by SiNW FETs
Array. We have studied the identification of particular polar
VOC from among the overall group of the polar VOCs. Table 6summarizes the discrimination accuracy and the p-values foreach of the studied VOCs. As could be seen in the table, thecombination of all the 10 sensors had the highest discrim-ination accuracy for all the VOCs. The discrimination accuracyof the sensor array with different chain length was not sig-nificantly different from the accuracy of the array having purelyend group variations. Some modified sensors showed betterdiscrimination compared to the bare sensor, whereas sensorswith other modifications showed inferior results. For thealcohols, chlorobenzene, cyclohexanone, and water, better dis-crimination accuracy was achieved by the bare sensor (thepercentage of the number of the sensors with accuracy abovethe bare SiNW FET accuracy was under 40%).
Identification of a Specific Nonpolar VOC by SiNWFETs Array. Finally, we have tested the identification of par-ticular nonpolar VOCs from among the group of the nonpolarcompounds (see Table 7). We observed that the addition ofsurface modification significantly improved the ability to dis-criminate a specific nonpolar VOC from the other nonpolarVOCs. This can also be seen by the discrimination accuracy ofeach individual sensor and the sensors’ combinations comparedto the bare sensor.
■ SUMMARY AND CONCLUSIONS
We have demonstrated that molecularly modified SiNW FETsare powerful tools for VOC detection and discriminations in anatmosphere with real-world background humidity. Three mainsensing parameters of the SiNW FETs as compared to the base-line values in initial vacuum were selected as sensing signals:threshold voltage change (ΔVth), mobility change (Δμh) andIon current change (ΔIon) on exposure to VOCs. A systematicoverview was provided of the effect of different types of surfacemodifications, including different electron-withdrawing, elec-tron-donating end groups, and different backbone lengths.Systematic trends of the surface modification type wereestablished by analyzing the performance of the molecularlymodified SiNW FETs as elements of sensor arrays for sensingVOCs. The sensor combinations having optimal discriminativepower were identified and discussed in terms of theirconstituent surface modifications. The optimized sensor arraysallowed excellent VOC discrimination according to theirpolarity. Additionally, the optimized sensors array allowedexcellent discrimination between the separate VOCs insideeach group (alcohols, other polar and nonpolar), even in thepresence of a realistic humidity background. The resultspublished here show that the sensitivity and accuracy of thecross-reactive array can be tailored to detect the molecules ofinterest, using appropriate combinations of molecule-termi-nated Si NW FETs. Ultimately, this approach could lead to thedevelopment of cost-effective, lightweight, low-power, non-invasive sensors for the widespread detection of VOCs in real-world applications, including environmental monitoring, home-land security, food safety, and health care devices for diseasediagnosis from breath or skin.
■ ACKNOWLEDGMENTSThe research leading to these results has received finding fromthe FP7-Health Program under the LCAOS (Grant 258868).The authors acknowledge Dr. Silke Christiansen (Max-Planck-Institute for the Science of Light, Germany) for providing someof the SiNWs reported in the current study.
■ REFERENCES(1) Konvalina, G.; Haick, H. Acc. Chem. Res. 2013, DOI: 10.1021/ar400070m.(2) Broza, Y. Y.; Haick, H. Nanomedicine 2013, 8, 785−806.(3) Hakim, M.; Broza, Y. Y.; Barash, O.; Peled, N.; Phillips, M.;Amann, A.; Haick, H. Chem. Rev. 2012, 112, 5949−5966.(4) Tisch, U.; Billan, S.; Ilouze, M.; Phillips, M.; Peled, N.; Haick, H.CML-Lung Cancer 2012, 5, 107−117.(5) Xu, Z. Q.; Broza, Y. Y.; Ionsecu, R.; Tisch, U.; Ding, L.; Liu, H.;Song, Q.; Pan, Y. Y.; Xiong, F. X.; Gu, K. S. Br. J. Cancer 2013, 108,941−950.(6) Barash, O.; Peled, N.; Hirsch, F. R.; Haick, H. Small 2009, 5,2618−2624.(7) Amal, H.; Ding, L.; B., L. B.; Tisch, U.; Xu, Z. Q.; Shi, D. Y.;Zhao, Y.; Chen, J.; Sun, R. X.; Liu, H.; Ye, S. L.; Tang, Z. Y.; Haick, H.Int. J. Nanomed. 2012, 7, 4135−4146.(8) Barash, O.; Peled, N.; Tisch, U.; Bunn, P. A.; Hirsch, F. R.; Haick,H. Nanomedicine 2012, 8, 580−589.(9) Hakim, M.; Billan, S.; Tisch, U.; Peng, G.; Dvrokind, I.; Marom,O.; Abdah-Bortnyak, R.; Kuten, A.; Haick, H. Br. J. Cancer 2011, 104,1649−1655.(10) Peng, G.; Hakim, M.; Broza, Y. Y.; Billan, S.; Abdah-Bortnyak,R.; Kuten, A.; Tisch, U.; Haick, H. Br. J. Cancer 2010, 103, 542−551.(11) Banday, K. M.; Pasikanti, K. K.; Chan, E. C. Y.; Singla, R.; Rao,K. V. S.; Chauhan, V. S.; Nanda, R. K. Anal. Chem. 2011, 83, 5526−5534.(12) Phillips, M.; Cataneo, R. N.; Condos, R.; Ring Erickson, G. A.;Greenberg, J.; La Bombardi, V.; Munawar, M. I.; Tietje, O. Tuberculosis2007, 87, 44−52.(13) Haick, H.; Hakim, M.; Patrascua, M.; Levenberg, C.; Shehada,N.; Nakhoul, F.; Abassi, Z. ACS Nano 2009, 3, 1258−1266.(14) Marom, O.; Nakhoul, F.; Tisch, U.; Shiban, A.; Abassi, Z.;Haick, H. Nanomedicine 2012, 7, 639−650.(15) Tisch, U.; Aluf, Y.; Ionescu, R.; Nakhleh, M.; Bassal, R.; Axelrod,N.; Robertman, D.; Tessler, Y.; Finberg, J. P. M.; Haick, H. ACS Chem.Neurosci. 2012, 3, 161−166.(16) Tisch, U.; Schlesinger, I.; Ionescu, R.; Nassar, M.; Axelrod, N.;Robertman, D.; Tessler, Y.; Azar, F.; Marmur, A.; Aharon-Peretz, J.;Haick, H. Nanomedicine 2013, 8, 43−56.(17) Ionescu, R.; Broza, Y.; Shaltieli, H.; Sadeh, D.; Zilberman, Y.;Feng, X.; Glass-Marmor, L.; Lejbkowicz, I.; Mullen, K.; Miller, A.;Haick, H. ACS Chem. Neurosci. 2011, 2, 687−693.(18) Tisch, U.; Haick, H. Rev. Chem. Eng. 2010, 26, 171−179.(19) Tisch, U.; Haick, H. MRS Bull. 2010, 35, 797−803.(20) Konvalina, G.; Haick, H. ACS Appl. Mater. Interfaces 2012, 4,317−325.(21) Wallace, L. A. Annu. Rev. Energy Environ. 2001, 26, 269−301.(22) Zilberman, Y.; Ionescu, R.; Feng, X.; Mullen, K.; Haick, H. ACSNano 2011, 5, 6743−6753.(23) Pinto, D. M.; Blande, J. D.; Souza, S. R.; Nerg, A. M.;Holopainen, J. K. J. Chem. Ecol. 2010, 36, 22−34.(24) McAlpine, M. C.; Ahmad, H.; Wang, D. W.; Heath, J. R. Nat.Mater. 2007, 6, 379−384.(25) Paska, Y.; Haick, H. ACS Appl. Mater. Interfaces 2012, 4, 2604−2617.(26) Paska, Y.; Stelzner, T.; Assad, O.; Tisch, U.; Christiansen, S.;Haick, H. ACS Nano 2012, 6, 335−345.(27) Paska, Y.; Stelzner, T.; Christiansen, S.; Haick, H. ACS Nano2011, 5, 5620−5626.(28) Wang, B.; Haick, H. ACS Appl. Mater. Interfaces 2013, 5, 2289−2299.
(29) Wang, B.; Haick, H. ACS Appl. Mater. Interfaces 2013, 5, 5748−5756.(30) Ammu, S.; Dua, V.; Agnihotra, S. R.; Surwade, S. P.; Phulgirkar,A.; Patel, S.; K., M. S. J. Am. Chem. Soc. 2012, 134, 4553−4556.(31) Kim, I. D.; Rothschild, A.; Lee, B. H.; Kim, D. Y.; Jo, S. M.;Tuller, H. L. Nano Lett. 2006, 6, 2009−2013.(32) Salehi-Khojin, A.; Estrada, D.; Lin, K. Y.; Bae, M. H.; Xiong, F.;Pop, E.; Masel, R. I. Adv. Mater. 2012, 24, 53−57.(33) Zhang, T.; S., M.; Myung, N. V.; Deshusses, M. A.Nanotechnology 2008, 19, 332001.(34) Gao, X. P. A.; Zheng, G. F.; Lieber, C. M. Nano Lett. 2010, 10,547−552.(35) Cui, Y.; Zhong, Z.; Wang, D.; Wang, W. U.; Lieber, C. M. NanoLett. 2003, 3, 149−152.(36) Braga, D.; Horowitz, G. Adv. Mater. 2009, 21, 1473−1486.(37) Tang, H.; Zhu, L. G.; Zhao, L.; Zhang, X. J.; Shan, J.; Lee, S. T.ACS Nano 2012, 6, 7814−7819.(38) Cui, Y.; Duan, X. F.; Hu, J. T.; Lieber, C. M. J. Phys. Chem. B2000, 104, 5213−5216.(39) Ford, A. C.; Ho, J. C.; Chueh, Y. L.; Tseng, Y. C.; Fan, Z.; Guo,J.; Bokor, J.; Javey, A. Nano Lett. 2009, 9, 360−365.(40) Wang, B.; Stelzner, T.; Dirawi, R.; Assad, O.; Shehada, N.;Christiansen, S.; Haick, H. ACS Appl. Mater. Interfaces 2012, 4, 4251−4258.(41) Dresselhaus, M. S.; Dresselhaus, G.; Eklund, P. C. Science ofFullerenes and Carbon Nanotubes; Academic Press: San Diego, CA,1996.(42) Wolf, S., Silicon Processing for the VLSI Era, Vol. 2: ProcessIntegration; Lattice Press: Sunset Beach, CA, 1990; p 52.(43) Wolf, S.; Tauber, R. N., Silicon Processing for the VLSI Era, Vol. 1:Process Technology; Lattice Press: Sunset Beach, CA, 2000.(44) Cui, Y.; Wei, Q.; Park, H.; Lieber, C. M. Science 2001, 293,1289−92.(45) Stern, E.; Vacic, A.; Reed, M. A. IEEE Trans. Electron Dev. 2008,55, 3119−3130.(46) Puniredd, S. R.; Assad, O.; Stelzner, T.; Christiansen, S.; Haick,H. Langmuir 2011, 27, 4764−4771.(47) Puniredd, S. R.; Assad, O.; Haick, H. J. Am. Chem. Soc. 2008,130, 9184−9185.(48) Assad, O.; Puniredd, S. R.; Stelzner, T.; Christiansen, S.; Haick,H. J. Am. Chem. Soc. 2008, 130, 17670−17671.(49) Bashouti, M. Y.; Stelzner, T.; Berger, A.; Christiansen, S.; Haick,H. J. Phys. Chem. C 2008, 112 (49), 19168−19172.(50) Bashouti, M. Y.; Stelzner, T.; Christiansen, S.; Haick, H. J. Phys.Chem. C. 2009, 113, 14823−14828.(51) Bashouti, M. Y.; Tung, R. T.; Haick, H. Small 2009, 5, 2761−2769.(52) Bashouti, M. Y.; Sardashti, K.; Schmitt, S. W.; Pietsch, M.;Ristein, J.; Haick, H.; Christiansen, S. H. Prog. Surf. Sci. 2013, 88, 39−60.(53) Engel, Y.; Elnathan, R.; Pevzner, A.; Davidi, G.; Flaxer, E.;Patolsky, F. Angew. Chem. Int. Ed. 2010, 49, 6830−6835.(54) Stelzner, T.; Andra, G.; Wendler, E.; Wesch, W.; Scholz, R.;Gosele, U.; Christiansen, S. Nanotechnology 2006, 17, 2895−2898.(55) Assad, O.; Leshansky, A. M.; Wang, B.; Stelzner, T.;Christiansen, S.; Haick, H. ACS Nano 2012, 6, 4702−4712.(56) Brereton, R. G. Chemometrics, Application of Mathematics andStatistics to Laboratory Systems; Ellis Horwood: Chichester, U.K., 1990.
ACS Applied Materials & Interfaces Research Article