35

Discuss what this map shows. In your book write three concise bullet points to describe what this map shows. Explain what the Brandt Line is.


Most people link development to wealth. We divide the world up depending on how much money we think a country has. We link how much money a country has to the type of jobs people do, the level of education people receive, the type of homes people live in. We are used to thinking of the world in terms of the map below.

Geographers are moving on from the simple idea of MEDCs and LEDCs. Countries now tend to be classed as either: Low Income Countries (LICs) Newly Emerging Economies (NEESs) High Income Countries (HICs)
LICs tend to have……
NEEs tend to have …….
HICs tend to have ……..
Average incomes per person of less than $1,045.

How do we know if a country is rich or poor?
We measure its level of development or wealth.
How do Geographers do this?
By using Development Indicators. They tell us important information about a country.
TASK – brainstorm 10 pieces of data that you think could be used as Development Indicators:
Some of the most well known Development Indicators are: Adult Literacy
Rate
Infant Mortality Life Expectancy Daily calories
consumed
% of the population with access to clean water
Gross Domestic Product

What is the HDI? (Human Development Index)
How do countries compare?
1. Using Page 182 in New
Wider World explain how
the HDI is calculated and
what the result means.
Every Development Indicator we have looked at so far today is a single measure of Development. In 1990 the United Nations created the HDI. This is a combined measure of life expectancy, % of people who attend school and wealth per person. The outcome, for each country, is a number between 0 and 1 (Your HDI number). The closer to 1 the better your level of overall development is.

HDI for
2014
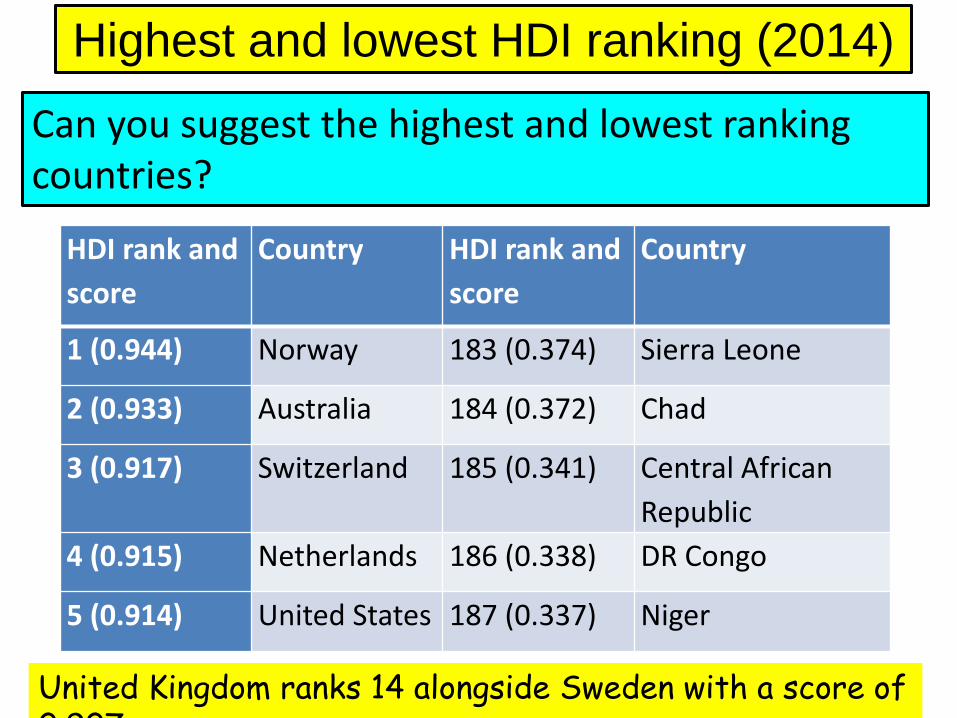
Highest and lowest HDI ranking (2014)
Can you suggest the highest and lowest ranking countries?
HDI rank and
score
Country HDI rank and
score
Country
1 (0.944) Norway 183 (0.374) Sierra Leone
2 (0.933) Australia 184 (0.372) Chad
3 (0.917) Switzerland 185 (0.341) Central African
Republic
4 (0.915) Netherlands 186 (0.338) DR Congo
5 (0.914) United States 187 (0.337) Niger
United Kingdom ranks 14 alongside Sweden with a score of 0.907
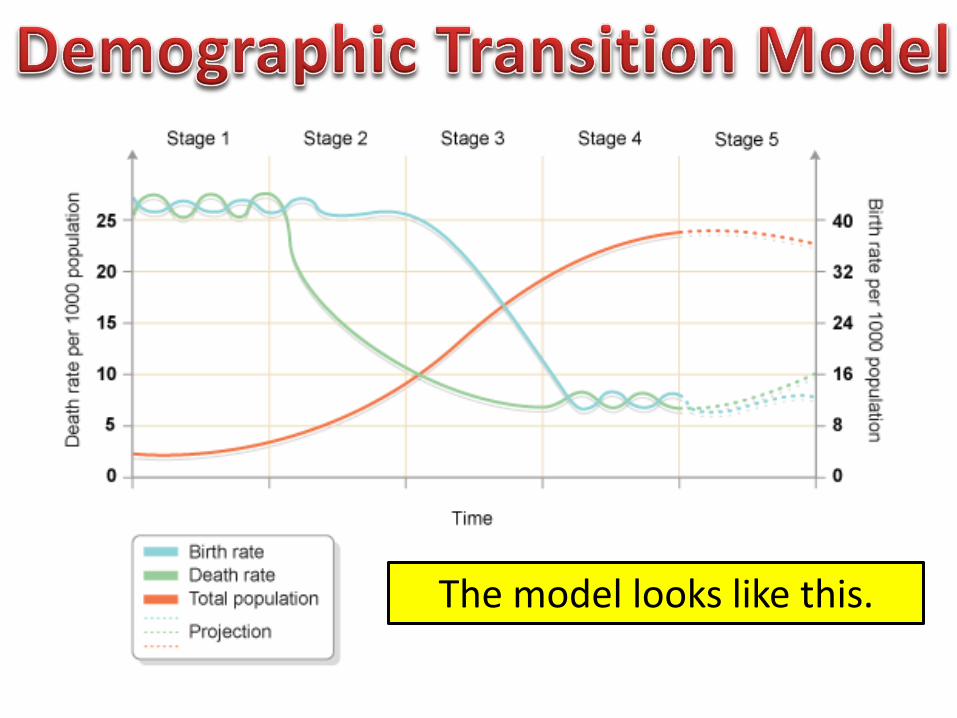
The model looks like this.
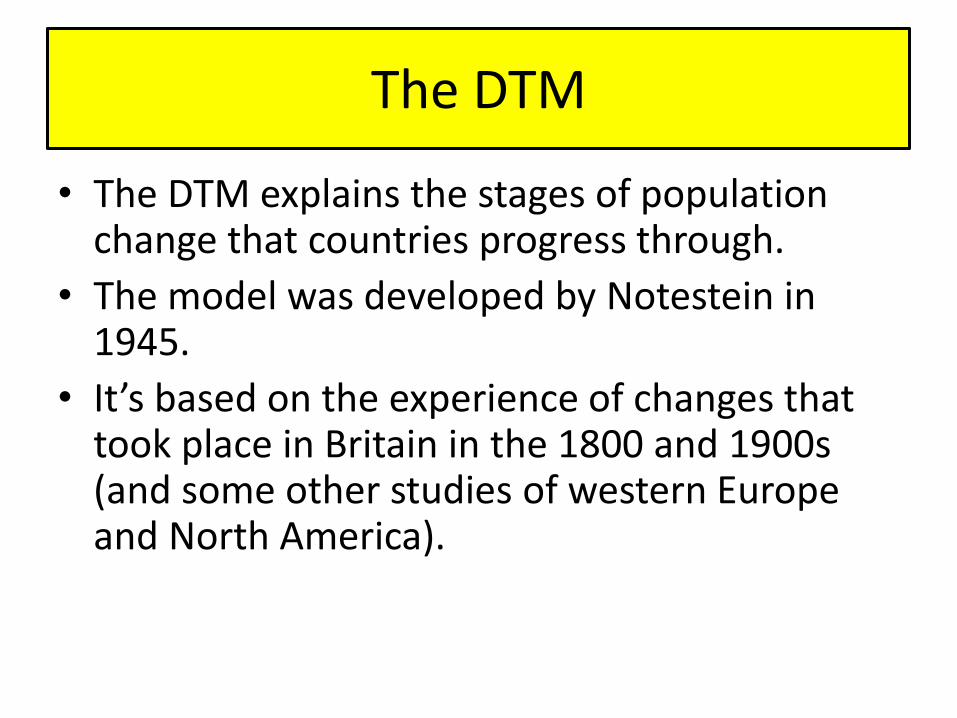
The DTM
• The DTM explains the stages of population change that countries progress through.
• The model was developed by Notestein in 1945.
• It’s based on the experience of changes that took place in Britain in the 1800 and 1900s (and some other studies of western Europe and North America).

The DTM
• Birth rates, death rates and total population were seen to have gone through a series of stages, in a logical order.
• Notestein believed that all countries would pass through each stage of the model as they advanced socially and economically and were taken over by the process of modernisation.
• Notestein believed that population change was closely linked to economic change – birth rates and death rates fall as standards of living and levels of wealth increase.

High fluctuating: High birth rate and high death rate, therefore there is little population increase as one cancels out the other. High BR and DR generally means that both are about 35 per 1000. Often referred to as the pre-industrial phase.

Early expanding: The BR remains high but the DR starts to fall rapidly, to about 20 per 1000. This results in significant population increase. Start of the industrial phase. To move from Stage one to Stage Two the DR must go into permanent and continuous decline.

Late expanding: The BR now begins to decline (to about 16 per 1000). The DR is still in decline but is not falling as sharply as it did before (about 12 per 1000). Resulting in steady population increase.

Low fluctuating: Both birth rates and death rates remain low. BR 12 – 16 per 1000 DR 10 – 12 per 1000 Steady, low population growth Post industrial
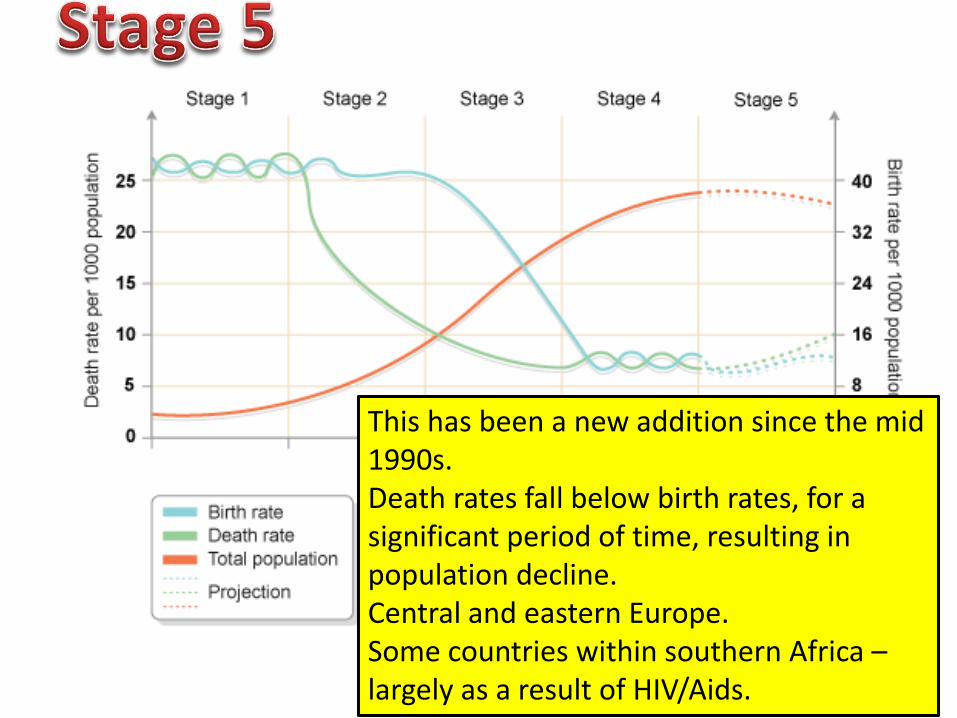
This has been a new addition since the mid 1990s. Death rates fall below birth rates, for a significant period of time, resulting in population decline. Central and eastern Europe. Some countries within southern Africa – largely as a result of HIV/Aids.

An unequal world
• 15% of the world’s population live on less than $1 a day.
• 77% live on less than $10 a day.
• 24% of the world’s population have no access to electricity.
• 16% of the world’s population do not have access to safe clean water.
• 39% do not have access to adequate toilets.
• 8% never get enough to eat, ever!
• Around one in five people aged 15 and over cannot read or write.
• Around 25,000 young people die every day, mainly from causes linked to poverty.

Physical causes The actual physical geography of some counties can make development difficult. Some examples:
• The most landlocked countries on Earth are in Africa. A landlocked country is a country which is only bordered by land. With no access to the seas, a country is cut off from seaborne trade, which is important for economic growth.
• Extreme weather, such as cyclones, droughts and foods, often hits tropical regions – parts of Africa are particularly badly affected. An extreme weather season can slow development and it can be costly to repair damaged infrastructure.
Insert map of landlocked Africa.
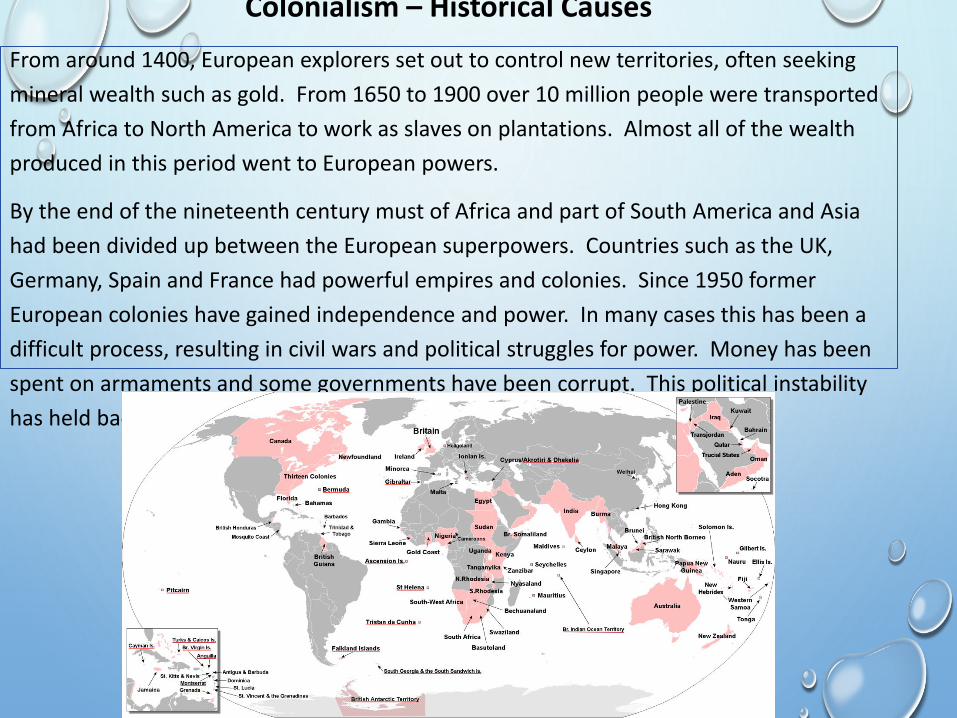
Colonialism – Historical Causes
From around 1400, European explorers set out to control new territories, often seeking
mineral wealth such as gold. From 1650 to 1900 over 10 million people were transported
from Africa to North America to work as slaves on plantations. Almost all of the wealth
produced in this period went to European powers.
By the end of the nineteenth century must of Africa and part of South America and Asia
had been divided up between the European superpowers. Countries such as the UK,
Germany, Spain and France had powerful empires and colonies. Since 1950 former
European colonies have gained independence and power. In many cases this has been a
difficult process, resulting in civil wars and political struggles for power. Money has been
spent on armaments and some governments have been corrupt. This political instability
has held back development.

Many richer countries have a long history of industrial and
economic development. Whilst some countries, particular in Asia
and South America (for example, China, Malaysia and Mexico)
have recently emerged as industrialised nations, many other
countries have yet to experience any significant economic growth.
Abilit
y to
trade
with
others

Economic causes
There is often more supply than demand for raw
materials, which keep prices low. Processing, which adds
value, takes place in the richer developed countries. In
this way, the rich countries get richer and the poorer
countries are not able to develop.
LICs and NEEs have traditionally exported primary
products such as minerals and agricultural products. In
the last 20 years many of these countries have developed
manufacturing. Manufacturing products now make up
about 80 per cent of the exports of NEEs. Some countries
have trade surpluses, while others have trade deficits.
This often leads to a ‘debt trap’ that makes further
development difficult.

WHAT CAUSES POVERTY AND A LACK OF DEVELOPMENT?
• POOR EDUCATION
• UNRELIABLE WATER SUPPLY
• HOSTILE CLIMATE
• COLONIALISM
• NOT ABLE TO IMPORT
MANUFACTURED GOODS
• LACK OF NATURAL
RESOURCES
• TARIFFS ON GOODS
• TNCS NOT LOCATING IN YOUR
COUNTRY
• GOVERNMENT CORRUPTION
• INFERTILE SOIL
• Landlocked
• Civil war
• Low life expectancy
• Poor water quality
• Poor healthcare
• Diseases (E.g. Aids, Malaria)
• Relief - height and shape of the land
• Natural hazards
• Trading mostly raw materials
• Desertification

THE DEVELOPMENT GAP
FOR SOME GROUPS OF PEOPLE IN LICS AND NEES QUALITY OF LIFE IS NOT
IMPROVING. SOMETIMES, THE ECONOMIC IMPROVEMENTS A COUNTRY
EXPERIENCES ARE ONLY OF BENEFIT TO A SMALL NUMBER OF PEOPLE IN THE
COUNTRY.
THIS IS KNOWN AS “INTERNAL DISPARITY”. IN OTHER WORDS – THE
SITUATION ISN’T FAIR FOR ALL PEOPLE!
THE GINI COEFFICIENT ATTEMPTS TO EXPLAIN THIS.

THE DEVELOPMENT GAP
GINI COEFFICIENT
• THIS IS A RATIO THAT RANKS COUNTRIES BETWEEN 0 AND 1
• 0 = EVERYONE HAS THE SAME INCOME
• 1 = ALL THE INCOME IS CONTROLLED BY ONE PERSON
• THE CLOSER TO 1 THE MORE UNFAIR AND UNEQUAL THE ECONOMIC
WEALTH IN THE COUNTRY IS LIKELY TO BE.
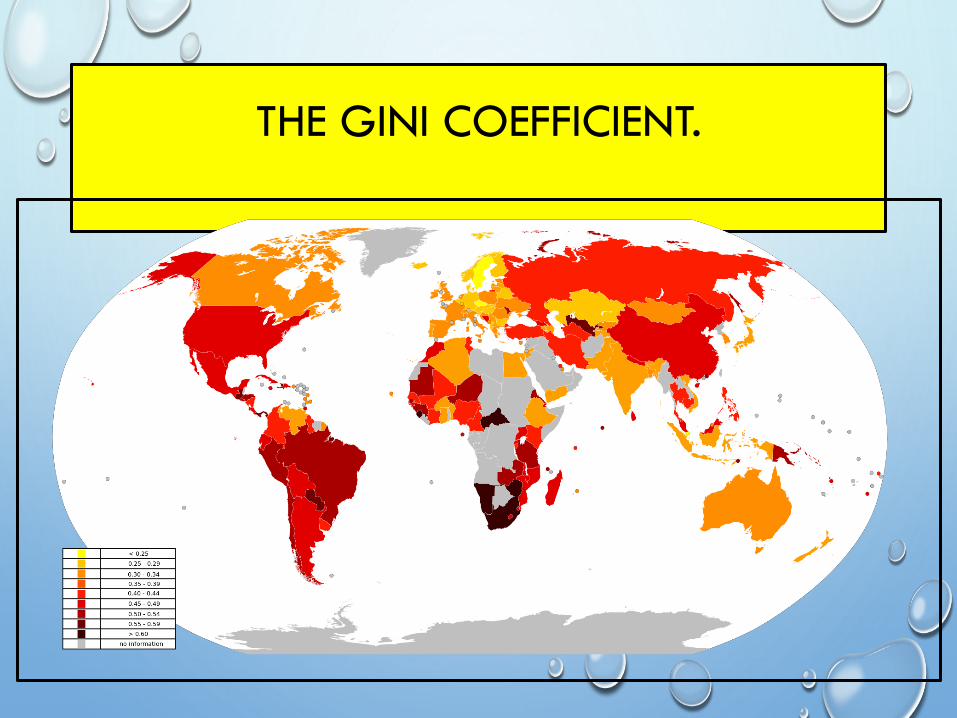
THE GINI COEFFICIENT.


Aid
What is it?

TYPES OF AID: This IS a recap of Y9 work. Match the numbers and letters on your whiteboard. You
will be given a work sheet with definitions on after.
A) Short term =
B) Long term =
D) Bilateral =
E) Tied =
C) Multilateral =
F) Voluntary =
3) Emergency help usually in response to a natural disaster, such
as a flood or earthquake
4) Sustainable aid that seeks to improve resilience, e.g. wells to
reduce the effects of drought, or improvements to agriculture
2) richer governments give money to an international
organisation such as the World Bank, which then redistributes
the money as aid to poorer countries.
5) aid from one country to another (often tied)
6) aid may be given with certain conditions e.g. that the
recipient has to spend the aid money on the donor country’s
products
1) Money donated by the general public in richer countries and
distributed by NGOs such as Oxfam
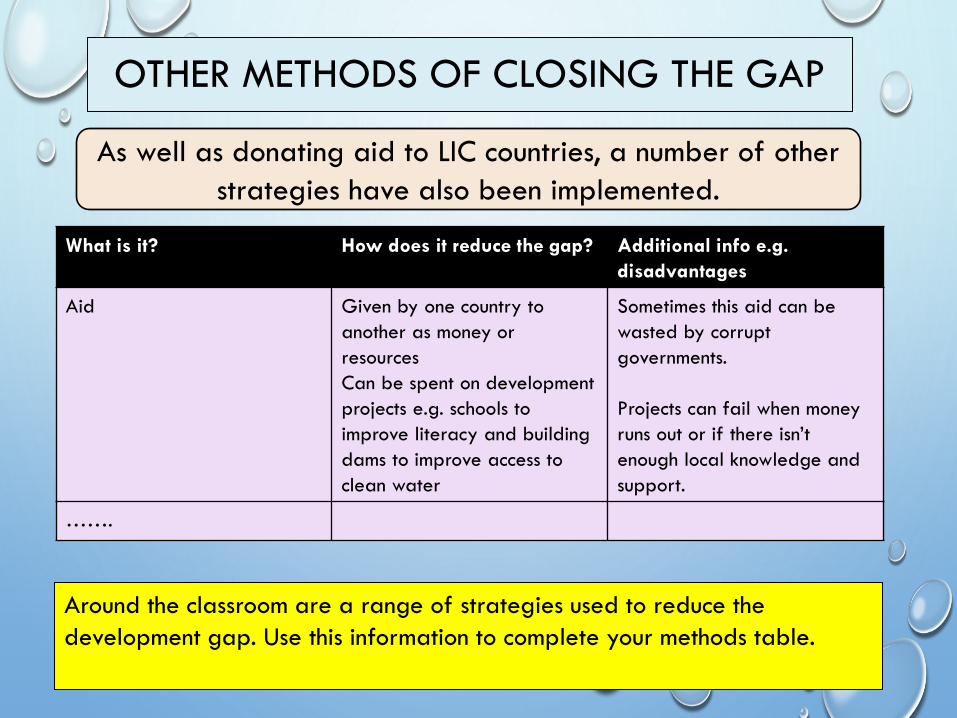
OTHER METHODS OF CLOSING THE GAP
As well as donating aid to LIC countries, a number of other
strategies have also been implemented.
What is it? How does it reduce the gap? Additional info e.g.
disadvantages
Aid Given by one country to
another as money or
resources
Can be spent on development
projects e.g. schools to
improve literacy and building
dams to improve access to
clean water
Sometimes this aid can be
wasted by corrupt
governments.
Projects can fail when money
runs out or if there isn’t
enough local knowledge and
support.
…….
Around the classroom are a range of strategies used to reduce the
development gap. Use this information to complete your methods table.

ECONOMIC INVESTMENT AND INDUSTRIAL DEVELOPMENT
Foreign-direct investment (FDI) is when people or
companies in one country buy property or infrastructure in
another
FDI leads to better access to finance, technology and
expertise and improve infrastructure, improved industry
and an increase in services.
IN COUNTRIES WITH A VERY LOW LEVEL OF DEVELOPMENT, AGRICULTURE MAKES UP A LARGE PORTION OF THE
ECONOMY. DEVELOPING INDUSTRY INCREASES GNI AND HELPS IMPROVE LEVELS OF DEVELOPMENT AS
PRODUCTIVITY, LEVELS OF SKILL AND INFRASTRUCTURE ARE IMPROVED.
Hydropower is the fastest-growing
energy source in the world,
encouraged by the world bank, which
sees it as the basis for economic
growth. Rapidly developing LICs and
NEEs such as China, India and Brazil
all have large projects in the pipeline.
These developments however have
risks, In China for example the extra
water pressure on the ground may
increase the risk of earthquakes.
Dams also threaten unique
environments such as rainforests
leading to a loss of biodiversity.
Impact of the Three Gorges Dam in China
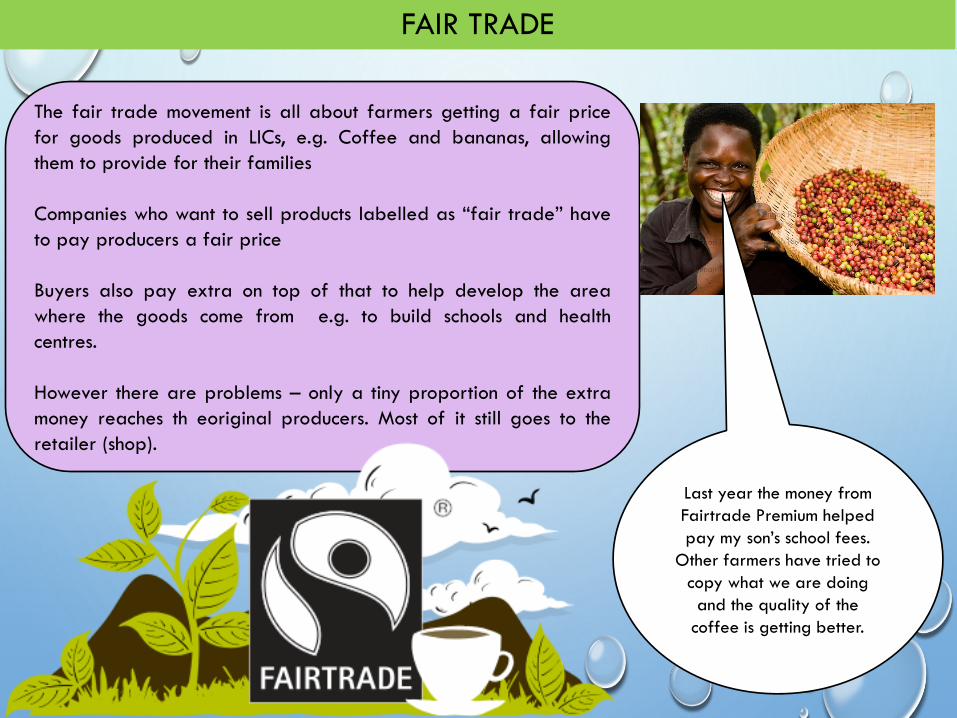
FAIR TRADE
The fair trade movement is all about farmers getting a fair price
for goods produced in LICs, e.g. Coffee and bananas, allowing
them to provide for their families
Companies who want to sell products labelled as “fair trade” have
to pay producers a fair price
Buyers also pay extra on top of that to help develop the area
where the goods come from e.g. to build schools and health
centres.
However there are problems – only a tiny proportion of the extra
money reaches th eoriginal producers. Most of it still goes to the
retailer (shop).
Last year the money from
Fairtrade Premium helped
pay my son’s school fees.
Other farmers have tried to
copy what we are doing
and the quality of the
coffee is getting better.

MICROFINANCE
Microfinance is when small loans are given to people in
LICs who may not be able to get the loans from
traditional banks. The loans enable them to start their
own businesses and become financially independent.
Many borrowers are women
Although microfinance works for some people, it’s not
clear that microfinance can reduce poverty on a large
scale.
Phones for women in Bangladesh:
One business idea has been to introduce mobile pay phones.
The bank lends $200 to village women to buy a mobile phone.
Other villagers then pay her for the use of it. They might use it
to check the price of items at markets in surrounding villages
or talk to family who have moved to the city.

INTERMEDIATE TECHNOLOGIES.
Solar cookers are used all over the world
today, they focus the suns rays on the
cooking pot. Cheap to make and easy to
transport!
Intermediate technology includes tools, machines and
systems that improve quality of life but are also
simple to use, affordable to buy or build and are
cheap to maintain.
For example, solar powered LED lightbulbs are used in
parts of Nepal where the only other lighting options
are polluting and dangerous kerosene lamps or wood
fires.
This allows people to work in their homes or
businesses, and children to study after dark. As a
result, skills, income and industrial output can increase
which helps to reduce the development gap.
Small scale dams
and pumps
improve access to
water and
irrigation of farm
land

DEBT RELIEF:
Debt relief is when
some or all of a
country’s debt is
cancelled, or interest
rates are lowered.
This means they have
more money to
develop rather than
pay back the debt.
For example, Zambia
(in S Africa) had
$4billion of debt
cancelled in 2005. in
2006, the country had
enough money to start
a free healthcare
scheme for millions of
people living in rural
areas.
In 2005, the worlds richest countries
(G8) agreed to cancel the debts of
many HIPCs. To qualify the countries
had to:
• Demonstrate they could manage
their own finances
• Show there was no corruption in
their government
• Agreed to spend the saved money
on education, healthcare and
reducing poverty.


