PERARES Milestone M9.3 Discussion Paper: A Cost-Benefit Analysis and Evaluation of Science Shops Esther Boere, MSc. and Prof. Dr. Wim Heijman Wageningen University February 2011 This publication is part of the project Public Engagement with Research and Research Engagement with Society - PERARES Financed by the European Community's Seventh Framework Programme (FP7/2007-2013) under grant agreement n° 244264 Contact details: Agricultural Economics and Rural Policy Group Wageningen University, Hollandseweg 1, 6706 KN Wageningen, The Netherlands [email protected], [email protected]
Transcript
PERARES Milestone M9.3
Discussion Paper:
A Cost-Benefit Analysis and Evaluation of Science Shops
Esther Boere, MSc. and Prof. Dr. Wim Heijman
Wageningen University
February 2011
This publication is part of the project
Public Engagement with Research and Research Engagement with Society - PERARES
Financed by the European Community's Seventh Framework Programme
LIST OF FIGURES Figure 1: social benefits of science shop research ........................................................................... 7
Figure 2: Science shop Wageningen revenues with changing SRH/PRH ratio ......................... 12
Figure 3: Science shop Brussels revenues with changing PRH-SRH ratio ................................ 15
Figure 4: Chemistry shop Eindhoven revenues with changing PRH-SRH ratio ......................... 19
LIST OF TABLES Table 1: Different scenarios for sensitivity analyses on science shops ......................................... 9
Table 2: Costs and hours spent by science shop Wageningen over the past 5 years in euros11 Table 3: Sensitivity analysis on the efficiency of science shop Wageningen hours as opposed to PRH hours ...................................................................................................................................................... 11 Table 4: Sensitivity analysis on the efficiency of science shop Wageningen hours as opposed to SRH hours ...................................................................................................................................................... 12
Table 6: Costs and hours of research conducted in the science shop Brussels ........................ 14 Table 7: Sensitivity analysis on the efficiency of science shop Brussels hours as opposed to PRH hours ...................................................................................................................................................... 14 Table 8: Sensitivity analysis on the efficiency of science shop Brussels hours as opposed to SRH hours ...................................................................................................................................................... 15
Table 10: Costs and hours of research conducted in the chemistry shop Eindhoven ............... 18
Table 11: Sensitivity analysis on the efficiency of student hours for the chemistry shop Eindhoven 18 Table 12: Sensitivity analysis on the efficiency of chemistry shop Eindhoven hours as opposed to SRH hours............................................................................................................................................. 19
Table 13: Comparison of CBA results and sensitivity analyses between science shops ......... 22
Table 14 Best guess of economic efficiency of science shops ..................................................... 23
LIST OF ABBREVIATIONS CBA Cost-Benefit Analysis
CSO Civil Society Organization
PERARES Public engagement with Research and Research Engagement with Society.
PRH Professional Research Hour
SME Small and Medium Enterprises
SRH Student Research Hour
VUB Vrije Universiteit Brussel
5
1. INTRODUCTION
Over the past decades science shops have been set up, closed, rebuilt and developed, not only in
Europe, but also in Canada, the USA, Africa and Asia (Commissie Wetenschapscommuniatie, 2009).
Science shops have been developed in order to provide access to (academic) knowledge for
organizations and the broader public who would else not have the financial means to get their
questions answered. The aim of these projects is to support private persons, civil society
organizations (CSO) or small and medium enterprises (SME) in realizing their future plans (Straver,
2008). Therefore, one of the preconditions of the science shops is that public organizations should be
able to use the research conducted by the science shops. The wider goal of science shops is in the
impact that influencing research may have on citizen participation (Straver, 2010).
The increasing involvement of civil society organizations leads to an increasing amount of research
questions posed by clients and a need to extend the amount of science shops (PERARES, 2010).
The main aim of this study is to evaluate science shops in terms of their costs and benefits. The
central question is therefore whether or not science shops are economically efficient. This can be best
assessed with the help of a Cost-Benefit Analysis (CBA), which is a method to determine whether a
project, program or policy is feasible given the objectives that have been stated and the assumptions
that have been made (Oskam, 2008). In general, a CBA aims at answering whether a project or
program should be carried out and if funds are limited, which elements should be selected. In doing
this, the specific project is compared to its next-best alternative (Mishan, Quah; 2007).
The concept of science shops is spread around the world. As a consequence, science shops
developed in a large variety of ways; depending on the region, area of expertise, focus from policy
makers and institute to which the science shop is connected (Commissie Wetenschapscommunicatie,
2009). In order to answer our research question, we will give an economic evaluation of science
shops that differ in size, region, target groups and area of expertise.
This analysis represents a substantive addition to the evaluation methods and models available for
science shops and is intended to generate further discussion and research within and outside the
PERARES project. Chapter 2 will give an overview of the methodology used, where the subsequent
chapters will each present a cost-benefit analysis on the economic evaluation of a specific science
shop. We will end the analysis with a conclusion and discussion in Chapter 6. This analysis only
focuses on the direct costs and benefits of science shops. Indirect costs and benefits are however of
large importance and will therefore be highlighted in the discussion of Chapter 6 and annex 1 and 2
that present some individual projects of science shops.
6
2. METHODOLOGY
2.1 Introduction This study is based on the theoretical principles of welfare economics (Brent, 2009), where we
assume perfect competition, which implies a large number of companies, identical products sold by
all, the freedom to enter in and out of the industry and perfect knowledge on prices and technologies
(Krugman, Obstfeld, 1994). With this economic evaluation we try to assess the social desirability of
science shops relative to its next best alternative; i.e. where clients of science shops would turn to if
science shops would not exist.
The entrance of science shops in the market may at first give the idea of price discrimination3;
however, in essence we deal with market segmentation. Market segmentation is the distinction of a
market in different groups of buyers and sellers and occurs when a sub-set of the market is made up
of organizations that share one or more characteristics with the related market that cause them to
demand similar products and/or services (Krugman, Obstfeld, 1994). Because of the financial
restrictions of science shop clients, these clients would not engage in the market segment of
professional consultancy bureaus if there would not be a science shop. Therefore, clients of
consultancy companies effectively engage in another segment of the market than clients from science
shops. The different segments of the market are graphically represented in Figure 1 below, where
area ODRQ represents the segment of professional consultancy bureaus and area QRE the segment
of research conducted by students, under which science shop research falls, as will be explained in
the following section.
Hence, the difference in price and provider results in two market segments; that of the professional
consultancy bureaus and that of student research. In this study we assume divisibility, which means
that the benefits of research conducted by science shops can be measured by the amount of
research hours conducted. The unit of measurement used in our analysis will therefore be one
research hour, where its valuation will be based on the market price for a research hour conducted by
a professional consultancy bureau. In the rest of our analysis, we will indicate a professional research
hour by the abbreviation ‘PRH’ and a student research hour by ‘SRH’.
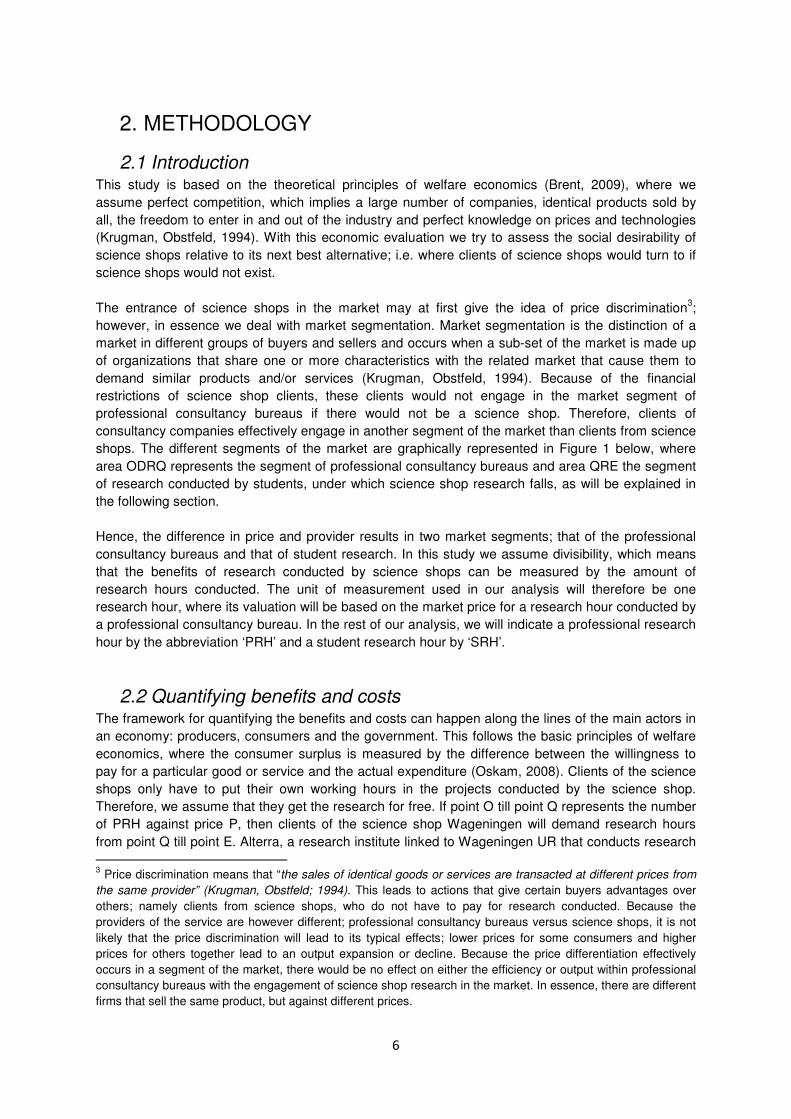
2.2 Quantifying benefits and costs The framework for quantifying the benefits and costs can happen along the lines of the main actors in
an economy: producers, consumers and the government. This follows the basic principles of welfare
economics, where the consumer surplus is measured by the difference between the willingness to
pay for a particular good or service and the actual expenditure (Oskam, 2008). Clients of the science
shops only have to put their own working hours in the projects conducted by the science shop.
Therefore, we assume that they get the research for free. If point O till point Q represents the number
of PRH against price P, then clients of the science shop Wageningen will demand research hours
from point Q till point E. Alterra, a research institute linked to Wageningen UR that conducts research
3 Price discrimination means that “the sales of identical goods or services are transacted at different prices from
the same provider” (Krugman, Obstfeld; 1994). This leads to actions that give certain buyers advantages over
others; namely clients from science shops, who do not have to pay for research conducted. Because the
providers of the service are however different; professional consultancy bureaus versus science shops, it is not
likely that the price discrimination will lead to its typical effects; lower prices for some consumers and higher
prices for others together lead to an output expansion or decline. Because the price differentiation effectively
occurs in a segment of the market, there would be no effect on either the efficiency or output within professional
consultancy bureaus with the engagement of science shop research in the market. In essence, there are different
firms that sell the same product, but against different prices.
7
for organizations from outside and thus acts as a professional consultancy bureau, charges an
average market-rate of €147.- per hour (Holsteijn, personal communication, 29-9-2010). This means
that in Figure 1, based on Mishan and Quah (2007), point P represents 147.
Figure 1: social benefits of science shop research
We do not know exactly how many hours are demanded in the market segment of professional
consultancies, but according to the methodology as presented in Figure 1 above, the area ODRQ
under the demand curve from point D till point R, represents societies willingness to pay for these
hours. The area OPRQ represents the total amount society has to pay for the hours of research
conducted by professional consultancy bureaus and the area DPR represents what the clients would
additionally have been willing to pay for. As mentioned before, we assume perfect competition, which
means that consultancy bureaus will produce till the point where marginal costs equal marginal
revenues. Hence, the square OPRQ also includes the costs that professional consultancy bureaus
have to make. The triangle DPR is also referred to as the consumer surplus of professional
consultancy bureaus. This is the amount of benefit that consumers gain by being able to purchase a
product for a price that is less than they would have been willing to pay. Subtracting what clients
actually have to pay (area OPRQ) from the willingness to pay of buyers (area ODRQ) gives us the
consumer surplus (Mishan, Quah; 2007). Area DPR can therefore be named ‘Consumer surplus from
professional consultancy bureaus’.
The second segment of the market is represented by triangle QRE, which represents the research
hours that are conducted by student research, where the science shop is a part of. The costs of the
science shop projects are represented by the total costs, i.e. the variable and fixed costs, for the
science shop. The surface of the triangle QRE corresponds to the maximum consumer valuation of
the work conducted by student research. The maximum valuation for science shop research is, as
represented in Figure 1 above, part of the triangle QRE and part of this maximum valuation is
composed of the total costs paid by science shops. Therefore, this part of the triangle can be best
referred to as ‘gross benefits of science shop research’. For each of the total units of research hours
purchased, there is a different maximum valuation; the straight line from point R to each of the axes
8
represents the different prices that people are willing to pay given a certain quantity (Mishan, Quah;
2007). We will however value the price of the research produced by the science shop as the average
of the triangle QRE, which is halfway on the straight line RE. We assumed the average of this price to
be half of price P, which makes the average willingness to pay for an hour of student research €73.50.
Figure 1 above shows that the economic value of science shop projects is determined by the
economic behavior in the context of demand and supply. The estimate of the gross benefits will be
entered as benefits in the cost-benefit calculations. Hence, they represent the welfare gain from
consumption gained by the clients of the science shop. Costs on the other hand, represent the
aggregate inputs measured in monetary units and compose the salary costs and other overhead
costs. Another important cost factor is the added time involved in organizing collaborative, democratic
processes among members of an usually diverse project team between CSO’s and science shop
researchers.
2.3 Approaches to measure costs and benefits There are two lines of thinking in deciding upon the next best alternative for science shop clients. On
the one hand, there are the critics of science shops who say that without science shops, clients and
student researchers would have found each other just by demand and supply of the market. If this is
true, the next best alternative would be student research without science shops acting as an
intermediary. On the other hand, there are the proponents of science shops, who argue that without
the interference of science shops to regulate demand and supply, the clients would not get their
questions answered. In this latter case, the next best alternative would be where civil society
organizations would turn to if they would have the financial means to do so; hence, professional
consultancy bureaus. Here, we would like to perform a cost-benefit analysis based on both views of
the science shops. Therefore, we will first perform a cost-benefit analysis according to the
methodology presented in the previous section, where the benefits are represented by a multiplication
of the amount of science shop research hours by the average willingness to pay for these hours and
the costs are represented by the total costs made by the science shop.
Hereafter, we will perform sensitivity analyses from two viewpoints; the first based on the assumption
that if science shops would not exist, the only option left for its clients is professional consultancy
bureaus. With this sensitivity analysis we will estimate the amount of SRH that can compose one PRH
up till the point where the science shop breaks even. It can namely be assumed that one SRH does
not have the same efficiency and productivity as one PRH has. This partly because students do not
have the experience and facilities that professional researchers have and partly because of the
specific field in which science shops work. Science shops operate on the cutting point between
science and society. This does sometimes lead to conflicts in the way of presentation and analysis
between students or researchers and civil society organizations. These conflicts take time and may
lead science shops to become less efficient than professional consultancy bureaus. Therefore, we will
analyze the benefits or losses that the science shop makes with the help of a benchmark for the rate
of efficiency between a PRH and a SRH. Based on discussions with supervisors of science shop
projects we can set this benchmark at one PRH representing three SRH (Heijman, Oude Lansink,
Straver; personal communication, November 2010).
The second viewpoint will be based on the assumption that if science shops would not exist, student
and clients would meet each other via the market. In this case, the costs that the science shop as a
mediator would have made do not occur. This would obviously make research where science shops
interfere less cost-efficient than when the client and the student meet each other without the science
shop, namely by the amount of the costs for central coordination of the science shop. A side note
here is that those involved in science shop work often argue that science shops do not only connect
client and student, but also lead to a higher quality product, because they also supervise and support
the whole research process. Here again, we will use a benchmark for the amount of SRH that would
9
also have been conducted if the science shops would not exist. Based on discussions with science
shop leaders we decided to use a benchmark that without science shops, only 50% of science shop
clients would get their research question answered (Sijtsma, personal communication).
These two viewpoints will lead to four different scenarios performed on the science shops, as they are
represented in Table 1 below. In scenarios 1 and 3 we will use a positive view on science shops,
where 1 PRH represents 1 SRH. In scenarios 2 and 4 we will use the benchmark of 1 PRH represents
3 SRH. In scenarios 1 and 2 we will use the proponent’s viewpoint that without the science shop, its
clients would not get their questions answered. Scenarios 3 and 4 use the benchmark of 50% of SRH
that would also have been conducted if science shops would not exist.
Table 1: Different scenarios for sensitivity analyses on science shops
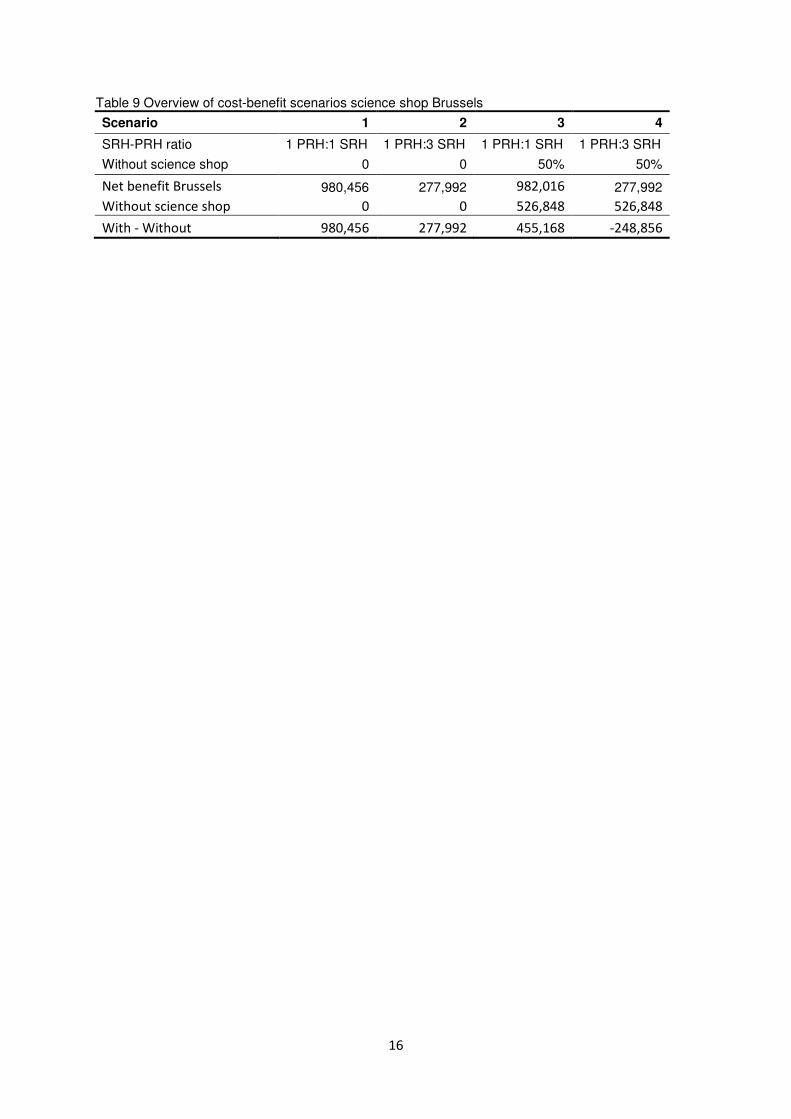
Net benefit Brussels 980,456 277,992 982,016 277,992
Without science shop 0 0 526,848 526,848
With - Without 980,456 277,992 455,168 -248,856
17
5. CASE 3: CHEMISTRY SHOP EINDHOVEN
5.1 Introduction At the science shops in Eindhoven, research is completely conducted by students who, guided by
scientists from the university, try to answer questions that mainly come from individual persons and
small and medium enterprises (SME). The students are supported by the facilities of the university
and their work can lead to for example a tangible product such as a technical tool for patients or a
research report that analyses harmful substances in materials. There are four science shops in
Eindhoven that conduct research for civil society organizations. These science shops are the
architecture shop, the chemistry shop, the electro shop and the physics shop. Each of these science
shops is linked to a faculty of the university. The different science shops meet once every two weeks
to discuss the progress under the different science shops.
In this part of the analysis, we focus on the chemistry shop Eindhoven. This science shop has been
established in 1973 under the name “Milieu Aksie Groep T” and changed names to Chemistry Shop
Eindhoven in 1975. The aim of the chemistry shop is to function as an information center, specialized
in chemistry and the environment, for society. Initially, the chemistry shop Eindhoven was based on
the idea to conduct research for individual persons against low costs. During the year 2006-2007 the
chemistry shop started with including cases from SME. The idea behind including this sector is that,
because of the low costs of student work, it becomes affordable for small or new companies to have
their research conducted by the chemistry shop. Apart from the attractiveness for its clients, the
chemistry shop provides possibilities for students to apply their knowledge to other areas of chemistry
and development.
5.2 Cost-Benefit Analysis We used a four year period for our analysis to measure costs and benefits of research hours
conducted by the chemistry shop Eindhoven. The chemistry shop yearly receives around €20,000 to
conduct projects and often a small amount from clients, especially from SME, for projects conducted.
By far most costs of the chemistry shop come from salary costs. These are composed of the salary
costs for the board of the chemistry shop and salary costs for students who conduct the research. The
exact composition of the board of the chemistry shop Eindhoven has changed somewhat over the
past years; however, the positions have remained largely the same. Currently, the board of the
science shop Eindhoven consists of the chairman, secretary and public relations officer. Apart from
the board members, there are two persons who deal with requests coming in the science shop. The
science shop Eindhoven aims at extending SME-research next to research for private persons and
facilitating research studies for students. This is represented by a separate SME coordinator that
deals with requests from the sector. Policy and executive work fall under the tasks of the SME
coordinator.
The chemistry shop Eindhoven is overseen by a supervision committee linked to the chemistry shop
where a group of persons within the Chemical Engineering faculty check research conducted by the
chemistry shop and advises on policies within the chemistry shop. All of the research of the Chemistry
Shop Eindhoven is conducted by students who are a member of the science shop. They get paid for
their work by a student assistantship salary of €16 per hour. Hence, the total amount of SRH
conducted at the Chemistry Shop Eindhoven is composed of the 0.9 FTE that each of the on average
5 board members spend on the Chemistry Shop per year plus the hours for conducting research.
Here, we used 2080 hours for 1 FTE and the student assistantship wage rate of €16.- for executive
18
work. The total salary and other costs are represented in Table 7 below, which shows the total costs
and amount of hours that have been put into science shop research in Eindhoven over the past 4
years.
Table 10: Costs and hours of research conducted in the chemistry shop Eindhoven
2009-2010 2008-2009 2007-2008 2006-2007 Total
Salary Costs 26281 31086 27653 28556 113576
Other Costs 2840 4523 5767 4008 17138
Total Costs 29121 35609 33420 32564 130714
Total amount of SRH a)
16459
Total amount of PRH 0 a)
0.9 FTE for 5 board members €16.- / hour for executive work
5.3 Sensitivity Analyses Eindhoven The table above shows the costs and benefits in the way described by our methodology. If we
assume that one SRH is as efficient and productive as one PRH, then a total amount of 16,459
productive hours have been supplied over the past 4 years. Again, we use €73.50 as the average
willingness to pay for an hour of science shop research. Based on this, the total benefits over the past
4 years are 16,459*73.5= €1,209,737.- and the average benefits per year €302,434.-. With the
average cost per year being €32,679.-, we arrive at a net positive benefit of 302,434 - 32,679.- =
€269,755.-. Table 11 below shows that under scenario 2, where 1 PRH:3SRH and no SRH would be
conducted without the science shop, the science shop Eindhoven would result with a net benefit of
€68,132.-.
The chemistry shop Eindhoven realizes that there is not much known about the actual research
qualities of students and that good results identified by SME are not always guaranteed (Jaarverslag
2006-2007). Therefore, we can again analyze the minimal rate of efficiency that students must have in
order for the science shop to break even. Table 8 below shows the benefits with different rates of
efficiency of SRH relative to one PRH when other things remain equal, i.e. the average benefits of
one science shop hour remains at €73.50 and the total costs of the chemistry shop Eindhoven over
the past 4 years remain at €130714.-.
Table 11: Sensitivity analysis on the efficiency of student hours for the chemistry shop Eindhoven
PRH/SRH ratio
Total amount of
SRH / 4 years
Total benefits
€ / 4 years
Benefit - Costs in
€ / average year
1 PRH = 1 SRH 16459 1209737 269755
1 PRH = 2 SRH 8230 604868 118538
1 PRH = 3 SRH 5486 403246 68132
1 PRH = 4 SRH 4115 302434 42930
1 PRH = 5 SRH 3292 241947 27808
1 PRH = 6 SRH 2743 201623 17727
1 PRH = 7 SRH 2351 172820 10526
1 PRH = 8 SRH 2057 151217 5125
1 PRH = 9 SRH 1829 134415 925
1 PRH = 10 SRH 1646 120974 -2436
1 PRH = ∞ SRH 0 0 -32679
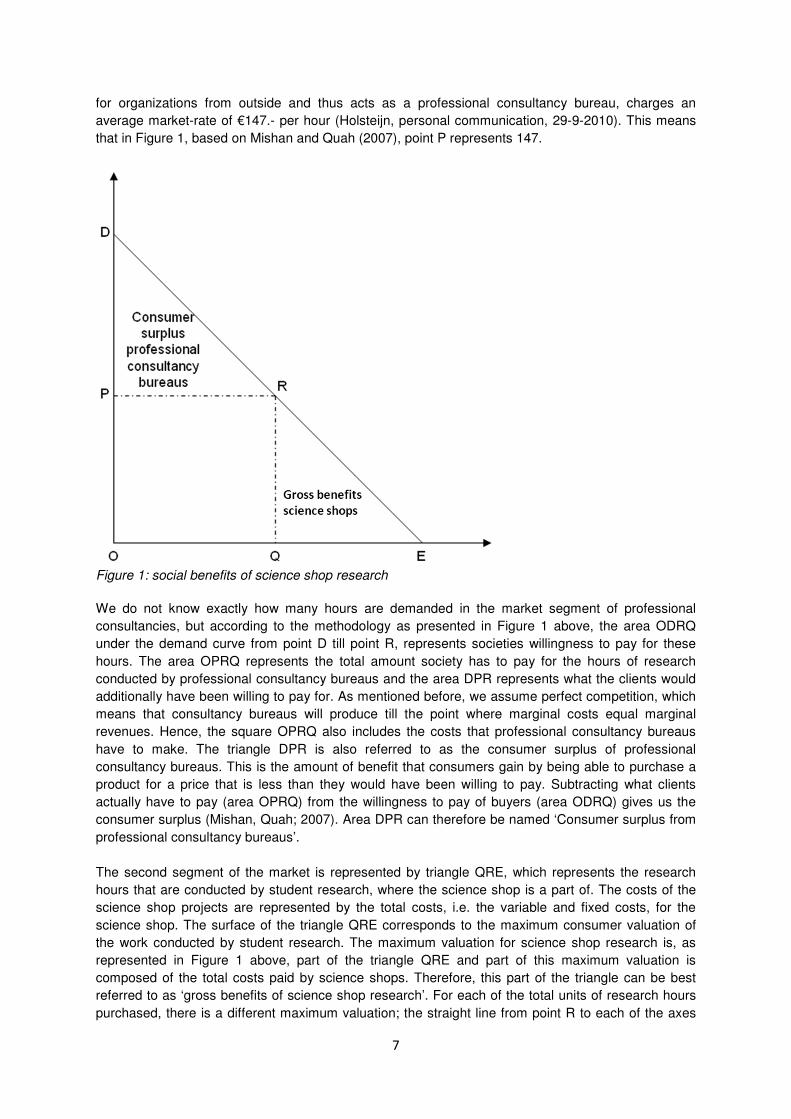
In the most extreme case, where a student hour is not of any use, the science shop Eindhoven would
make a loss of €32,679.- per year. It is however very unlikely that a student hour won’t be of any use.
Therefore, in analyzing the cut-off point by the efficiency of a student hour, it can be estimated that
the chemistry shop Eindhoven breaks even somewhere in between when one research hour
19
represents 9 or 10 student hours. Here, the science shop would break even in its costs and benefits;
costs and benefits would be equal to €32,679.- on average per year (figure 4).
Figure 4: Chemistry shop Eindhoven revenues with changing PRH-SRH ratio
Table 12 below shows a sensitivity analysis under scenario 3; when one PRH represents one SRH and without the science shop 50% of the SRH would still be conducted. Under this scenario, the additional benefits of the science shop Eindhoven are reduced to €269,756 - €151,217 = €118,539.-.
Table 12: Sensitivity analysis on the efficiency of chemistry shop Eindhoven hours as opposed to SRH hours
With science shop Without science shop
Revenues SRH/year a)
302434 151217
Revenues PRH/year 0 0
Total revenues/year
302434 151217
Costs/year 32679 0
Benefit-Costs 269756 151217
Under the most strict scenario, where three SRH equal one PRH and 50% of the clients of the science shop would have been able to find students without the help of the science shop, the science shop Eindhoven would make a loss. Namely, this would lead to the result of scenario 2 minus the revenues that would be made without the science shop in the table above: €68,132 - €151,217 = € -83,085.-.
5.4 Conclusion The table below shows an overview of the different scenarios discussed. As can be seen, there is a
large range of results of the analysis. They are however quite comparable with the other science
shops. Again, only under the quite unlikely circumstances of scenario 4, the analysis would lead to a
negative result.
Table 13: Overview of cost-benefit scenarios science shop Eindhoven
With science shop (€) 765,972 136,812 765,972 136,812
Without science shop (€) 0 0 471,87 471,87
With – Without (€) 765,972 136,812 294,102 -335,058
BRUSSELS
With science shop (€) 980,456 277,992 982,016 277,992
Without science shop (€) 0 0 526,848 526,848
With – Without (€) 980,456 277,992 455,168 -248,856
EINDHOVEN
With science shop (€) 269,755 68,132 269756 68,132
Without science shop (€) 0 0 151217 151,217
With – Without (€) 269,755 68,132 118539 -83,085
Because of the large difference in size and structure of the science shops, it is difficult to compare
their costs and benefits. The table above does however show that the CBA on the science shops
Wageningen and Brussels result in much larger benefits. This can be easily explained by the size of
the science shops. With an average of 13 projects per year over the past 5 years, and a maximum
working budget of €35,000.- per project, science shop Wageningen is one of the larger science
shops. But this also counts for Brussels, characterized by a central coordination point that oversees
all Belgian science shops and has a budget of nearly €70,000 per year. There is however quite a
large difference in annual budget between these two science shops, which is reflected by their
difference in PRH-SRH ratio. This difference in fixed costs for coordination can mainly be explained
by the fact that also researchers of Wageningen University conduct research for the science shop,
where research of science shop Brussel is only conducted by students.
23
The chemistry shop Eindhoven is one of the smaller science shops, fully managed by students and
with an average working budget of around €32000.-. It can however easily keep up with the larger
science shops in terms of its PRH-SRH ratio and the percentage of extra quality that needs to be
added to a science shop hour in order to break lead to the same valuation of a normal SRH.
All science shops end up with negative results under the scenario that one PRH equals 3 SRH and
50% of the SRH would also occur without the help of the science shop. Most striking in these losses
is the small loss for Wageningen. This is due to the fact that the science shop acts for a relatively
large part as a professional research bureau and therefore the loss of 50% of the SRH does not have
a large effect on the science shop Wageningen compared to the others. However, again the ratio of
1PRH: 3 SRH combined with the 50% of SRH that would also have occurred without the science shop
is probably quite a strict calculation in the cost-benefit analysis. We can therefore conclude that the
best-guess of for the economic efficiency of the analyzed science shops would be half way between
the most positive scenario (scenario 1) and the most negative scenario (scenario 2). This would lead
to the net benefits as presented in table 14 below. From this, we can conclude that both large and
small science shops are economically efficient.
Table 14 Best guess of economic efficiency of science shops
Science shop Net benefits (€)
WAGENINGEN 215457
BRUSSELS 365800
EINDOVEN 93335
6.3 Discussion The analysis provided in this study gave some useful insights in the costs, benefits and efficiency of
science shops. There are however a number of other important aspects to keep in mind when
evaluating the social desirability of science shops. Here, we will touch upon the most important of
these.
In our CBA, the benefits have been represented by a multiplication of the amount of science shop
research hours by the average willingness to pay and the costs have been represented by the total
costs made by the science shop. We used €147.- as the threshold value of price P for an hour of
research conducted at a professional consultancy bureau and assumed that from this the demand
curve was a straight line to each of the axes. We are however aware that another threshold value as
the price for a professional research hour or another slope of the demand curve would lead to very
different results.
The CBA analysis only took the direct costs and benefits into account. Costs and benefits can
however be disaggregated into three categories: direct, indirect and intangible. Direct are those costs
directly related; such as overhead and labor costs, which are taken into account in related markets.
Indirect costs refer to the inputs and outputs that occur outside the science shops. These indirect
effects could be measured by the earnings foregone or enhanced due to the work of the science
shops. These are reflected by the value of production lost or gained by society. Intangible costs or
benefits refer to the internal valuation of people to costs incurred or benefit obtained by science shop
work (Brent, 2009).
It can easily be assumed that the projects conducted by science shops have not only led to direct
costs and benefits, but also to indirect ones. These indirect costs and benefits are however very
difficult to measure in monetary terms. Including all costs and benefits of the projects conducted by
science shops will be very hard. Not only is it difficult to indicate a monetary value to all costs and
benefits, but also to measure externalities. In economic theory, different techniques to measure non-
24
market valuation have been developed. Among these are the stated and revealed preference
techniques. The stated preference techniques rely on answers from surveys where revealed
preference techniques draw statistical inferences on values from people’s market behaviour. (Oskam,
2008). However, science shops often do not possess these kinds of data and acquiring them is
outside the scope of this research. In order to still be able to show the indirect costs and benefits that
may occur in science shop work, we analysed the impact of two specific projects, namely the ring
road around Erp conducted by science shop Wageningen, in annex I and the development plans for
the socio-economic disadvantaged region in Hungary by the ESSRG science shop in annex 2. These
examples shows that research conducted by science shops can lead to new approaches to problems
that may in turn lead to new insights. The effect of this work does not only lead to costs and benefits
on the specific project, but also on related markets.
Moreover, science shops themselves, do not only focus on answering research questions for clients,
but do also bring a valuable contribution to the education of students by offering practical topics for,
amongst others, master theses. In this way, they do not only aim at answering research questions of
private persons, CSO or SME in realizing their future plans, but also bring a valuable contribution to
the training, and possibly motivation, of students for their further jobs. Moreover, the fact that science
shops are generally linked to universities makes them the ideal bridge between science and society
and allows them to often bring new, innovative approaches to answer research questions. This is
further explained in annex 2. This is in light with one of PERARES’ goals to embrace the dialogue
between research and society.
With this analysis we tried to provide a substantive addition to the evaluation methods and models
available for science shops and to provide a paper intended for further discussion and research within
and outside PERARES. We do realize that the core analysis provided in this paper does not pay
attention to the indirect costs and benefits that occur in science shop research, but we hope that it
provides a starting point for an economic evaluation of science shops.
25
ANNEX 1: SCIENCE SHOP ZITTAU
Introduction The full name for the science shop Zittau is The Science and Technology Transfer e.V. Zittau. The
science shop Zittau is a non-profit organization that is linked to the university of Zittau/Gorlitz and the
International University Institute Zittau as well as regional initiatives and SME. At the science shop
Zittau, different enterprises conduct activities and in these offer businesses, clubs, initiatives and the
general public in the region a contact point that connects them to university institutions. The science
shop Zittau has been initiated based on a student initiative of the Founders Academy at the university
of Zittau/Gorlitz, based on the idea to develop a more active participation in German and international
science shop networks.
The science shop Zittau aims at offering attractive qualification trainings for founders of businesses
and students in the region. An example is the project Career Service that has been introduced in
order to prepare students to begin their career as qualified workers and managers of firms. When the
present Founders Academy project ends, the data bank will be converted into the Zittau Science
Shop. Some of the main tasks of the science shop Zittau are to offer students the possibility to follow
workshops and trainings, to join certain groups, such as the investors club for engineering students,
and to offer projects that are likely to give a stimulus to the economic development by helping
businesses in the region. Hence, the science shop Zittau is quite different from the three science
shops analyzed in the previous chapters in the sense that it does not only focus itself on analyzing
research questions from society, but also on providing trainings for students and businesses.
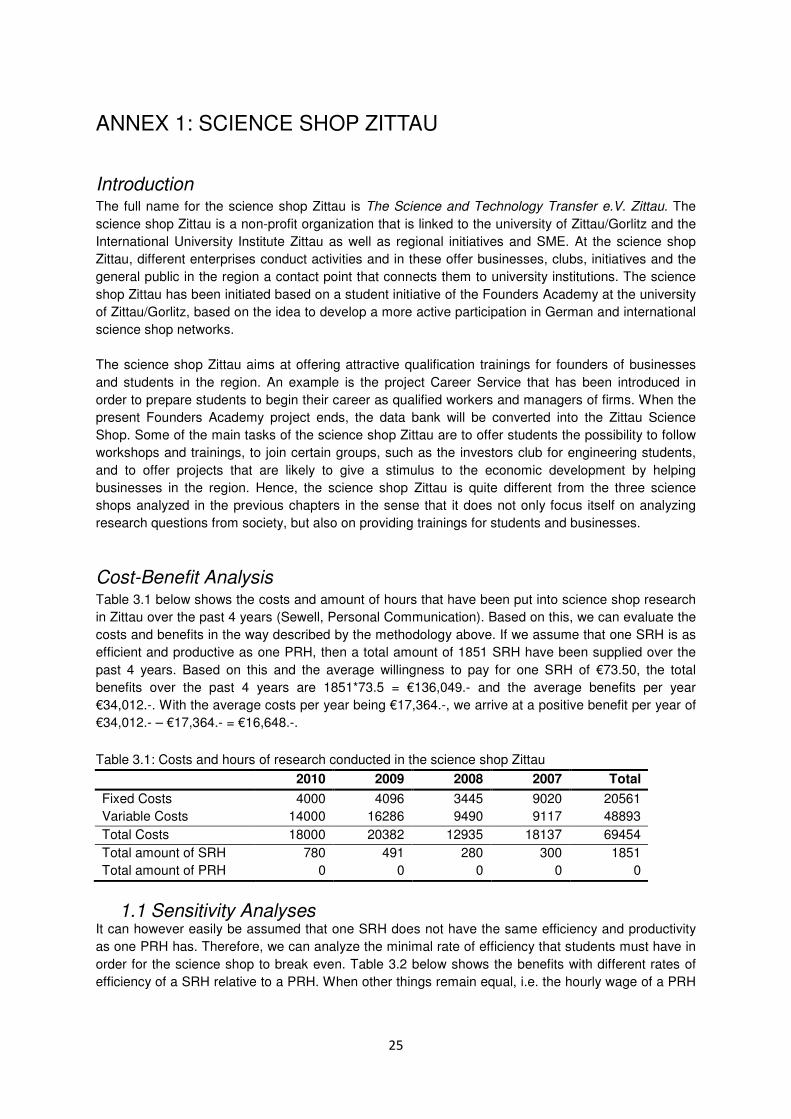
Cost-Benefit Analysis Table 3.1 below shows the costs and amount of hours that have been put into science shop research
in Zittau over the past 4 years (Sewell, Personal Communication). Based on this, we can evaluate the
costs and benefits in the way described by the methodology above. If we assume that one SRH is as
efficient and productive as one PRH, then a total amount of 1851 SRH have been supplied over the
past 4 years. Based on this and the average willingness to pay for one SRH of €73.50, the total
benefits over the past 4 years are 1851*73.5 = €136,049.- and the average benefits per year
€34,012.-. With the average costs per year being €17,364.-, we arrive at a positive benefit per year of
€34,012.- – €17,364.- = €16,648.-.
Table 3.1: Costs and hours of research conducted in the science shop Zittau
2010 2009 2008 2007 Total
Fixed Costs 4000 4096 3445 9020 20561
Variable Costs 14000 16286 9490 9117 48893
Total Costs 18000 20382 12935 18137 69454
Total amount of SRH 780 491 280 300 1851
Total amount of PRH 0 0 0 0 0
1.1 Sensitivity Analyses It can however easily be assumed that one SRH does not have the same efficiency and productivity
as one PRH has. Therefore, we can analyze the minimal rate of efficiency that students must have in
order for the science shop to break even. Table 3.2 below shows the benefits with different rates of
efficiency of a SRH relative to a PRH. When other things remain equal, i.e. the hourly wage of a PRH
26
remains at €147.-, the average benefits of one science shop hour remains at €73.50 and the total
costs of science shop Zittau over the past 4 years remains at €69,454.-.
Table 3.2: Sensitivity analysis on the efficiency of science shop Zittau hours as opposed to PRH hours
PRH/SRH ratio
Total amount of
SRH / year
Total benefits
€ / year
Benefits - Costs
€ / year
1 PRH = 1 SRH 463 33994 16630
1 PRH = 2 SRH 231 16997 -367
1 PRH = 3 SRH 154 11331 -6032
1 PRH = 4 SRH 116 8498 -8865
1 PRH = 5 SRH 93 6799 -10565
1 PRH = 6 SRH 77 5666 -11698
1 PRH = ∞ SRH 0 0 -17364
In the most extreme case, where a student hour is not of any use, the science shop Wageningen
would make a loss of €-17,364.-. It is however very unlikely that a student hour won’t be of any use.
Therefore, in analyzing the cut-off point in the efficiency of a student hour, we can see that the
science shop Zittau will break even when one PRH represents almost two SRH. This break-even
point is graphically represented in Figure 4 below. Here, the science shop would break even in its
costs and benefits; costs and benefits would be equal to €17,364.
Figure 3.1: Science shop Zittau revenues with changing PRH/SRH ratio
The science shop Zittau does not conduct research as other science shops do. Therefore, it makes it
difficult to compare the science shop hours conducted with professional consultancy bureau hours.
Student hours conducted at the science shop Zittau are not conducted as part of a master thesis and
would therefore not occur if the science shop would not exist. The exclusivity of the hours conducted
at the science shop Zittau makes a sensitivity analysis on the amount of extra hours that could be
conducted without the science shop, under the assumption that client and student would meet each
other by demand and supply of the market unnecessary.
27
ANNEX 2: SOCIAL COSTS AND BENEFITS, THE CASE OF ERP
In and around Erp, a village in the province Brabant in the Netherlands, there is a considerable
amount of heavy traffic. This is partly caused by traffic that has a destination in Erp, but also partly by
traffic that uses Erp to get from A to B, both outside the village. The traffic causes a considerable
amount of inconvenience to the inhabitants of Erp, who have been trying to come up with a good
solution for a long time. Residents on one side wanted a ring road to cut the heavy flow of traffic
through the village. Those in the opposing party argued that a ring road would destroy the landscape.
In 2004, the municipality decided to build a ring road to the North and South of Erp in order to relieve
the through road of traffic. At this time, one of the opposing parties, Erp Alert, asked science shop
Wageningen to research the alternatives for this solution.
The science shop Wageningen conducted a research on the alternatives for the traffic situation
around Erp and how traffic problems like these can in general be approached. Firstly, residents were
asked to describe their ideal scenario, which resulted in a list of four items. The solution should
namely result in a (1) reduction of the traffic burden, (2) increased safety, (3) improved accessibility
and (4) conservation of landscape quality.
In search of the best alternative, a distinction between on the one hand the origin and destination and
on the other hand the level (local or regional) of the traffic had to be made. For this, the science shop
came to a new approach, the so called ‘diamond concept’; traffic that neither comes from nor has its
destination in Erp, should stay in the surrounding roads instead of passing through Erp. In this new
structure, the science shop took the following principles into account; the size of the residence area,
the possibility to enforce lower speed limits, the prevention of traffic passing through Erp and the
accessibility of the main roads from Erp. The science shop came to the conclusion that the option of a
feeder road to the industrial park with traffic curbing measures in the village center would be the best
solution (Hoofwijk et al., 2007).
These conclusions led to recommendations for the municipality of Erp and province of Brabant in
solving the traffic problems on both a local and regional scale. An analysis for the best solution to
overcome the traffic problems had been conducted by several professional consultancy bureaus
before the question was posed to science shop Wageningen. New in the approach of the science
shop was that the analysis took place on a larger level than that on which local interest groups
normally operate. In autumn 2008, after the science shop report had been published in August 2007,
the municipality decided to abandon the planned ring road in favor of the feeder road in the South of
Erp and traffic curbing measures in the center of Erp, as proposed by the science shop (Brabants
Dagblad, 2008a; Brabants Dablad, 2008b).
Effects of a project can be defined by the difference between a development with the project (project
alternative) and without the project (zero rate). Because it’s the difference that is important in a cost
benefit analysis, the construction of the zero tariff is as important as the construction of the project
alternative in order to make a reliable choice. The zero-tariff is a combination of the second best
means and solutions for the problem. Hence, it is not the ‘status quo’ but the best alternative
(Eijgenraam et al., 2000). In the science shop project of Erp, we can measure the project alternative
defined by the science shop against the zero rate if the research of the science shop would not have
taken place.
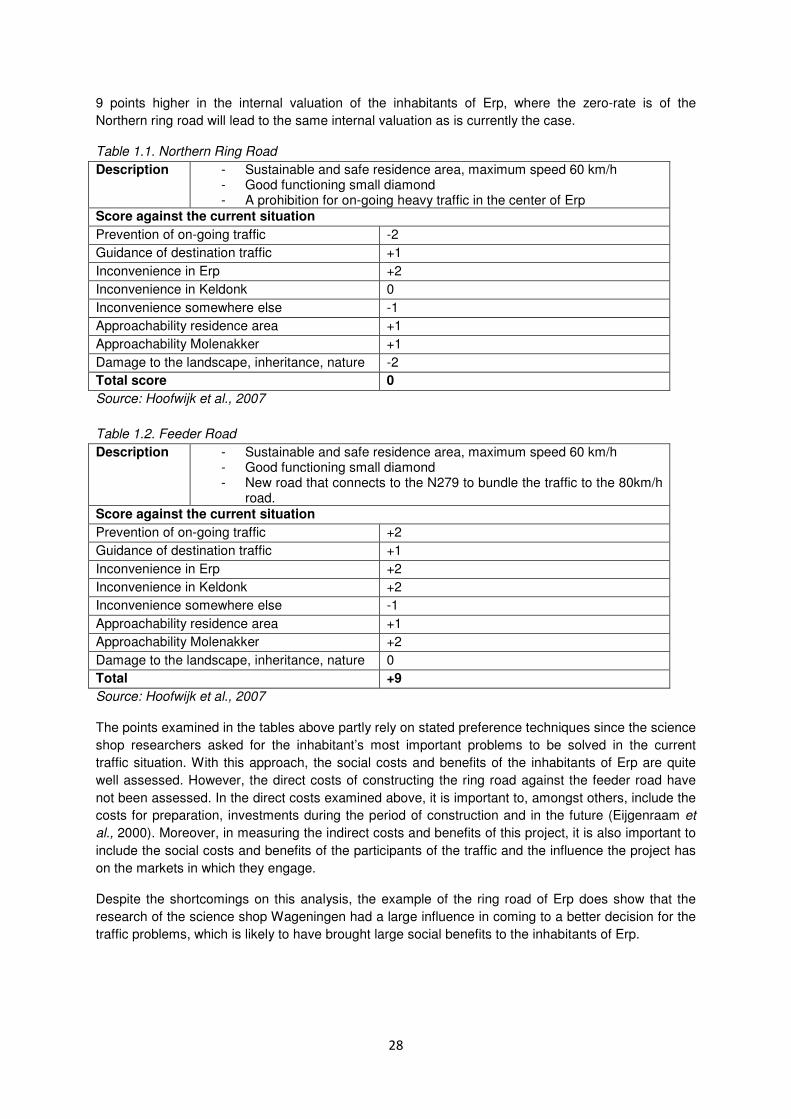
These two projects are compared in the research of the science shop as represented in table 1 and 2
(Hoofwijk et al., 2007). The benefits of infrastructure projects are largely determined by the internal
valuation of traffic participants or the inhabitants of the area (Eijgenraam, 2000). Based on tables 1.1
and 1.2 below, we can see that the alternative solution proposed by the science shop is likely to score
28
9 points higher in the internal valuation of the inhabitants of Erp, where the zero-rate is of the
Northern ring road will lead to the same internal valuation as is currently the case.
Table 1.1. Northern Ring Road
Description - Sustainable and safe residence area, maximum speed 60 km/h - Good functioning small diamond - A prohibition for on-going heavy traffic in the center of Erp
Score against the current situation
Prevention of on-going traffic -2
Guidance of destination traffic +1
Inconvenience in Erp +2
Inconvenience in Keldonk 0
Inconvenience somewhere else -1
Approachability residence area +1
Approachability Molenakker +1
Damage to the landscape, inheritance, nature -2
Total score 0
Source: Hoofwijk et al., 2007
Table 1.2. Feeder Road
Description - Sustainable and safe residence area, maximum speed 60 km/h - Good functioning small diamond - New road that connects to the N279 to bundle the traffic to the 80km/h
road.
Score against the current situation
Prevention of on-going traffic +2
Guidance of destination traffic +1
Inconvenience in Erp +2
Inconvenience in Keldonk +2
Inconvenience somewhere else -1
Approachability residence area +1
Approachability Molenakker +2
Damage to the landscape, inheritance, nature 0
Total +9
Source: Hoofwijk et al., 2007
The points examined in the tables above partly rely on stated preference techniques since the science
shop researchers asked for the inhabitant’s most important problems to be solved in the current
traffic situation. With this approach, the social costs and benefits of the inhabitants of Erp are quite
well assessed. However, the direct costs of constructing the ring road against the feeder road have
not been assessed. In the direct costs examined above, it is important to, amongst others, include the
costs for preparation, investments during the period of construction and in the future (Eijgenraam et
al., 2000). Moreover, in measuring the indirect costs and benefits of this project, it is also important to
include the social costs and benefits of the participants of the traffic and the influence the project has
on the markets in which they engage.
Despite the shortcomings on this analysis, the example of the ring road of Erp does show that the
research of the science shop Wageningen had a large influence in coming to a better decision for the
traffic problems, which is likely to have brought large social benefits to the inhabitants of Erp.
29
ANNEX 3: THE NEED FOR COMMUNITY BASED RESEARCH, THE CASE OF THE MEZOCSAT MICRO-REGION OF HUNGARY The ESSRG Science Shop in Hungary is the first one established in the country as part of the
Environmental Social Science Research Group (ESSRG) of Szent Istvan University, Hungary. Partly,
the research of this science shop is conducted by researchers and partly by students. In this latter
case, research is conducted in the form of participatory action research (PAR).
An example of such a PAR was the design of a rural development plan of the Mezocsat micro-region
of Hungary in order to strengthen cooperation among local stakeholder and initiate development
projects. Master students could participate in this project by following a 5 credits course at either the
Szent István University in Gödöllő or the Pázmány Péter Catholic University or students could
voluntarily conduct in-depth interviews with local inhabitants in the region. Together, this formed a
group of 29 students that were involved in conducting interviews, organizing community forums and
developing project ideas with local inhabitants. Next to the students, a science shop coordinator was
involved in the project.
The project resulted in a participatory rural development plan, consulted and co-created with the
public in the micro-region and formed the basis of an article by Borkodos and Pataki (2009) on the
role of science and society. In this article, they provided the participatory action research (PAR)
combined with an educational model of service learning as a methodology to fulfill academic
institutions’ responsibilities to establish science-society relationships and mutual dialogues. Borkodos
and Pataki (2009) apply this methodology to sustainability planning in one of the most socio-
economically disadvantaged rural areas of north-east Hungary. Part of this work was the development
of an environmental education trial that would provide more attractive services for eco-tourism,
promoting local products by organizing annual local product festivals and a rural development plan for
the Mezocsat micro-region of Hungary. With the help of this case-study area, the article shows that
community-based research is necessary to tackle problems that include empowering local people and
providing space for dialogues, amongst others. Hereby, it is necessary for researchers to stay
sensitive and receptive to local needs.
Hence, science shops can help bridge this gap between the academic world and small communities.
However, the article goes further by arguing that this may not only be beneficial for these
communities, it can also provide new teaching opportunities that make students more enthusiastic for
the research they conduct. By offering credits for their work done, the capacity of academic
institutions can largely expand. Furthermore, Borkodos and Pataki (2009) found that this kind of
research can bring researchers to discover new fields of research. An example of this is the issue of
environmental justice among Roma-communities in the studied Mezocsat micro-region.
30
BIBLIOGRAPHY
Brent, (2009) “Handbook of Research on Cost-Benefit Analysis.” Edward Elgar. Cheltenham,
UK.
(Brown and Mikkelsen 1990, pp. 131-132).
Commissie Wetenschapscommunicatie, (2009) “Dossier Wetenschapswinkel. Voor de