DISCUSSION PAPER SERIES Forschungsinstitut zur Zukunft der Arbeit Institute for the Study of Labor The Effects of the Earned Income Tax Credit on Children’s Health, Quality of Home Environment, and Non-Cognitive Skills IZA DP No. 9173 July 2015 Susan Averett Yang Wang
Transcript
DI
SC
US
SI
ON
P
AP
ER
S
ER
IE
S
Forschungsinstitut zur Zukunft der ArbeitInstitute for the Study of Labor
The Effects of the Earned Income Tax Credit on Children’s Health, Quality of Home Environment,and Non-Cognitive Skills
IZA DP No. 9173
July 2015
Susan AverettYang Wang
The Effects of the Earned Income Tax Credit
on Children’s Health, Quality of Home Environment, and Non-Cognitive Skills
Any opinions expressed here are those of the author(s) and not those of IZA. Research published in this series may include views on policy, but the institute itself takes no institutional policy positions. The IZA research network is committed to the IZA Guiding Principles of Research Integrity. The Institute for the Study of Labor (IZA) in Bonn is a local and virtual international research center and a place of communication between science, politics and business. IZA is an independent nonprofit organization supported by Deutsche Post Foundation. The center is associated with the University of Bonn and offers a stimulating research environment through its international network, workshops and conferences, data service, project support, research visits and doctoral program. IZA engages in (i) original and internationally competitive research in all fields of labor economics, (ii) development of policy concepts, and (iii) dissemination of research results and concepts to the interested public. IZA Discussion Papers often represent preliminary work and are circulated to encourage discussion. Citation of such a paper should account for its provisional character. A revised version may be available directly from the author.
IZA Discussion Paper No. 9173 July 2015
ABSTRACT
The Effects of the Earned Income Tax Credit on Children’s Health, Quality of Home Environment, and Non-Cognitive Skills*
In 1993, the benefit levels of the Earned Income Tax Credit (EITC) were changed significantly based on the number of children in the household. Employing a difference-in-differences plus mother fixed-effects framework, we find better mother-rated health for children of unmarried black mothers and married white and Hispanic mothers, lower accident rates for children of married white and Hispanic mothers, and improved home environment quality for children of unmarried white and Hispanic mothers. Our results provide new evidence of the effects of the 1993 EITC expansion and therefore have important policy implications. JEL Classification: I12, I38, J13 Keywords: EITC, child health, home environment, non-cognitive skills Corresponding author: Susan Averett Lafayette College Department of Economics Easton, PA 18042 USA E-mail: [email protected]
* We have benefited greatly from helpful comments from Nicholas Stacy, Dhaval Dave, David Simon, and participants at the 2013 Eastern Economic Association Annual meeting, the 2013 Southern Economic Association Annual meeting, and the 2014 American Economic Association Annual meeting. All remaining errors are our own.
In 2013, 14.5 percent of Americans had incomes below the poverty level and approxi-
mately one in five children lived in poverty (Census Bureau, 2014). Although the child
poverty rate in the U.S. has recently been falling, it remains stubbornly greater than
that of nearly all other OECD countries (OECD, 2009). For decades, a vigorous na-
tional debate has existed over how to best improve the lives of the poor, particularly
children. In the aftermath of the 1996 welfare reform, government spending on tra-
ditional welfare programs has slowed and the Earned Income Tax Credit (EITC) has
become the nation’s largest anti-poverty program in terms of dollars spent.1 Scholars
have exerted a considerable amount of effort to ascertain the effect of the EITC on
poverty reduction (Scholz, 1994; Neumark and Wascher, 2001; Meyer, 2010), labor force
participation (Eissa and Leibman, 1996; Meyer and Rosenbaum, 2001; Hotz and Scholz,
2003; Cancian and Levinson, 2006; Eissa et al., 2008), educational attainment (Miller
and Zhang, 2009), and marriage (Ellwood, 2000; Dickert-Conlin, 2002). In this paper,
we focus on the potential effects of the EITC on three outcomes that have been linked
to later life well-being and economic success: children’s health, the quality of their home
environment, and their non-cognitive skills.
Economists have been interested in whether certain welfare reform has led to better
health behaviors/outcomes for recipients and their children (e.g., Bitler et al., 2005;
Dunifon et al., 2006; Corman et al., 2013), because health is an important consumption
and investment good (Grossman, 1972) and children’s health is particularly crucial for
the accumulation of human capital and hence their future health and socioeconomic
status (e.g., Currie, 2005; Currie and Stabile, 2006; Heckman, 2007). However, only a
few studies have examined the effect of the EITC on the health and/or health behaviors
of adult recipients2, and even fewer studies have examined how the increased income
1Information on spending was obtained from the Tax Policy Center at:http://www.taxpolicycenter.org/taxfacts/displayafact.cfm?Docid=266, accessed 9/18/2014.
2For example, Schmeiser (2009), using the same dataset as we do in this paper and an InstrumentalVariable method, finds that an increase in family income due to the generosity of state and federalEITC benefits significantly raised the Body Mass Index (BMI) and the probability of being obese for
2
from the EITC might affect children’s health. For example, Baker (2008) and Hoynes
et al. (2012), using different datasets but similar identification and estimation methods,
find that an EITC-induced increase in family income is associated with a 7 to 14 gram
increase in average birthweight and a 6.7 to 10.8% reduction in low birthweight rate,
respectively. In related work, Strully et al. (2010) exploit state-level EITC variation
and find evidence that the EITC reduces the incidence of low birthweight using census
data. Finally, Baughman (2012) examines the effects of the state-level EITC on a wider
array of children’s health related outcomes including mother-rated health and insurance
coverage and finds that states which adopted the EITC saw higher rates of private health
insurance coverage and lower rates of public health insurance coverage for children.
If we say that we still know little about how the EITC affects children’s health, then
we can say that we know almost nothing about its effects on another two important
measures of children’s outcomes: their home environment quality and their non-cognitive
skills.3 Home environment quality has been linked to health outcomes including asthma
and obesity (Crawford et al., 2010; Ege et al., 2011; Carneiro et al., 2013). And it is also
an important predictor of children’s cognitive ability, school readiness and hence later
life success (Todd and Wolpin, 2007; Carneiro et al., 2013).
Similarly, a growing body of evidence has documented that non-cognitive skills, de-
fined as personality, social, and emotional traits, are important predictors of school
readiness (Duncan et al., 2007) and later life economic success as they are crucial com-
ponents of human capital (Heckman et al., 2005; Cunha et al. 2010; Cunha and Heck-
women with EITC-eligible earnings. Averett and Wang (2012) and Cowan and Tefft (2012) examine theeffect of the 1993 EITC expansion on women’s smoking behavior. Though using different datasets andfocusing on different groups of women, both studies find that the increase in income following the EITCexpansion led to a significant decline in the likelihood of smoking for (certain groups of) women. Evansand Garthwaite (2014) examine the effects of the 1993 EITC expansion on female recipients’ healthusing data from the Behavioral Risk Factor Surveillance Survey (BRFSS) and the National HealthInterview Survey (NHIS), and find that the number of days with poor mental health and the fractionreporting excellent or very good health improved and risky levels of biomarkers fell for mothers of twoor more children relative to the mothers with only one child.
3Related work by Dahl and Lochner (2012) examines the effect of the EITC expansion on children’scognitive outcomes. Children’s scores on tests of cognitive ability have long been found to be predictiveof later life outcomes (Todd and Wolpin, 2007; Cunha et al., 2010; Cunha and Heckman, 2010) andDahl and Lochner show that a $1,000 increase in family income could raise math and reading testscores by 6% of a standard deviation in the short run, and this gain is even larger for children fromdisadvantaged families.
3
man, 2010). Both the quality of the home environment and non-cognitive skills are also
important components/predictors of the racial gap in school readiness and cognitive
ability. For example, Currie (2005) calculates that racial differences in health conditions
and in maternal health and behaviors together may account for as much as a quarter
of the racial gap in school readiness, and Todd and Wolpin (2007) note that equalizing
home inputs at the average levels of white children would close the black-white and the
Hispanic-white test score gaps in math and reading by about 10 - 20%.
In this paper, we aim to fill this gap in the literature by focusing on the potential
health, quality of home environment, and non-cognitive skills effects on the children of
the recipients of the 1993 EITC expansion, the largest expansion to-date of the EITC.
Specifically, in 1993, then President Bill Clinton expanded the EITC as a strategy to
support minimum wage workers, famously stating “No one should have to work forty
hours a week and raise a family in poverty.” (Klein, 2003, p.55) This expansion dramati-
cally increased the difference in EITC benefits between eligible families with two or more
children and those with only one child. We are therefore able to exploit the differential
trends in children’s health, quality of home environment, and non-cognitive skills after
this policy change between children in a family with two or more EITC-eligible children
and those in a family with only one EITC-eligible child, to examine the effect of the
EITC, the largest anti-poverty program in the United States, on children’s outcomes of
interest.
There are three channels through which the EITC expansion could influence chil-
dren’s outcomes that we study in this research. First, there is a direct income effect.
The 1993 EITC expansion was the largest expansion in EITC history. It increased in-
come for its recipients through increased EITC benefit levels, and this increased family
income may impact children’s outcomes. For example, the existence of a positive in-
come/health gradient is well-known and has been documented for a wide array of health
outcomes and health-related behaviors (e.g., Deaton, 2002; Adda et al., 2009). Increased
income may allow the family to purchase higher-quality food and better medical care,
and improve the quality of their housing/home environment thus improving child health.
4
Previous research has found that poverty is associated with increased exposure to lead
paint, increased child mortality and an increased likelihood of hospitalization (Duncan
and Brooks-Gunn, 2000), though whether family income has a causal effect on chil-
dren’s health remains an important economic question (e.g., Case et al., 2002; Currie
and Stabile, 2003; Currie, 2009).
Second, expanding the EITC might influence children’s outcomes through its effect
on mother’s labor supply. The EITC was designed to and has been found to encourage
labor force participation in the low-income population because of its negative income
tax structure.4 The effect of this increased labor supply on children’s outcomes can
be complex (Gordon et al., 2007; Gennetian et al., 2010; Morrill, 2011). On the one
hand, when low-income parents work more, they are more likely to earn higher income
and higher income could lead to a positive change in children’s outcomes, as discussed
above. On the other hand, however, increased maternal employment may also decrease
mothers’ ability to care for and supervise their children, leading perhaps to less healthful
activities, such as eating poorly or engaging in a more sedentary lifestyle. Increased
maternal employment could also lead to more non-parental child care, and this may have
its own effects on children. For example, non-parental child care has been associated
with an increase in childhood communicable diseases (Bradley, 2003) and an increase in
childhood obesity (Maher, 2008).
Third, expanding the EITC may impact children’s outcomes through changed health
and/or health behaviors of the parents. As discussed above, the EITC has been found to
be largely beneficial for mothers’ health, mentally and physically (Evans and Garthwaite,
4There is a considerable literature on the effect of the EITC on labor supply and scholars haveexamined both the intensive (hours or weeks worked) and the extensive (labor force participation)margins. From a purely theoretical perspective, economic theory indicates that the EITC expansionshould unambiguously increase the labor force participation of unmarried women. The effect of theEITC on the labor force participation decision of married women is more complex as it depends alsoupon their husbands’ labor supply. At the intensive margin, the effect of the EITC expansion dependson where on the subsidy range the individual is located. The three distinct credit regions of the federalEITC program, the phase-in, the plateau and the phase-out regions, each yield their own labor supplyincentives for workers already in the labor force. Previous research has found that the EITC expansionsthat occurred in the 1990s tended to increase labor force participation but had little effect on hoursworked (Eissa and Liebman, 1996; Eissa and Hoynes, 2006) though some studies find no effect of EITCexpansion on either margin (e.g. Cancian and Levinson, 2006).
5
2014), and a healthy mother can take better care of her children and pay more attention
to their health, the quality of their home environment, and their non-cognitive skills.
In addition, there has been research showing that the EITC leads mothers to smoke
less (Averett and Wang, 2012 and Cowan and Tefft, 2012), which is good for children
through less exposure to second-hand smoke and/or a positive role-model effect.
Because expanding the EITC might impact children in different directions through
these three channels, the direction of the final/composite effects is an empirical question
depending on the relative sizes of the various effects discussed above. Using a difference-
in-differences plus mother fixed-effects (DD+FE) method, we find that the 1993 EITC
expansion statistically significantly improved mother-rated health for children of unmar-
ried black mothers and married white and Hispanic mothers, lowered the probabilities
of having accidents for children of married white and Hispanic mothers, and improved
home environment quality for children of unmarried white and Hispanic mothers. Our
results provide new evidence on the positive effects of the 1993 EITC expansion on chil-
dren’s health and the quality of their home environment, and therefore have important
policy implications.
Our research makes the following contributions. First, it is among the first to ex-
amine, at the individual level, the effects of the EITC expansion on children’s health,
the quality of their home environment, and their non-cognitive skills, and therefore con-
tributes to a growing literature on the potential spillover effects of non-health safety
net programs (e.g. Dunifon et al., 2006; Leonard and Mas, 2008; Strully et al., 2010;
Baughman 2012; Hoynes et al., 2012). As a major anti-poverty program in the United
States, it is important to include a full range of benefits in any cost-benefit analysis of
the EITC, especially given that the United States continues to struggle with ways to
improve the health and decrease the health care costs of its population. More impor-
tantly, because interventions in childhood may have disproportionately large returns in
terms of human capital accumulation and adult socio-economic status, it is particularly
important to focus on effects of various public policies on children. Focusing on the
EITC-eligible population is also important since children from low income families tend
6
to have worse health status, poorer home environments and lower non-cognitive skills
that may compromise their future labor market success (Currie, 2009).
Second, our paper uses a longitudinal dataset, which makes it possible to employ
a difference-in-differences plus mother fixed-effects estimation method. Our estimates
are therefore free of family-level time-invariant unobserved heterogeneity, which cannot
be easily achieved by using (pooled) cross sectional data or even panel data at more
aggregate levels. Most studies on the health effects of the EITC instead use repeated
cross sectional data sets such as the Behavioral Risk Factor Surveillance System, the
National Health Interview Survey, the Current Population Survey, or Vital Statistics
(e.g., Evans and Garthwaite, 2014). It is important to show and indeed encouraging
to the EITC literature that results on the positive effects of the EITC on children’s
health and their home environment are robust to the inclusion of mother fixed effects.
Longitudinal data also allow us to explore the dynamics of the effects of the EITC and
see how these effects on our outcome variables change over time relative to the policy
change, which is particularly important since the EITC policy does not “turn off” (as
long as parents remain eligible) and therefore may have accumulating effects throughout
children’s childhood.
The rest of this paper proceeds as follows. In the second section, we present details
of the EITC with a focus on the 1993 expansion. Following that we discuss our data
and econometric models and then our empirical results. We offer concluding comments
in the final section.
2 The Earned Income Tax Credit and the Omnibus
Reconciliation Act of 1993
The EITC is a refundable tax credit that provides cash payments to qualifying families.
First started in 1975 as a rather modest tax credit for the working poor designed to offset
social security taxes and to encourage the poor to work, the EITC has grown into one of
the nation’s largest anti-poverty programs in terms of the amount of money the federal
7
government transfers to low income individuals who qualify for the credit and is one of
the main federal policy tools for redistributing income. By 1996, spending on the EITC
was almost double the spending on the Aid to Families with Dependent Children (AFDC)
program, which until the early 1990s was the primary source of spending for the poor,5
and in 2011 over 28 million people received nearly $65 billion in EITC benefits.6 The
EITC generally enjoys bipartisan support because it reduces poverty while rewarding
work, and some economists argue that the EITC works better than the minimum wage at
improving the wellbeing of the working poor due to its targeted nature (e.g., Burkhauser
et al., 1996; Neumark and Wascher, 2001).
For qualifying (low income) households, the EITC provides cash transfers as a per-
centage of earned income and these transfers increase with household income. The EITC
benefit schedule is divided into three phases defined by income levels. For those with
the lowest incomes, the percentage benefit is the greatest. Once the maximum benefit is
reached, the benefits received by recipients remain constant over a range of income. The
third phase begins once a certain amount of earned income is reached and the benefits
start to decrease with income. Finally, over a certain threshold, the EITC benefits are
completely phased out. Different income cutoff points and rates of increase/decrease in
benefits affect how generous the EITC is to low income families and individuals.
The EITC policy has undergone several changes over time. The focus of this pa-
per is on the impact on children’s health, the quality of their home environment, and
their non-cognitive skills of the 1993 Omnibus Reconciliation Act (OBRA93), signed by
then President Clinton which dramatically increased the difference in benefits between
families with two or more children and those with only one child. The difference was
first created as part of the Omnibus Reconciliation Act of 1990, but on a much smaller
scale. Because of this policy change, the maximum benefits for families with two or more
children more than doubled and for the first time a meaningful separation was created
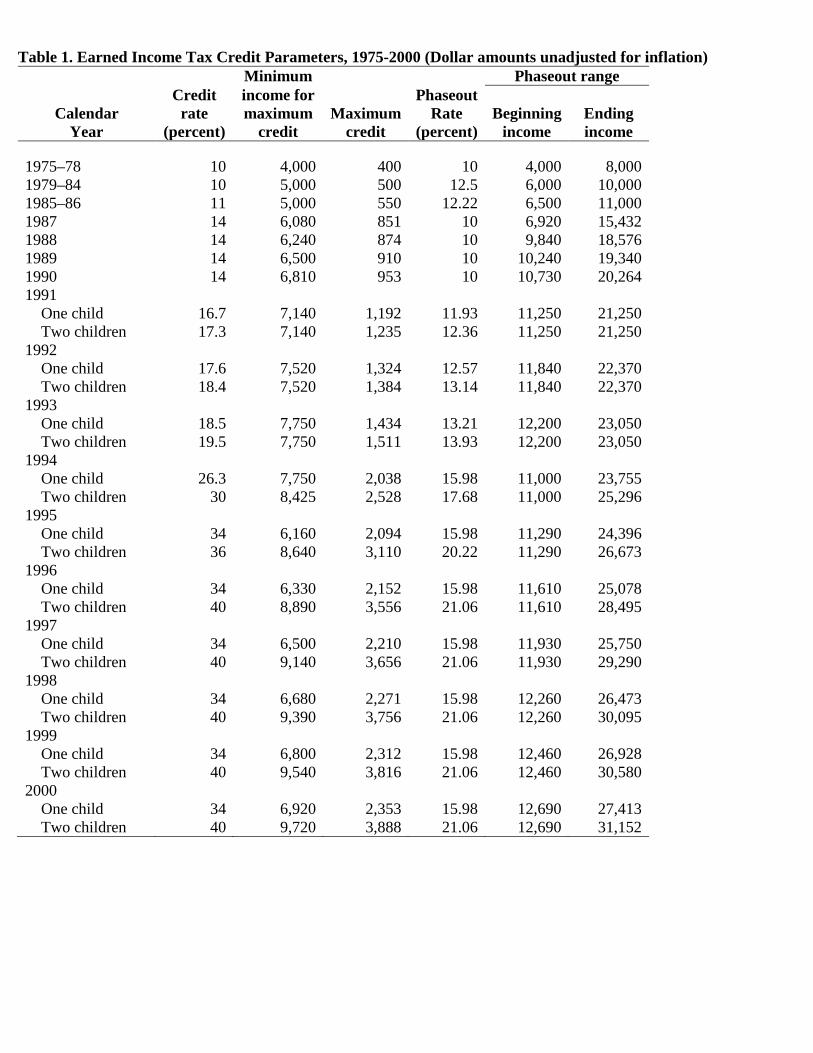
for eligible families based on the number of children as reported in Table 1.7
The credit has three parameters that policymakers can manipulate: the credit rate
(Table 1, column 1), the maximum amount of the credit (column 2) and the phase out
rate/range (columns 3, 4 and 5). As is clear from Table 1, back in 1991, the difference
in maximum benefits between families with one child and families with two or more
children was less than $40. In 1996, however, this difference jumped to over $1,400.
This general structure is still in place today.8 Because of this exogenous policy change,
we are able to provide empirical evidence on the effects of the EITC expansion on our
outcomes of interest for recipients’ children.
Note that although Dahl and Lochner (2012) report that the 1993 expansion in-
creased eligible families’ incomes by as much as 20%, the typical family might not receive
the full EITC benefit. Indeed, research has shown that the average difference in EITC
benefits between mothers with one versus those with two or more children is $480 (Hotz
and Scholz, 2006). While the magnitude of this difference in income may appear small
in absolute terms, whether it could be a relatively large income shock for the wellbeing
of the children with low-educated mothers with two or more children under the age of
19 in the household is an empirical question.
3 Data
We use data from the 1979 National Longitudinal Survey of Youth (NLSY79) and the
NLSY79 Child and Young Adult (NLSCYA) to examine the effects of the 1993 EITC
expansion on the well-being of the children of low income mothers. The NLSY79 sampled
12,686 individuals who were between the ages of 14 and 21 in 1979 and has followed
them ever since, with annual interviews until 1994 and interviews every other year
following that through 2010. The NLSCYA cohort is a longitudinal project that follows
7Tax Policy Center http://www.taxpolicycenter.org/taxfacts/displayafact.cfm?Docid=36, accessed05/01/2014. The most recent EITC expansion was in 2009 as a part of American Recovery and Rein-vestment Act.
8See 1040 instruction for the difference in maximum benefits for tax year 2010,http://www.irs.gov/pub/irs-pdf/i1040gi.pdf (accessed 05/01/2014).
9
the biological children of the women in the NLSY79.9 We match the children from the
NLSCYA with their biological mothers in the NLSY79 to obtain information on whether
the mothers are EITC-eligible and whether they are likely to be affected by the 1993
EITC expansion.
The NLSY79 is the only dataset of which we are aware that allows us to examine
the 1993 EITC expansion using children of women who were in their childbearing years
at that time and for whom we have longitudinal information — i.e., we can observe
the same mothers before and after the expansion and therefore purge our estimates of
any family-level time-invariant heterogeneity by the use of mother fixed-effects estima-
tion — an important feature of these data that we exploit in the analyses that follow
and is absent in (repeated) cross sectional data. The NLSY79 also oversamples civilian
blacks, Hispanics, and the economically disadvantaged non-black/non-Hispanic popula-
tion, which likely expands our pool of children of EITC-eligible mothers. In addition,
the NLSY79 household roster makes it possible to more accurately measure the number
of EITC-eligible children (under 19 years of age and living in the household).
We focus on the changes in our outcome variables between 1990, three years before
the 1993 EITC expansion, and 1998, three years after EITC-eligible families with two
or more children first received their dramatically increased EITC payments due to the
policy change. This eight-year period covers four waves of the data: 1990, 1992, 1996,
and 1998. We exclude the data from 1994 because 1994 is right in the middle of the policy
change. This relatively long time period allows us to analyze the dynamic effect of the
EITC expansion on children over time relative to the policy change, which is particularly
important since as long as parents remain eligible children will be continuously influenced
by this policy change throughout their childhood.
A key question within our research framework is how to restrict the sample to include
people likely to be eligible for the EITC. Although the EITC is income-based, previous
literature indicates that there are important labor supply consequences of the program
9See http://www.bls.gov/nls/handbook/2005/nlshc3.pdf for a description of the NLSY79 (accessed05/01/2014) and http://www.nlsinfo.org/content/cohorts/NLSY79-Children for a description of theNLSCYA cohort (accessed 05/01/2014).
10
(see Section 1 for citations). Thus, an income-based criterion is inappropriate as this
would select the sample based on an outcome and potentially contaminate our results
due to sample selection bias.
We employ the same strategy used in the literature (e.g., Averett and Wang, 2012
and Evans and Garthwaite, 2014) and use education to determine who in our sample
is likely to be eligible for the EITC. In particular, we regard those mothers with fewer
than 13 years of education as potentially eligible for EITC and those with 13 or more
years of education as likely ineligible for the EITC. In our sample, we observe that
several women obtained more years of education after the policy change, which gave
them more than 12 years of education and thus made them very unlikely to be eligible
for EITC benefits. We therefore exclude children of those women in our sample to avoid
contamination of the estimation results.10 There are also some women in our data who
switched treatment status after the policy change; i.e., they went from having one EITC-
eligible child (control group) before 1993 to having two or more EITC-eligible children
(treatment group) after 1995 or vice versa.11 We exclude children of these women from
our sample for the same reason. We also exclude those few observations with missing
information on important control variables.
We use the following outcome variables. First, for children’s health, we use: (1)
illness in the past year, a binary variable generated from the responses to the question,
“Has the child had an illness in last 12 mos. requiring medical attention?”; (2) accident
in the past year, a binary variable generated from the responses to the question on the
“number of accidents or injuries the child has had in the past 12 mos”; and (3) an overall
measure of the child’s health as rated by the mother12.
10Results from a robustness check where we keep those children whose mothers obtained more than 12years of education after the policy change and hence may have lost their EITC eligibility are qualitativelythe same as our main results and are available upon request.
11Results from a robustness check where we keep those children whose mothers switched treatmentstatus after the policy change are qualitatively the same as our main results and are available uponrequest. In addition, we might worry that the EITC provided incentives for mothers to have morechildren. However, research indicates that the EITC expansions in 1993 not only did not encouragefertility but led to a small reduction in higher-order fertility among white women (Baughman andDickert-Conlin, 2009).
12This variable is measured on a Likert scale ranging from 1 to 4 with 4 being excellent, 3 being good,
11
Our measure of the quality of the home environment is the Home Observation Mea-
surement of the Environment (HOME) standardized z-score,13 which measures the qual-
ity of the home environment provided by a child’s family and includes questions regarding
the cleanliness of the home, whether the play environment in the home is safe for chil-
dren, whether regular meals are eaten, whether television time is limited, what type of
discipline is used, how often parents read to the child and whether parents assist with
homework among other questions.14
Finally, our measure of non-cognitive skills is the Behavior Problems Index (BPI)
standardized z-score, a 28-item questionnaire administered to parents about their chil-
dren and a widely used indicator of non-cognitive skills (Cunha et al., 2010).15 Higher
values of this index indicate more behavior problems and lower non-cognitive skills and
it is answered by the mother for children aged four and over.16 While there are other
health outcomes that we would have liked to include that are available in the NLSYCA
such as asthma and ADHD, they were not asked frequently enough for us to use given
our research design.
4 Econometric Models
As explained in Section 1, we exploit the unique feature of the EITC expansion during
1993 to 1995 to identify the effects of EITC expansion on children’s outcomes important
2 being fair, and 1 being poor. This variable was only asked in the years 1992, 1996, and 1998.
13A general discussion of this measure can be found at: https://www.nlsinfo.org/content/cohorts/nlsy79-children/topical-guide/assessments/home-home-observation-measurement, accessed 05/01/2014.A complete list of questions used to construct the HOME scores can be found athttps://www.nlsinfo.org/content/cohorts/nlsy79-children/other-documentation/codebook-supplement/appendix-home-sf-scales (accessed 05/01/2014).
14Note that although some questions used to construct HOME scores such as cleanliness of the homeare at the household level, responses to most questions such as how often parents read to the childand whether parents assist with homework still vary from child to child. Therefore this measure of thequality of home environment is still an individual-level variable.
15Some researchers focus on “(BPI) Headstrong”, a subset of the BPI because they argue it is thebest measure of non-cognitive skills (Cunha et al., 2010). When we used this measure our results werequalitatively the same so we only report the overall BPI.
16Details of this index can be found at: https://www.nlsinfo.org/content/cohorts/nlsy79-children/topical-guide/assessments/behavior-problems-index-bpi, last accessed on 06/23/2015.
12
for their health, human capital accumulation, and later life success. Our baseline econo-
metric model for the children of EITC-eligible mothers therefore is a straightforward
difference-in-differences (DD) framework as follows:
where αj measures the mother fixed effects or unobserved time-invariant heterogeneity
between different families. The inclusion of αj is important, because omitted variable
bias will likely result if αj is correlated with any of the control variables and yet is
excluded from the model.
5 Results
Because of well-known differences in our outcome variables across race, we estimate our
models separately by race/ethnicity (Currie, 2005; Adler and Rehkopf, 2008; Carneiro et
al., 2013). Specifically, we consider two race/ethnicity subsamples: white and Hispanic
mothers, and black mothers.17
In addition, the literature shows that parents’ marital status plays an important role
in determining children’s health and other outcomes (e.g., McLanahan, 2004; Ribar,
2004; Blackwell, 2010; Bzostek and Beck, 2011), and previous research has also estab-
lished that the EITC has no impact on low-income women’s marital status (Ellwood,
17In the NLSY79, the only three mutually exclusive categories for race/ethnicity were black, Hispanic,and non-black, non-Hispanic. Because Hispanics may identify as white or black and considering thesample size, we combine white mothers with Hispanic mothers, calling this subsample the white andHispanic subsample. We then refer to the group of black mothers as the black subsample. In addition,the race/ethnicity of the mothers is identical to that of their children, so we do not differentiate betweenmothers’ and children’s race/ethnicity. In robustness checks not reported but available upon request,we conduct our analysis separately for the three race/ethnicity groups, by combining Hispanic motherswith black mothers instead, and by pooling all three race/ethnicity groups together, and the results arelargely the same.
14
2000). We therefore further analyze the effects of the EITC policy change on children’s
outcomes by their parents’ marital status as well. Specifically, we now divide the chil-
dren in our sample into four groups: two different races/ethnicities and two parental
marital statuses: married at the time of interview or not. Table 2 reports sample means
for children by their (mothers’) race/ethnicity, parental marital status, and treatment
status, denoted by the number of EITC-eligible children in the household, for mothers
with less than 13 years of education (and therefore more likely to be eligible for the
EITC) in our sample.
When we look at the measures of children’s outcomes of interest, we see that there are
sizable differences in these outcomes across race/ethnicity, marital status, and numbers
of EITC-eligible children. For example, children of white and Hispanic mothers were
more likely to have an illness needing medical attention or an accident in the past year,
as well as higher HOME and lower BPI scores than those of black mothers.
When we turn our attention to the characteristics of the children and their mothers
in our sample, we see that children of different groups are of similar age on average,18 and
about half of them are male. All mothers are of a similar age too, reflecting the cohort
nature of the NLSY sampling scheme, and have similar years of education on average
which is expected given that all the mothers in our sample have less than 13 years of
education. In addition, black mothers have more EITC-eligible children in the household
compared to white and Hispanic mothers. Finally, white and Hispanic mothers are more
likely to live in a state with higher AFDC benefits and higher unemployment rates.
Before reporting our estimation results, it is instructive to consider what the average
family in our sample received in terms of the EITC benefits. Table 3 shows the EITC
benefits received by EITC-eligible families in our sample by the numbers of EITC-eligible
children in the households for years 1990, 1992, 1996, and 1998. As is clear from the
table, in 1990 and 1992, the difference in benefits between these two groups of families
was rather small (around $50 to $200); in 1996 and 1998, however, the mean difference
18In our main specification, we use a continuous measure of children’s age. In a robustness check notreported but available upon request, we use dummy variables to control for children’s age given howrapidly children develop. Once again, our results are qualitatively the same.
15
in benefits between families with only one child and those with two or more children
rose to $300 to $400 in our sample.19 This is somewhat less than what Hotz and Scholz
(2006) report as the average EITC benefit but the difference is likely due in part to the
composition of our sample.
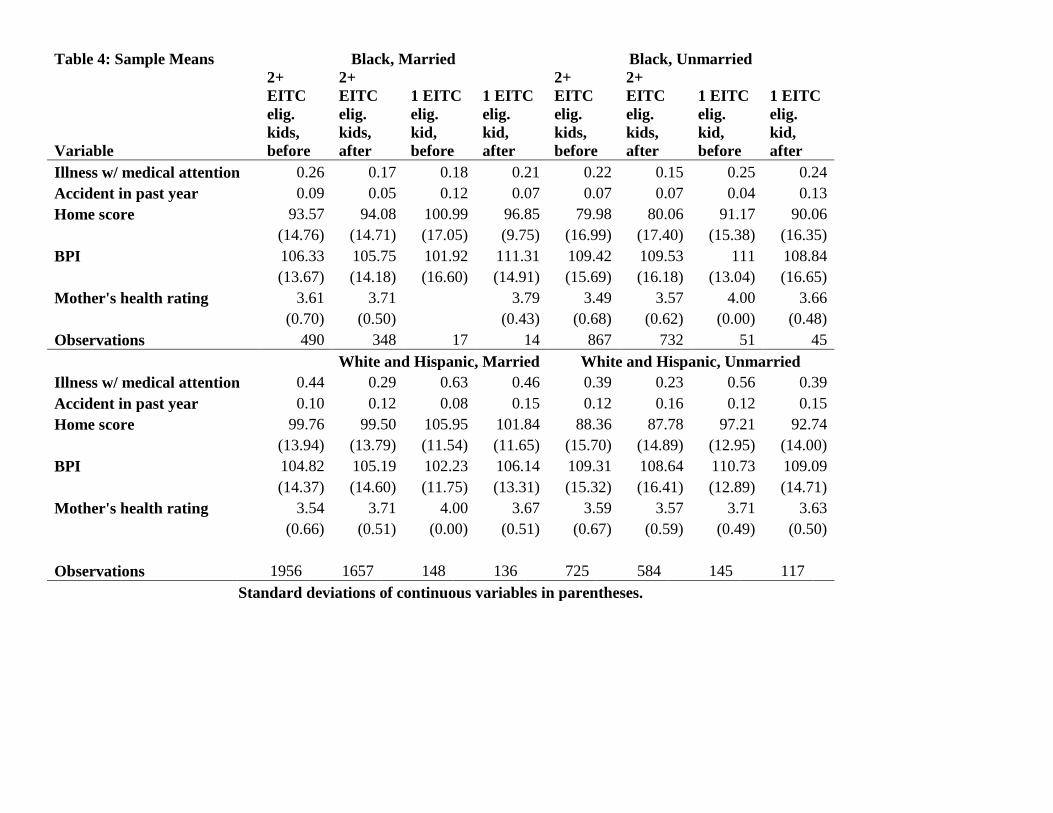
Table 4 presents the summary statistics for the five outcome variables by race/ethnicity,
parental marital status, and treatment status (1 EITC-eligible child versus 2 or more
EITC-eligible children), before and after the policy change. This table previews some
of our parametric estimation results. For example, in Table 4 looking at white and His-
panic married women before the policy change we see that 10.0 percent of the children
in the treatment group and 8.0 percent in the control group had an accident in the past
year. After the policy change, however, these two numbers were 12.0 for the treatment
group and 15.0 for the control group, leading to an unadjusted difference-in-differences
estimate of (12.0 − 15.0) − (10.0 − 8.0) = −5.0 percentage point. This indicates that
although accident rates were overall trending upwards during this time period, without
controlling for any control variables or mother fixed effects, the EITC expansion led to
a 5 percentage point decline in the probability of having an accident for children of low
income, married white and Hispanic mothers with two or more EITC-eligible children
relative to those with only one EITC-eligible child. For this same group, a parallel cal-
culation reveals that the HOME score increased by 3.86 points. This table also shows a
similar economically meaningful pattern for some of the other outcome measures includ-
ing the HOME (BPI) score for black women which increases (decreases) by 4.65 (11.24)
points. However, these simple, unadjusted difference-in-differences calculations do not
give us an indication of statistical significance.
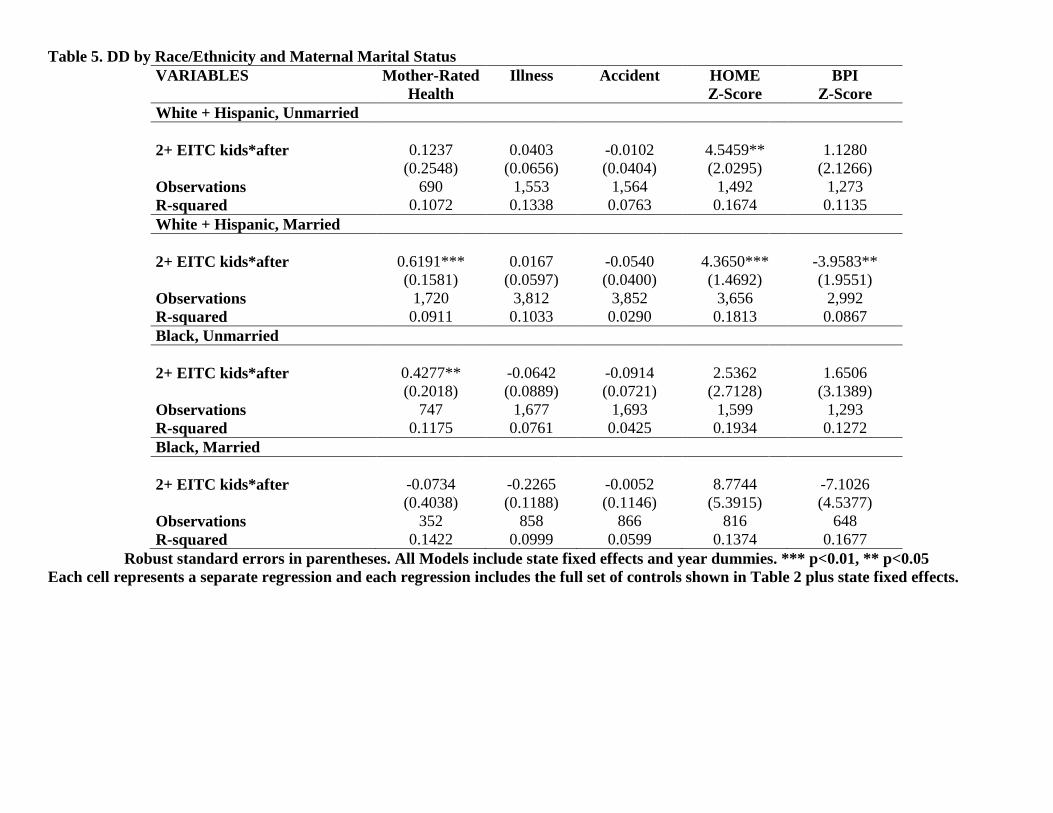
Tables 5 and 6 report the main estimation results for the linear probability DD model,
for all the outcome measures for children by race/ethnicity and marital status of their
mothers. We show only the DD coefficients but all models include the control variables
shown in Table 2.20 Table 5 presents the DD model without mother fixed effects based
19Numbers in Table 3 are calculated based on families’ earnings in the previous year and the EITCparameters shown in Table 1. Details are available upon request.
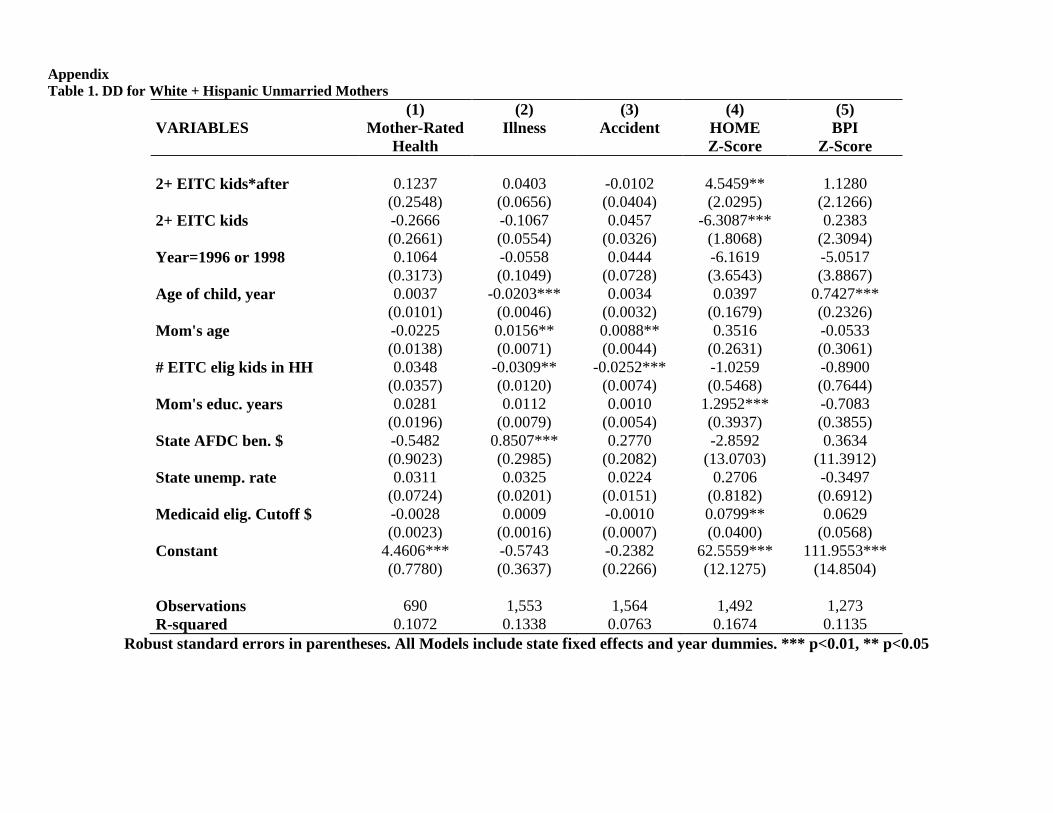
20The full estimation results are in Appendix Tables 1 - 8.
16
on Equation (4.1) and reveals that the EITC expansion significantly increased mother’s
rating of her child’s health for married white and Hispanic mothers and unmarried black
mothers. We also find that the quality of the home environment increased for children of
white and Hispanic mothers of either marital status and that the children of unmarried
white and Hispanic mothers also had better non-cognitive skills. We find no effect of
the 1993 EITC expansion on illness or accidents using this simple DD model.
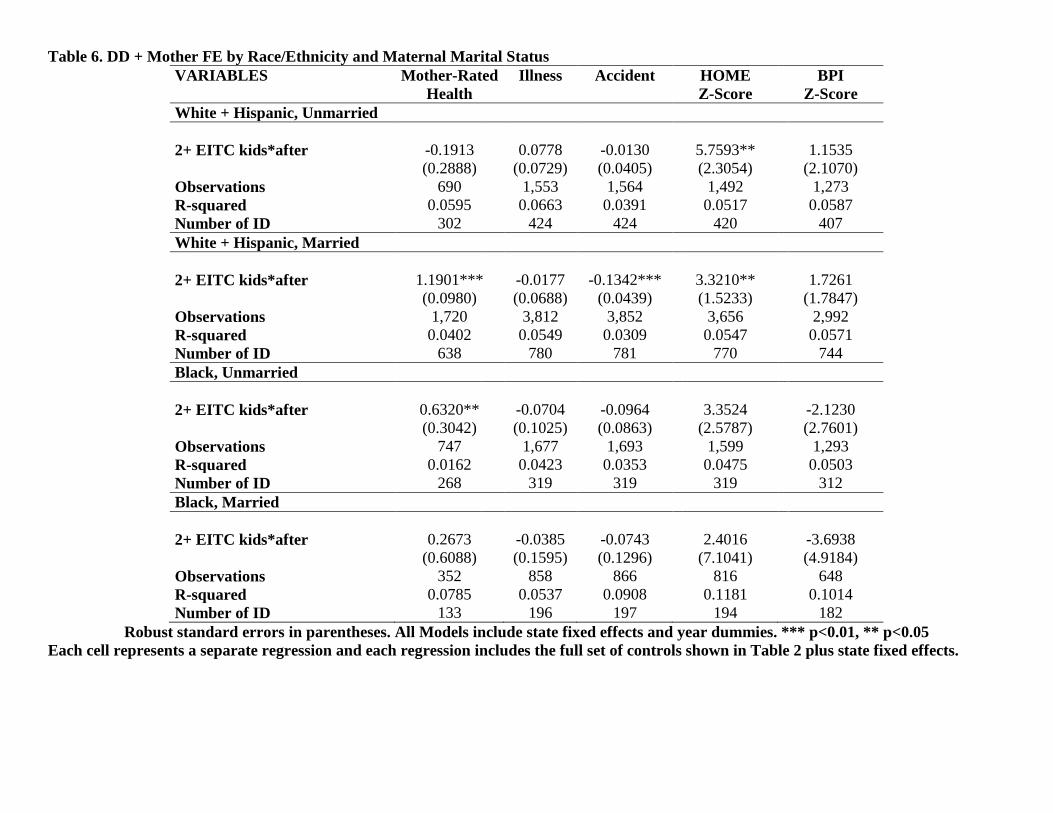
In Table 6, we add the mother fixed effects to our analysis using Equation (4.2)21. We
see that children of white and Hispanic mothers of either marital status still have higher
HOME z-scores after the addition of mother fixed effects to the model. For white and
Hispanic children of unmarried mothers, the 5.76 points increase in the HOME z-score is
equivalent to 37.6 percent (5.76/15.29) of the standard deviation of the HOME z-score
(see Table 2), while for white and Hispanic children of married mothers, the 3.32 points
increase is equivalent to 24.1 percent (3.32/13.77) of the standard deviation. Similarly,
mother-rated health for children of married white and Hispanic mothers and unmarried
black mothers significantly increased after the 1993 EITC expansion. For children of
married white and Hispanic mothers, this increase is equal to 32 percent (1.19/3.71) of
the average mother-rated health for this group, while for children of unmarried black
mothers, this increase is equal to 18 percent (0.63/3.57) of the corresponding mean.
The inclusion of mother fixed effects also makes some important changes to the
estimation results compared to those presented in Table 5. Specifically, children of white
and Hispanic married mothers no longer have a lower BPI score, but they do enjoy
a statistically significantly lower accident rate, evidence of protective effect of EITC
expansion on children’s health possibly through, among other things, an improvement
in the quality and/or quantity of child care. These changes highlight the importance
of controlling for family-level time-invariant unobserved heterogeneity by including the
mother fixed effects which is made possible by our use of longitudinal data.
To bolster our confidence that the estimated δdd indeed captures the effects of the
21Standard errors are clustered at the household/mother level. We have also tried clustering thestandard errors at the state level, and our results are robust.
17
1993 EITC expansion on children’s outcomes of interest, we conduct a falsification test
where we exclude children of mothers with only one child and focus only on children in
the households with two or more EITC-eligible children. Mothers with three or more
children will be considered as the ‘treatment’ group in this case, while those with exactly
two children will form the ‘control’ group. Everything else in this falsification test is the
same as in Equation (4.2).
Because the 1993 EITC expansion provides the greatest differential treatment for
eligible mothers with one child versus those with two or more children, we should not
expect to see any significant effect on children’s outcomes of the policy change for the
‘treatment’ group compared to the ‘control’ group in this falsification test, because any
association of the EITC expansion with the outcomes of interest in this definition of
the ‘treatment’ and ‘control’ groups would be considered spurious and would call into
question similar associations reported in Tables 5 and 6. This is exactly what we see in
Table 7, where again each estimated coefficient is from a separate regression. In addition,
the coefficients in these regressions are generally much smaller than those seen in Tables
5 and 6 and despite the necessarily smaller sample sizes and hence the slightly larger
standard errors, they truly appear to be indicative of no effect which is what we would
expect from this falsification test. It is noteworthy that this falsification test also shows
that the effect we capture in Table 6 based on Equation (4.2) is not merely the effect of
mothers having another child and thus giving less or more attention to all their children;
otherwise children of mothers changing from having two to three or more children would
experience significant changes in the outcomes of interest.
In order to take into account the possible dynamic nature of the effects of the 1993
EITC expansion on children’s outcomes, we further investigate how these effects changed
over time relative to the first year of the policy treatment. Table 8 presents the estimation
results. Here, for each outcome measure and each of the four race/ethnicity and parental
marital status groups, we report two estimates, the first one is the effect of EITC one
year after the policy change became effective (i.e., 1996), and the second one is the effect
of the EITC expansion three years after the policy change (i.e., 1998). These numbers
18
provide some new and interesting information on exactly how the EITC policy change
impacted children in our sample.
For example, the positive effects on mother-rated health and the negative effects on
having an accident for white and Hispanic children of married mothers were significant
right after the policy change and lasted at least for another three years. The only
difference is that for mother-rated health, the effects decreased slightly in magnitude,
while for the probability of having an accident, the effects became economically and
statistically more significant over time. When we look at the effects of this policy change
on HOME scores for white and Hispanic children of unmarried mothers, we find that the
policy change did not make an instant impact, but only became significant about three
years later. The effects of this policy on HOME scores for children of white and Hispanic
married mothers, however, become statistically insignificant, though the magnitude of
the effects stay relatively stable. Furthermore, the effect of the 1993 EITC policy change
on mother-rated health for children of unmarried black mothers is statistically significant
in 1996 but not in 1998.
Finally, it is important to note that the key assumption underlying any DD strategy
is that the outcomes of interest in the treatment and the control groups would follow
the same trend over time if not for the treatment. Specifically, in our case, we would be
concerned if children of mothers with two or more EITC-eligible kids (treatment group)
already displayed trends in our outcome variables which were significantly different from
those for the children of mothers with only one EITC-eligible kid (control group) prior
to the EITC expansion. In that instance, it would be difficult to conclusively assign the
changes in our outcome variables to the policy change itself.
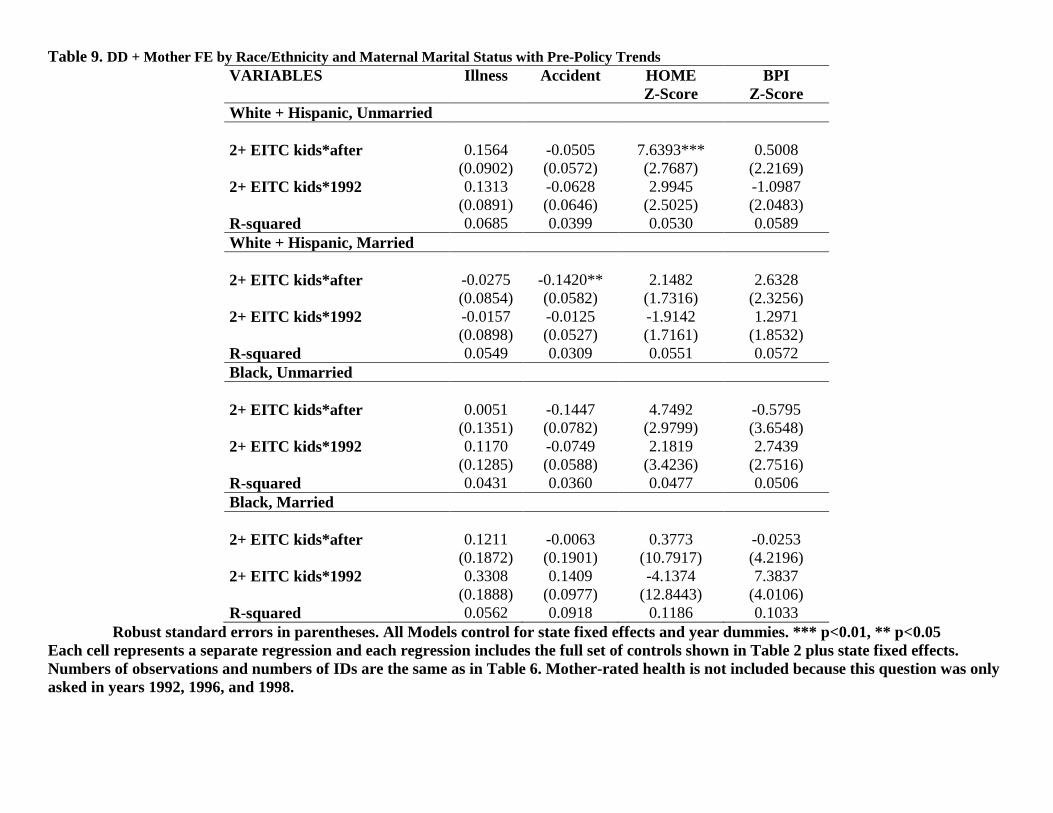
To check whether this assumption of non-existence of pre-policy trend indeed holds,
we estimate the DD model with the interaction between the treatment status and year
1992 (one year before the policy change), controlling for the same set of covariates as
used for the estimations reported in Table 6.22 If those interaction terms between the
22We cannot include the interaction between the treatment status and year 1990 due to multicollinear-ity, and we cannot conduct this analysis for mother-rated health because the question used to generatethis variable was only asked in 1992, 1996, and 1998 for our sample period.
19
treatment status and the pre-policy year are significant, then it is important that we
control for them to avoid attributing to the EITC expansion any significant changes in
our outcome variables that may merely reflect pre-treatment trends; if they are insignif-
icant, then we can be reassured that pre-existing trends are not driving our results and
therefore not a concern.
Our results presented in Table 9 provide clear evidence that there exist no pre-
treatment trends that are different between the treatment and the control groups; that
is, the interaction terms between treatment status and the pre-policy year are all sta-
tistically insignificant, and our DD estimates all stay unchanged except for that of the
HOME score for children of married white and Hispanic mothers which, although has
insignificant pre-trend term, is no longer statistically significant. This finding that the
interaction term between treatment status and the pre-policy year are insignificant gives
us confidence that our results are not merely capturing the effects of some pre-existing
trends in our outcomes.
As mentioned earlier, $480 extra received by a typical EITC-eligible family with two
or more children might not seem substantial in absolute terms. However, our results
suggest that at least for this group of children of low-educated mothers, this EITC
expansion does matter for their health and the quality of their home environment. These
results are consistent with Baker (2008) and Hoynes et al. (2012) who find that the
1993 EITC expansion had statistically significantly increased the birth weight of EITC
recipients’ children. They are also consistent with findings regarding reduced maternal
smoking (Averett and Wang, 2012 and Cowan and Tefft, 2012 ), and improved mental
and physical health for female EITC recipients (Evans and Garthwaite, 2014) .
One lingering question is why children of the four different race/ethnicity and marital
status groups experienced different changes in their health status and quality of their
home environment. One explanation is that qualifying families of different race/ethnicity
groups and even different marital status have different EITC take-up rates.23 The other
23See Scholz (1994) for suggestive evidence on the difference in EITC take-up rates by race/ethnicityand marital status.
20
possibility is that although the EITC expansion works through the same three channels
on children’s outcomes of interest, the magnitude, significance, and even the sign of
these effects may vary by children’s race/ethnicity and their parental marital status.
And these two points are precisely the reason why we conduct our analysis separately
for these groups.24
6 Discussion and Conclusions
In this research, we analyze whether the EITC, the largest anti-poverty program in the
US, also serves to improve children’s health, the quality of their home environment,
and their non-cognitive skills by exploring an exogenous increase in EITC benefits that
occurred in the mid-1990s. Although the policy is not specifically aimed at improving
these outcomes, it is possible that it might do so through its effect on income, maternal
labor supply and/or maternal health or health behaviors. These potential spillover
effects are a potentially important benefit of this program.
The EITC enjoys wide support across the political spectrum and the literature look-
ing into the potential health impacts of the EITC has just been emerging. We contribute
to this literature not only by joining the discussion on the potential effects of the EITC
on children’s health, but also by being the first to analyze the potential effects of the
EITC on the quality of children’s home environment and their non-cognitive skills. We
conduct our analyses separately by race/ethnicity and parental marital status. Our
results indicate that the 1993 EITC expansion has statistically significantly improved
mother-rated health for children of unmarried black mothers and married white and
Hispanic mothers, lowered the probabilities of having accidents for children of married
white and Hispanic mothers, and improved home environment quality for children of
unmarried white and Hispanic mothers. These results are robust to various specification
and falsification checks.
In the past several decades, U.S. poverty relief has become increasingly tied to em-
24Hoynes et al. (2012), for example, also find different effects of the EITC on birth weight with blackmothers seeing much larger effects as compared to white mothers.
21
ployment, but the consequences for children’s wellbeing remain controversial. The EITC,
as an income-redistribution policy which encourages labor force participation among the
low income population, has enjoyed wide support. Overall our results provide evidence
of positive externalities in children’s health and the quality of their home environment
from the EITC and therefore have potentially important policy implications.
22
References Adda, Jerome, James Banks, and Hans-Martin von Gaudecker. 2009. “The Impact of Income Shocks on Health: Evidence from Cohort Data.” Journal of the European Economic Association 7(6): 1361-99. Adler, N. E., and Rehkopf, D. H. 2008. “US disparities in health: descriptions, causes, and mechanisms.” Annual Review of Public Health, 29, 235-252. Averett, Susan and Yang Wang. 2012. “The Effects of EITC Payment Expansion on Maternal Smoking.” Health Economic, 22(11), 1344 – 1359 Baker, Kevin. 2008. “Do Cash Transfer Programs Improve Infant Health: Evidence from the 1993 Expansion of the Earned Income Tax Credit.” mimeo, University of Notre Dame. Baughman, Reagan A. 2012. “Effects of State EITC Expansion on Children’s Health”, The Carsey Institute at the Scholars’ Repository. Paper 168. Baughman, Reagan A, and Dickert-Conlin, Stacy. 2009. "The earned income tax credit and fertility." Journal of Population Economics 22(3):537-563. Bitler, Marianne, Jonah B. Gelbach, and Hilary W. Hoynes. 2005. “Welfare Reform and Health.” Journal of Human Resources, 40(2): 309-334. Blackwell, Debra L. 2010. "Family structure and children's health in the United States: findings from the National Health Interview Survey, 2001-2007." Vital and health statistics. Series 10, Data from the National Health Survey 246: 1. Bradley, R. H. 2003. “Child care and common communicable illnesses in children aged 37 to 54 months.” Archives of pediatrics & adolescent medicine, 157(2), 196-200. Burkhauser, Richard, Kenneth Couch and Andrew Glenn. 1996. “Public Policies for the Working-Poor: The Earned Income Tax Credit Versus Minimum Wage Legislation.” Research in Labor Economics 15: 65-109. Bzostek, Sharon H., and Audrey N. Beck. 2011. "Familial instability and young children’s physical health." Social Science & Medicine 73, no. 2: 282-292. Cancian, M. and A. Levinson. 2006. “Labor Supply Effects of the Earned Income Tax Credit: Evidence from Wisconsin’s Supplemental Benefit for Families with Three Children.” National Tax Journal, 59(4): 781-800. Carneiro, P., Meghir, C., and Parey, M. 2013. “Maternal education, home environments, and the development of children and adolescents.” Journal of the European Economic Association, 11(s1), 123-160.
Case, A., Lubotsky, D., Paxson, C., 2002. “Economic status and health in childhood: the origins of the gradient.” American Economic Review 92, 1308–1334. Centers for Disease Control and Prevention. 2000. Growth Charts (http://www.cdc.gov/nchs/about/major/nhanes/growthcharts/clinical_charts.htm) Census Bureau. 2014. “Income and Poverty in the United States: 2014” Available at: http://www.census.gov/content/dam/Census/library/publications/2014/demo/p60-249.pdf. Last accessed 9/18/2014. Corman, Hope, DM Dave, D Das, and NE Reichman. 2013. "Effects of welfare reform on illicit drug use of adult women." Economic Inquiry 51.1: 653-674. Cowan, Benjamin, and Nathan Tefft. 2012. "Education, Maternal Smoking, and the Earned Income Tax Credit." The BE Journal of Economic Analysis & Policy12.1. Crawford, David, V. Cleland, Anna Timperio, Jo Salmon, Nick Andrianopoulos, R. Roberts, Billie Giles-Corti, Louise Baur, and Kathleen Ball. 2010. "The longitudinal influence of home and neighbourhood environments on children's body mass index and physical activity over 5 years: the CLAN study." International journal of obesity 34, no. 7: 1177-1187. Carneiro, Pedro, Costas Meghir, and Matthias Parey. 2013. "Maternal education, home environments, and the development of children and adolescents." Journal of the European Economic Association 11.s1: 123-160. Cunha, F., Heckman, J. J., and Schennach, S. M. 2010. “Estimating the technology of cognitive and noncognitive skill formation.” Econometrica, 78(3), 883-931. Cunha, F., and Heckman, J. J. 2010. “Investing in our young people.” National Bureau of Economic Research. No. w16201 Currie, Janet. 2005. “Health disparities and gaps in school readiness.” The Future of Children, 15(1), 117-138. Currie, Janet. 2009. “Healthy, Wealthy, and Wise: Socioeconomic Status, Poor Health in Childhood, and Human Capital Development.” Journal of Economic Literature, 47(1), 87-122. Currie, J., and Lin, W. 2007. “Chipping away at health: more on the relationship between income and child health.” Health Affairs, 26(2), 331-344. Currie, Janet and Mark Stabile, 2003."Socioeconomic Status and Child Health: Why Is the Relationship Stronger for Older Children?" American Economic Review, 93(5), 1813-1823. Currie, Janet, and Mark Stabile. 2006. "Child mental health and human capital accumulation: the case of ADHD." Journal of Health Economics, 25.6: 1094-1118.
Dahl, Gordon B., and Lance Lochner. 2012 "The impact of family income on child achievement: Evidence from the earned income tax credit." The American Economic Review, 102.5: 1927-1956. Deaton, A.S. 2002. "Policy Implications of the Gradient of Health and Wealth," Health Affairs, 21: 13-30. Dickert-Conlin, Stacy. 2002. “EITC and Marriage.” National Tax Journal, 55(1): 25-40. Duncan, G. J., and Brooks‐Gunn, J. (2000). Family poverty, welfare reform, and child development. Child development, 71(1), 188-196. Duncan, Greg J., Chantelle J. Dowsett, Amy Claessens, Katherine Magnuson, Aletha C. Huston, Pamela Klebanov, and Linda S. Pagani. 2007. “School readiness and later achievement.” Developmental psychology, 43(6), 1428. Dunifon, R., Hynes, K., and Peters, H. E. 2006. “Welfare reform and child well-being.” Children and Youth Services Review, 28(11), 1273-1292. Ege, Markus J., Melanie Mayer, Anne-Cécile Normand, Jon Genuneit, William OCM Cookson, Charlotte Braun-Fahrländer, Dick Heederik, Renaud Piarroux, and Erika von Mutius. 2011. "Exposure to environmental microorganisms and childhood asthma." New England Journal of Medicine 364(8): 701-709. Eissa, Nada and J. Liebman. 1996. “Labor Supply Response to the Earned Income Tax Credit.” Quarterly Journal of Economics, 111(2): 605-37. Eissa, Nada, and Hoynes, H. W. 2006. Behavioral responses to taxes: Lessons from the EITC and labor supply. In Tax Policy and the Economy, Volume 20 (pp. 73-110). The MIT Press. Eissa, Nada, Kleven, HJ, and Kreiner, CT. 2008. “Evaluation of four tax reforms in the United States: Labor supply and welfare effects for single mothers.” Journal of Public Economics, 92(3-4): 795-816. Ellwood, David T. 2000. “The Impact of the Earned Income Tax Credit and Social Policy Reforms on Work, Marriage and Living Arrangements.” National Tax Journal. 53(4): 1063-1005. Evans, William N., and Graig L. Garthwaite. 2014. “Giving Mom a Break: The Impact of Higher EITC Payments on Maternal Health”, American Economic Journal: Economic Policy, 6(2): 258-90. Gennetian, L. A., Hill, H. D., London, A. S., & Lopoo, L. M. 2010. “Maternal employment and the health of low-income young children.” Journal of Health Economics, 29(3), 353-363.
Gordon, R. A., Kaestner, R., and Korenman, S. 2007. “The effects of maternal employment on child injuries and infectious disease”. Demography, 44(2), 307-333. Grossman, M. 1972, “On the Concept of Health Capital and the Demand for Health.” Journal of Political Economy. 80 (2): 223 – 255. Heckman, J., J. Stixrud, and S. Urzua (2005). The effects of cognitive and noncognitive abilities on labor market outcomes and social behavior. Journal of Labor Economics 24 (3), 411-482. Heckman, James J. 2007. "The economics, technology, and neuroscience of human capability formation." Proceedings of the National Academy of Sciences, 104.33: 13250-13255. Heckman, J., S. H. Moon, R. Pinto, P. Savelyev, and A. Yavitz (2010). Analyzing social experiments as implemented: A reexamination of the evidence from the highscope perry preschool program. Technical Report IZA DP No. 5095, IZA Institute for the Study of Labor. Hotz, Joseph V. and John Karl Scholz. 2003. “The Earned Income Tax Credit.” In Means-Tested Transfer Programs in the United States, Robert Moffitt, ed. Chicago: The University of Chicago Press and the NBER, 141-197. Hotz, V. Joseph, and John Karl Scholz. 2006 “Examining the effect of the earned income tax credit on the labor market participation of families on welfare”. No. w11968. National Bureau of Economic Research,. Hoynes, Hilary W., Douglas L. Miller, and David Simon. 2012. “Income, the Earned Income Tax Credit, and Infant Health”. NBER Working Paper No. 18206. Klein, J. (2003). The natural: The misunderstood presidency of Bill Clinton. Random House LLC. Leonard, J., and Mas, A. 2008. “Welfare reform, time limits, and infant health”. Journal of health economics, 27(6), 1551-1566. Maher, E. J., Li, G., Carter, L., and Johnson, D. B. 2008. “Preschool child care participation and obesity at the start of kindergarten.” Pediatrics, 122(2), 322-330. Meyer, Bruce D. 2010. “The Effects of the Earned Income Tax Credit and Recent Reforms.” Chapter in NBER book Tax Policy and the Economy, Volume 24, Jeffrey R. Brown, editor. p. 153 - 180. Meyer, Bruce D., and Dan T. Rosenbaum. 2001. “Welfare, the Earned Income Tax Credit, and the Labor Supply of Single Mothers.” Quarterly Journal of Economics, 116(3): 1063-1114. McLanahan, Sara. 2004 "Diverging destinies: How children are faring under the second demographic transition." Demography 41.4: 607-627.
Miller, Amalia R., and Lei Zhang. 2009. “The Effects of Welfare Reform on the Academic Performance of Children in Low-Income Households.” Journal of Policy Analysis and Management, 28(4): 577–599. Morrill, M. S. 2011. “The effects of maternal employment on the health of school-age children,” Journal of Health Economics, 30(2), 240-257. Neumark, David and William Wascher. 2001. “Using the EITC to help Poor Families: New Evidence and a Comparison with the Minimum Wage.” National Tax Journal, 54(2): 281-317. OECD. 2009. “Comparative Child Well-Being Across the OECD.” Available at: http://www.oecd.org/social/family/43570328.pdf. Last accessed 9/18/2014. Ribar, David C. 2004. “What do social scientists know about the benefits of marriage?: A review of quantitative methodologies”. No. 998. IZA Discussion paper series. Schmeiser, M. 2009. “Expanding Wallets and Waistlines: The Impact of Family Income on the BMI of Women and Men Eligible for the Earned Income Tax Credit.” Health Economics, 18(11): 1277-84. Scholz, John Karl. 1994. “The Earned Income Tax Credit: Participation, Compliance, and Anti-Poverty Effectiveness.” National Tax Journal, 47(1): 59-81. Strully, K. W., Rehkopf, D. H., and Xuan, Z. 2010. “Effects of Prenatal Poverty on Infant Health State Earned Income Tax Credits and Birth Weight”. American sociological review, 75(4), 534-562. Todd, P. E., and Wolpin, K. I. 2007. “The production of cognitive achievement in children: Home, school, and racial test score gaps.” Journal of Human Capital, 1(1), 91-136.
Robust standard errors in parentheses. All Models include state fixed effects and year dummies. *** p<0.01, ** p<0.05 Each cell represents a separate regression and each regression includes the full set of controls shown in Table 2 plus state fixed effects.
Table 6. DD + Mother FE by Race/Ethnicity and Maternal Marital Status VARIABLES Mother-Rated
Health Illness Accident HOME
Z-Score BPI
Z-Score White + Hispanic, Unmarried 2+ EITC kids*after -0.1913 0.0778 -0.0130 5.7593** 1.1535 (0.2888) (0.0729) (0.0405) (2.3054) (2.1070) Observations 690 1,553 1,564 1,492 1,273 R-squared 0.0595 0.0663 0.0391 0.0517 0.0587 Number of ID 302 424 424 420 407 White + Hispanic, Married 2+ EITC kids*after 1.1901*** -0.0177 -0.1342*** 3.3210** 1.7261 (0.0980) (0.0688) (0.0439) (1.5233) (1.7847) Observations 1,720 3,812 3,852 3,656 2,992 R-squared 0.0402 0.0549 0.0309 0.0547 0.0571 Number of ID 638 780 781 770 744 Black, Unmarried 2+ EITC kids*after 0.6320** -0.0704 -0.0964 3.3524 -2.1230 (0.3042) (0.1025) (0.0863) (2.5787) (2.7601) Observations 747 1,677 1,693 1,599 1,293 R-squared 0.0162 0.0423 0.0353 0.0475 0.0503 Number of ID 268 319 319 319 312 Black, Married 2+ EITC kids*after 0.2673 -0.0385 -0.0743 2.4016 -3.6938 (0.6088) (0.1595) (0.1296) (7.1041) (4.9184) Observations 352 858 866 816 648 R-squared 0.0785 0.0537 0.0908 0.1181 0.1014 Number of ID 133 196 197 194 182
Robust standard errors in parentheses. All Models include state fixed effects and year dummies. *** p<0.01, ** p<0.05 Each cell represents a separate regression and each regression includes the full set of controls shown in Table 2 plus state fixed effects.
Z-Score White + Hispanic, Unmarried 3+ EITC kids*after 0.5614 0.0705 -0.0510 4.7566 -2.6460 (0.3172) (0.0714) (0.0480) (2.7095) (2.2981) Observations 577 1,290 1,301 1,246 1,060 R-squared 0.0697 0.0654 0.0338 0.0549 0.0667 Number of ID 219 313 313 309 304 White + Hispanic, Married 3+ EITC kids*after -0.0739 -0.0292 -0.0091 0.8422 -0.1427 (0.1769) (0.0412) (0.0242) (1.1182) (1.0593) Observations 1,589 3,527 3,564 3,384 2,778 R-squared 0.0375 0.0578 0.0282 0.0599 0.0595 Number of ID 548 663 664 658 639 Black, Unmarried 3+ EITC kids*after -0.2017 -0.0706 -0.0196 -0.9259 -1.7050 (0.2417) (0.0502) (0.0272) (2.4181) (2.3206) Observations 706 1,581 1,597 1,510 1,220 R-squared 0.0136 0.0480 0.0352 0.0486 0.0540 Number of ID 242 284 284 284 277 Black, Married 3+ EITC kids*after -0.3003 0.1336 0.0178 -1.1074 2.9335 (0.2137) (0.0835) (0.0510) (2.8139) (2.7257) Observations 338 827 835 786 622 R-squared 0.0904 0.0565 0.1020 0.1316 0.1043 Number of ID 124 179 180 178 168
Robust standard errors in parentheses. All models control for state fixed effects and year dummies. *** p<0.01, ** p<0.05 Each cell represents a separate regression and each regression includes the full set of controls shown in Table 2 plus state fixed effects.
Table 8. DD + Mother FE with Lagged Treatment Effects
Robust standard errors in parentheses. All Models control for state fixed effects and year dummies. *** p<0.01, ** p<0.05 Each cell represents a separate regression and each regression includes the full set of controls shown in Table 2 plus state fixed effects.
Numbers of observations and numbers of IDs are the same as in Table 6.
Table 9. DD + Mother FE by Race/Ethnicity and Maternal Marital Status with Pre-Policy Trends VARIABLES Illness Accident HOME
Robust standard errors in parentheses. All Models control for state fixed effects and year dummies. *** p<0.01, ** p<0.05 Each cell represents a separate regression and each regression includes the full set of controls shown in Table 2 plus state fixed effects. Numbers of observations and numbers of IDs are the same as in Table 6. Mother-rated health is not included because this question was only asked in years 1992, 1996, and 1998.
Appendix Table 1. DD for White + Hispanic Unmarried Mothers