DISCUSSION PAPER Report rMo.: UDD-89 SPATIAL DISTRIBUTION OF INDUSTRIES AND IMiPORTANT LOCATION FACTORS IN THE SEOUL REGION by Sang-Chuel Choe and Byung-Nak Song Nqovember 1985 Water Supply and Urban Development Department Operations PolicV Staff The 'W,orld Bank The views presented herein are those of the aLithors, and they should not be interpreted as reflecting those of the .lorld Bank. Public Disclosure Authorized Public Disclosure Authorized Public Disclosure Authorized Public Disclosure Authorized Public Disclosure Authorized Public Disclosure Authorized Public Disclosure Authorized Public Disclosure Authorized
Transcript
DISCUSSION PAPER
Report rMo.: UDD-89
SPATIAL DISTRIBUTION OF INDUSTRIESAND IMiPORTANT LOCATION FACTORS IN THE SEOUL REGION
by
Sang-Chuel Choe and Byung-Nak Song
Nqovember 1985
Water Supply and Urban Development DepartmentOperations PolicV Staff
The 'W,orld Bank
The views presented herein are those of the aLithors, and they shouldnot be interpreted as reflecting those of the .lorld Bank.
Pub
lic D
iscl
osur
e A
utho
rized
Pub
lic D
iscl
osur
e A
utho
rized
Pub
lic D
iscl
osur
e A
utho
rized
Pub
lic D
iscl
osur
e A
utho
rized
Pub
lic D
iscl
osur
e A
utho
rized
Pub
lic D
iscl
osur
e A
utho
rized
Pub
lic D
iscl
osur
e A
utho
rized
Pub
lic D
iscl
osur
e A
utho
rized
5)
Dr. Sang-Chuel Choe, Dean of the Graduate School of EnvironmentalStudies, Seoul National University, was the Local Director bf the 1Industrial Location Policies Research Project. Dr. Byung-Nak Song .
is a Professor of Economics at. Seoul National University. Theauthors would like to thank Dr. Kyu-Sik Lee, the Project Director,for his encouragement and support in preparing this paper. Hiscontribution through this research project to the understandingof intrametropolitan locatioh problems and policies in Korea hasbeen instrumental for rnaking a turning point of Korea's industriallocation policies and for the creation of the Industrial LocationStudy Group in Korea.
Research Project No.: RPO 672-91Research Project Name: An Evaluation of Industrial Location
Policies for Urban Deconcentration
C..
Abstract
This paper has been prepared as part of the World Bank's Industrial
Location Policies Research Project (RPO 672-91). The main purpose
of this study is to identify the locational forces that influence
the manufacturing industry in the Seoul region where more than
45 percent of industrial establishments are located and industrial
movement has been taking place most actively. The paper begins
with the analysis of changing spatial distribution of manufacturing
establishments and employment and documents spatial variations of
location characteristics; then it shows certain regularities observed
between the changing distribution of industries and spatial variations
in location factors, and develops hypothetical postulations for further
empirical analysis.
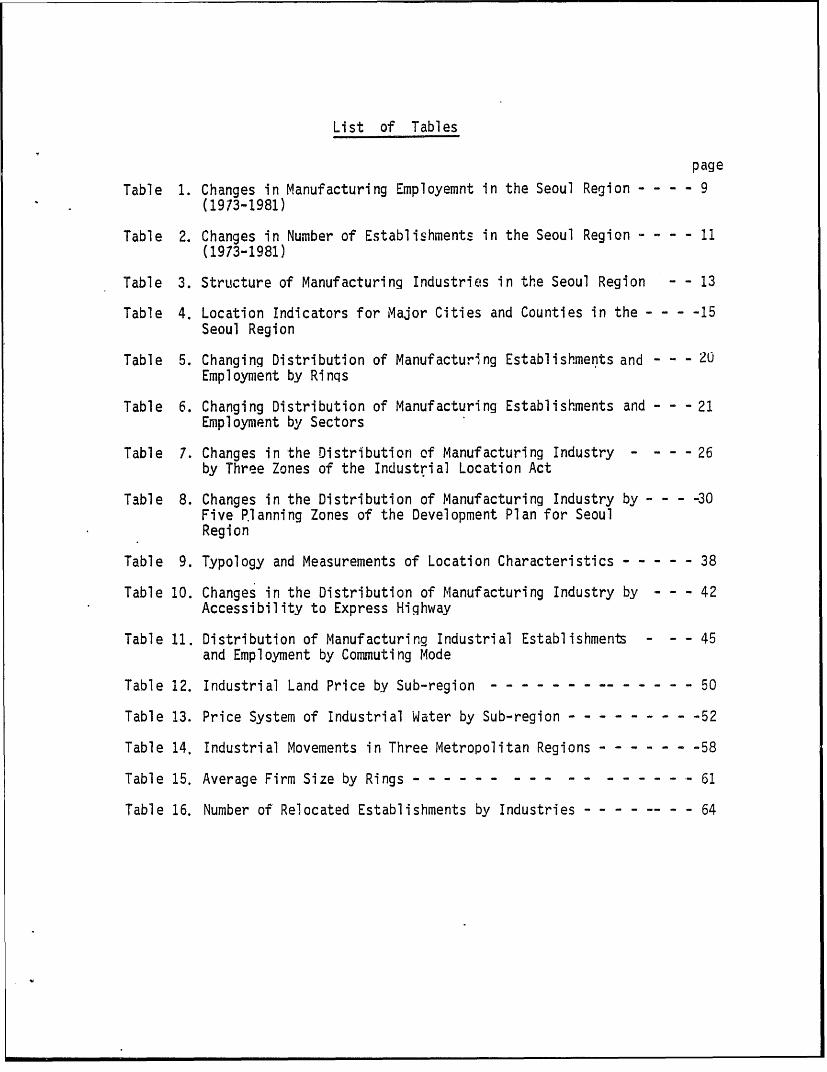
Table of Contents
page
Part I IntrodLuction------------- ------------ ------- 1
Part II Changing Spatial Distribution of Industries --- - 4
1. Stage of Industrial Development and Overall - - - 4Locational Changes
2. Locational Changes of Manufacturing Industries - - Cin the Seoul Region
A. Seoul versus Gyeonggi- 8
B. Southward versus Northward --- 12
C. Moving Distance and Directions -- ------ --- 17
D. Government Policies and Plans - - - - - - - - 24
Part III Spatial Variations in Location Characteristics - 32
1. Classification of Location Characteristics - - - - 32
2. Some Quantitative Measurements and Appraisal - - -of Locational Factors
A. Transportation- - --------------- 41
B. Industrial Land ------------- ---------- 46
C. Public Utilities and Telecommunications - - - 49
D. Urban Services - ------- ----- ------- --- - 53
Part IV Summary of Findings and Concluding Remarks - ----- --- 57
pageTable 1. Changes in Manufacturing Employemnt in the Seoul Region - - - - 9
(1913-1981)
Table 2. Changes in Number of Establishments in the Seoul Region - - - - 11(1973-1981)
Table 3. Structure of Manufacturing Industries in the Seoul Region - - 13
Table 4. Location Indicators for Major Cities and Counties in the - - - -15Seoul Region
Table 5. Changing Distribution of Manufacturing Establishments and - - - 20Employment by Rinqs
Table 6. Changing Distribution of Manufacturing Establishments and - - - 21Employment by Sectors
Table 7. Changes in the Distribution of Manufacturing Industry 26by Three Zones of the Industrial Location Act
Table 8. Changes in the Distribution of Manufacturing Industry by - - - -30Five Planning Zones of the Development Plan for SeoulRegion
Table 9. Typology and Measurements of Location Characteristics - ----- 38
Table 10. Changes in the Distribution of Manufacturing Industry by - - - 42Accessibility to Express Highway
Table 11. Distribution of Manufacturing Industrial Establishments - 45and Employment by Commuting Mode
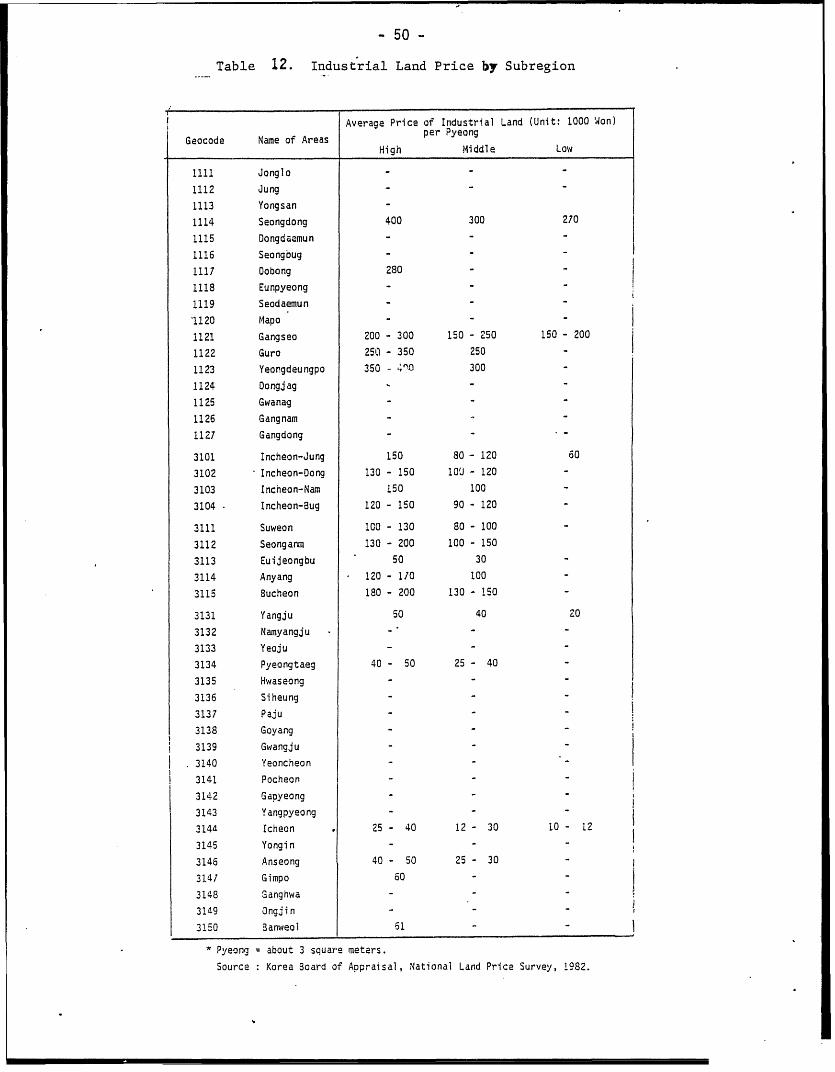
Table 12. Industrial Land Price by Sub-region---- - - - -- - - - - - 50
Table 13. Price System of Industrial Water by Sub-region ------------ 52
Table 14. Industrial Movements in Three Metropolitan Regions - - - - - - -58
Table 15. Average Firm Size by Rings ------ 61
Table 16. Number of Relocated Establishments by Industries - - - - ---- 64
List of Maps
page
Map 12. Concentration of Industries in the Seoul Region - - - - 16
Map 2. Areal Dilineation of Rings by Sub-regions --- - - - - - '18
Map 3. Areal Dilineation of Sectors by Sub-regions - - - - - -- 19
Map 4. Three Development Zones by Industrial Location Act - - - 25
Map 5. Five Planning Zones by Seoul Metropolitan Region - - - 29Development Plan
Map 6. Accessibility to Interchange of Express Highway - - - - 43.
Map 7. Time Distance by Railroad - - - - - - - -- ----- ---- 44
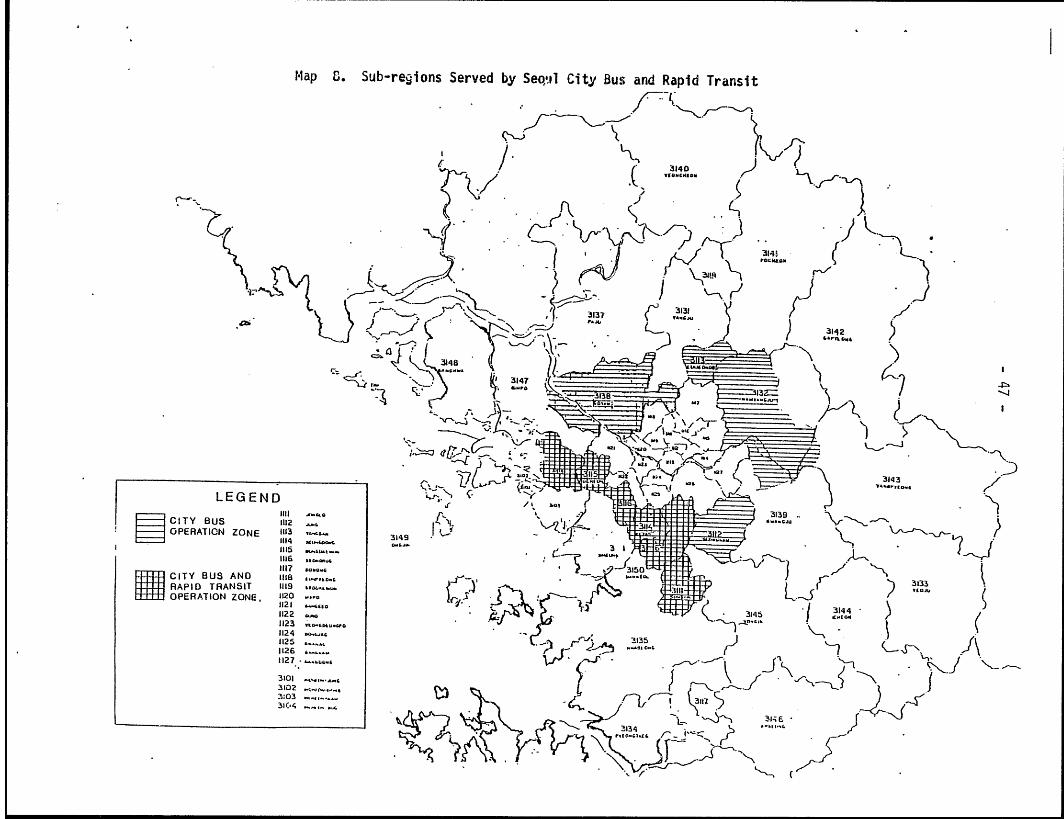
Map 8. Sub-regions Served by Seoul City Bus and/or Rapid Transit-47
Map 9. Time Distance from Seoul by Local Bus - - - ---- --- -- 48
Map 10. Residential Land Price by Sub-region - - - - --- - - -- 55
Part I, Introduction
The spatial redistribution of population and industry has been
a crucial developmental issue in Korea since the early 1960's. The
high primacy rate of Seoul, regional disparities and associated
regional rivalry detrimental to national integrity, and the concern
about national security have given the government a strong impetus in
taking action toward solving the nation's spatial imbalance, and in
particular toward the dispersal of industry from Seoul and its surround-
ing areas to the other parts of the nation. Throughout the relatively
short but compressed histroy of these decentralization efforts, indus-
trial location policies and programs have been highlighted as being
of major importance.
The reasons for choosing an industrial location program as the
strategic means for spatial redistribution are well known. The
Korean experience draws a particular attention because policies have
been heavily enforced and implemented. There are very few
countries aside from Korea which have actually brought in and implem-
ented an industrial location program for spatial distribution.
There is an increasing awareness by policy makers and academicians of
the need to evaluate the multi-dimensional consequences of industrial
-2-
location policies and their impacts on the overall regional development. -/
In the first phase of the present study, Choe and Song reviewed
the historical evolution of Korea's industrial location policies and
their policy instruments, attempting to make some qualitative evalua-
tions of the effectiveness of policy instruments. It also highligh-
ted the current policy situation and identified further research needs.
.However, the findings were only intended to serve as a historical and
institutional basis for the empirical formulation of policy analysis. 2/
This study's primary purpose is to contribute to the knowledge
and understanding of locational forces acting on the manufacturing indus-
try in the Seoul region where 45.2 percent of industrial establishments
is located and industrial movement has been taking place most actively.
Another rationale for choosing the Seoul region is that industrial
location policies that have evolved in Korea centered around the
attempts to move the manufacturing industry from Seoul and its adjacent
areas to peripheral areas. Locational forces are revealed
most clearly at the time of industrial movement, whether in the case
1/ (1) Office of the Minister Without Portfolio, A Study on oolic'Effectiveness of the Population Readistmri m theSe-oul Meropolitan Regin 17,(in K-orean)
(2) Won-Yong Kwon, "A Study of Economic Impact of Industrial Reloca-tion: A Case Study, Urban Studies, No. 18, 1981, and Sam OckPark, Locational Change in Manufacturing: A Conceptual Modeland Case Studies, Ph. D. dissertation submitted to Universityof Georgia, Athens, 1981.
2/ Sang-Chuel Choe and Byiung-Nak Song, An Evaluation of IndustrialLocational Policies for Urban Deconcentration in Seoul Region,Report No. UDD-7, Water Supply and Urban £Development Department,The World Bank, 1982
-3-
of relocating existing plants to new sites or opening of branches away
from parent plants. To this end, the present study begins with the
analysis of the changing spatial distribution of manufacturing
establishments and employment and the moving patterns of manufacturing
establishments by geographical delineation of distance, direction,
anld development zoning. The next part touches upon the definitional
and taxonomic issues of location characteristics by sub-regions in
the Seoul Region. The final section attempts to observe a certain
regularities between the changing distribution of industries and
spatial variations in location characteristics, with the expectation
of generating a set of broad hypotheses for further empirical analysis.
-4-
Part II. Changing Spatial Distribution of Industries
1. Sta.-, of Industrial Development and Overall Locational Changes
The beginning of the period of rapid industrial growth in Korea
is usually dated from 1963 when the economic growth rate marked about
9 percent at the beginning of the First-Five year Economic Plan.
The economic growth rate was on the average only about 3 percent
in the preceding years. Most Korean firms around 1963 were of the
small size and also of the single proprietorship type. Location or
relocation of these small firms w.as only a minor economnic issue.
As the economy and industries continued to grow rapidly, location
and relocation became an important issue, from the point of view of
both the rapidly expanding individual firms and the regional distribu-
tion of industries.
In the late 1960s continuous industrialization started to create
various problems associated with industrialization, namely, rapid
urbanization, congestion, pollution, shortage of infrastructure facili-
ties, and the need for development of industrial sites. Thus, the spatial
distribution of industries in Korea emerged as a national issue in the
l a-t 1960s.
For the discussion of the pattern and stage of industrial development,
-5-
we follow the framewark suggested by Chenery and Taylor 3/. They
classified industries according to the stage of development as 'early
industries', 'middle industries', and 'late industries', Early indus-
tries are those producing foods, textile, wood products and leather
goods with income elasticities of demand of usually 1.0 or less and
which provided the essential demands of developing countries at an
earlier stage of development. M4iddle industries are those producing
rubber products, nonmetallic minerals, and chemicals and petroleum
refining. Finished products of these industries usually have income
elasticities of 1.2 - 1.5.
Their share of gross national product increases rapidly until
income reaches about $400-$500 (1976 prices), but relatively little
thereafter. Late industries are clothing, printing and publishing,
basic metals, paper and paper products, and metal products, which
have high income elasticities and continue to grow faster than GNP up
to the highest GNP levels,
In Korea the period 1963-73 appears to be the stage of early
industries. During this period early industries such as textiles,
plywood, etc., led the growth of the economy and dominated the pattern
of industrial location. Because p,ywood and other wood products
industries relied on foreign countries for both raw materials and
3 / H.B.Chenery and L. Tayor, "Development Patterns: Among Countriesand Over Time", The Review of Economics and Statistics Vo. A,No. 4 (Nov. 19 68 pp. L09-412
-6-
markets, international ports such as Incheon and Busan played a crucial
role in the location of these industries. Thus, most export-oriented,
and large wood products companies during this period were located in
either Busan or Incheon. There is no doubt that for location of
heavy and bulky products such as plywood, transportation plays a dominant
role. However, for the location of light, export-oriented industries
such as textiles, both international ports and large domestic markets
such as Seoul and Busan appear to have played an important role. Such
industries were usually located in the Seoul-Incheon region and the
Busan region. Wood products industries locate very close to ports,
whereas 'textile industries need not locate so close. However, manywood product industries in the 1970's and 1980's manufactured furniture
for domestic markets and tended to locate cl.oser to markets such as
Seoul and Busan.
The period of growth for middle industries such as chemicals in
Korea were the years 1971-1977. Although the year 1972 is the year
officially declared as the starting point for heavy industries, the
rapid growth of heavy industries did not occur until. 1977 when the
so-called Middle-East boom boosted by construction exports necessitated
the rapid development of heavy industries. Thus, the growth of indus-
tries during the years 1972-77 can be said to have been dominated by
middle industries. For the development and location of middle indus-
tries many industrial estates such as the Ulsan and Changweon industrial
complex w.ere created.
- 7 -
Late industries such as machinery and metallic products started
to grow rapidly from 1977 with the rapid growth of the economy and
as the rapid expansion of construction exports to the Middle East
necessitated the rapid developme, ' of various types of constriuction
equipment. The other major factor that promoted the rapid develop-
ment of heavy industries may be the nation's self-reliant defense
policy, which resulted in the industrial development of various
defense equipment and machinery. As the Busan region or the coastal
industrial complex along the south-eastern coast zone was considered
the most favorable industrial location for heavy and defense industries,
the development of those industries may mark the turning-point in the
location and spatial distribution pattern of Korean industries.
Prior to the era of heavy industries, Seoul and the Seoul region
were. the only areas for most Korean firms to locate. However, with
the grc .rth of heavy and defense industries, the south-eastern coastal
region emerged as the second largest industrial area. From these
facts we may find that industrial location in countries, such as Korea,
undergoing a very rapid transformation of economic structure, is greatly
dictated by the changing pattern of industrial structure itself.
So far, we have glanced through the macro-structural change of
Korea's industrialization and its locational adaptation of early, middle
and late industries. In summary, the Seoul region and the south-eastern
coastal region have been the locational embryos of Korea's industrial
development. Especially, the Seoul region has experienced a drastic
-8-
structural and spatial change and is still very much in the process
of change. Thus, as part of the on-going World Bank-SNU study on
the Seoul region -his paper is devoted to the descriptive ananlysis
of changing pattern of industrial composition and location in the
Seoul region.
2. Locational Changes of Manufacturing Industries in the Seoul Region
A. Seoul versus Gnyeonggl
According to the 1981 manufacturing survey, about 45 percent of
2.1 million Korean manufacturing workers were located in the Seoul
region. The share of manufacturing employment in Seoul in 1981 was
21.2 percent while 23.8 percent worked its peripheral reqion, Gyeonggi
province, as shown in Table 1. In 1973 the same figures were 33.7
percent and 14.1 percent respectively. The national share of manufac-
turing employment in Seoul has therefore substantially decreased since
1973. Gyeonggi province shows the opposite pattern. The annual
growth rates of manufactuirng employment between 1973-1981 ,.were 0.7
percent for Seoul and 14.0 percent for Gyeonggi provincei/
I For more detailed analysis, see Donq-Hoon Chun and K.S. Lee. ChanginLocation Patternts of Population and 7F-Hployrnent in the Seoul LeionWSUDP, Th_e Wo_rld aank, Discussion Paper No DD 5
Table 1. Changes in Manufacturing Employment in the Seoul Region, 1973-1981.
Korea Total 1,216,389 100.0 2,150,971 100.0 2,044,269 100.0 6.7
X % of SMR Total, xx % of Korea TotalData Source: Economic Planning Board. NBS, Mining and Manufacturing Surveys, 1973, 1978, and 1981.SlR- Seoul Mletropolitan Region, i.e., Seoul and Gyeonggi
- 10
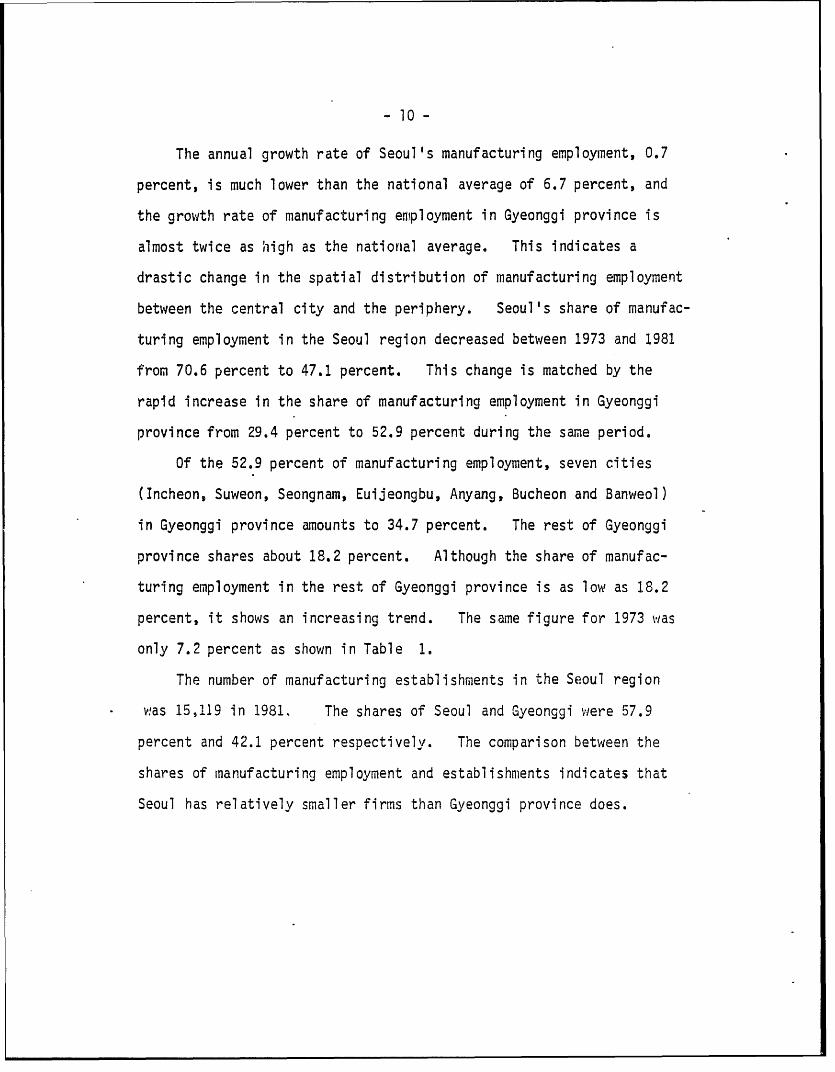
The annual growth rate of Seoul's manufacturing employment, 0.7
percent, is much lower than the national average of 6.7 percent, and
the growth rate of manufacturing employment in Gyeonggi province is
almost twice as hiigh as the national average. This indicates a
drastic change in the spatial distribution of manufacturing employment
between the central city and the periphery. Seoul's share of manufac-
turing employment in the Seoul region decreased between 1973 and 1981
from 70.6 percent to 47.1 percent. This change is matched by the
rapid increase in the share of manufacturing employment in Gyeonggi
province from 29.4 percent to 52.9 percent during the same period.
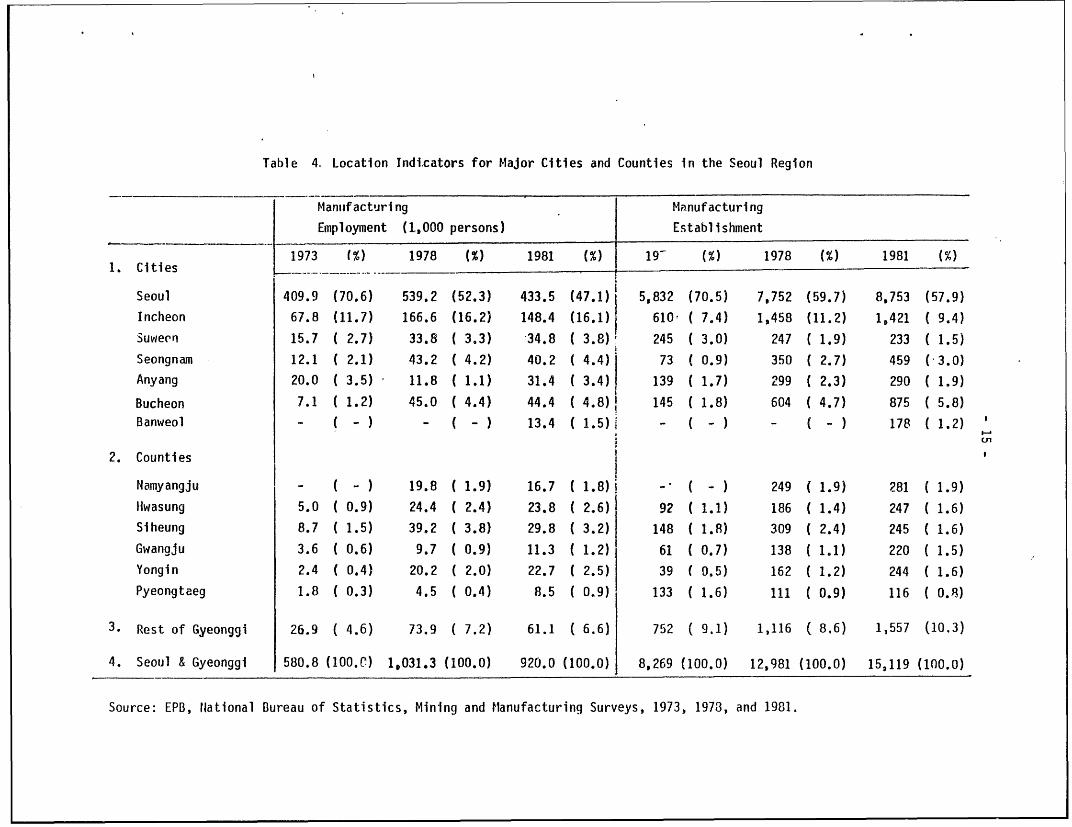
Of the 52.9 percent of manufacturing employment, seven cities
(Incheon, Suweon, Seongnam, Euijeongbu, Anyang, Bucheon and Banweol)
in Gyeonggi province amounts to 34.7 percent. The rest of Gyeonggi
province shares about 18.2 percent. Although the share of manufac-
turing employment in the rest of Gyeonggi province is as low as 18.2
percent, it shows an increasing trend. The same figure for 1973 was
only 7.2 percent as shown in Table 1.
The number of manufacturing establishments in the Seoul region
* was 15,119 in 1981. The shares of Seoul and Gyeonggi were 57.9
percent and 42.1 percent respectively. The comparison between the
shares of manufacturing employment and establishnients indicates that
Seoul has relatively smaller firms than Gyeonggi province does.
Table 2. Changes in Number of Establishments in the Seoul Region, 1973-1981.
SIIR-Seoul Mletrooolitan Region, i e. Seoul and Geyonggi* % of SMR Total, ** % of Korea fotalCource: Econoimic Planniing Board NWBS, Mininq and Manufacturing Surveys, 1973, 1978, and 1981.
- 12 -
The size of firms in Seoul and Gyeonggi were about the same in 1973,
but became substantially different in 1981. This may indicate that
larger firms moved from Seoul to Gyeonggi province while small firms
conti nue doi ng busi ness i n Seoul .
As shown in Table 3, the types of manufacturing industries located
in the Seoul region as of 1981 are (in descending order of share of
employment), textiles and leather (30.1%), fabricated metals (30.0%),
chemicals (9.3%), food beverages and tobacco (7.1%), paper and publish-
ing (6.4%), nonmetallic (4.5%), wood and wood products (3.7%), and
other manufacturing (6.0%). Of these industries, textiles, paper
and publishing, and food and beverages are relatively more concentrated
in Seoul. But the level of concentration is not very substantial.
Industries such as fabricated metals, non-metallic products and metals
are relatively more concentrated in Gyeonggi province than is Seoul.
Two industries, textile and fabricated metal, are the largest employers
accounting close to 60 percent of total manufacturing. This was true
for Seoul, Geonggi as well as Korea as a wJhole. It should be noted
that the relative share of textile increased in Seoul while that of
fabricated metal decl i ned! i ndi cati ng the f abri cated metal i ndustri es
shifted locations from Seoul to Gyeonggi.
B. Southward versus Northward
One special feature of industrial movement in the Seoul region can
be described as the southwards movement. This has been facilitated by
Table 3. Structure of Manufacturing Industries in the Seoul Region
___ ___ 11913 1978 1981
__Seoul Gyeonggi Korea Seoul Gyeonggi Korea Seoul Gyeonggi Korea
* % of row : 1978 and 1981 figures as percent or 1973 base.** % of columnSource: EPB, National Bureau of Statistics, Mining and Manufacturing jurveys, 1973, 1978, and 1981.
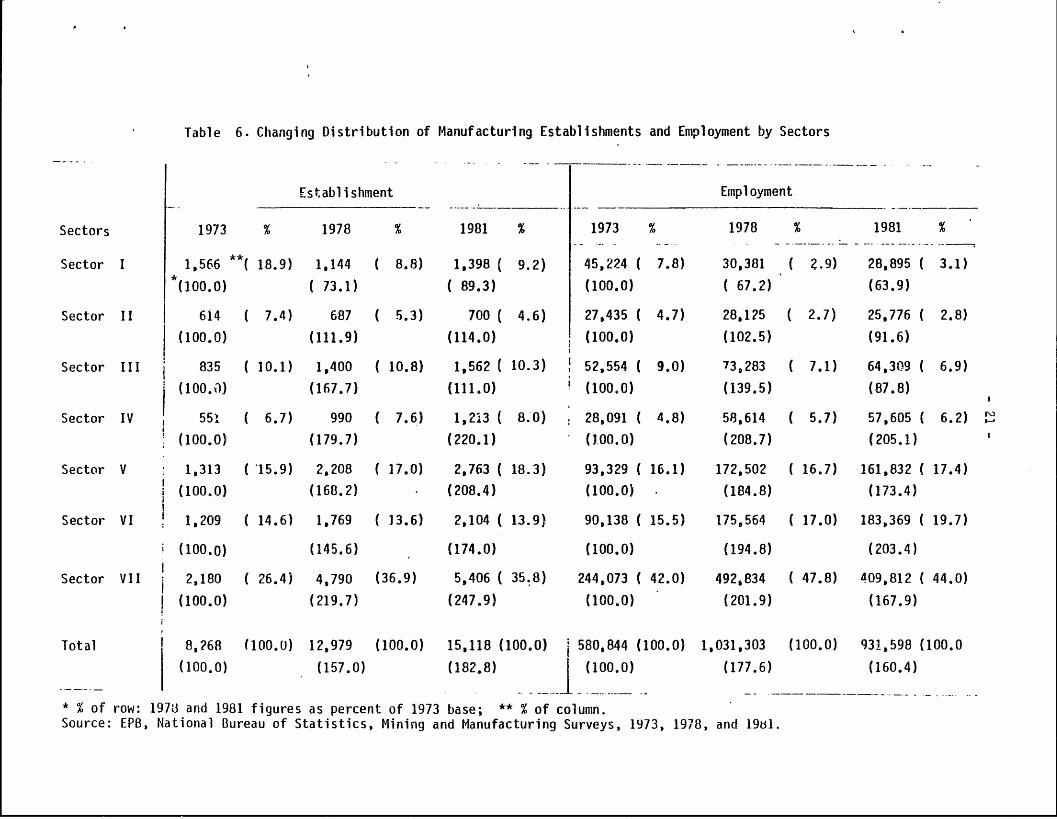
Table 6. Changing Distribution of Manufacturing Establishments and Employment by Sectors
Establishment Emnployment
Sectors 1973 % 1978 % 1981 % 1973 % 1978 % 1981 %
Sector I 1,566 t 18.9) 1,144 ( 8.8) 1,398 ( 9.2) 45,224 ( 7.8) 30,381 ( Z.9) 28,895 ( 3.1)
* % of row: 1978 and 1981 figures as percent of 1973 base; ** % of column.Source: EPB, National Bureau of Statistics, Mining and Manufacturing Surveys, 1973, 1978, and 1981.
- 22 -
locate in Ring IV. Ring I has experienced an absolute loss both in
the number of establishments and employmnent. Employment loss has
been more severe than establishment loss, indicating that small firms
tend to stay in Ring I. Ring II shows a mixed blessing which is
characterized by establishment gain and employment loss. Only Ring V
has experienced most rapid growth in employment, indicating that larger
firms tend to move farther away. On the whold, the evidence shows a
strong decentralization of manufacturing employment in the region.
In search of a new industrial location, directional orientation
seems to play important role i.n the Seoul region, As shown in Table 6,
about 81 percent of total employment is concentrated in south and
south-westerl sub-regions or Sector V, VI and VII. In 1973, their share
of employment was 73.6 percent but had increased to 81.0 percent by 1981.
Several explantions for this trend can be found. First, the
south-western sub-regions or Sector VI and VII were endowed by initially
preferrable conditions such as an existing port, Incheon a well-developed
transportation network, and an urban corridor in which industrialists
could provide agreeable living amenities such as school and mass transit
to their employees. Secondly, government policies discouraged newfirms
to locate in other sub-regions. The location of new firms and/or
even the expansion of existing plants within the northern area of the
Han river were prohibited actually in 1978 by Industrial Location Act.
The northern part of Seoul (Sector II and III) lacks developmental poten-
tial in terms of accessibility and is also a strategic area in the path
- 23 -
of North and South Korea confrontation. Therefore, Sector II and
III experienced absolute or relative decline in the number of employ-
ment although a meager increase in the number of establishment was
shown.
Sector IV is considered to be one of the most attractive locations
having the advantage of plentiful water resources and good accessibility
to railroad and arterial national highways. However, new industrial
location was strongly criticized by environmentalists because the areas
are an up-stream providing the portable water in-take for the 12 million
inhabitants in the Seoul region. The sub-regions in Sector IV were
designated as environmental conservation zones by the Seoul Metropolitan
Region Development Plan of 1981, Location of new firms was thereafter
stri ctly control 1 ed.
Finally, in addition to the initial advantages, locational pressure
for the opening of new plants and the expansion of existing plants led
firms to the southern and south-western sub-regions. Industrial
growth in Sector V3 VI and VII has been partly encouraged by the construc-
tion of the new industrial city, Banweol and the designation of the sub-
regions as a development inducement zone by the Seoul Metropolitan Region
Development Plan. Although major agglomeration diseconomies like the
soaring land price and the scarcity of industrial land begin to appear,
one of the most important reasons for reinforcing industrial growth in
Sector V, VI and VII has been the constrtiction of Seoul-Incheon and
- 24 -
Seoul -Busan Expressways. These regions thus fell within a thirty
minute traveling time from Seoul, becoming in fact a part of the City
of Seoul proper. Recently, the south and south-western areas have
come within the zone of commuting from Seoul due to the opening of two
rapid transit lines since 1974. This will be further discussed in the
following chapters.
D. Government Policies and Plans
Government policies and policy measures could have a significant
impact on the search for a location before industrialists go through
the direct process of choosing the final site of a new plant. Among
many policies and regulatory provisions, the Industrial Location Act
of 1978 by which three industrial zones, dispersal zone, status-quo zone
and inducement zone as shown in Map 4, had special implications for
the explanation of locational changes in the Seoul metropolitan region.
However, a three-year time span was too short a time to draw a
meaningful conclusion about impact on industrial location. Also it is
even more difficult to separate the market driven trend of industrial
spillover towards the periphery from the policy impact zwithout an in-
dept study.
The manufacturing census statistics support that to a certain extent
government policies might have superficially achieved some policy objecti-
ves. As shown in Table 7, the inducement zone has experienced impressive
Map 4. Three Developw~ent Zonies by Industrial Location Act
3141
>~31f
K~ ~31q8 iiI2.
IfIN
LEGEND L
:1112
11156 , - -~STATU S-QUO 11 oc.~(--.ln.
ZONE 3119
.120INDUCEMENT ZONE 1212 3144
1124 3
11245 p1126,
1127
33102 013101 3
3104
Table 7. Changes in the Distribution of Manufacturing
Industry by Three Zones of the Industrial T'cation Act
Development Induce- 353 583 790 10,662 54,141 63,182ment Zone (100.0) (165.2) (223.7) (100.0) (507.8) (592.6)
Source: EPB, National Bureau of Statistics, Mining and Manufacturing Surveys, 1973, 1978, and 1981.
- 31 -
As an industrial move implies deliberate locational decisions,
it is useful to consider some of the factors that influence firms'
locational choice, and to assess the observed trends of the Seoul
metropolitan region. Part III is an attempt to document such
locational factors that might have influenced the observed patterns.
- 32 -
Part III. Spatial Variations in Location Characteristics
1. Classification of Location Characteristics
Industrial movement is not only an outcome of firms' response to
market signals, but also an adaptive process to a variety of governmen-
tal intervention. It is not easy to disaggregate the complexity of
those locational factors into operational concepts for analysis,,
Keeping the purpose of the present study in mind, ie., to observe
certain regularities between industrial movement and location charac-
teristics, we have however introduced two kinds of locational deter-
minants.,
First, central and local governments have intervened to influence
industrial location through a variety of policy measures. Some are
indicative without necessary power for implementation while others are
coersive. Some are promotional while others are punitive. Provisions
for these four types of policy measures are written in a number of
laws: the Industrial Location Act, the Local Industrial Development
Act and the Seoul Metropolitan Region Development Act. 5/ These laws
and their associdted policy directions, plans and programs should have
5/ Sang-Chuel Choe and Byung-Nak Song, An Evaluation of Industrial LocationPolicies for Urban Deconcentration in the Seoul Region, WSUDD, the WorldBank Discussion Paper Report No. UDD-7, 1982, pp. 44-52.
- 33 -
contributed to shaping the locational terrain of manufacturing industry
in the Seoul region. Each sub-region is characterized by a mixed com-
bination of the four types of governmental intervention with different
intensity and policy objectives.
Second, the degree of willingness on the part of industrialists
to move or choose a new site is essential. An array of location fac-
tors can not be exhaustive.. Econonmic theory rc:garding the choice of
manufacturing location is usually based on profit maximization assump-
tion. Although a theoretical inquiry into the economics of industrial
location is beyond the scope of this paper, it is widely held that
empirical implementation of theory is not easy.- The final location
chosen may not nesessarily be the result of a detailed consideration
of a complete set of location factors. One factor may predominate over
all the others, such as the availability of space to move into immedia-
tely. Many other considerations may be so obvious one way or another
that they may be passed over without careful calculation. For many
categories of industry, the choice of location can be footloose and firms
may find indifferent among althernative sites based only on cost considera-
tion.
For analytical purpose, location characteristics can be classified
by the level of spatial aggregation, i.e., area-wide, site-specific, and
privately provided factors. . Although some of the area-wide location
6/ For an example of such a model, see Kyu Sik Lee, "A Mlodel of IntraurbanEmployment Location: An Application to Bogota, Columbia", Journal ofUrban Economics Vol.12 (Nlov. 1982), pp. 263-79.
- 34 -
characteristics tend to be associated with national or local govern-
ment programs, area differences in charges or prices for public services
are quite negligible in a particular region. In this regard, the
location characteristics of a region as a whole may be more important
for the firm if site characteristics are location-invariant. In
other words, area-wide characteristics are a sub-region's aggregate
environment for industrial location, determining the general direction
and the extent of the industrial movement.
Contrary to area-wide factors, site-specific location factors are
generally provided by a single local government and their spillover
effect beyond local jurisdiction is quite negligible. Site-specific
factors usually includes the general category of local services like
public utilities and socio-cultural facilities which are invested and
administrated by a municipal or county government. There is still
another category_of location factors: private services such as
restaurants, hotels, shopping facilities and banking service that
largely remain within the dorimain of, private economic activitCies in terms
of investment and locational choice.
Another useful classification of location factors is whether
they are mobile or immobile. Mobile location factors are defined by
the transportability of such factors as labor Forces, materials and
capital, while immobile ones are featured by their lack of mobility,
for example, land, mines, river, highway, and natural amenities. As
mobile location factors can be transferred from elsewhere in spite of
- 35 -
transport costs involved, immobile ones are taken to be more crucial
for the final selection of plant location for many industries.
There is yet another type of classification of location factors;
the distinction between person-oriented factors and firm-oriented factors.
Person-oriented factors are housing, educational institutions, drinking
water, shopping facilities and so on. Firm-oriented factors include
industrial building sites, industrial water, port, and industrial land.
This distinction is menaingful for understanding the locational behavior
of manufacturing industries. A firm is not an abstract entity of
buildings and machinery but composed o'f employees and their families
whether they are managerial or menial workers. Beyond meeting the
locational requirements for a firm., locational attractiveness on the
part of employees should not be underestimated.
In the Seoul region, industrialists may easily find the labor force
which they need, although higher wages or some other costs such as a
commuting-bus service and housing allowance are involved to recruit
workers from the central city where they used to live. Except for a
small number of managerial workers and qualified technicians, many
workers are ready to trade-off living ainenities for a job opportunity
away from Seoul. In this respect, the theory of "people-to-job" may be
better supported than that of "job-to-people" in the analysis of employment-
residential location nexus. Locational dynamics between firm-oriented
and person-oriented locational factors are to be given special attention.
Even if the difficulty of identifying location factors according to
- 36
an analytical typoloqi can be overcome, the key issue is how to measure
tl,cse factors. Various locational characteristics and their
measuremleiii are so varied that the evaluation of locational attrac-
tiveness does not always allow for a uniform scale of measurements.
Locational advantages and disadvantages of a sub-region are quite often
impossible to evaluate in precise quantitative terms.
Four types of measurements can be considered although they are
not easily comparable in quantitative terms. They are availability,
quantity, quality, and cost. In order to highlight locational aspects,
the availability of a certain type of services can be translated into
accessibility of such services. Accessibility then can be roughly
measured by relative distance,given that the source of such a service
already exists. For example, an express highway is hardly expected to
go through the very plant site, but it is, in most cases, accessible
through a highway interchange. In this case, the availability of an
express highway can be m4.iasured by distance from the interchange to
the plant. On the other hand, in the case of an advanced tele-communi-
cation network the actual availability of service and charge are more
relevant than the distance. Likewise, other location factors can be
measured differently.
Favorable and unfavorable location factors are not always additive.
A combination of unfavorable factors may- have a cumulative discounting
effect, even through each factor by itself would be of minor consequence.
In reality, subjective feelings among industrialists with limited
- 37 -
information about locational attractiveness quite often dictates
location decisions. Furthermore, the information necessary for
measuring locational attractiveness is seldom available and the
sub-region is too large to evaluate with a single quantitative or
qualitative measurement. For example the accessibility of a county
or a municipality government office may greatly differ from one place
to another within the same jurisdiction.
Given these analytical difficulties, the typologies of location
factors and a unit of measurement are introduced in-Table 9.
Table 9. Typology and Measurements of Location Characteristics
Typol ogy Measurements
Public/Private Spatial Location Availability Quantity Quality CostPu l c Pr v t Aggregation Factors _ _ _ _ _ _ _ _ _ _ _ _ _ _ _ _ _ _ _ _ _ _ _ _
Public and etc. length maintenancecapacity frequencyServices Site-specific Local street, Local bus service, accessibility acreage comfort tollnumber of reliability fareDrinking water, Sewerage availability students purity chargefactors treatment, Garbage collection, affordability buses prestige taxPublic housing, Middle and high dwel coverage prci school, Industrial Land, units cosene tuitioSocial welfare facilities, units closeness tuitionI Cultural facilities, banks variety
Fire and police station, facilities sophisticationPost office etc. enst.tutions etc.4 - -etc.
Private I Shopping facilities, Recreationand aniusenient, Medical facilities
Services I Private housing, Banking service,etc.
- 39 -
2. Some Quantitative Measurements and Appraisal of Locational
Factors
Considering the above typology and measures, the data on the mmajor
locational characteristics have been complied for sub-areas from existing
statistics and field surveys. Profil es of locational characteristics
for each sub-area are summarized in the Appendix.
As observed in the preceding discussion, the trend toward decentrali-
zation of manufacturing activity from the central city to periphery in
the Seoul region has been underway. One of the most widely known
premises explaining the phenomenon is push-pull theory. 7 It is
quite clear that push and pull factors have an impact upon the movement
of manufacturing establishments although the push versus pull controversy
is difficult to differentiate.
Among the factors which constitute the push that forces manufacturing
activity to move out into periphery must be included in the following
the soaring land price of the central city, the difficulty of securing
land properly zoned for industrial use which is tightened by the increasing
awaremess of environmental protection, and various governmental actions
toward dispersing manufacturing employment from Seoul.
7/ Benjamin Chinitz, "City and Suburb," in B. Chinitz ed., City and Suburb;Economics of Metrooolitan Growth, Prentice Hall, 1964, pp. 5-6,and James Heilbrun, Urban Economics and Public Po New York;St. Martin's Press, 1981, pP.37-51.
- 40 -
On the other hand, there are many pull factors lying behind the
trend. The main cause of dispersing manufacturing activity has
unquesticnably been the development of new modes of transportation.
In the days when rail and waterways were the most efficient means of
moving both people and goods from one place to another, it was not
only natural but essential for manufacturing activity to cluster at
the nodal points of these transport systems. With the advent of auto-
mobile and truck and the development of an increasingly wide-spread
network of highways, the situation has been changing rapidly.
Freed from their dependence on fixed line of transportation, manufac-
turers are able to consider other factors in choosing locations, and
in many cases these other considerations lead them out of the central
city into non-central. city parts of a metropolitan region. Other pull
factor attracting manufacturing employment into the peripheral areas
of the Seoul metropolitan region is a steady rise of living amenities
of the non-central city parts as compared to the central city, although
it is undeniable that an absolute gap between the center and the periphery
still exists. However, the introduction of rapid transit network and the
integrated development of public utilities covering the entire metro-
politan region like water supply and teleghone system has made less
difference in one place to another in the Seoul region.
In this background, four location factors among many factors in the
analytical typology are highlighted in the following discussion.
- 41 -
A) Transportation
The largest impetus of outward industrial movement may have
resulted from improved accessibility through the construction of
express highways and the alignment and pavement of existing highways.
Roughly 80 percent of the relocations have taken place in the sub-
regions along the main route toward the south and south-west which is
served by the Seoul-Busan and Seoul-Incheon express highways. Among
many modes of transportation, access to a highway or an express highway
has apparently played the most important determinant for industrial
location. As shown in Table 10, and Map 6, about 60 percent of the
industrial establishment and 72 percent of employment was located in
a corridor within 20 minutes of the two express highways according to
the 1981 statistics. But it should be noted that the proportions of
both establishments and employment located in the less than 10 minutes
area declined during 1918-1981, indicating further dispersion of industries
from the highway network. Time-distance from Seoul by railroad is shown
in Map 7. In a small country like Korea, the distance of railroad
transportation tends to be less attractive except for single-and-bulky
commodities such as coal and cement. As industries in the Seoul region
are characterized by using raw materials of various origins and multiple
product destinations, they are less dependent on rail transportation.
Another transportation factor in relation to industrial location is
journey-to-work. As shown in Table 11 about 40% of the manufacturing
TablelO. Changes in the Distribution of Manufacturing Industry by Accessibility to Express Highway
waiting times and frequent interruptions. But this problem has been
gradually resolved by the completion of the integrated direct dialing
system covering the Seoul region.
0) Urban Services
The urban services that have the greatest effects on industrial
location appear to be those related to Hirschman's social overhead
capital, - namely, those related to transportation, communication,
electricity and water which have been discussed in the preceding section.
While these transportation and public utilities have a direct
impact oh industrial location, other urban services that have had an
indirect impact on industrial location in Korea appear to be housing,
educational and medical services. According to the Urban Household
Survey of 1983 compiled by the National Bureau of Statistics,- the
importance of those urban services are ranked as housing, education,
and medical services in terms of household expenditure. Urban services
related to housing, education and medical services which fall into the
category of urban economies have direct impacts upon the location of
workers and entrepreneurs and, thereby, influence the location of indus-
tries. As Koreans place great importance on housing and education,
8/ See Albert 0. Hirschman, The Strategy of Economic Development, YaleUniversity Press, 1958.
M/ National Bureau of Statistics/Economic Planning Board, Annual Reon the Family Income and Expenditure Survy, 1983.
- 54 -
these two services become important determinats of the location of
employees as well as employers.
It has been attempted-to quantify various urban services, both
public and private, by sub-regions in the Seoul region as shown in
the Appendix. The major problem in quantifing urban services apper
to be the measurement of quality of urban services. The comparison
indicates that large cities in the Seoul region, namely, Seoul, Incheon,
and Seongnam have better urban services than other localities. This
coincides with Professor Mills' findings that urban services are better
in larger cities in developing countries.10/
Housing problem is generally more severe in the cities and highly
urbanized counties like Sihueng and Namyangju. Beyond the sheerhousing
shortage in the number of dwelling units, the price of housing and
rent is also much higher in those sub-areas comparab,le to the degree of
differences in land price as shown in Map 10 . Highest land price for
housing is more than 2 million won per pyeong in Jonglo and Jung-ku,
Seoul's CBD. Residential land with the price of below 300 thousand won
per pyeong is not available in Seoul, resulting in the consequent rise
of housing price.
Althouqh how housing affordability and price act on industrial
location is not well known in the Seoul region, housing itself as an
industrial location factor can hardly be meaningful without concomittant
consideration of accessibility to educational facilities for Koreans who
place much higher priority on education than housing.
10/ See Edwin S. Mills, 'Government Procrams- to Control Sizes ofLarge Cities, "Paper Presented at Conference on Urbanization and NationalDevelopment, East-West Center, Honolulu, Hawaii, January 25-29, 1982.
Better educational institutions in terms of academic attainment
are largely concentrated in the large cities like Seoul, Suweon and
Anyang. This means that the two urban services i.e., housing and
education are in direct conflicts in that better education is available
where housing is more scarce. Therefore, their locational impacts
tend to offset each other. The trade-off between the two, however,
usually favors education.
- 57 -
Part IV. Summary of Findings and Concluding Remarks
This paper was intended to summarize the aggregate patterns
of industrial distribution and to identify important locational factors
contributing to the explanation of changing distribution of industries
in the Seoul region. It is also hoped to draw some hypothetical postula-
tions for further analysis in the research project.
1. Intrametropolitan Movement
The first census enumeration of industrial movement conducted by the
National Bureau of Statistics in 198111/ has shown how influential
industrial movement has become in altering the spatial distribution of
manufacturing industries. About 16 percent or 5,313 firms out of 33,431
firms in Korea experienced locational changes. However, the locational
change was highlyconcentrated within the three metropolitan regions of
Seoul, Busan, and Taegu, where 79 percent of industrial movement took
place as shown in Table 14
This means that interregional or long-distance industrial movement was
a phenomenon of relatively little significance. Nearly 80 percent of
industrial movement had been featured by intra-metropolitan or short-distance
industrial movement in Korea. 12/ Of 5,313 firms which had relocated by 1981,
2,865 firms or 54 percent moved within the Seoul region. The Seoul region
accounts for more than two thirds of industrial -mi-graticn within thle three
metropolit.an regi ons.
11/ Conducted by the National Bureau of Statistics as part of the IBRD-SNUIndustrial Location Policies Research Project (IBRD RPO 0672-91)
12/, See, K.S.Lee (1985) fo. more detailed analysis of the nianUfacturingCensus data.
Table 14. Industrial Movements in Three Metropolitan Regions
No. of Relocated Firms Percent
Nation Total 5,313 100.0Three Metropolitan Regions 4,198 79.0 100.0
Seoul Region 2,865 53.9 658,2Pusan Region 831 15.6 19.8Taegu Region 502 9.5 12.0
Other Regions 1,115 31.0
Unfortunately, very little has been known about intra-metropolitan
industrial location in Korea. For the formulation and effective imple-
mentation of industrial location policies and programs more attention
should be given to intra-metropolitan industrial movetment and the conse-
qennces of industrial location policies in the Seoul region.
Changing location patterns of manufa.cturing industries in the Seoul
region have been characterized by the strong trend of decentralization
from center to periphery and from the niorth to the south. Given this
general flow in the Seoul region as a whole, the industrial locations of
newly created anid relocated firms have selectively taken place in some
localities of seven cities (Iricheon, Bucheon, Songnam, Anyang, Suweon,
Euijeongbu and Banweol) and six counties (Siheung, Hwasung, Yongin,
Namyangju, Gwangju and Pyeongtag) which are bordered either by the City of
Seoul or are easily accessible by expressways and/or rapid transit system.
2. Push and Pull
in relation to industrial location in the Seoul region, two kinds of
conditions are reinforcing the trend toward decentralization. The first
- 59 -
can be called the 'push factors' which are largely determinied by the
conditions at the place of origin. They may include a prohibitive
land price for on-site expansion, difficulties of obtaining land in
terms of space and proper zoning, outmoded plant and equipment at the
old city locations, reinforced environmental control and legal enforce-
ment of non-conforming uses. 'Push factors' can be classified into
two kinds; nattjral market forces and governinental regulatory measures.
For example, the former is the termination of tenure for an industrial
premise and the latter is a mandatory order to relocate the plant by
reason of being a public nuisance.
The second category consists of the so-called 'pull factors' which
are conditioned by the attractiveness of the place of destination. An
outlying area may offer relatively cheap land properly developed for
industrial use. Technological advances in transportion and communication
lessen the need for close proximity to markets. Changes in production
technology, which demand a predominantly horizontal layout often of
special design, tend to move industrial establishmens from congested
inner-city locations to the spacious metropolital fringe. Governmental
policies coincide with the trend of industrial dispersal and quite often
reinforce it by means of various kinds of incentives such as a relocation
subsidy, preferential loans, the designation of an inducement zone and
the development of a new industrial city to accomodate relocated plants.
Push and pull factors do not work independently but are reinforcing.
In reality, the identification of locational advantages and disadvantages
is not only a complex problem but also involves a considerable degree of
- 60 -
uncertainty with limited information about locational characteristics.
The final locational choice is usually made upon a consideration of
both push and pull factors.
3. Step-wise Decision of Industrial Location
The choice of location by a firm is usually made in two steps. A
firm may first choose a region for its new plant or branch and then select
a site within that region.13/ As discussed earlier, location factors are
considered first for area-wide characteristics and second for
site-specific characteristics. Area-wide characteristics determine the
general preference toward direction or distance of movement based on an
overall evaluation of a region, while site-specific characteristics tend
to influence the selection of a site to locate a plant.
In terms of area-wide characteristics, the Seoul region has been the
most attractive region in Korea since the region can enjoy the externali-
ties which Seoul with a population of ten millions may offer. The best
banking services, medical facilit:ies, higher educational institutions and
cultural facilities are readily available within thirty minutes traveling
distance to Seoul. Therefore, the consideration of the site-specific
factors has become less critical as long as the site is within the metro-
politan shadow of Seoul. Locational deficiencies caused by the lack of
site-specific factors could have been simply tolerated at the cost of
inconveniences and might have not led to locational disqualification.
However, the availability of industrial land and water and an easy access
13/ D.J. Spooner, "Industrial Movement and Rural Periphery: The Case ofDevon and Cornwall, "Regional Studies, Vol. 6, 1972, p. 2C6.
- 61 -
to major transportation network are assumed to be of critical importance
in choosing the final site of the plant in the Seoul region. This
hypothesis has been supported by the establishment survey results (Lee
and Choe, 1985).
4. Push Factors - Land Constraints
The rapidly rising price of land in Seoul would have played as a
strong push factor. The limIted availability of industrial land properly
zoned for industrial use has also played an important role in the location
of new firms and the relocation of especially large firms. This may be
partly supported by the fact that the size of plants located on the
periphery of Seoul is larger than those located in the central part of
Seoul and that the size of plants located in Gyeonggi province is larger
than those located in Seoul. As shown in Table 15 , the average size
of employemnt per firm increase from 20.7 in Ring I to 81.6 in Ring IV
in 1981. Firm size in terms of employment in Ring I, II and III, which
constitute the boundary of the City of Seoul has consistently become
smaller from 1973 to 1981, while firm size in Rinq IV and V Tends to increase.
Table 15. Average Firm Size by Rings
(Unit: Persons)
Rings 1973 | 1978 1981
Ring I 28.9 26.6 20.7Ring II 58.2 54.3 43.5Ring III 136.8 j 102.8 64.8Ring IV 84.9 100.0 81.6Ring V i 25.6 68.4 65. 0Total 70.2 J 79.5 61.6
- 62 -
5. Pull Factors - Improved Accessibility
The most important pull factor for changing industrial location patternsin the Seoul region seems to be improved accessibility to Seoul. Industrialsites, whicfi are moqst accessible to both the largest domestic market in thenation and the source of imported inputs via the port of Incheon, are thoselocated along the Seoul-Incheon corridor which is merging into a megalopolisby the Seoul-Incheon expressway and the Seoul-Incheon rapid transit line.
The City of Bucheon which is located in the Seoul-Incheon corridoris one of the cities that has grown most rapidly in Korea since 1970's.Bucheon is in sharp contrast with Banweol which was created from by thegovernment to accomodate industries to be relocated from Seoul. Thegrowth of Banweol had been very slow up until the end of 1982. AlthoughBanweol's growth has speeded since then, it has been hardly comparable tothe growth of other cities close to Seoul like Bucheon and Anyang.
The main development axis of Seoul is characterized to a large extentby the 'east-west transport route' connecting Yeongdeungpogu-Mapogu- Jongloguand Junggu-Dongdaemungu. As this transport route is extended to the
Seoul-Incheon corridor, the whole of the Seoul region's accessibility isaffected substantially by this east-west corridor. In addition to theeast-west corridor, the north--south corridor connecting Seoul-Anyang-Suweonis shaping the spatial distr 4bution of the Seoul region. These two corri-
-dors provide industrial location which are easily accessible to Seoul byexpressways and rapid transit system.
- 63 -
The influence of the transportation factor has been significant.
Its strength in Korea may be at least as great as that found in the
metropolitan areas of advanced countries. This may be due to the
fact that the major improvement of transportation in Korea in the 19lOs
has been spatially confined within the Seoul region. Thus, most of the
decentralized industries tend to locate in areas close to Seoul and
a few large cities.
6. Locational Differences by Industries and Size
Industrial mobility may differ among industries. In other words,
certain industries are more mobile than others. As shown in Table 16 ,
fabricated metal, machinery, and equipment industries are distinguished
by the highest mobility rate of 24.4 percent as compared with 15.9 percent
for the sector as a whole. The textile, apparel,, and leather industries
appears to be relatively immobile with a 13.2 percent. Reasons for the
high mobility of the fabricated metal industry may be explained from
that this industry is a rapidly growing sector and a need to relocate for
expansion. The low rate of relocation for the textile, apparel, and
leather industry can be explained by the fact that the industry is highly
depedent on external economies which the central city location provides.
Locational pressue to move for expansion depends not only on locational
conditions but also on the business prospects of individual industries.
Prospects for the textile, apparel, and leather industries has, in the
recent past, become less bright, and potential movers have some reservations
about taking the great risks associated with relocation, while fabricated
- 64 -
Table 16. Number of Relocated Establishments by Industries
No. of (A) No. of Relocated (B)1 B/A (%)Establ ishments Establishmentsw - I
Manufacturing Total 33,431 5,313 (100.0) 15.9
Food, Beverage & 4,261 303 ( 5.7) 7.1Tobacco
Textile, Wearing Apparel 8,488 1,120 C 21.1) 13.2and Leather
Wood, Wood Products 2,294 245 ( 4.6) 10.7
Paper, Paper Products 2,587 534 ( 10.1) 20.6Printing & Publushing
Non-metallic Mineral 2,626 251 C 4.7) 9.6Products I
Basic Metal 981 177 ( 3.3) 18.0
Fabricated Metal 7,433 1,811 ( 34.1) 24.4
Other Manufacturing 1,210 251 (4.7) 20.7
Source: National Bureau of Statistics, Economic Planning Board,
Mining and Manufactiurina Survey, 1981.
65 -
metal, machinery,and equipment industries are preparing for a boom period
ahead and therefore looking for new locations.
As generally known in the 'incubator hypothesis', industrial mobility
may be different by firm size (Lee, 1985). The locational choice for larqe firms
appears to be different from that of s,mall firms in Korea. The locations
of key industries such as petro-chemical, ship-building and steel industries
have been made at the national level. Those industries which are usually
more export-oriented' tend to choose locations closer to international ports
for the transportation of both materials and products. Seoul's share
of those industries has declined with the rise in the size of Seoul.
This is already supported by Henderson's observation that the share of
resource-bound manufacturing appears to decline with city size and also
that footloose activity, relative to resource-bound activity tends to
cluster in a large metropolis. 14/
Small firms tend to reduce the risk associated with their relocation
by remaining in their old location or by a short-distance move from a
metropolis. Uncertainties of various types will be less in areas with
conglomerations, through the greater availability of private, public and
visual information, the wide array of external economies, and proximity
to competitors and business establishments in general. 1 -5/
This general observation has been substantiated by the establishment
survey in this project (Lee and Choe, 1985). The direction of movement
from the congested central city location to surrounding metropolitan fringe
14/ J.V. Henderson, "Industrial Bases and City Sizes," American EconomicReview, May 1983, p. 167.
15/ A. Pred, Behaviour and Location: Foundations for a Geographic andDynamic Location Th land Studies in'Geography SeriesB, 1967, p. 27.
- 66 -
is consistent for both small and large firms. Although technologicaladvances in transportation and communication lessen the need for closeproximity to markets, suppliers and business services, it is still truefor small-arid-medium size industries, which seek to minimize the riskinvolved in a locational decision, thereby clustering around the areaswhich are not too far from and not too close to the city center.
7. Urban Services and Industrial Location
Of various urban services that influence industrial location in theSeoul region, educational services, especially those related to primaryeducation seem to have strong implications. This may be explained bythe following two factors. One is that Koreans put great emphasis onthe education of their children requiring primary education. As youngchildern may not commute long distance, primary education must be providedclose to where workers live. The second is the fact that because mostlocalities in the Seoul region are within arelatively short travel dis-tance, people heavily rely on Seoul, Incheon, or other big cities in theregion for other urban services such as medical treatment and entertain-ment. Thus, educational services for workers' childern appear to be thedominant factor influencing employment location in Korea in general.
Public services such as electricity, industrial water, communication,and many site-specific services have to be provided as part of a servicepackage. Provision of any of these services in isolation tends to lessenthe policy of effectiveness especially in the case of planned industrial
- 67 -
relocation as exemplified by the case of Banweol. Our analysis of the
relationship between industrial location and urban services in the Seoul
region indicates that large cities and localities close to large cities
tend to have better urban services and to attract more manufacturing
i ndustri es.
Decentralization of employee's residential location does not seem to
follow industrial decentralization immediately. Because of poor public
services in fringe areas, the time lag between industrial decentralization
and residential decentralization is substantial. As distance from major
industrial locations to Seoul is relatively short by improved accessibility,
many employees working for the relocated or newly established firms tend
to choose commuting from Seoul instead of moving with the firms.
One of the important reasons appears to be that employees may not.
always be able to minimize journey-to-work distance and tend to tolerate
inconveniences and costs entailed by commuting from home to workplace for
the externalities like better school and other living amenities that Seoul
provide. Another reason is that more than 90 percent of the employees
relies on public transportation. The fare is generally uniform and
distance variation is quite negligible.
For movement of workers and their families to take place, the price
and availability of housing should not also be ruled out. As Hamilton
pointed out, a household may trade off longer distance from a decentralized
work-place for lower price of housing in peripheral areas.16/ However,
16/ Bruce W. Hamilton, Wasteful Commuting, The Johns Hopkins University,November 1981, p. 3a pT7 mimelY
- 68 -
the availability of cheap housing alone seems to make little impact onindustrial location in the absense of necessary services at the relocatedsite. In other words, the low price of housing would not be attractiveenough to change the residential locations of employees unless other urbanservices, especially educational services, are provided. Moreover, housingmeans more than the provision of shelter; it is the object of real estatespeculation in Korea. This means that the expected increase of housingprice quite often dictates residential location. This was especiallytrue in the period of rapid inflation.
8. Further Studies
It has been attempted to find associations between changes inlocation characteris-tics and the changing patterns of industrial move-
ment in and around a large metropolis of Seoul. These findings shouldprovide some implications for understanding the location behavior ofindustrial establishments and for what industrial location policies canbe expected to accomplish.
However, this paper is limited to an acareqate analysis that hardlytouches on the complexity of industrial location problems at the micro-level
of individual firms. Industrial establishments can be stratified by firmtypes (newly created firms, firms stayed at the same location, and
relocated firms), firm size (large, medium, and small) and industries,
in order to identify closely which factors are contributing to locational
- 69
changes. Understanding the firms' location behavior at much
disaggregated levels should provide better analytical bases for
taking policy initiatives. Such analyses, both theoretical and
empirical, have been conducted in this research project and
presented in other project papers.
- 70 -
APPENDIX:
LOCATION ATTRIBUTES OF SUBAREAS BY 4-DIGIT GEOCODE
Social Welfare Facilities
Recreation Facilities
Drinking Water Supply
Industrial Water Supply
Per Capita Finance
Percent of Capital Investment
Sewerage Treatment
Garbage Disposal
Housing
Fire Prevention Services
Police Services
Universities
Junior Colleges
Educational Facilities
Cultural Facil ities
Urban Street
Mass Transportation
Telecommunication Services
Banking Services
Market and Commercial Services
- 71 -
Social Welfare Facilities ! Recreational Facilities
Nursery, Employment No. of No. ofI Information Game Centers Movie Theatres_ Center
Bade, Frang-Josef, "Locational Behaviour and the Mobility of Firms inWest Germany," Urban Studies, Vol. 20, pp. 279-297, 1983.
Banweol Government Office, Status of Construction of the IndustrialCity of Banweol, 1982.
Brown, "Changes in Workplace and Residential Locations," AmericanInstitute of Planners Journal, Jan. 1975.
Chenery, Hollis B. and Lance Taylor "Development Patterns: AmongCountries and Over Time," The Review of Economics andStatistics, Vol. L, No. 4 (Nov. 1968).
Choe, Sang-Chuel, Methodological Evolution and Issues of RegionalDevelopment Planning in Korea, "Journal of EnvironmentalStudies, Vol. 3, No. 1, 1976.
_ "The Determinants of Redistribution of ManufacturingActivities in Korea," Korean Journal of Public Administration,Vol. 9, No. 2, 1971.
Choe, Sang-Chuel and Byung-Nak Song, "An Evaluation of IndustrialLocation Policies for Urban Deconcentration in SeoulRegion," UDD Paper No. 7, The World Bank, August 1982.
Collins L. and D.F. Walker ed, Locational Dynamics of ManufacturingActivity, John Wiley & Sons, 1975.
Doebels, William A. and Myong Chan Hwang, "Land Policies in theRepublic of Korea-With Special Reference to DecentralizedDevelopment," World Bank Urban and Regional ReportNo. 79-4, August 1979.
Downs, Anthony, "Developing A National Urban Policy for Korea,"Korea Development Institute Consultant Report,October 1978.
Economic Planning Board, The Republic of Korea Population andHousing Census, Various Years, Seoul.
9 Fifth Five-Year Economic and Social Development Plan,1982-1986, Seoul, 1981.
The National Land and Industrial Sector Plan for theFifth Five-Year Plan (1982-1986), Seoul,981.
- 82
Economic Planning Board, Report on Population and Housing Census,1966, 1970, 1975 and 1980, Seoul, 1982.
-,_ Mining and Manufacturing Survey, 1966, 1970, 1978 and 1981.
-,_ Social Indicators in Korea, 1982.
Fuchs, Roland J., "Population Distribution Policies in Asia and thePacific: Current Status arnd Future Prospects," PaperPresented at the East-West Centre Conference on Urbanizationand National Development-, Honolulu, Hawaii, January 25-29,1982.
Gresser, Julian, "Balancing Industrial Development with-EnvironmentalManagement in the Republic of Korea," World Bank Urban andRegional Report No. 79-3, August 1979.
Gudgin, Grahan, Industrial Location Precesses and Regional EmploymentGrowth, Saxon House 1979.
Gyeong-gi do (Provincial Government), Gyeong-gi Statistical Yearbook,1982.
Isard, Walter, Location and Space-Economy, Cambridge, Mass:The M.I.T. Press, 1956.
Hansen, Miles, "The Role of Small and Intermediate-Size Cities inNational Development Processes and Strategies," PaperPresented at the U.N. Centre for Regional DevelopmentSeminar on the Role of Small and Intermediate SizeCities in National Development, 26 January - 1 February1982, Nagoya, Japan.
Hekman, Johns, "An Analysis of the Changing Location of Irori andSteel Production in Twentieth Century," American EconomicReview, Vol. 68, No. 1, March 1978.
Henderson, J. Vernon, "Industrial Bases and City Sizes," AmericanEconomic Review, May 1983.
Hanushek, Eric. A. and Byung-Nak Song, "The Dynamics of PostwarIndustrial Location, Review of Economics and Statistics,1978.
Honjo, Masahiko, Metropolitan Problems in Post-Industrial Societies;The Case of Japan," U.N. Center for Regional DevelopmentWorking Paper WP: 79-12, October 1980.
Hwang, Myong-Chan, "Growth and Management of Seoul MetropolitanRegion," Paper Presented at the East-West Centre Conferenceon Urbanization and National Development, Hcnolulu, Hawaii,January 25-29, 1982.
- 83 -
Keeble, Industrial Location and Planning in the United Kingdom,Methuen, 1976.
Klassen, Leo H. "Relocation of Industry," in Yung-hee Rho andMyong-Chan Hwang ed., Metropolitan Planning: Issues andPolicies, Korea Research Institute for Human Settlement,Seoul, 1979.
Korea Research Institute for Human Settlements. Long-Term Prospectfor Urban Development, 1982-2001, Seoul, 1I98.
. A Study on Overall Urban Policies in Korea, 1981.
_ The Basic Plan for Growtn and Management of the CapitalRegion, 1982-1991 (Preliminary Report), Seoul, 1981
Data for the Basic Plan for the Capital Region, December 1980.
Research on Industrial Location Planning for PopulationDispersion, December 1982.
Long-Term Perspective Plan for National Land DevelopmentToward 2000g May 1983.
Korea Institute for Industrial Development, Research Report for thePreparation of the Basic Plan for Industrial Relocation,Seoul, 1980.
Kwon, Won-Yong, "A Study of the Economic Impact of IndustrialRelocation: The Case of Seoul," Urban Studies, No. 18, 1981.
Lee, Kyu Sik, "Intra-urban Location of Manufacturing Employment inColumbia," Journal of Urban Economics, Vol. 9, 1981, pp.222-41.
"An Evaluation of Decentralization Policies in Light ofChanging Location Patterns of Employment in the Seoul Region,"Report No. UDD-60, Water Supply and Urban DevelopmentDepartment, The World Bank, 1985.
-,_ "Decentralization Trends of Employment Location and SpatialPolicies in LDC Cities," Urban Studies, Vol. 22, 1985.
"A Model of Intra-urban Employment Location: An Applicationto Bogota, Colombia," Journal of Urban Economics, No. 12, 1982.
Lee, Kyu Sik and Sang-Chuel Choe, "Determinants of Locational Choice ofManufacturing Firms in the Seoul Region: An Analysis ofSurvey Results," Report No. UDD-85, Water Supply and UrbanDevelopment Department, The World Bank, 1985.
- 84 -
Lloyd, P.E. and C.M. Mason, "Industrial Movement in North West England:1966-1975," Environment and Planning, Vol. 11, pp. 1367-1385,1979.
Lo, Fu-Chen and Kamal Salih, (eds), Growth Pole Strategy and RegionalDevelopment Policy: Asian Experiences and AlternativeApproaches, New York: Pergamon Press, 1978.
Mason, Colin M. "Intra-Urban Plant Relocation: A Case Stuidy of GreaterManchester," Regional Studies Vol. 14, 1981, pp. 267-283.
Mera, Koichi and Byung-Nak Song, "Spatial Policies for Population inthe Context of Economic Development: The Case of theRepublic of Korea," Paper Presented at the Conferenceon World Regional Development and Planning Held at Universityof Tsukuba, Ibaraki, Japan, August 21-23, 1978.
Meyer, John, R.,"Report on Proposed Korean Spatial Study," The WorldBank Urban and Regional Report No. 81-1, March 1981.
Mills, Edwin S., "Government Programs to Control Sizes of Large Cities,"Paper Presented at Conference on Urbanization and NationalDevelopment, East-West Center, Honolulu, Hawaii,January 25-29, 1982.
-__,__"Procedures for Allocating Land in Korea," Korea DevelopmentInstitute Consultant Paper Series No. 6, June, 1981.
Mills, Edwin S. and Byung-Nak Song, Urbanization and Urban Problems,Harvard University Press, 1979.
Mills, Edwin S. and Charles Becker, "Urbanization, Public Services andIncome Distribution in Developing Countries,'Paper Preparedfor UNCRD Seminar on Urbanization and National DevelopmentNagoya, Japan, October 20-18, 1980.
Ministry of Commerce and Industry, The Republic of Korea, The Basic Planfor Relocation of Industries, Preliminary Report, Seoul, 1982.
Ministry of Construction, The Republic of Korea and Korea ResearchInstitute for Human Settlements, The Second ComprehensiveNational Land Development Plan,1982-1991, Seoul, 1981.
The First Comprehensive National Land Development Plan,1972-1981, Seoul, 1971.
Ministry of Home Affairs, The Republic of Korea, Municipal Yearbookof Korea, 1982.
Murray, Michael P. "Industrial Location and Government Policy: AFramework for Analysis," Draft, April, 1982.
- 85 -
Murray, Michael P. "Here, There, Where? A Strategy for EvaluatingIndustrial Relocation Policies in Korea," UDD Report No. 6,The World Bank, May 1982.
Office of the First Ministry without Portfolio, The Republic of Korea.A Study on the Effects of the Population Relocation Planfor the Capital Region, Seoul, 1980.
_ The Population Redistribution Plan for the Capital Region,1977-1986, 1978.
_ Appraisal of Implemeritation of the Population RedistributionPlan for the Capital Region for the Year 1979, Seoul, 1980.
Owen, Wilfred, "Transport Factors in Korea's Long-range Development,"Korea Development Institute Consultant Report, October 1978.
Renaud, Bertrand, "National Urbanization Policies in Developing Countries,"World Bank Staff Working Paper No. 347, July 1973.
"Regional Policy and Industrial Location in Korea, Universityof Hawaii, 1971.
Richardson, Harry W. "Policies for strengthening Small Cities in DevelopingCountries," Paper Presented at the U.N. Centre for RegionalDevelopment Seminar on the Role of Small and Intermediate SizeCities in National Development, Nagoya, Japan, 26 January -1 February, 1982.
Sal'h, Kamal, et. al., "Decentralization Policy, Growth Pole Approachand Resource Frontier Development: A Synthesis of theResponse in Four Southeast Asian Countries: in Fu-Chen Loand Kamal Salih, ed., Growth Pole Strategy and RegionalDevelopment Policy; Asian Experiences and AlternativeApproaches, New York: Pergamon Press, 1978.
Robinson, J.F.F. and D.J. Storey, "Employment Change in ManufacturingIndustry in Cleveland, 1965-1976," Regional Studies,Vol. 15, No. 3, pp. 161-172, 1981.
Sant, M.E.C., Industrial Movement and Regional Development, PergamonPress, 1975.,
Schmenner, Roger W., "Industrial Location and Urban Public Management,"Arther P. Solomon ed., The Prospective City, MIT Press, 1980.pp. 446-468.
Seoul Metropolitan Government, Seoul Statistical Yearbook, 1982.
- 86 -
Song, Byung-Nak, "The Distribution and Movement of Jobs and Industry:The Case-of the Seoul Metropolitan Region," Korea DevelopmentInstitute Working Paper 7411, Seoul 1974.
"The Production Structure of the Korea Economy: Internationaland Historical Comparisons," Econometrica, January 1977.
"The Role of Small and Intermediate Size Cities in NationalDevelopment: The Korean Case," Paper Presented at the U.N.Centre for Regional Development Seminar on The Role of Smalland Intermediate Size Cities in National Development,26 January - 1 February 1982.
-__ ,_ Regional Policy for Korea's Fifth Five-Year Plan, 1982-1986Paper Presented at the U.N. Center for. Regional DevelopmentSeminar on National Development and Regional Policy,31 October - 4 November 1979.
Song, Byung-Nak and Sang-Chuel Choe, "Review of Urban Trends and Policiesin Korea," World Bank Urban Regional Report No. 81-2, May 1981.
Spooner, D.J., "Industrial Movement, Rural Areas and Regional Policy,"Akademiai Kiado, Budapest, 1976.
_ "Some Qualitative Aspects of Industrial Movement in ProblemRegion in the United Kingdom," Town Planning Review, Vol. 45,No. 1, 1975.
__-_, "Industrial Movement and Rural Periphery: The Case of Devonand Cornwall," Regional Studies, Vol. 6, pp. 197-215, 1972.
Starrett, David A., "On the Method of Taxation and the Provision ofLocal Public Goods," American Economic Review, June 1980.
Struyk, Raymond J., "Housing in Korea's Fifth Five-Year Plan: Possibilitiesand Constraints," Korea Development Institute Consultant PaperSeries No. 5, May 1980, Revised November 1980.
Struyk, Raymond J., "Empirical Foundations for Modeling Urban IndustrialLocation, in L.S. Bourne ed.," Internal Structure of the City,Oxford University Press, 1982, pp. 357-369.
Struyk, Raymond J. and F. James, "Intermetronolitan Industrial Location,"Lexington Books, 1975.
Sweet, Morris L., Industrial Location Policy for Economic Revitalization:National and International -Perspectives, Praeger, 1981.
Tolly, George, "The Welfare Economics of City Bigness," Journal of UrbanEconomics, Vol. 1, 1975, pp. 324-345.
et al., Urban Growth Policy in a Market Economy, Academic Press,1975.
Yeung, Yue-Man and Norton Ginsberg, "Pacific Basin Cities in the Eighties,"Paper Presented at the Pacific Science Association 4thInter-Congress, Held in Singapore, September 1-5, 1981.