We show that societies with a history of irrigation-based agriculture have been less likely
to adopt democracy than societies with a history of rainfed agriculture. Rather than actual
irrigation, the empirical analysis is based on how much irrigation potentially can increase yields.
Irrigation potential is derived from a range of exogenous geographic factors, and reverse causality
is therefore ruled out. Our results hold both at the cross-country level, and at the subnational
level in premodern societies surveyed by ethnographers.
1 Introduction
Since the Enlightenment, no concept has drawn more attention from social scientists and political
philosophers than democracy. It has been said that democracy is the worst form of government
except all those other forms that have been tried from time to time.1 From an economic perspective,
it is closely related to secure property rights, the rule of law, and other institutions believed to be
conducive to long term economic development. Autocratic regimes, by contrast, are prone to growth-
reducing rent seeking by the ruling elite.2 Understanding the roots of democracy and autocracy is
therefore an important question, not only because democracy is desireable in itself, but also because
it is a determinant of global inequality.
∗We thank Daron Acemoglu, Oana Borcan, Carl-Johan Dalgaard, Jacob Gerner Hariri, James Robinson, David Weil,
participants at the Macro Lunch at Brown University and at the Nordic Conference in Development Economics, and
the MEHR group at University of Copenhagen for useful comments.1Remark by Winston Churchill in a speech in the House of Commons November 11, 1947.2See, e.g., Acemoglu and Robinson (2012) for a recent book-length discussion.
1
We investigate a specific geographical source of present day institutions, namely whether a society
in historical times was dependent on large scale irrigation. The link between irrigation and autocracy
was noted both by Adam Smith, John Stuart Mill, and Karl Marx, but it is perhaps most forcefully
articulated by Karl August Wittfogel in Oriental Despotism.3 Wittfogel argues that the construction
and maintenance of large scale irrigation systems required a strong leadership, which in historical times
meant a centralization of power in the hands of a despotic ruler. The ability to control water resources
gave the despot more sway over his subjects than in areas with widespread rainfed agriculture. In
turn, this made it possible to increase rent-seeking to levels unknown in Europe without fearing revolt.
Wittfogel gives ancient Egypt, Mesopotamia, India, China, and the Andean and Mexican civilizations
as examples.4
Oriental Despotism has been hotly debated and is routinely dismissed by anthropologists and
historians.5 Arguably, Wittfogel takes his theory too far, but based on two different data sets, we
confirm that he was right about the basic empirical link between irrigation and autocracy.
The cornerstone in our analysis is a measure of irrigation potential. It is based on geographical
factors and unaffected by institutions. So, by using irrigation potential rather than actual irrigation
as explanatory variable, reverse causality is ruled out. Moreover, irrigation potential is correlated
with historical use of irrigation across premodern societies surveyed by ethnographers.
With the irrigation potential measure in hand, we show that countries with a high irrigation
potential are more likely to be autocratic today as measured by the Polity IV index of democracy.
Likewise, ethnographic societies in areas with high irrigation potential were more likely to be ruled
by an elite that based its power on control of natural resources. In both data sets the relationships
are statistically significant and robust to a wide range of control variables.
There is a large literature investigating the link between autocracy and irrigation, but it is entirely
based on case studies.6 Our contribution is to go beyond the case studies found in the anthropological
and historical literature and look for more systematic evidence. To our knowledge we are the first to
3Smith (1776 [1999]) book IV, chapter IX, Mill (1848) p. 20-21, Marx (1853), and Wittfogel (1957). While irrigation
is not mentioned explicitly, Smith (1776 [1999]) discusses the differences between Europe and the great irrigation-based
civilizations in Egypt, India, and China.4Wittfogel (1957) p. 24.5See, e.g., Toynbee (1958), Leach (1959), Needham (1959), Mann (1986), or Fukuyama (2011).6Examples are Leach (1959) and Toynbee (1958) along with numerous others. See Mitchell (1973) and Hunt and
Hunt (1976) for overviews of the literature.
2
test the theory using statistical methods.7
We do not interpret our results as showing that irrigation has a strong direct impact on institu-
tions today. It seems implausible that Sweden, say, would turn autocratic overnight if climatic change
were to produce conditions similar to those of Egypt, especially since agriculture is so relatively unim-
portant to the modern Swedish economy. Instead, the observed link between irrigation and present
day autocracy should be viewed as a manifestation of a historical process. Power structures forged in
premodern times as a consequence of irrigation-based agriculture made countries less susceptible to
the waves of democratizations that have flowed across the world since the 19th century. The argument
resonates with string of recent contributions to the economics literature dealing with instiutional per-
sistence. Notable examples are North (1990), Engerman and Sokoloff (2000), Acemoglu et al. (2001)
and Nunn (2007). Our analysis is thus embedded in this line of research.
While our results are consistent with Oriental Despotism, the channel through which irrigation
has shaped autocratic institutions may well be different from what Wittfogel suggested. For instance,
Mayshar et al. (2012) argue that irrigated agriculture made yields more predictable and thus an
easier object to tax. Predictability also made serfdom or share cropping more viable compared to
areas with rainfed agriculture. Local land lords may therefore have been relatively more powerful in
irrigated societies and better able to withstand democratization, much in the same way as Engerman
and Sokoloff (2000) argue it was the case in plantation based economies in the New World.8 The
results from the ethnographic data supports this notion.
Many historical determinants of institutions have been suggested, but we show that the effect of
irrigation does not work through channels known in the literature to have had an impact on present
day institutions. These include income levels, as argued by Lipset (1959), natural resource abundance,
as argued by Ross (2001), and, perhaps most notably, colonization. Acemoglu et al. (2001), Feyrer
and Sacerdote (2009), Olsson (2009), Dell (2010) and Hariri (forthcoming), among others, show that
European colonialism exported institutions to other parts of the world. Reassuringly, the statistical
relationship between irrigation potential and autocracy remains both in a subsample of non-colonies,
and in a subsample of former colonies. The effect of irrigation on autocracy is smaller across former
7Since precipitation is one determinant of irrigation potential, partial exceptions are Midlarsky (1995) and Haber and
Menaldo (2010), who study two different links between rainfall and institutions. But as shown empirically in Section 4,
irrigation potential is a stronger determinant of present day autocracy.8Engerman and Sokoloff (2000) argue that some crops were better suited for extractive enterprise by ruling elites.
Hence, in these areas, the ruling elite managed to grasp more power and to keep it.
3
colonies, however, and our results are therefore consistent with the view that European presence had
a long lasting impact on institutions.
The paper is organized as follows. In Section 2, we review the theoretical link between large scale
irrigation and present day institutions. Section 3 describes the methodological approach used in the
empirical analysis, particularly with respect to our measure of irrigation potential. Armed with an
empirical strategy, we proceed to test the link between irrigation and autocracy on two data sets:
cross country data in Section 4, and a more disaggregated data set based on ethnographic studies in
Section 5. Section 6 concludes.
2 The Theory of Irrigation and Autocracy
The concept of oriental despotism has existed in one form or another in European intellectual discourse
for millenia. Aristotle, Herodotus, Montesqieu and Hegel, to name a few, all considered Middle
Eastern and Asian institutions less representative and more despotic than what they were used to in
Europe. Karl Marx dubbed it the Asiatic Mode of Production and, inspired by Adam Smith and other
classical economists, argued that the ability to control water was one reason for the state’s dominance
in the irrigation dependent societies in Asia.9 Expanding on their analysis, Wittfogel (1957) called it
the hydraulic society, allthough he kept Oriental Despotism as the title of his book to maintain the
connection to the earlier literature. We follow Wittfogel (1957) and use the term hydraulic society to
mean the set of institutions that evolved in historical times in areas where agriculture relied on large
scale irrigation.10 As explained below, however, we do not believe that the institutions were exactly
as Wittfogel envisioned them.
Wittfogel came under heavy fire after the publication of Oriental Despotism, but most of the
criticism was aimed at aspects of his theory that we are not interested in. Particularly, Wittfogel’s
claim that irrigation was a cause of state formation has been refuted by scores of anthropologists and
archaeologists who have shown that the emergence of the state preceeded large scale irrigation by
centuries, even millenia.11 Let us therefore be clear. The hypothesis we investigate is not about the
9Marx (1853). See O’Leary (1989) for an account of the history of thought on the asiatic mode of production.10The hydraulic society should be distinguished from what Wittfogel (1957) called hydroagriculture. The difference is
a matter of scale. In the hydraulic society, farmers are dependent on a common irrigation system of canals and dams. In
hydroagriculture, farmers are dependent on irrigation, but the geographical conditions make coordination unneccessary
or impossible. Wittfogel mentions Japan as an example of the latter. For further discussion, see Price (1994).11See, e.g., Carneiro (1970).
4
origin of the state, it is about whether areas with irrigation based agriculture are more autocratic
today.
In this section we spell out the hypothesis in greater detail. First, we describe a number of channels
through which irrigation shapes institutions and the distribution of power. Second, we argue that
these institutions can perpetuate through time and affect a society’s resilience to democratization.
2.1 The hydraulic society
Agriculture in hydraulic societies differed from rainfed agriculture in several crucial aspects that
tilted power in favor of a landed elite or a centralized government at the expense of the peasants.
Irrigated agriculture relied, for instance, on public works like dams and canals which required the
mobilization of a large labor force. Moreover, the problem of allocating water between plots created
an interdependence among farmers not found in rainfed societies.
Both the building of irrigation systems and the problem of allocating water required an institu-
tional framework that could handle coordination problems, preventing free-riding and solving disputes
over scarce water resources when irrigated areas were too large to be managed by kin. In pre-modern
times, where only primitive technologies were available, the most effi cient solution is likely to have
been a strong authoritarian leadership. This could either be in the hands of a pharao-like despot, as
Wittfogel envisioned, or in the hands of a local landed elite. The geographer Commadore B. Fisher,
observing early 20th century Persia, noted that:
"Because of the expense and the diffi culty of cooperative effort on the part of small
landowners, these irrigation systems are privately owned and tend to perpetuate the feudal
system which is well organized in Persia today. A wealthy family can purchase an extensive
tract of desert land, make a large investment in a water system, and attract hundreds of
tenants who are eager to make their homes around the water supply. Under the need of
water and the diffi culty of securing it, these tenants are easily reduced to virtual slavery."12
Admittedly, irrigation systems can be built and maintained in a completely decentralized fash-
ion, as Ostrom (1990) shows. Although exceptions can be found, such arrangements are inherently
unstable due to the bargaining process involved and tend to be short-lived compared to centralized
systems.13 Moreover, in historical times when property rights were less secure, decentralized irrigation12Fisher (1928).13See, e.g., Ostrom and Gardner (1993), footnote 15.
5
systems were likely to be expropriated by rent-seeking rulers or elites. A transfer of power the other
way is less likely. Compared to rainfed agriculture where the source of water is uncontrollable, it is
relatively easy to control the water supply in most irrigated systems at low costs. One needs only to
guard and govern the section of the irrigation system close to the physical source of water.
Another mechanism through which irrigation can affect institutions is related to transparency.
As pointed out by Mayshar et al. (2012), the observability of the amount of water allocated to
the individual plot in irrigated areas increased the transparency in agricultural production. Such
transparency made taxation easier. In Egypt, for example, accurate estimates of yields could be
calculated in advance by observing the height reached by the annual floods, and taxes could be set
accordingly.14 Ease of taxation reduced the bargaining power of the population when the rulers were
in need of revenue, which, as argued by Bates and Lien (1985), made the rulers less likely to offer
representation in return for tax payments.
Transparency also meant that tax collection and the daily management of irrigation systems could
be delegated to local land lords without causing moral hazard problems. The central government could
simply calculate the amount owed to the state and punish the land lords if they failed to provide
the government with its share. Decentralized control of the water, particularly in Egypt, has often
been used to dismiss Wittfogel’s hypothesis.15 Yet, it may in fact be a reflection of the government’s
ability to excercise control in a hydraulic society.
Perhaps more importantly, the transparency in agricultural production provided by irrigation
made absentee landlordism based on sharecropping or outright serfdom more attractive. The land
owner did not need to monitor effort directly as shirking could be prevented by promising severe
punishment if the tenant or serf failed to produce the amount of crops predicted by the water allocated
to the plots. Large land holdings were therefore more economically attractive in irrigated societies
than in rainfed areas and, as a consequence, a centralization of land ownerhip in the hands of an elite
or a despotic state were more likely to occur. The tendency was reinforced by the high fixed costs
of building and maintaining irrigation systems as explained by Commadore B. Fisher in the quote
above.16
14Cooper (1976) documents this procedure. See also Mayshar et al. (2012).15E.g., Manning (2012).16Serfdom and sharecropping seems to have been the norm in the ancient hydraulic societies identified by Wittfogel
(1957). An interesting case analyzed by Mayshar et al. (2012) is Mesopotamia. Agriculture in Lower Mesopotamia
(Babylonia) was fed by water from Tigris and Euphrates, and land ownership was concentrated with a small, but
powerful elite. Independent owner-occupied farms were, by contrast, prevalent in Upper Mesopotamia where agriculture
6
2.2 Resistance to democratization
Monopolization of water, ease of monitoring and elite-controlled agriculture reduced the economical
and political power of the general population in hydraulic societies compared to their rulers. Whether
the rulers were landed elites or despotic governments is not central to our argument. What matters
is that open access to compete for power was highly unappealing to them, as it would erode their
power bases.17 That was not unique to hydraulic societies, but the centralization of power fostered
by irrigation made elites or despots in such societies better able to respond to popular revolt, and
thereby fend off calls for democracy.
The argument is analogous to the Engerman and Sokoloff (2000) analysis of how the interplay
between geography and colonization shaped institutions in the Americas. They argue that areas
suitable for cash crops like sugar and cotton became dominated by large plantations worked by slaves
or indentured servants. Even when slavery was abolished, the ruling elites maintained their land
ownership and much of their political power. Democracy would disturb this position of power, and
the elites consequently supported autocratic regimes. Areas only suitable for grains or livestock, on
the other hand, were mainly inhabited by independent smallholders and therefore more susceptible
to democracy.
The present day link between irrigation and autocracy is according to our argument a result of
power structures and institutions forged through the course of history. Moreover, such institutional
persistence is self-perpetuating if increased representation may spur economic growth, which itself
could drive further development of representative institutions. For instance, as shown by Easterly
(2007), Galor et al. (2009) and Gallego (2010), societies with a relatively egalitarian pattern of land
ownership are more likely to foster human capital promoting institutions. Countries which were
initially more autocratic should consequently grow more slowly and therefore develop democracy
even later.
was chiefly rainfed. A more recent example is documented by Islam et al. (1997), who show that the correlation between
the share of land with canal irrigation and the share of land tilled by tenants was 0.58 across districts in Punjab in the
early 1920s.17 Indeed, moves towards broad representation have often been accompanied by land reform. See Conning and Robin-
son (2002).
7
3 Methodology and irrigation data
To test whether societies with high dependency on irrigation are more autocratic, we estimate regres-
where i indexes countries in Section 4 and ethnographic societies in Section 5. The measure of
institutions will be different depending on the level of disaggregation, so we leave it unspecified for
now. X is a vector of control variables and u is an error term. The effect of irrigation on institutions
is captured by the coeffi cient α1.
Our explanatory variable is irrigation potential rather than actual irrigation. There are three
reasons for this. First, actual irrigation is likely to be endogenous. For example, higher income could
lead to more investments in irrigation. If democratic institutions are conducive to economic devel-
opment this would bias our estimate of α1. Furthermore, strong autocratic regimes may have been
better able to undertake large irrigation works, which could lead to problems with reverse causality.18
Second, there is, to our knowledge, no reliable historical measure of national irrigation. Third, even if
we could obtain a historical irrigation measure, this would reflect irrigation in a particular year, which
is problematic since we believe that the level of autocracy today is a product of a long, accummulated
history of irrigation.
For these reasons we use data on irrigation potential taken from the Food and Agriculture Orga-
nization (FAO)’s global Agroecological Zones (GAEZ) 2002 database.19 For each 0.5x0.5o grid cell
FAO computes the potential yield of irrigated agriculture relative to rainfed agriculture using climatic
and geographic data. The construction of the yield increase data at the grid-cell level boils down to
the following four steps:
1. Does the soil quality and the distribution of temperature and sunlight hours across the year
allow for production of crops at all? If no, the cell is classified as unsuitable for agriculture.
Otherwise, proceed to step 2.
2. Is there enough precipitation for crop production? If no, and if there is no source of water
18This has often been used to criticize Wittfogel (1957), see, e.g., Fukuyama (2011).19Our empirical strategy is similar to that of Nunn and Qian (2011), who use agricultural suitability for growing
potatoes as a source of exogenous variation in actual potato cultivation.
8
nearby, the cell is classified as unsuitable for agriculture. If there is enough precipitation and/or
a nearby source of water proceed to step 3.
3. Compute the rainfed crop yield using data on soil fertility and the yearly distribution of tem-
perature, sunlight hours, and precipitation. Compute the irrigated crop yield using data on
soil fertility and the yearly distribution of temperature and sunlight hours while assuming that
there is always suffi cient amount of water available for optimal crop growth.
4. Compute the percentage increase in crop yield obtained by using irrigation compared to rainfed
agriculture. Use this number to place the cell in one of the five following impact classes: 1: 0%,
2: 1-20%, 3: 20-50%, 4: 50-100%, and 5: >100%.
The resulting data is depicted in Figure 1. Now, we can aggregate the measure of irrigation impact
classes up to the relevant unit of observation. We do this in the following way:
irrigation potential =arable land where yield increase from irrigation > x%
arable land, (2)
where x should be intepreted as the minimum return to irrigation where it is economically viable
given the costs of construction and maintenance; irrigation potential is therefore the fraction of total
arable land where irrigation is worthwhile. Arable land is the sum of the area of impact classes 1
through 5. In order to settle with one measure of irrigation potential, we need to find the cut-off
value, x.
3.1 Finding the cut-off value x
Technological progress means that the cut-off value x is likely to have been higher historically than it
is the case today. Mechanization and development of new types of irrigation (e.g., sprinkler irrigation)
has reduced costs. At the same time, the development of new types of seed, fertilizer, and pesticides
has made the absolute gain from irrigation larger in each impact class. So, while it is likely to be
profitable to adopt irrigation in areas where irrigation can increase crop yields by only 1-20% today,
it was probably not the case historically.
To find out which cut-off to use in our empirical analysis, we investigate how irrigation potential
based on different values of x correlate with actual irrigation use in pre-industrial societies. To this
end we take the data from the Ethnographic Atlas constructed by Murdock (1967). The dataset
9
Figure 1: Irrigation impact classes.
10
comprises historical information on 1167 societies scattered across the globe.20 319 of these societies
had intensive agriculture at the time of observation. Of these, 126 had irrigated intensive agriculture.
For each society we calculate the irrigation potential within a 200 km radius of the society centre.
Seven of the 319 societies are placed on small islands where no irrigation potential data is available,
and the sample is consequently reduced to 312 observations.
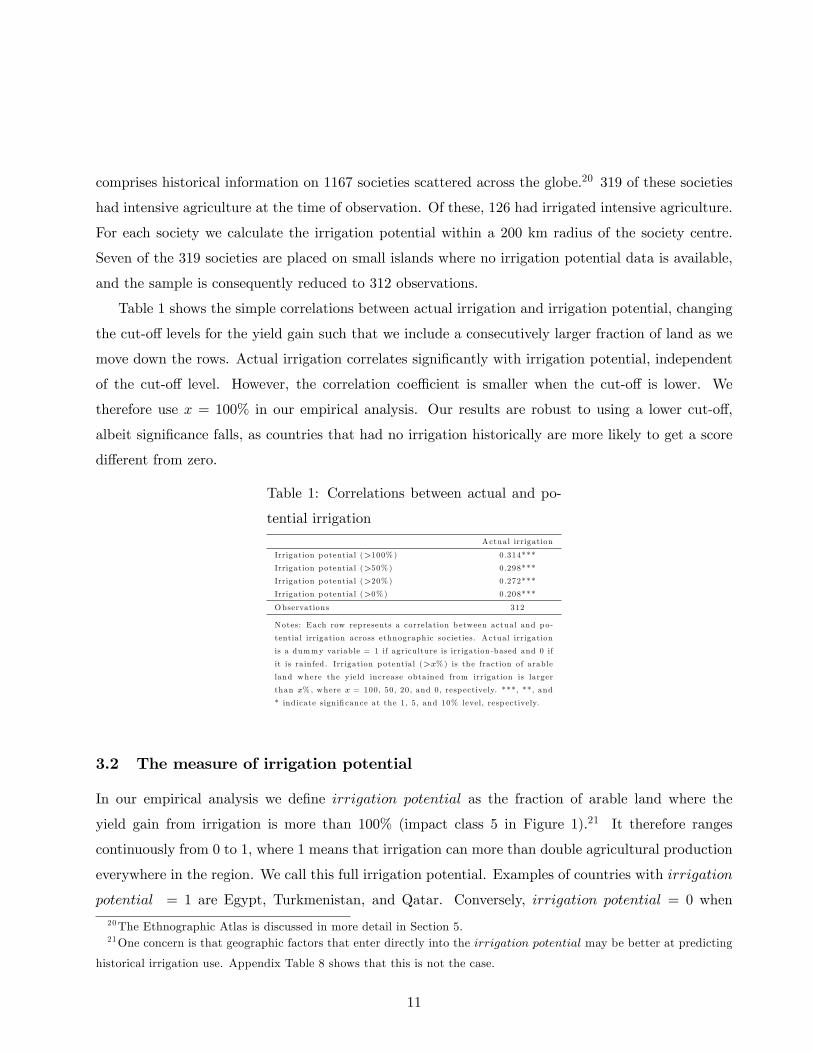
Table 1 shows the simple correlations between actual irrigation and irrigation potential, changing
the cut-off levels for the yield gain such that we include a consecutively larger fraction of land as we
move down the rows. Actual irrigation correlates significantly with irrigation potential, independent
of the cut-off level. However, the correlation coeffi cient is smaller when the cut-off is lower. We
therefore use x = 100% in our empirical analysis. Our results are robust to using a lower cut-off,
albeit significance falls, as countries that had no irrigation historically are more likely to get a score
different from zero.
Table 1: Correlations between actual and po-
tential irrigation
Actual irrigation
Irrigation potentia l (>100% ) 0.314***
Irrigation potentia l (>50% ) 0.298***
Irrigation potentia l (>20% ) 0.272***
Irrigation potentia l (>0% ) 0.208***
Observations 312
Notes: Each row represents a correlation b etween actual and po-
tentia l irrigation across ethnographic so cieties. Actual irrigation
is a dummy variab le = 1 if agricu lture is irrigation-based and 0 if
it is ra in fed . Irrigation potentia l (>x%) is the fraction of arab le
land where the yield increase obtained from irrigation is larger
than x% , where x = 100, 50, 20, and 0, resp ectively. ***, **, and
* ind icate sign ificance at the 1, 5 , and 10% level, resp ectively.
3.2 The measure of irrigation potential
In our empirical analysis we define irrigation potential as the fraction of arable land where the
yield gain from irrigation is more than 100% (impact class 5 in Figure 1).21 It therefore ranges
continuously from 0 to 1, where 1 means that irrigation can more than double agricultural production
everywhere in the region. We call this full irrigation potential. Examples of countries with irrigation
potential = 1 are Egypt, Turkmenistan, and Qatar. Conversely, irrigation potential = 0 when
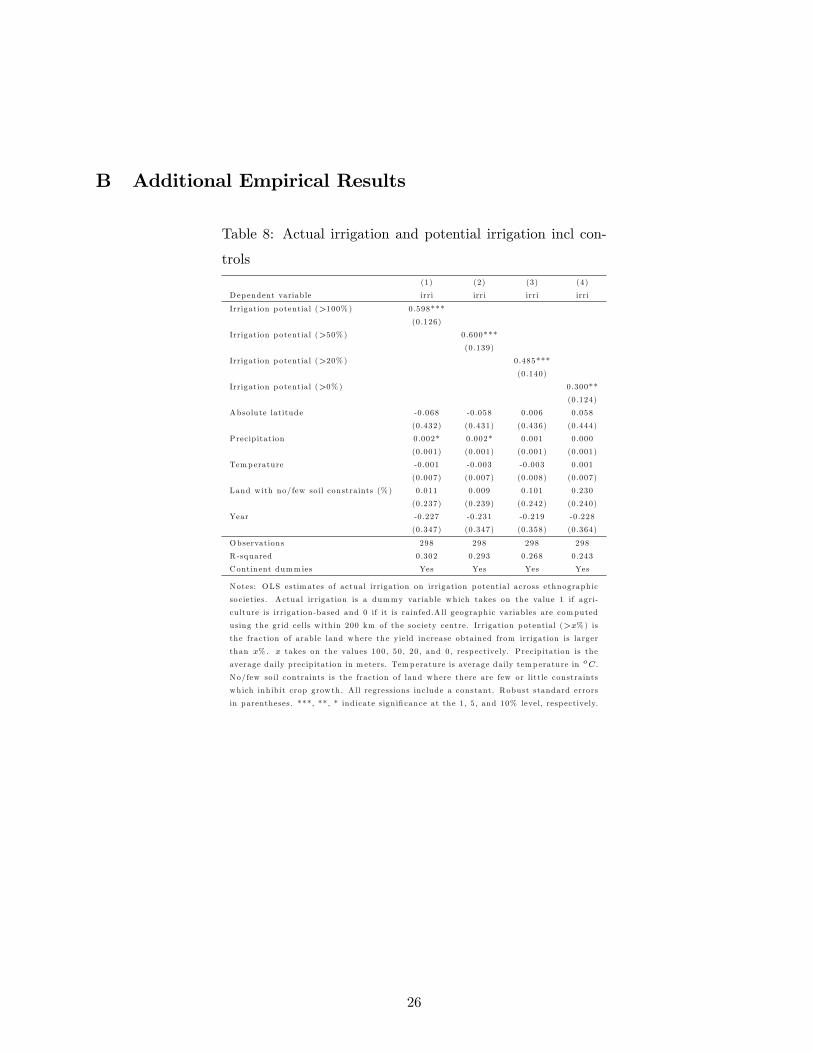
20The Ethnographic Atlas is discussed in more detail in Section 5.21One concern is that geographic factors that enter directly into the irrigation potential may be better at predicting
historical irrigation use. Appendix Table 8 shows that this is not the case.
11
irrigation is not economically profitable (given the cut-off value of 100%) anywhere in the region.
Examples of countries with irrigation potential = 0 are United Kingdom, Denmark, and Macedonia.22
Countries with intermediate levels of irrigation potential include Argentina (0.42), Jordan (0.54), and
Namibia (0.56).
4 Evidence across countries
In our cross-country analysis, the outcome variable is the degree of democracy in a society as measured
by the polity2 index from the Marshall et al. (2010) Polity IV database.23 The index ranges from
-10 to +10, where +10 is a full democracy with free elections, strong constraints on the executive,
and well protected civil liberties. Examples of countries with a score of 10 is the United States, the
United Kingdom, and Sweden. The only countries to score a -10 are Saudi Arabia and Oman, but
places like Uzbekistan, Belarus, North Korea, and Eritrea are close. Following Hariri (forthcoming),
we average the polity2 index over the post-Cold War period (1991-2010) to reduce the noise from
institutional volatility in politically unstable countries.24
Column (1) of Table 2 shows the simple correlation coeffi cient between irrigation and the polity2
index. The relation is negative and highly significant. Countries with a higher irrigation potential are
therefore more autocratic. Taken at face value, the estimate implies that a region with no irrigation
potential will be 9.7 points more democratic on the 21 point scale than a country with full irrigation
potential. A large effect, but it is perhaps even more noteworthy that irrigation potential alone
explains 22.7% of the variation in the polity2 index.
4.1 Geographical control variables
Irrigation potential is related to a host of other geographical variables that potentially could drive
the result. In this subsection we show that this is not the case. In column (2), continent dummies
(Europe, Asia, North America, South America, Africa, and Oceania) are included in the regression.
The estimate of interest decreases slightly because Africa and Asia have significantly higher irrigation
22These countries would have a much higher irrigation potential, if we used the lowest cut-off level of >0%, which
is in line with the relatively high present day irrigation levels in these countries. This supports the idea that present
day costs related to irrigation are fairly low, meaning that a lower benefit is need in order to be willing to engage in
irrigation agriculture.23The data is available online from www.systemicpeace.org/polity/polity4.htm.24The results are robust to using only year 2010.
12
potential and, at the same time, are more autocratic than the average country. A proxy for devel-
opment or institutional quality often used in the empirical literature is distance to the Equator. As
shown in column (3), countries further away from the Equator are indeed more democratic, but the
coeffi cient on irrigation potential is unchanged and still highly significant.
Table 2: Polity2 and irrigation potential - geographical control variables
(1) (2) (3) (4) (5) (6) (7) (8) (9) (10)
Dep endent variab le polity2 polity2 polity2 polity2 polity2 polity2 polity2 polity2 polity2 polity2
Notes: OLS estim ates. The dep endent variab le is the p olity2-index, which measures how democratic p olitica l institutions are. It ranges from -10
(least democratic) to 10 (most democratic) and is computed as an average of yearly values from 1991-2010. Irrigation potentia l ranges from 0 to 1 and
measures the fraction of arab le land where the yield increase obtained from irrigation is larger than 100% . A ll geographic variab les are computed by
averaging over the modern-day borders of the country. Temperature is average daily temperature in oC. P recip itation is the average daily precip ita-
tion in m eters. No/few soil contra ints is the fraction of land where there are no or few constra ints to crop growth . A rable land is the fraction of land
where the clim ate, so il quality, and water sources p erm it crop grow th . A ll variab les are describ ed in more deta il in the Data App endix . ***, **, and *
ind icate sign ificance at the 1, 5 , and 10% level, resp ectively. A ll regressions include a constant. Robust standard errors in parentheses.
A range of geographical variables enter directly into our measure of irrigation potential, including
(in the numerator) precipitation, temperature, and soil quality, and (in the denominator) arable land.
We control for each of these factors one by one in columns (4)-(7).25 Only the share of arable land
is individually significant, and the inclusion of these control variables has neglegible impact on the
irrigation potential coeffi cient.
Haber and Menaldo (2010) show that precipitation exerts a non-linear effect on political institu-
tions, with intermediate levels of rainfall being the most conducive to democracy. They argue that
this relationship is a proxy for the climatic suitability for growing cereals, a class of crops which
are storable and have only modest returns to scale in their production. Storability allows for an
accumulation of surplus, which, according to Haber and Menaldo (2010), historically has permitted
trade and specialization. Modest scale returns created a more equal distribution of property, an25See Data Appendix A for data description and sources.
13
argument closely related to ours. Combined, Haber and Menaldo (2010) contend that these charac-
taristics of cereal production gave rise to stronger property rights, human capital investments, and
the development of representative institutions.
In our regressions, we proxy the nonlinear relationship between rainfall and democracy by adding
precipitation and precipitation squared as control variables. Column (8) shows that the nonlinear
relationship exists when irrigation potential is excluded from the regression. However, if we include
irrigation potential in column (9), both rainfall terms become insignificant individually and jointly,
and even change signs.26
Column (10) includes all geographical control variables together. The coeffi cient on irrigation
potential is still negative and highly significant.The added-variable plot of column (10) of Table 2
shown in Figure 2 confirms visually that our finding is not driven by a particular country or group of
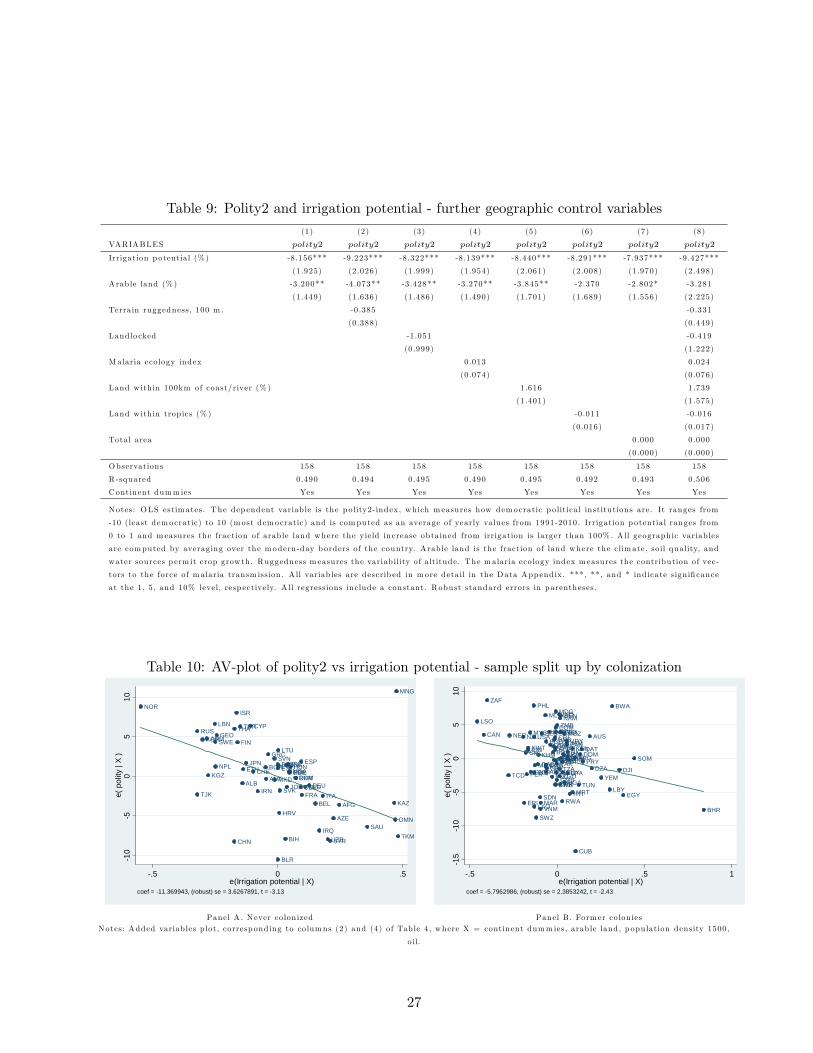
countries.27 A range of other geographical control variables suggested in the literature to influence
economic development or institutions were also tested (see Appendix B, Table 9), but none of these
explain any significant variation in the polity index in addition to that explained by irrigation.28 More
importantly, none of them affect our estimate of interest.
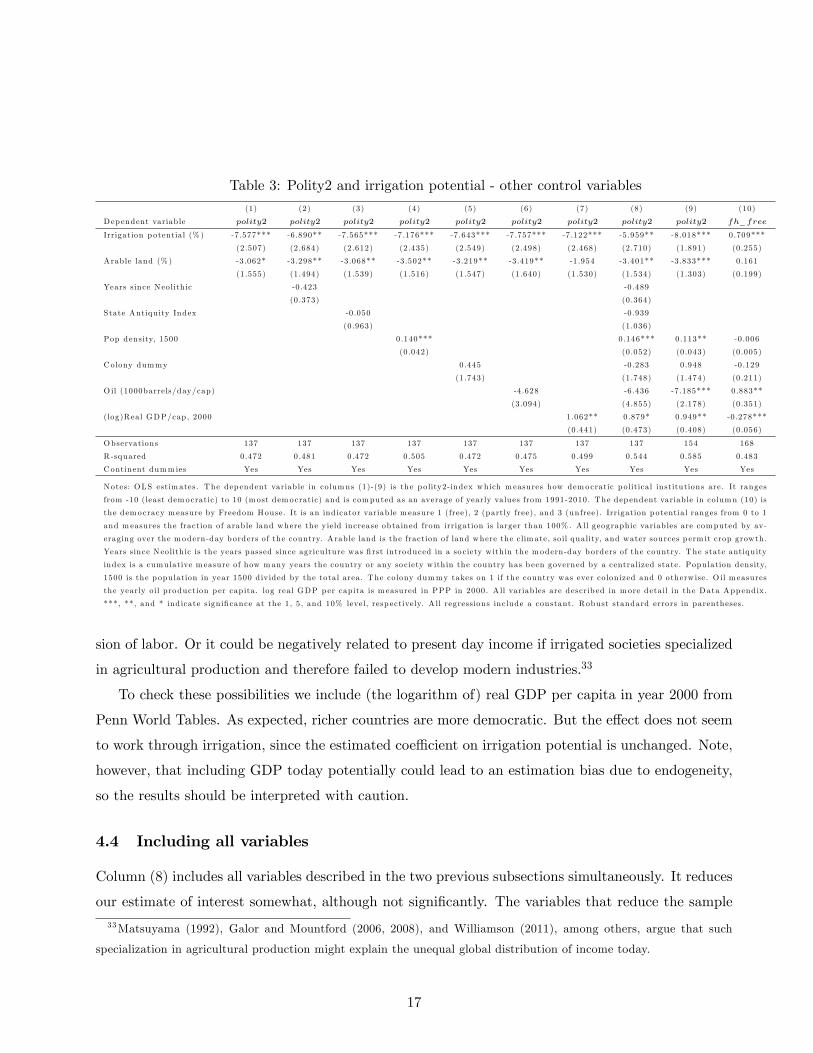
4.2 Historical control variables
That institutions are persistent over time is hardly controversial, and a corollary of this is that history
matters. In Table 3, we deal specifically with two aspects of the historical process that have drawn
attention in the literature: the consequences of a developmental head start and colonization.
We carry the significant geography control variables from the previous section (continent dummies
and arable land) with us. The sample in Table 3 is somewhat restricted by data availability compared
to Table 2 and therefore, column (1) shows the relation between irrigation and democracy in the new
and smaller sample. The irrigation potential coeffi cient decreases, but not significantly so. The
standard errors are somewhat larger.
As argued by Diamond (1997) and shown empirically by Hibbs and Olsson (2004), among others,
26Confirmed by an F-test with a p-value of 0.897.27The result also holds if we exclude the 10 countries with irrigation potential = 1, the 44 countries with irrigation
potential = 0, or all 54 countries at the same time (results not shown here). If anything, the level of significance and
the estimate rise in absolute value.28These include: malaria ecology, distance to coast or navigable river, land within tropics, terrain ruggedness, total
area, and a dummy for whether a country is landlocked or not.
14
NER
TCD
ISRCYP
ZAF
ERI
IRN
SDN
LBNMLI
JOR
SEN
TJK
ARM
KGZMEX
TUR
PNG
GRC
GMB
LSO
PRK
SWZ
BGRSWEBFAMDA
CHN
SLB
HUNMYS
MAR
MKDIDN
PHL
FIN
UKR
RUS
ETH
CRI
ALB
IRQ
PER
BOL
ZWE
PRT
BEN
PAK
POL
SGP
THA
MRT
DNK
KOR
CAN
TWN
COL
CZEKHMNLD
AGO
IND
ESPBGDTTO
TGO
SVK
GUY
FRA
BLR
USAURYROM
ZMB
HTI
LKA
SYR
PANGEOGHA
VEN
SRB
FJI
ECUTZA
DEU
CUB
LTU
LVAGTMEST
LAO
CIV
KEN
BRAITACHL
NGA
NOR
MMR
SLV
MWI
JPN
ARG
MOZ
VNM
NPLCAF
BTN
NAM
BEL
UZB
UGA
DOMNICAUTBDIGNB
GIN
JAM
RWA
HND
COG
PRYZAR
ARE
SLE
BIH
DZA
HRVCMR
COMMDG
LBR
TUNGAB
NZL
SAU
CHE
GNQ
SVN
AZE
AUS
IRL
KWTAFG
GBR
YEM
OMNLBYQAT
SOM
MNEEGY
DJI
TKM
BWA
BHR
KAZ
MNG
15
10
50
510
e( p
olity
| X
)
.4 .2 0 .2 .4e(Irrigation potential | X)
coef = 6.8825859, (robust) se = 3.3139434, t = 2.08
Figure 2: AV-plot of irrigation potential vs polity2 from regression in Table 2, Column (10)
15
an early onset of the Neolithic Revolution has been associated with a developmental head start
that has persisted to this day.29 If an early start predicts democracy today and at the same time
is correlated with irrigation, our result might be biased. We include a measure of years since the
Neolithic Revolution constructed by Putterman and Trainor (2006) in column (2).30 For similar
reasons, we include the Bocksette and Putterman (2007) State Antiquity Index and the population
density in 1500 AD in columns (3) and (4).31
Only population density in 1500 AD explains a significant share of the polity index. The coeffi cient
on population density is positive, indicating that areas more densely populated historically became
more democratic. This result seems at odds with the reversal of fortune argument put forward
by Acemoglu et al. (2002), who argue that densely populated regions colonized by European powers
received fewer European settlers bringing democratic institutions with them from their home country.
However, as shown in Section 4.5 where we deal with colonization in more detail by splitting the
sample in former colonies and non-colonies, the estimated coeffi cient on population density is mainly
driven by the subsample of countries which where never colonized by Europeans (including Europe).
As shown in column (5), colonization does not appear to affect present day institutions in the full
sample. But given the amount of attention paid to colonization and institutional development, we go
a bit further into the question in Section 4.5.
4.3 Resources and income
Many of the high-irrigation potential countries are also oil rich, which could prove a curse for democ-
racy.32 To control for such potential resource curse, we include barrels of oil produced per capita in
year 2000 in column (6). Again the irrigation estimate is unaltered, and although insignificant, more
oil per capita is associated with less democracy as expected.
Another potential determinant of democracy is present day income, as famously suggested by
Lipset (1959). Consequently, income rather than the channels we suggest may drive our results if irri-
gation is directly linked to economic development. A high irrigation potential could, for instance, have
induced faster development by allowing for more densely populated societies and thus a greater divi-
29The term ’Neolithic Revolution’refers to the point in time when a society evolved from relying entirely on hunting
and gathering to relying on settled agriculture.30Using instead Putterman’s (2008) migration-adjusted years since the Neolithic Revolution produces similar results.31These variables are potentially endogenous and this could bias the main results. Hence, the estimates reported
below should be interpreted with caution.32E.g., Ross (2001).
16
Table 3: Polity2 and irrigation potential - other control variables
(1) (2) (3) (4) (5) (6) (7) (8) (9) (10)
Dep endent variab le polity2 polity2 polity2 polity2 polity2 polity2 polity2 polity2 polity2 fh_free
Notes: OLS estim ates. The dep endent variab le in columns (1)-(9) is the p olity2-index which m easures how democratic p olitica l institutions are. It ranges
from -10 (least democratic) to 10 (most democratic) and is computed as an average of yearly values from 1991-2010. The dep endent variab le in column (10) is
the democracy measure by Freedom House. It is an ind icator variab le m easure 1 (free), 2 (partly free), and 3 (unfree). Irrigation potentia l ranges from 0 to 1
and measures the fraction of arab le land where the yield increase obtained from irrigation is larger than 100% . A ll geographic variab les are computed by av-
eraging over the modern-day borders of the country. A rab le land is the fraction of land where the clim ate, so il quality, and water sources p erm it crop grow th.
Years since Neolith ic is the years passed since agricu lture was first introduced in a so ciety w ith in the modern-day borders of the country. The state antiqu ity
index is a cumulative m easure of how many years the country or any so ciety w ith in the country has b een governed by a centra lized state. Population density,
1500 is the p opulation in year 1500 div ided by the total area . The colony dummy takes on 1 if the country was ever colon ized and 0 otherw ise. O il m easures
the yearly oil production p er cap ita . log real GDP per cap ita is m easured in PPP in 2000. A ll variab les are describ ed in more detail in the Data App endix .
***, **, and * ind icate sign ificance at the 1, 5 , and 10% level, resp ectively. A ll regressions include a constant. Robust standard errors in parentheses.
sion of labor. Or it could be negatively related to present day income if irrigated societies specialized
in agricultural production and therefore failed to develop modern industries.33
To check these possibilities we include (the logarithm of) real GDP per capita in year 2000 from
Penn World Tables. As expected, richer countries are more democratic. But the effect does not seem
to work through irrigation, since the estimated coeffi cient on irrigation potential is unchanged. Note,
however, that including GDP today potentially could lead to an estimation bias due to endogeneity,
so the results should be interpreted with caution.
4.4 Including all variables
Column (8) includes all variables described in the two previous subsections simultaneously. It reduces
our estimate of interest somewhat, although not significantly. The variables that reduce the sample
33Matsuyama (1992), Galor and Mountford (2006, 2008), and Williamson (2011), among others, argue that such
specialization in agricultural production might explain the unequal global distribution of income today.
17
size compared to Table 2 are years since the Neolithic Revolution, the state antiquity index, and
population density in 1500 AD. The two former turn out to be insignificant in column (8), and we
therefore exclude them to get a larger sample in column (9). The irrigation potential coeffi cient is
numerically larger and has smaller standard errors in the larger sample. Moreover, consistent with a
resource curse, oil production is now negative and significant.
Most specifications in Table 2 and Table 3 indicate that the coeffi cient on irrigation potential
is around 7, meaning that going from no irrigation potential to full irrigation potential will move
a country 7 points toward democracy on the polity2 scale. Or, to give an example, Algeria as
of 2010 (polity2 = 2, irrigation potential = 0.79) would be as democratic as Turkey (polity2 =
7, irrigation potential = 0.08) if it did not have a history of irrigation.
4.5 Further robustness
This subsection provides robustness checks of our cross-country analysis. First we use the freedom
ratings by Freedom House as an alternative democracy indicator. Countries are categorized as being
free, partly free, and unfree based on the amount of political rights and civil liberties they offer their
citizen. By assigning numerical values 1 (free), 2 (partly free), and 3 (unfree), a freedom index is
constructed. We call this variable fh_free. Note that now we expect that α1 > 0, which is indeed
the case as Table 3, column (10) shows. Areas with higher irrigation potential are more likely to be
classified as unfree, and significantly so. The size of the effect is slightly smaller than the estimate
using the polity2 measure. The estimate equals 23% of the range in fh_free, compared to 33% of
the polity2 measure.34
We now turn to a more thorough investigation of whether the link between irrigation and autocracy
is caused by colonization. Table 4 splits the sample in two: a sample of the 60 countries that were
never a colony (columns 1-2) and a sample of the 94 countries that were colonized at some point in
time (columns 3-5). Together with arable land and continent dummies, we include the variables that
turned out to be important in the previous section: population density in 1500 AD and oil production.
Table 4 shows that irrigation potential retains its sign and significance in both subsamples. How-
ever, irrigation has exerted a larger impact on autocracy in countries that were never a colony. The
results are consistent with the large literature that documents how European conquest amounted to
34Note that the Freedom House measure adds 14 countries to the sample. The coeffi cient on irrigation potential is
unchanged (0.733, se=0.266) if we restrict the sample in column (10) to that in column (9) (not shown here). The
sample in Table 2 would increase to 177 if we used the Freedom House measure instead of polity2.
18
an institutional shock to the New World.35 That colonization amounts to noise in such manner seems
to be confirmed by the big differences in the R2 in the two subsamples. This is also clear from the
added-variable plots in Appendix B Figure 10.
Table 4: Polity2 and irrigation potential - colonies and non-colonies
(1) (2) (3) (4) (5)
Dep endent variab le polity2 polity2 polity2 polity2 polity2
Sample Never colon ized Never colon ized Form er colon ies Form er colon ies Form er colon ies
O il (1000barrels/day/cap) -2 .005 -6 .203*** -4 .933***
(4.714) (1 .824) (1 .816)
Duration of co lony 0.014***
(0.004)
Years since indep endence 0.026*
(0.014)
Malaria ecology index 0.062
(0.074)
Observations 60 60 94 94 94
R -squared 0.545 0.640 0.131 0.506 0.567
Continent dumm ies No Yes No Yes Yes
Notes: OLS estim ates of polity2 on irrigation potentia l for vary ing samples. Columns (1) and (2) include on ly countries that
were never colon ized , while co lumns (3)-(5) include on ly countries that were once a colony. The dep endent variab le is the p olity2-
index, which measures how democratic p olitica l institutions are. It ranges from -10 (least democratic) to 10 (most democratic)
and is computed as an average of yearly values from 1991-2010. Irrigation potentia l ranges from 0 to 1 and measures the frac-
tion of arab le land where the yield increase obtained from irrigation is larger than 100% . A ll geographic variab les are computed
by averaging over the modern-day borders of the country. A rab le land is the fraction of land where the clim ate, so il quality,
and water sources p erm it crop grow th . Population density, 1500 is the p opulation in year 1500 d iv ided by the total area. O il
m easures the yearly oil production p er cap ita . Duration of co lony measures the total number of years the country was a colony.
Years since indep measures the number of years since the country b ecam e indep endent of its co lon ia l p ower. M alaria ecology
m easures the contribution of vectors to the force of m alaria transm ission . A ll variab les are describ ed in more detail in the Data
Appendix . ***, **, and * ind icate sign ificance at the 1, 5 , and 10% level, resp ectively. A ll regressions include a constant. Robust
standard errors in parentheses.
In the last column of Table 4, we include controls that are potentially important for colonies
only. Olsson (2009) tests the impact of colonization on the polity2 index, taking into account the
heterogeneity of the colonization period. He shows that countries that were colonized for longer
periods of time and who became independent earlier, are more democratic today. We find results
consistents with Olsson (2009)’s hypothesis. A measure of malaria ecology is also included in the
regression to test the notion that the disease environment was crucial for the institutions set up by
the colonial powers.36 We do not find evidence for that hypothesis. The coeffi cient on irrigation stays
35E.g., Acemoglu et al. (2001, 2002), Engerman and Sokoloff (2000), Iyer and Banerjee (2005), Nunn (2007), Feyrer
and Sacerdote (2009), Olsson (2009), Dell (2010), and Hariri (forthcoming).36Acemoglu et al. (2001, 2002). They use settler mortality and not malaria ecology as a measure of the disease
19
unchanged.
Wittfogel (1957) argues that power in hydraulic societies often radiated from an irrigated core to
rainfed regions. For instance, throughout most of history the power in China has been concentrated
in the irrigated North East. The nationwide irrigation potential variable may therefore understate
the importance of irrigation. Another robustness check is therefore to restrict the irrigation potential
measure to a 200 km radius around capital cities, which is seen as a proxy for the original center of
power in a given country.37 As shown in Appendix B Table 12, our results are robust to using only
irrigation potential around the capital city instead of irrigation potential within country boundaries.
5 Evidence from ethnographic societies
We now move back in history and from the country-level to a more disaggregated level. To this
end we use data from the Ethnographic Atlas.38 The Atlas is based on ethnographic evidence from
traditional societies scattered around the globe, mostly from the 19th and early 20th century. The
data set includes latitude and longitude for each society centre, and it is therefore possible to calculate
our geographical variables at the local level using GIS software.
There is no direct measure of autocracy or democracy in the Ethnographic Atlas.39 Instead we
use social stratification as an indicator of the distribution of power in the society. The ethnographic
societies are classified into five different groups based on the type of stratification prevalent: complex
stratification, hereditary aristocracy, elite stratification, wealth distinctions, and no stratification. We
use elite stratification as our dependent variable as it directly captures the sort of power distribution
we are interested in.40 A society with elite stratification is, according to the definition given in
the Ethnographic Atlas, a society "...in which an elite class derives its superior status from, and
perpetuates it through, control over scarce resources, particularly land, and is thereby differentiated
from a propertyless proletariat or serf class."
environment. It is admittedly a more direct measure, but is only available for a smaller sample of colonies. Moreover,
settler mortality is insignificant in a regression based on the smaller sample where data is available.37Admittedly, the location of the capital may be endogenous and a bias may therefore be present in the regression.38Murdock (1967).39There are some democracy indicators in the related Standard Cross-Cultural Sample (SCCS). Unfortunately, there
are too few observations for our purpose, and mostly from societies of hunters and gatherers where irrigation is not
relevant to the distribution of power.40Admittedly, power may be centralized in societies with hereditary aristocracy. Yet, without control of resources, an
aristocracy is likely to have faced more constraints on their execution of power than a ressource controlling elite.
20
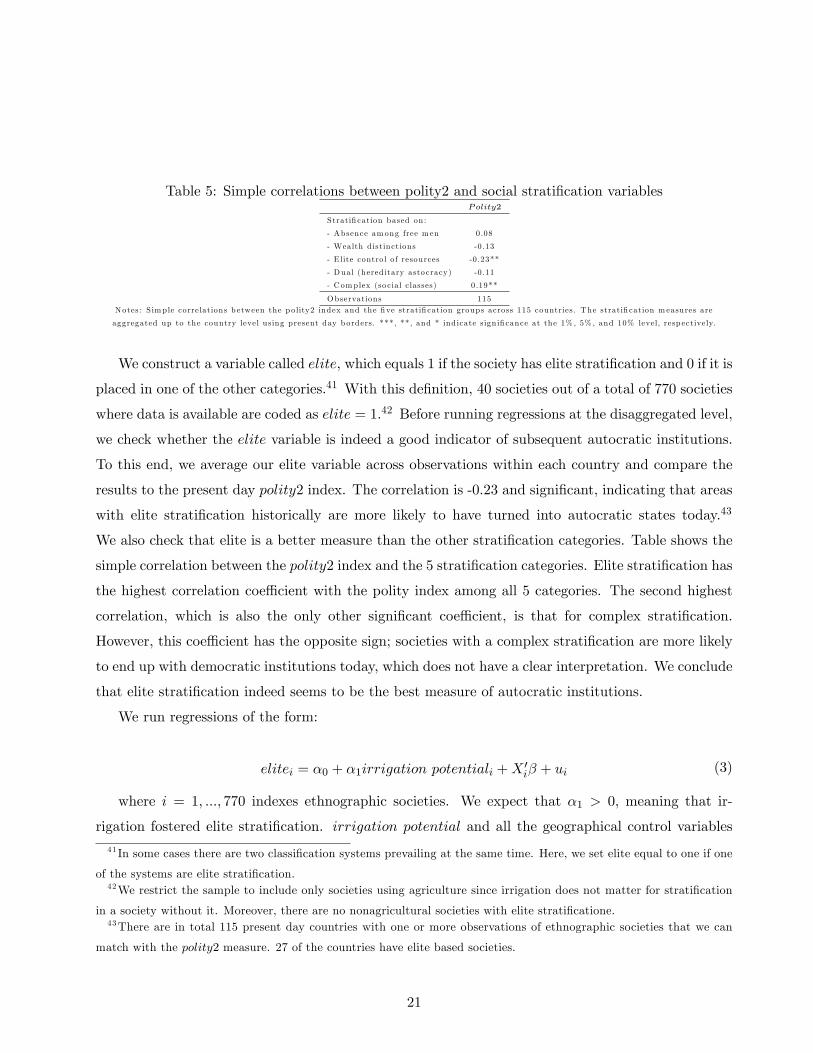
Table 5: Simple correlations between polity2 and social stratification variablesPolity2
Stratification based on:
- Absence among free m en 0.08
- Wealth d istinctions -0 .13
- E lite contro l o f resources -0 .23**
- Dual (hered itary asto cracy) -0 .11
- Complex (so cia l classes) 0 .19**
Observations 115Notes: S imple correlations b etween the p olity2 index and the five stratification groups across 115 countries. The stratification m easures are
aggregated up to the country level using present day borders. ***, **, and * ind icate sign ificance at the 1% , 5% , and 10% level, resp ectively.
We construct a variable called elite, which equals 1 if the society has elite stratification and 0 if it is
placed in one of the other categories.41 With this definition, 40 societies out of a total of 770 societies
where data is available are coded as elite = 1.42 Before running regressions at the disaggregated level,
we check whether the elite variable is indeed a good indicator of subsequent autocratic institutions.
To this end, we average our elite variable across observations within each country and compare the
results to the present day polity2 index. The correlation is -0.23 and significant, indicating that areas
with elite stratification historically are more likely to have turned into autocratic states today.43
We also check that elite is a better measure than the other stratification categories. Table shows the
simple correlation between the polity2 index and the 5 stratification categories. Elite stratification has
the highest correlation coeffi cient with the polity index among all 5 categories. The second highest
correlation, which is also the only other significant coeffi cient, is that for complex stratification.
However, this coeffi cient has the opposite sign; societies with a complex stratification are more likely
to end up with democratic institutions today, which does not have a clear interpretation. We conclude
that elite stratification indeed seems to be the best measure of autocratic institutions.
where i = 1, ..., 770 indexes ethnographic societies. We expect that α1 > 0, meaning that ir-
rigation fostered elite stratification. irrigation potential and all the geographical control variables
41 In some cases there are two classification systems prevailing at the same time. Here, we set elite equal to one if one
of the systems are elite stratification.42We restrict the sample to include only societies using agriculture since irrigation does not matter for stratification
in a society without it. Moreover, there are no nonagricultural societies with elite stratificatione.43There are in total 115 present day countries with one or more observations of ethnographic societies that we can
match with the polity2 measure. 27 of the countries have elite based societies.
21
Table 6: Elite stratification and irrigation potential - geographical control variables
(1) (2) (3) (4) (5) (6) (7) (8) (9)
Dep endent variab le elite elite elite elite elite elite elite elite elite
Continent and 55 language dumm ies No Yes Yes Yes Yes Yes Yes Yes Yes
Notes: OLS estim ates of elite on irrigation potentia l for ethnographic so cieties. The dep endent variab le, e lite , is a dummy variab le equal to one if
the so ciety is so cia lly stratified and ru led by an elite which bases its p ower on contro l of a natural resource, and zero otherw ise. A ll geographic
variab les are computed using the grid cells w ith in 200 km of the so ciety centre. Irrigation potentia l ranges from 0 to 1 and measures the fraction
of arab le land where the yield increase obtained from irrigation is larger than 100% . Year is the year of observation of the ethnographic so ciety.
P recip itation is the average daily precip itation in m eters. Temperature is average daily temperature in oC. No/few soil contra ints is the fraction
of land where there are few or little so il constra ints which inh ib it crop grow th . A rab le land is the fraction of land where the clim ate, so il quality,
and water sources p erm it crop grow th . A ll variab les are describ ed in more detail in the Data App endix . ***, **, and * ind icate sign ificance at the
1, 5 , and 10% level, resp ectively. A ll regressions include a constant. Robust standard errors clustered at the language-group level in parentheses.
are calculated within a 200 km radius of the society centre. In addition to continent fixed effects,
we include 55 language group fixed effects since a shared language indicates a shared cultural and
historical background. We thereby remove variation in the elite variable caused by a shared culture
and history.
The simple regression coeffi cient between irrigation potential and elite is shown in Table 6,
column (1). It is 0.168 and highly significant. When language fixed effects are introduced in column
(2), the estimated coeffi cient more than doubles. The effect of irrigation on elite stratification therefore
seems to have happened within cultural groups rather than between them.
Column (3) in Table 6 includes the year a given society was observed with no consequence for the
results. Likewise, columns (4)-(9) show that all the geographical control variables are insignificant
both included individually and jointly.
It could be that elite stratification requires a certain level of economic development absent in
primitive societies. If that is the case, the estimated effect of irrigation potential could run through
development, and not through the channels outlined in this paper. We therefore control for settlement
complexity and agricultural intensity in Table 7 (variables described in the Data Appendix). This
22
Table 7: Elite stratification and irrigation potential - development
control variables
(1) (2) (3) (4) (5)
Dep endent variab le elite elite elite elite elite
Estim ation m ethod OLS OLS OLS OLS probit
Irrigation potentia l (% ) 0.325*** 0.326*** 0.315*** 0.314*** 1.649***
(0.104) (0 .105) (0 .079) (0 .080) (0 .229)
Agricu ltural intensity -0 .000 0.002 -0 .036
(0 .009) (0 .010) (0 .103)
Settlem ent complex ity -0 .006 -0 .006 0.019
(0.015) (0 .015) (0 .089)
Observations 770 770 770 770 770
R -squared 0.221 0.221 0.222 0.222 0.352a
Continent and 55 language dumm ies Yes Yes Yes Yes Yes
Notes: E stim ates of elite on irrigation potentia l for ethnographic so cieties, co lumns (1)-(4) esti-
m ated w ith OLS, column (5) estim ated w ith prob it. The dep endent variab le, e lite , is a dummy
variab le equal to one if the so ciety is so cia lly stratified and ru led by an elite which bases its p ower
on contro l o f a natural resource, and zero otherw ise. A ll geographic variab les are computed using
the grid cells w ith in 200 km of the so ciety centre. Irrigation potentia l ranges from 0 to 1 and mea-
sures the fraction of arab le land where the yield increase obtained from irrigation is larger than
100% . Settlem ent complex ity m easures, on a scale from 1 to 8, the p ermanency and density of set-
tlem ents. Agricu ltural intensity runs from 1 to 4, where 1 is casual agricu lture and 4 is intensive
agricu lture. A ll variab les are describ ed in more detail in the Data App endix . ***, **, and * in-
d icate sign ificance at the 1% , 5% , and 10% level, resp ectively. A ll regressions include a constant.
Robust standard errors clustered at the language-group level in parentheses.a The R -squared from the prob it estim ation is the pseudo R -squared .
does not affect the results.
Note that our dependent variable is a dummy variable, and one might argue that a nonlinear model
is preferred to OLS. Column (5) of Table 7 estimates the same relation using probit estimation instead
of OLS. The conclusion is unaltered: Irrigation potential exerts a positive and highly significant
influence on the probability of elite stratification.
The evidence across ethnographic societies therefore supports the theory. The coeffi cient on
irrigation potential is positive and highly significant throughout all specifications. Ethnographic
societies in areas where irrigation was worthwhile are more likely to have been dominated by a
resource controlling elite that, in turn, might have inhibited democratization later on.
6 Conclusion
We have tested the theory that societies with a history of irrigation-based agriculture have developed
more autocratic institutions compared to societies with a history of rain-fed agriculture. Such a link
has been hypothesized by many prominent scholars throughout history, including Marx (1853) and
Wittfogel (1957). Yet, we are, to our knowledge, the first to have tested the theory directly using
23
statistical methods.
Since adoption of irrigation may be influenced by existing institutions or the degree of economic
development, we use a measure of irrigation potential to estimate a causal effect of historical irrigation
on autocracy. The measure is correlated with historical use of irrigation in premodern societies.
We find that countries in areas with a high potential for irrigation are more autocratic today as
measured by the polity2 index from the Polity IV database. Our results are robust to a wide range
of geographical, climatic, and historical control variables. According to our estimates, the difference
between a country with no irrigation potential and a country with full irrigation potential is about
seven points on the 21 point polity2 scale. Or, to be concrete, the difference in irrigation potential
can account for the gap in institutional quality between Turkey and Algeria. At a more disaggregated
level, we document that ethnographic societies in areas with a high irrigation potential are more likely
to be ruled by a natural resource-controlling elite.
As the example with Turkey and Algeria shows, the magnitudes involved are quite large. Contem-
porary effects of irrigation on institutions are unlikely to generate such differences, and we therefore
argue that our result is an outcome of a long run historical process. Irrigation in pre-modern soci-
eties fostered, for instance, a concentration of land ownership in the hands of a small elite opposed
to democratization, much in the same way as plantations and slavery according to Engerman and
Sokoloff (2000) had a lasting impact on institutions in the Americas. Other links between historical
irrigation use and present day democracy are conceivable, but our empirical methodology does not
allow us to separate them. Yet, our results from the ethnographic data set indicate that concentration
of ressources played an important role.
Our results contribute to the growing literature on the origins of institutions. Much attention has
been paid to economic development and to historical contingencies related to, for example, coloniza-
tion. However important these determinants might be, a significant fraction of global variation in
institutional quality can still be traced to more deeply rooted geographic factors. Sources of water is
one, as we show in this paper, but there are most likely many others since the livelihood of the vast
majority of humanity until very recently has depended directly on the whims of Mother Nature.
24
A Data Appendix
Many variables in our analysis are based on grid-cell data. We use GIS software and a shapefile of
borders from www.thematicmapping.org to convert them to country averages. The capital city and
Etnographic Atlas calculations are done within a 200 km radius of the city or society centre.
Temperature Averagetemperatureovertheperiod19012000. Countrydata:www.cru.uea.ac.uk/cru/data/hrg/Totalarea Totalareain1000km,excludinginlandwater. Calculatedfromtheshapefile:
Notes: OLS estim ates. The dep endent variab le is the p olity2-index, which m easures how democratic p olitica l institutions are. It ranges from
-10 (least democratic) to 10 (most democratic) and is computed as an average of yearly values from 1991-2010. Irrigation potentia l ranges from
0 to 1 and measures the fraction of arab le land where the yield increase obtained from irrigation is larger than 100% . A ll geographic variab les
are computed by averaging over the modern-day borders of the country. A rab le land is the fraction of land where the clim ate, so il quality, and
water sources p erm it crop grow th . Ruggedness m easures the variab ility of a ltitude. The malaria ecology index m easures the contribution of vec-
tors to the force of m alaria transm ission . A ll variab les are describ ed in more detail in the Data App endix . ***, **, and * ind icate sign ificance
at the 1, 5 , and 10% level, resp ectively. A ll regressions include a constant. Robust standard errors in parentheses.
Table 10: AV-plot of polity2 vs irrigation potential - sample split up by colonization
NOR
RUS
TJK
KORARM
KGZ
LBN
SWE
NPL
GEO
CHN
THA
ISR
FIN
TUR
ALB
ETHJPN
CYP
CHE
IRN
BGR
AUT
GRCSVN
MKD
PRT
BLR
EST
LTU
LVA
HRV
SVK
BIH
DNK
JOR
IRLGBRMDAPOLHUN
ROMUKRCZE
ESP
FRANLDDEU
BEL
IRQ
ITA
UZBSYR
AZE
AFG
SAU
KAZ
OMN
MNG
TKM
10
50
510
e( p
olity
| X
)
.5 0 .5e(Irrigation potential | X)
coef = 11.369943, (robust) se = 3.6267891, t = 3.13
LSO
CAN
ZAF
TCD
NERNZL
ERI
CHL
PER
IDNKWT
MYS
GNQ
PHL
USA
LAO
SGPMEX
SWZ
GABKHM
SDN
VNMMAR
SEN
MLI
AGOCOGARE
BGD
GIN
LKA
LBR
PNG
BOLCAF
ECU
GNBCRI
SLEZAR
ZWECMR
MDG
VEN
MWICOM
CIVPAK
GMB
ZMB
IND
TGO
SLBTZA
NAM
TTO
FJI
BEN
GHA
COL
RWA
BDI
GUY
BRA
MOZ
NGA
UGA
URYPANJAM
GTM
BFA
SLVNICHND
HTI
KEN
MRT
ARG
CUB
TUN
DOMQAT
PRY
AUS
DZAYEM
LBY
BWA
DJI
EGY
SOM
BHR
15
10
50
510
e( p
olity
| X
)
.5 0 .5 1e(Irrigation potential | X)
coef = 5.7962986, (robust) se = 2.3853242, t = 2.43
Panel A . Never colon ized Panel B . Form er colon iesNotes: Added variab les p lot, corresp onding to columns (2) and (4) of Table 4, where X = continent dumm ies, arab le land, p opulation density 1500,
o il.
27
Table 12: Polity2 and irrigation potential - capital cities
(1) (2) (3) (4) (5) (6) (7) (8) (9) (10)
Dep endent variab le polity2 polity2 polity2 polity2 polity2 polity2 polity2 polity2 polity2 polity2
Notes: OLS estim ates of p olity2 on irrigation potentia l surrounding cap ita l cities. The dep endent variab le is the p olity2-index which m easures how demo-
cratic p olitica l institutions are. It ranges from -10 (least democratic) to 10 (most democratic) and is computed as an average of yearly values from 1991-
2010. Irrigation potentia l ranges from 0 to 1 and measures the fraction of arab le land where the yield increase obtained from irrigation is larger than
100% , and is m easured w ith in a 200 km radius of the cap ita l city. A ll geographic variab les are computed by averaging over the modern-day borders of the
country. Temperature is average daily temperature in oC. P recip itation is the average daily precip itation in m eters. Land w ith no or few soil contra ints
is the fraction of land where there are few or little so il constra ints which inh ib it crop grow th . A rable land is the fraction of land where the clim ate, so il
quality, and water sources p erm it crop grow th .A ll variab les are describ ed in more detail in the Data App endix . ***, **, and * ind icate sign ificance at the
1, 5 , and 10% level, resp ectively. A ll regressions include a constant. Robust standard errors in parentheses.
28
References
Acemoglu, D., S. Johnson, and J. Robinson (2001): “The Colonial Origins of Comparative
Development: An Empirical Investigation.” The American Economic Review.
– – – (2002): “Reversal of Fortune: Geography and Institutions in the Making of the Modern World
Income Distribution*.”Quarterly Journal of Economics, 117(4):1231—1294.
Acemoglu, D. and J. Robinson (2012): Why Nations Fail: The Origins of Power, Prosperity,
and Poverty. Crown Publishing Group (NY).
Bates, R. and D. Lien (1985): “A Note on Taxation, Development, and Representative Govern-
ment.” Politics & Society, 14(1):53—70.
Bocksette, V. and L. Putterman (2007): “State Antiquity Index.” Computer file.
Carneiro, R. (1970): “A Theory of the Origin of the State.” Science, 169(3947):733—738.
Comin, D., W. Easterly, and E. Gong (2010): “Was the Wealth of Nations Determined in 1000