56
| Date post: | 07-Mar-2015 |
| Category: |
Documents |
| Upload: | yajur-taxali |
| View: | 32 times |
| Download: | 2 times |
Published in 2011 byNational University of Educational Planning and Administration(Declared by the Government of India under Section 3 of the UGC Act, 1956)
17-B, Sri Aurobindo MargNew Delhi – 110016, INDIA
&
Department of School Education and LiteracyMinistry of Human Resource DevelopmentGovernment of India
© NUEPA 2011
Design and Layout by Publication Unit, NUEPA
Printed at International Print-o-Pac LimitedC- 4 to C-11, Hosiery ComplexPhase II ExtensionNOIDA – 201 305 (Uttar Pradesh)

Foreword
Development of a sound information system is critical for successful monitoring and implementation of any programme, particularly in social sectors. Design of a schoolinformation system has, therefore, been accorded priority from the very beginning of the District Primary Education Programme, as a result of which the DistrictInformation System for Education (DISE) was developed by the National University of Educational Planning and Administration (NUEPA), New Delhi. When SarvaShiksha Abhiyan (SSA) was launched in 2001, not only was the coverage extended to all States & Districts of the country, its scope was also expanded to the entireelementary level of education. I am confident that DISE will play an important role in monitoring the Right of Children to Free and Compulsory Education Act, 2009in years that follow.
I am happy to note that DISE has become a regular source of information on all aspects of elementary education and, through it, information is available at alldisaggregated levels such as school, cluster, block, district, state and national level. NUEPA used to bring out a set of eight annual publications including‘District andState Report Cards’, ‘Elementary Education in Rural and Urban India’, ‘DISE Flash Statistics including Educational Development Index’, and ‘ElementaryEducation in India: Progress towards UEE, Analytical Reports & Tables’, which data-users and researchers found very useful. I am sure that anyone interestedin the Indian education system will find the present publication a valuable resource.
The year 2010 is special for DISE because its project, www.schoolreportcards.in has received two National Awards: E-Governance 2010 (Department of AdministrativeReforms and Public Grievances, Ministry of Personnel, Public Grievances and Pensions, GoI) and eINDIA 2010 (Department of Information Technology, Ministry ofCommunication & IT, GoI) and also Manthan Award South Asia 2010. I congratulate all those involved in the process of strengthening EMIS in the country.
I thank NUEPA, especially Dr. Arun C. Mehta, Professor and Head, Department of EMIS and entire DISE team, for bringing out the present publication. I also thankUNICEF, Delhi, for consistently supporting EMIS activities since 1995.
(Anshu Vaish)
ANSHU VAISHSECRETARY
va’kq oS’;lfpo
Hkkjr ljdkjekuo lalk/ku fodkl ea=ky;Ldwy f’k{kk vkSj lk{kjrk foHkkx
ubZ fnYyh & 110 001Government of India
Ministry of Human Resource DevelopmentDepartment of School Education & Literacy
124 ‘C’ Wing, Shastri Bhavan, New Delhi-110 001Tel.: 23382587, 23381104, Fax: 23387859
E-mail: [email protected]

From the Vice-Chancellor’s Desk
I am happy to observe that the process of strengthening EMIS initiated in 1995 has covered all the districts and states of the country and MIS Units have beenestablished at both these levels and similar units are being established at the block level. The time-lag in availability of educational statistics has come down to less thana year at the national level and only few months at state and district levels. I am confident that DISE would play an important role in monitoring the implementation ofRight to Education Act. In fact, the data capture format and information collection processes have already been suitably modified.
Besides launching one million plus School Report Cards, a set of eight publications exclusively based on the DISE data are being brought out by the National Universityeach year. It is a great pleasure for me to present (a) DISE Flash Statistics: Elementary Education in India, Progress towards UEE, (b) Elementary Education in India:Where Do We Stand; District & State Report Cards; (c) Analytical Report & Analytical Tables, and (d) Elementary Education in Rural & Urban India which togetherencompass different aspects of universalisation of elementary education for the past more than eight years.
I take this opportunity to congratulate everyone involved in strengthening of MIS at various levels and for winning three prestigious National Awards (e-Governance,eINDIA and Manthan South Asia) in 2010. I thank the DISE team led by Prof. Arun C. Mehta for bringing out this publication. I hope that researchers, policy makers,administrators and planners will find the publication both informative and useful.
New DelhiJanuary, 2011 (R Govinda)
Prof. R. GovindaVice-Chancellor Telephone Off. 26515472, 26853038
Fax 91-011-26861882 E-mail [email protected] Website www.nuepa.org
Acknowledgements
For the last several years, NUEPA has been actively involved in strengthening Educational Management Information System (EMIS) in the country. The FlashStatistics: Elementary Education in India: Progress towards UEE is based on the data received from all the States & UTs of the country for the year 2009-10.Besides an Educational Development Index, the publication presents not only state-specific indicators but also brings in many new dimensions of elementary educationinto focus. It incorporates key indicators on all aspects of universalisation of elementary education in case of all the States & UTs of the country.
The Flash Statistics: 2009-10 is based on the data received from as many as 1.3 million schools spread over 635 districts across 35 States & UTs. The study of thismagnitude cannot be completed without the active involvement and participation of the EMIS professionals at the national and sub-national levels. I am extremelythankful to all the State Project Directors, the state level EMIS coordinators and district level programmers and data entry operators for timely supply of data.
I take this opportunity to thank UNICEF, Delhi, in particular Ms Urmila Sarkar, Chief (Education) for consistently supporting EMIS activities ever since the inceptionof DISE and Ms Anita Kaul, Joint Secretary and Mr P. K. Tiwari, Director, Department of School Education & Literacy, Government of India, who played a crucial rolein facilitating the implementation of DISE in various states. I am thankful to Dr. Deepa Sankar, World Bank, Delhi office for useful suggestions which has helped us inimproving EDI each year.
I am thankful to Prof R Govinda, Vice-Chancellor, NUEPA, for his consistent encouragement and guidance. I take this opportunity and thank NUEPA faculty for theirsupport.
The contribution of Shri Naveen Bhatia, Computer Programmer, NUEPA and Shri Shalender Sharma, Chief Consultant, Technical Support Group, Ed. CIL, in databasemanagement, is gratefully acknowledged. I am thankful to Ms Aseela M, Project Assistant (DISE Project) for computing Educational Development Index andMs Shakun Sethi, Project Consultant (DISE Project) for computing indicators that have been presented in the document.
I am also thankful to colleagues in the Publication Unit especially Shri Pramod Rawat, Deputy Publication Officer and Ms Sheeja Biju, Project Publication Officer(DISE Project) for timely bringing out the publication.
I hope that this publication will be of value to education planners, policy formulators and researchers. Suggestions for improvement are most welcome.
Arun C. [email protected]
PAGE NO.PAGE NO.PAGE NO.PAGE NO.PAGE NO.
Foreword i i i
From the Vice-Chancellor's Desk v
Acknowledgements vii
Disclaimer x i
School Indicators
1. Number of Districts covered under DISE 1
2. Number of Recognised Schools imparting Elementary Education 1
3. Number of Government Schools 1
4. Percentage Government Share to Total Schools 1
5. Percentage Government Schools by Type of Management 1
6. Number of Private Schools 2
7. Percentage Private Share to Total Schools 2
8. Percentage Private Schools by Type of Management 2
9. Number of Primary Schools covered under DISE 2
10. Number of New Government Schools Opened 2
11. Primary Schools/Sections per thousand Child Population(6 to 11 Years) 3
12. Upper Primary Schools/Sections per thousand Child Population 3
13. Density of Schools per 10 Sq. Km. 3
14. Ratio of Primary to Upper Primary Schools/Sections 3
15. Average Number of Instructional Days 4
16. Percentage of Primary Only Schools with Less than 200 Working Days 4
17. Percentage of Upper Primary Schools with Less than 220 Working Days 4
18. Average Number of Classrooms 4
19. Average Student–Classroom Ratio 5
20. Number of Districts where Student–Classroom Ratio is above 30 5
21. Percentage of Schools with Student–Classroom Ratio above 30 : Primary Level 5
CONTENTS
PAGE NO.PAGE NO.PAGE NO.PAGE NO.PAGE NO.
22. Percentage of Schools with SCR > 35 : Upper Primery Level 5
23. Percentage Distribution of Primary Only Schools having Enrolment 150& above and have Head Master/Teacher 6
24. Percentage Distribution of Upper Primary Schools/Sections havingEnrolment 100 & above and have Head Master/Teacher 6
25. Percentage of Single-Teacher Schools 6
26. Percentage of Single-Teacher Schools with 15 and more Students 7
27. Percentage Enrolment in Single-Teacher Schools 7
28. Percentage of Schools having Pupil-Teacher Ratio > 60 7
29. Percentage of Schools with Female Teacher 8
30. Percentage Distribution of Schools having Enrolment < 50 8
Facility Indicators
31. Percentage of Schools having Drinking Water Facility 8
32. Percentage of Schools having Common Toilet 8
33. Percentage of Schools having Functional Common Toilet 8
34. Percentage of Schools having Boys’ Toilet 9
35. Percentage of Schools having Functional Boys’ Toilet 9
36. Percentage of Schools having Girls’ Toilet 9
37. Percentage of Schools having Functional Girls’ Toilet 9
38. Percentage of Schools having Boundary Wall 9
39. Percentage of Schools having Computer 9-10
40. Percentage of Schools having Functional Computer 10
41. Percentage of Schools having CAL Facility 10
42. Percentage of Schools having Ramp 10
43. Percentage of Schools having Kitchen-Shed 10
44. Percentage of Schools Providing Mid-day Meal 11
45. Percentage of Schools Having Electricity Connection 11
PAGE NO.PAGE NO.PAGE NO.PAGE NO.PAGE NO.
Teachers-Related Indicators
46. Number of Teachers 11
47. Number of Teachers Available in Government Schools 12
48. Percentage of Teachers in Government Schools 12
49. Percentage of Teachers in Aided Schools 12
50. Percentage of Teachers in Unaided Schools 12
51. Average Number of Teachers per School 13
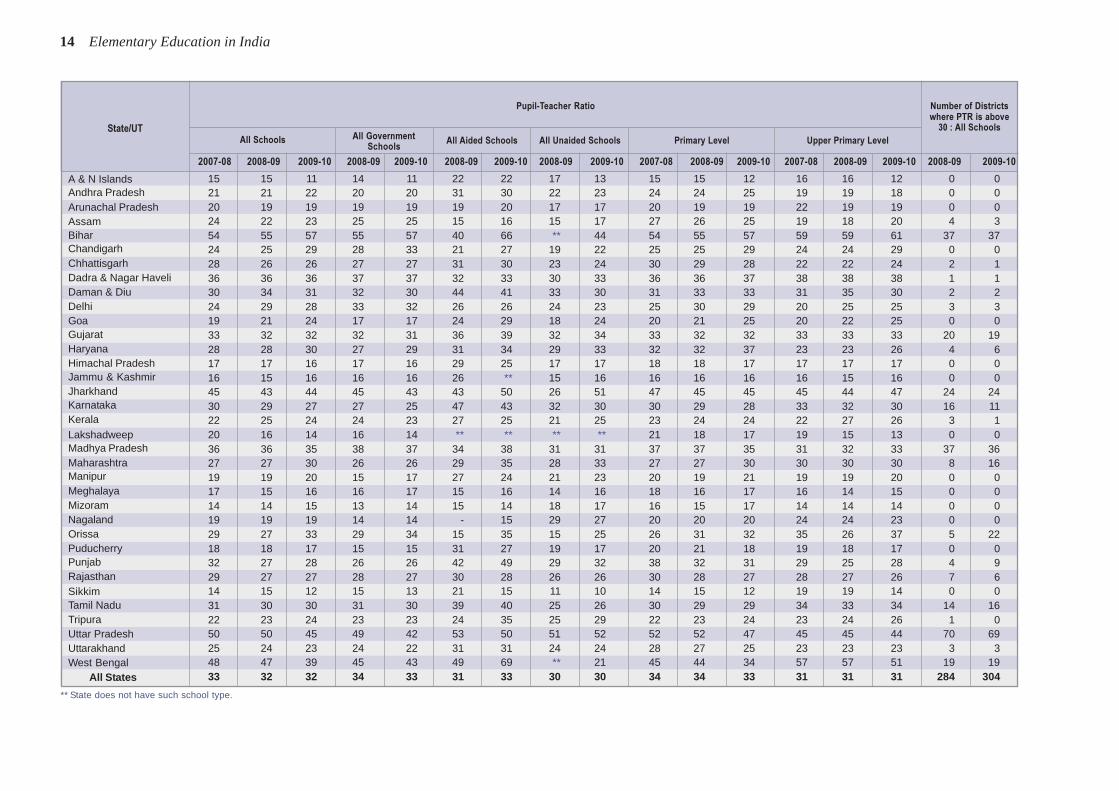
52. Pupil-Teacher Ratio (PTR) 14
53. Number of Districts where PTR is above 30 14
54. Percentage of Schools with PTR > 30 : Primary Level 15
55. Percentage of Schools with PTR > 35 : Upper Primary Level 15
56. Percentage Distribution of Female Teachers 15
57. Percentage Distribution of SC Teachers to Total Teachers 15
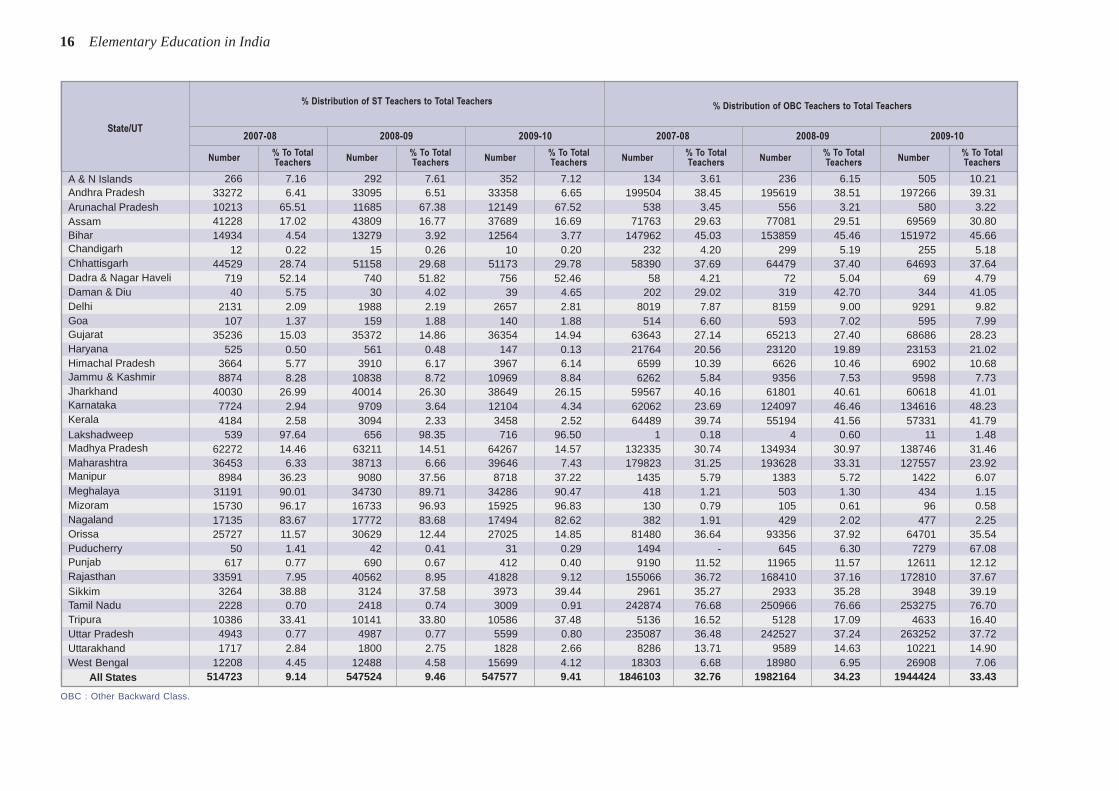
58. Percentage Distribution of ST Teachers to Total Teachers 16
59. Percentage Distribution of OBC Teachers to Total Teachers 16
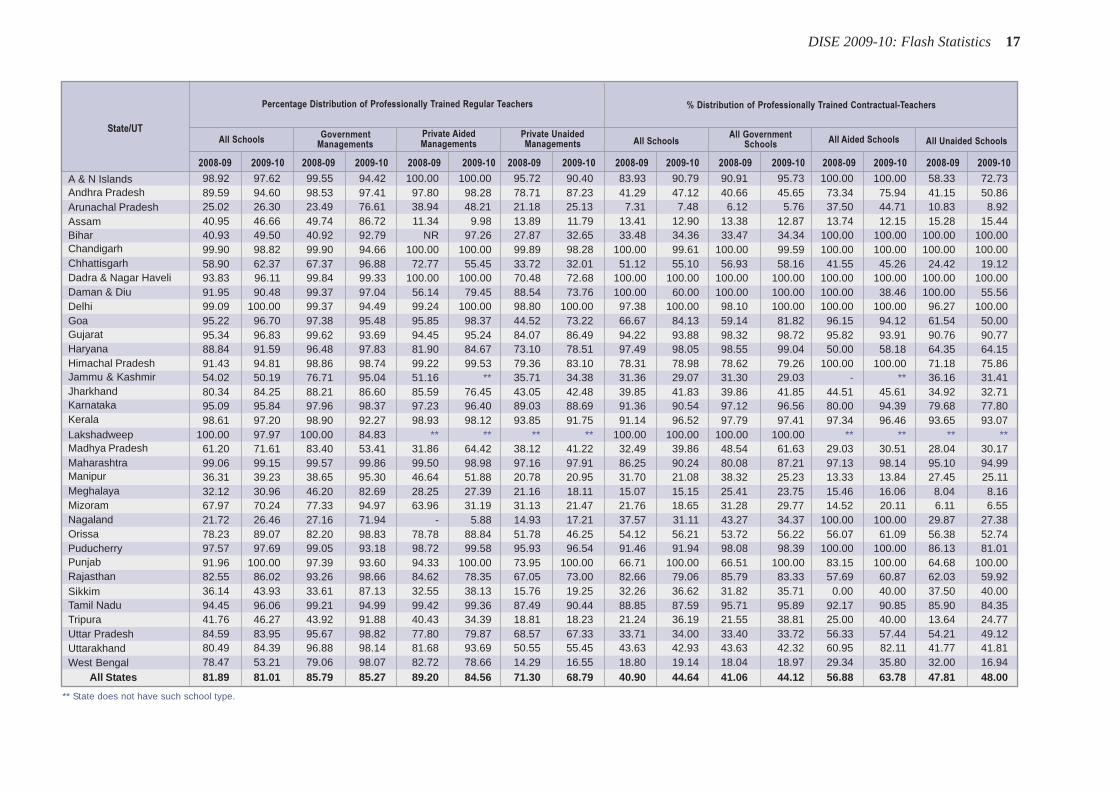
60. Percentage Distribution of Professionally Trained Regular Teachers 17
61. Percentage Distribution of Professionally Trained-Contractual Teachers 17
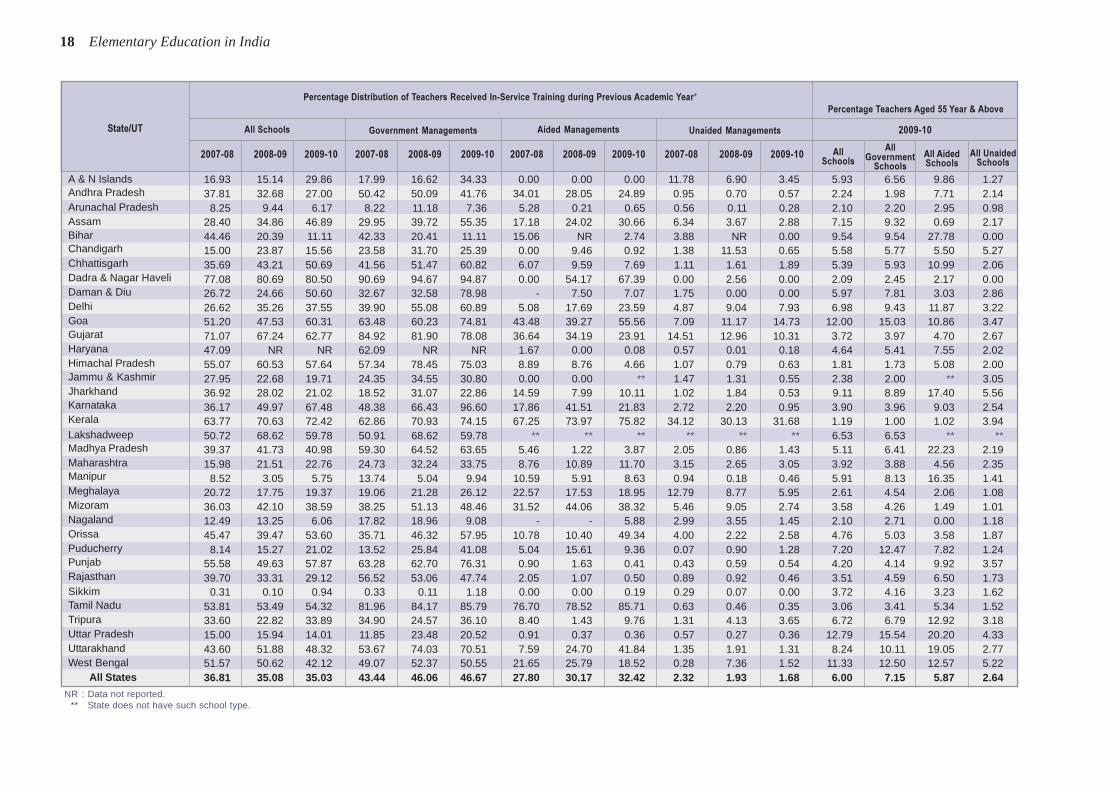
62. Percentage Distribution of Teachers Received In-Service Training 18
63. Percentage of Teachers Aged 55 Year & Above 18
64. Percentage Teachers Involved in Non-Teaching Assignments to Total Teachers 19
65. Percentage Distribution of Contractual-Teachers to Total Teachers 19
Enrolment-Based Indicators
66. Enrolment 20-21
67. Percentage of CWSN Enrolment to Total Enrolment in Elementary Classes 22
68. Percentage of Girls’ Enrolment 22
69. Gender Parity Index 22
70. Percentage of Enrolment in Schools with Student-Classroom Ratio above 60 23
71. Percentage Under-age Children 23
PAGE NO.PAGE NO.PAGE NO.PAGE NO.PAGE NO.
72 Percentage Over-age Children 23
73. Percentage Share of Enrolment in Pre-primary Classes to Total Enrolment inPrimary Classes 23
74. Percentage of SC Population & Enrolment 24
75. Figures 1 to 28 25-31
76. Percentage of ST Population & Enrolment 32
77. Percentage of OBC Enrolment 32-33
78. Percentage of Muslim Population & Enrolment 34
79. Ratio of Grade V to Grade I Enrolment 35
80. Transition Rate from Primary to Upper Primary Level 35
81. Average Repetition Rate 35
82. Average Drop-out Rate at Primary Level 35
83. Retention Rate at Primary Level 36
84. Gross Completion Rate at Primary Level 36
85. Gross Enrolment Ratio: Primary Level 36
86. Net Enrolment Ratio: Primary Level 36
87. Enrolment Ratio at Upper Primary Level 37
88. Students’ Perfomance: Grade IV/V 37
89. Students’ Perfomance: Grade VII/VIII 37
Educational Development Index
90. Variables used in Computing Educational Development Index 41
91. Assumptions used in Computing EDI 42
92. Educational Development Index : Primary Level 43-44
93. Educational Development Index : Upper Primary Level 45-46
94. Composite Educational Development Index 47
Disclaimer
Raw data presented in the document or used for calculating indicators are essentiallybased on data provided by the States and UTs through annual data collection (as on 30th
September 2009) under SSA (DISE). NUEPA is committed to provide professional andsoftware support to all States and UTs as well as for dissemination and analysis of dataas it is provided by the individual States and UTs.
In no way, NUEPA is involved in data collection as such and therefore the accuracy andtruthfulness of the data rest with the States/UTs. The State Project Directors have certifiedthat data is free from errors and inconsistencies and hence may be merged into the nationaldatabase maintained at NUEPA, New Delhi.
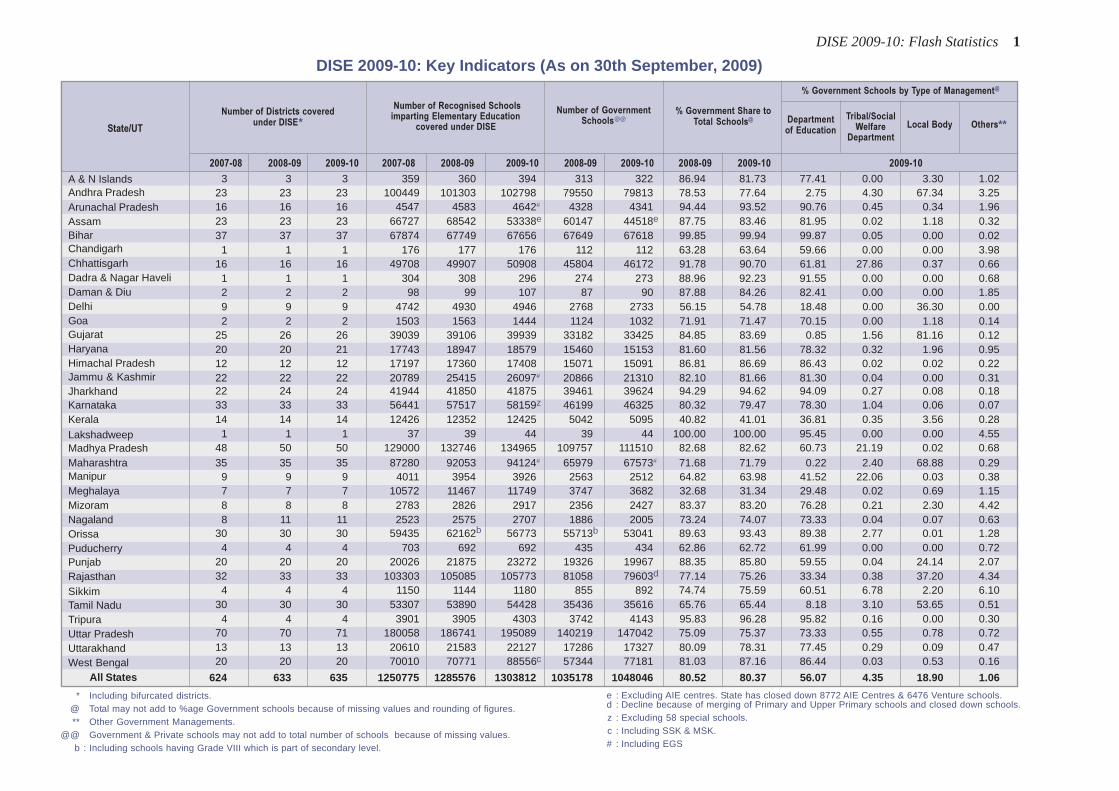
DISE 2009-10: Flash Statistics 1
A & N IslandsAndhra PradeshArunachal PradeshAssamBiharChandigarhChhattisgarhDadra & Nagar HaveliDaman & DiuDelhiGoaGujaratHaryanaHimachal PradeshJammu & KashmirJharkhandKarnatakaKeralaLakshadweepMadhya PradeshMaharashtraManipurMeghalayaMizoramNagalandOrissaPuducherryPunjabRajasthanSikkimTamil NaduTripuraUttar PradeshUttarakhandWest Bengal
All States
State/UT
DISE 2009-10: Key Indicators (As on 30th September, 2009)
3 3 3 359 360 394 313 322 86.94 81.73 77.41 0.00 3.30 1.0223 23 23 100449 101303 102798 79550 79813 78.53 77.64 2.75 4.30 67.34 3.2516 16 16 4547 4583 4642# 4328 4341 94.44 93.52 90.76 0.45 0.34 1.9623 23 23 66727 68542 53338e 60147 44518e 87.75 83.46 81.95 0.02 1.18 0.3237 37 37 67874 67749 67656 67649 67618 99.85 99.94 99.87 0.05 0.00 0.02
1 1 1 176 177 176 112 112 63.28 63.64 59.66 0.00 0.00 3.9816 16 16 49708 49907 50908 45804 46172 91.78 90.70 61.81 27.86 0.37 0.66
1 1 1 304 308 296 274 273 88.96 92.23 91.55 0.00 0.00 0.682 2 2 98 99 107 87 90 87.88 84.26 82.41 0.00 0.00 1.859 9 9 4742 4930 4946 2768 2733 56.15 54.78 18.48 0.00 36.30 0.002 2 2 1503 1563 1444 1124 1032 71.91 71.47 70.15 0.00 1.18 0.14
25 26 26 39039 39106 39939 33182 33425 84.85 83.69 0.85 1.56 81.16 0.1220 20 21 17743 18947 18579 15460 15153 81.60 81.56 78.32 0.32 1.96 0.9512 12 12 17197 17360 17408 15071 15091 86.81 86.69 86.43 0.02 0.02 0.2222 22 22 20789 25415 26097# 20866 21310 82.10 81.66 81.30 0.04 0.00 0.3122 24 24 41944 41850 41875 39461 39624 94.29 94.62 94.09 0.27 0.08 0.1833 33 33 56441 57517 58159z 46199 46325 80.32 79.47 78.30 1.04 0.06 0.0714 14 14 12426 12352 12425 5042 5095 40.82 41.01 36.81 0.35 3.56 0.28
1 1 1 37 39 44 39 44 100.00 100.00 95.45 0.00 0.00 4.5548 50 50 129000 132746 134965 109757 111510 82.68 82.62 60.73 21.19 0.02 0.6835 35 35 87280 92053 94124# 65979 67573# 71.68 71.79 0.22 2.40 68.88 0.29
9 9 9 4011 3954 3926 2563 2512 64.82 63.98 41.52 22.06 0.03 0.387 7 7 10572 11467 11749 3747 3682 32.68 31.34 29.48 0.02 0.69 1.158 8 8 2783 2826 2917 2356 2427 83.37 83.20 76.28 0.21 2.30 4.428 11 11 2523 2575 2707 1886 2005 73.24 74.07 73.33 0.04 0.07 0.63
30 30 30 59435 62162b 56773 55713b 53041 89.63 93.43 89.38 2.77 0.01 1.284 4 4 703 692 692 435 434 62.86 62.72 61.99 0.00 0.00 0.72
20 20 20 20026 21875 23272 19326 19967 88.35 85.80 59.55 0.04 24.14 2.0732 33 33 103303 105085 105773 81058 79603d 77.14 75.26 33.34 0.38 37.20 4.34
4 4 4 1150 1144 1180 855 892 74.74 75.59 60.51 6.78 2.20 6.1030 30 30 53307 53890 54428 35436 35616 65.76 65.44 8.18 3.10 53.65 0.51
4 4 4 3901 3905 4303 3742 4143 95.83 96.28 95.82 0.16 0.00 0.3070 70 71 180058 186741 195089 140219 147042 75.09 75.37 73.33 0.55 0.78 0.7213 13 13 20610 21583 22127 17286 17327 80.09 78.31 77.45 0.29 0.09 0.4720 20 20 70010 70771 88556c 57344 77181 81.03 87.16 86.44 0.03 0.53 0.16
624 633 635 1250775 1285576 1303812 1035178 1048046 80.52 80.37 56.07 4.35 18.90 1.06
Number of Districts coveredunder DISE*
Number of Recognised Schoolsimparting Elementary Education
covered under DISE
Number of GovernmentSchools@@
% Government Share toTotal Schools@
% Government Schools by Type of Management@
Others**Departmentof Education
Tribal/SocialWelfare
Department
Local Body
2007-08 2008-09 2009-10 2007-08 2008-09 2009-10 2008-09 2009-10 2008-09 2009-10 2009-10
* Including bifurcated districts.@ Total may not add to %age Government schools because of missing values and rounding of figures.** Other Government Managements.
@@ Government & Private schools may not add to total number of schools because of missing values.b : Including schools having Grade VIII which is part of secondary level.
e : Excluding AIE centres. State has closed down 8772 AIE Centres & 6476 Venture schools.d : Decline because of merging of Primary and Upper Primary schools and closed down schools.z : Excluding 58 special schools.c : Including SSK & MSK.# : Including EGS

2 Elementary Education in India
A & N IslandsAndhra PradeshArunachal PradeshAssamBiharChandigarhChhattisgarhDadra & Nagar HaveliDaman & DiuDelhiGoaGujaratHaryanaHimachal PradeshJammu & KashmirJharkhandKarnatakaKeralaLakshadweepMadhya PradeshMaharashtraManipurMeghalayaMizoramNagalandOrissaPuducherryPunjabRajasthanSikkimTamil NaduTripuraUttar PradeshUttarakhandWest Bengal
All States
State/UT
2008-09 2009-10 2007-08 2008-09 2009-10 2009-10 2009-10 2007-08 2008-09 2009-10
46 72 11.70 12.78 18.27 0.51 17.77 199 200 233 17 621753 22985 21.03 21.47 22.36 3.33 19.03 65352 68187 68927# 6740 3517
255 300 4.75 5.56 6.46 1.77 4.70 3677 3498 3481 2465 1228395 8820 19.15 12.25 16.54 12.72 3.82 50655 50756 38910# 5179 50
93 14d 1.82 0.14 0.02d 0.01 0.01 49868 47637 43679 16133 42665 64 37.50 36.72 36.36 3.98 32.39 28 24 17 7 6
4060 4642 7.95 8.14 9.12 0.98 8.14 32780 34287 33442 4597 747021 23 6.25 6.82 7.77 3.72 4.05 177 174 172 88 812 17 10.20 12.12 15.74 3.70 12.04 51 44 48 3 0
2162 2213 37.12 43.85 44.36 5.17 39.19 2454 2563 2580 102 68436 411 27.21 27.90 28.46 24.79 3.67 1013 1064 1007 4 1
5924 6513 15.18 15.15 16.31 2.27 14.03 12775 11362 11062 2521 8553480 3424 16.95 18.37 18.43 2.21 16.22 9503 9820 9772 551 4942289 2317 12.93 13.19 13.31 0.20 13.11 11515 11515 11403 334 13184549 4786 20.62 17.90 18.34 0.00 18.34 11782 15443 14719 8467 4702082 2250 5.06 4.97 5.37 3.04 2.33 28802 27744 26149 16960 937
11318 11834 19.17 19.68 20.38 4.46 15.92 28871 26641 26252 4216 6667302 7327 58.84 59.12 58.97 54.45 4.52 6704 6656 6685 22 15
0 0 0.00 0.00 0.00 0.00 0.00 16 16 20 8 422989 23455 17.51 17.32 17.38 0.88 16.50 90092 90916 91204 5435 780126069 26551 29.27 28.32 28.21 19.36 8.84 40960 44835 470573# 6256 8641391 1414 34.68 35.18 36.02 14.57 21.45 2564 2516 2389 39 57693 8057 62.15 67.09 68.58 59.59 8.99 7867 8469 8243 141 184
466 486 17.28 16.49 16.66 1.75 14.91 1512 1504 1526 284 239689 702 26.48 26.76 25.93 0.07 25.86 1591 1598 1681 140 50
6447 3732 9.70 10.37 6.57b 3.25 3.33 34286 35108 35265 7938 353257 258 36.98 37.14 37.28 4.77 32.51 306 296 299 12 0
2549 3303 7.58 11.65 14.19 2.14 12.06 13409 14026 14160 424 84924027 24767 22.00 22.86 23.42 0.78 22.63 57332 50934e 50275 13607 1826
288 288 24.17 25.17 24.41 4.41 20.00 804 795 768 85 218454 18812 33.71 34.24 34.56 15.48 19.09 34835 34245 33840 1908 1214
163 160 4.15 4.17 3.72 1.12 2.60 2154 2104 2390 1127 4546474 48019 24.71 24.89 24.61 3.97 20.65 128111 129526 132297 17886 251604295 4800 17.66 19.90 21.69 2.40 19.30 14665 15171 15344 1543 1247
13427 11362 17.89 18.97 12.83 0.84 11.99 58957 59434 74678 6970 2448
249920 254178 19.50 19.44 19.49 5.46 14.04 805667 809108 809974 132209 58720
% Private Share to Total Schools@
% Private Schools by Type of
Managementc
Private UnaidedPrivate Aided
Number of Primary Schools covered under DISE
Number of Government SchoolsOpened during the period
2002-03 to 2009-10Number of Private Schools@@
c : Total may not add to %age Private Schools because of rounding of figures.d : Incomplete Coverage.# : Including EGS.
#
e : Number declined because of upgradation of a few primary schools.b : Including schools having Grade VIII which is part of secondary level.
@ Total may not add to 100 because of missing values and rounding of figures.@@ Government & Private schools may not add to total number of schools because of missing values.
Upper PrimarySchools/Sections
PrimarySchools/Sections
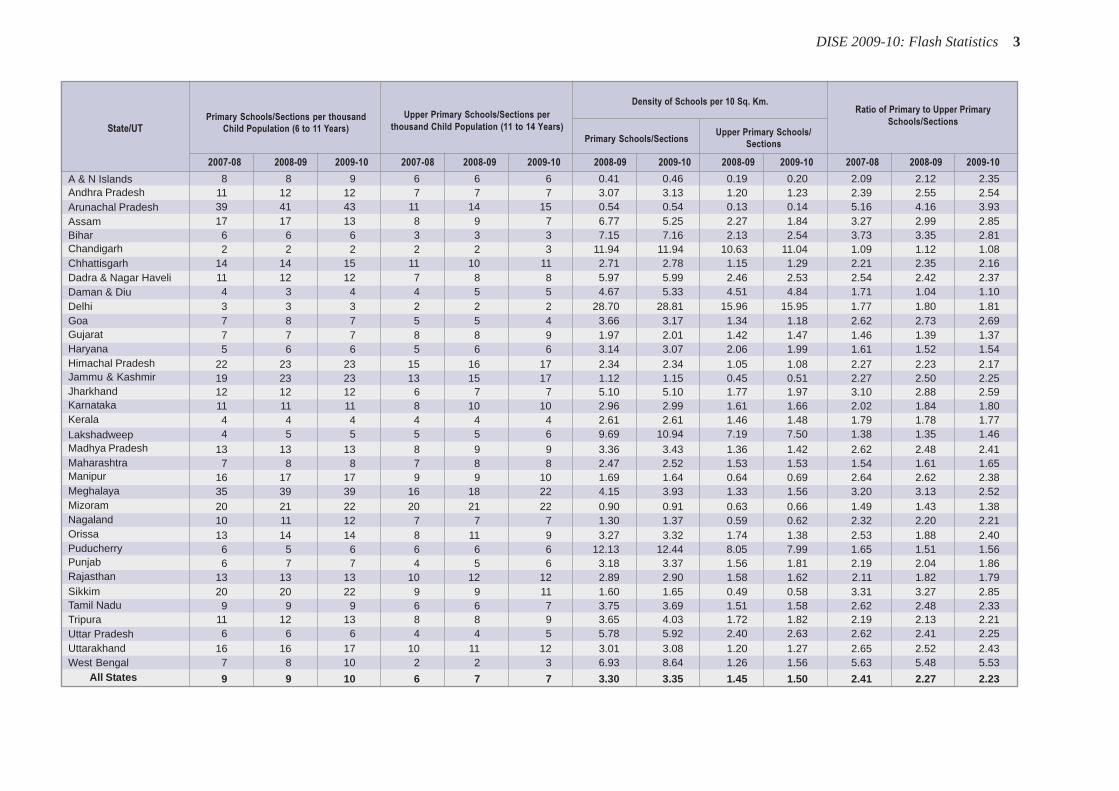
DISE 2009-10: Flash Statistics 3
A & N IslandsAndhra PradeshArunachal PradeshAssamBiharChandigarhChhattisgarhDadra & Nagar HaveliDaman & DiuDelhiGoaGujaratHaryanaHimachal PradeshJammu & KashmirJharkhandKarnatakaKeralaLakshadweepMadhya PradeshMaharashtraManipurMeghalayaMizoramNagalandOrissaPuducherryPunjabRajasthanSikkimTamil NaduTripuraUttar PradeshUttarakhandWest Bengal
All States
State/UT
Primary Schools/Sections per thousand
Child Population (6 to 11 Years)
Upper Primary Schools/Sections per
thousand Child Population (11 to 14 Years)
8 8 9 6 6 6 0.41 0.46 0.19 0.20 2.09 2.12 2.3511 12 12 7 7 7 3.07 3.13 1.20 1.23 2.39 2.55 2.5439 41 43 11 14 15 0.54 0.54 0.13 0.14 5.16 4.16 3.9317 17 13 8 9 7 6.77 5.25 2.27 1.84 3.27 2.99 2.856 6 6 3 3 3 7.15 7.16 2.13 2.54 3.73 3.35 2.812 2 2 2 2 3 11.94 11.94 10.63 11.04 1.09 1.12 1.08
14 14 15 11 10 11 2.71 2.78 1.15 1.29 2.21 2.35 2.1611 12 12 7 8 8 5.97 5.99 2.46 2.53 2.54 2.42 2.374 3 4 4 5 5 4.67 5.33 4.51 4.84 1.71 1.04 1.103 3 3 2 2 2 28.70 28.81 15.96 15.95 1.77 1.80 1.817 8 7 5 5 4 3.66 3.17 1.34 1.18 2.62 2.73 2.697 7 7 8 8 9 1.97 2.01 1.42 1.47 1.46 1.39 1.375 6 6 5 6 6 3.14 3.07 2.06 1.99 1.61 1.52 1.54
22 23 23 15 16 17 2.34 2.34 1.05 1.08 2.27 2.23 2.1719 23 23 13 15 17 1.12 1.15 0.45 0.51 2.27 2.50 2.2512 12 12 6 7 7 5.10 5.10 1.77 1.97 3.10 2.88 2.5911 11 11 8 10 10 2.96 2.99 1.61 1.66 2.02 1.84 1.804 4 4 4 4 4 2.61 2.61 1.46 1.48 1.79 1.78 1.774 5 5 5 5 6 9.69 10.94 7.19 7.50 1.38 1.35 1.46
13 13 13 8 9 9 3.36 3.43 1.36 1.42 2.62 2.48 2.417 8 8 7 8 8 2.47 2.52 1.53 1.53 1.54 1.61 1.65
16 17 17 9 9 10 1.69 1.64 0.64 0.69 2.64 2.62 2.3835 39 39 16 18 22 4.15 3.93 1.33 1.56 3.20 3.13 2.5220 21 22 20 21 22 0.90 0.91 0.63 0.66 1.49 1.43 1.3810 11 12 7 7 7 1.30 1.37 0.59 0.62 2.32 2.20 2.2113 14 14 8 11 9 3.27 3.32 1.74 1.38 2.53 1.88 2.406 5 6 6 6 6 12.13 12.44 8.05 7.99 1.65 1.51 1.566 7 7 4 5 6 3.18 3.37 1.56 1.81 2.19 2.04 1.86
13 13 13 10 12 12 2.89 2.90 1.58 1.62 2.11 1.82 1.7920 20 22 9 9 11 1.60 1.65 0.49 0.58 3.31 3.27 2.859 9 9 6 6 7 3.75 3.69 1.51 1.58 2.62 2.48 2.33
11 12 13 8 8 9 3.65 4.03 1.72 1.82 2.19 2.13 2.216 6 6 4 4 5 5.78 5.92 2.40 2.63 2.62 2.41 2.25
16 16 17 10 11 12 3.01 3.08 1.20 1.27 2.65 2.52 2.437 8 10 2 2 3 6.93 8.64 1.26 1.56 5.63 5.48 5.53
9 9 10 6 7 7 3.30 3.35 1.45 1.50 2.41 2.27 2.23
Density of Schools per 10 Sq. Km.
Primary Schools/SectionsUpper Primary Schools/
Sections
Ratio of Primary to Upper Primary
Schools/Sections
2007-08 2008-09 2009-10 2007-08 2008-09 2009-10 2008-09 2009-10 2008-09 2009-10 2007-08 2008-09 2009-10
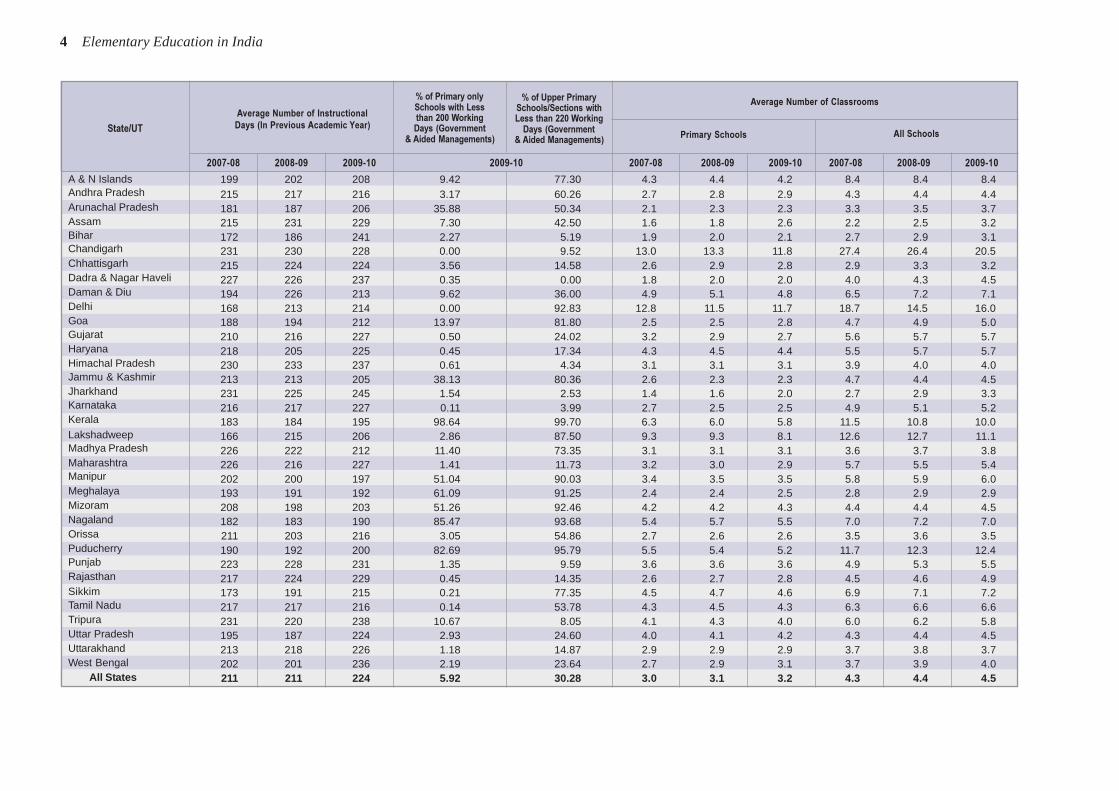
4 Elementary Education in India
A & N IslandsAndhra PradeshArunachal PradeshAssamBiharChandigarhChhattisgarhDadra & Nagar HaveliDaman & DiuDelhiGoaGujaratHaryanaHimachal PradeshJammu & KashmirJharkhandKarnatakaKeralaLakshadweepMadhya PradeshMaharashtraManipurMeghalayaMizoramNagalandOrissaPuducherryPunjabRajasthanSikkimTamil NaduTripuraUttar PradeshUttarakhandWest Bengal
All States
State/UT
2007-08 2008-09 2009-10 2009-10 2007-08 2008-09 2009-10 2007-08 2008-09 2009-10
199 202 208 9.42 77.30 4.3 4.4 4.2 8.4 8.4 8.4215 217 216 3.17 60.26 2.7 2.8 2.9 4.3 4.4 4.4181 187 206 35.88 50.34 2.1 2.3 2.3 3.3 3.5 3.7215 231 229 7.30 42.50 1.6 1.8 2.6 2.2 2.5 3.2172 186 241 2.27 5.19 1.9 2.0 2.1 2.7 2.9 3.1231 230 228 0.00 9.52 13.0 13.3 11.8 27.4 26.4 20.5215 224 224 3.56 14.58 2.6 2.9 2.8 2.9 3.3 3.2227 226 237 0.35 0.00 1.8 2.0 2.0 4.0 4.3 4.5194 226 213 9.62 36.00 4.9 5.1 4.8 6.5 7.2 7.1168 213 214 0.00 92.83 12.8 11.5 11.7 18.7 14.5 16.0188 194 212 13.97 81.80 2.5 2.5 2.8 4.7 4.9 5.0210 216 227 0.50 24.02 3.2 2.9 2.7 5.6 5.7 5.7218 205 225 0.45 17.34 4.3 4.5 4.4 5.5 5.7 5.7230 233 237 0.61 4.34 3.1 3.1 3.1 3.9 4.0 4.0213 213 205 38.13 80.36 2.6 2.3 2.3 4.7 4.4 4.5231 225 245 1.54 2.53 1.4 1.6 2.0 2.7 2.9 3.3216 217 227 0.11 3.99 2.7 2.5 2.5 4.9 5.1 5.2183 184 195 98.64 99.70 6.3 6.0 5.8 11.5 10.8 10.0166 215 206 2.86 87.50 9.3 9.3 8.1 12.6 12.7 11.1226 222 212 11.40 73.35 3.1 3.1 3.1 3.6 3.7 3.8226 216 227 1.41 11.73 3.2 3.0 2.9 5.7 5.5 5.4202 200 197 51.04 90.03 3.4 3.5 3.5 5.8 5.9 6.0193 191 192 61.09 91.25 2.4 2.4 2.5 2.8 2.9 2.9208 198 203 51.26 92.46 4.2 4.2 4.3 4.4 4.4 4.5182 183 190 85.47 93.68 5.4 5.7 5.5 7.0 7.2 7.0211 203 216 3.05 54.86 2.7 2.6 2.6 3.5 3.6 3.5190 192 200 82.69 95.79 5.5 5.4 5.2 11.7 12.3 12.4223 228 231 1.35 9.59 3.6 3.6 3.6 4.9 5.3 5.5217 224 229 0.45 14.35 2.6 2.7 2.8 4.5 4.6 4.9173 191 215 0.21 77.35 4.5 4.7 4.6 6.9 7.1 7.2217 217 216 0.14 53.78 4.3 4.5 4.3 6.3 6.6 6.6231 220 238 10.67 8.05 4.1 4.3 4.0 6.0 6.2 5.8195 187 224 2.93 24.60 4.0 4.1 4.2 4.3 4.4 4.5213 218 226 1.18 14.87 2.9 2.9 2.9 3.7 3.8 3.7202 201 236 2.19 23.64 2.7 2.9 3.1 3.7 3.9 4.0211 211 224 5.92 30.28 3.0 3.1 3.2 4.3 4.4 4.5
Primary Schools
Average Number of Classrooms
All Schools
Average Number of Instructional
Days (In Previous Academic Year)
% of Primary onlySchools with Lessthan 200 WorkingDays (Government
& Aided Managements)
% of Upper PrimarySchools/Sections withLess than 220 Working
Days (Government& Aided Managements)

DISE 2009-10: Flash Statistics 5
A & N IslandsAndhra PradeshArunachal PradeshAssamBiharChandigarhChhattisgarhDadra & Nagar HaveliDaman & DiuDelhiGoaGujaratHaryanaHimachal PradeshJammu & KashmirJharkhandKarnatakaKeralaLakshadweepMadhya PradeshMaharashtraManipurMeghalayaMizoramNagalandOrissaPuducherryPunjabRajasthanSikkimTamil NaduTripuraUttar PradeshUttarakhandWest Bengal
All States
State/UT
7.9 8.5 11.9 8.4 19 19 17 14 13 0 0 8.31 6.08 8.18 4.3533.0 2.9 9.6 9.4 26 25 24 27 26 0 0 32.00 31.13 19.55 19.95
3.2 3.4 9.3 9.1 21 20 19 16 15 0 0 17.58 13.93 16.96 16.472.3 3.1 3.8 4.1 39 35 30 36 28 16 10 51.96 41.60 43.93 41.762.9 3.1 5.5 11.2 96 96 89 98 88 37 37 71.57 74.19 88.30 89.86
21.9 16.5 34.1 27.5 28 30 40 33 39 1 1 45.93 68.60 36.60 61.013.0 2.8 6.4 6.7 30 28 28 29 29 5 6 36.62 33.81 22.20 23.644.0 4.0 10.4 10.5 41 39 39 34 31 1 1 53.24 61.90 62.81 67.745.9 5.3 16.0 16.9 32 36 34 37 38 2 2 47.37 53.85 40.00 36.67
14.9 16.2 14.0 15.5 28 37 34 36 36 9 7 60.95 56.43 56.61 35.412.9 2.8 10.2 10.7 22 23 25 18 21 0 0 14.69 15.78 18.51 16.745.3 5.2 8.4 8.5 35 34 34 29 27 23 22 50.49 48.76 40.91 39.434.8 4.8 9.8 9.8 30 30 32 34 35 12 12 47.10 48.45 29.43 30.973.2 3.2 9.0 9.5 16 15 15 14 13 0 0 5.86 4.87 12.81 11.873.0 3.1 10.6 10.5 17 17 17 16 15 0 0 18.02 16.76 14.54 14.342.7 3.1 7.3 7.7 60 54 47 57 43 24 23 58.04 58.92 71.10 65.584.2 4.3 8.6 8.9 29 27 25 18 16 12 4 28.29 23.78 30.59 24.79
10.0 9.1 11.4 10.6 25 25 27 24 24 2 2 27.76 27.04 21.29 25.8512.7 11.1 * * 24 22 22 25 24 0 0 22.58 14.29 4.35 8.33
3.1 3.1 6.7 7.1 33 31 30 32 30 29 25 44.58 41.18 33.44 33.534.1 4.0 9.1 9.0 32 31 31 30 30 17 18 33.58 32.61 29.28 29.004.5 4.5 8.5 8.8 21 19 20 17 17 0 0 14.20 14.79 11.75 10.872.6 2.6 3.1 3.1 19 18 18 17 17 0 0 16.14 16.13 10.97 10.903.9 4.0 7.2 6.9 19 19 19 16 16 0 0 13.23 11.20 16.01 15.005.7 5.5 11.3 11.3 22 22 21 15 15 0 0 15.46 15.26 24.87 24.953.5 3.4 4.4 5.1 30 30 30 28 26 11 1 38.26 35.74 35.69 41.729.2 8.9 17.6 18.3 22 21 21 21 20 0 0 19.77 16.99 9.34 8.404.3 4.2 13.0 13.2 26 24 23 26 25 1 0 29.35 25.19 20.51 14.583.8 3.9 7.6 8.0 26 25 24 24 22 4 1 29.60 25.86 23.41 19.927.2 7.2 7.0 7.2 15 15 15 11 10 0 0 5.18 4.43 7.47 5.344.9 4.8 9.9 10.0 29 28 27 22 23 8 6 29.22 26.87 38.08 32.676.0 5.6 12.1 11.7 29 28 27 18 17 2 1 32.46 27.67 43.86 36.913.9 4.0 6.0 6.0 41 39 36 43 39 66 65 66.53 60.39 33.58 30.433.1 3.0 6.3 6.3 20 20 19 21 20 2 2 18.26 15.82 12.32 12.354.3 3.8 2.2 5.3 51 47 42 41 37 18 18 52.36 56.60 66.60 70.223.6 3.7 7.5 7.8 35 33 32 35 32 302 274 42.86 40.63 34.17 33.17
2008-09 2009-10 2008-09 2009-10 2007-08 2008-09 2009-10 2008-09 2009-10 2008-09 2009-10 2008-09 2009-10 2008-09 2009-10
All Government
SchoolsAll Private Schools
Average Student-Classroom Ratio (SCR)Average Number of Classrooms
All Schools Primary Schools
Number of Districtswhere SCR is Above
30 : All Schools
% Schools with SCR
> 30 Primary Level
* : State does not have such school type.
Schools with SCR > 35
Upper Primary Level

6 Elementary Education in India
A & N IslandsAndhra PradeshArunachal PradeshAssamBiharChandigarhChhattisgarhDadra & Nagar HaveliDaman & DiuDelhiGoaGujaratHaryanaHimachal PradeshJammu & KashmirJharkhandKarnatakaKeralaLakshadweepMadhya PradeshMaharashtraManipurMeghalayaMizoramNagalandOrissaPuducherryPunjabRajasthanSikkimTamil NaduTripuraUttar PradeshUttarakhandWest Bengal
All States
State/UT
% Single-Teacher Schools%age Distribution of Primary
Only Schools having Enrolment
150 & Above and have Head
Master/Teacher
%age Distribution of Upper
Primary Schools/Sections having
Enrolment 100 & Above and have
Head Master/Teacher
2008-09 2009-10 2008-09 2009-10 2007-08 2008-09 2009-10 2008-09 2009-10
73.33 41.67 51.22 74.19 0.56 2.78 4.06 5.00 6.8718.21 18.32 31.10 39.02 7.34 9.02 13.72 13.28 19.7326.26 17.17 35.85 31.77 54.41 50.23 49.25 63.98 65.1278.49 74.12 82.60 80.48 26.88 24.87 12.13 33.31 16.4255.26 53.33 42.76 39.93 6.37 4.93 5.44 6.22 7.2647.62 40.00 44.37 48.41 0.00 0.00 0.00 0.00 0.0014.86 44.59 24.61 33.47 14.74 12.22 11.03 15.18 12.8420.00 25.00 28.97 27.19 22.70 22.08 19.59 38.51 33.7294.12 57.89 35.90 45.00 0.00 0.00 1.87 0.00 4.1789.96 90.84 80.93 87.01 0.00 0.06 0.06 0.12 0.0834.33 49.44 35.89 29.50 23.82 21.37 24.58 31.20 35.2593.64 100.50 93.15 90.52 1.97 2.07 1.42 5.54 3.4747.89 49.19 50.39 50.56 3.44 3.08 4.17 4.23 5.9683.23 91.54 39.31 38.21 7.28 9.45 6.15 13.43 8.7257.63 54.69 79.60 72.93 4.30 12.73 12.18# 20.79 21.04#
27.27 25.92 33.79 28.62 8.24 7.41 8.02 10.24 11.2312.32 40.92 14.79 69.45 10.84 8.09 7.44 16.31 15.5092.04 99.06 64.85 64.56 0.27 0.66 0.63 0.65 0.6783.33 90.91 28.57 52.38 0.00 0.00 0.00 0.00 0.0025.90 24.68 49.25 48.68 15.42 14.63 14.15 17.44 16.7361.88 63.91 54.80 54.15 3.77 7.24 4.46 14.21 8.4872.04 73.56 67.19 65.14 11.42 11.58 12.18 18.00 18.0085.50 77.98 75.98 65.77 13.86 13.46 11.34 18.05 12.1167.74 65.82 70.33 64.92 2.41 1.80 2.78 0.93 3.4170.86 79.07 65.10 65.15 2.38 2.37 3.73 3.69 5.5355.09 47.57 44.94 36.23 11.12 7.41 12.27# 12.22 17.99#
82.54 72.41 83.05 70.09 1.85 0.00 0.29 0.00 0.3355.12 44.95 28.73 26.10 8.14 5.50 3.39 8.12 5.4058.45 58.83 66.87 69.42 21.74 16.27 17.17 31.42 33.7979.17 83.33 60.27 66.15 0.70 0.35 1.02 0.50 1.5688.07 88.00 63.28 62.09 2.83 2.16 2.34 3.11 3.3239.31 37.95 38.08 46.11 0.82 0.92 1.02 1.19 1.5174.20 72.68 76.02 73.30 6.07 7.49 7.87 3.65 2.7179.71 85.70 46.33 44.82 14.46 14.95 12.55 19.85 16.3073.03 68.97 53.99 48.87 3.23 4.08 5.70 4.75 6.49
61.10 60.92 54.90 57.71 10.13 9.71 9.33 13.25 12.26
All Schools Primary Schools
# : Including EGS.
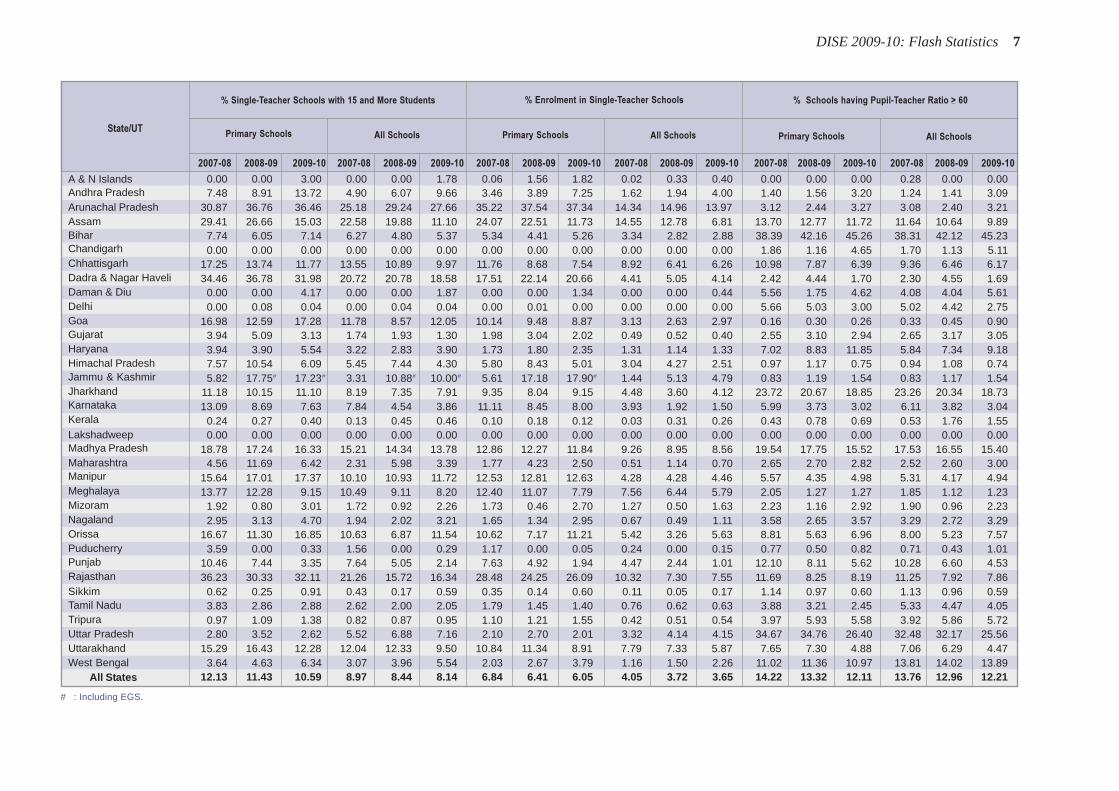
DISE 2009-10: Flash Statistics 7
A & N IslandsAndhra PradeshArunachal PradeshAssamBiharChandigarhChhattisgarhDadra & Nagar HaveliDaman & DiuDelhiGoaGujaratHaryanaHimachal PradeshJammu & KashmirJharkhandKarnatakaKeralaLakshadweepMadhya PradeshMaharashtraManipurMeghalayaMizoramNagalandOrissaPuducherryPunjabRajasthanSikkimTamil NaduTripuraUttar PradeshUttarakhandWest Bengal
All States
State/UT
2007-08 2008-09 2009-10 2007-08 2008-09 2009-10 2007-08 2008-09 2009-10 2007-08 2008-09 2009-10 2007-08 2008-09 2009-10 2007-08 2008-09 2009-10
% Single-Teacher Schools with 15 and More Students % Enrolment in Single-Teacher Schools
Primary Schools All Schools Primary Schools All Schools
% Schools having Pupil-Teacher Ratio > 60
Primary Schools All Schools
0.00 0.00 3.00 0.00 0.00 1.78 0.06 1.56 1.82 0.02 0.33 0.40 0.00 0.00 0.00 0.28 0.00 0.007.48 8.91 13.72 4.90 6.07 9.66 3.46 3.89 7.25 1.62 1.94 4.00 1.40 1.56 3.20 1.24 1.41 3.09
30.87 36.76 36.46 25.18 29.24 27.66 35.22 37.54 37.34 14.34 14.96 13.97 3.12 2.44 3.27 3.08 2.40 3.2129.41 26.66 15.03 22.58 19.88 11.10 24.07 22.51 11.73 14.55 12.78 6.81 13.70 12.77 11.72 11.64 10.64 9.89
7.74 6.05 7.14 6.27 4.80 5.37 5.34 4.41 5.26 3.34 2.82 2.88 38.39 42.16 45.26 38.31 42.12 45.230.00 0.00 0.00 0.00 0.00 0.00 0.00 0.00 0.00 0.00 0.00 0.00 1.86 1.16 4.65 1.70 1.13 5.11
17.25 13.74 11.77 13.55 10.89 9.97 11.76 8.68 7.54 8.92 6.41 6.26 10.98 7.87 6.39 9.36 6.46 6.1734.46 36.78 31.98 20.72 20.78 18.58 17.51 22.14 20.66 4.41 5.05 4.14 2.42 4.44 1.70 2.30 4.55 1.69
0.00 0.00 4.17 0.00 0.00 1.87 0.00 0.00 1.34 0.00 0.00 0.44 5.56 1.75 4.62 4.08 4.04 5.610.00 0.08 0.04 0.00 0.04 0.04 0.00 0.01 0.00 0.00 0.00 0.00 5.66 5.03 3.00 5.02 4.42 2.75
16.98 12.59 17.28 11.78 8.57 12.05 10.14 9.48 8.87 3.13 2.63 2.97 0.16 0.30 0.26 0.33 0.45 0.903.94 5.09 3.13 1.74 1.93 1.30 1.98 3.04 2.02 0.49 0.52 0.40 2.55 3.10 2.94 2.65 3.17 3.053.94 3.90 5.54 3.22 2.83 3.90 1.73 1.80 2.35 1.31 1.14 1.33 7.02 8.83 11.85 5.84 7.34 9.187.57 10.54 6.09 5.45 7.44 4.30 5.80 8.43 5.01 3.04 4.27 2.51 0.97 1.17 0.75 0.94 1.08 0.745.82 17.75# 17.23# 3.31 10.88# 10.00# 5.61 17.18 17.90# 1.44 5.13 4.79 0.83 1.19 1.54 0.83 1.17 1.54
11.18 10.15 11.10 8.19 7.35 7.91 9.35 8.04 9.15 4.48 3.60 4.12 23.72 20.67 18.85 23.26 20.34 18.7313.09 8.69 7.63 7.84 4.54 3.86 11.11 8.45 8.00 3.93 1.92 1.50 5.99 3.73 3.02 6.11 3.82 3.04
0.24 0.27 0.40 0.13 0.45 0.46 0.10 0.18 0.12 0.03 0.31 0.26 0.43 0.78 0.69 0.53 1.76 1.550.00 0.00 0.00 0.00 0.00 0.00 0.00 0.00 0.00 0.00 0.00 0.00 0.00 0.00 0.00 0.00 0.00 0.00
18.78 17.24 16.33 15.21 14.34 13.78 12.86 12.27 11.84 9.26 8.95 8.56 19.54 17.75 15.52 17.53 16.55 15.404.56 11.69 6.42 2.31 5.98 3.39 1.77 4.23 2.50 0.51 1.14 0.70 2.65 2.70 2.82 2.52 2.60 3.00
15.64 17.01 17.37 10.10 10.93 11.72 12.53 12.81 12.63 4.28 4.28 4.46 5.57 4.35 4.98 5.31 4.17 4.9413.77 12.28 9.15 10.49 9.11 8.20 12.40 11.07 7.79 7.56 6.44 5.79 2.05 1.27 1.27 1.85 1.12 1.23
1.92 0.80 3.01 1.72 0.92 2.26 1.73 0.46 2.70 1.27 0.50 1.63 2.23 1.16 2.92 1.90 0.96 2.232.95 3.13 4.70 1.94 2.02 3.21 1.65 1.34 2.95 0.67 0.49 1.11 3.58 2.65 3.57 3.29 2.72 3.29
16.67 11.30 16.85 10.63 6.87 11.54 10.62 7.17 11.21 5.42 3.26 5.63 8.81 5.63 6.96 8.00 5.23 7.573.59 0.00 0.33 1.56 0.00 0.29 1.17 0.00 0.05 0.24 0.00 0.15 0.77 0.50 0.82 0.71 0.43 1.01
10.46 7.44 3.35 7.64 5.05 2.14 7.63 4.92 1.94 4.47 2.44 1.01 12.10 8.11 5.62 10.28 6.60 4.5336.23 30.33 32.11 21.26 15.72 16.34 28.48 24.25 26.09 10.32 7.30 7.55 11.69 8.25 8.19 11.25 7.92 7.86
0.62 0.25 0.91 0.43 0.17 0.59 0.35 0.14 0.60 0.11 0.05 0.17 1.14 0.97 0.60 1.13 0.96 0.593.83 2.86 2.88 2.62 2.00 2.05 1.79 1.45 1.40 0.76 0.62 0.63 3.88 3.21 2.45 5.33 4.47 4.050.97 1.09 1.38 0.82 0.87 0.95 1.10 1.21 1.55 0.42 0.51 0.54 3.97 5.93 5.58 3.92 5.86 5.722.80 3.52 2.62 5.52 6.88 7.16 2.10 2.70 2.01 3.32 4.14 4.15 34.67 34.76 26.40 32.48 32.17 25.56
15.29 16.43 12.28 12.04 12.33 9.50 10.84 11.34 8.91 7.79 7.33 5.87 7.65 7.30 4.88 7.06 6.29 4.473.64 4.63 6.34 3.07 3.96 5.54 2.03 2.67 3.79 1.16 1.50 2.26 11.02 11.36 10.97 13.81 14.02 13.89
12.13 11.43 10.59 8.97 8.44 8.14 6.84 6.41 6.05 4.05 3.72 3.65 14.22 13.32 12.11 13.76 12.96 12.21
# : Including EGS.
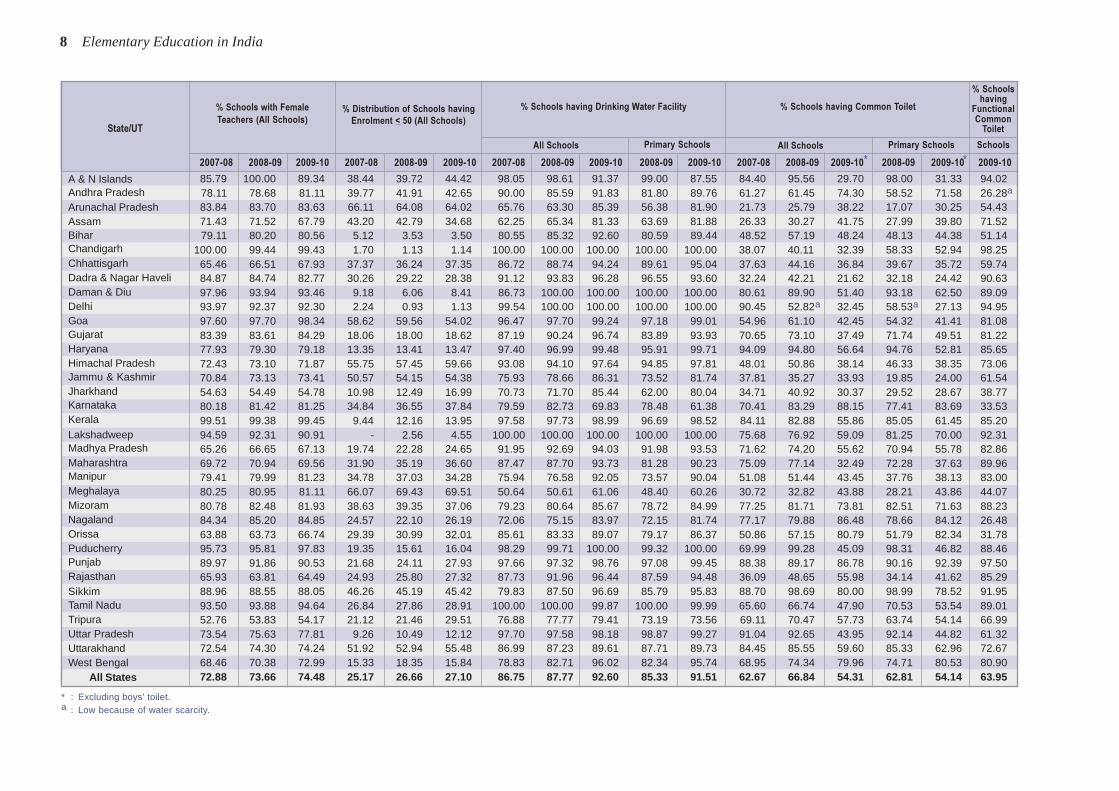
8 Elementary Education in India
A & N IslandsAndhra PradeshArunachal PradeshAssamBiharChandigarhChhattisgarhDadra & Nagar HaveliDaman & DiuDelhiGoaGujaratHaryanaHimachal PradeshJammu & KashmirJharkhandKarnatakaKeralaLakshadweepMadhya PradeshMaharashtraManipurMeghalayaMizoramNagalandOrissaPuducherryPunjabRajasthanSikkimTamil NaduTripuraUttar PradeshUttarakhandWest Bengal
All States
State/UT
% Schools with Female
Teachers (All Schools)
2007-08 2008-09 2009-10 2007-08 2008-09 2009-10 2007-08 2008-09 2009-10 2008-09 2009-10 2007-08 2008-09 2009-10* 2008-09 2009-10 2009-10
% Distribution of Schools having
Enrolment < 50 (All Schools)
% Schools having Drinking Water Facility
Primary Schools All Schools
% Schools having Common Toilet
% Schoolshaving
FunctionalCommon
Toilet
Primary Schools All Schools Schools
85.79 100.00 89.34 38.44 39.72 44.42 98.05 98.61 91.37 99.00 87.55 84.40 95.56 29.70 98.00 31.33 94.0278.11 78.68 81.11 39.77 41.91 42.65 90.00 85.59 91.83 81.80 89.76 61.27 61.45 74.30 58.52 71.58 26.28a
83.84 83.70 83.63 66.11 64.08 64.02 65.76 63.30 85.39 56.38 81.90 21.73 25.79 38.22 17.07 30.25 54.4371.43 71.52 67.79 43.20 42.79 34.68 62.25 65.34 81.33 63.69 81.88 26.33 30.27 41.75 27.99 39.80 71.5279.11 80.20 80.56 5.12 3.53 3.50 80.55 85.32 92.60 80.59 89.44 48.52 57.19 48.24 48.13 44.38 51.14
100.00 99.44 99.43 1.70 1.13 1.14 100.00 100.00 100.00 100.00 100.00 38.07 40.11 32.39 58.33 52.94 98.2565.46 66.51 67.93 37.37 36.24 37.35 86.72 88.74 94.24 89.61 95.04 37.63 44.16 36.84 39.67 35.72 59.7484.87 84.74 82.77 30.26 29.22 28.38 91.12 93.83 96.28 96.55 93.60 32.24 42.21 21.62 32.18 24.42 90.6397.96 93.94 93.46 9.18 6.06 8.41 86.73 100.00 100.00 100.00 100.00 80.61 89.90 51.40 93.18 62.50 89.0993.97 92.37 92.30 2.24 0.93 1.13 99.54 100.00 100.00 100.00 100.00 90.45 52.82a 32.45 58.53a 27.13 94.9597.60 97.70 98.34 58.62 59.56 54.02 96.47 97.70 99.24 97.18 99.01 54.96 61.10 42.45 54.32 41.41 81.0883.39 83.61 84.29 18.06 18.00 18.62 87.19 90.24 96.74 83.89 93.93 70.65 73.10 37.49 71.74 49.51 81.2277.93 79.30 79.18 13.35 13.41 13.47 97.40 96.99 99.48 95.91 99.71 94.09 94.80 56.64 94.76 52.81 85.6572.43 73.10 71.87 55.75 57.45 59.66 93.08 94.10 97.64 94.85 97.81 48.01 50.86 38.14 46.33 38.35 73.0670.84 73.13 73.41 50.57 54.15 54.38 75.93 78.66 86.31 73.52 81.74 37.81 35.27 33.93 19.85 24.00 61.5454.63 54.49 54.78 10.98 12.49 16.99 70.73 71.70 85.44 62.00 80.04 34.71 40.92 30.37 29.52 28.67 38.7780.18 81.42 81.25 34.84 36.55 37.84 79.59 82.73 69.83 78.48 61.38 70.41 83.29 88.15 77.41 83.69 33.5399.51 99.38 99.45 9.44 12.16 13.95 97.58 97.73 98.99 96.69 98.52 84.11 82.88 55.86 85.05 61.45 85.2094.59 92.31 90.91 - 2.56 4.55 100.00 100.00 100.00 100.00 100.00 75.68 76.92 59.09 81.25 70.00 92.3165.26 66.65 67.13 19.74 22.28 24.65 91.95 92.69 94.03 91.98 93.53 71.62 74.20 55.62 70.94 55.78 82.8669.72 70.94 69.56 31.90 35.19 36.60 87.47 87.70 93.73 81.28 90.23 75.09 77.14 32.49 72.28 37.63 89.9679.41 79.99 81.23 34.78 37.03 34.28 75.94 76.58 92.05 73.57 90.04 51.08 51.44 43.45 37.76 38.13 83.0080.25 80.95 81.11 66.07 69.43 69.51 50.64 50.61 61.06 48.40 60.26 30.72 32.82 43.88 28.21 43.86 44.0780.78 82.48 81.93 38.63 39.35 37.06 79.23 80.64 85.67 78.72 84.99 77.25 81.71 73.81 82.51 71.63 88.2384.34 85.20 84.85 24.57 22.10 26.19 72.06 75.15 83.97 72.15 81.74 77.17 79.88 86.48 78.66 84.12 26.4863.88 63.73 66.74 29.39 30.99 32.01 85.61 83.33 89.07 79.17 86.37 50.86 57.15 80.79 51.79 82.34 31.7895.73 95.81 97.83 19.35 15.61 16.04 98.29 99.71 100.00 99.32 100.00 69.99 99.28 45.09 98.31 46.82 88.4689.97 91.86 90.53 21.68 24.11 27.93 97.66 97.32 98.76 97.08 99.45 88.38 89.17 86.78 90.16 92.39 97.5065.93 63.81 64.49 24.93 25.80 27.32 87.73 91.96 96.44 87.59 94.48 36.09 48.65 55.98 34.14 41.62 85.2988.96 88.55 88.05 46.26 45.19 45.42 79.83 87.50 96.69 85.79 95.83 88.70 98.69 80.00 98.99 78.52 91.9593.50 93.88 94.64 26.84 27.86 28.91 100.00 100.00 99.87 100.00 99.99 65.60 66.74 47.90 70.53 53.54 89.0152.76 53.83 54.17 21.12 21.46 29.51 76.88 77.77 79.41 73.19 73.56 69.11 70.47 57.73 63.74 54.14 66.9973.54 75.63 77.81 9.26 10.49 12.12 97.70 97.58 98.18 98.87 99.27 91.04 92.65 43.95 92.14 44.82 61.3272.54 74.30 74.24 51.92 52.94 55.48 86.99 87.23 89.61 87.71 89.73 84.45 85.55 59.60 85.33 62.96 72.6768.46 70.38 72.99 15.33 18.35 15.84 78.83 82.71 96.02 82.34 95.74 68.95 74.34 79.96 74.71 80.53 80.9072.88 73.66 74.48 25.17 26.66 27.10 86.75 87.77 92.60 85.33 91.51 62.67 66.84 54.31 62.81 54.14 63.95
* : Excluding boys’ toilet.a : Low because of water scarcity.
*

DISE 2009-10: Flash Statistics 9
A & N IslandsAndhra PradeshArunachal PradeshAssamBiharChandigarhChhattisgarhDadra & Nagar HaveliDaman & DiuDelhiGoaGujaratHaryanaHimachal PradeshJammu & KashmirJharkhandKarnatakaKeralaLakshadweepMadhya PradeshMaharashtraManipurMeghalayaMizoramNagalandOrissaPuducherryPunjabRajasthanSikkimTamil NaduTripuraUttar PradeshUttarakhandWest Bengal
All States
State/UT
2009-10 2009-10 2007-08 2008-09 2009-10 2008-09 2009-10 2009-10 2007-08 2008-09 2009-10 2007-08 2008-09 2009-10
All Schools
% Schools having
Boys’ Toilet
PrimarySchools
% Schoolshaving
FunctionalBoys’ Toilet
All Schools
% Schools having Girls’ Toilet*
All Schools Primary Schools
% Schoolshaving
FunctionalGirls’ Toilet
All Schools
% Schools having Boundary Wall
All Schools All Schools
% Schools having Computer
84.52 76.39 99.40 73.82 81.67 88.83 76.00 81.97 99.14 47.63 48.61 51.78 41.23 47.50 55.338.57 7.28 35.34 46.75 47.14 66.66 36.21 59.66 27.55 52.60 52.46 53.85 21.11 22.71 23.84
17.62 11.52 34.96 11.90 16.08 37.98 7.66 27.52 59.19 27.07 27.65 27.77 9.15 9.54 14.2221.30 22.17 85.86 10.54 12.74 38.24 8.59 34.06 76.08 28.33 26.47 27.55 3.69 3.24 4.9617.37 13.94 72.28 21.62 26.06 37.70 17.62 31.96 50.53 28.08 33.19 39.13 0.58 0.68 0.9493.18 76.47 99.39 94.89 94.92 97.16 75.00 82.35 100.00 100.00 99.44 99.43 76.14 85.88 90.3423.95 20.95 78.94 19.95 23.13 35.29 17.34 29.91 60.56 41.70 42.57 70.01 8.52 6.30 7.2152.36 32.56 32.26 25.33 32.79 51.69 16.67 32.56 95.42 42.11 43.18 38.85 5.92 4.22 9.4672.90 64.58 75.64 61.22 73.74 75.70 63.64 66.67 76.54 88.78 90.91 89.72 36.73 43.43 42.9978.65 75.16 100.00 74.15 87.87 78.93 84.63 75.97 100.00 98.67 97.95 97.94 72.80 85.84 82.4158.31 49.06 84.80 45.38 58.03 61.01 44.74 51.34 84.90 62.74 64.88 69.04 30.61 31.22 30.7549.36 28.34 90.14 65.26 67.73 58.47 47.86 37.42 85.76 80.43 83.61 86.74 36.50 37.69 42.8268.27 64.75 92.83 87.32 87.54 87.37 83.50 83.89 88.39 92.80 93.43 95.05 25.29 27.46 26.8042.90 35.08 84.92 38.72 42.90 56.41 32.41 48.35 77.81 28.70 31.76 50.02 11.14 12.94 14.6814.02 5.08 81.06 21.99 20.36 24.23 7.11 10.63 68.36 33.58 29.65 30.17 12.99 11.66 12.7332.65 30.16 72.52 20.71 28.23 49.26 19.28 45.73 53.21 23.45 22.54 21.51 5.54 5.83 5.9958.50 45.72 83.50 47.16 56.04 68.19 41.78 54.06 77.18 55.62 70.76 62.91 11.84 18.35 21.2066.07 57.17 90.11 78.99 77.87 76.46 69.07 67.14 87.86 70.59 72.84 76.91 71.20 79.93 86.8663.64 55.00 89.29 62.16 64.10 70.45 50.00 55.00 87.10 40.54 46.15 56.82 81.08 89.74 93.1824.32 19.26 89.99 46.98 47.60 37.85 41.30 30.21 81.02 46.23 43.35 43.02 12.36 10.38 10.4864.70 52.54 38.74 60.02 63.94 69.61 46.31 55.72 93.19 59.59 58.13 59.99 36.49 37.17 39.3616.94 4.31 12.18 18.03 18.64 23.18 3.82 7.28 84.95 33.03 28.86 31.81 11.32 11.99 15.6610.99 8.58 65.92 10.20 11.15 31.72 7.27 28.91 46.58 17.84 18.95 17.93 6.24 7.25 7.4332.77 30.47 94.87 23.50 34.22 56.56 28.99 52.56 83.41 30.69 29.97 41.72 13.94 15.64 17.5512.41 10.41 40.77 37.02 57.36 90.51 48.81 88.82 29.76 75.15 76.50 76.14 19.66 23.57 27.6014.67 12.41 74.25 28.04 34.01 37.85 25.86 28.95 44.06 59.56 59.13 57.61 7.96 7.51 7.2882.95 81.27 96.17 86.20 88.58 89.16 81.76 85.28 93.68 85.49 84.25 85.69 63.02 70.95 79.9133.54 25.44 94.55 86.09 83.27 98.59 80.54 99.02 100.00 91.20 90.51 90.69 30.61 32.53 38.64
1.91 1.31 87.08 79.32 82.99 89.35 72.86 83.28 88.47 63.56 64.26 71.95 14.88 2.73 14.9943.39 37.24 95.90 42.26 41.43 74.75 28.18 65.89 92.97 25.74 25.52 26.69 21.91 24.04 35.8558.70 50.60 92.24 62.33 64.15 69.24 54.52 59.96 91.91 62.55 62.07 66.95 24.28 32.12 38.6013.94 4.94 83.83 22.58 26.63 42.32 12.69 21.80 68.04 15.77 14.80 12.92 7.90 8.71 9.0443.29 42.75 94.50 82.36 84.20 71.85 83.11 70.62 73.97 46.62 48.04 51.65 3.30 3.59 4.7232.90 29.69 94.30 52.13 52.21 58.31 47.14 54.31 76.55 70.91 75.75 77.62 22.64 22.27 24.1316.04 12.39 83.58 35.13 41.18 48.94 35.35 43.95 86.42 41.44 40.11 0.00 4.99 5.90 7.4531.03 25.72 88.99 50.55 53.60 58.82 44.37 50.99 74.64 50.22 51.02 51.45 14.25 14.12 16.65
*In addition, schools may also have boys and common toilets in co-educational schools.

10 Elementary Education in India
A & N IslandsAndhra PradeshArunachal PradeshAssamBiharChandigarhChhattisgarhDadra & Nagar HaveliDaman & DiuDelhiGoaGujaratHaryanaHimachal PradeshJammu & KashmirJharkhandKarnatakaKeralaLakshadweepMadhya PradeshMaharashtraManipurMeghalayaMizoramNagalandOrissaPuducherryPunjabRajasthanSikkimTamil NaduTripuraUttar PradeshUttarakhandWest Bengal
All States
State/UT
% Schools having Kitchen-Shed
(Government & Aided Managements)
37.50 37.34 60.38 81.37 93.12 39.13 8.64 7.22 17.26 4.50 12.45 24.45 25.08 24.07 20.45 19.6711.10 10.71 46.61 50.54 62.96 18.16 10.82 11.98 14.20 9.68 11.82 31.87 33.07 32.84 31.70 31.772.17 2.41 33.27 49.66 61.82 21.55 2.99 2.95 3.30 1.77 2.18 20.05 39.95 34.34 33.67 27.810.82 1.00 10.15 15.64 70.52 9.00 14.71 22.46 42.65 24.55 47.28 39.66 37.44 47.81 47.74 61.740.17 0.09 1.90 2.50 61.60 3.16 20.59 29.26 38.71 22.75 29.18 11.10 14.85 14.73 11.85 11.07
62.50 47.06 89.54 94.97 91.82 72.96 35.23 38.98 43.18 25.00 23.53 26.50 25.21 25.21 17.65 14.293.61 3.95 12.22 13.51 61.30 10.55 29.45 33.01 40.63 32.54 41.16 41.99 4.87** 35.50 6.39** 47.000.57 2.33 9.92 19.35 100.00 7.26 2.96 6.17 27.36 0.57 11.05 37.54 34.27 33.10 27.17 26.049.09 12.50 70.91 67.80 93.48 38.98 12.24 33.33 44.86 36.36 50.00 19.75 63.04 59.57 68.18 63.64
78.66 79.77 93.62 85.29 83.12 66.65 65.04 58.99 70.52 49.16 68.84 11.00 6.84 5.95 2.48 2.477.05 6.75 83.10 86.24 93.92 66.51 18.23 24.76 34.49 30.26 40.42 4.59 4.43 3.81 1.82 0.93
13.71 13.91 47.52 53.90 81.17 21.97 71.55 77.75 79.62 77.61 79.32 42.32 47.37 45.54 41.97 39.736.51 4.84 50.03 51.17 82.15 30.75 54.20 57.38 66.02 56.58 66.14 8.95 18.67 18.08 20.92 20.633.99 3.55 30.57 35.82 77.62 18.20 27.69 33.40 46.35 37.44 51.05 4.41 16.36 14.86 21.77 19.813.21 3.08 24.74 25.21 61.94 9.83 11.00 10.71 11.85 5.96 5.99 1.81 1.78 1.74 0.86 0.893.42 3.43 10.58 10.25 25.34 4.97 5.58 7.00 13.96 4.88 9.87 30.19 32.33 31.74 26.29 25.548.40 7.63 26.93 32.35 68.27 18.79 22.42 44.94 55.14 33.70 45.93 27.29 73.41 74.90 70.39 71.91
68.95 78.41 92.90 96.76 92.44 65.10 57.95 59.90 61.84 59.71 62.27 48.62 77.47 78.22 77.43 78.5993.75 85.00 86.96 100.00 97.56 87.50 75.68 82.05 70.45 75.00 60.00 51.35 82.05 72.73 87.50 75.00
4.97 3.74 22.13 24.52 54.77 15.21 34.16 47.82 53.55 47.92 53.35 44.39 58.21 57.30 68.76 67.6011.30 13.01 61.75 65.70 85.85 10.43 62.78 61.26 65.43 73.77 75.71 17.58 31.83 30.53 29.17 27.610.99 1.09 31.22 38.32 76.10 13.66 7.38 4.98 6.04 3.54 4.86 NR NR 71.30 NR 75.222.95 2.95 19.55 18.02 53.49 6.04 5.29 8.03 12.25 7.86 12.35 6.64 22.96 22.17 25.86 26.525.72 5.44 27.01 30.93 87.89 8.00 27.60 37.23 38.50 40.16 41.74 45.02 55.16 41.04 87.17 67.394.82 4.58 54.25 65.30 56.36 26.41 6.42 8.08 7.83 7.07 7.08 38.78 84.15 79.12 84.90 79.443.81 3.15 12.32 14.06 31.49 6.56 17.85 23.55 36.19 20.47 30.11 20.77 24.69 24.74 23.37 22.08
38.51 58.86 95.20 95.93 98.19 67.18 38.98 39.31 52.31 43.92 57.19 27.27 26.07 26.12 26.00 25.694.67 10.99 82.32 81.62 93.28 35.72 40.92 37.68 53.25 39.62 55.04 5.60 20.79 19.95 28.67 28.300.13 3.38 5.17 25.50 88.87 7.30 27.17 38.98 51.09 34.87 45.04 32.88 46.30 36.43 44.25 35.06
12.33 13.02 50.86 78.40 80.61 21.60 6.00 6.03 5.51 5.03 3.65 NR 31.90 30.61 26.92 25.8318.15 21.40 56.48 66.87 92.07 28.38 43.70 45.86 57.14 41.80 52.43 86.96 87.84 96.64 87.57 96.99
1.66 1.63 16.94 18.30 63.50 4.39 46.73 50.73 55.96 47.34 49.12 65.30 67.66 59.87 62.56 50.282.10 2.79 6.95 8.79 40.70 3.91 52.50 56.13 58.98 61.53 64.70 48.33 59.52 49.27 71.75 64.55
11.20 10.97 48.47 53.88 63.53 29.40 29.34 33.74 35.02 38.28 39.49 61.11 67.34 66.23 90.52 89.751.86 3.54 27.34 28.52 39.42 10.30 53.42 57.34 49.60 58.65 50.01 64.12 66.58 51.71 74.84 57.735.76 6.47 28.34 33.37 74.14 13.65 34.43 40.39 47.09 39.69 45.86 36.06 43.44 42.81 47.41 47.78
2008-09 2009-10 2008-09 2009-10 2009-10 2009-10 2007-08 2008-09 2009-10 2008-09 2009-10 2007-08 2008-09 2009-10 2008-09 2009-10
% Schools having Computer
All SchoolsPrimary Only Schools Upper PrimarySchools/Sections
Upper PrimarySchools/Sections
% Schools having
Functional
Computer
% Schools having
CAL Facility+ % Schools having Ramp
All Schools Primary Schools Primary Only SchoolsAll Schools
+CAL :Computer Aided Learning.NR :Data not reported.
** Incomplete Coverage.

DISE 2009-10: Flash Statistics 11
A & N IslandsAndhra PradeshArunachal PradeshAssamBiharChandigarhChhattisgarhDadra & Nagar HaveliDaman & DiuDelhiGoaGujaratHaryanaHimachal PradeshJammu & KashmirJharkhandKarnatakaKeralaLakshadweepMadhya PradeshMaharashtraManipurMeghalayaMizoramNagalandOrissaPuducherryPunjabRajasthanSikkimTamil NaduTripuraUttar PradeshUttarakhandWest Bengal
All States
State/UT
94.44 83.00 87.50 76.82 84.26 3715 3837 494792.02 20.08 37.34 29.42 44.95 518881# 508004# 50181977.50 7.86 16.65 8.56 19.67 15590 17341 1799280.45 4.47 8.78 6.76 11.67 242203 261212 225857b
72.29 1.62 3.45 2.07 3.91 328581 338478 33283487.39 100.00 100.00 100.00 100.00 5519 5762 492288.56 12.79 20.77 14.95 23.54 154928 172382 17186199.30 65.52 74.35 61.05 75.68 1379 1428 144191.49 100.00 100.00 100.00 100.00 696 747 83895.72 97.46 98.50 98.02 98.65 101895 90705 9463696.04 92.95 94.75 95.13 95.98 7782 8445 745092.53 73.07 87.38 88.49 94.80 234507 238030 24334292.32 97.72 96.03 95.95 94.25 105846 116239 11013498.98 50.38 58.28 51.15 59.77 63531 63363 6463897.71 8.44 18.08 8.48 18.30 107141 124324 12412795.00 2.32 6.81 3.17 7.48 148322 152168 14780445.87* 78.81 85.27 83.14 88.03 259940 267094 27908696.43 85.20 90.07 85.00 88.59 162270 132805 13718295.45 100.00 100.00 100.00 100.00 552 667 74293.66 10.74 20.56 9.69 20.07 430548 435723 44106394.66 57.16 71.37 58.31 71.73 575519 581257 53329796.66 5.41 21.29 4.77 21.57 24799 24173 2342389.19 NR 14.13 8.21 13.74 34652 38713 3789693.02 20.74 32.41 23.20 34.08 16357 17263 1644780.02 11.39 33.36 11.42 33.95 20367 21237 2117487.72 7.62 18.64 7.55 15.75 222375 246217# 182026**94.65 100.00 100.00 99.67 99.86 9498 10239 1085293.53 80.35 85.91 85.97 88.99 79754 103383 10404996.62 8.92 28.99 11.42 33.74 422330 453163 45876690.47 41.89 53.41 42.45 57.12 8396 8313 1007397.71 73.91 81.02 88.04 91.26 316721 327391 33020097.26 2.42 12.60 2.80 13.15 31090 30003 2824282.23 15.34 18.37 22.97 25.54 644426 651338 69789095.09 21.02 32.55 24.05 36.23 60427 65531 6860585.70 16.33 24.92 18.79 26.50 274052 272923 381018a
87.45 23.57 35.56 27.70 38.98 5634589 5789898 5816673
2009-10 2008-09 2009-10 2007-08 2008-09 2009-10
% Schools Having Electricity Connection% Schools Providing
Mid-day Meal
(Government &
Aided Managements) All SchoolsPrimary Only Schools All SchoolsPrimary Only Schools
* Data not fully reported. State has clarified that all Government & Aided Schools are covered under MDM.NR :Date not Reported.
# Including teachers teaching Grade VIII as a part of Secondary level has also been considered.
Number of Teachers (All Schools)
a Including SSK etc. Institutions.b Excluding AIE Ccentres.** Excluding AIE centres. State has closed down 8772 AIE Centres & 6476 Venture schools.
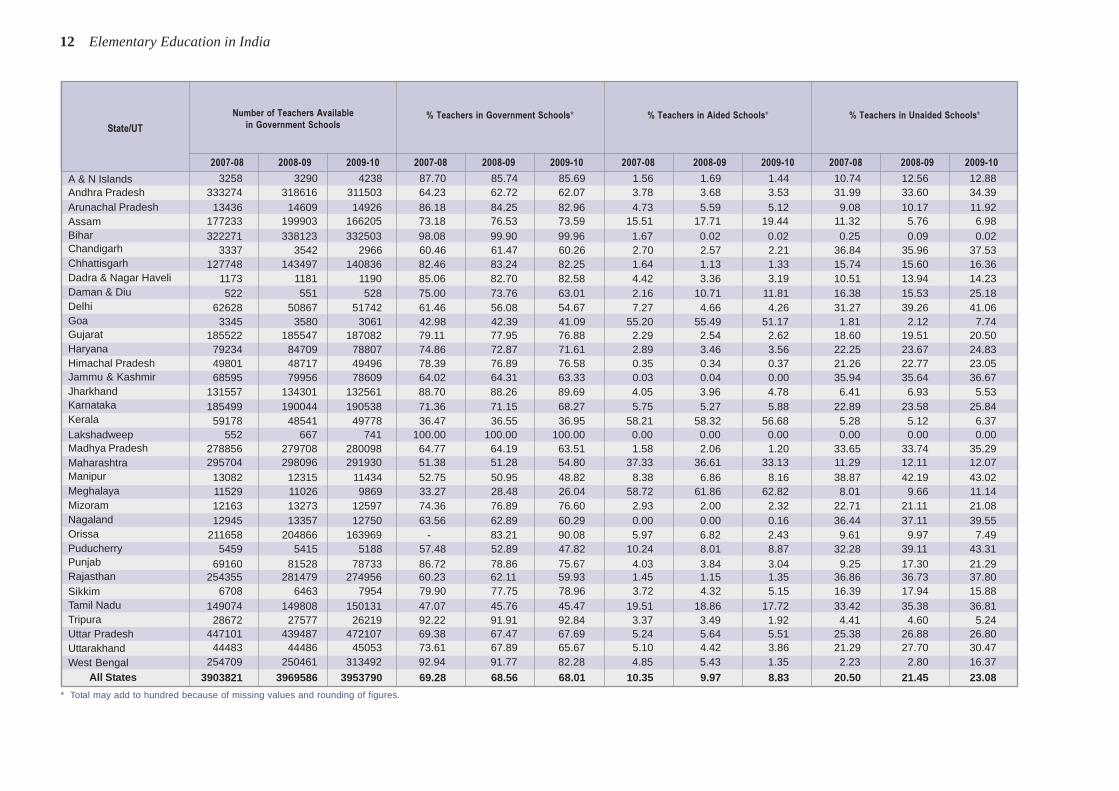
12 Elementary Education in India
A & N IslandsAndhra PradeshArunachal PradeshAssamBiharChandigarhChhattisgarhDadra & Nagar HaveliDaman & DiuDelhiGoaGujaratHaryanaHimachal PradeshJammu & KashmirJharkhandKarnatakaKeralaLakshadweepMadhya PradeshMaharashtraManipurMeghalayaMizoramNagalandOrissaPuducherryPunjabRajasthanSikkimTamil NaduTripuraUttar PradeshUttarakhandWest Bengal
All States
State/UT
3258 3290 4238 87.70 85.74 85.69 1.56 1.69 1.44 10.74 12.56 12.88333274 318616 311503 64.23 62.72 62.07 3.78 3.68 3.53 31.99 33.60 34.39
13436 14609 14926 86.18 84.25 82.96 4.73 5.59 5.12 9.08 10.17 11.92177233 199903 166205 73.18 76.53 73.59 15.51 17.71 19.44 11.32 5.76 6.98322271 338123 332503 98.08 99.90 99.96 1.67 0.02 0.02 0.25 0.09 0.02
3337 3542 2966 60.46 61.47 60.26 2.70 2.57 2.21 36.84 35.96 37.53127748 143497 140836 82.46 83.24 82.25 1.64 1.13 1.33 15.74 15.60 16.36
1173 1181 1190 85.06 82.70 82.58 4.42 3.36 3.19 10.51 13.94 14.23522 551 528 75.00 73.76 63.01 2.16 10.71 11.81 16.38 15.53 25.18
62628 50867 51742 61.46 56.08 54.67 7.27 4.66 4.26 31.27 39.26 41.063345 3580 3061 42.98 42.39 41.09 55.20 55.49 51.17 1.81 2.12 7.74
185522 185547 187082 79.11 77.95 76.88 2.29 2.54 2.62 18.60 19.51 20.5079234 84709 78807 74.86 72.87 71.61 2.89 3.46 3.56 22.25 23.67 24.8349801 48717 49496 78.39 76.89 76.58 0.35 0.34 0.37 21.26 22.77 23.0568595 79956 78609 64.02 64.31 63.33 0.03 0.04 0.00 35.94 35.64 36.67
131557 134301 132561 88.70 88.26 89.69 4.05 3.96 4.78 6.41 6.93 5.53185499 190044 190538 71.36 71.15 68.27 5.75 5.27 5.88 22.89 23.58 25.84
59178 48541 49778 36.47 36.55 36.95 58.21 58.32 56.68 5.28 5.12 6.37552 667 741 100.00 100.00 100.00 0.00 0.00 0.00 0.00 0.00 0.00
278856 279708 280098 64.77 64.19 63.51 1.58 2.06 1.20 33.65 33.74 35.29295704 298096 291930 51.38 51.28 54.80 37.33 36.61 33.13 11.29 12.11 12.07
13082 12315 11434 52.75 50.95 48.82 8.38 6.86 8.16 38.87 42.19 43.0211529 11026 9869 33.27 28.48 26.04 58.72 61.86 62.82 8.01 9.66 11.1412163 13273 12597 74.36 76.89 76.60 2.93 2.00 2.32 22.71 21.11 21.0812945 13357 12750 63.56 62.89 60.29 0.00 0.00 0.16 36.44 37.11 39.55
211658 204866 163969 - 83.21 90.08 5.97 6.82 2.43 9.61 9.97 7.495459 5415 5188 57.48 52.89 47.82 10.24 8.01 8.87 32.28 39.11 43.31
69160 81528 78733 86.72 78.86 75.67 4.03 3.84 3.04 9.25 17.30 21.29254355 281479 274956 60.23 62.11 59.93 1.45 1.15 1.35 36.86 36.73 37.80
6708 6463 7954 79.90 77.75 78.96 3.72 4.32 5.15 16.39 17.94 15.88149074 149808 150131 47.07 45.76 45.47 19.51 18.86 17.72 33.42 35.38 36.81
28672 27577 26219 92.22 91.91 92.84 3.37 3.49 1.92 4.41 4.60 5.24447101 439487 472107 69.38 67.47 67.69 5.24 5.64 5.51 25.38 26.88 26.80
44483 44486 45053 73.61 67.89 65.67 5.10 4.42 3.86 21.29 27.70 30.47254709 250461 313492 92.94 91.77 82.28 4.85 5.43 1.35 2.23 2.80 16.37
3903821 3969586 3953790 69.28 68.56 68.01 10.35 9.97 8.83 20.50 21.45 23.08
2007-08 2008-09 2009-10 2007-08 2008-09 2009-10 2007-08 2008-09 2009-10 2007-08 2008-09 2009-10
Number of Teachers Available
in Government Schools% Teachers in Government Schools* % Teachers in Aided Schools* % Teachers in Unaided Schools*
* Total may add to hundred because of missing values and rounding of figures.
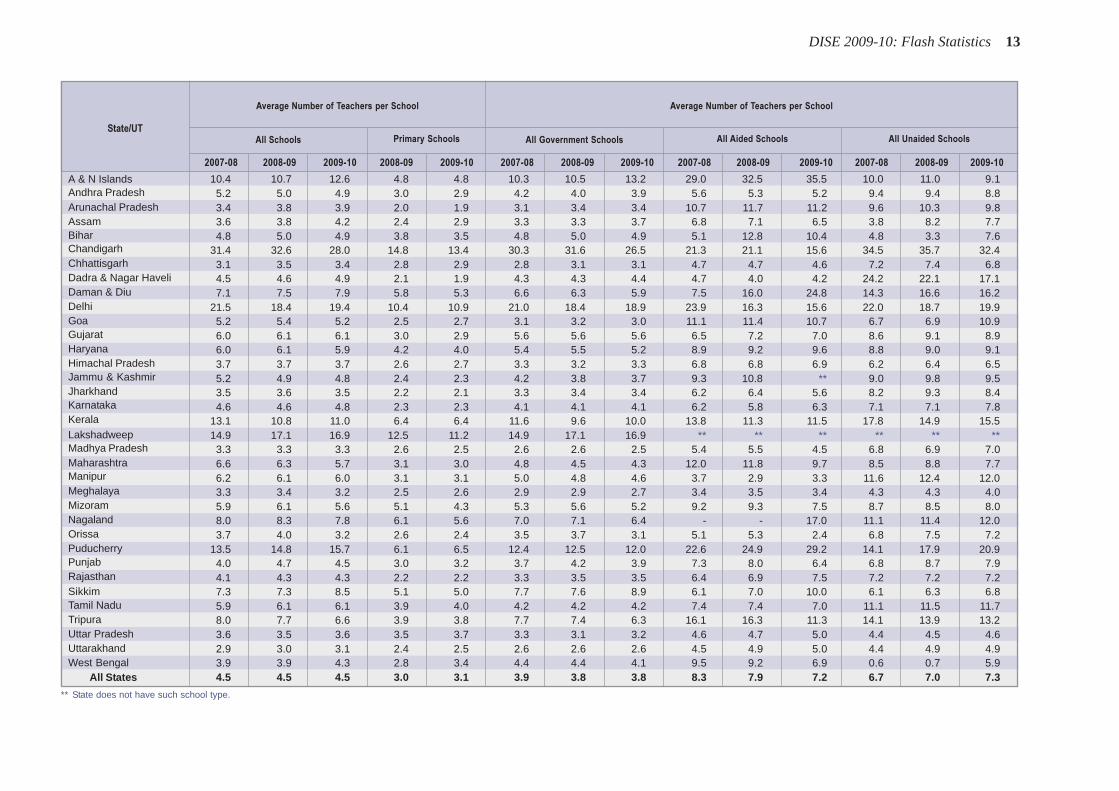
DISE 2009-10: Flash Statistics 13
A & N IslandsAndhra PradeshArunachal PradeshAssamBiharChandigarhChhattisgarhDadra & Nagar HaveliDaman & DiuDelhiGoaGujaratHaryanaHimachal PradeshJammu & KashmirJharkhandKarnatakaKeralaLakshadweepMadhya PradeshMaharashtraManipurMeghalayaMizoramNagalandOrissaPuducherryPunjabRajasthanSikkimTamil NaduTripuraUttar PradeshUttarakhandWest Bengal
All States
State/UT
2007-08 2008-09 2009-10 2008-09 2009-10 2007-08 2008-09 2009-10 2007-08 2008-09 2009-10 2007-08 2008-09 2009-10
Average Number of Teachers per School
All Schools Primary Schools
Average Number of Teachers per School
All Government Schools All Aided Schools All Unaided Schools
10.4 10.7 12.6 4.8 4.8 10.3 10.5 13.2 29.0 32.5 35.5 10.0 11.0 9.15.2 5.0 4.9 3.0 2.9 4.2 4.0 3.9 5.6 5.3 5.2 9.4 9.4 8.83.4 3.8 3.9 2.0 1.9 3.1 3.4 3.4 10.7 11.7 11.2 9.6 10.3 9.83.6 3.8 4.2 2.4 2.9 3.3 3.3 3.7 6.8 7.1 6.5 3.8 8.2 7.74.8 5.0 4.9 3.8 3.5 4.8 5.0 4.9 5.1 12.8 10.4 4.8 3.3 7.6
31.4 32.6 28.0 14.8 13.4 30.3 31.6 26.5 21.3 21.1 15.6 34.5 35.7 32.43.1 3.5 3.4 2.8 2.9 2.8 3.1 3.1 4.7 4.7 4.6 7.2 7.4 6.84.5 4.6 4.9 2.1 1.9 4.3 4.3 4.4 4.7 4.0 4.2 24.2 22.1 17.17.1 7.5 7.9 5.8 5.3 6.6 6.3 5.9 7.5 16.0 24.8 14.3 16.6 16.2
21.5 18.4 19.4 10.4 10.9 21.0 18.4 18.9 23.9 16.3 15.6 22.0 18.7 19.95.2 5.4 5.2 2.5 2.7 3.1 3.2 3.0 11.1 11.4 10.7 6.7 6.9 10.96.0 6.1 6.1 3.0 2.9 5.6 5.6 5.6 6.5 7.2 7.0 8.6 9.1 8.96.0 6.1 5.9 4.2 4.0 5.4 5.5 5.2 8.9 9.2 9.6 8.8 9.0 9.13.7 3.7 3.7 2.6 2.7 3.3 3.2 3.3 6.8 6.8 6.9 6.2 6.4 6.55.2 4.9 4.8 2.4 2.3 4.2 3.8 3.7 9.3 10.8 ** 9.0 9.8 9.53.5 3.6 3.5 2.2 2.1 3.3 3.4 3.4 6.2 6.4 5.6 8.2 9.3 8.44.6 4.6 4.8 2.3 2.3 4.1 4.1 4.1 6.2 5.8 6.3 7.1 7.1 7.8
13.1 10.8 11.0 6.4 6.4 11.6 9.6 10.0 13.8 11.3 11.5 17.8 14.9 15.514.9 17.1 16.9 12.5 11.2 14.9 17.1 16.9 ** ** ** ** ** **3.3 3.3 3.3 2.6 2.5 2.6 2.6 2.5 5.4 5.5 4.5 6.8 6.9 7.06.6 6.3 5.7 3.1 3.0 4.8 4.5 4.3 12.0 11.8 9.7 8.5 8.8 7.76.2 6.1 6.0 3.1 3.1 5.0 4.8 4.6 3.7 2.9 3.3 11.6 12.4 12.03.3 3.4 3.2 2.5 2.6 2.9 2.9 2.7 3.4 3.5 3.4 4.3 4.3 4.05.9 6.1 5.6 5.1 4.3 5.3 5.6 5.2 9.2 9.3 7.5 8.7 8.5 8.08.0 8.3 7.8 6.1 5.6 7.0 7.1 6.4 - - 17.0 11.1 11.4 12.03.7 4.0 3.2 2.6 2.4 3.5 3.7 3.1 5.1 5.3 2.4 6.8 7.5 7.2
13.5 14.8 15.7 6.1 6.5 12.4 12.5 12.0 22.6 24.9 29.2 14.1 17.9 20.94.0 4.7 4.5 3.0 3.2 3.7 4.2 3.9 7.3 8.0 6.4 6.8 8.7 7.94.1 4.3 4.3 2.2 2.2 3.3 3.5 3.5 6.4 6.9 7.5 7.2 7.2 7.27.3 7.3 8.5 5.1 5.0 7.7 7.6 8.9 6.1 7.0 10.0 6.1 6.3 6.85.9 6.1 6.1 3.9 4.0 4.2 4.2 4.2 7.4 7.4 7.0 11.1 11.5 11.78.0 7.7 6.6 3.9 3.8 7.7 7.4 6.3 16.1 16.3 11.3 14.1 13.9 13.23.6 3.5 3.6 3.5 3.7 3.3 3.1 3.2 4.6 4.7 5.0 4.4 4.5 4.62.9 3.0 3.1 2.4 2.5 2.6 2.6 2.6 4.5 4.9 5.0 4.4 4.9 4.93.9 3.9 4.3 2.8 3.4 4.4 4.4 4.1 9.5 9.2 6.9 0.6 0.7 5.94.5 4.5 4.5 3.0 3.1 3.9 3.8 3.8 8.3 7.9 7.2 6.7 7.0 7.3
** State does not have such school type.
14 Elementary Education in India
A & N IslandsAndhra PradeshArunachal PradeshAssamBiharChandigarhChhattisgarhDadra & Nagar HaveliDaman & DiuDelhiGoaGujaratHaryanaHimachal PradeshJammu & KashmirJharkhandKarnatakaKeralaLakshadweepMadhya PradeshMaharashtraManipurMeghalayaMizoramNagalandOrissaPuducherryPunjabRajasthanSikkimTamil NaduTripuraUttar PradeshUttarakhandWest Bengal
All States
State/UT
15 15 11 14 11 22 22 17 13 15 15 12 16 16 12 0 021 21 22 20 20 31 30 22 23 24 24 25 19 19 18 0 020 19 19 19 19 19 20 17 17 20 19 19 22 19 19 0 024 22 23 25 25 15 16 15 17 27 26 25 19 18 20 4 354 55 57 55 57 40 66 ** 44 54 55 57 59 59 61 37 3724 25 29 28 33 21 27 19 22 25 25 29 24 24 29 0 028 26 26 27 27 31 30 23 24 30 29 28 22 22 24 2 136 36 36 37 37 32 33 30 33 36 36 37 38 38 38 1 130 34 31 32 30 44 41 33 30 31 33 33 31 35 30 2 224 29 28 33 32 26 26 24 23 25 30 29 20 25 25 3 319 21 24 17 17 24 29 18 24 20 21 25 20 22 25 0 033 32 32 32 31 36 39 32 34 33 32 32 33 33 33 20 1928 28 30 27 29 31 34 29 33 32 32 37 23 23 26 4 617 17 16 17 16 29 25 17 17 18 18 17 17 17 17 0 016 15 16 16 16 26 ** 15 16 16 16 16 16 15 16 0 045 43 44 45 43 43 50 26 51 47 45 45 45 44 47 24 2430 29 27 27 25 47 43 32 30 30 29 28 33 32 30 16 1122 25 24 24 23 27 25 21 25 23 24 24 22 27 26 3 120 16 14 16 14 ** ** ** ** 21 18 17 19 15 13 0 036 36 35 38 37 34 38 31 31 37 37 35 31 32 33 37 3627 27 30 26 26 29 35 28 33 27 27 30 30 30 30 8 1619 19 20 15 17 27 24 21 23 20 19 21 19 19 20 0 017 15 16 16 17 15 16 14 16 18 16 17 16 14 15 0 014 14 15 13 14 15 14 18 17 16 15 17 14 14 14 0 019 19 19 14 14 - 15 29 27 20 20 20 24 24 23 0 029 27 33 29 34 15 35 15 25 26 31 32 35 26 37 5 2218 18 17 15 15 31 27 19 17 20 21 18 19 18 17 0 032 27 28 26 26 42 49 29 32 38 32 31 29 25 28 4 929 27 27 28 27 30 28 26 26 30 28 27 28 27 26 7 614 15 12 15 13 21 15 11 10 14 15 12 19 19 14 0 031 30 30 31 30 39 40 25 26 30 29 29 34 33 34 14 1622 23 24 23 23 24 35 25 29 22 23 24 23 24 26 1 050 50 45 49 42 53 50 51 52 52 52 47 45 45 44 70 6925 24 23 24 22 31 31 24 24 28 27 25 23 23 23 3 348 47 39 45 43 49 69 ** 21 45 44 34 57 57 51 19 1933 32 32 34 33 31 33 30 30 34 34 33 31 31 31 284 304
2007-08 2008-09 2009-10 2008-09 2009-10 2008-09 2009-10 2008-09 2009-10 2007-08 2008-09 2009-10 2007-08 2008-09 2009-10 2008-09 2009-10
Pupil-Teacher Ratio
All Schools All GovernmentSchools
All Aided Schools All Unaided Schools Primary Level Upper Primary Level
Number of Districtswhere PTR is above
30 : All Schools
** State does not have such school type.

DISE 2009-10: Flash Statistics 15
A & N IslandsAndhra PradeshArunachal PradeshAssamBiharChandigarhChhattisgarhDadra & Nagar HaveliDaman & DiuDelhiGoaGujaratHaryanaHimachal PradeshJammu & KashmirJharkhandKarnatakaKeralaLakshadweepMadhya PradeshMaharashtraManipurMeghalayaMizoramNagalandOrissaPuducherryPunjabRajasthanSikkimTamil NaduTripuraUttar PradeshUttarakhandWest Bengal
All States
State/UT
2.67 1.06 2.52 0.00 57.34 59.19 58.15 16 0.43 11 0.29 24 0.4921.11 23.08 6.31 10.46 44.88 45.43 45.70 66918 12.90 65340 12.86 66529 13.2621.10 17.57 10.60 13.19 35.93 37.24 37.78 276 1.77 237 1.37 288 1.6038.58 38.99 13.40 15.15 30.16 30.55 30.89 14045 5.80 14789 5.66 12662 5.6187.69 87.67 85.71 86.93 36.50 37.11 37.55 48168 14.66 50532 14.93 50141 15.0626.16 44.19 10.46 24.53 81.25 80.88 83.28 437 7.92 471 8.17 406 8.2541.80 35.79 15.38 20.96 32.93 34.83 35.84 20522 13.25 23161 13.44 22476 13.0862.46 64.29 55.37 58.06 55.63 56.95 56.90 85 6.16 71 4.97 75 5.2042.11 49.23 38.18 30.51 63.17 65.21 67.54 55 7.90 49 6.56 61 7.2853.90 50.92 13.69 13.49 67.51 71.81 72.18 12153 11.93 8759 9.66 9191 9.7111.29 12.37 14.69 21.79 76.51 76.90 77.97 90 1.16 107 1.27 94 1.2648.45 44.98 34.30 32.25 53.40 53.90 54.55 24243 10.34 24785 10.41 24850 10.2155.68 58.67 20.11 20.67 46.31 47.39 46.61 11019 10.41 12217 10.51 11953 10.8510.14 6.99 7.87 6.96 42.11 42.71 42.98 9135 14.38 9227 14.56 9731 15.0512.42 12.73 5.92 7.88 43.57 43.24 44.21 5214 4.87 6054 4.87 6085 4.9074.97 69.81 68.21 67.28 28.32 28.07 27.71 12580 8.48 12690 8.34 12459 8.4329.22 26.05 30.02 26.01 53.20 54.64 55.14 30052 11.47 34971 13.09 36249 12.9918.35 16.22 18.35 16.34 71.65 73.72 73.90 6253 3.85 5352 4.03 5919 4.31
0.00 5.71 0.00 0.00 40.18 38.89 38.06 1 0.18 1 0.15 3 0.4059.33 55.69 35.94 38.83 37.27 38.82 39.23 57851 13.44 57473 13.19 57893 13.1331.27 30.71 20.70 25.26 42.76 43.41 43.58 64549 11.22 66306 11.41 66372 12.4523.17 25.95 12.87 17.18 42.39 43.14 44.29 1040 4.19 891 3.69 869 3.7111.20 11.50 3.90 5.86 51.06 51.82 52.34 571 1.65 643 1.66 561 1.4811.43 15.89 4.93 4.40 42.55 43.05 42.54 186 1.14 177 1.03 161 0.9816.25 17.64 19.04 18.23 42.63 43.80 44.72 937 4.23 692 3.26 727 3.4344.35 46.46 34.43 47.61 33.15 34.05 38.29 26619 11.97 29470 11.97 26280 14.4412.23 7.35 6.57 4.83 61.16 64.78 69.54 633 14.24 1186 11.58 1335 12.3042.32 40.60 18.86 22.81 60.87 64.49 64.98 15888 19.92 18976 18.36 20202 19.4241.80 40.33 26.31 25.53 29.26 30.02 30.14 63647 15.07 65951 14.55 65572 14.29
5.01 2.81 7.76 3.64 45.08 45.50 48.66 332 3.95 314 3.78 372 3.6941.23 36.89 44.91 40.35 73.87 74.99 76.65 41696 13.16 44432 13.57 45198 13.6928.47 25.07 25.26 26.87 24.78 25.14 25.19 4233 13.62 4085 13.62 3921 13.8874.56 67.60 52.98 50.29 36.31 37.48 39.11 90528 14.05 92497 14.20 101973 14.6129.83 24.76 17.11 16.45 46.20 46.43 47.15 6826 11.30 7421 11.32 7639 11.1353.93 54.26 61.76 63.22 32.40 33.55 43.07 53293 19.45 53466 19.59 69026 18.1247.71 45.76 32.57 34.34 42.72 43.46 44.83 690091 12.25 712804 12.31 737297 12.68
% To Total % To Total % To Total % To Total
2008-09 2009-10 2008-09 2009-10 2007-08 2008-09 2009-10 Number Teachers Number Teachers Number Teachers
% Schools with
PTR > 30 Primary% Distribution of Female
Teachers (All Schools)
% Distribution of SC Teachers to Total Teachers
2007-08 2008-09 2009-10
% Schools with
PTR > 35 Upper Primary
16 Elementary Education in India
A & N IslandsAndhra PradeshArunachal PradeshAssamBiharChandigarhChhattisgarhDadra & Nagar HaveliDaman & DiuDelhiGoaGujaratHaryanaHimachal PradeshJammu & KashmirJharkhandKarnatakaKeralaLakshadweepMadhya PradeshMaharashtraManipurMeghalayaMizoramNagalandOrissaPuducherryPunjabRajasthanSikkimTamil NaduTripuraUttar PradeshUttarakhandWest Bengal
All States
State/UT
266 7.16 292 7.61 352 7.12 134 3.61 236 6.15 505 10.2133272 6.41 33095 6.51 33358 6.65 199504 38.45 195619 38.51 197266 39.3110213 65.51 11685 67.38 12149 67.52 538 3.45 556 3.21 580 3.2241228 17.02 43809 16.77 37689 16.69 71763 29.63 77081 29.51 69569 30.8014934 4.54 13279 3.92 12564 3.77 147962 45.03 153859 45.46 151972 45.66
12 0.22 15 0.26 10 0.20 232 4.20 299 5.19 255 5.1844529 28.74 51158 29.68 51173 29.78 58390 37.69 64479 37.40 64693 37.64
719 52.14 740 51.82 756 52.46 58 4.21 72 5.04 69 4.7940 5.75 30 4.02 39 4.65 202 29.02 319 42.70 344 41.05
2131 2.09 1988 2.19 2657 2.81 8019 7.87 8159 9.00 9291 9.82107 1.37 159 1.88 140 1.88 514 6.60 593 7.02 595 7.99
35236 15.03 35372 14.86 36354 14.94 63643 27.14 65213 27.40 68686 28.23525 0.50 561 0.48 147 0.13 21764 20.56 23120 19.89 23153 21.02
3664 5.77 3910 6.17 3967 6.14 6599 10.39 6626 10.46 6902 10.688874 8.28 10838 8.72 10969 8.84 6262 5.84 9356 7.53 9598 7.73
40030 26.99 40014 26.30 38649 26.15 59567 40.16 61801 40.61 60618 41.017724 2.94 9709 3.64 12104 4.34 62062 23.69 124097 46.46 134616 48.234184 2.58 3094 2.33 3458 2.52 64489 39.74 55194 41.56 57331 41.79
539 97.64 656 98.35 716 96.50 1 0.18 4 0.60 11 1.4862272 14.46 63211 14.51 64267 14.57 132335 30.74 134934 30.97 138746 31.4636453 6.33 38713 6.66 39646 7.43 179823 31.25 193628 33.31 127557 23.928984 36.23 9080 37.56 8718 37.22 1435 5.79 1383 5.72 1422 6.07
31191 90.01 34730 89.71 34286 90.47 418 1.21 503 1.30 434 1.1515730 96.17 16733 96.93 15925 96.83 130 0.79 105 0.61 96 0.5817135 83.67 17772 83.68 17494 82.62 382 1.91 429 2.02 477 2.2525727 11.57 30629 12.44 27025 14.85 81480 36.64 93356 37.92 64701 35.54
50 1.41 42 0.41 31 0.29 1494 - 645 6.30 7279 67.08617 0.77 690 0.67 412 0.40 9190 11.52 11965 11.57 12611 12.12
33591 7.95 40562 8.95 41828 9.12 155066 36.72 168410 37.16 172810 37.673264 38.88 3124 37.58 3973 39.44 2961 35.27 2933 35.28 3948 39.192228 0.70 2418 0.74 3009 0.91 242874 76.68 250966 76.66 253275 76.70
10386 33.41 10141 33.80 10586 37.48 5136 16.52 5128 17.09 4633 16.404943 0.77 4987 0.77 5599 0.80 235087 36.48 242527 37.24 263252 37.721717 2.84 1800 2.75 1828 2.66 8286 13.71 9589 14.63 10221 14.90
12208 4.45 12488 4.58 15699 4.12 18303 6.68 18980 6.95 26908 7.06514723 9.14 547524 9.46 547577 9.41 1846103 32.76 1982164 34.23 1944424 33.43
Number% To TotalTeachers
Number% To TotalTeachers
Number% To TotalTeachers
Number% To TotalTeachers
Number% To TotalTeachers
Number% To TotalTeachers
2007-08 2008-09 2009-10 2007-08 2008-09 2009-10
% Distribution of ST Teachers to Total Teachers% Distribution of OBC Teachers to Total Teachers
OBC : Other Backward Class.
DISE 2009-10: Flash Statistics 17
A & N IslandsAndhra PradeshArunachal PradeshAssamBiharChandigarhChhattisgarhDadra & Nagar HaveliDaman & DiuDelhiGoaGujaratHaryanaHimachal PradeshJammu & KashmirJharkhandKarnatakaKeralaLakshadweepMadhya PradeshMaharashtraManipurMeghalayaMizoramNagalandOrissaPuducherryPunjabRajasthanSikkimTamil NaduTripuraUttar PradeshUttarakhandWest Bengal
All States
State/UT
98.92 97.62 99.55 94.42 100.00 100.00 95.72 90.40 83.93 90.79 90.91 95.73 100.00 100.00 58.33 72.7389.59 94.60 98.53 97.41 97.80 98.28 78.71 87.23 41.29 47.12 40.66 45.65 73.34 75.94 41.15 50.8625.02 26.30 23.49 76.61 38.94 48.21 21.18 25.13 7.31 7.48 6.12 5.76 37.50 44.71 10.83 8.9240.95 46.66 49.74 86.72 11.34 9.98 13.89 11.79 13.41 12.90 13.38 12.87 13.74 12.15 15.28 15.4440.93 49.50 40.92 92.79 NR 97.26 27.87 32.65 33.48 34.36 33.47 34.34 100.00 100.00 100.00 100.0099.90 98.82 99.90 94.66 100.00 100.00 99.89 98.28 100.00 99.61 100.00 99.59 100.00 100.00 100.00 100.0058.90 62.37 67.37 96.88 72.77 55.45 33.72 32.01 51.12 55.10 56.93 58.16 41.55 45.26 24.42 19.1293.83 96.11 99.84 99.33 100.00 100.00 70.48 72.68 100.00 100.00 100.00 100.00 100.00 100.00 100.00 100.0091.95 90.48 99.37 97.04 56.14 79.45 88.54 73.76 100.00 60.00 100.00 100.00 100.00 38.46 100.00 55.5699.09 100.00 99.37 94.49 99.24 100.00 98.80 100.00 97.38 100.00 98.10 100.00 100.00 100.00 96.27 100.0095.22 96.70 97.38 95.48 95.85 98.37 44.52 73.22 66.67 84.13 59.14 81.82 96.15 94.12 61.54 50.0095.34 96.83 99.62 93.69 94.45 95.24 84.07 86.49 94.22 93.88 98.32 98.72 95.82 93.91 90.76 90.7788.84 91.59 96.48 97.83 81.90 84.67 73.10 78.51 97.49 98.05 98.55 99.04 50.00 58.18 64.35 64.1591.43 94.81 98.86 98.74 99.22 99.53 79.36 83.10 78.31 78.98 78.62 79.26 100.00 100.00 71.18 75.8654.02 50.19 76.71 95.04 51.16 ** 35.71 34.38 31.36 29.07 31.30 29.03 - ** 36.16 31.4180.34 84.25 88.21 86.60 85.59 76.45 43.05 42.48 39.85 41.83 39.86 41.85 44.51 45.61 34.92 32.7195.09 95.84 97.96 98.37 97.23 96.40 89.03 88.69 91.36 90.54 97.12 96.56 80.00 94.39 79.68 77.8098.61 97.20 98.90 92.27 98.93 98.12 93.85 91.75 91.14 96.52 97.79 97.41 97.34 96.46 93.65 93.07
100.00 97.97 100.00 84.83 ** ** ** ** 100.00 100.00 100.00 100.00 ** ** ** **61.20 71.61 83.40 53.41 31.86 64.42 38.12 41.22 32.49 39.86 48.54 61.63 29.03 30.51 28.04 30.1799.06 99.15 99.57 99.86 99.50 98.98 97.16 97.91 86.25 90.24 80.08 87.21 97.13 98.14 95.10 94.9936.31 39.23 38.65 95.30 46.64 51.88 20.78 20.95 31.70 21.08 38.32 25.23 13.33 13.84 27.45 25.1132.12 30.96 46.20 82.69 28.25 27.39 21.16 18.11 15.07 15.15 25.41 23.75 15.46 16.06 8.04 8.1667.97 70.24 77.33 94.97 63.96 31.19 31.13 21.47 21.76 18.65 31.28 29.77 14.52 20.11 6.11 6.5521.72 26.46 27.16 71.94 - 5.88 14.93 17.21 37.57 31.11 43.27 34.37 100.00 100.00 29.87 27.3878.23 89.07 82.20 98.83 78.78 88.84 51.78 46.25 54.12 56.21 53.72 56.22 56.07 61.09 56.38 52.7497.57 97.69 99.05 93.18 98.72 99.58 95.93 96.54 91.46 91.94 98.08 98.39 100.00 100.00 86.13 81.0191.96 100.00 97.39 93.60 94.33 100.00 73.95 100.00 66.71 100.00 66.51 100.00 83.15 100.00 64.68 100.0082.55 86.02 93.26 98.66 84.62 78.35 67.05 73.00 82.66 79.06 85.79 83.33 57.69 60.87 62.03 59.9236.14 43.93 33.61 87.13 32.55 38.13 15.76 19.25 32.26 36.62 31.82 35.71 0.00 40.00 37.50 40.0094.45 96.06 99.21 94.99 99.42 99.36 87.49 90.44 88.85 87.59 95.71 95.89 92.17 90.85 85.90 84.3541.76 46.27 43.92 91.88 40.43 34.39 18.81 18.23 21.24 36.19 21.55 38.81 25.00 40.00 13.64 24.7784.59 83.95 95.67 98.82 77.80 79.87 68.57 67.33 33.71 34.00 33.40 33.72 56.33 57.44 54.21 49.1280.49 84.39 96.88 98.14 81.68 93.69 50.55 55.45 43.63 42.93 43.63 42.32 60.95 82.11 41.77 41.8178.47 53.21 79.06 98.07 82.72 78.66 14.29 16.55 18.80 19.14 18.04 18.97 29.34 35.80 32.00 16.9481.89 81.01 85.79 85.27 89.20 84.56 71.30 68.79 40.90 44.64 41.06 44.12 56.88 63.78 47.81 48.00
2008-09 2009-10 2008-09 2009-10 2008-09 2009-10 2008-09 2009-10 2008-09 2009-10 2008-09 2009-10 2008-09 2009-10 2008-09 2009-10
Percentage Distribution of Professionally Trained Regular Teachers
Private AidedManagements
Private UnaidedManagementsAll Schools
GovernmentManagements All Schools
All GovernmentSchools
All Aided Schools All Unaided Schools
% Distribution of Professionally Trained Contractual-Teachers
** State does not have such school type.
18 Elementary Education in India
A & N IslandsAndhra PradeshArunachal PradeshAssamBiharChandigarhChhattisgarhDadra & Nagar HaveliDaman & DiuDelhiGoaGujaratHaryanaHimachal PradeshJammu & KashmirJharkhandKarnatakaKeralaLakshadweepMadhya PradeshMaharashtraManipurMeghalayaMizoramNagalandOrissaPuducherryPunjabRajasthanSikkimTamil NaduTripuraUttar PradeshUttarakhandWest Bengal
All States
State/UT
AllSchools
AllGovernment
Schools
All AidedSchools
All UnaidedSchools
Percentage Teachers Aged 55 Year & Above
2007-08 2008-09 2009-10 2007-08 2008-09 2009-10 2007-08 2008-09 2009-10 2007-08 2008-09 2009-10
All Schools Government Managements Aided Managements Unaided Managements
Percentage Distribution of Teachers Received In-Service Training during Previous Academic Year*
16.93 15.14 29.86 17.99 16.62 34.33 0.00 0.00 0.00 11.78 6.90 3.45 5.93 6.56 9.86 1.2737.81 32.68 27.00 50.42 50.09 41.76 34.01 28.05 24.89 0.95 0.70 0.57 2.24 1.98 7.71 2.14
8.25 9.44 6.17 8.22 11.18 7.36 5.28 0.21 0.65 0.56 0.11 0.28 2.10 2.20 2.95 0.9828.40 34.86 46.89 29.95 39.72 55.35 17.18 24.02 30.66 6.34 3.67 2.88 7.15 9.32 0.69 2.1744.46 20.39 11.11 42.33 20.41 11.11 15.06 NR 2.74 3.88 NR 0.00 9.54 9.54 27.78 0.0015.00 23.87 15.56 23.58 31.70 25.39 0.00 9.46 0.92 1.38 11.53 0.65 5.58 5.77 5.50 5.2735.69 43.21 50.69 41.56 51.47 60.82 6.07 9.59 7.69 1.11 1.61 1.89 5.39 5.93 10.99 2.0677.08 80.69 80.50 90.69 94.67 94.87 0.00 54.17 67.39 0.00 2.56 0.00 2.09 2.45 2.17 0.0026.72 24.66 50.60 32.67 32.58 78.98 - 7.50 7.07 1.75 0.00 0.00 5.97 7.81 3.03 2.8626.62 35.26 37.55 39.90 55.08 60.89 5.08 17.69 23.59 4.87 9.04 7.93 6.98 9.43 11.87 3.2251.20 47.53 60.31 63.48 60.23 74.81 43.48 39.27 55.56 7.09 11.17 14.73 12.00 15.03 10.86 3.4771.07 67.24 62.77 84.92 81.90 78.08 36.64 34.19 23.91 14.51 12.96 10.31 3.72 3.97 4.70 2.6747.09 NR NR 62.09 NR NR 1.67 0.00 0.08 0.57 0.01 0.18 4.64 5.41 7.55 2.0255.07 60.53 57.64 57.34 78.45 75.03 8.89 8.76 4.66 1.07 0.79 0.63 1.81 1.73 5.08 2.0027.95 22.68 19.71 24.35 34.55 30.80 0.00 0.00 ** 1.47 1.31 0.55 2.38 2.00 ** 3.0536.92 28.02 21.02 18.52 31.07 22.86 14.59 7.99 10.11 1.02 1.84 0.53 9.11 8.89 17.40 5.5636.17 49.97 67.48 48.38 66.43 96.60 17.86 41.51 21.83 2.72 2.20 0.95 3.90 3.96 9.03 2.5463.77 70.63 72.42 62.86 70.93 74.15 67.25 73.97 75.82 34.12 30.13 31.68 1.19 1.00 1.02 3.9450.72 68.62 59.78 50.91 68.62 59.78 ** ** ** ** ** ** 6.53 6.53 ** **39.37 41.73 40.98 59.30 64.52 63.65 5.46 1.22 3.87 2.05 0.86 1.43 5.11 6.41 22.23 2.1915.98 21.51 22.76 24.73 32.24 33.75 8.76 10.89 11.70 3.15 2.65 3.05 3.92 3.88 4.56 2.35
8.52 3.05 5.75 13.74 5.04 9.94 10.59 5.91 8.63 0.94 0.18 0.46 5.91 8.13 16.35 1.4120.72 17.75 19.37 19.06 21.28 26.12 22.57 17.53 18.95 12.79 8.77 5.95 2.61 4.54 2.06 1.0836.03 42.10 38.59 38.25 51.13 48.46 31.52 44.06 38.32 5.46 9.05 2.74 3.58 4.26 1.49 1.0112.49 13.25 6.06 17.82 18.96 9.08 - - 5.88 2.99 3.55 1.45 2.10 2.71 0.00 1.1845.47 39.47 53.60 35.71 46.32 57.95 10.78 10.40 49.34 4.00 2.22 2.58 4.76 5.03 3.58 1.87
8.14 15.27 21.02 13.52 25.84 41.08 5.04 15.61 9.36 0.07 0.90 1.28 7.20 12.47 7.82 1.2455.58 49.63 57.87 63.28 62.70 76.31 0.90 1.63 0.41 0.43 0.59 0.54 4.20 4.14 9.92 3.5739.70 33.31 29.12 56.52 53.06 47.74 2.05 1.07 0.50 0.89 0.92 0.46 3.51 4.59 6.50 1.73
0.31 0.10 0.94 0.33 0.11 1.18 0.00 0.00 0.19 0.29 0.07 0.00 3.72 4.16 3.23 1.6253.81 53.49 54.32 81.96 84.17 85.79 76.70 78.52 85.71 0.63 0.46 0.35 3.06 3.41 5.34 1.5233.60 22.82 33.89 34.90 24.57 36.10 8.40 1.43 9.76 1.31 4.13 3.65 6.72 6.79 12.92 3.1815.00 15.94 14.01 11.85 23.48 20.52 0.91 0.37 0.36 0.57 0.27 0.36 12.79 15.54 20.20 4.3343.60 51.88 48.32 53.67 74.03 70.51 7.59 24.70 41.84 1.35 1.91 1.31 8.24 10.11 19.05 2.7751.57 50.62 42.12 49.07 52.37 50.55 21.65 25.79 18.52 0.28 7.36 1.52 11.33 12.50 12.57 5.2236.81 35.08 35.03 43.44 46.06 46.67 27.80 30.17 32.42 2.32 1.93 1.68 6.00 7.15 5.87 2.64
NR : Data not reported.** State does not have such school type.
2009-10

DISE 2009-10: Flash Statistics 19
A & N IslandsAndhra PradeshArunachal PradeshAssamBiharChandigarhChhattisgarhDadra & Nagar HaveliDaman & DiuDelhiGoaGujaratHaryanaHimachal PradeshJammu & KashmirJharkhandKarnatakaKeralaLakshadweepMadhya PradeshMaharashtraManipurMeghalayaMizoramNagalandOrissaPuducherryPunjabRajasthanSikkimTamil NaduTripuraUttar PradeshUttarakhandWest Bengal
All States
State/UT 2007-08 2008-09 2009-10 All Schools
% TeachersInvolved
Number ofDays
Involved
% TeachersInvolved
Numberof DaysInvolved
% TeachersInvolved
Numberof DaysInvolved
Percentage Teachers Involved in Non-Teaching Assignments to Total Teachers(Including Contractual Teachers) during Previous Academic Year
% Distribution of Contractual-Teachersto Total Teachers
11.28 11 11.20 11 23.37 11 1.11 1.47 3.07 1.35 2.76 0.00 2.82 2.51 5.1817.14 12 8.75 13 16.43 9 15.19 11.20 10.65 16.51 13.93 5.56 5.98 1.92 5.215.32 23 7.98 19 5.47 17 17.31 16.32 14.48 17.24 14.41 7.43 9.23 13.61 17.256.12 22 12.06 15 22.08 14 8.03 7.84 6.97 9.96 9.17 0.74 0.56 1.52 1.73
13.90 24 2.68 31 0.92 26 7.16 7.14 6.88 7.14 6.88 0.00 0.00 1.37 7.5521.36 9 4.37 11 2.72 15 1.49 16.91 20.76 26.27 32.57 1.35 9.17 2.08 2.495.82 18 4.57 22 12.35 19 9.11 10.05 35.87 9.85 39.80 7.29 17.59 11.30 17.090.00 0 0.21 2 0.00 0 0.07 0.00 0.07 0.00 0.08 0.00 0.00 0.00 0.008.86 23 27.18 16 29.59 17 3.11 0.55 5.97 0.19 2.84 0.00 26.26 2.59 4.27
10.93 24 17.75 20 17.44 20 2.37 1.39 2.80 1.44 3.48 0.38 0.22 1.43 2.1724.55 17 16.40 17 25.04 14 1.28 1.59 0.85 2.65 1.44 0.56 0.45 7.26 0.356.10 13 6.72 11 11.11 8 1.04 1.08 0.90 0.54 0.42 3.96 3.09 2.82 2.438.30 17 2.28 18 5.13 13 12.49 11.21 12.30 14.92 16.71 1.04 1.40 1.25 1.16
14.47 18 15.09 14 14.41 15 16.20 15.52 16.66 19.21 19.65 8.29 8.90 3.18 6.8512.39 11 10.78 11 6.30 9 22.44 24.29 19.99 37.26 31.12 0.00 ** 0.90 0.768.41 28 6.30 31 3.70 36 44.57 47.26 50.75 53.05 56.21 2.72 3.23 3.58 3.290.55 7 14.00 13 7.30 15 0.00 0.52 0.54 0.49 0.49 0.64 0.65 0.59 0.66
21.04 6 19.21 7 20.32 7 2.63 2.29 2.06 2.66 2.33 1.86 1.76 4.71 3.2140.58 14 28.19 13 15.77 9 0.55 0.00 0.27 0.00 0.27 0.00 ** ** **4.43 21 3.82 24 5.27 20 1.42 1.02 0.36 0.34 0.17 1.03 1.11 2.30 0.673.01 14 1.87 15 3.72 11 1.09 1.72 1.81 1.98 2.29 1.37 1.17 1.56 1.377.34 28 5.83 22 20.95 15 1.52 0.93 3.79 0.87 0.97 0.90 16.63 1.00 4.55
31.82 17 29.32 18 25.86 17 6.36 7.96 6.57 3.28 3.03 8.65 6.78 17.30 13.6517.24 6 18.87 4 23.45 7 24.66 27.88 26.34 22.24 17.09 35.94 46.98 47.63 57.6914.29 13 14.61 12 7.38 27 0.94 0.85 0.85 0.78 0.75 0.00 0.00 0.98 1.0024.73 12 11.99 15 4.07 16 25.09 NR 37.27 NR 40.88 NR 5.81 NR 4.022.60 19 4.59 22 4.37 29 2.05 2.40 1.94 1.92 2.39 0.61 0.83 3.42 1.68
13.63 20 13.94 20 23.61 13 1.59 4.98 4.37 5.88 5.38 2.26 3.07 1.50 0.967.13 12 3.49 13 5.51 21 7.88 5.99 5.24 8.39 7.08 2.49 2.22 2.06 2.441.88 11 0.18 14 0.67 13 0.66 0.37 0.70 0.34 0.70 0.28 0.96 0.54 0.63
15.73 9 7.43 12 6.04 10 0.66 0.57 0.44 0.28 0.21 0.35 0.28 1.05 0.803.34 49 1.71 35 11.10 16 3.00 3.12 2.06 3.18 1.79 1.53 0.92 3.19 7.368.53 11 8.14 13 5.10 15 25.90 26.26 25.06 38.35 36.39 1.10 1.13 1.18 1.34
11.92 18 14.55 18 9.75 22 7.01 7.93 7.62 9.23 8.85 3.63 3.59 5.42 5.4928.17 13 27.10 13 23.05 15 14.51 16.89 12.92 16.80 15.34 20.09 10.77 1.56 0.8910.84 14 8.59 15 9.55 14 10.48 9.39 10.97 12.61 14.39 2.29 1.91 2.14 2.58
NR : Data not reported.** State does not have such school type.
% Distribution of Contractual-Teachers to Total Teachers
All Government Schools All Aided Schools All Unaided Schools
2007-08 2008-09 2009-10 2008-09 2009-10 2008-09 2009-10 2008-09 2009-10
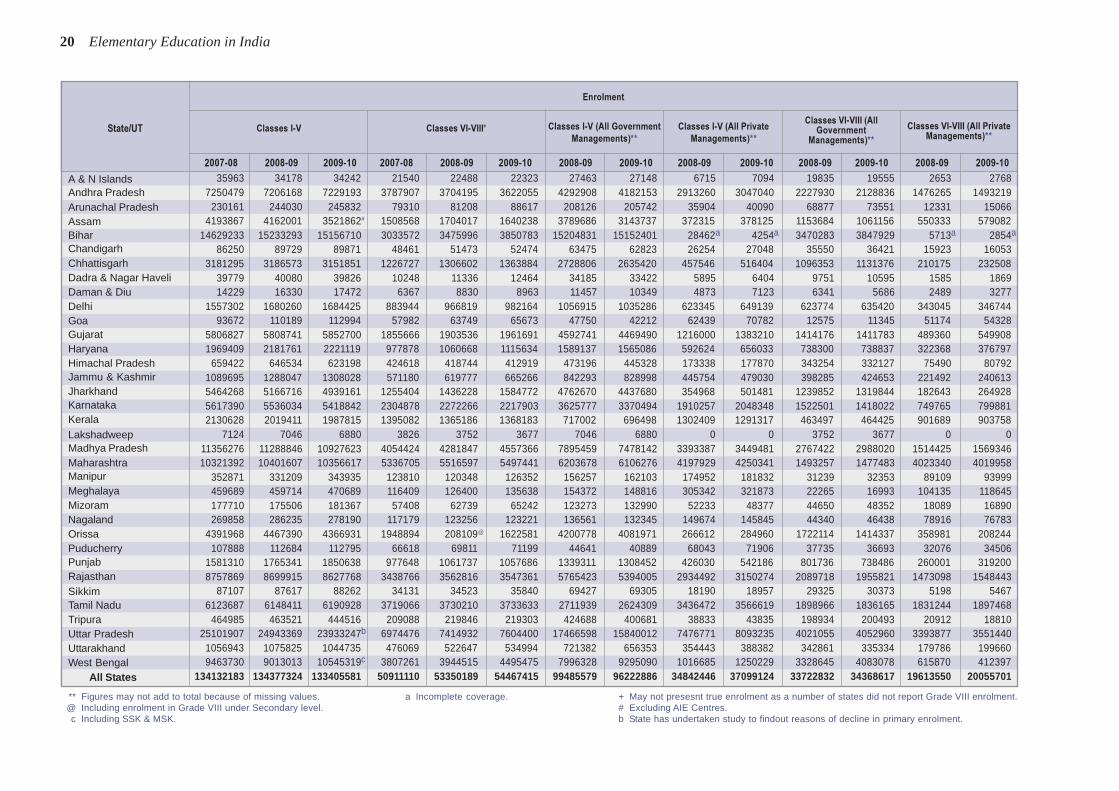
20 Elementary Education in India
A & N IslandsAndhra PradeshArunachal PradeshAssamBiharChandigarhChhattisgarhDadra & Nagar HaveliDaman & DiuDelhiGoaGujaratHaryanaHimachal PradeshJammu & KashmirJharkhandKarnatakaKeralaLakshadweepMadhya PradeshMaharashtraManipurMeghalayaMizoramNagalandOrissaPuducherryPunjabRajasthanSikkimTamil NaduTripuraUttar PradeshUttarakhandWest Bengal
All States
State/UT
35963 34178 34242 21540 22488 22323 27463 27148 6715 7094 19835 19555 2653 27687250479 7206168 7229193 3787907 3704195 3622055 4292908 4182153 2913260 3047040 2227930 2128836 1476265 1493219
230161 244030 245832 79310 81208 88617 208126 205742 35904 40090 68877 73551 12331 150664193867 4162001 3521862# 1508568 1704017 1640238 3789686 3143737 372315 378125 1153684 1061156 550333 579082
14629233 15233293 15156710 3033572 3475996 3850783 15204831 15152401 28462a 4254a 3470283 3847929 5713a 2854a
86250 89729 89871 48461 51473 52474 63475 62823 26254 27048 35550 36421 15923 160533181295 3186573 3151851 1226727 1306602 1363884 2728806 2635420 457546 516404 1096353 1131376 210175 232508
39779 40080 39826 10248 11336 12464 34185 33422 5895 6404 9751 10595 1585 186914229 16330 17472 6367 8830 8963 11457 10349 4873 7123 6341 5686 2489 3277
1557302 1680260 1684425 883944 966819 982164 1056915 1035286 623345 649139 623774 635420 343045 34674493672 110189 112994 57982 63749 65673 47750 42212 62439 70782 12575 11345 51174 54328
5806827 5808741 5852700 1855666 1903536 1961691 4592741 4469490 1216000 1383210 1414176 1411783 489360 5499081969409 2181761 2221119 977878 1060668 1115634 1589137 1565086 592624 656033 738300 738837 322368 376797
659422 646534 623198 424618 418744 412919 473196 445328 173338 177870 343254 332127 75490 807921089695 1288047 1308028 571180 619777 665266 842293 828998 445754 479030 398285 424653 221492 2406135464268 5166716 4939161 1255404 1436228 1584772 4762670 4437680 354968 501481 1239852 1319844 182643 2649285617390 5536034 5418842 2304878 2272266 2217903 3625777 3370494 1910257 2048348 1522501 1418022 749765 7998812130628 2019411 1987815 1395082 1365186 1368183 717002 696498 1302409 1291317 463497 464425 901689 903758
7124 7046 6880 3826 3752 3677 7046 6880 0 0 3752 3677 0 011356276 11288846 10927623 4054424 4281847 4557366 7895459 7478142 3393387 3449481 2767422 2988020 1514425 156934610321392 10401607 10356617 5336705 5516597 5497441 6203678 6106276 4197929 4250341 1493257 1477483 4023340 4019958
352871 331209 343935 123810 120348 126352 156257 162103 174952 181832 31239 32353 89109 93999459689 459714 470689 116409 126400 135638 154372 148816 305342 321873 22265 16993 104135 118645177710 175506 181367 57408 62739 65242 123273 132990 52233 48377 44650 48352 18089 16890269858 286235 278190 117179 123256 123221 136561 132345 149674 145845 44340 46438 78916 76783
4391968 4467390 4366931 1948894 208109@ 1622581 4200778 4081971 266612 284960 1722114 1414337 358981 208244107888 112684 112795 66618 69811 71199 44641 40889 68043 71906 37735 36693 32076 34506
1581310 1765341 1850638 977648 1061737 1057686 1339311 1308452 426030 542186 801736 738486 260001 3192008757869 8699915 8627768 3438766 3562816 3547361 5765423 5394005 2934492 3150274 2089718 1955821 1473098 1548443
87107 87617 88262 34131 34523 35840 69427 69305 18190 18957 29325 30373 5198 54676123687 6148411 6190928 3719066 3730210 3733633 2711939 2624309 3436472 3566619 1898966 1836165 1831244 1897468
464985 463521 444516 209088 219846 219303 424688 400681 38833 43835 198934 200493 20912 1881025101907 24943369 23933247b 6974476 7414932 7604400 17466598 15840012 7476771 8093235 4021055 4052960 3393877 3551440
1056943 1075825 1044735 476069 522647 534994 721382 656353 354443 388382 342861 335334 179786 1996609463730 9013013 10545319c 3807261 3944515 4495475 7996328 9295090 1016685 1250229 3328645 4083078 615870 412397
134132183 134377324 133405581 50911110 53350189 54467415 99485579 96222886 34842446 37099124 33722832 34368617 19613550 20055701
Enrolment
Classes I-V
2007-08 2008-09 2009-10 2007-08 2008-09 2009-10 2008-09 2009-10 2008-09 2009-10 2008-09 2009-10 2008-09 2009-10
Classes VI-VIII+ Classes I-V (All Government
Managements)**
Classes I-V (All Private
Managements)**
Classes VI-VIII (AllGovernment
Managements)**
Classes VI-VIII (All PrivateManagements)**
** Figures may not add to total because of missing values.@ Including enrolment in Grade VIII under Secondary level.c Including SSK & MSK.
+ May not presesnt true enrolment as a number of states did not report Grade VIII enrolment.# Excluding AIE Centres.b State has undertaken study to findout reasons of decline in primary enrolment.
a Incomplete coverage.

DISE 2009-10: Flash Statistics 21
A & N IslandsAndhra PradeshArunachal PradeshAssamBiharChandigarhChhattisgarhDadra & Nagar HaveliDaman & DiuDelhiGoaGujaratHaryanaHimachal PradeshJammu & KashmirJharkhandKarnatakaKeralaLakshadweepMadhya PradeshMaharashtraManipurMeghalayaMizoramNagalandOrissaPuducherryPunjabRajasthanSikkimTamil NaduTripuraUttar PradeshUttarakhandWest Bengal
All States
State/UT
79.28 2.59 18.13 20.72 87.60 3.00 9.40 12.40 82.57 2.75 14.69 17.4357.85 4.73 37.42 42.15 58.77 5.29 35.94 41.23 58.16 4.91 36.93 41.8483.69 4.95 11.35 16.31 83.00 7.01 9.99 17.00 83.51 5.50 10.99 16.4989.26 5.64 5.10 10.74 64.70 30.26 5.05 35.30 81.46 13.46 5.08 18.5499.97 0.02 0.01 0.03 99.93 0.04 0.03 0.07 99.96 0.03 0.01 0.0469.90 1.45 28.65 30.10 69.41 3.03 27.56 30.59 69.72 2.03 28.25 30.2883.61 1.41 14.97 16.38 82.95 1.81 15.24 17.05 83.41 1.53 15.05 16.5883.92 2.83 13.25 16.08 85.00 3.26 11.74 15.00 84.18 2.94 12.89 15.8259.23 12.36 28.41 40.77 63.44 20.92 15.64 36.56 60.66 15.26 24.08 39.3461.46 2.88 35.66 38.54 64.70 5.65 29.66 35.30 62.65 3.90 33.45 37.3537.36 51.76 10.88 62.64 17.27 80.41 2.31 82.73 29.98 62.29 7.73 70.0276.37 2.75 20.88 23.63 71.97 4.63 23.40 28.03 75.26 3.22 21.52 24.7470.46 3.67 25.87 29.54 66.23 4.72 29.06 33.77 69.05 4.02 26.93 30.9571.46 0.41 28.13 28.54 80.43 0.78 18.78 19.57 75.04 0.56 24.40 24.9663.38 0.00 36.62 36.62 63.83 0.00 36.17 36.17 63.53 0.00 36.47 36.4789.85 4.77 5.39 10.15 83.28 7.37 9.34 16.72 88.25 5.40 6.35 11.7562.20 8.67 29.13 37.80 63.94 10.55 25.52 36.06 62.70 9.21 28.08 37.3035.04 58.01 6.95 64.96 33.94 60.14 5.92 66.06 34.59 58.88 6.53 65.41
100.00 0.00 0.00 0.00 100.00 0.00 0.00 0.00 100.00 0.00 0.00 0.0068.43 1.30 30.26 31.57 65.56 1.28 33.15 34.44 67.59 1.30 31.11 32.4158.96 26.29 14.75 41.04 26.88 61.70 11.43 73.12 47.83 38.57 13.60 52.1747.13 10.07 42.79 52.87 25.61 9.10 65.30 74.39 41.35 9.81 48.84 58.6531.62 57.15 11.23 68.38 12.53 77.50 9.98 87.47 27.35 61.70 10.95 72.6573.33 1.63 25.04 26.67 74.11 3.35 22.54 25.89 73.53 2.09 24.38 26.4747.57 0.11 52.32 52.43 37.69 0.17 62.15 62.31 44.54 0.12 55.34 55.4693.47 1.01 5.52 6.53 87.17 6.93 5.91 12.83 91.77 2.61 5.62 8.2336.25 13.43 50.32 63.75 51.54 15.14 33.33 48.46 42.17 14.09 43.74 57.8370.70 4.13 25.16 29.30 69.82 7.31 22.87 30.18 70.38 5.29 24.33 29.6262.52 1.32 35.19 36.51 55.13 1.76 41.89 43.65 60.37 1.45 37.15 38.5978.52 5.67 15.81 21.48 84.75 7.76 7.50 15.25 80.32 6.27 13.41 19.6842.39 20.98 36.63 57.61 49.18 28.31 22.51 50.82 44.94 23.74 31.32 55.0690.14 2.37 7.50 9.86 91.42 3.89 4.68 8.58 90.56 2.87 6.57 9.4466.18 3.80 30.02 33.82 53.30 13.25 33.45 46.70 63.08 6.08 30.85 36.9262.82 1.07 36.10 37.18 62.68 13.22 24.10 37.32 62.78 5.19 32.04 37.2288.14 1.04 10.82 11.86 90.83 5.46 3.71 9.17 88.95 2.36 8.69 11.0572.13 6.43 21.38 27.81 63.10 15.38 21.44 36.82 69.51 9.03 21.39 30.42
Enrolment
Classes I-V: 2009-10 Classes VI-VIII: 2009-10 Classes I-VIII (2009-10)
% Enrolment inAll
GovernmentManagements*
% Enrolment inPrivate Aided
Managements*
% Enrolment inPrivate UnaidedManagements*
% Enrolmentin Private
Managements*
% Enrolment inAll GovernmentManagements*
% Enrolment inPrivate Aided
Managements*
% Enrolment inPrivate UnaidedManagements*
% Enrolmentin Private
Managements*
% Enrolment inAll GovernmentManagements*
% Enrolment inPrivate Aided
Managements*
% Enrolment inPrivate UnaidedManagements*
% Enrolmentin Private
Managements*
* Total may not add to 100 because of rounding of figures and no responses.

22 Elementary Education in India
A & N IslandsAndhra PradeshArunachal PradeshAssamBiharChandigarhChhattisgarhDadra & Nagar HaveliDaman & DiuDelhiGoaGujaratHaryanaHimachal PradeshJammu & KashmirJharkhandKarnatakaKeralaLakshadweepMadhya PradeshMaharashtraManipurMeghalayaMizoramNagalandOrissaPuducherryPunjabRajasthanSikkimTamil NaduTripuraUttar PradeshUttarakhandWest Bengal
All States
State/UT
0.74 0.69 0.99 0.93 48.76 48.97 48.74 47.50 47.45 47.96 0.95 0.96 0.95 0.90 0.90 0.920.69 0.62 0.51 0.44 49.26 49.35 49.20 48.57 48.91 49.07 0.97 0.97 0.97 0.94 0.96 0.960.92 2.94 0.68 2.17 47.91 48.02 48.50 47.20 47.34 48.15 0.92 0.92 0.94 0.89 0.90 0.931.26 1.02 0.67 0.55 49.35 49.36 49.68 50.14 50.68 51.17 0.97 0.97 0.99 1.01 1.03 1.050.69 0.72 0.70 0.71 46.56 47.45 47.80 43.04 45.19 46.44 0.87 0.90 0.92 0.76 0.82 0.870.40 0.54 0.56 0.92 44.72 45.04 45.51 44.63 44.81 44.38 0.81 0.82 0.84 0.81 0.81 0.800.52 0.51 0.50 0.50 48.88 48.87 49.02 47.99 48.27 48.77 0.96 0.96 0.96 0.92 0.93 0.950.36 0.19 0.46 0.25 47.68 47.73 47.65 43.03 44.03 44.60 0.91 0.91 0.91 0.76 0.79 0.810.45 0.52 0.19 0.26 46.73 46.53 46.29 44.23 49.60 46.95 0.88 0.87 0.86 0.79 0.98 0.880.36 0.29 0.67 0.55 46.92 46.78 46.92 46.08 46.19 45.99 0.88 0.88 0.88 0.85 0.86 0.850.34 0.46 0.28 0.49 48.46 48.34 47.99 45.92 46.17 46.54 0.94 0.94 0.92 0.85 0.86 0.870.90 0.85 0.90 0.90 46.70 46.76 46.64 45.31 45.73 45.74 0.88 0.88 0.87 0.83 0.84 0.840.49 0.45 0.34 0.28 46.06 47.24 47.10 46.63 47.93 47.44 0.85 0.90 0.89 0.87 0.92 0.900.99 0.84 0.97 0.90 47.30 47.36 47.49 47.24 47.28 47.21 0.90 0.90 0.90 0.90 0.90 0.890.88 0.92 0.75 0.80 46.47 47.38 47.42 45.02 45.62 46.02 0.87 0.90 0.90 0.82 0.84 0.850.51 0.55 0.55 0.62 49.02 49.32 49.52 46.39 47.31 48.75 0.96 0.97 0.98 0.87 0.90 0.950.84 1.04 0.90 1.22 48.44 48.40 48.36 48.28 48.21 48.17 0.94 0.94 0.94 0.93 0.93 0.932.10 2.76 2.30 3.20 49.62 49.54 49.60 48.93 48.85 48.91 0.98 0.98 0.98 0.96 0.96 0.962.98 2.21 4.40 2.69 49.27 50.50 50.22 46.73 48.72 49.82 0.97 1.02 1.01 0.88 0.95 0.990.55 0.55 0.66 0.61 48.91 49.28 49.32 45.71 47.20 48.48 0.96 0.97 0.97 0.84 0.89 0.940.81 0.79 0.52 0.54 47.13 47.10 47.09 46.81 47.00 46.86 0.89 0.89 0.89 0.88 0.89 0.880.72 0.60 0.44 0.31 49.69 49.93 49.91 49.00 49.85 49.95 0.99 1.00 1.00 0.96 0.99 1.000.60 0.63 0.44 0.51 50.18 50.35 50.28 52.37 53.37 52.99 1.01 1.01 1.01 1.10 1.14 1.131.72 2.77 1.48 2.07 48.62 48.41 48.44 49.09 49.19 49.20 0.95 0.94 0.94 0.96 0.97 0.970.45 0.86 0.24 0.33 49.01 49.03 48.71 48.67 48.79 49.08 0.96 0.96 0.95 0.95 0.95 0.961.33 1.30 1.06 1.19 48.83 48.87 48.80 47.58 48.08 48.52 0.95 0.96 0.95 0.91 0.93 0.940.75 0.64 0.95 0.87 49.58 48.49 48.50 49.00 47.96 47.86 0.98 0.94 0.94 0.96 0.92 0.920.61 0.98 0.58 0.76 45.97 45.45 45.29 46.27 45.70 45.15 0.85 0.83 0.83 0.86 0.84 0.821.16 1.00 0.94 0.92 46.66 46.39 46.57 40.84 41.76 42.66 0.87 0.87 0.87 0.69 0.72 0.740.51 0.56 0.34 0.29 49.45 49.40 48.87 54.07 53.81 54.33 0.98 0.98 0.96 1.18 1.17 1.190.62 0.67 0.78 0.94 48.43 48.52 48.55 48.07 48.03 48.20 0.94 0.94 0.94 0.93 0.92 0.930.55 0.57 0.56 0.54 48.33 48.69 48.68 49.05 48.99 49.16 0.94 0.95 0.95 0.96 0.96 0.970.46 0.37 0.45 0.36 49.21 49.38 49.47 48.52 49.23 50.05 0.97 0.98 0.98 0.94 0.97 1.000.56 0.58 0.42 0.39 48.79 48.25 48.13 48.83 48.63 48.81 0.95 0.93 0.93 0.95 0.95 0.950.96 1.04 0.79 0.86 49.09 49.22 49.43 49.62 50.25 51.39 0.96 0.97 0.98 0.98 1.01 1.060.75 0.75 0.71 0.74 48.22 48.38 48.46 46.99 47.58 48.12 0.93 0.94 0.94 0.89 0.91 0.93
2008-09 2009-10 2008-09 2009-10 2007-08 2008-09 2009-10 2007-08 2008-09 2009-10 2007-08 2008-09 2009-10 2007-08 2008-09 2009-10
% Girls’ Enrolment
Classes I-V Classes VI-VIII
Gender Parity Index (Enrolment)
Classes I-V Classes VI-VIII
% CWSN to Total Enrolment in
Elementary Classes
Primary Level Upper Primary Level
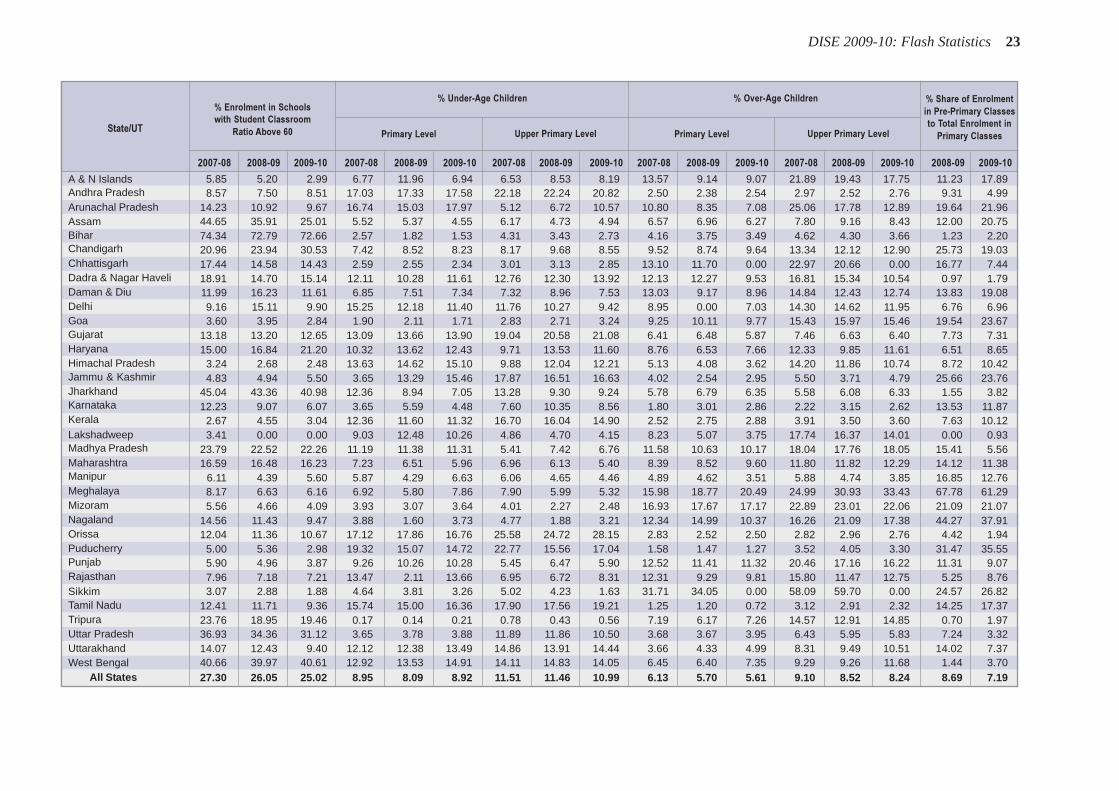
DISE 2009-10: Flash Statistics 23
A & N IslandsAndhra PradeshArunachal PradeshAssamBiharChandigarhChhattisgarhDadra & Nagar HaveliDaman & DiuDelhiGoaGujaratHaryanaHimachal PradeshJammu & KashmirJharkhandKarnatakaKeralaLakshadweepMadhya PradeshMaharashtraManipurMeghalayaMizoramNagalandOrissaPuducherryPunjabRajasthanSikkimTamil NaduTripuraUttar PradeshUttarakhandWest Bengal
All States
State/UT
5.85 5.20 2.99 6.77 11.96 6.94 6.53 8.53 8.19 13.57 9.14 9.07 21.89 19.43 17.75 11.23 17.898.57 7.50 8.51 17.03 17.33 17.58 22.18 22.24 20.82 2.50 2.38 2.54 2.97 2.52 2.76 9.31 4.99
14.23 10.92 9.67 16.74 15.03 17.97 5.12 6.72 10.57 10.80 8.35 7.08 25.06 17.78 12.89 19.64 21.9644.65 35.91 25.01 5.52 5.37 4.55 6.17 4.73 4.94 6.57 6.96 6.27 7.80 9.16 8.43 12.00 20.7574.34 72.79 72.66 2.57 1.82 1.53 4.31 3.43 2.73 4.16 3.75 3.49 4.62 4.30 3.66 1.23 2.2020.96 23.94 30.53 7.42 8.52 8.23 8.17 9.68 8.55 9.52 8.74 9.64 13.34 12.12 12.90 25.73 19.0317.44 14.58 14.43 2.59 2.55 2.34 3.01 3.13 2.85 13.10 11.70 0.00 22.97 20.66 0.00 16.77 7.4418.91 14.70 15.14 12.11 10.28 11.61 12.76 12.30 13.92 12.13 12.27 9.53 16.81 15.34 10.54 0.97 1.7911.99 16.23 11.61 6.85 7.51 7.34 7.32 8.96 7.53 13.03 9.17 8.96 14.84 12.43 12.74 13.83 19.089.16 15.11 9.90 15.25 12.18 11.40 11.76 10.27 9.42 8.95 0.00 7.03 14.30 14.62 11.95 6.76 6.963.60 3.95 2.84 1.90 2.11 1.71 2.83 2.71 3.24 9.25 10.11 9.77 15.43 15.97 15.46 19.54 23.67
13.18 13.20 12.65 13.09 13.66 13.90 19.04 20.58 21.08 6.41 6.48 5.87 7.46 6.63 6.40 7.73 7.3115.00 16.84 21.20 10.32 13.62 12.43 9.71 13.53 11.60 8.76 6.53 7.66 12.33 9.85 11.61 6.51 8.65
3.24 2.68 2.48 13.63 14.62 15.10 9.88 12.04 12.21 5.13 4.08 3.62 14.20 11.86 10.74 8.72 10.424.83 4.94 5.50 3.65 13.29 15.46 17.87 16.51 16.63 4.02 2.54 2.95 5.50 3.71 4.79 25.66 23.76
45.04 43.36 40.98 12.36 8.94 7.05 13.28 9.30 9.24 5.78 6.79 6.35 5.58 6.08 6.33 1.55 3.8212.23 9.07 6.07 3.65 5.59 4.48 7.60 10.35 8.56 1.80 3.01 2.86 2.22 3.15 2.62 13.53 11.87
2.67 4.55 3.04 12.36 11.60 11.32 16.70 16.04 14.90 2.52 2.75 2.88 3.91 3.50 3.60 7.63 10.123.41 0.00 0.00 9.03 12.48 10.26 4.86 4.70 4.15 8.23 5.07 3.75 17.74 16.37 14.01 0.00 0.93
23.79 22.52 22.26 11.19 11.38 11.31 5.41 7.42 6.76 11.58 10.63 10.17 18.04 17.76 18.05 15.41 5.5616.59 16.48 16.23 7.23 6.51 5.96 6.96 6.13 5.40 8.39 8.52 9.60 11.80 11.82 12.29 14.12 11.38
6.11 4.39 5.60 5.87 4.29 6.63 6.06 4.65 4.46 4.89 4.62 3.51 5.88 4.74 3.85 16.85 12.768.17 6.63 6.16 6.92 5.80 7.86 7.90 5.99 5.32 15.98 18.77 20.49 24.99 30.93 33.43 67.78 61.295.56 4.66 4.09 3.93 3.07 3.64 4.01 2.27 2.48 16.93 17.67 17.17 22.89 23.01 22.06 21.09 21.07
14.56 11.43 9.47 3.88 1.60 3.73 4.77 1.88 3.21 12.34 14.99 10.37 16.26 21.09 17.38 44.27 37.9112.04 11.36 10.67 17.12 17.86 16.76 25.58 24.72 28.15 2.83 2.52 2.50 2.82 2.96 2.76 4.42 1.94
5.00 5.36 2.98 19.32 15.07 14.72 22.77 15.56 17.04 1.58 1.47 1.27 3.52 4.05 3.30 31.47 35.555.90 4.96 3.87 9.26 10.26 10.28 5.45 6.47 5.90 12.52 11.41 11.32 20.46 17.16 16.22 11.31 9.077.96 7.18 7.21 13.47 2.11 13.66 6.95 6.72 8.31 12.31 9.29 9.81 15.80 11.47 12.75 5.25 8.763.07 2.88 1.88 4.64 3.81 3.26 5.02 4.23 1.63 31.71 34.05 0.00 58.09 59.70 0.00 24.57 26.82
12.41 11.71 9.36 15.74 15.00 16.36 17.90 17.56 19.21 1.25 1.20 0.72 3.12 2.91 2.32 14.25 17.3723.76 18.95 19.46 0.17 0.14 0.21 0.78 0.43 0.56 7.19 6.17 7.26 14.57 12.91 14.85 0.70 1.9736.93 34.36 31.12 3.65 3.78 3.88 11.89 11.86 10.50 3.68 3.67 3.95 6.43 5.95 5.83 7.24 3.3214.07 12.43 9.40 12.12 12.38 13.49 14.86 13.91 14.44 3.66 4.33 4.99 8.31 9.49 10.51 14.02 7.3740.66 39.97 40.61 12.92 13.53 14.91 14.11 14.83 14.05 6.45 6.40 7.35 9.29 9.26 11.68 1.44 3.7027.30 26.05 25.02 8.95 8.09 8.92 11.51 11.46 10.99 6.13 5.70 5.61 9.10 8.52 8.24 8.69 7.19
% Share of Enrolment
in Pre-Primary Classes
to Total Enrolment in
Primary Classes
2007-08 2008-09 2009-10 2007-08 2008-09 2009-10 2007-08 2008-09 2009-10 2007-08 2008-09 2009-10 2007-08 2008-09 2009-10 2008-09 2009-10
% Under-Age Children
Upper Primary LevelPrimary Level
% Enrolment in Schools
with Student Classroom
Ratio Above 60 Upper Primary LevelPrimary Level
% Over-Age Children
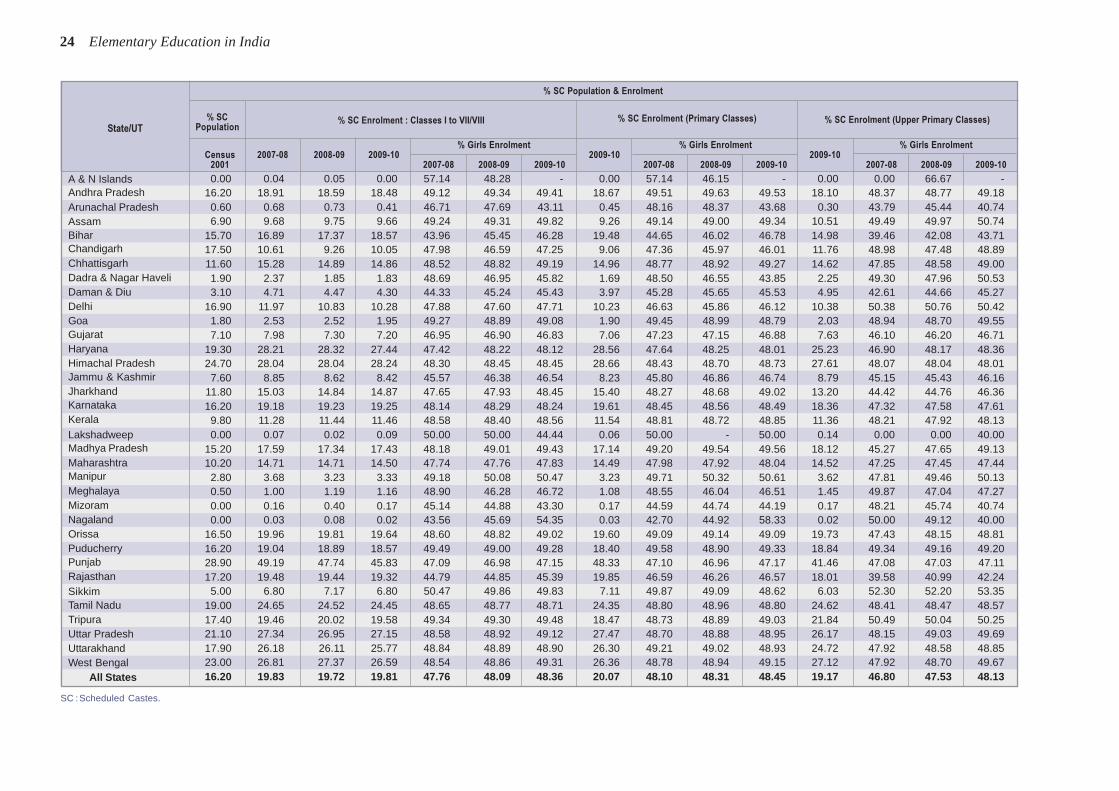
24 Elementary Education in India
A & N IslandsAndhra PradeshArunachal PradeshAssamBiharChandigarhChhattisgarhDadra & Nagar HaveliDaman & DiuDelhiGoaGujaratHaryanaHimachal PradeshJammu & KashmirJharkhandKarnatakaKeralaLakshadweepMadhya PradeshMaharashtraManipurMeghalayaMizoramNagalandOrissaPuducherryPunjabRajasthanSikkimTamil NaduTripuraUttar PradeshUttarakhandWest Bengal
All States
State/UT
0.00 0.04 0.05 0.00 57.14 48.28 - 0.00 57.14 46.15 - 0.00 0.00 66.67 -16.20 18.91 18.59 18.48 49.12 49.34 49.41 18.67 49.51 49.63 49.53 18.10 48.37 48.77 49.180.60 0.68 0.73 0.41 46.71 47.69 43.11 0.45 48.16 48.37 43.68 0.30 43.79 45.44 40.746.90 9.68 9.75 9.66 49.24 49.31 49.82 9.26 49.14 49.00 49.34 10.51 49.49 49.97 50.74
15.70 16.89 17.37 18.57 43.96 45.45 46.28 19.48 44.65 46.02 46.78 14.98 39.46 42.08 43.7117.50 10.61 9.26 10.05 47.98 46.59 47.25 9.06 47.36 45.97 46.01 11.76 48.98 47.48 48.8911.60 15.28 14.89 14.86 48.52 48.82 49.19 14.96 48.77 48.92 49.27 14.62 47.85 48.58 49.001.90 2.37 1.85 1.83 48.69 46.95 45.82 1.69 48.50 46.55 43.85 2.25 49.30 47.96 50.533.10 4.71 4.47 4.30 44.33 45.24 45.43 3.97 45.28 45.65 45.53 4.95 42.61 44.66 45.27
16.90 11.97 10.83 10.28 47.88 47.60 47.71 10.23 46.63 45.86 46.12 10.38 50.38 50.76 50.421.80 2.53 2.52 1.95 49.27 48.89 49.08 1.90 49.45 48.99 48.79 2.03 48.94 48.70 49.557.10 7.98 7.30 7.20 46.95 46.90 46.83 7.06 47.23 47.15 46.88 7.63 46.10 46.20 46.71
19.30 28.21 28.32 27.44 47.42 48.22 48.12 28.56 47.64 48.25 48.01 25.23 46.90 48.17 48.3624.70 28.04 28.04 28.24 48.30 48.45 48.45 28.66 48.43 48.70 48.73 27.61 48.07 48.04 48.017.60 8.85 8.62 8.42 45.57 46.38 46.54 8.23 45.80 46.86 46.74 8.79 45.15 45.43 46.16
11.80 15.03 14.84 14.87 47.65 47.93 48.45 15.40 48.27 48.68 49.02 13.20 44.42 44.76 46.3616.20 19.18 19.23 19.25 48.14 48.29 48.24 19.61 48.45 48.56 48.49 18.36 47.32 47.58 47.619.80 11.28 11.44 11.46 48.58 48.40 48.56 11.54 48.81 48.72 48.85 11.36 48.21 47.92 48.130.00 0.07 0.02 0.09 50.00 50.00 44.44 0.06 50.00 - 50.00 0.14 0.00 0.00 40.00
15.20 17.59 17.34 17.43 48.18 49.01 49.43 17.14 49.20 49.54 49.56 18.12 45.27 47.65 49.1310.20 14.71 14.71 14.50 47.74 47.76 47.83 14.49 47.98 47.92 48.04 14.52 47.25 47.45 47.442.80 3.68 3.23 3.33 49.18 50.08 50.47 3.23 49.71 50.32 50.61 3.62 47.81 49.46 50.130.50 1.00 1.19 1.16 48.90 46.28 46.72 1.08 48.55 46.04 46.51 1.45 49.87 47.04 47.270.00 0.16 0.40 0.17 45.14 44.88 43.30 0.17 44.59 44.74 44.19 0.17 48.21 45.74 40.740.00 0.03 0.08 0.02 43.56 45.69 54.35 0.03 42.70 44.92 58.33 0.02 50.00 49.12 40.00
16.50 19.96 19.81 19.64 48.60 48.82 49.02 19.60 49.09 49.14 49.09 19.73 47.43 48.15 48.8116.20 19.04 18.89 18.57 49.49 49.00 49.28 18.40 49.58 48.90 49.33 18.84 49.34 49.16 49.2028.90 49.19 47.74 45.83 47.09 46.98 47.15 48.33 47.10 46.96 47.17 41.46 47.08 47.03 47.1117.20 19.48 19.44 19.32 44.79 44.85 45.39 19.85 46.59 46.26 46.57 18.01 39.58 40.99 42.245.00 6.80 7.17 6.80 50.47 49.86 49.83 7.11 49.87 49.09 48.62 6.03 52.30 52.20 53.35
19.00 24.65 24.52 24.45 48.65 48.77 48.71 24.35 48.80 48.96 48.80 24.62 48.41 48.47 48.5717.40 19.46 20.02 19.58 49.34 49.30 49.48 18.47 48.73 48.89 49.03 21.84 50.49 50.04 50.2521.10 27.34 26.95 27.15 48.58 48.92 49.12 27.47 48.70 48.88 48.95 26.17 48.15 49.03 49.6917.90 26.18 26.11 25.77 48.84 48.89 48.90 26.30 49.21 49.02 48.93 24.72 47.92 48.58 48.8523.00 26.81 27.37 26.59 48.54 48.86 49.31 26.36 48.78 48.94 49.15 27.12 47.92 48.70 49.6716.20 19.83 19.72 19.81 47.76 48.09 48.36 20.07 48.10 48.31 48.45 19.17 46.80 47.53 48.13
% SC Population & Enrolment
% SCPopulation
% SC Enrolment (Upper Primary Classes)
SC :Scheduled Castes.
% Girls Enrolment % Girls Enrolment % Girls EnrolmentCensus 2007-08 2008-09 2009-10 2009-10 2009-10
2001 2007-08 2008-09 2009-10 2007-08 2008-09 2009-10 2007-08 2008-09 2009-10
% SC Enrolment : Classes I to VII/VIII % SC Enrolment (Primary Classes)
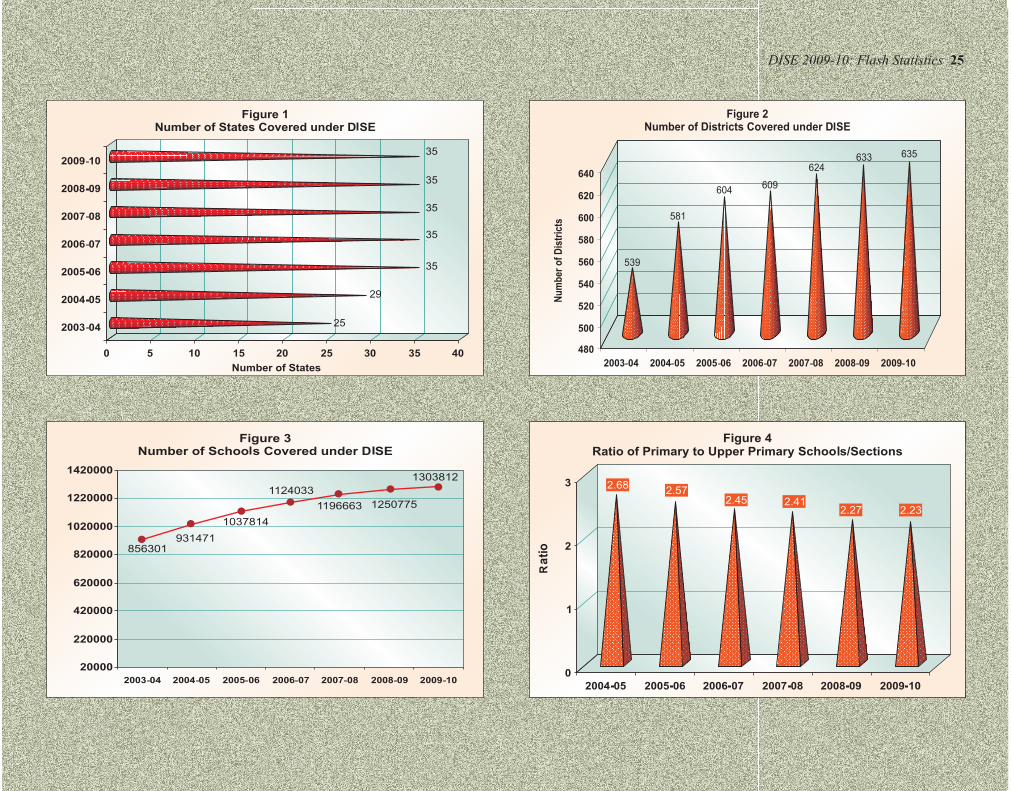
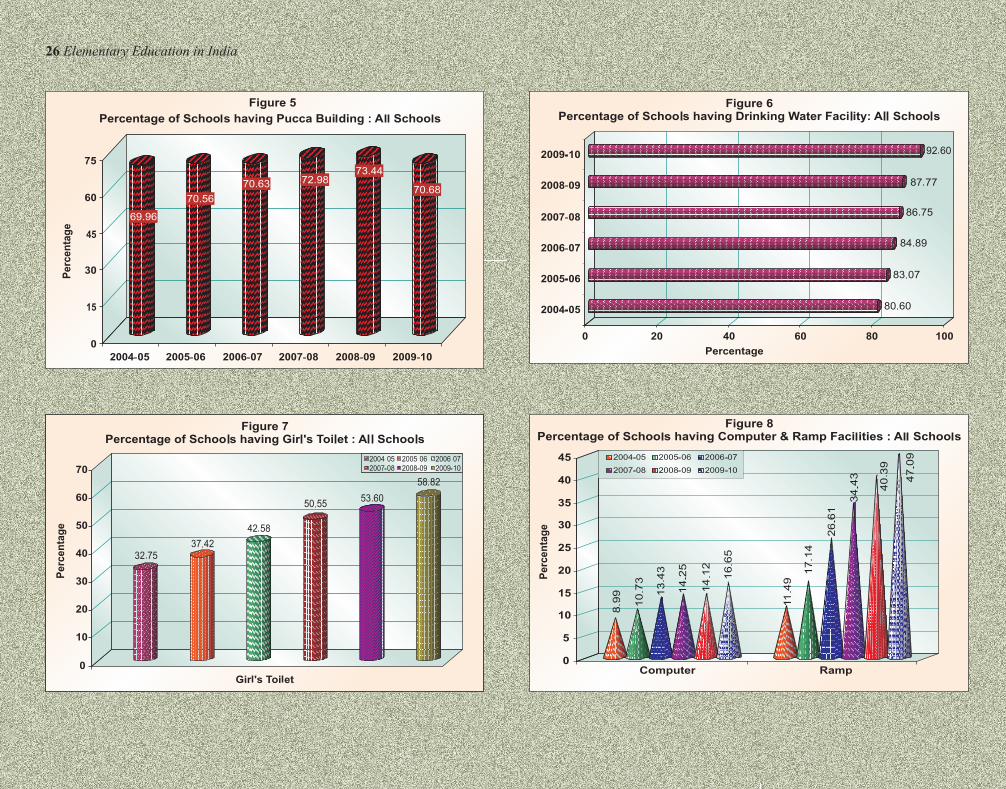
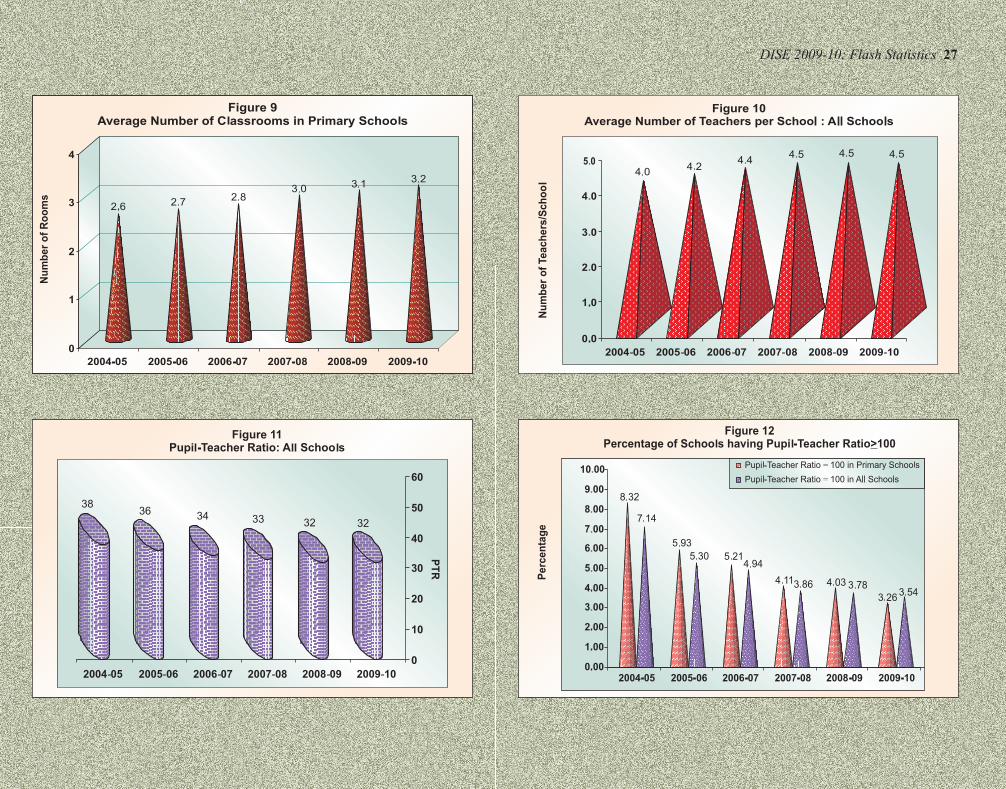
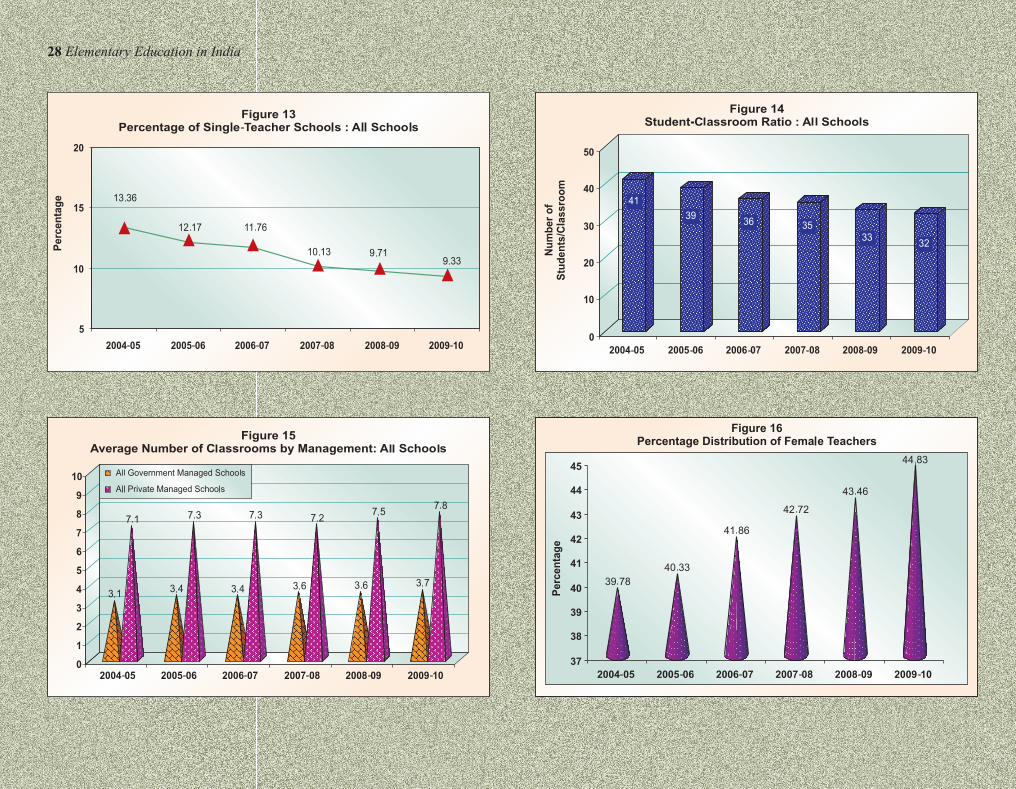

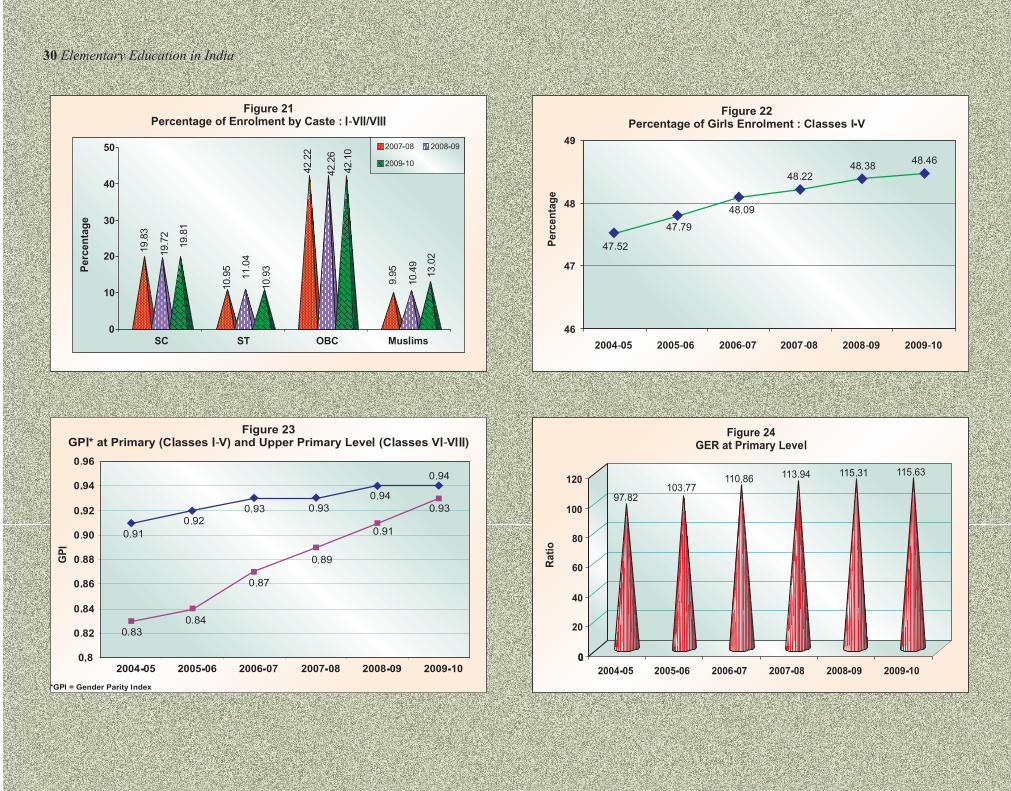
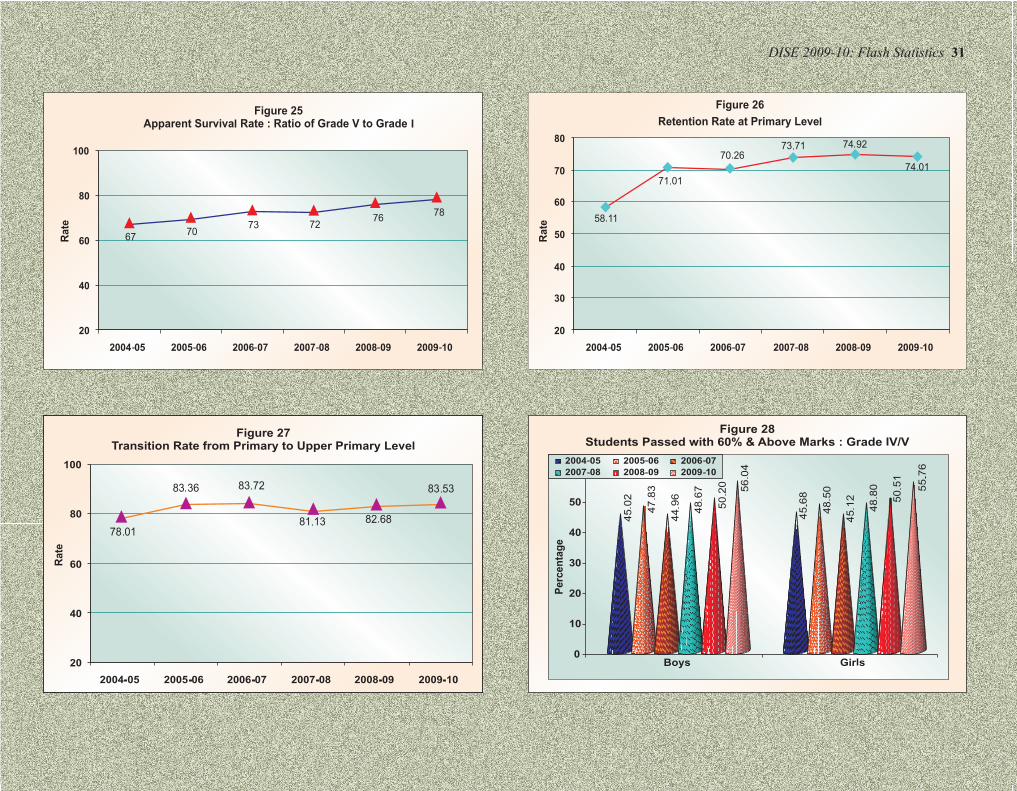

32 Elementary Education in India
A & N IslandsAndhra PradeshArunachal PradeshAssamBiharChandigarhChhattisgarhDadra & Nagar HaveliDaman & DiuDelhiGoaGujaratHaryanaHimachal PradeshJammu & KashmirJharkhandKarnatakaKeralaLakshadweepMadhya PradeshMaharashtraManipurMeghalayaMizoramNagalandOrissaPuducherryPunjabRajasthanSikkimTamil NaduTripuraUttar PradeshUttarakhandWest Bengal
All States
State/UT
SC : Scheduled Castes.*OBC : Population is not availabe from the Census sources.
OBC : Other Backward Class.
8.30 7.02 7.38 7.35 46.94 47.50 47.79 7.04 47.32 47.88 48.55 7.82 46.29 46.98 46.74 0.73 3.46 4.186.60 9.64 9.64 9.80 47.31 47.72 47.74 10.91 48.23 48.48 48.45 7.58 44.83 45.62 45.68 45.36 45.18 45.06
64.20 75.95 76.42 76.15 48.48 48.67 49.21 76.86 48.62 48.73 49.20 74.16 48.07 48.48 49.23 0.39 0.42 0.2712.40 15.57 15.15 15.22 49.12 49.28 49.60 14.72 49.22 49.28 49.53 16.32 48.88 49.29 49.75 23.30 23.17 25.23
0.90 2.29 2.28 1.85 45.05 46.55 46.91 1.95 45.56 46.91 47.47 1.46 41.34 44.10 43.97 59.26 60.16 60.990.00 0.13 0.11 0.15 44.83 36.24 41.06 0.15 44.86 31.73 39.42 0.13 44.78 46.67 44.29 1.26 1.01 1.17
31.80 32.03 32.47 32.21 48.63 48.41 48.78 33.62 48.89 48.68 48.93 28.93 47.86 47.64 48.39 45.64 45.67 45.4962.20 71.03 70.43 69.72 47.43 47.79 47.81 69.77 48.59 48.83 48.76 69.55 42.65 43.97 44.78 0.83 0.89 0.67
8.80 12.94 12.03 11.54 46.44 45.70 46.31 11.17 47.08 46.67 46.62 12.26 44.80 44.00 45.77 33.71 40.22 40.950.00 0.31 0.40 0.25 47.33 40.91 47.98 0.26 50.15 38.43 47.78 0.23 40.38 46.92 48.37 11.79 8.69 7.630.00 7.85 8.91 8.45 47.13 47.32 47.91 7.83 47.34 47.64 48.41 9.52 46.81 46.85 47.21 9.34 8.87 7.96
14.80 18.41 18.79 18.13 48.10 48.20 48.08 18.81 48.20 48.29 48.09 16.13 47.73 47.91 48.02 50.34 50.50 51.150.00 0.13 0.16 0.00 41.48 50.01 0.00 0.00 40.57 50.14 0.00 0.00 43.65 49.74 0.00 32.79 29.26 30.834.00 5.64 5.70 5.69 48.10 48.16 48.18 5.60 48.53 48.11 48.35 5.81 47.41 48.24 47.94 13.98 13.50 12.90
10.90 13.09 14.36 14.48 43.38 45.15 45.54 15.70 45.06 46.74 46.88 12.07 39.20 40.55 42.11 6.45 8.27 9.4626.30 30.49 30.74 29.80 48.08 48.34 48.84 30.97 48.60 48.84 49.02 26.15 45.34 46.21 48.21 44.34 45.40 44.17
6.60 7.51 7.93 7.91 48.11 48.10 48.21 8.04 48.42 48.26 48.38 7.60 47.31 47.69 47.77 52.46 51.87 53.081.10 1.93 2.24 2.32 48.90 50.29 49.18 2.51 48.91 49.68 48.66 2.06 48.88 51.39 50.10 62.63 63.44 63.81
94.50 99.59 99.34 98.84 48.42 49.88 50.03 98.91 49.30 50.47 50.14 98.72 46.78 48.78 49.83 0.39 0.51 0.6120.30 23.59 23.66 23.75 48.03 49.00 49.63 25.59 48.96 49.60 49.82 19.35 44.29 46.85 49.05 41.48 42.26 42.49
8.90 11.34 11.62 11.62 46.78 47.08 47.17 12.74 47.37 47.55 47.58 9.53 45.32 45.88 46.15 32.36 32.28 32.1634.20 42.68 43.85 45.35 48.46 48.71 49.25 48.22 48.64 48.79 49.21 37.54 47.84 48.43 49.41 8.02 10.20 8.5685.90 93.08 92.02 91.90 50.68 51.12 51.06 92.50 50.22 50.43 50.40 89.84 52.56 53.70 53.43 0.54 0.71 0.6994.50 99.24 98.76 99.25 48.76 48.64 48.65 99.22 48.64 48.42 48.45 99.30 49.12 49.24 49.22 0.24 0.31 0.2289.10 93.75 95.37 91.54 49.08 49.08 48.89 91.39 49.26 49.20 48.85 91.89 48.65 48.82 48.99 0.00 0.02 0.2022.10 25.35 26.59 28.01 47.90 48.13 48.56 30.30 48.89 48.96 48.96 21.83 44.55 45.40 47.10 34.16 33.61 32.95
0.00 0.68 0.18 0.42 51.21 51.20 73.62 0.23 49.29 57.93 57.09 0.72 53.38 44.64 81.98 74.02 72.68 66.380.00 0.25 0.16 0.03 47.88 47.50 38.34 0.03 46.15 46.21 47.78 0.03 49.95 49.08 23.84 16.03 13.19 12.94
12.60 14.97 15.10 14.93 44.49 44.59 44.85 15.72 46.13 45.90 45.90 13.01 39.35 40.66 41.76 47.98 47.76 47.2020.60 36.10 37.27 35.80 51.13 51.16 50.50 36.25 49.45 49.45 48.30 34.70 56.66 55.59 56.17 39.45 38.34 40.39
1.00 1.88 1.83 1.79 47.62 47.42 47.96 1.95 47.93 48.10 48.17 1.53 47.06 46.16 47.52 68.85 69.49 68.8031.10 38.95 39.62 40.15 47.30 47.90 47.99 43.49 47.80 48.37 48.40 33.39 45.84 46.61 46.91 15.83 15.91 15.54
0.10 0.63 0.60 0.61 47.75 48.72 48.68 0.62 48.09 48.62 48.50 0.56 46.47 49.12 49.31 50.46 49.92 50.783.00 3.77 3.46 2.99 50.40 50.29 50.81 2.88 50.43 50.20 50.39 3.21 50.34 50.45 51.55 23.55 25.50 24.515.50 6.27 6.29 6.84 47.78 48.24 48.98 7.38 48.52 48.74 49.27 5.58 45.38 46.78 48.05 4.54 4.67 4.278.20 10.95 11.04 10.93 47.64 48.01 48.33 11.54 48.30 48.50 48.62 9.43 45.47 46.45 47.47 42.35 42.39 42.15
% ST Population & Enrolment
% STPopulation % ST Enrolment (Upper Primary Classes)
% Girls Enrolment % Girls Enrolment % Girls Enrolment
Census 2007-08 2008-09 2009-10 All All 2007-08 2008-09 2009-10
2001 2007-08 2008-09 2009-10 2007-08 2008-09 2009-10 2007-08 2008-09 2009-10
% ST Enrolment : Classes I to VII/VIII % ST Enrolment (Primary Classes) Primary Level
% OBC Enrolment*
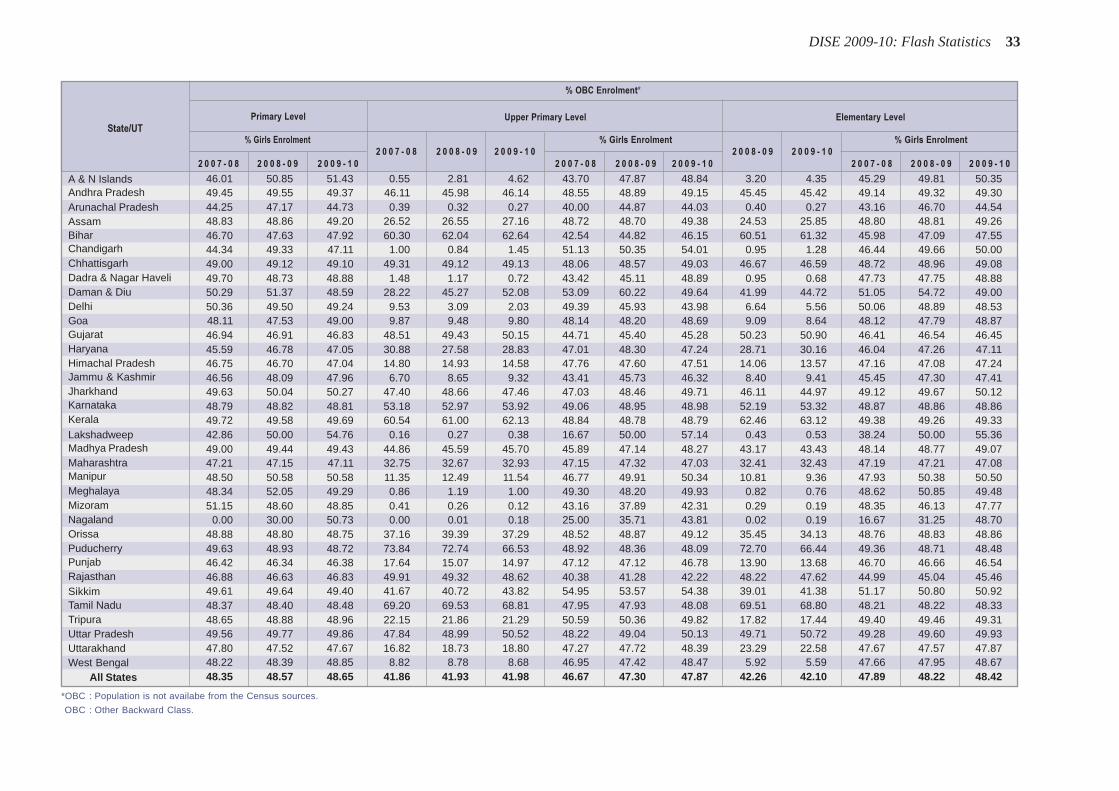
DISE 2009-10: Flash Statistics 33
A & N IslandsAndhra PradeshArunachal PradeshAssamBiharChandigarhChhattisgarhDadra & Nagar HaveliDaman & DiuDelhiGoaGujaratHaryanaHimachal PradeshJammu & KashmirJharkhandKarnatakaKeralaLakshadweepMadhya PradeshMaharashtraManipurMeghalayaMizoramNagalandOrissaPuducherryPunjabRajasthanSikkimTamil NaduTripuraUttar PradeshUttarakhandWest Bengal
All States
State/UT
46.01 50.85 51.43 0.55 2.81 4.62 43.70 47.87 48.84 3.20 4.35 45.29 49.81 50.3549.45 49.55 49.37 46.11 45.98 46.14 48.55 48.89 49.15 45.45 45.42 49.14 49.32 49.3044.25 47.17 44.73 0.39 0.32 0.27 40.00 44.87 44.03 0.40 0.27 43.16 46.70 44.5448.83 48.86 49.20 26.52 26.55 27.16 48.72 48.70 49.38 24.53 25.85 48.80 48.81 49.2646.70 47.63 47.92 60.30 62.04 62.64 42.54 44.82 46.15 60.51 61.32 45.98 47.09 47.5544.34 49.33 47.11 1.00 0.84 1.45 51.13 50.35 54.01 0.95 1.28 46.44 49.66 50.0049.00 49.12 49.10 49.31 49.12 49.13 48.06 48.57 49.03 46.67 46.59 48.72 48.96 49.0849.70 48.73 48.88 1.48 1.17 0.72 43.42 45.11 48.89 0.95 0.68 47.73 47.75 48.8850.29 51.37 48.59 28.22 45.27 52.08 53.09 60.22 49.64 41.99 44.72 51.05 54.72 49.0050.36 49.50 49.24 9.53 3.09 2.03 49.39 45.93 43.98 6.64 5.56 50.06 48.89 48.5348.11 47.53 49.00 9.87 9.48 9.80 48.14 48.20 48.69 9.09 8.64 48.12 47.79 48.8746.94 46.91 46.83 48.51 49.43 50.15 44.71 45.40 45.28 50.23 50.90 46.41 46.54 46.4545.59 46.78 47.05 30.88 27.58 28.83 47.01 48.30 47.24 28.71 30.16 46.04 47.26 47.1146.75 46.70 47.04 14.80 14.93 14.58 47.76 47.60 47.51 14.06 13.57 47.16 47.08 47.2446.56 48.09 47.96 6.70 8.65 9.32 43.41 45.73 46.32 8.40 9.41 45.45 47.30 47.4149.63 50.04 50.27 47.40 48.66 47.46 47.03 48.46 49.71 46.11 44.97 49.12 49.67 50.1248.79 48.82 48.81 53.18 52.97 53.92 49.06 48.95 48.98 52.19 53.32 48.87 48.86 48.8649.72 49.58 49.69 60.54 61.00 62.13 48.84 48.78 48.79 62.46 63.12 49.38 49.26 49.3342.86 50.00 54.76 0.16 0.27 0.38 16.67 50.00 57.14 0.43 0.53 38.24 50.00 55.3649.00 49.44 49.43 44.86 45.59 45.70 45.89 47.14 48.27 43.17 43.43 48.14 48.77 49.0747.21 47.15 47.11 32.75 32.67 32.93 47.15 47.32 47.03 32.41 32.43 47.19 47.21 47.0848.50 50.58 50.58 11.35 12.49 11.54 46.77 49.91 50.34 10.81 9.36 47.93 50.38 50.5048.34 52.05 49.29 0.86 1.19 1.00 49.30 48.20 49.93 0.82 0.76 48.62 50.85 49.4851.15 48.60 48.85 0.41 0.26 0.12 43.16 37.89 42.31 0.29 0.19 48.35 46.13 47.77
0.00 30.00 50.73 0.00 0.01 0.18 25.00 35.71 43.81 0.02 0.19 16.67 31.25 48.7048.88 48.80 48.75 37.16 39.39 37.29 48.52 48.87 49.12 35.45 34.13 48.76 48.83 48.8649.63 48.93 48.72 73.84 72.74 66.53 48.92 48.36 48.09 72.70 66.44 49.36 48.71 48.4846.42 46.34 46.38 17.64 15.07 14.97 47.12 47.12 46.78 13.90 13.68 46.70 46.66 46.5446.88 46.63 46.83 49.91 49.32 48.62 40.38 41.28 42.22 48.22 47.62 44.99 45.04 45.4649.61 49.64 49.40 41.67 40.72 43.82 54.95 53.57 54.38 39.01 41.38 51.17 50.80 50.9248.37 48.40 48.48 69.20 69.53 68.81 47.95 47.93 48.08 69.51 68.80 48.21 48.22 48.3348.65 48.88 48.96 22.15 21.86 21.29 50.59 50.36 49.82 17.82 17.44 49.40 49.46 49.3149.56 49.77 49.86 47.84 48.99 50.52 48.22 49.04 50.13 49.71 50.72 49.28 49.60 49.9347.80 47.52 47.67 16.82 18.73 18.80 47.27 47.72 48.39 23.29 22.58 47.67 47.57 47.8748.22 48.39 48.85 8.82 8.78 8.68 46.95 47.42 48.47 5.92 5.59 47.66 47.95 48.6748.35 48.57 48.65 41.86 41.93 41.98 46.67 47.30 47.87 42.26 42.10 47.89 48.22 48.42
% OBC Enrolment*
Primary Level Elementary LevelUpper Primary Level
% Girls Enrolment % Girls Enrolment % Girls Enrolment
2 0 0 7 - 0 8 2 0 0 8 - 0 9 2 0 0 9 - 1 0 2 0 0 8 - 0 9 2 0 0 9 - 1 0
2 0 0 7 - 0 8 2 0 0 8 - 0 9 2 0 0 9 - 1 0 2 0 0 7 - 0 8 2 0 0 8 - 0 9 2 0 0 9 - 1 0 2 0 0 7 - 0 8 2 0 0 8 - 0 9 2 0 0 9 - 1 0
*OBC : Population is not availabe from the Census sources.
OBC : Other Backward Class.

34 Elementary Education in India
A & N IslandsAndhra PradeshArunachal PradeshAssamBiharChandigarhChhattisgarhDadra & Nagar HaveliDaman & DiuDelhiGoaGujaratHaryanaHimachal PradeshJammu & KashmirJharkhandKarnatakaKeralaLakshadweepMadhya PradeshMaharashtraManipurMeghalayaMizoramNagalandOrissaPuducherryPunjabRajasthanSikkimTamil NaduTripuraUttar PradeshUttarakhandWest Bengal
All States
State/UT
8.22 1.49 3.08 6.97 48.04 49.71 49.18 1.25 3.04 5.77 49.81 50.22 46.70 3.06 6.49 48.63 49.91 48.319.17 10.51 10.79 8.99 50.73 50.92 50.83 9.45 10.07 8.13 51.75 52.12 52.31 10.55 8.70 51.06 51.34 51.291.88 0.04 0.10 0.34 50.00 45.42 47.78 0.03 0.08 0.38 52.00 44.78 44.14 0.09 0.35 50.46 45.28 46.75
30.92 31.94 35.08 39.89 49.74 49.90 50.10 20.26 25.57 31.87 52.69 53.63 53.66 32.31 37.34 50.29 50.75 51.0616.53 11.27 12.96 13.83 46.80 48.05 48.38 8.22 10.35 12.21 44.76 47.92 48.59 12.47 13.50 46.53 48.03 48.423.95 3.81 4.73 5.26 48.88 48.10 47.56 2.78 3.67 4.06 48.55 48.15 49.77 4.34 4.82 48.78 48.12 48.241.97 0.68 0.21 1.20 47.87 48.72 49.47 0.90 0.30 1.43 47.42 49.11 51.41 0.24 1.27 47.71 48.86 50.132.96 NR NR 3.37 0.00 - 33.04 NR NR 2.74 0.00 - 45.91 0.01 3.22 0.00 0.00 35.657.76 3.87 8.33 8.95 46.46 46.62 45.20 2.25 6.48 7.26 37.76 47.03 46.85 7.68 8.38 44.67 46.74 45.69
11.72 5.33 12.33 15.39 50.32 49.66 49.60 8.39 10.66 12.47 51.79 49.35 49.68 11.72 14.32 51.01 49.56 49.636.84 2.49 0.21 8.69 46.94 40.61 47.88 1.99 0.17 7.18 46.01 42.34 45.40 0.20 8.13 46.63 41.18 47.089.06 4.57 4.73 6.45 47.89 48.71 48.29 4.52 4.75 6.44 47.07 47.97 47.73 4.74 6.45 47.69 48.53 48.155.78 5.34 3.61 6.68 40.76 41.52 42.64 2.31 2.03 2.77 35.45 39.64 33.55 3.09 5.37 39.82 41.12 41.071.97 1.08 1.18 1.56 46.21 45.01 46.00 1.05 0.90 1.07 43.92 44.75 43.94 1.07 1.37 45.33 44.92 45.36
66.97 59.29 66.42 67.80 47.09 48.05 48.15 58.22 63.96 65.14 45.48 45.89 46.27 65.62 66.90 46.55 47.36 47.5313.85 10.30 10.74 13.25 48.55 49.34 49.58 9.04 9.91 11.78 46.76 48.92 50.59 10.56 12.89 48.25 49.26 49.8012.23 15.06 14.67 35.52 49.98 49.49 48.40 16.73 13.81 37.13 50.46 50.41 48.32 14.42 35.99 50.13 49.75 48.3724.70 21.49 26.22 33.24 49.32 49.42 50.17 19.09 21.98 29.23 48.44 48.74 48.47 24.51 31.61 49.00 49.17 49.5395.47 99.92 99.73 99.61 49.24 50.53 50.28 99.95 99.73 98.97 46.73 48.74 49.90 99.73 99.38 48.36 49.91 50.156.37 3.27 3.22 4.29 49.37 50.48 50.63 3.13 3.06 3.81 49.94 51.45 52.22 3.18 4.15 49.51 50.74 51.06
10.60 8.61 9.31 12.03 48.09 48.01 48.57 7.24 8.02 10.40 48.54 48.49 48.91 8.87 11.46 48.22 48.16 48.688.81 NR NR 6.02 NR - 51.72 NR NR 5.10 0.00 - 51.44 NR 5.77 0.00 - 51.654.28 0.15 0.42 2.39 69.19 46.58 50.95 0.21 0.71 2.68 74.39 52.61 52.09 0.49 2.45 70.56 48.49 51.231.14 NR 0.18 0.09 33.33 46.56 44.71 NR NR 0.05 0.00 69.23 23.33 0.14 0.08 29.63 47.45 41.501.76 0.03 0.01 0.03 48.05 50.00 51.35 0.05 0.02 0.00 62.90 47.83 0.00 0.02 0.02 54.68 49.21 51.352.07 1.67 1.69 1.72 49.32 49.80 49.76 1.60 1.62 1.80 51.01 52.42 51.22 1.66 1.74 49.83 50.61 50.176.09 6.77 6.38 7.23 46.74 47.70 48.25 5.86 6.20 6.68 44.70 46.66 47.51 6.31 7.02 46.03 47.31 47.981.57 0.51 0.95 1.60 46.29 46.55 45.96 0.24 0.85 1.33 41.96 46.04 45.05 0.91 1.50 45.33 46.37 45.678.47 5.40 5.05 6.73 46.21 46.16 45.98 3.61 3.46 4.43 37.88 39.77 40.58 4.59 6.06 44.48 44.76 44.831.42 NR 0.50 0.58 NR 56.59 38.04 NR 1.00 0.39 0.00 58.96 45.39 NR 0.52 NR - 39.635.56 4.74 4.47 5.25 48.83 49.29 49.12 4.74 4.47 5.08 49.58 48.73 49.76 4.47 5.19 49.11 49.08 49.357.95 7.51 7.83 9.15 49.20 49.48 49.16 6.68 7.58 9.20 53.86 53.36 53.20 7.75 9.16 50.53 50.70 50.50
18.50 9.34 9.59 10.31 48.15 48.14 48.31 7.34 7.55 8.20 48.54 48.46 49.72 9.12 9.80 48.22 48.20 48.5911.92 14.80 13.78 15.39 47.52 47.61 47.71 8.06 7.35 8.90 45.59 48.03 48.01 11.68 13.19 47.14 47.70 47.7825.25 28.13 28.28 32.30 49.94 49.95 49.89 18.91 20.08 26.46 54.04 54.80 55.99 25.79 30.56 50.81 51.10 51.47
13.43 10.49 11.03 13.48 48.67 48.93 48.96 8.54 9.13 11.89 49.40 50.03 50.41 10.49 13.02 48.84 49.20 49.34
* A few states may not present complete coverage.
% Muslim
Population
% Muslim Enrolment*
Upper Primary Level Elementary Level
% Girls Enrolment % Girls Enrolment % Girls Enrolment
Census 2007-08 2008-09 2009-10 2007-08 2008-09 2009-10 2008-09 2009-10
2001 2007-08 2008-09 2009-10 2007-08 2008-09 2009-10 2007-08 2008-09 2009-10
Primary Level
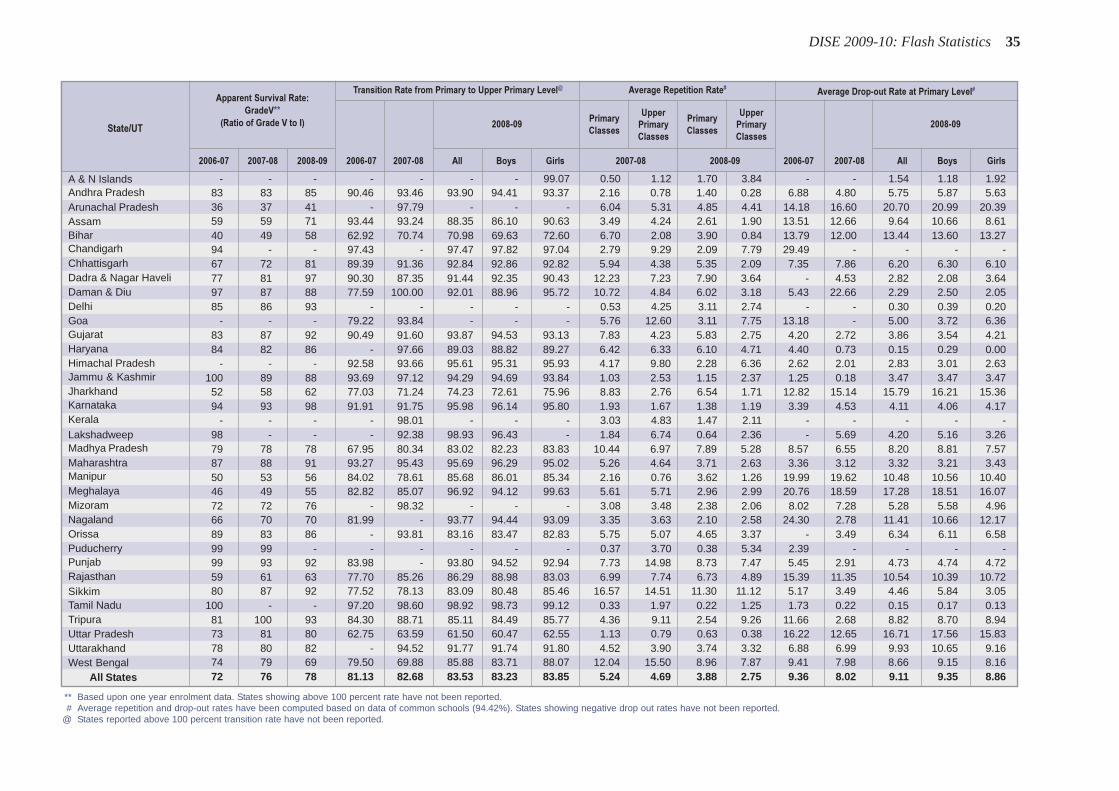
DISE 2009-10: Flash Statistics 35
A & N IslandsAndhra PradeshArunachal PradeshAssamBiharChandigarhChhattisgarhDadra & Nagar HaveliDaman & DiuDelhiGoaGujaratHaryanaHimachal PradeshJammu & KashmirJharkhandKarnatakaKeralaLakshadweepMadhya PradeshMaharashtraManipurMeghalayaMizoramNagalandOrissaPuducherryPunjabRajasthanSikkimTamil NaduTripuraUttar PradeshUttarakhandWest Bengal
All States
State/UT
- - - - - - - 99.07 0.50 1.12 1.70 3.84 - - 1.54 1.18 1.9283 83 85 90.46 93.46 93.90 94.41 93.37 2.16 0.78 1.40 0.28 6.88 4.80 5.75 5.87 5.6336 37 41 - 97.79 - - - 6.04 5.31 4.85 4.41 14.18 16.60 20.70 20.99 20.3959 59 71 93.44 93.24 88.35 86.10 90.63 3.49 4.24 2.61 1.90 13.51 12.66 9.64 10.66 8.6140 49 58 62.92 70.74 70.98 69.63 72.60 6.70 2.08 3.90 0.84 13.79 12.00 13.44 13.60 13.2794 - - 97.43 - 97.47 97.82 97.04 2.79 9.29 2.09 7.79 29.49 - - - -67 72 81 89.39 91.36 92.84 92.86 92.82 5.94 4.38 5.35 2.09 7.35 7.86 6.20 6.30 6.1077 81 97 90.30 87.35 91.44 92.35 90.43 12.23 7.23 7.90 3.64 - 4.53 2.82 2.08 3.6497 87 88 77.59 100.00 92.01 88.96 95.72 10.72 4.84 6.02 3.18 5.43 22.66 2.29 2.50 2.0585 86 93 - - - - - 0.53 4.25 3.11 2.74 - - 0.30 0.39 0.20
- - - 79.22 93.84 - - - 5.76 12.60 3.11 7.75 13.18 - 5.00 3.72 6.3683 87 92 90.49 91.60 93.87 94.53 93.13 7.83 4.23 5.83 2.75 4.20 2.72 3.86 3.54 4.2184 82 86 - 97.66 89.03 88.82 89.27 6.42 6.33 6.10 4.71 4.40 0.73 0.15 0.29 0.00
- - - 92.58 93.66 95.61 95.31 95.93 4.17 9.80 2.28 6.36 2.62 2.01 2.83 3.01 2.63100 89 88 93.69 97.12 94.29 94.69 93.84 1.03 2.53 1.15 2.37 1.25 0.18 3.47 3.47 3.4752 58 62 77.03 71.24 74.23 72.61 75.96 8.83 2.76 6.54 1.71 12.82 15.14 15.79 16.21 15.3694 93 98 91.91 91.75 95.98 96.14 95.80 1.93 1.67 1.38 1.19 3.39 4.53 4.11 4.06 4.17
- - - - 98.01 - - - 3.03 4.83 1.47 2.11 - - - - -98 - - - 92.38 98.93 96.43 - 1.84 6.74 0.64 2.36 - 5.69 4.20 5.16 3.2679 78 78 67.95 80.34 83.02 82.23 83.83 10.44 6.97 7.89 5.28 8.57 6.55 8.20 8.81 7.5787 88 91 93.27 95.43 95.69 96.29 95.02 5.26 4.64 3.71 2.63 3.36 3.12 3.32 3.21 3.4350 53 56 84.02 78.61 85.68 86.01 85.34 2.16 0.76 3.62 1.26 19.99 19.62 10.48 10.56 10.4046 49 55 82.82 85.07 96.92 94.12 99.63 5.61 5.71 2.96 2.99 20.76 18.59 17.28 18.51 16.0772 72 76 - 98.32 - - - 3.08 3.48 2.38 2.06 8.02 7.28 5.28 5.58 4.9666 70 70 81.99 - 93.77 94.44 93.09 3.35 3.63 2.10 2.58 24.30 2.78 11.41 10.66 12.1789 83 86 - 93.81 83.16 83.47 82.83 5.75 5.07 4.65 3.37 - 3.49 6.34 6.11 6.5899 99 - - - - - - 0.37 3.70 0.38 5.34 2.39 - - - -99 93 92 83.98 - 93.80 94.52 92.94 7.73 14.98 8.73 7.47 5.45 2.91 4.73 4.74 4.7259 61 63 77.70 85.26 86.29 88.98 83.03 6.99 7.74 6.73 4.89 15.39 11.35 10.54 10.39 10.7280 87 92 77.52 78.13 83.09 80.48 85.46 16.57 14.51 11.30 11.12 5.17 3.49 4.46 5.84 3.05
100 - - 97.20 98.60 98.92 98.73 99.12 0.33 1.97 0.22 1.25 1.73 0.22 0.15 0.17 0.1381 100 93 84.30 88.71 85.11 84.49 85.77 4.36 9.11 2.54 9.26 11.66 2.68 8.82 8.70 8.9473 81 80 62.75 63.59 61.50 60.47 62.55 1.13 0.79 0.63 0.38 16.22 12.65 16.71 17.56 15.8378 80 82 - 94.52 91.77 91.74 91.80 4.52 3.90 3.74 3.32 6.88 6.99 9.93 10.65 9.1674 79 69 79.50 69.88 85.88 83.71 88.07 12.04 15.50 8.96 7.87 9.41 7.98 8.66 9.15 8.1672 76 78 81.13 82.68 83.53 83.23 83.85 5.24 4.69 3.88 2.75 9.36 8.02 9.11 9.35 8.86
2006-07 2007-08 2008-09 2006-07 2007-08 All Boys Girls 2007-08 2008-09 2006-07 2007-08 All Boys Girls
2008-09
Apparent Survival Rate:
GradeV**
(Ratio of Grade V to I)
Transition Rate from Primary to Upper Primary Level@ Average Repetition Rate#
Primary
Classes
Upper
Primary
Classes
Primary
Classes
Upper
Primary
Classes
2008-09
Average Drop-out Rate at Primary Level#
** Based upon one year enrolment data. States showing above 100 percent rate have not been reported.# Average repetition and drop-out rates have been computed based on data of common schools (94.42%). States showing negative drop out rates have not been reported.
@ States reported above 100 percent transition rate have not been reported.
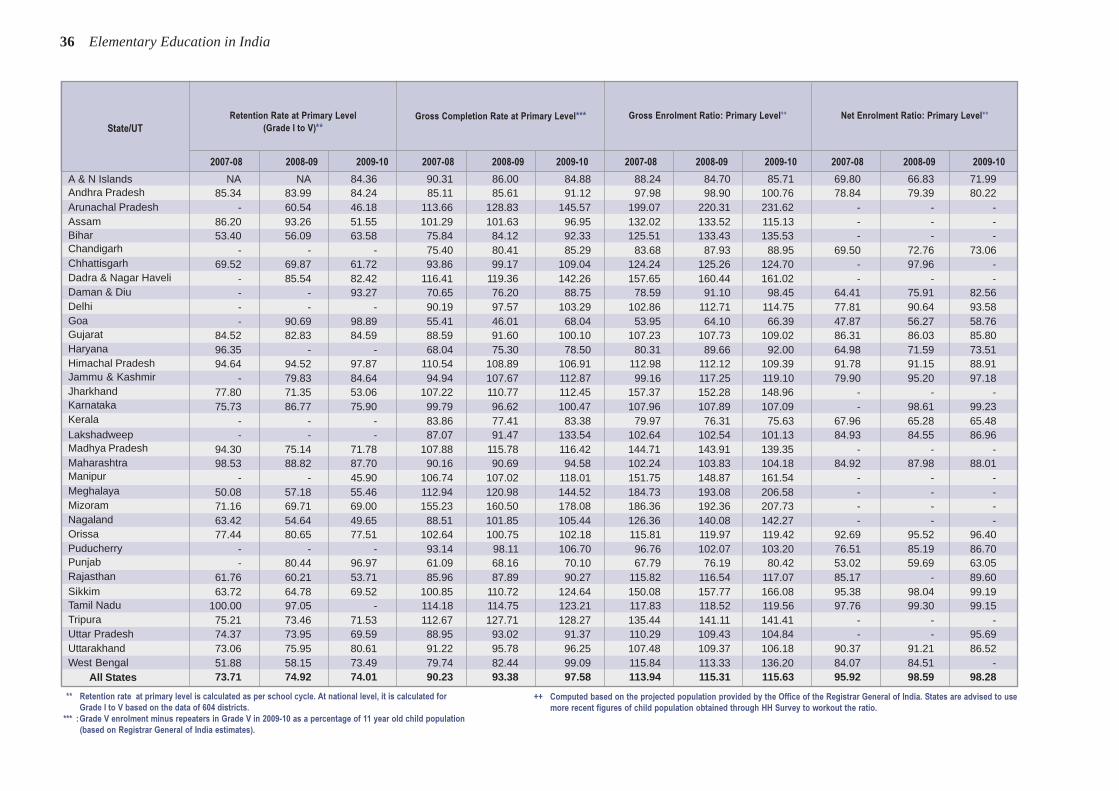
36 Elementary Education in India
A & N IslandsAndhra PradeshArunachal PradeshAssamBiharChandigarhChhattisgarhDadra & Nagar HaveliDaman & DiuDelhiGoaGujaratHaryanaHimachal PradeshJammu & KashmirJharkhandKarnatakaKeralaLakshadweepMadhya PradeshMaharashtraManipurMeghalayaMizoramNagalandOrissaPuducherryPunjabRajasthanSikkimTamil NaduTripuraUttar PradeshUttarakhandWest Bengal
All States
State/UT
** Retention rate at primary level is calculated as per school cycle. At national level, it is calculated for
Grade I to V based on the data of 604 districts.
*** :Grade V enrolment minus repeaters in Grade V in 2009-10 as a percentage of 11 year old child population
(based on Registrar General of India estimates).
NA NA 84.36 90.31 86.00 84.88 88.24 84.70 85.71 69.80 66.83 71.9985.34 83.99 84.24 85.11 85.61 91.12 97.98 98.90 100.76 78.84 79.39 80.22
- 60.54 46.18 113.66 128.83 145.57 199.07 220.31 231.62 - - -86.20 93.26 51.55 101.29 101.63 96.95 132.02 133.52 115.13 - - -53.40 56.09 63.58 75.84 84.12 92.33 125.51 133.43 135.53 - - -
- - - 75.40 80.41 85.29 83.68 87.93 88.95 69.50 72.76 73.0669.52 69.87 61.72 93.86 99.17 109.04 124.24 125.26 124.70 - 97.96 -
- 85.54 82.42 116.41 119.36 142.26 157.65 160.44 161.02 - - -- - 93.27 70.65 76.20 88.75 78.59 91.10 98.45 64.41 75.91 82.56- - - 90.19 97.57 103.29 102.86 112.71 114.75 77.81 90.64 93.58- 90.69 98.89 55.41 46.01 68.04 53.95 64.10 66.39 47.87 56.27 58.76
84.52 82.83 84.59 88.59 91.60 100.10 107.23 107.73 109.02 86.31 86.03 85.8096.35 - - 68.04 75.30 78.50 80.31 89.66 92.00 64.98 71.59 73.5194.64 94.52 97.87 110.54 108.89 106.91 112.98 112.12 109.39 91.78 91.15 88.91
- 79.83 84.64 94.94 107.67 112.87 99.16 117.25 119.10 79.90 95.20 97.1877.80 71.35 53.06 107.22 110.77 112.45 157.37 152.28 148.96 - - -75.73 86.77 75.90 99.79 96.62 100.47 107.96 107.89 107.09 - 98.61 99.23
- - - 83.86 77.41 83.38 79.97 76.31 75.63 67.96 65.28 65.48- - - 87.07 91.47 133.54 102.64 102.54 101.13 84.93 84.55 86.96
94.30 75.14 71.78 107.88 115.78 116.42 144.71 143.91 139.35 - - -98.53 88.82 87.70 90.16 90.69 94.58 102.24 103.83 104.18 84.92 87.98 88.01
- - 45.90 106.74 107.02 118.01 151.75 148.87 161.54 - - -50.08 57.18 55.46 112.94 120.98 144.52 184.73 193.08 206.58 - - -71.16 69.71 69.00 155.23 160.50 178.08 186.36 192.36 207.73 - - -63.42 54.64 49.65 88.51 101.85 105.44 126.36 140.08 142.27 - - -77.44 80.65 77.51 102.64 100.75 102.18 115.81 119.97 119.42 92.69 95.52 96.40
- - - 93.14 98.11 106.70 96.76 102.07 103.20 76.51 85.19 86.70- 80.44 96.97 61.09 68.16 70.10 67.79 76.19 80.42 53.02 59.69 63.05
61.76 60.21 53.71 85.96 87.89 90.27 115.82 116.54 117.07 85.17 - 89.6063.72 64.78 69.52 100.85 110.72 124.64 150.08 157.77 166.08 95.38 98.04 99.19
100.00 97.05 - 114.18 114.75 123.21 117.83 118.52 119.56 97.76 99.30 99.1575.21 73.46 71.53 112.67 127.71 128.27 135.44 141.11 141.41 - - -74.37 73.95 69.59 88.95 93.02 91.37 110.29 109.43 104.84 - - 95.6973.06 75.95 80.61 91.22 95.78 96.25 107.48 109.37 106.18 90.37 91.21 86.5251.88 58.15 73.49 79.74 82.44 99.09 115.84 113.33 136.20 84.07 84.51 -73.71 74.92 74.01 90.23 93.38 97.58 113.94 115.31 115.63 95.92 98.59 98.28
2007-08 2008-09 2009-10 2007-08 2008-09 2009-10 2007-08 2008-09 2009-10 2007-08 2008-09 2009-10
Retention Rate at Primary Level
(Grade I to V)**
Gross Enrolment Ratio: Primary Level++Gross Completion Rate at Primary Level*** Net Enrolment Ratio: Primary Level++
++ Computed based on the projected population provided by the Office of the Registrar General of India. States are advised to use
more recent figures of child population obtained through HH Survey to workout the ratio.
DISE 2009-10: Flash Statistics 37
A & N IslandsAndhra PradeshArunachal PradeshAssamBiharChandigarhChhattisgarhDadra & Nagar HaveliDaman & DiuDelhiGoaGujaratHaryanaHimachal PradeshJammu & KashmirJharkhandKarnatakaKeralaLakshadweepMadhya PradeshMaharashtraManipurMeghalayaMizoramNagalandOrissaPuducherryPunjabRajasthanSikkimTamil NaduTripuraUttar PradeshUttarakhandWest Bengal
All States
State/UT
85.48 89.86 89.83 55.68 60.31 61.65 50.32 52.86 53.91 60.37 23.12 22.49 27.82 28.9979.02 79.07 79.12 57.50 58.11 58.95 76.09 81.85 76.26 81.75 57.10 72.55 54.88 70.61
100.86 104.39 115.15 65.93 75.07 83.70 23.00 25.38 21.84 23.50 19.75 22.58 20.55 20.6975.70 86.17 83.58 63.28 71.65 70.22 32.33 34.29 30.99 32.43 22.25 25.71 21.70 23.6442.36 48.36 53.38 37.21 43.37 48.85 40.44 47.14 40.42 49.08 37.51 47.61 38.44 47.4976.05 81.34 83.50 55.08 59.17 60.44 45.43 54.55 49.72 58.17 46.32 53.62 52.41 59.6279.56 84.67 88.30 53.60 54.65 61.75 49.54 56.90 50.68 58.50 26.78 44.80 26.01 45.60
- 73.17 81.01 47.02 54.23 61.94 57.85 58.92 60.85 62.17 44.49 48.70 51.69 51.5056.88 79.44 81.19 45.16 57.08 60.38 39.25 49.29 45.43 56.39 28.32 32.08 47.26 42.8091.50 99.45 100.40 63.99 70.46 71.69 58.73 62.60 65.64 69.61 40.26 39.54 41.40 40.8954.01 59.80 62.04 40.39 44.35 45.73 59.07 58.24 66.81 64.60 21.79 25.40 31.93 36.4955.90 57.66 59.75 41.04 41.86 42.42 57.32 62.05 59.83 63.10 62.33 67.29 65.94 68.4764.05 69.98 74.14 46.71 51.12 53.71 45.58 62.50 48.31 62.32 41.81 54.85 39.71 52.13
115.62 115.37 115.11 79.36 80.72 81.54 54.81 67.13 56.88 67.31 31.59 40.13 34.03 42.5481.74 91.21 100.69 58.67 67.57 75.31 54.33 58.74 53.99 58.10 40.35 47.66 39.74 46.4757.74 66.19 73.18 45.11 54.19 60.27 35.77 42.79 33.74 40.65 34.05 44.22 32.54 55.0970.05 69.94 69.14 62.71 59.99 60.90 62.87 68.25 66.85 71.03 61.70 67.23 66.58 71.5786.46 84.56 84.71 66.60 65.95 67.61 59.38 66.77 62.88 71.32 41.73 54.94 46.33 58.4089.16 88.04 86.89 62.87 64.74 63.49 62.05 100.00 68.01 100.00 53.90 100.00 56.01 100.0086.47 91.36 97.28 60.48 64.24 70.59 28.02 38.03 26.96 37.28 25.16 34.13 26.42 35.2985.98 89.06 88.93 63.88 67.86 67.59 64.63 74.47 67.34 77.72 50.08 59.43 54.53 66.1079.78 78.39 83.20 68.48 69.03 74.82 27.34 28.38 26.70 29.69 29.41 31.51 28.75 33.8070.10 76.94 83.46 49.03 51.00 54.35 25.66 38.02 27.09 31.12 23.31 26.21 24.04 25.2590.21 99.66 104.75 71.50 80.80 85.36 22.95 41.09 25.10 40.00 14.78 47.19 16.32 47.1282.22 87.42 88.34 60.69 62.60 66.66 31.86 45.86 34.74 41.65 30.36 40.44 33.48 42.5680.80 87.48 69.16 55.89 61.35 47.16 22.07 32.09 20.79 30.81 11.95 18.99 11.64 18.1396.63 101.97 104.72 68.44 79.37 80.57 54.86 100.00 63.09 100.00 33.11 100.00 37.83 100.0065.64 72.85 74.15 42.70 49.64 52.21 40.75 64.38 44.81 67.85 26.04 42.25 29.17 47.0074.41 76.99 76.54 50.85 57.26 55.03 57.59 67.35 53.68 67.35 61.02 66.98 60.05 66.4288.11 90.09 94.54 35.74 35.76 33.68 17.59 27.56 16.46 26.36 11.12 17.69 11.97 17.10
114.95 117.35 119.56 88.05 90.51 91.27 68.64 67.31 73.47 70.03 44.63 55.97 50.28 59.3991.26 96.99 97.80 73.69 80.55 78.93 16.64 27.03 17.65 28.96 14.66 24.54 15.16 25.7450.93 54.54 56.35 40.16 43.26 45.38 44.57 47.44 42.92 45.89 43.24 46.15 43.86 45.0278.80 87.78 91.18 58.26 64.34 65.26 42.55 56.98 38.67 54.97 29.48 42.17 26.08 37.1372.01 75.54 87.17 51.42 54.56 63.31 46.70 45.84 46.03 44.15 24.50 31.68 21.12 26.8669.88 73.74 75.80 52.55 56.22 58.29 50.20 56.04 50.51 55.76 42.55 49.19 43.56 48.90
Students’ Performance: Grade IV/V*
Net Enrolment Ratio*
%age StudentsSecured 60% &Above Marks:
2008-09
%age StudentsSecured 60% &Above Marks:
2009-10
%age StudentsSecured 60% &Above Marks:
2008-09
%age StudentsSecured 60% &Above Marks:
2009-10
%age StudentsSecured 60% &Above Marks:
2008-09
%age StudentsSecured 60% &Above Marks:
2009-10
%age StudentsSecured 60% &Above Marks:
2008-09
%age StudentsSecured 60% &Above Marks:
2009-10
2007-08 2008-09 2009-10 2007-08 2008-09 2009-10
Gross Enrolment Ratio*
Enrolment Ratio at Upper Primary Level++
Boys Girls Boys Girls
Students’ Perfomance: Grade VII/VIII*
++ Computed based on the projected population provided by the Office of the Registrar General of India. States are advised to use
more recent figures of child population obtained through HH Survey to workout the ratio.
* Based on the incomplete coverage as a number of states have not reported Grade VIII enrolment.

DISE 2009-10: Flash Statistics 39
EDUCAEDUCAEDUCAEDUCAEDUCATITITITITIOOOOONALNALNALNALNAL
DEVELDEVELDEVELDEVELDEVELOOOOOPMENTPMENTPMENTPMENTPMENT
INDEXINDEXINDEXINDEXINDEX
(EDI)(EDI)(EDI)(EDI)(EDI)
2009-12009-12009-12009-12009-100000

DISE 2009-10: Flash Statistics 41
Variables used in Computing Educational Development Index(EDI)
Component IndicatorPercentage of Habitations not Served* (corrected with reference to new schools (Government) opened since 2002-03)
ACCESS Availability of Schools per 1000 Child PopulationRatio of Primary to Upper Primary Schools/Sections (only at Upper Primary stage)Schools with Student-Classroom Ratio > 40
INFRASTRUCTURE Schools with Drinking Water facilitySchools with Common toiletSchools with Girl’s toiletPercentage of Schools with Female Teachers (in schools with 2 and more teachers)Schools with Pupil-Teacher Ratio > 40
TEACHERS Percentage of schools with less than 2 teachers (in schools with more than 15 students) (Primary schools only)Percentage of Schools with < 3 teachers (Upper Primary schools/sections)Teachers without Professional QualificationGross Enrolment Ratio - OverallParticipation of Scheduled Castes Children: Percentage SC Population (2001 Census) - Percentage SC EnrolmentParticipation of Scheduled Tribes Children : Percentage ST Population (2001 Census) - Percentage ST EnrolmentGender Parity Index in Enrolment
OUTCOMES Repetition RateDrop-out Rate*Ratio of Exit Class over Class I Enrolment (only at Primary stage)Transition Rate from Primary to Upper Primary level (only for Upper Primary level)Percentage of Appeared Children securing 60 per cent and more marks
Note:� Indicators used for constructing EDI were pre-determined by the MHRD, Government of India. Contributions received from the members of the Multi-Disciplinary Expert and
Core Group on EDI constituted by the MHRD in 2005-06 is gratefully acknowledged.� Indicators were normalized before the Principal Component Analysis was applied to decide the factor loadings and weights.� Separate dimensional indices were constructed first before finalising the EDI; and* Number of access-less habitations has been obtained from the Seventh All India Educational Survey and drop-out rate at Upper Primary level from the Selected
Educational Statistics (MHRD). Wherever necessary projected child population provided by the Office of the Registrar General of India has been used.

42 Elementary Education in India
Assumptions used in Computing EDI
An effort has been made by the National University of Educational Planning and Administration (NUEPA) and the Government of India (MHRD, Department ofSchool Education and Literacy) to compute an Educational Development Index (EDI), separately for Primary and Upper Primary levels of education and also acomposite index for the entire Elementary education which is exclusively based on the DISE data for the year 2009-10. The first such attempt was made in 2005-06.
A set of 21 indicators have been used in computing EDI which are re-grouped into the four sub-groups, namely Access, Infrastructure, Teachers and Outcomeindicators. The Indicators used for constructing EDI were pre-determined by a Working Group on EDI constituted by the MHRD during 2005-06 of which NUEPAwas also one of the institutional members. In the present year, improved versions of a few variables were used. Percentage of access-less habitation was one suchvariable which is latest available for the year 2002-03. In view of a large number of schools that have been opened across the country in the recent past, the same wascorrected with reference to new schools (Government) opened since 2002-03. Like in the previous year, in place of Gross Enrolment Ratio of SC/ST population,percentage of SC/ST population (to total population, 2001 Census) minus percentage of SC/ST share of enrolment in Primary and Upper Primary classes has beenused to assess participation of the SC/ST children. Like 2008-09, in 2009-10 also, Schools with Student-Classroom Ratio (SCR) above 40 and schools with Pupil-Teacher Ratio (PTR) above 40 have been used in place of schools having SCR and PTR above 60. Similarly, in place of single-teacher schools, percentage of Primaryonly schools with less than 2 teachers (in schools with more than 15 students) has been used in computing Teacher’s Index at Primary level. In view of these changes,average SCR and PTR and percentage of passed children to total enrolment have not been used in computing EDI in 2009-10 both in case of Primary and UpperPrimary levels of education.
After data was cleaned, each indicator was normalised by using the following formula:
{Best Xi - Observed Xij}NVij = 1-
{Best Xi - Worst Xi}
Upon receiving normalised values, Principal Component Analysis (PCA) was applied to decide the factor loading and weights. In case of a few variables, policyoptions were explored to identify the best values instead of based on the observed values. Some of these variables are: access-less habitations (best value, zero),percentage of schools with pupil-teacher and students-classroom ratio above 40 (best value, zero), percentage of teachers without professional qualification (bestvalue, zero) etc. EDI in 2009-10 may not necessarily be comparable with the same in the previous year.
[ ]

DISE 2009-10: Flash Statistics 43
Sl. State/UTNo.
1 A & N Islands 0.085 35 0.094 35 0.931 2 0.890 32 Andhra Pradesh 0.627 9 0.625 7 0.549 23 0.666 203 Arunachal Pradesh 1.000 1 1.000 1 0.221 33 0.394 314 Assam 0.696 5 0.524 20 0.164 34 0.365 335 Bihar 0.554 15 0.552 16 0.379 30 0.375 326 Chandigarh 0.500 24 0.500 28 0.715 12 0.865 57 Chhattisgarh 0.663 6 0.659 5 0.429 28 0.463 278 D & N Haveli 0.628 8 0.623 8 0.515 25 0.568 259 Daman & Diu 0.320 33 0.378 33 0.818 7 0.820 9
10 Delhi 0.515 20 0.515 23 0.741 10 0.817 1011 Goa 0.452 29 0.435 30 0.676 17 0.726 1412 Gujarat 0.570 12 0.569 13 0.700 14 0.684 1813 Haryana 0.551 16 0.520 22 0.872 4 0.847 714 Himachal Pradesh 0.411 31 0.398 31 0.595 22 0.654 2115 Jammu & Kashmir 0.769 3 0.762 2 0.363 31 0.318 3416 Jharkhand 0.632 7 0.628 6 0.291 32 0.422 2917 Karnataka 0.559 14 0.565 14 0.680 16 0.596 2318 Kerala 0.229 34 0.225 34 0.848 5 0.846 819 Lakshadweep 0.536 19 0.542 17 0.784 8 0.854 620 Madhya Pradesh 0.561 13 0.577 11 0.637 19 0.535 2621 Maharashtra 0.542 17 0.562 15 0.674 18 0.732 1322 Manipur 0.404 32 0.397 32 0.408 29 0.421 3023 Meghalaya 0.794 2 0.760 3 0.149 35 0.219 3524 Mizoram 0.743 4 0.746 4 0.602 21 0.679 1925 Nagaland 0.582 11 0.620 9 0.635 20 0.807 1126 Orissa 0.513 21 0.528 19 0.489 26 0.570 2427 Puducherry 0.500 23 0.523 21 0.966 1 0.927 228 Punjab 0.502 22 0.514 24 0.883 3 0.969 129 Rajasthan 0.593 10 0.592 10 0.686 15 0.691 1630 Sikkim 0.464 28 0.509 25 0.741 11 0.882 431 Tamil Nadu 0.494 25 0.473 29 0.747 9 0.801 1232 Tripura 0.416 30 0.505 26 0.482 27 0.436 2833 Uttar Pradesh 0.487 26 0.502 27 0.827 6 0.713 1534 Uttarakhand 0.538 18 0.537 18 0.707 13 0.689 1735 West Bengal 0.473 27 0.574 12 0.516 24 0.609 22
Educational Development Index: Primary LevelAll Schools: All Managements
Access Index & Rank Infrastructure Index & Rank
2008-09 2009-10 2008-09 2009-10
44 Elementary Education in India
Sl. State/UTNo.
1 A & N Islands 0.977 1 0.900 7 0.582 30 0.675 202 Andhra Pradesh 0.711 15 0.686 17 0.834 5 0.806 63 Arunachal Pradesh 0.375 34 0.368 35 0.483 34 0.465 354 Assam 0.408 33 0.454 32 0.645 23 0.688 175 Bihar 0.466 29 0.463 30 0.579 31 0.597 316 Chandigarh 0.969 3 0.949 3 0.451 35 0.593 337 Chhattisgarh 0.486 28 0.503 28 0.745 12 0.746 118 D & N Haveli 0.560 23 0.585 22 0.757 9 0.748 99 Daman & Diu 0.861 9 0.810 11 0.537 33 0.651 27
10 Delhi 0.895 6 0.913 5 0.596 27 0.699 1511 Goa 0.873 8 0.852 9 0.596 28 0.668 2412 Gujarat 0.790 10 0.816 10 0.752 10 0.692 1613 Haryana 0.708 17 0.694 16 0.699 17 0.678 1814 Himachal Pradesh 0.708 16 0.730 13 0.829 6 0.788 715 Jammu & Kashmir 0.520 25 0.507 27 0.835 4 0.769 816 Jharkhand 0.363 35 0.373 34 0.604 26 0.606 3017 Karnataka 0.758 12 0.774 12 0.839 3 0.815 418 Kerala 0.975 2 0.981 1 0.665 22 0.812 519 Lakshadweep 0.935 5 0.917 4 0.879 2 0.923 120 Madhya Pradesh 0.438 32 0.462 31 0.699 18 0.670 2321 Maharashtra 0.685 18 0.713 15 0.801 7 0.747 1022 Manipur 0.515 26 0.510 26 0.590 29 0.647 2823 Meghalaya 0.557 24 0.563 23 0.568 32 0.615 2924 Mizoram 0.725 14 0.674 19 0.684 21 0.714 1325 Nagaland 0.618 20 0.593 21 0.751 11 0.677 1926 Orissa 0.565 22 0.525 24 0.737 13 0.704 1427 Puducherry 0.951 4 0.966 2 0.698 20 0.908 228 Punjab 0.786 11 0.873 8 0.616 25 0.564 3429 Rajasthan 0.452 31 0.449 33 0.627 24 0.594 3230 Sikkim 0.728 13 0.725 14 0.698 19 0.672 2131 Tamil Nadu 0.881 7 0.901 6 0.954 1 0.887 332 Tripura 0.455 30 0.467 29 0.777 8 0.716 1233 Uttar Pradesh 0.587 21 0.637 20 0.728 14 0.671 2234 Uttarakhand 0.639 19 0.674 18 0.708 16 0.666 2635 West Bengal 0.500 27 0.511 25 0.708 15 0.667 25
Educational Development Index: Primary LevelAll Schools: All Managements
Teachers Index & Rank Outcomes Index & Rank
2008-09 2009-10 2008-09 2009-10
DISE 2009-10: Flash Statistics 45
Sl. State/UTNo.
1 A & N Islands 0.526 31 0.433 33 0.925 2 0.972 12 Andhra Pradesh 0.642 23 0.578 23 0.700 18 0.777 153 Arunachal Pradesh 0.293 34 0.289 34 0.501 31 0.698 194 Assam 0.637 24 0.564 27 0.205 35 0.306 345 Bihar 0.513 32 0.515 31 0.520 30 0.424 326 Chandigarh 0.760 10 0.756 5 0.708 17 0.891 67 Chhattisgarh 0.752 12 0.712 11 0.477 32 0.448 308 D & N Haveli 0.751 13 0.682 16 0.629 23 0.742 179 Daman & Diu 0.779 7 0.775 3 0.818 9 0.787 14
10 Delhi 0.760 9 0.694 14 0.683 20 0.819 1111 Goa 0.589 27 0.520 29 0.831 7 0.865 812 Gujarat 0.823 2 0.798 2 0.710 14 0.684 2213 Haryana 0.786 6 0.728 7 0.901 3 0.864 914 Himachal Pradesh 0.802 3 0.732 6 0.653 22 0.685 2115 Jammu & Kashmir 0.729 16 0.713 10 0.523 28 0.422 3316 Jharkhand 0.497 33 0.475 32 0.466 33 0.438 3117 Karnataka 0.789 5 0.727 8 0.709 15 0.658 2418 Kerala 0.682 21 0.620 22 0.860 5 0.866 719 Lakshadweep 0.799 4 0.763 4 0.815 10 0.900 520 Madhya Pradesh 0.722 17 0.664 17 0.698 19 0.577 2621 Maharashtra 0.704 19 0.650 18 0.781 11 0.819 1222 Manipur 0.568 30 0.528 28 0.570 26 0.561 2923 Meghalaya 0.609 26 0.649 19 0.208 34 0.146 3524 Mizoram 0.964 1 0.963 1 0.601 24 0.664 2325 Nagaland 0.587 28 0.517 30 0.653 21 0.824 1026 Orissa 0.722 18 0.576 24 0.534 27 0.569 2727 Puducherry 0.731 15 0.684 15 0.974 1 0.907 428 Punjab 0.750 14 0.717 9 0.873 4 0.946 229 Rajasthan 0.766 8 0.700 12 0.775 12 0.757 1630 Sikkim 0.572 29 0.574 25 0.828 8 0.943 331 Tamil Nadu 0.616 25 0.566 26 0.730 13 0.804 1332 Tripura 0.701 20 0.622 21 0.520 29 0.565 2833 Uttar Pradesh 0.672 22 0.630 20 0.840 6 0.703 1834 Uttarakhand 0.753 11 0.699 13 0.709 16 0.645 2535 West Bengal 0.267 35 0.281 35 0.571 25 0.686 20
Educational Development Index: Upper Primary LevelAll Schools: All Managements
Access Index & Rank Infrastructure Index & Rank
2008-09 2009-10 2008-09 2009-10

46 Elementary Education in India
Sl. State/UTNo.
1 A & N Islands 0.965 4 0.976 2 0.759 8 0.699 122 Andhra Pradesh 0.871 8 0.864 10 0.744 11 0.717 73 Arunachal Pradesh 0.582 25 0.645 24 0.660 17 0.686 134 Assam 0.625 24 0.582 26 0.620 22 0.590 245 Bihar 0.363 33 0.510 29 0.411 35 0.430 356 Chandigarh 0.976 1 0.952 3 0.563 27 0.579 267 Chhattisgarh 0.549 26 0.477 32 0.651 19 0.700 118 D & N Haveli 0.626 23 0.774 16 0.575 25 0.608 239 Daman & Diu 0.827 11 0.864 11 0.774 5 0.672 18
10 Delhi 0.908 6 0.894 8 0.685 15 0.673 1711 Goa 0.905 7 0.951 4 0.431 33 0.621 2212 Gujarat 0.673 21 0.848 14 0.638 20 0.588 2513 Haryana 0.737 15 0.779 15 0.734 12 0.676 1614 Himachal Pradesh 0.783 12 0.773 17 0.753 9 0.768 515 Jammu & Kashmir 0.695 19 0.708 20 0.706 14 0.679 1416 Jharkhand 0.278 34 0.427 34 0.634 21 0.678 1517 Karnataka 0.662 22 0.850 13 0.749 10 0.709 1018 Kerala 0.909 5 0.941 5 0.809 3 0.819 419 Lakshadweep 0.970 3 0.924 6 0.801 4 0.892 120 Madhya Pradesh 0.427 31 0.428 33 0.527 30 0.575 2721 Maharashtra 0.708 17 0.760 18 0.763 7 0.712 922 Manipur 0.707 18 0.703 21 0.657 18 0.659 2023 Meghalaya 0.689 20 0.647 23 0.584 24 0.631 2124 Mizoram 0.764 13 0.721 19 0.669 16 0.716 825 Nagaland 0.716 16 0.692 22 0.725 13 0.671 1926 Orissa 0.425 32 0.483 31 0.505 31 0.495 3327 Puducherry 0.972 2 0.981 1 0.829 2 0.872 328 Punjab 0.865 9 0.894 7 0.542 29 0.571 2829 Rajasthan 0.495 30 0.589 25 0.543 28 0.496 3230 Sikkim 0.844 10 0.857 12 0.459 32 0.483 3431 Tamil Nadu 0.738 14 0.878 9 0.907 1 0.873 232 Tripura 0.521 28 0.563 27 0.590 23 0.542 3033 Uttar Pradesh 0.254 35 0.253 35 0.569 26 0.562 2934 Uttarakhand 0.513 29 0.508 30 0.765 6 0.758 635 West Bengal 0.544 27 0.528 28 0.416 34 0.535 31
Educational Development Index: Upper Primary LevelAll Schools: All Managements
Teachers Index & Rank Outcomes Index & Rank
2008-09 2009-10 2008-09 2009-10

DISE 2009-10: Flash Statistics 47
Sl. State/UTNo.
1 A & N Islands 0.664 12 0.663 5 0.809 4 0.829 4 0.736 7 0.746 42 Andhra Pradesh 0.657 15 0.561 17 0.746 11 0.762 12 0.702 14 0.662 143 Arunachal Pradesh 0.512 29 0.328 35 0.519 31 0.620 25 0.516 30 0.474 314 Assam 0.446 35 0.386 31 0.519 32 0.503 32 0.483 33 0.445 325 Bihar 0.480 32 0.375 32 0.447 35 0.466 35 0.463 34 0.421 356 Chandigarh 0.688 10 0.655 7 0.756 9 0.814 5 0.722 10 0.735 67 Chhattisgarh 0.554 26 0.439 26 0.600 25 0.558 27 0.577 26 0.498 278 D & N Haveli 0.594 22 0.493 22 0.640 22 0.710 19 0.617 22 0.602 209 Daman & Diu 0.654 17 0.612 9 0.801 5 0.782 10 0.728 9 0.697 9
10 Delhi 0.701 6 0.651 8 0.762 7 0.790 8 0.732 8 0.720 811 Goa 0.658 14 0.602 11 0.697 17 0.783 9 0.678 17 0.692 1012 Gujarat 0.698 7 0.584 13 0.706 16 0.730 18 0.702 13 0.657 1513 Haryana 0.714 4 0.590 12 0.789 6 0.770 11 0.752 4 0.680 1114 Himachal Pradesh 0.611 21 0.567 16 0.746 12 0.741 16 0.679 16 0.654 1715 Jammu & Kashmir 0.586 24 0.404 30 0.661 21 0.621 24 0.623 21 0.512 2516 Jharkhand 0.449 34 0.363 34 0.464 33 0.500 34 0.456 35 0.431 3417 Karnataka 0.693 8 0.569 15 0.723 15 0.743 15 0.708 12 0.656 1618 Kerala 0.689 9 0.700 3 0.822 3 0.844 3 0.756 3 0.772 319 Lakshadweep 0.773 2 0.704 2 0.851 2 0.887 2 0.812 2 0.795 220 Madhya Pradesh 0.571 25 0.433 27 0.585 26 0.540 28 0.578 25 0.486 3021 Maharashtra 0.660 13 0.576 14 0.740 14 0.750 13 0.700 15 0.663 1322 Manipur 0.464 33 0.411 29 0.630 24 0.627 23 0.547 27 0.519 2423 Meghalaya 0.498 31 0.365 33 0.522 30 0.501 33 0.510 31 0.433 3324 Mizoram 0.686 11 0.544 19 0.741 13 0.738 17 0.714 11 0.641 1825 Nagaland 0.633 20 0.549 18 0.675 20 0.699 20 0.654 20 0.624 1926 Orissa 0.553 27 0.468 23 0.537 29 0.524 30 0.545 28 0.496 2827 Puducherry 0.797 1 0.736 1 0.884 1 0.891 1 0.841 1 0.813 128 Punjab 0.714 5 0.656 6 0.760 8 0.803 7 0.737 6 0.730 729 Rajasthan 0.587 23 0.458 25 0.636 23 0.629 22 0.612 24 0.544 2230 Sikkim 0.657 16 0.608 10 0.683 18 0.748 14 0.670 18 0.678 1231 Tamil Nadu 0.747 3 0.677 4 0.753 10 0.811 6 0.750 5 0.744 532 Tripura 0.501 30 0.415 28 0.577 27 0.567 26 0.539 29 0.491 2933 Uttar Pradesh 0.654 18 0.534 21 0.573 28 0.511 31 0.614 23 0.523 2334 Uttarakhand 0.643 19 0.538 20 0.679 19 0.636 21 0.661 19 0.587 2135 West Bengal 0.528 28 0.467 24 0.459 34 0.540 29 0.494 32 0.503 26
Composite Educational Development IndexAll Schools: All Managements
EDI & RankPrimary Level
EDI & RankUpper Primary Level
EDI & Rank(Composite Primary & Upper Primary)
2008-09 2009-10 2008-09 2009-10 2008-09 2009-10