Sulabh International Academy of Sulabh International Academy of Environmental Sanitation Environmental Sanitation Final Report Study on “Disease Burden due to Inadequate Water & Sanitation Facilities in India ” Suppo ted by Suppo r rted by World Health Organization World Health Organization
Transcript
Sulabh International Academy of Sulabh International Academy of
Environmental SanitationEnvironmental Sanitation
Final Report
Study on “Disease Burden due to Inadequate Water & Sanitation
Facilities in India”
Suppo ted bySupporrted by World Health Organization
World Health Organization
Final Report
Study on Disease Burden Due to Inadequate Water & Sanitation
Facilities in India
Study Sponsored by World Health Organization
Study Conducted by Sulabh International Academy of Environmental Sanitation
Study Team
Principal Investigator
Prof. K. J. Nath Chairman,
Sulabh International Social Service Organization Vice Chancellor
Sulabh International Academy of Environmental Sanitation Chairman, Arsenic Task Force, Govt. of West Bengal
President, Institution of Public Health Engineers, India. Member, Scientific Advisory Board & Regional Co-ordinator for South East Asia
International Scientific Forum on Home Hygiene, Geneva (IFH) Former Director, All India Institute of Hygiene & Public Health, Kolkata
Co-Investigators/Research Associates
Prof. A. Majumdar Former, Director-Professor,
All India Institute of Hygiene & Public Health, Kolkata
Mr. Santanu Lahiri Formerly of WSP, Laos, World Bank
Mr. Diptarup Kahali Assistant Professor,
All India Institute of Hygiene and Public Health, Kolkata
Mr. Barenyo Chowdhury IKONET
i
Sulabh International Academy of Enviorenmental Sanitation Palam, New Delhi
Study on “Disease Burden Due to Inadequate Water and Sanitation Facilities in India”
Dated: …………………….
Dr. Bindeshwar Pathak, Chancellor,
Foreword
Sulabh has been working for the promotion of Environmental Sanitation in the country for the last four decades. We are committed to the fulfillment of the dream of Mahatma Gandhi to build a society free from the evils of untouchability and social discrimination. Abolishing the dehumanizing system of manual scavenging of night soil from the community is the basic precondition and primary step towards that end. Sulabh developed the two-pit pour flush toilets – an affordable, user-friendly model of human excreta disposal – which ensure hundred percent safety against environmental pollution and does not require manual handling. Today, there are more than a million household Sulabh Souchalayas in the country and more than 6000 public toilet complexes based on Sulabh technologies. All together more than 10 million people in the country are using Sulabh Souchalayas. It is in this context that I express my deepest gratitude and sincere thanks to WHO, India for entrusting this important study on “Disease Burden Due to Inadequate Water & Sanitation Facilities in India” to Sulabh International Academy of Environmental sanitation. While, it requires little more than common sense to appreciate the fact that safe water and sanitary excreta disposal facilities are the basic precondition for prevention of infectious diseases like diarrhea, cholera, typhoid, hepatitis etc, a scientific documentation of the same, will go a long way in sensitizing and orienting the policy makers to provide the desired priority and emphasis on this vital programme. I congratulate Prof. K.J. Nath and his team, for successfully completing this study and once again extend my grateful thanks to Dr. Salim J. Habayeb and Mr. A.K. Sengupta of WHO India, for entrusting us this important study.
(Dr. Bindeshwar Pathak)
Sulabh International Academy of Enviorenmental Sanitation Palam, New Delhi
Study on “Disease Burden Due to Inadequate Water and Sanitation Facilities in India”
Prof. Kumar Jyoti Nath Dated: …………………….Vice Chancellor
Preface
Access to safe drinking water and sanitation is essential for protection and promotion of health. It is a basic human right and a key component of effective public health delivery system. The importance of community water supply and sanitation as a key health and development issue has been highlighted in a number of international policy forums, which include the Alma Ata Conference on Primary Health Care 1978, and the Mardel Plata World Water Conference, 1977, which launched the Water Supply and Sanitation Decade of 1981-1990. More recently, the Millennium Declaration Goal adapted by the General Assembly of the United Nations in 2000 and the outcome of the Johannesburg World Summit for Sustainable Development in 2002 brought the issue into sharp focus. Despite an overall lack of information, available evidence suggests that the health impacts of high levels of environmental pollution and poor quality of drinking water are significant. Episodes of gastro-enteric diseases are frequent and severe, particularly for specific socio-environmental groups within the bustees of the major urban areas as well as in rural and peri-urban areas. The environmental health situation is changing as rapidly as the socio-economic scenario in the urban and rural areas. Although there are few data to substantiate this, it is possible that today environmental health impacts in the deprived urban areas are more severe than the traditional impacts on health in the rural areas. Malaria is now predominantly an urban disease. GE epidemics are seasonal and overall GE disease prevalence maintains an endemic profile. These preventable crises are primarily related to inadequate water supplies, sanitation and drainage facilities. This is despite decades of attempts to improve the environmental infrastructure in the country. Importantly, environmental health impacts are not equally distributed – the detailed epidemiological data available suggest that there is a “double” burden of health impacts on the poor as a consequence of high levels of poverty, malnutrition and exposure to environmental risks. In terms of priority environmental conditions, diarrhea and dysentery still constitute major health problems for all age groups. The burden is particularly severe for children, with deaths due to
ii
infectious diseases dominating the mortality profile of children under 14 years. The overall population particularly the socio-economically vulnerable groups living in the slums, peri-urban and rural areas are critically affected by endemic gastro-enteric illness. Given the unrepresentative nature of hospital data this probably represents the tip of the iceberg in terms of the scale of the environmental health problems associated with water and waste management. The cholera which declined during the eighties reappeared in 1992-93. Epidemiological data indicate that the epidemic’s distribution was largely confined to the poor population of the cities. Evidence suggests that poor water supply and lack of sanitation facilities were, in part, responsible for other water-borne diseases like viral hepatitis, enteric fever etc. As many as 60-65 % of people reporting to health clinics suffer from water borne diseases (WHO). However, unfortunately the planners and policy makers of the developing countries are yet to be adequately sensitized on this vital issue. The fact that, the investments in water supply and sanitation could yield a net economic benefit for the nation is often lost sight of in fixing priorities in the national development plans. Poor coordination and collaboration between the health sector and non-health development sectors in the developing countries has often resulted in inadequate health benefits from water supply and sanitation projects. It is in the above context that the WHO entrusted the above study to Sulabh International Academy of Environmental Sanitation (SIAES). Sulabh has played a pioneering role in promotion of sanitation in India and it is possibly in fitness of things that SIAES has been considered an appropriate organization for collection, collation, analysis and co-relation of water supply and sanitation data with the data in respect of infectious disease burden in the country. We sincerely hope that the study document could be an effective advocacy tool for greater cooperation and coordination between health sector and development sectors like the rural development, urban development and environment which will result in optimal health benefits from water supply and sanitation programmes in the country. I would like to acknowledge and record with grateful thanks, the support received from WHO country office, particularly Mr. A.K. Sengupta, National Professional Officer, for conducting the study. We also take this opportunity to thank the resource organizations like PHED, Govt. of West Bengal, NICD, GOI, NICED, ICMR, NEERI, MUDPA, GOI, MRD, Dept. of Drinking Water Supply, GOI, UNICEF, West Bengal for their support. Lastly I would like to thank my co-investigators and research associates for their untiring efforts.
Prof. Kumar Jyoti Nath
Contents iv
Chapter
No. Title Page
No.
1 Background, Objectives & Methodology 1 1.1 Background 1 1.2 Objective & Scope of work of the study / Consultancy 2
1.3 Methodology & Plan of Activities. 3
1.4 Planned Schedule of Activities 3
2. Planning Meeting: Kolkata, 21st July, 2006 5
2.1 Programme & Participants 5
2.2 Summary of Discussions 7
2.3 Study Strategy 8 3. Basic Issues & International Perspective 11
3.1 Water Sanitation-hygiene and Health Linkages: Basic Issues 11 3.2 International Perspectives 19
3.3 Water supply and sanitation: South-East-Asia Scenario 30
3.4 General Observations 34
4. National Perspective on WSS Coverage in the Country and in Major States & Cities
36
4.1 Fact Sheets on India 36 4.2 Community water supply and environmental sanitation: A review of
progress and present status 36
4.3 Domestic and personal hygiene: Practice and perception 46 5. Discussion on Linkage Between Water and Sanitation Coverage and
Corresponding Disease Burden in the Country 49
5.1 The public health scenario in India 49
5.2 Impact of Improved Water Supply and Sanitation Coverage in the Country on the Burden of WSS Related Diseases
52
5.3 Linkage between availability of water supply and sanitation facilities with the incidence of diseases like Acute Diarrhoeal disease, Enteric Fever, Hepatitis and Cholera, across the states
59
5.4 Vector-borne Disease Burden in the Country 70
5.5 West Bengal Scenario: Water Sanitation related Disease Burden 74
5.6 Fluoride in Groundwater and Endemic Fluorosis in India 93
5.7 Geo-Environmental and Climatological factors’ influence on endemecity of WSS diseases in India
95
6. National Level Workshop on “Water Borne and Related Diseases” 98
6.1 Preamble: 98 6.2 Inaugural Session: 98
6.3 Programme Details 100
6.4 List of Participants 103 6.5 Recommendations: 106
7. Sanitation/Hygiene practice and perception and health linkage: Pilot studies in West Bengal
109
7.1 A Case Study on Sanitation-Health Linkage in the “Nirmal Grams” in Murshidabad and Bankura Districts in West Bengal, June-July 2007
109
7.2 The Study on Perception and practices of Hygiene and its health impact 127
8 Review of Institutional Issues and Key Recommendation for Action Plan 135 8.1 Present Institutional Setup in the Country on Issues related to Water,
Sanitation and Health 135
8.2 Health and Environment: Critical Coalition is Lacking 136 8.3 Water quality monitoring and surveillance: Review of the Institutional Issues
in South East Asian countries 137
8.4 Key Problem Areas and Basic Maladies 139
8.5 Key Recommendation for Action Plan to Capacitate Dept. of Health and Other Related Depts.
140
8.6 Specific Action Programmes Recommended for Implementation During the 11th Plan.
146
9. General Discussions, Key Conclusions and Recommendations 153
References
Appendix i
Appendix ii
Appendix iii
v
vi
ABBREVIATIONS
AIIH&PH All India Institute of Hygiene and Public Health, Calcutta DALY Disability-adjusted life year [DALY combines the burden from death and
disability in a single index and permits the comparison of the burden from water, sanitation and hygiene with the burden with the burden from other risk factors or diseases].
IFH International Scientific Forum on Home Hygiene Lpcd litre per capita per day MoHFW Ministry of Health and Family Welfare, Government of India NICD National Institute of Communicable Diseases NICED (ICMR) National Institute of Cholera and Enteric DiseasesNIE (Chennai) National Institute of Epidemiology NIOH (ICMR) National Institute for Occupational Health UNICEF United Nations Children’s Programme UT Union Territory WB World Bank WHO World Health Organization WSP Water and Sanitation Program of the World Bank MRD Ministry of Rural Development MOEF Ministry of Environment & Forest CPHEEO Central Public Health and Environmental Engineering Organization MUD & PA Ministry of Urban Development & Poverty Alleviation CHS Central Health Service DGHS Directorate General of Health Service SEAR South East Asia Region P&RDD Panchayet & Rural Development Deptt. DOH Department of Health IEC Information, Education and Communication KAP Knowledge Attitude & Practice IMR Infant Mortality Rate EPTRI Environmental Protection Training and Research Institute, Hyderabad IHS Institute of Health System I&CA Information and Cultural Affairs
Background, Objectives & Methodology 1.1 Background: A substantial proportion of ill health in India can be attributed to lack of safe drinking water, poor sanitation and hygiene practices. Safe and potable water is normally defined as water that is free from pathogenic agents and chemical substances, pleasant to taste and usable for domestic purposes. A daily requirement of minimum of 40 lpcd (litres per capita per day) in the rural and 70 lpcd in the urban areas is a must to lead a normal healthy life. Polluted water, the root cause of most of the water borne diseases, is caused by human activities like rapid unplanned urbanization, industrialization, agricultural pollutants like pesticides and insecticides, improper waste management in the urban areas etc. Quality of water and waste management are interdependent and has to be dealt with together to ensure supply of pollution free water. The public health impact of water pollution is enormous. A number of diseases with high morbidity and mortality are wide spread in the communities specially living in unsuitable environmental conditions in urban slums and vast rural areas. The major diseases that are attributed to environment pollution and poor drinking water supply are: diarrhoeal diseases, cholera, shigellosis, escherichia coli diarrhoea, poliomyelitis, typhoid, water borne viral hepatitis. Of these, diarrhoeal diseases alone cause more than 0.6 million deaths annually. Study has shown that in slum areas of major cities diarrhoeal incidence as high as 10.5 episodes per child per year occur on regular basis. Diseases caused by faeco-orally transmitted enteric pathogens account for 10% of total burden of disease in India. Statistics indicate that intestinal group of diseases claim about 5 million lives and about 50 million people suffer from these diseases every year. Apart from biological contaminants, chemical contaminants namely fluoride, arsenic and other heavy metals pose a very serious health hazard in the country. It is estimated that about 70 million people in 20 states are at risk due to excess fluoride and around 14 million people are at risk due to excess arsenic in ground water. Apart from this, increase in the concentration of chloride, TDS, nitrate, iron in ground water is of great concern for a sustainable drinking water programme. All these need to be tackled holistically. With over extraction of groundwater the concentration of chemicals is increasing regularly.
- 2 -
Scientists around the world continue to identify links between cancers and chemical contaminants in water, along with new methods for preventing and removing the contamination. One of the greatest failures of the last fifty years has been the failure to lay the foundation stones of public health in the developing world – hygiene, sanitation and water supply. It is a failure that to day deprives hundreds of millions not only of health but of productivity. Despite significant progress during the last two decades, the demographic and environmental health scenario continues to be a cause of serious concern in the developing countries of South East Asia and Sub-Saharan Africa. The traditional problems of water and air-borne infections combine with malnutrition and poor environmental sanitation to form a vicious cycle which is increasing the burden of diseases beyond the capacity of the existing health infrastructure and jeopardizing the productivity of society. Information related to disease burden due to improper hygiene practices and inadequate supply of drinking water and provision of sanitation facilities in India is lacking – currently there are no summarized snap shots available for the macro-level that clearly reflects the concerns and achievements at micro-level initiatives. Therefore, this study is launched to initiate a process to summarize the disease burden situation in India due to inadequate WSS services. 1.2 Objective & Scope of work of the study / Consultancy The consultant is expected to develop a report based on desk study and discussions with various stakeholders assessing the disease burden due to inadequate availability of water and sanitation facilities as also the poor level of awareness on Hygiene issues in the country. Though the study will be country specific, approximate status of disease burden in some of the major states need to included to give broad idea about regional variation of the problem. The consultant will also study the present coordination mechanism amongst various ministries (listed above) on environmental issues and suggest mechanism for an active role for MoH&FW for coordination and improve disease burden situation. A first hand assessment of the disease burden due to inadequate supply of safe drinking water and provision of proper sanitation facilities in India, with highlighting the approximate status of disease burden in some of the major states and cities in India.
- 3 -
1.3 Methodology & Plan of Activities. The Consultancy team is expected to:
• Carry out desk study of documents concerning Reports on Environmental Quality and Community Health status with special emphasis on lack of safe water and sanitation & hygiene behaviour and diseases caused due to the same.
• Based on the status of water, sanitation & hygiene reported from various studies, co-relation need to be established between health indicators and water and sanitation facilities. A comparative study between various regions/states may also be included.
• A comparative study amongst the situation in Urban slums and rural areas may be brought in to establish the linkages between health issues and water and sanitation facilities.
• Discuss with various stakeholders including research agencies and other institutions to assess the problem related to environmental health with special emphasis on water and sanitation facilities in the country.
• To analyze the roles of various ministries in the water and sanitation sector and suggest the coordination mechanism with MoH&FW.
1.4 Planned Schedule of Activities
(i) The study was launched with the planning meeting/brain storming in Calcutta on 21st July, 2006. In this brain storming session, the views of various Public Health experts were shared by the Principal Investigator and his team regarding the present status of safe water & sanitation and its impact on community health. Both the Indian scenario & International perspective was discussed.
(ii) An in-depth desk study and internet research was planned to be undertaken by the Research team on the following issues.
Present status of drinking water supply and sanitation facilities in various South East Asian countries, along with the community health status in those countries (Infant mortality rate and morbidity & mortality from water & sanitation related infectious diseases). Present status of drinking water supply and sanitation along with solid waste management in various regions of the country and also a few major cities, along with the community health status in those areas.
- 4 -
Documentation & review of microlevel epidemiological studies in relation to lack of safe water & sanitation, poor hygiene behaviour and environmental pollution. Studies should be India specific. However, a few such studies from other countries could also be included. The information collected through desk study & internet research was analyzed to establish a possible co-relation between the water, sanitation & hygiene related causes and their health impact (disease burden).
(iii) Review meetings in Calcutta to be held sometimes during Nov/Dec, 2006.
(iv) Interaction and discussions with various stakeholders including Research Institutes like, All India Institute of Hygiene & Public Health (AIIH&PH), Calcutta, National Institute of Cholera & Enteric Diseases (NICED), Calcutta, National Institute Communicable Diseases (NICD), Delhi, National Institute of Epidemiology (NIE), Chennai, NIOH (ICMR), Ahmedabad, etc and also some of the officials of the Health Dept. as well as PHE, Rural & Urban Dev. Depts. of a few major states, were undertaken by the Researchers. Discussions were also held with Central Govt. organizations like the CPHEEO, Ministry of Urban Development, GOI, Dept. of Drinking Water Supply, Ministry of Rural Dev. GOI, Ministry of Health, GOI and Ministry of Environment & Forest, GOI.
(v) Data Analysis, compilation and documentation would be completed by 30th
June, 2006.
(vi) The concluding National workshop was held in Kolkata on 23rd-25th July, 2007, when the draft report of the study was presented before invited scientists and sector leaders as well as officials from WHO, UNICEF, WSP, ICMR etc.
(vii) The Final report was submitted to WHO by the end of August,, 2007.
The Planning meeting was organized in the National Institute of Occupational Health to discuss about the methodology and action plan. The following resource persons participated in the planning meeting.
List of Participants
Sl. No. Name of the Participant Designation / Address
1. Dr. Bindeshwar Pathak Chancellor, Sulabh International Academy of Environmental Sanitation, New Delhi
2. Prof. K.J. Nath
Vice Chancellor, Sulabh International Academy of Environmental Sanitation, New Delhi & Chairman, Core Committee Arsenic Task Force, Bikash Bhaban 3rd Floor, South Block, Bidhannagar, Kolkata-91, 23342171 9831275668 , 2337-4612
3. Sri A.K. Sengupta National Professional Officer, WHO Country Office, Nirman Bhawan, New Delhi
4. Dr. A.N. Sinha Chief Medical Office (Administration), DGHS 5th Floor, A-Wing, Nirman Bhawan, Moulana Azad Road, New Delhi - 110011
5. Dr. D. N Guha Majumder 37 C, Block – B New Alipur, Kolkata-53
7. Dr. A. Banerjee Chief Engineer, Planning & WQM PHE Dte, Govt. of West Bengal 1, Kiron Shankar Roy Road, 6th Floor Kolkata – 1, Tel. No. 2248 8264, 98302 59214, 98304 52788
8. Prof. S.K. Ray Secy. General, IPHA
9. Dr. S.N Dutta Joint Director, Health Services, Govt. of West Bengal, Shasthya Bhaban, CP Block, Sector-V, Kolkata-91, 2357-6000, Ext. 180 2357 1192 (Direct)
10. Dr. Rathindra Nath Dutta
Associate Professor, Dept. of Dermatology and STD,Institute of Post Graduate Medical Education & Research, SSKM Hospital, Kolkata
11. Mr. S.N. Dave Project Officer (WES), UNICEF, Kolkata 2289-2477
12. Sri Chandan Sengupta Chairman, Task Force, Total Sanitation Programme, Member, Arsenic Task Force. B.E-242, Sector-1 Salt Lake, Kolkata-64, 2358 2533, 98303 03122
13. Sri Diptarup Kahali Asst. Professor, Dept. of Sanitary Engineering, AIIH&PH, 9836067025
14. Dr. Prof. Routh Head. Dept.of Epidemiology, AIIH&PH
15. Prof. Arunabha Majumdar Former, Director, Professor, Dept. of Saniraty Engineering, AIIH&PH, Member, Arsenic Task Force. Tel/ No.: 2337-2470 (Res)
16. Sri Santanu Lahiri Consultant, World Bank, WSP
17. Dr. Roy Choudhury,
Director, National Institute of Occupational Health (NIOH), Regional Centre, Kolkata.
18. NICED National Institute of Cholera & Enteric Diseases, Kolkata
- 7 -
Programme
10.00 am Welcome & Inaugural address by Dr. Bindeshwar Pathak,
Chancellor, Sulabh International Academy of Environmental Sanitation, New Delhi
10.15 am Address by Sri A.K. Sengupta National Professional Officer, WHO Country Office, India
10.30 am Background, Objective & Methodology of the study – Prof. K.J. Nath
Vice Chancellor, Sulabh International Academy of Environmental Sanitation, New Delhi & Chairman, Arsenic Task Force
10.50 am Address by Dr. A.N. Sinha Chief Medical Officer (Hospital Administration), DGHS, Govt. of India
11.00 am Presentation by Sri Santanu Lahiri on “International Perspective”
Research Associate, Formerly of WSP, World Bank, Laos & Cambodia,
11.20 am Presentation by Prof. Dipatarup Kahali on “National Perspective”
Research Associate, Asst. Professor, Dept. of Sanitary Engineering, AIIH&PH
11.40 am Tea Break
12.00 pm –1.30 pm
Brainstorming and Interactive Session
On the Chair, Prof. K.J. Nath 1.30 pm Lunch
2.30 pm – 5.00 pm
Review Meeting on WHO Project on “Arsenic Mitigation Programme: Awareness Generation in North 24 Parganas”
5.00 pm High Tea
Venue: Conference Hall of the Regional Occupational Health Centre (ICMR), Block – DP, Sector-V, Salt Lake City, Kolkata-700 091. 2.2 Summary of Discussions
Dr. Bindeshwar Pathak, Chancellor, Sulabh International Academy of Environmental Sanitation (SIAES), in his welcome address mentioned about the enormous problem of sanitation in India and the huge impact of the same on the health of the community. Mr. A.K. Sengupta, National Professional Office, WHO
- 8 -
Country Office, India, in his address referred to the genesis and background of the study. He stressed the importance of scientific knowledge of linkage between water and sanitation facilities and health for effective advocacy with the policy makers. Prof. K.J. Nath, Vice Chancellor, SIAES, explained the background, objectives and methodology of the study. Mr. Shantanu Lahiri, Research Associate made a presentation on the International perspective and Prof. Diptarup Kahali, Asst. Professor, Dept. of Sanitary Engineering, AIIH&PH, presented the National perspective. In the brainstorming and interactive session that followed, the participants had in-depth interactions on the methodology of the study and also the confounding factors and the constraints for the same.
2.3 Study Strategy
It was suggested by the participants that along with the macro-level data on community water supply and environmental sanitation in the states and cities collected from Govt. sources, the study team should also try to undertake a few micro-level cross-sectional epidemiological assessment of the impact of improvements in sanitation/water supply on infectious disease burden. It was agreed that the study of the health scenario in some of the villages declared as “Nirmal Grams” could give some interesting and significant clues. It was also agreed that, out of the 33 infectious diseases identified by WHO as WSS related, the study team should concentrate on the disease as listed in Table -1, Table-2.
It was suggested that the study should also highlight the findings of some case studies carried out in India, which co-relate the burden of infections diseases with various aspects of water, sanitation and hygiene.
Table-1
List of infectious Diseases which Occur Due to Improper WSS Services
1. Anaemia
2. Arsenicosis
3. Ascariasis
4. Campylobacteriosis
5. Cyanobacterial Toxins
6. Dengue
7. Diarrhoea
8. Dracunculosis
- 9 -
9. Drowning
10. Filariasis
11. Fluorosis
12. Guinea Worm
13. Hepatitis A
14. Hepatitis E and Fb
15. Hookworm
16. Impetigo
17. Japanese Encephalitis
18. Lead Poisoning
19. Legionellosis
20. Leptospirosis
21. Malaria
22. Malnutrition
23. Methamoglobinamia
24. Onchocerciasis (River Blindness)
25. Ringworm
26. Scabies
27. Schistosomiasis
28. Spinal Injury
29. Trachoma
30. Trichuriasis Scabies
31. Typhoid and Paratyphoid Fevers
32. Yellow Fever
33. Leishmaniasis
- 10 -
Table-2
List of Infectious Diseases to be included in the Study
1. Diarrhea
2. Cholera
3. Enteric Fever
4. Hepatitis A
5. Malaria
6. Dengue
7. Arsenicosis
8. Fluorosis
The planning meeting endorsed the following strategy for the study.
• Intensive Desk & Internet Research to identify potential Case Studies
• Interaction & Feedback from Resource Institutes. NICD, NICED (ICMR), NIE (Chennai), AIIH&PH, NIOH (ICMR), WHO,UNICEF, WSP (World Bank), NEERI
• Study Macro-level Regional/State Data on Health & Environmental Quality (Water/Sanitation)
• Micro-level Epidemiological study on the Community Health scenario in
the villages, declared as “Nirmal Grams” and review of case studies co-relating water, sanitation and health.
• Pilot study on Hygiene perception and practice: Health Impact
• Review Workshop (New Delhi/Kolkata)
• Preparation of Report on (a) Water-Sanitation-Health Linkage (b) Institutional Review & Recommendations for MOH (GOI)
• Presentation of the findings to the participants from Resource Institutes
and other stakeholders.
- 11 -
Chapter-3
Basic Issues & International Perspective 3.1 Water Sanitation-hygiene and Health Linkages: Basic Issues
Dictionary defines hygiene as “science of health in preservation of health and the prevention of disease” and “it is practice of measures designed to attain and preserve health”. However, often people describe hygiene as the practice of desirable behaviors that promote good health and prevent sickness. The key to good health is the practice of good hygiene. The simple habit of hand washing with soap before eating and after using toilet will prevent sickness and promote good health. Dictionary defines sanitation as “the provision of means whereby health is protected, especially the arrangements for the safe disposal of sewage (excreta)”. However, the practitioners defined sanitation as means of collecting and disposing of excreta and community liquid waste in a hygienic way so as not to endanger the health of individuals or the community as a whole. Safe and potable water is normally defined as water that is free from pathogenic agents and chemical substances, pleasant to taste and usable for domestic purposes.
The F-Diagram on Routes of Faecal-Oral Contamination clearly describes how faecal-oral contamination is transmitted. The F-Diagram shows how people catch water-borne diseases such as diarrhea, cholera, etc. The diagram depicts the various routes “from the unsafe disposal of faeces to environment then to new host”. For example, dirty hands touch water container – water container contaminated – child drink water – then child at-risk of having diarrhea.
Figure – 1
F-Diagram on Routes of Faecal-Oral Contamination
FAECES
FINGER
FLIES
FIELD
FLUID
Food & Drinking
Water
NEW HOST
- 12 -
Though the linkage between sage water/sanitation and health appear, on the face of it, rather simple, many attempts to co-relate the national or regional data on water supply and sanitation coverage, with the corresponding burden of infectious diseases have not been fully validated. The reasons for the apparently contradictory and confounding results, would be clear, if we try to understand and appreciate the process and mechanism of health improvement, from water/sanitation programmes.
Figure – 2
Basic criteria for health improvements
“Health improvements are only the culmination of a long causal chain. It runs from the original construction of the water supplies or sanitation facilities, through their operation and use, permitting changes in hygienic behaviour and thus the prevention of disease transmission.” The coverage figures, often does not reflect the most important intermediate link i.e., effective use and functioning of the facilities. The other most important link is the hygiene behaviour. The first effort to simplify the relationship between water supplies and health in developing countries was made by David Bradley (White et al. 1972), who developed a classification of disease transmission routes in terms of whether they were:-
Water-borne, in the strict sense where the pathogen is ingested in drinking water; Water-washed, that is favored by inadequate hygiene conditions and practices, and
susceptible to control by improvements in hygiene; Water-based, referring to transmission via an aquatic invertebrate host; and Water-related insect vector routes, involving an insect vector which breeds in or near to
water.
- 13 -
Table-1
Classification of water related diseases
Transmission Route
Description Disease Group Examples
Water-borne The pathogen is in
water, which is ingested Feco-oral
Water-washed
(or water scarce)
Person-to-person transmission
because of a lack of water for
hygiene.
Skin and eye infections
Diarrhea, Dysenteries,
Typhoid fever, Scabies,
Trachoma
Water-based Transmission via
an aquatic intermediate host
(e.g., snail)
Water-based Schistosomiasis, Guinea worm
Water-related insect vector
Transmission by insects, which
breed in water or bite near water.
Water-related insect vector
Dengue, Malaria, Trypanosomiasis
The full list of water-related infections is large and varied, which are as follows (Annette Prüss et al. 2002):-
12. Guinea Worm 29. Trachoma 13. Hepatitis A 30. Trichuriasis Scabies 14. Hepatitis E and Fb 31. Typhoid and Paratyphoid Fevers 15. Hookworm 32. Yellow Fever 16. Impetigo 33. Leishmaniasis 17. Japanese Encephalitis
3.1.1 Constraints & Compounding Factors. The risk factor for water-sanitation-hygiene and health include the following transmission pathways, although not all of them are accommodated in the assessment to follow:-
Transmission through ingestion of water - such as during drinking and, to some extent, bathing. This category includes diseases from fecal–oral pathogens, arsenicosis, fluorosis, and diseases from other toxic chemicals.
Transmission caused by lack of water linked to inadequate personal hygiene. This would include diseases such as trachoma and scabies.
Transmission caused by poor personal, domestic, or agricultural hygiene. This includes person-to-person transmission of fecal-oral pathogens, food-borne transmission of fecal–oral pathogens as a result of poor hygiene, or use of contaminated water for irrigation or cleaning.
Transmission through contact with water (through bathing or wading) containing organisms such as Schistosoma.
To a certain extent, transmission through vectors proliferating in water reservoirs or other stagnant water or certain agricultural practices (e.g., malaria, lymphatic filariasis) should also be included.
Transmission through contaminated aerosols from poorly managed water systems (e.g., legionellosis).
Therefore, it is only logical to conclude that the inadequate water, sanitation and hygiene account for a large part of the burden of illness and death in developing countries.
Fundamentally and from the basic point of view of public health and epidemiological sciences, there is no denying the fact, that bad sanitation or the lack of the same and unsafe or contaminated water would add to the burden of diseases as discussed earlier. However, there are a number of constraints and confounding factors as given below, which often make it difficult to establish a co-relation statically between the WSS coverage data available with the implementing agencies and the disease burden data available with the health departments.
Coverage Figures: A Reality or Myth! Safe water – How safe? Confounding Health Habits Hygiene Behaviour & Socio-Cultural Practices Co-lateral Developments.
The reliability and adequacy of the available data on population covered with water supply and sanitation facilities (discussed further in Chapter 7) are highly questionable. Apart from the sustainability issues, there is also the issue of the quality of water which the people are having access to, often the people are ingesting pathogenic micro-organisms and chemical
- 15 -
contaminants, with water supplied from the public systems. Confounding health habits, hygiene behaviour and socio-cultural practices could also make lot of difference in the ultimate health benefits. In this study, we will initially review global, regional and national data on water supply, sanitation and related disease burden and subsequently examine the co-relation, supported by some micro level case studies
Co-lateral Developments
3.1.2 Poverty-Environment Linkages Poverty is widespread, a share of this damage is generally borne by poor households. In some cases, poor households may degrade the environment in ways that are damaging both to themselves and to others. Conceptually, the existence of a "poverty-environment nexus" implies that one problem is a significant determinant of the other. Numerous studies have suggested that environmental damage can have particular significance for the poor. Recent participatory poverty assessments, conducted in 14 developing countries of Asia, Africa, and Latin America, reveal a common perception by the poor that environmental quality is an important determinant of their health, earning capacity, security, energy supplies and housing quality (Brocklesby and Hinshelwood, 2001). Rural studies commonly observe that poor people's economic dependence on natural resources makes them particularly vulnerable to environmental degradation (Ambler, 1999; Cavendish, 1999; Cavendish 2000; Kepe, 1999; Reddy and Chakravarty, 1999). Other studies have assessed the health damage suffered by poor households that are directly exposed to pollution of the air, water and land (Akbar and Lvovsky, 2000; Bosch et al., 2001; Brooks and Sethi, 1997; Mink, 1993; Songsore and McGranahan, 1993; Surjadi, 1993). In addition, environmental disasters and environment-related conflicts may have regressive impacts because the poor are least capable of coping with their effects (Albla-Betrand, 1993; Myers and Kent, 1995). The existing literature suggests that the strength of poverty-environment linkages may be affected by factors as diverse as economic policies, resource prices, local institutions, property rights, entitlements to natural resources, and gender relations (Ambler, 1999; Arnold and Bird, 1999; Barbier 2000; Dasgupta and Mäler, 1994; Dutt and Rao, 1996; Ekbom and Bojö, 1999; Eskeland and Kong, 1998; Heath and
- 16 -
Binswanger,1996; Leach and Mearns, 1991; Roe 1998). By implication, the relative strength of links between poverty and environment may be very context-specific (Chomitz, 1999, Bucknall, Kraus, Pillai, 2001; Ekbom and Bojö, 1999). Figure 1 summarizes potentially-important elements in the poverty-environment nexus, and indicates the two-way nature of causality in this context. An example is extracted from the World Bank Report to highlight the possible linkages that have been established between water-sanitation-hygiene-health and poverty in Cambodia. Similar study has also been conducted in Lao PDR and Mongolia by the World Bank. (Annex.)
Figure-3 A Simplified Representation of the Poverty-Environment Nexus
Access to natural resources
Quality of natural resource base
Access to water and sanitation
Air quality
Access to environmental information
Opportunity
Security
EEmmppoowweerrmmeenntt
Ecological fragility
Examples of Environmental Determinants
Dimensions of Poverty Elements of Well-
Likelihood of natural disasters
Property rights
Income/ consumption/ inequality of
urban and rural livelihoods
Health
Vulnerability
Education
- 17 -
3.1.3 Influence of climate on disease burden: A confounding factor In co-relating disease burden, with water and sanitation related factors, one need to be careful, to consider the influence of the climate on the same. Climatic influences on health are often modulated by interactions with other ecological processes and social conditions. In seeking explanations about the linkage between various social and ecological factors and the health outcome, we need to strike a balance between various complex interactive forces. The Figure 4 depicts the pathways by which climate change affects human health. Table-3 depicts the examples of how diverse environmental changes affect the occurrences of various infectious diseases like malaria, dengue, schistomiasis, cholera, helminthiasis etc. The Table-4, indicate the climatic epidemic links, in respect of infectious diseases like diaorrheal diseases and cholera, which are primarily linked to water and sanitation.
Figure-4
Pathways by which climate change effects human health:
CLIMATE CHANGE
Human Exposure
Regional weather changes
· Heatwaves
· Extreme weather · Temperature · Precipitation
Contaminations Pathways
Transmission
dynamics
Human Effects
Temparature-related illness and death
Extreme weather-related health effects
Air pollution-related health effects
Water and food-borne diseases
Vector-borne and rodent-borne diseases
Effects of food and water shortages
Mental, nutritional, infectious and other
health effects
Modulating Influences
Changes in agro-ecosystems, hydrology
Socioeconomic and demographic
disruption
- 18 -
Table-3
Examples of how diverse environmental changes affect the occurrence of various infectious diseases in humans
Environmental changes Example diseases Pathway of effect Dams, canals, irrigation Schistomiasis Snail host habit, human contact Malaria Breeding sites for mosquitoes Helminthiasis Larval contact due to moist soil River blindness Black fly breeding disease Agricultural intensification Malaria Crop insecticides and vector
resistance Venezuelan haemorraghic
fever Rodent abundance, contact
Urbanization, urban crowding Cholera Sanitation hygiene, water contamination
Dengue Water-collecting trash, Aedea aegypti mosquito breeding sites
Cutaneous lieshmaniasis Proximity, sand fly vectors Deforestation and new habitation
Malaraia Breeding sites and vectors, immigration of susceptible people
Oropouche Contact, breeding of vectors Visceral lieshmaniasis Contact with sand fly vectors Reforestation Lyme disease Tick hosts, outdoor exposure Ocean warming Red tide Toxic algal blooms Elevated precipitation Rift valley fever Pools for mosquito breeding Hantavirus pulmonary
syndrome Rodent food, habitat, abundance
Source: Climate Change and Human Health – Risks and Responses, published by WHO, WMO,UNEP, ISBN 92 4 159081 5
Table-4
Using climate to predict the disease out break has been established: Some examples…
Disease Global Burden
(1000 DALYs) Transmission Distribution Climate-epidemic
link Diarrhoeal diseases
62227 (including Cholera)
Food and water-borne transmission
Worldwide Increases in temperature and decreases in rainfall associated with epidemics. Sanitation and human behavior are probably more important.
Cholera -
Food and water-borne transmission
Africa, Asia, South America, Russia
Increase in sea and air temperatures as well a El Nino events associated with epidemics. Sanitation and human behavior are probably more important
- 19 -
3.2 International Perspectives 3.2.1 Water supply and sanitation related disease burden: Global scenario
Approximately 4 billion cases of diarrhea per year cause 2.2 million deaths, most—1.7 million—children under the age of five, about 15% of all under 5 deaths in developing countries.
Diarrheal diseases account for 4.3% of the total global disease burden (62.5 million DALYs). An estimated 88% of this burden is attributable to unsafe drinking water supply, inadequate sanitation, and poor hygiene. These risk factors are second, after malnutrition, in contributing to the global burden of disease.
Intestinal worms infect about 10% of the population of the developing world, and can lead to malnutrition, anemia and retarded growth.
6 million people are blind from trachoma and the population at risk is about 500 million. 300 million people suffer from malaria. 200 million people are infected with schistosomiasis, 20 million of whom suffer severe
consequences.
Summary of Major Diseases Burden: Global Scenario
Disease Name Global Impact
Diarrhoea
2.1 million people die every year from diarrhoeal diseases (including cholera) in developing countries. Water, hygiene and sanitation interventions reduce diarrhea incidence by 26% and mortality by 65%.
Malaria 1 million people - mainly children under 5 - die of malaria each year. 300 million people suffer from malaria every year.
Schistosomiasis
200 million people are infected with schistosomiasis and 20 million suffer severe consequences. The disease is still found in 74 countries of the world. Basic sanitation reduces the disease by up to 77%.
Arsenic
Emerging as a major public health concern caused by arsenic contamination of drinking water sources (ground water). 70 countries in 6 continents are affected, with about 100 million people living in risk prone areas. Epidemiological assessment of the disease burden is as yet uncertain. India, Bangladesh and China are among the worst affected countries. The commonly reported symptoms of chronic arsenic poisoning include hyper pigmentation, dypigmentation keratosis, skin cancer and internal cancer can also occur
Trachoma 6 million people are visually impaired by Trachoma. 146 million are threatened by blindness. 500 million people are at risk from Trachoma. Trachoma can be prevented by improving sanitary
- 20 -
Disease Name Global Impact conditions and hygiene practices.
Japanese encephalitis
20% of persons with Japanese encephalitis with clinical symptoms die. 35% have permanent brain damage.
Fluorosis
It is estimated that nearly 28 million people suffer from chronic fluorosis primarily due to exposure to fluoride in drinking-water, in China and around 66 million people at risk in India. Removal of excessive fluoride from drinking-water reduces crippling fluorosis.
Hepatitis A 1.5 million cases of clinical hepatitis A every year.
Figure 5 depicts major causes of death among children under 5 as well as among all age group and globally in the year 2000 and Figure 6 depicts disease burden due to environmental factors in the developed and developing countries. Water related infections account for 19% of all deaths due to infectious diseases.
Figure-5
Major causes of death world wide 2000.
All deaths infectious disease Under 5, deaths
The lack of access to water, sanitation, and hygiene is attributed as the causes for the 1.6 million deaths per year due to diarrhea – especially among children. It is estimated that there are more deaths due to diarrhea than tuberculosis (TB) or Malaria. Children dying due to diarrhea are four times higher than deaths due to HIV/AIDS.
- 21 -
Figure – 6
3.2.2 Community Water Supply & Sanitation Coverage: Global & Regional Perspective The international Drinking Water Supply and Sanitation Decade (1981-1990) was a period of accelerated and concerted effort to expand water supply & sanitation services to the unserved and underserved poor populations of the World. During the nineties also many initiatives were taken by the UN and a number of crucial international conferences recognized water and sanitation as the bedrock of public health and social progress and the key to improving human survival, health and well-being. The global assessment of WSS, 2000, a joint effort of WHO & UNICEF, reviews the progress achieved by various countries in WSS sector. Although an enormous number of additional people gained access to services between 1990 and 2000, with approximately 816 million additional people gaining access to water supplies and 747 million additional people gaining access to sanitation facilities, the percentage increases in coverage appear modest because of global population growth during that time. Unlike urban and rural sanitation and rural water supply, for which the percentage coverage has increased, the percentage coverage for urban water supply appears to have decreased over the 1990s. Furthermore, the numbers of people who lack access to water supply and sanitation services remained practically the same throughout the decade.
- 22 -
At the beginning of the New Millennium 1.1 billion people (one sixth of the world population) are without access to safe water and 2.4 billion (two-fifth of world population) are without access to improved sanitation.
Figure – 7
Depicts changes in sanitation coverage in Asia, Africa & Latin America (1990-200)
Figure 8 to Figure 11, depict the water supply and sanitation coverage in different
regions of the world. The low GDP countries of the sub-Saharan region in Africa and
South Asia countries including India are having the least coverage. Water supply and
sanitation coverage by category of services is shown in figure 12 & 13. Only 18% of the
houses in Asia are having sewerage connections while the same in Africa is only 13%.
In the matter of community water supply, 49% of the houses are having household
connections, while the same in Africa is only 24%. Urban water supply and sanitation
coverage’s in different regions are depicted in figures 14 & 15.The urban water supply
and sanitation coverage figures for Asian and African countries appear to be not
reflecting the extremely poor services received by the poor living in the slums and other
unserved or underserved areas.
- 23 -
Figure – 8, Water Supply, Global coverage, 2000
Figure – 9, Water Supply, Global coverage, 2000
0
20
40
60
80
100
120
Nor
ther
n Am
eric
a
Sub-
Saha
ran
Afric
a
Lat.
Amr.
& C
ar.
East
ern
Asia
Sout
h-C
entr.
Asi
a
Sout
h-Ea
st A
sia
Wes
tren
Asia
Oce
ania
All D
evel
opin
g C
ount
ries
No acces
Acces through other improved sources
Acces to drinking water through household connections
Source: Global Water Supply and Sanitation Assessment -2000 Report
- 24 -
Figure – 10, Sanitation, Global coverage, 2000
Source: Global Water Supply & Sanitation Assessment: 2000 Report.
Figure – 11 Sanitation, Global coverage, 2000
Source: Global Water Supply and Sanitation Assessment -2000 Report
- 25 -
Figure – 12
Figure – 13
- 26 -
Figure – 14
Figure – 15
- 27 -
3.2.3 Regional Disease Burden & Child Mortality: Critical Determinants In the context of the fore-going discussions, it would be pertinent to take a look at the
figures related to the infection disease burden, in the regions of the world (Fig.14). Sub-
Saharan Africa and India are among the most affected. They are also the countries with
comparatively low water supply and sanitation coverage. Figure 16 indicate the diarrhoeal
disease burden in various regions of the world. Again sub-Saharan Africa and India are the
worst affected. Table-4 shows the select infectious diseases in the developing countries. It
is needless to say that the disease burden indicated in Figure 15 and 16 and table-4 are
mostly related to poor sanitation and unsafe water. Regional child mortality, along with
select determinants like access to improved water sources, access to sanitation, female
literacy and immunization are shown in the Table 5. The inverse relationship between
access to improved water and child mortality is not evident very significantly. On the other
hand, access to sanitation and female literacy appear to be of more critical importance. The
associations of child mortality with sanitation coverage in WHO SEA countries have been
reviewed in Section 3.3.
In a study, commissioned by the International Scientific Forum on Home Hygiene (IFH), Mr.
B. Larsen tried to estimate the annual preventable child deaths, which could be attributable
to full implementation of immunization, sanitation, safe water and female literacy etc.(Table-
6) Implemented jointly, full water and sanitation coverage is estimated to prevent almost 2.5
million child deaths a year. Joint implementation of all four interventions is estimated to
prevent about 4 million deaths yearly. It should be noted that all the sum of estimates (1)
through (4) in Table 6 is higher than deaths prevented in (6). This is because of the
interdependence of variables. Estimates are from statistical regression analysis of 84
countries by the author. The current rates for the developing world are 80% for
immunization, 78% female literacy, 78% for water, and 52% for sanitation.
- 28 -
Figure – 16
Infectious Diseases in Year 2000 – DALYs per 1000 person
050
100150200250300
Sub-
Saha
ran
Afr
ica
Indi
a
Mid
dle
East
ern
Cre
sent
Oth
er A
sian
Cou
ntrie
s
Latin
Am
eric
a/C
arib
bean
Chi
na
Source: Calculated based on global burden of diseases data published by the World Bank.
Figure – 17
Diarrheal Diseases in Year 2000 – DALYs per 1000 person
Source: Calculated based on global burden of diseases data published by the World Bank
- 29 -
Table-5
Select Infectious Diseases in Developing countries
Diarrhoea 4 billion cases per year – 2.2 million deaths Intestinal Nematode Infections Infect 500 million people
Schistosomaisis Infects about 200 million people – 20 million suffer severe consequences
Trachoma Blinds about 6 million people
Table-6
Regional Child Mortality & Select Determinants
Source: Calculated based on data from World Development Indicators (World Bank) and Global Water Supply and Sanitation Assessment 2000 Report (WHO/UNICEF)
- 30 -
Table – 7
Estimated preventable child deaths (thousands per year)
India China Other Asian
countries
Middle Eastern Crescent
Sub-Saharan Africa
Latin America/
Caribbean
Total
1. Increase child immunization to 100%
110 5 30 85 525 15 770
2. Increase female literacy to 100% (age 15-24 year)
460 15 135 280 615 15 1520
3. Provide safe water to 100% of the population
90 60 90 90 700 20 1050
4. Provide safe sanitation to 100% of the population
570 150 115 105 565 25 1530
5. Provide safe water and sanitation to 100% of the population
635 200 195 185 1165 45 2425
6. Increase immunization and female literacy and water and sanitation to 100%
1030 215 330 495 1910 70 4050
7. Percent reduction in child mortality rate based on (6)
46% 30% 28% 325 48% 16%
Source: International Journal of Environmental Health Research 13, S37-46 (June 2003) 3.3 Water supply and sanitation: South-East-Asia Scenario The South-East Asia Region of WHO is one of the most diverse regions, having some of the most populous countries like India, Indonesia and Bangladesh as also some of the least
- 31 -
populous countries like Bhutan and Maldives. Six of the 11 countries namely India, Indonesia, Thailand, Sri Lanka, Myanmar and Maldives, fall in the medium human development category and 3 (Nepal. Bhutan and Bangladesh) fall in the low human development category. These countries are primarily rural population in nature, and the per capita GDP varies from $ I 027 in Myanmar to $ 6 132 in Thailand. The adult literacy rate varies from 40.4% (Nepal) to 96.2% (Maldives). Life expectancy varies from S6 (Myanmar) to 71.9 years (Sri Lanka). The varied socioeconomic characteristics as described above are also reflected in health parameters and level of environment and hygiene-related services. Table 17 depicts the water supply and sanitation coverage, by country. in the South-East Asia Region for the period: 1990-2000. Table 2 depicts some of the vital health and socioeconomic parameters of these countries.
Table- 8
Water supply and sanitation coverage, by country, in the South-East-Asia Region
Source: Health situation in South-East-Asia – 1998-2000 (WHO) The Global Water Supply and Sanitation Assessment 2000 Report indicates that during the International Water Supply and Sanitation Decade (lDWSSD) and in the nineties, increasing number of people in the South-East Asia Region got access to some form of improved water supply, though access to sanitation continued to be extremely poor in the Region.
- 32 -
Table- 9
Socioeconomic and health parameters in countries of the South-East-Asia Regions
Country GDP per
capita (US$)
Human poverty
index (%)
Estimated adult
literacy (%)
Life expectancy
at birth (Years)
% of life span lived
with disability
IMR (infant mortality rate/1000
live births)
Under-5 mortality
Bangladesh 1483 43.3 40.8 58.9 28.5 58 115
Bhutan 1341 - 42.0 61.5 20 80 114
India 2248 34.3 56.5 62.9 15 70 101
Indonesia 2857 21.3 86.3 65.8 12 38 58
Maldives 4423 15.8 96.2 6601 19 60 88
Myanmar 1027 28.0 84.4 56.0 162 79 134
Nepal 1237 44.2 0.4 58.1 21.4 75 113
Sri Lanka 3279 18.0 91.4 71.9 14.5 17 22
Thailand 6132 14.0 9.53 69.9 13.5 26 34
Source: Health situation in South-East-Asia – 1998-2000 (WHO) It has been estimated that from 1990 to 2000. India. Indonesia. Bangladesh. Thailand. Nepal. Myanmar and Sri Lanka together managed to extend water supp~ coverage to an additional 133 million population. While the progress is significant, it is almost equivalent to the population growth in these countries. Which means that the number of people without access to improved water supply have not decreased significantly. Region wide over 232 million persons or 15% of the population lack access to improved water supply. Nearly four times that number or some 916 million people lack access to improved sanitation. India with more than 699 million people lacking access to improved sanitation facilities accounts for more than two-thirds of the total number of people without this basic service in the South-East Asia Region. More than three-Quarters of people who lack access to improved water supply in the Region live in rural communities. In general, urban populations have greater access to improved water supply and sanitation than rural populations while sanitation coverage is low in countries with low GDP high poverty and low adult literacy rates. Besides DPR Korea which has achieved almost 100% water and sanitation coverage. Thailand with the highest GDP and literacy rates in the Region and with a very low level of human poverty has also achieved almost total sanitation coverage. What is interesting to note however is that Bangladesh with one of the lowest GDP and adult literacy rates and with very high poverty is having the highest (excluding MaIdives) rural and urban water supply coverage better than even Sri Lanka and Thailand.
- 33 -
Table- 10
Estimates of morbidity and mortality of water-related diseases in SEAR countries (late 1990s)
Diseases Morbidity (episodes/year or people infected)
Mortality (deaths/year)
Diarrhoeal episodes 0.7 to 3.7 episodes per child less than 5 years of age
Malaria 3100000 NA Dengue fever 400000 8000 Hepatitis NA 28000 Lymphatic Filariasis 60000000 (people infected) -
Communicable disease burden Despite substantial improvement in water and sanitation coverage, both mortality and morbidity figures indicate a significant burden of communicable diseases derived from water, sanitation and other environment-related factors. Table-9 indicates high IMR and under-5 mortality and significantly high percentage of lifespan lived with disability, in most SEAR countries. Table-10 depicts the morbidity and mortality of water-borne diseases in South-East-Asia. Diarrhoel diseases account for 6.6% of all deaths and 7.2% of all DALYs in the Region. The majority of this health burden is carried by children and the poor. Generally speaking, the countries with low GDP and lesser access to water and sanitation, are having higher burden of water-sanitation related diseases and higher under 5 and infant mortality. The inverse relationship with access to safe water and infant mortality does not come out that significantly. But the association of sanitation coverage with infant mortality is very conspicuous in the SEA countries, as depicted in Table 11 and Figure 18.
Table-11
Child mortality association with sanitation coverage
Name of the Countries % population with sanitation coverage
Child mortality rate
Korea 100 30 Thailand 98 35 Indonesia 60 60 Maldives 55 88 India 35 80 Bangladesh 40 95 Myanmar 35 100 Nepal 25 105 Bhutan 60 120 Source: UNICEF-WHO Global Sanitation Assessment 2000
- 34 -
Figure-18
Source: UNICEF End Decade Databases and Global Water Supply and Sanitation Assessment Expectedly Korea with 100% sanitation coverage is having the least child mortality rate (30). Nepal & Myanmar, with very low sanitation coverage (25% & 35%) are also having very high child mortality. But surprisingly, Bhutan with rather good sanitation coverage of 60%, is having the highest child mortality (120), in the region. Indonesia and Maldives, are having similar sanitation coverage, but they differ widely in respect of child mortality. On the whole, however, the inverse relationship is validated. 3.4 General observations A careful and close examination of the International and South-East-Asia regional scenario, in respect of water supply and sanitation services and communicable disease burden, would lead us to the following general conclusions.
• The public health impact of water pollution along with lack of sanitation and poor hygiene is enormous.
• A number of communicable diseases with high morbidity and mortality are wide spread
in the communities specially living in unsuitable environmental conditions in urban slums and vast rural areas, without adequate water supply and sanitation facilities.
• The major diseases that are attributed to lack of sanitation, poor waste water & solid
waste management and poor drinking water supply are:-
Diarrhoeal diseases
- 35 -
Cholera Shigellosis Poliomyelitis Typhoid Water borne Viral Hepatitis Vector-borne diseases like Malaria, Dengue, Filaria etc
• Of these, Diarrhoeal diseases alone cause more than 0.6 million deaths annually.
• Previous Studies have shown that in slum areas of major cities Diarrhoeal incidence as
high as 10.5 episodes per child per year occur on regular basis.
• Statistics indicate that Intestinal group of diseases claim about 5 million lives and about 50 million people suffer from these diseases every year.
As the data on environmental epidemiology is scanty in most countries of Asia & Africa, it is difficult to accurately ascertain the extent to which the deficiencies in water and sanitation-related services contribute to the heavy burden of diaorrhoel, helminthic, vector-borne and viral diseases. However, morbidity due to water and sanitation-related diseases has not declined to an extent commensurate with the investments made in the CWSS sector. The reasons could be traced to lack of effective water Quality surveillance and extremely poor level of environmental sanitation. Having said this, one could also question the validity of these coverage figures which perhaps do not adequately reflect the plight of millions of unserved or underserved people mostly the poor and the marginalized, of countries with a low GDP in the developing countries, living in squalid and unhealthy environments.
- 36 -
Chapter-4
National Perspective on WSS Coverage in the Country and in Major States & Cities
4.1 Fact Sheets on India
Table-1
2001 Total Population - 1028.61 million Sex Ratio - 933/1000 males Ave. Annual expected growth rate - 1.95
Urban Population - 286.12 million
% of Urban Population - 27.82% No. of cities reporting slum - 640
Population of cities reporting slum - 184.35 million
% of slum population to total population - 15%
% " " to population of cities reporting slum - 23.10% Projected population by 2012 - 1208.11 million
Projected population by 2016 - 1268.96 million
Table- 2 : Socioeconomic and health parameters
Estimated adult literacy (%) IMR (infant mortality rate/1000 live births)
GDP per
capita (US$)
Human poverty index (%) Male Female Combined
Life expectancy
at birth (Years)
% of life span lived with
disability Rural Urban Combined
Under- 5
mortality
2248 34.3 61.8 63.5 64.8 62.9 15 64 40 58 101
Source: Health situation in South-East-Asia – 1998-2000 (WHO)
4.2 Community water supply and environmental sanitation: A review of progress and present status
Table- 3: Water supply and sanitation coverage in India
Year Total Pop (mil)
Urban Pop (mil)
Rural Pop (mil)
%Urban water
supply coverage
%Rural water
supply coverage
%Total water
supply coverage
%Urban sanitation coverage
%Rural sanitation coverage
%Total sanitation coverage
1990 850.8 217.3 633.5 92 73 78 58 8 21
2000 1013.6 288.3 725.4 92 86 88 73 14 31
Source: Health situation in South-East-Asia – 1998-2000 (WHO)
- 37 -
Coverage of urban and rural water supply
In the year 2000, 92% of the urban population had access to a community water supply, though the quality, safety and reliability of the supply was often questionable. The poorer section of the population in under-served urban areas had very poor access to public water supply systems. Out of 1,422,646 rural habitations, 1,183,212 are fully covered and 213,331 partially covered. There are still 26,121 uncovered problem villages that do not have an adequate provision of drinking water. Rural water supply coverage increased from 73% in 1990 to 86% in 2000.
Norms of coverage The norm for coverage of rural water supply is 40 litres per capita daily (lpcd), or
one hand pump for 250 people within a walking distance of 1.6 km, or an
elevation difference of 100 mm in hilly areas. An additional 30 lpcd of water is
required for cattle (rural water supply). Variations in water requirements include 40
lpcd where only spot-sources are available; 70 lpcd where there is a piped water
supply but no sewerage system; 125 lpcd where there is a piped water supply and
a sewerage system, and 150 lpcd for large cities. Additional demands on water
are called upon for in urban situations, including industrial, commercial,
institutional, fire fighting and for gardens (urban water supply).
Environmental sanitation Only 237 of more about 4700 towns have a partially complete sewerage system.
There are still 400,000 scavengers and 7,210,000 dry latrines, of which 5,400,000
are in urban areas. Less than 60% of the urban populations have access to
sanitation, that is, safe disposal of human excreta, while in respect of the rural
population less than 20% had facilities for sanitary disposal of human excreta in
2000. Present figure is near about 35 to 40%. Open defecation is still the most
popular means of toileting in rural India. In urban areas less than 60% of solid
wastes is collected and disposed of on a regular basis.
The drainage infrastructure for storm water and sullage is extremely poor in
urban, periurban and rural areas. There are other problems too. Rivers and other
- 38 -
bodies of surface water are grossly polluted, where, for example, faecal coliform
count would vary between 5,000 and 50,000 mpn 100 ml-1. The holy river of the
Ganges is one such river, which in most parts is unfit for bathing.
Quality of water in public distribution systems Almost all urban water supply systems in the country are of intermittent supply
and prone to disruption and leakage. As a result, faecal contamination of the
distribution systems is universal in most cities and towns. Water quality monitoring
and surveillance is inadequate and irregular, expect in a few Metro cities. The
situation in small and medium towns is worst. Ground water drawn from tube wells
and dug-wells is often contaminated by chemicals, minerals, pesticides or
bacteria. Fluoride and arsenic contamination of ground water has become a
serious health risk for almost 80 million people in the country.
Figure 1 depicts the percentage coverage of rural habitations with improved water
supply across different regions in the country. It is to be noted that safety and
quality of the public water supply systems in the rural areas are questionable.
Table 4 and Figures 2 to Figure 5, depicts the progress of urban and rural water
supply programmes in the country between 1980 to 2004. Figure-6 and Figure-7
highlight the crisis in urban water supply and water quality management, in major
cities and towns of the country. All most universal faecal contamination of urban
water supply systems, as depicted in Figure 7, is possibly the prime reason that
the high level of urban water supply coverage does not result in commensurate
reduction in water-borne disease burden in the country.
The efforts put by the Ministry of Rural Development, GOI, in recent years and
various state Govts, have resulted in higher coverage of habitations in the ryral
areas, with improved water supply. However, quality related problems and the
problems of sustainability of the rural water supply facilities created under the
programme, have often adversely affected the same. Table-5 depicts, the state
wise water supply coverage figures indicating the Fully Covered (FC), Partially
Covered (PC) and Not Covered (NC) habitations in various states of the country.
- 39 -
Table-6 depicts the performance of various states in respect of providing
Individual Household Toilets as percentage of targeted house holds.
Increased planned investments in WSS Sector in India
- 58 -
The neglect of hygiene and sanitation along with water quality goes a long way in
explaining why improvement in water supply coverages has not brought the
expected health benefits in terms of reduction in disease burden. Having said
this, one could also question the validity of the coverage figures of urban and
rural water supply and sanitation a s discussed earlier, in terms of quality and
quantity. Recent surveys by Govt. of India, regarding the quality of the drinking
water supplied to the rural community clearly indicate that the number of people
actually covered by safe water is in reality much less than what is indicated in
Table-5 and Table-6 in terms of fully covered habitations. Similarly the quality of
urban water supply as indicated in Figure –7 of Chapter-4, raises question
regarding the validity of urban water supply coverage. The urban water safety
coverage figures also do not reflect on the plight of the urban poor, in respect of
access to safe water.
The reliability and adequacy of the available data and coverage figures on
community water supply and sanitation facilities are very much questionable. As
is evident, from the following table taken from ADB Report, when the same is
considered in the light of present national figures on urban water supply
coverage.
Table-2
Reliability & Adequacy of Community Water Supply Systems: Coverage Figures A Myth or Reality?
- 59 -
From the above table, it is quite apparent that in many cities and towns of the
country, the urban poor living in the slums could access the municipal water
supply with much difficulty and for extremely short period. The crisis of urban
water supply in terms of quantity and quality is hardly reflected in the official
figure for urban water supply coverage. It is no wonder that the coverage figure
and disease burden does not match.
5.3 Linkage between availability of water supply and sanitation facilities with the incidence of diseases like Acute Diarrhoeal disease, Enteric Fever, Hepatitis and Cholera, across the states
Present status of community water supply and sanitation, state wise figures has
been depicted in Chapter-4. State wise figures for prevalence of key WSS related diseases have been depicted in the figures 11 to 14 in the following section. The status of vector-borne diseases (Malaria, Dengue) and diseases related to chemical contaminants like Arsenic and Fluoride are depicted in sections 5.4, 5.5 and 5.6. The city specific situation on community water supply and sanitation is discussed in Chapter-4.
5.3.1 Water Vis-à-vis Disease Burden (State wise)
An attempt has been made to examine the possible linkage between water supply and sanitation coverage figures as available with the Ministry of Rural Development and the disease burden figure as available from the Department of Health in various states. Figure-11 depicts the percentage of not covered habitations in respect of community water supply in various states, Vis-à-vis the prevalence of Acute Diarrhoeal diseases (ADD) in states. Figure 12, 13 and 14 depicts the same against the prevalence of Enteric Fever, Hepatitis A and Cholera, across states. In case of ADD, the correlation coefficient is 0.13, which indicate positive correlation between prevalence of ADD and state wise percentage of not covered habitation (Figure 15). Standard mathematical model of correlation has been used. However, the correlation co-efficient for the other diseases are negative, which indicate inverse relationship, which may not be logically valid.
- 60 -
The primary reason for the weak linkage and inverse co-relation between percentage of not covered habitation and prevalence of diseases as mentioned above, is limitations of coverage data and disease burden data as well as various confounding and collateral factors discussed earlier like water quality, hygiene behavior, literacy, women’s empowerment as ell as sustainability of sanitation and water supply facilities created in the states. The varying status of water quality in the so-called covered habitations of different states, along with diverse socio-cultural parameters, make it difficult to establish the correlation between lack of access to improved water and the burden of water/sanitation related diseases. 5.3.2 Sanitation Vis-à-vis Disease Burden (State wise) Figure 16, 17, 18, 19 depict the prevalence of ADD, Enteric fever, Hepatitis A
and Cholera in states vis-à-vis, the percentage of household not having latrines.
However, the basic assumption that the gap between the target (objective) of
IHHL and achievements on the same in various states, should be taken as an
index of proportion of total households, not having toilets, is questionable. Only,
in case of Cholera (positive co-relation co-efficient of 0.14) the mathematical
model indicates a positive relationship between percentage of household without
latrine and prevalence of diseases. (Figure 20)
In case of all other diseases, the co-efficient was found to be negative. Obviously
the reasons for weak or inverse relationship are as mentioned earlier – varying
socio-economic and cultural parameters as well as level of personal hygiene,
particularly hand washing, Home Hygiene, Food Safety etc, and most importantly
the limitations of sanitation coverage data as well as the disease surveillance
data.
- 61 -
Figure-11 Water Percentage of Not covered Habitations (Source: Ministry of Rural Development) across states, Vis-à-vis prevalence of A.D.D (NICED/NICD). The data for fully covered and partially covered habitations were not considered as it was expected that prevalence of the diseases would be higher in habitation where no safe water is available.
- 62 -
Figure-12 Water Percentage of Not covered Habitations (Source: Ministry of Rural Development) across states, Vis-à-vis prevalence of Enteric Fever (NICED/NICD). The data for fully covered and partially covered habitations were not considered as it was expected that prevalence of the diseases would be higher in habitation where no safe water is available.
- 63 -
Figure-13 Water Percentage of Not covered Habitations (Source: Ministry of Rural Development) across states, Vis-à-vis prevalence of Hepatitis A (NICED/NICD). The data for fully covered and partially covered habitations were not considered as it was expected that prevalence of the diseases would be higher in habitation where no safe water is available.
- 64 -
Figure-14 Water Percentage of Not covered Habitations (Source: Ministry of Rural Development) across states, Vis-à-vis prevalence of Cholera (NICED/NICD). The data for fully covered and partially covered habitations were not considered as it was expected that prevalence of the diseases would be higher in habitation where no safe water is available.
- 65 -
Figure-15
The correlation coefficient is 0.13. This indicates positive correlation between percentage of not covered habitations and prevalence of diarrhea in the states.
- 66 -
Figure-16 Sanitation Percentage of Households not covered (Source: Ministry of Rural Development,), Vis-à-vis prevalence of A.D.D state wise. The data used was the difference between Coverage target (Objective) under IHHL and Achievement. The assumption is that this figure depicts the absence of Household latrine.
- 67 -
Figure-17 Sanitation Percentage of Households not covered (Source: Ministry of Rural Development,), Vis-à-vis prevalence of Enteric Fever state wise. The data used was the difference between Coverage target (Objective) under IHHL and Achievement. The assumption is that this figure depicts the absence of Household latrine.
- 68 -
Figure-18 Sanitation Percentage of Households not covered (Source: Ministry of Rural Development,), Vis-à-vis prevalence of Hepatitis A state wise. The data used was the difference between Coverage target (Objective) under IHHL and Achievement. The assumption is that this figure depicts the absence of Household latrine.
- 69 -
Figure-19 Sanitation Percentage of Households not covered (Source: Ministry of Rural Development,), Vis-à-vis prevalence of Cholera state wise. The data used was the difference between Coverage target (Objective) under IHHL and Achievement. The assumption is that this figure depicts the absence of Household latrine.
- 70 -
Figure- 20
The correlation coefficient is 0.14. This indicates positive correlation between Percentages of household with no latrine and Prevalence of Cholera in the states.
5.4 Vector-borne Disease Burden in the Country Table-3 depicts the state wise figures for malarial cases and deaths from 2001 to
2005. Table-4 shows the state wise figures for Dengue cases and deaths during 1999-2005. It is to be noted that the country has a huge burden of vector-borne diseases which are largely related to poor drainage and solid waste management. In absence of précised data regarding the level of solid waste management and drainage system for the disposal of storm water as well as sullage, it would be difficult to correlate the burden of vector-borne diseases with the environmental factors. However, as has been mentioned in Chapter-4, out of 4700 cities and towns in the country, only 237 are having sewerage system that to partially. It is almost logical that the burden of vector-borne diseases is continuing unabated. With the initial success of large scale use of insecticides,
- 71 -
malarial cases came down to negligible level and the health authorities started in terms of eradication of the diseases in the early sixties. Total number of cases of malaria in the country was less than 50,000 in 1961. Since then, it increases steadily and today, it has reached almost 3 million. Table 4.1 shows the increase in the country cases and deaths in Malaria, in the country between 1962 and 1994. It is needless to say that the key factors behind the increase in Malaria and other vector-borne diseases like Dengue, Filaria, Japanese Encephelitis etc in the country are the following socio-ecological factors.
1. Indiscriminate and unplanned urbanization in the country. 2. Lack of drainage for storm water, sewage and sullage. 3. Lack of proper disposal of effluents from Septic tanks and other on-site
sanitation systems in the peri-urban and rural areas. 4. Lack of solid waste management in most cities and towns. Except for
metro cities, solid waste management and extremely inadequate in small and medium towns and almost non-existent in rural and peri-urban areas. Lack of scientific solid waste management is not only fouling the environment and creating unhygienic neighborhood, but it is adding to the problems of drainage and leading to vector-borne breeding.
That, vector-borne diseases could be effectively controlled by Bio-Environmental Control Strategy, has been successfully demonstrated by the pilot projects executed by National Malaria Research Institute in Gujarat and other states. (Annex)
Malaria cases and deaths in India, state wise figures, 2001-2005
- 74 -
Table-4
Dengue cases and deaths in India, state wise figures, 2001-2005
5.5 West Bengal Scenario: Water Sanitation related Disease Burden The West Bengal scenario in respect of WSS related disease burden is depicted
in the following figures and tables. Fig.21 depicts the incidence and case fatality rates of acute diarrhoeal diseases between 2001 and 2006. Fig. 23 depicts the incidence and case fatality rates of viral hepatitis between 2001 and 2006. The same for enteric fever is shown in Fig. 25. It is interesting to note that all these diseases show an increasing trend during this period when there has been
- 75 -
significant improvement in sanitation in the state. Figures 16, 18 and 20 and Table 5 depict distribution of diarrhea, viral hepatitis, enteric fever across districts in West Bengal. In Section 5.1.1, the linkage between district wise sanitation coverage data vis-à-vis prevalence of the above diseases have been discussed. In Section 5.2.2, the linkage between water quality data and district wise disease prevalence data have been discussed. The problem of arsenic contamination of ground water in West Bengal and its impact on community health has been discussed in section 5.5.4.
Figure-21
Incidence and case fatality rates of acute diarrhoeal diseases in West Bengal, 2001-2006
0.06
0.080.07
0.06
0.040.03
0
5
10
15
20
25
30
35
Y2001 Y2002 Y2003 Y2004 Y2005 Y2006
Cas
es/1
000
popu
latio
n
00.010.020.030.040.050.060.070.080.09
Dea
ths/
100
case
s
IRCFR
Figure- 22
Murshidabad, 13.7
Kochbihar, 8.3
Malda, 8.0
Paschim Medinipur, 7.0
Purba Medinipur, 7.8
Other, 55.2
Proportional (%) distribution of diarrhoea cases across the districts, West Bengal, 2006
- 76 -
Figure- 23
Incidence and case fatality rates of acute viral hepatitis in West Bengal, 2001-2006
0
0.02
0.04
0.06
0.08
0.1
Y2001 Y2002 Y2003 Y2004 Y2005 Y2006
Case
s/10
00 p
opul
atio
n
0
1
2
3
4
Deat
hs/1
00 c
ases
IRCFR
Figure-24
- 77 -
Figure-25
Incidence and case fatality rates of enteric fever in West Bengal, 2001-2006
0.00.20.40.60.81.01.21.41.6
Y2001 Y2002 Y2003 Y2004 Y2005 Y2006
Case
s/10
00 p
opul
atio
n
0.00
0.05
0.10
0.15
0.20
0.25
Deat
hs/1
00 c
ases
IRCFR
Figure-26
- 78 -
Table -5
Incidence rate (per 1000) of water-borne diseases in West Bengal 2006
District Acute Diarrhoeal Diseases
Viral Hepatitis Enteric Fever
Bankura 18.72 0.03 2.53
Birbhum 25.57 0.09 1.27
Burdhaman 22.35 0.07 0.46
Dakshin Dinajpur 48.37 0.10 1.25
Darjeeling 70.16 0.26 1.82
Hooghly 21.33 0.067 2.08
Howrah 16.43 0.18 0.71
Jalpaiguri 41.87 0.31 1.81
Kochbihar 80.67 0.10 0.47
Malda 58.77 0.05 3.45
Murshidabad 56.84 0.10 1.38
Nadia 14.22 0.10 0.59
North 24 Pgs 17.22 0.02 1.31
Paschim Medinipur 32.60 0.06 1.32
Purba Medinipur 42.96 0.03 1.94
Purulia 44.64 0.01 3.65
South 24 Pgs 17.13 0.04 0.34
Uttar Dinajpur 40.74 0.029 0.25
State 32 0.08 1.35
5.5.1 Linkage of District wise sanitation coverage data with disease prevalence
An attempt has been made to establish the relationship between availability of household latrines with the incidence of diseases such as Diarrhea, Enteric Fever and Viral hepatitis. The variables, containing district wise data, used were as follows: Percentage of Households not covered (Source: DDWS, MoRD). The data used was Total Households coverage (APL + BPL) without Toilet. Limitations:
- 79 -
Primarily rural sanitation coverage. The data may not include the urban coverage of household sanitation. Period of Reporting. The data reported from the district pertains to different years Community Latrine users not included. In urban areas a large proportion of the BPL may be using this shared facility.
Figure-27
0%10%20%30%40%50%60%70%80%90%
100%
Banku
ra
Birbhu
m
Burdwan
D. Dinajp
ur
Darjee
ling
Hoogh
ly
Howrah
Jalpa
iguri
Kochb
ihar
Malda
Murshid
abad
Nadia
North 2
4 Pgs
Pas. M
edini
pur
Pur. M
edinipu
r
Purulia
South
24 Pgs
U. Dinajp
ur
Districts
HH S
anita
tion
not c
over
ed
No HH Latrine
Disease Prevalence Figure-28
a. Prevalence of Diarrhea - Cases Reported per 1000 population during January – September 2005, 2006 & 2007 (Source: )
-
10
20
30
40
50
60
70
Banku
ra
Birbhu
m
Burdwan
D. Dinajp
ur
Darjee
ling
Hoogh
ly
Howrah
Jalpa
iguri
Kochb
ihar
Malda
Murshid
abad
Nadia
North 2
4 Pgs
Pas. M
edini
pur
Pur. M
edinipu
r
Purulia
South
24 Pgs
U. Dinajp
ur
Districts
Avg
Dia
rrhe
a at
tack
/ 10
00
Avg Diarrhea attack / 1000
- 80 -
Figure-29
b. Prevalence of Enteric Fever - Cases Reported per 1000 population during January – September 2005, 2006 & 2007 (Source: )
-
0.05
0.10
0.15
0.20
0.25
0.30
0.35
Banku
ra
Birbhu
m
Burdwan
D. Dinajp
ur
Darjee
ling
Hoogh
ly
Howrah
Jalpa
iguri
Kochb
ihar
Malda
Murshid
abad
Nadia
North 2
4 Pgs
Pas. M
edini
pur
Pur. M
edinipu
r
Purulia
South
24 Pgs
U. Dinajp
ur
Districts
Avg
Ent
eric
feve
r at
tack
/ 10
00
Avg Enteric fever attack / 1000
Figure-30 c. Prevalence of Viral Hepatitis - Cases Reported per 1000 population during
January – September 2005, 2006 & 2007 (Source: )
-
0.01
0.01
0.02
0.02
0.03
0.03
Banku
ra
Birbhu
m
Burdwan
D. Dinajp
ur
Darjee
ling
Hoogh
ly
Howrah
Jalpa
iguri
Kochb
ihar
Malda
Murshid
abad
Nadia
North 2
4 Pgs
Pas. M
edini
pur
Pur. M
edinipu
r
Purulia
South
24 Pgs
U. Dinajp
ur
Districts
Avg
Vira
l hep
atiti
s at
tack
/ 10
00
Avg Viral hepatitis attack / 1000
Limitations: Source of information may be from the Government Health Delivery System Only. The data from the private health delivery system may not be captured in the district wise data.
- 81 -
Table -6
Correlation between Percentages of household with no latrine and Prevalence of Diarrhea
Correlation coefficient between Percentages of household with no latrine and Average Viral hepatitis attack / 1000 is found to be positive 0.04.
- 84 -
5.5.2 Linkage of District wise water quality data with disease prevalence Presently data in respect of microbiological quality at the district/block/habitation level is extremely scanty. Recently, the NGO managed laboratories set up with UNICEF assistance in some of the districts of West Bengal, conducted sample bacteriological testing. Figure – 34 shows the percentage of water samples tested positive doe faecal coliform in various districts. In the following sections, we have attempted to establish a correlation between this disease level water quality data with the district wise disease prevalence data in respect of ADD, Enteric Fever and Hepatitis A.
Figure-34 Percentage of Water Samples tested positive on Bacteriological test conducted by the NGO
laboratories. (Source: UNICEF/PHED)
0%1%2%3%4%5%6%7%8%9%
Banku
ra
Birbhu
m
Burdwan
D. Dinajp
ur
Darjee
ling
Hoogh
ly
Howrah
Jalpa
iguri
Kochb
iharMald
a
Murshid
abad
Nadia
North 2
4 Pgs
Pas. M
edini
pur
Pur. M
edinipu
r
Purulia
South
24 Pgs
U. Dinajp
ur
Districts
MPN
(+ve
)
MPN (+ve)
Table- 9 Correlation between Percentages of bacteriological test found positive and
Correlation coefficient between Percentages of bacteriological test found positive and Average Enteric fever attack / 1000 is found to be positive -0.13.
Table-11
Correlation between Percentages of bacteriological test found positive and Prevalence of Viral hepatitis
Correlation coefficient between Percentages of bacteriological test found positive and Average Viral hepatitis attack / 1000 is found to be positive 0.45.
5.5.3 Case Study on Diarrhoea and Cholera, vis-à-vis, Water Quality and Sanitation in Kolkata
Figure below depicts the extremely poor status of water quality (Faecal contamination) and sanitation in the city of Kolkata and its impact of extremely high level of morbidities of Diarrhoea and Cholera in the comminuty.
- 88 -
General comments
The district wise disease prevalence data in West Bengal indicates positive correlation with lack of sanitation and safe water. Lack of sanitation data in districts has positive correlation co-efficient of 0.27 for diarrhea, 0.13 for enteric fever, and 0.04 for viral hepatitis. Percentage of water samples found positive for faecal coliform shows a positive correlation coefficient of 0.39 for diarrhea and 0.45 for viral hepatitis. However, the correlation coefficient for enteric fever is -0.13. On the whole the West Bengal scenario depicts a more rational and logical correlation between water, sanitation and health, compared to the national scenario. 5.5.4 Arsenic contamination of ground water in West Bengal and related disease burden During the last two decades arsenic contamination of ground water has become a serious public health problem in West Bengal. Figure 38 shows the arsenic affected blocks in West Bengal. Presently 79 blocks (more than 6000 habitations) are affected in 9 districts. 10 to 15 million people are at risk. However, the disease surveillance and epidemiological data in respect of people suffering from Arsenicosis and more serious health problems is extremely scanty. The routine disease surveillance data available from Government system indicates a rather low disease burden. Table-10 depicts the percentage of tubewells having arsenic
- 89 -
content in the affected blocks. Figure-38 shows the distribution of Arsenicosis cases in the affected districts of West Bengal between 2004 to 2006. Figure 39 depicts district wise percentage of tube wells having arsenic more than the WHO guideline value of 0.01 mg/l. Figure- 40 depicts district wise percentage of tube wells having arsenic more than BIS standard of 0.05 mg/l. The correlation between the percentage of tube wells having arsenic more than 0.01 and 0.05 mg/l in the affected districts with the number of arsenicosis cases in those districts indicates a positive coefficient of 0.76 and 0.70 respectively. Though it must be mentioned that the official disease burden statistics might be a faction of the true disease burden. In an epidemiological survey carried out by Dr. D.N. Guha Majumdar (Member, Arsenic Task Force, West Bengal) in one of the affected districts of West Bengal (South 24 Parganas), where 7683 people were examined in 57 arsenic affected villages, the prevalence of arsenical skin lesion was found to be 4.6%. Further Dr. K.C. (2003) reported the incidence of arsenic related cancer to be 5.1% among 4865 cases of arsenicosis examination during the period of 1983 to 2000. However, the data of the former study represented information in a highly exposed region of the state, while the later data were compiled from cases examined in a tertiary referral centre and some scattered survey carried out in the affected districts of the state. Figure 41 depicts the increasing trend of arsenic related skin cancer in the state.
Table –12
Percentage of tube well having Arsenic content (in mg/l) in the affected districts
District wise Percentage of tube well having Arsenic more than (WHO guideline) 0.01
Figure –40
District wise Percentage of tube well having Arsenic more than (BIS Standard) 0.05 in the affected blocks
- 92 -
Figure –40
Distribution of arsenics cases in districts, West Bengal, 2004 to 2006
150
23
83
26
99
0 13 0 2
1339 38
6038
0 0 0 1
51
24
433
115
35
0 0 0 0050
100150200250300350400450500
Malda
Murshidab
adNadia
North 24 Parganas
South 24 Parganas
Howrah
Burdwan
Hooghly
Kolkata
Y 2004Y 2005Y 2006
Figure – 41
Increasing malignancy due to Arsenic contamination in West Bengal
(Source: Dr. K.C. Saha, Ex-Prof. of Dermatology, School of Tropical Medicine, Calcutta)
- 93 -
5.6 Fluoride in Groundwater and Endemic Fluorosis in India
Table-13 depicts the gradual spread of endemic fluorosis in the country. Today, almost 65 million people in more than 200 districts spreading over more than 20 states are suffering from endemic fluorosis. Table-14 shows the state wise figures of rural population exposed to the risks of fluorosis. Table-15 depicts the state wise figures of percentage of districts affected with endemic fluorosis in the states. The environmental cause of fluorosis is the presence of fluoride in groundwater. People drinking more than 1.5 mg/l of fluoride in groundwater suffer from fluorosis. With moderate level of fluoride in drinking water, the suffering is limited to dental fluorosis but at higher level this could lead to crippling, skeletal fluorosis.
Table – 13
Review of Fluoride & Fluoride endemicity in India
- 94 -
Table – 14
Rural population at risks to Fluorosis
State Total Population
(million)
Rural Population
(million)
Rural Population
At Risk (million)
Percentage of Total Population
At Risk
Andhra Pradesh 74.62 52.31 13.50 18.10 Bihar 98.12 83.67 NA NA Delhi 13.42 1.23 0.16 1.4 Gujarat 47.56 29.45 4.78 10.10 Haryana 19.83 11.57 2.17 10.90 Jammu & Kashmir 9.71 7.22 NA NA Karnataka 51.65 34.42 6.90 13.40 Kerala 32.08 22.43 NA NA Madhya Pradesh 78.81 58.36 1.68 2.10 Maharashtra 90.45 52.84 0.14 0.20 Orissa 35.53 29.80 3.26 9.20 Punjab 23.28 16.05 2.07 8.90 Rajasthan 52.94 39.82 10.90 20.60 Tamil Nadu 61.43 39.19 7.64 12.40 Uttar Pradesh 167.66 130.83 11.77 7.00 West Bengal 78.32 56.21 1.65 2.10 Assam 25.88 22.62 NA NA All India 961.29 691.02 66.62 6.90 NA – Not Assessed
- 95 -
Table – 15
Endemic Fluorosis in India (State wise figures)
5.7 Geo-Environmental and Climatological factors’ influence on endemecity of WSS diseases in India
As discussed earlier, in Chapter-3, climatological, environmental, topographical and hydrogeological factors influence morbidity pattern in the community to a large extent. Table-16 indicates the districts in the country which are endemic of diarrhoeal disease. Figure-42 depicts the month wise distribution of diarrhea cases, on the basis of a case study conducted in South Andaman. As such while evaluating the impact of improved water and sanitation facilities or the lack of the same in a community. We need to consider these influencing factors as well.
States Endemic Fluorosis Total District Endemic District
Seasonal variations of Diarrhoea cases in South Andaman, 2005
Month-wise distribution of Diarrhea Cases on the basis of a case study was done with a total 546 Diarrhoeal episodes due to shigellosis in South Andaman
- 98 -
Chapter-6
National Level Workshop on “Water Borne and Related Diseases”
6.1 Preamble:
The National level Workshop on “Water Borne and Related Diseases” has been organised by Public Health Engineering Deptt., Govt. of West Bengal. The venture has been supported by World Health Organisation (India Cuntry Office). The approval of the programme was conveyed by WHO vide their no WR/IND PHE 001G [SE/07198031] dt. 12/06/07 of Mr. Pradip Dewan, Programm and Administrative Office. The fund for organising the workshop was provided by WHO.
The programme was held at Dakshin Roypur Water Treatment Plant Auditorium, (Budge Budge – II block, Distt. – South 24 Parganas, West Bengal State) from 23rd to 25th July 2007. The details of the programme is enclosed as Annexure – I. The details of participant in placed at the end of the recommendation as Annexure – II.
Considering the strength of participants and other factors, the workshop has been oriented on Seminar setup with interactive sessions at the end of each Plenary Sessions.
6.2 Inaugural Session:
The welcome address was given by Sri P. K. Dutta, Engineer-in-chief and Ex-officio Secretary, Public Health Engineering Department, Govt. of W.B. In his speech he cordially invited all the participants and also outlined the existing marvelous infrastructural facilities of the department for organising such programmes, in general, and available appropriate amenities of this venue, in particular. He placed an overview of water supply scenario under the aiges of PHED, WB. He also thanked WHO for their gesture in allowing this department to undertake the organising of such an important programme. He also thanked WHO for their support in two previous training courses on Water Quality Testing, Monitoring & Surveillance, which was held at the same venue and was attended by practicing engineers and professionals from different state of PHE Departments in India. Prof. K. J. Nath, Chairman, Arsenic Task Force, West Bengal and Principal investigator of WHO study group on Water borne and related disease issue programme
- 99 -
He delivered the keynote deliberation of this workshop and outlined the necessity of such an interaction on one of the most important issue of the day, which is the theme of this seminar. Mr. Achinta Sengupta, NPO (SDE), WHO, India Country Office explained the role of WHO, who associate with different Governments, Organisations, Institutions and individuals, all over the world, on different health related issues. He also submitted the views and findings of WHO on global Water Borne and related Diseases issue with specific stress on India. He expressed his hopes for a meaningful discussion and interaction during this programme. Mr. Gautam Deb, Hon’ble Minister-in-charge, Housing and Public Health Engineering Deptt., Govt. of West Bengal, first lighted the lamp as a mark of inauguration. Then he kindly delivered a nice speech narrating the importance of the issues as per caption theme of this program. He also presented an encouraging scenario of his deptt. in tackling the issues related to safe drinking water throughout the state, including the achievements made so far and the future plan. He also gave an outline of the functionary of total sanitation campaign in this state. He acknowledged the co-operation he receives on all related issues, from different organisations and individual experts. He wished success of this programme. Plenary Session I This session was chaired by Dr. (Smt.) Indira Chakraborty, Director, All India Institute of Hygiene and Public Health, Kolkata who regulated the session, including the interaction slot at the end of the session, in most befitting manner and also placed her nice concluding remarks. Plenary Session II This session was chaired by Dr. S. P. Sinha Ray, Member, Arsenic Task Force, West Bengal. The chairman took keen initiative to run the session in an effective manner and the session has been conducted very successfully. The chairman provided his valuable inputs wherever needed. Plenary Session III and IV (Combined) This session was chaired by Prof. K. J. Nath, Chairman, ATF, West Bengal and Principal Investigator, WHO study team on ‘Water borne and related disease burden’. This session is continued longer and the lunch break was delayed. Prof. Nath conducted the business in most proper manner. He also conducted the interaction with all the participants effectively and efficiently, at the end of the session.
- 100 -
6.3 PROGRAMME DETAILS
Time Activity Topic Presenter DAY – I; 23rd July, 2007, Monday
13.00 hrs. to 14.00 hrs R E G I S T R A T I O N
INAGURAL SESSION, CHAIRPERSON-SRI P.K. DUTTA, ENGINEER-IN-CHIEF & EX-OFFICIO SECRETARY, PHED, GOVT. OF WEST BENGAL
14.30 hrs. to 14.35 hrs. Address Welcome to Delegates
Sri. P.K. Dutta, Engineer-in-Chief & Ex-Officio Secretary, PHED, Govt. of
West Bengal
14.35 hrs. to 14.40 hrs. Address
Objective and background of the
Seminar
Prof. K.J. Nath, Chairman, Arsenic Task Force, West Bengal
14.40 hrs. to 14.45 hrs. Address Role of WHO Sri Achinta Sengupta, NPO (SDE),
WHO India Country Office
14.45 hrs. to 15.20 hrs. Inauguration Inaugural Speech
Sri Gautam Deb, Hon’ble MIC, Housing PHE Dept. Govt. of West
Bengal
15.20 hrs. to 15.50 hrs. T E A B R E A K
PLENARY SESSION- I & II, CHAIRPERSON – DR. INDIRA CHAKRABORTY, DIRECTOR, AIIH&PH
15.50 hrs to 16.10 hrs Presentation
Water & Sanitation related disease burden-International and National perspective (WHO Study)
(i) Prof. K.J. Nath, Principal Investigator & Chairman, ATF, West Bengal ii) Prof. Arunabha Majumdar, Co-Investigator
16.10 hrs. to 16.30 hrs. Presentation
Water Quality Status and Institutional arrangement for surveillance in West
8. Dr. Tapan Chakraborty Director grade Scientist & Head Environmental Biotechnology Division National Environmental Engineering Research Institute, Nagpur
(The final ‘Recommendation’ is based on suggestions made by participants as stated in last paragraph of the concluding session)
The National Level Seminar on “Water & Sanitation Related Disease Burden” wherein presentations were made by distinguished speakers from national institutes who deliberated at length on the issues related to the extremely serious Public Health Impact due to lack of access to safe water and facilities for environmental sanitation.
At the end of 3 days of in-depth interactions, considering the enormous impact on public health of,
• Microbial (Bacterial, Protozoal & Viral), helminthic & Chemical contamination (Arsenic, Fluoride, heavy metals and pesticides) of drinking water sources & distribution systems, creating huge burden of diarrhoeal, helminthic and other water borne diseases
• Lack of safe water supply and inadequate excreta disposal systems. • Inadequate food safety. • Lack of hygienic habits in the community. • Inadequate drainage & solid waste management and bio-environmental control
measures creating vector breeding and increasing vector-borne diseases. • Lack of appropriate institutions, legislations & infrastructure for environmental
monitoring & surveillance. • Lack of effective co-ordination between Ministry of Health / Ministry of
Environment & Forest / Ministry of Rural Development / Ministry of Urban Development / Ministry of Water Resources and other concerned Departments
• Inadequate advocacy by the Ministry of Health on Environmental Health issues. • Lack of awareness about health benefits related to safe water, sanitation and
other environmental services. The participants of the seminar resolve to recommend the following action plans for consideration of the policy makers and planning authorities:- 1. Strengthening ***** Department of Health to support decision making for
Environmental Health protection.
• Creation of a separate cell on environmental health within the department of Health including team members with skills in environmental health policy, environmental epidemiology and social science who will develop intra-departmental skills and will interact with other agencies. Initially starting with a review and situational analysis of the current Departments of Health/ Ministry of Environment & Forest / Ministry of Rural Development / Ministry of Urban Development / Ministry of Water Resources and other concerned Departments
- 107 -
2. Development of Appropriate Legislations and mechanism of enforcement –
i) Development of appropriate Legislations and mechanism of enforcement related to environment and health, beginning with a systematic review of existing legislations and gap identifications related to the same and possibly leading to development of an integrated environmental monitoring and health protection legislation.
3. Infrastructure strengthening
There is a need for providing/ strengthening necessary infrastructure for water supply, sewerage and sewage treatment, drainage and solid waste management both in urban and rural areas, where ever they are lacking, which are complementary to the health and well being of the community.
4. Strengthening information systems for decision-making.
a. Development of a priority programme of epidemiological research on environmental health impacts in the country related to air, water, soil, food, shelter and ecology, in order to create understanding of priority problems.
b. Development of a systematic database with periodic updating on
the distribution (spatial, social, demographic) of preventable environment related diseases of major public health significance, with a view to prioritize environmental interventions to areas and groups in greatest need.
5. Strengthening Training in and Orientation towards environmental health.
a. Develop programme of in-service training/awareness-raising on
environmental health priorities and policy for multiple audience (***Health professionals; panchayet leaders; NGOs; CBOs; urban local body personnel)
b. Review and strengthen educational curricula related to environmental health monitoring and management (e.g. in Medicine; Public Health /Environmental engineering; urban planning).
c. Review and strengthening educational curricula related to environmental health and hygiene in schools.
d. Develop ****** programme of training in environmental health policy in order to augment core of expertise in environmental epidemiology and policy within the state.
- 108 -
6. Strengthen mechanism for Inter and Intra Collaboration
a. Development of **** environmental and health monitoring and action projects, initially through pilot projects in order to guide joint decision making processes (for example - water, sanitation and Health centres by Panchayet )
b. Development of opportunities for convergence between environment and health initiatives within the state, specifically beginning with a systematic institutional review of inter-institution and programme collaborative processes.
7. Awareness generation and IEC
a. Development of public awareness programmes through improved risk perception and development of risk communication strategies.
b. Development of skilled human resource down to the grass root level, for awareness generation and interpersonal communication
[The “recommendation” draft has been mailed to participants on 31.07.2007 and requested to provide suggestion/ further input, within a week time. The final “recommendation” to be prepared accordingly].
- 109 -
Chapter-7
Sanitation/Hygiene practice and perception and health linkage: Pilot studies in West Bengal
7.1 A Case Study on Sanitation-Health Linkage in the “Nirmal Grams” in
Murshidabad and Bankura Districts in West Bengal, June-July 2007 7.1.1 Background and Context
Impact on disease burden due inadequate vis-à-vis improved drinking water supply and sanitation is a complex issue. In the forgoing chapters, we have reviewed the international perspective as well as national and state wise data in respect of WSS coverage and disease burden. We have discussed about the confounding factors and data limitations as key constraints in establishing the correlation. Therefore, it might be useful to carry out a comparative study between the Nirmal Gram Puraskar villages, which are now fully sanitized, and the villages where sanitation coverage is much less. Thus, it would be effective to see the disease burden situation before and after the Nirmal Gram Puraskar. “Sanitation” still mainly refers as “excreta disposal” facilities. Until adequate wastewater disposal and solid waste management including behavioral changes for proper hygienic practices are fostered, how the correlation between improved water and sanitation and reduction of disease burden can be achieved? This requires adequate attention. Number of locations and water sources of drinking water affected by pollutants are highlighted in many reports and studies, but people affected by contaminated water supported by epidemiological case studies are rare to be found. If it exists, the sample sizes on epidemiological studies are small. Therefore, it is further difficult to correlate the relation between disease burden and contaminated drinking water in Indian scenario.
Panchayeti Raj Institution in West Bengal is working hard for Total Sanitation Campaign in rural areas of West Bengal. The sanitation coverage (latrine use) has crossed 65% in rural habitations. Many Gram Panchayets and Panchayet Samities have received “Nirmal Gram Purashkar” for full sanitation coverage in villages and blocks respectively from Hon’ble President of India. In prima facie, sanitation coverage (Latrine use) has direct bearing on health of the community. But in fact the disease burden due to inadequate vis-à-vis improved drinking water supply and sanitation is a complex issue, because the environmental health improvement from water and sanitation depend on quality and quantity of water supply, use of toilet, better drainage system, improved management of solid waste, food sanitation, personal hygiene and domestic cleanliness, housing status etc.
7.1.2 Methodology and Work Plan
In the above context, a rapid assessment of impact on disease burden due to inadequate vis-à-vis improved drinking water supply and sanitation has been out
- 110 -
carried in Murshidabad and Bankura district of West Bengal, through Comparative Study between the Nirmal Gram Purashkar villages which are now fully sanitized and villages yet to be fully sanitized. Thus it would be useful to see the disease burden situation before and after the award of Nirmal Gram Purashkar (NGP). In Murshidabad and Bankura following blocks were selected for the field study.
Murshidabad District Bankura District
(i) Baharampur (i) Kotapur (ii) Bhagawangola-I (ii) Bankura I
(i) Murshidabad-Jiagunge (iii)Taldanga (ii) Raghunathgung-II (iv) Chatna
During the field studies following 12 (twelve) Gram Panchayets (6 nos.Gram Panchayet) in Murshidabad and 6 Nos. in Bankura district) were identified for conducting door-to-door study. The sanitation coverage of those Gram Panchayets are furnished below.
In each of the above Gram Panchayet 1 to 2% populations were selected for the field study. Questionnaires were used for collection of information from individual respondents of each house. The houses were also inspected by the study team during the filed study to assess the status of drinking water and environmental sanitation components.
- 111 -
Sanitation – Health Linkage Study In Murshidabad District of West Bengal : (June – July 2007)
Table-M1
District Block Gram-Panchayat (100% Sanitation)
(NGP awarded)
Gram-Panchayat
(50% Sanitation Coverage)
Gram-Panchayat
(10% Sanitation Coverage)
Murshidabad Baharampur Radharghat-I - -
- Do - -Do- Hatinagar - -
- Do - Bhagawangola-I - Amdanga -
- Do - Murshidabad- Jiagunge
- Bahadurpur -
- Do - Raghunathgung-II - - Mithipur
- Do - - Do - - - Sekendra
- 112 -
Sanitation – Health Linkage Study In Murshidabad District of West Bengal : (June – July 2007)
• The housing conditions of all the categories of villages (100%; 50%; and
10% Sanitation) are same and most of the houses are Katcha or Katcha-Pucca
• In all the categories of villages’ majority of the villages are daily labourers
• In one Gram Panchayet, Sanitation (Latrine use) coverage is 100%, where
as in other Gram Panchayet, the same coverage is only 10%. Majority of the latrines are single pour flush types.
Most of the latrines were found to be single-pit latrine. However, a few double-pit latrines have also been constructed by the villagers. The latrines constructed by the villagers are low cost type (cost Rs. 400/- to Rs. 450/-). These are liable to be damaged during natural disaster e.g. Flood, Cyclone etc.
• The source of drinking water in all the villages is ground water and villages
use tube well water for drinking.
• In all the categories of the villages, drainage condition, personal hygiene of the villagers, food sanitation and general sanitation are mostly poor.
• Field study indicates the common water borne and excreta borne diseases
• The illness time in days per person per year has been found to be lesser
in the villages (16.45 days/person/year and 5.61 days/person/year) where sanitation coverage was 100% (Nirmal Gram) compared to the villages where sanitation coverage was 10% (37.50 days/person/year and 12.64 days/person/year). However the difference is not significant in case of villages with 50% sanitation coverage.
• Similarly the loss of earnings per family per year due to illness as have
been found to be more in the villages where sanitation coverage was 10% compared to the villages where sanitation coverage was 100%, but not very significant when compared with the villages with 50% sanitation coverage.
• The medical expenditure per family per year however cannot be correlated
with the sanitation coverage figures in the study villages.
- 127 -
7.1.4 Conclusion and Recommendations
• The study in the Nirmal Grams of Murshidabad and Bankura districts, indicated that by providing only toilets in the individual houses, the disease burden may not reduce substantially. Improvements on drainage condition, general sanitation, personal hygiene, food sanitation are also to be taken, simultaneously to minimize the disease burden among the villagers.
• The issue of sustainability and use of toilets, constructed in the so-
called Nirmal Grams need also close examination.
• The present study was a very modest effort, a pilot study with a rather small sample size, conducted for a very short duration.
• A more elaborate study, covering a much larger number of villages
(Nirmal Grams) spread over different regions of the country, representing various ethnic and socio-economic groups, is required to evaluate the health impact of sanitation improvement in the so-called Nirmal Grams of the country.
7.2 The Study on Perception and practices of Hygiene and its health
impact
7.2.1 Objective and Methodology: Objective was to map the perceptions and to assess their practice patterns of the rural and urban women from all socio-economic classes of the society.
In keeping with the above goal, 400 women were randomly interviewed from 4 municipal areas (Kalyani, Kamarhati, Garulia & Titagarh) and 4 gram panchayats (Chandpara, Doma, Jhaudanga & Phoolsara) in North 24 Pargana district of West Bengal, India. The sample was selected from the four quadrants of the municipality or villages to ensure proper geographic representation. Pretested structured questionnaires were used for recording responses. The purpose of such coverage was ensuring sample selection from different areas with varied level of basic service provision with respect to water and sanitation.
7.2.2 Findings of the study:
Profile of the Respondent:
Further the sample within each of the locations was distributed amongst married and unmarried women belonging from upper, middle and lower economic classes. Besides these the sample also ensured representation of different education levels and religion.
- 128 -
The women were from households with the chief wage earner as Wage Labors, Self employed, Trader/ Small business, Govt. / Private Service, Business, House wife or Student.
Location Chandpar
a Doma Fulsara Garulia Jahudanga Kalyani Kamarhati Titagarh Tota
l
Type RURAL RURA
L RURAL URBAN RURAL URBAN URBAN URBAN Police Station Gaighata Gaigha
ta Gaighata Gaighata
District
North 24 Parganas
North 24
Parganas
North 24 Parganas
North 24 Parganas
North 24 Parganas Nadia North 24
Parganas North 24 Parganas
Married 44 27 34 14 119 Unmarried 23 23 16 19 81 RURAL Total 67 50 50 33 200 Married 30 30 30 30 120 Unmarried 20 20 20 20 80 URBAN Total 50 50 50 50 200 Grand Total 67 50 50 50 33 50 50 50 400
Incidence of disease reported amongst 400 households surveyed in the following areas:
There was no reporting of Hepatitis and Dengue amongst the surveyed
households.
Based on the above findings an attempt was made to test the correlation of the incidence of such diseases with the following variable sets. The information regarding the following was collected during the primary survey.
Public Health Awareness Score
Considering the following, a composite score has been computed for each of the 400 respondents. Subsequently, the average score of each of the location has
- 129 -
been derived to arrive at the Public Health Awareness Score for each location score. The variables and the computation have been detailed below.
Sl. Question Weightage
n1 Do you know due to hand contact or storage in dirty or uncovered vessels water becomes contaminated with Germs?
Yes 1 No 2
n2
Do you know accumulation of water in your environment encourages the breeding of mosquitoes etc. thereby increasing the risks of transmission of diseases like Malaria etc.?
Yes 1 No 2
n3
Do you know there is an opportunities for transmission of Germs directly by your children coming into direct contact with faeces or contaminated refuse whilst playing?
Yes 1 No 2
n4
Do you know cooked food becomes contaminated by contact with raw food like raw meat, unwashed vegetables or salad or with utensils, cloths?
Yes 1 No 2
n5
Do you know foods can become contaminated with Germs if you don’t wash your hands before handling cooked foods, or foods which are to be eaten raw, or use contaminated water to wash ready-to-eat foods or prepare infant feeds?
Yes 1 No 2
n6 Do you know foods can contain Germs when buying it from market or shop or while being handled or stored at home?
Yes 1 No 2
n7
Do you know Germs can be spread by flies, cockroaches, rats & mice which thrive in refuse such as food scraps & peelings from fruit & vegetables?
Yes 1 No 2
n8 Do you know old food may contain Germs that could be transformed to the new food if they are mixed together?
Yes 1 No 2
n9 Do you know handwashing with soap & water is useful to make the surfaces of the hands hygienically clean?
Yes 1 No 2
n10 Do you know that a fridge maintained between 1-5o C will reduce growth rate of microbes for a limited period?
Yes 1 No 2
n11 Do you know raw materials, including water & ice may be contaminated with Germs & dangerous chemials?
Yes 1 No 2
n12
Do you know infants & babies are much more likely than adults to become ill from eating contaminated food or drinking contaminated water?
Yes 1 No 2
n13
Do you know Germs on the skin surface, particularly the hands, can be transferred on to another person, either by direct contact or via surfaces, and can cause infection in that person?
Yes 1 No 2
n14 Do you know washing the face with soap & water every day helps to prevent eye infections such as conjunctivitis & trachoma?
Yes 1 No 2
n15
Do you know Germs can be transmitted from toilets & latrines either by direct contact with these items or indirectly via contaminated hands, or via insects?
Yes 1 No 2
n16 Do you know Germs continually enter the home & contaminate floors via shoes, the feet of pets?
Yes 1 No 2
n17 Do you know that toys can become contaminated quite easily as toys are passed from child to child?
Yes 1 No 2
- 130 -
Sl. Question Weightage
n18
Do you know domestic animals such as chicken, cattle, sheep, goats, pigs, cats, rats & other rodents can carry a variety of pathogens which, if transferred to humans, can cause disease?
Yes 1 No 2
n19 Do you know that people undergoing medical treatment and those recently discharged from hospital are more prone to infection?
As per the above computation, higher the score, lower is its awareness level on public health
issues.
0
5
10
15
20
25
30
0 2 4 6 8 10 12 14 16
Cum Incidence of Cholera, Typhoid, Diarrhea
Publ
ic H
ealth
Aw
aren
ess
Sco
re
Public Health Awareness Score
- 131 -
0
5
10
15
20
25
30
0 2 4 6 8 10 12 14 16
Incidence of Malaria
Publ
ic H
ealth
Aw
aren
ess
Sco
re
Public Health Awareness Score
The incidence of the disease such as Cholera, Typhoid, Diarrhea and Malaria increases with the increase in Public Health Awareness Score of the location. All the Correlation coefficients are found to have positive as shown above. This implies that the lack of awareness on public health issues have direct correlation with incidence of the above mentioned diseases. Personal hygienic Score
Similarly a composite score has been computed for each of the 400 respondents, considering the following. Subsequently, the average score of each of the location has been derived to arrive at the Personal hygienic Score for each location score. The variables and the computation have been detailed below.
Sl. no Question Weightagen1 How do you wash your hand? WWiitthh SSooaapp-- wwaatteerr
With Ash/ Mud With Water
1. 2. 3.
n2 Do you wash your hands whenever hands are visibly dirty? Yes
Sometimes No
1. 2. 3.
n3 Do you wash your hands after using toilet? Yes
Sometimes No
1. 2. 3.
n4 How do you wash your hand after using toilet? WWiitthh SSooaapp-- wwaatteerr 1.
- 132 -
Sl. no Question WeightageWith Ash/ Mud
With Water 2. 3.
n5 Do you wash your hands after handling pets or cattles or other their object?
Yes Sometimes
No
1. 2. 3.
n6 Do you wash your hands after coming into contact with body fluids – such as nasal secretions, saliva, and vomit?
Yes Sometimes
No
1. 2. 3.
n7 Do you wash your hands before giving or applying medication to another person?
Yes Sometimes
No
1. 2. 3.
n8 Do you wash your hands after changing nappies? Yes
Sometimes No
1. 2. 3.
n9 Do you wash your hands before applying contact lenses/ denture? Yes
Sometimes No
1. 2. 3.
n10 How do you wash cooking & feeding utensils? With hot water & detergent
With water & detergent With hot water With Ash/ Mud
With Water
1. 2. 3. 4. 5.
n11 Where do you wash your cooking & feeding utensils? Home
Pond Tube well
1. 2. 3.
n12 If at home, with what? Tap water
Well water Pond water
1. 2. 3.
n13 Do you wash your hands after handling raw food material i.e. raw meat etc.?
Yes Sometimes
No
1. 2. 3.
n14 Do you wash your hands before cooking? Yes
Sometimes 1. 2.
- 133 -
Sl. no Question Weightage No 3.
n15 Do you wash your hands before eating? Yes
Sometimes No
1. 2. 3.
n16 How do you wash your hand before eating? WWiitthh SSooaapp-- wwaatteerr
As per the above computation, higher the Personal Hygienic Score, lower is their adherence to personal hygiene issues in their daily life.
0
5
10
15
20
25
30
0 2 4 6 8 10 12 14 16
Cum Incidence of Cholera, Typhoid, Diarrhea
Per
sona
l hyg
ieni
c S
core
Personal hygienic Score
- 134 -
0
5
10
15
20
25
30
0 2 4 6 8 10 12 14 16
Incidence of Malaria
Per
sona
l hyg
ieni
c Sc
ore
Personal hygienic Score
The incidence of the disease such as Cholera, Typhoid, Diarrhea and Malaria increases with the increase in Personal Hygienic Score of respondent of the location. All the Correlation coefficients are found to have positive as shown above. This implies that the lack of adherence to personal hygiene issues in their daily life have direct correlation with incidence of the above mentioned diseases. 7.2.3 Conclusions and Recommendations:
• The pilot study findings on perception and practice of personal and domestic hygiene, among the woman in selected urban and rural house hold, further strengthens the hypothesis, that hygiene behavior of the community do have a strong influence on the health gains from water-sanitation programmes. In order to optimize the health benefits from community water supply and sanitation projects, it is necessary to improve the knowledge of the community on their perception on safe water, sanitation and hygiene and their linkage of health and change their practice of personal and home hygiene, concurrently with the WSS programmes.
• As the sensitivity of the variables considered have been tested in the
pilot project undertaken in the small survey undertaken, it may be worthwhile to carry out such an interesting study on a larger scale. The findings of the study would provide valuable inputs to design and implementation for control and surveillance of such diseases in the rural and urban areas of our country and their linkage to WSS programmes.
- 135 -
Chapter- 8
Review of Institutional Issues and Key Recommendation for Action Plan
8.1 Present Institutional Setup in the Country on Issues related to Water, Sanitation and Health: As per the constitutional provisions, the issues related to community water supply and sanitation as well as Health are to be dealt in by the State Govts. However, the Central Govt. plays a key and pivotal role in the matter of provision of funding support, technical and administrative guidance, human resource development, research & development etc. The implementation of water and sanitation programme and running of the health care delivery system is under the control of the State Govt, Municipal Govt. (in the urban areas) and Panchayetiraj organizations at the District, Block and Village level for the rural areas. The Planning Commission of the GOI, assists the Central and State Govt. in planning, policy framing and resource allocation. At the central level, the Department of Drinking Water Supply, Ministry of Rural Development (MRD) is handling the drinking water supply and sanitation programme for the rural areas of the country. The department supported by the technical advisory group provides policy support and resource allocation to the state Govts. and Panchayetiraj organizations in the rural areas. Similarly, to the Ministry of Urban Development and Poverty Alleviation (MUD & PA) is handling the urban water and sanitation programme. The Central Public Health and Environmental Engineering Organization (CPHEEO), provides technical support to the MUD&PA, in the matter of resource allocation to the states and urban local bodies and also providing them necessary policy support and technical guidelines. Ministry of Environment & Forests (MoEF), is handling the broader ecological issues related to environmental management, - pollution of air and surface and ground water sources, conservation of forests and other natural resources, control of soil erosion etc as well as control of industrial and other developmental projects. The Ministry of Health & Family Welfare (MoH & FW) at the central level supported by the Directorate General of Health Services (DGHS), provide policy and resource support to the Department of Health, at the state and local level. There are a number of national level centres of excellence of medical and public health institutes of the country managed by the MoH & FW and DGHS. For this, there is a Central Health Service (CHS) of medical cadre. Scientists and Faculty members, working in the Non-Medical Institutes under the Ministry of Health Service are not included in the Central Health Service. Same is also true for the Health Service cadre, under the State Govts. Non inclusion of non-medical professionals whose roles and responsibilities are crucial for preventive and environmental health management has resulted in bias for curative services in the health services and neglect of preventive services.
- 136 -
8.2 Health and Environment: Critical Coalition is Lacking If MoH&FW could play an effective advocacy role and also do critical monitoring of environmental issues with linkages to disease surveillance, it is likely that the disease burden will be on a downward path. But the present institutional set up for Environmental & Disease surveillance in the country is extremely fragmented. Crisis in Health Management
Under the existing institutional set up in the department of health and the existing co-ordination mechanism with the department of Drinking Water Supply/Environment & Forest/Urban development/Rural Development both at the Central and State level, the preventive and environmental health ,management issues are grossly neglected. Because of the neglect of environment and preventive health, the burden of infectious disease is increasing enormously. As a result the existing health infrastructure and hospital and health care management is unable to meet the disease burden. This has totally overstressed health administration and it has no time, neither the competence to do effective advocacy on environmental and preventive health issues with the department’s in-charge of implementing water supply, sanitation and environmental projects. Thus the whole system is in a perpetual state of crisis management and is unable to come out of the vicious cycle created by itself.
- 137 -
The role of health authorities in water supply, sanitation and hygiene: Lack of effective advocacy Health authorities have a role in reviewing, approving and modifying designs for water supply and sanitation projects in such a way as to maximize the health impact achieved from them. They can regulate the delivery of water and sanitation services, and conduct surveillance on the quality of services. Health authorities also have a responsibility, through education and social marketing, of promoting low cost interventions that would mitigate inadequacies that exist in water supply and sanitation infrastructure and in poor hygienic practices. Appropriate local cost interventions, may include hand washing, point-of-use disinfection and safe storage of drinking water, as well as safe disposal of excreta. However, health authorities also have a longer term role as advocates for increased investment and increased efficiency in the water supply and sanitation sector. At the present juncture in India, the health sectors at the central and state levels do not have appropriate and adequate institutions, expertise and infrastructure for playing the above role in an effective manner. Neither there is any institutional mechanism for inter-sectoral collaboration and co-ordination, on the other hand water supply, sanitation, urban and rural development and environmental departments are lacking in adequate expertise on health, social and epidemiological issues. Under the circumstances, the departments are working in isolation which is a critical barrier for promotion of environmental and public health in the country.
8.3 Water quality monitoring and surveillance: Review of the Institutional Issues in South East Asian countries
Six of the 10 countries of the Region have established national drinking water quality standards, which are more or less similar to the WHO guideline values. But setting water quality standards has little meaning, unless the quality of water supplied to the communities monitored regularly and remedial actions taken promptly. In most of the SEAR countries, institutional set-up for water quality surveillance is extremely inadequate. Only in metro cities, the municipalities have adequate laboratory infrastructure and manpower for regular water quality monitoring and surveillance. In most small and medium towns in the Indian sub-continental countries, water quality monitoring is undertaken only occasionally and under emergency situations.
Theoretically in many SEAR countries, the responsibility of WQS rests with the Ministry of Health. In rural areas in India, and also in small and medium towns, the Public Health Engineering Department of the state governments or Panchayati Raj organizations are supposed to have the same responsibility. In Bhutan, Maldives
- 138 -
and Nepal the responsibility for surveillance of drinking water rests with the national health authorities, while in Bangladesh it is assigned to the Ministry of Environment and Forests. The responsibility for surveillance is shared in Sri Lanka between the National Water Supply and Drainage Board and the Rural Water Supply Division, Ministry of Urban Development.
But irrespective of the institutional responsibility for drinking water quality surveillance, it remains a function that is seldom fulfilled with adequate coverage or integrity in SEAR countries. In most rural systems it is non-existent. The most glaring example of a non-existent water quality surveillance system in rural areas is the episode of arsenic contamination of groundwater sources in Bangladesh and India. People were using arsenic-contaminated sources for years, without the quality of water sources having been tested even once. It is only after some of them got sick, that the problem was identified. One of the beneficial fallouts of the arsenic problem is that the need for water quality monitoring and surveillance is better appreciated now by the water providers.
The above assessments are indicative of the need to develop more effective operation and maintenance of rural water supplies and to promote sanitary inspection, along with community based water quality monitoring in rural areas, as a mechanism to identity problems. On a positive note, it should be mentioned that the indifference and apathy to the water quality issue on the part of programme managers appear to be changing and a number of initiatives are now being taken in countries like Bangladesh, Bhutan, India, Indonesia, Nepal and Thailand, etc. for building capacities of water quality monitoring and surveillance at the grass-root level. In India during the last five years, hundreds of laboratories have been established at district and block levels. The World Bank is helping the Government of Bangladesh to undertake a massive programme for WQM for arsenic all over the country, with the help of field kits. However, institutional framework and laboratory infrastructure for an independent surveillance agency are yet to be developed in most countries of the Region.
For urban municipal water supplies, there is an urgent need to have appropriate regulation, institution and infrastructural facilities for regular and effective water quality monitoring and management. Accepting that intermittent supply system would continue in most SEAR countries for some time to come and that restoration and rehabilitation of distribution systems would also require considerable investment, immediate need of the hour is effective water quality monitoring and surveillance of the municipal distribution systems and household reservoirs.
- 139 -
8.4 Key Problem Areas and Basic Maladies
Presently the departments of Health, Urban Development, Rural Development & Environment at the central as well as State level (PHED, P&RDD, Municipal Engineering Deptt. etc) are working in isolation, though often aiming at the converging goals of improvement of quality of environment and health of the community and reduction of disease burden. An effective mechanism of inter-sectoral co-ordination for facilitation of detection, prevention and management of environmental health through monitoring, surveillance and support services, is seriously lacking. In order to capacitate the MOH/DGHS and related Depts. for effective decision making and strategy development about environmental health management, we need an in-depth socio-ecological and epidemiological analysis of the National Health Programme and their linkage with the national and state level programme on water, sanitation and environmental management.
The basic maladies of the present institutional set up in the country could be identified as the following.
(i) Absence of a core sector of environmental health within the department of
health including experts with skills in environmental epidemiology, environmental health policy and socio-ecological sciences.
Presently the Dept. of Health has disease specific vertical programmes like Malaria, Tuberculosis, Leprosy, AIDS etc. However, there is no separate department on programme to address the problems concerning environmental health. In absence of this core team on environment health, the department’s capacity to interact with other sectors and to do effective advocacy for environmental health related issues is seriously jeopardized. The intra departmental skills and infrastructure for environmental health surveillance (environmental epidemiology) and environmental quality monitoring (air/water) are also very limited in the health sector.
(ii) Lack of appropriate legislations related to environment and health. It is necessary to review the existing legislations related to environment and health for the development of a comprehensive legislation on environmental health monitoring and impact assessment. Current legislations related in the environmental impact assessment of developmental projects cover ecological issues but are rather non-specific on the issues of health impact. There are also lacunas and gaps in health regulations on water and air quality as well as food safety at the national, state and local (Municipal/Village Panchayet) level.
(iii) Lack of information on environmental epidemiological aspects and environmental health impacts in the country related to air, water, soil, shelter and ecology. In order to capacitate the department of MOH/DGHS and other related Depts. for decision making and strategy development about environmental management, strengthening of the existing information system in terms of its quality, content and
- 140 -
coverage will be necessary. Presently, there is hardly any database linking environmental parameters with their health impacts. As a result of this, there is no rational prioritization on environmental intervention in the department of health and hardly any system of early warning on the trends of on-going and emerging environmental related health problems. It is necessary to undertake priority epidemiological research by the Department of Health.
(iv) Lack of training and orientation of the health professionals as well as engineering and development professionals towards the issues related to environmental health. There is an acute requirement of training and orientation for the medical and technical professional in the department of health on the issues related to the environmental health like environmental epidemiology, environmental pathology, environmental medicine etc. Similarly, there is also lack of training and orientation among the technical professionals in the department of DOH/MUD/MRD/MOEF on health related issues like epidemiology, behavioral science, social science etc.
(v) Lack of effective mechanism for inter and intra- sectoral collaboration between the Dept. of Heath and other social, economic and infrastructural development departments. Presently, there is inadequate institutional mechanism for inter-sectoral co-ordination between the departments mentioned above. In absence of effective coordination and collaboration between these departments informed decision making and strategy development on environmental health related issues are suffering.
(vi) Lack of public awareness and understanding and risk perception and communication strategies for risk abatements. With the enactment of rights to information for the citizens, it is becoming imperative that the department of health must have adequate institution, infrastructure and expertise for creating adequate public awareness and conditioning risk perception of the people and communicating to them for the strategies for risk abatement.
8.5 Key Recommendation for Action Plan to Capacitate Dept. of Health and
Other Related Depts.
The key recommendations were formulated for institutional strengthening and reforms in the department of health and other related departments in consultation with the distinguished participants of the National Review Workshop as discussed in Chapter – 5.
The recommended actions plans build directly on the growing understanding internationally that health is a fundamental element of sustainable development and that environmental and development conditions have fundamental health impacts.
- 141 -
WHO strategies outlined in Agenda 21 place great emphasis on the investigation of links between human health and environmental conditions for the management of environmental risks to health. Capacity building, enabling the MOEF/DOH to evaluate and to manage environmental risks through multi-disciplinary approaches, and to deal promptly with major health problems, is recognized as the key to achieving sustainable development. The recommended actions plans, as stated hereafter, will strengthen the MOH/DGHS and its collaborating institutions in order that environmental health monitoring and action becomes an integral part of the decision-making process of the environment and development agenda of the country.
8.5.1 Strengthening DOH to support decision making for Environmental Health protection.
(i) Development of a core team on environmental health within the
department of Health (either a separate cell or a strengthening of Public Health); including team members with skills in environmental epidemiology; environmental health policy; and social and ecological sciences who will develop intra-departmental skills and will interact with other agencies. Initially starting with a review and situational analysis of current MOH/MOEF institutional capacity and inter-sectoral co-ordination mechanism.
8.5.2 Development of Appropriate Legislations
(i) Development of legislation related to environment and health. Initially
beginning with a systematic review of existing legislation related to environmental health and possibly leading to development of linked environmental monitoring and health protection legislation.
(ii) Development of public awareness programmes through improved
understanding of risk perception and development of risk communication strategies.
8.5.3 Strengthening information systems for decision-making
(i) Development of a programme of priority epidemiological research on environmental health impacts in the country related to air, water, soil, shelter and ecology, in order to create understanding of priority problems.
(ii) Development of a systematic database on the distribution (spatial, social,
demographic) of preventable environmental-related diseases of major public health significance, in order to prioritize environmental interventions to areas and groups in greatest need.
- 142 -
(iii) Development of a systematic database on trends in environmental health problems in order to monitor and guide long and short term development decisions and develop an early warning system.
(iv) Development of routine environmental health monitoring systems, initially
through pilot projects for linkage between environment and health data sets in order to assess regularly and improve the quality of existing data sets for estimation of environmental health impacts.
8.5.4 Strengthen Training in and Orientation towards environmental health
(i) Develop programme of in-service training/awareness-raising on environmental health priorities and policy for multiple audiences (medical officers; panchayat leaders; NGOs; GBOs)
(ii) Review and strengthen degree and P.G. level educational curricula related
to environmental health monitoring and management (e.g in medicine; public health engineering; urban planning).
(iii) Develop programme of training in environmental health policy in order to
develop expertise in environmental epidemiology and policy in the country. 8.5.5 Strengthen mechanism for Inter and Intra Collaboration
(i) Development of environment and health monitoring and action projects, initially through pilot projects in order to guide joint decision making processes (for example water - sanitation and Health at PHC at Panchayat level).
(ii) Development of opportunities for convergence between environment and
health initiatives within the state. Specifically beginning with a systematic institutional review of inter-institution and programme collaborative processes.
The Figure 1 shows the ideal structure indicating the components of a programme of control and surveillance of drinking water quality. Figure 2 elaborates the relation between control and surveillance of drinking water quality. This would help us appreciating the proposed plan of action for capacitating MOH in environmental health management.
- 143 -
Figure 1
Components of a Programme of Control and Surveillance of Drinking Water Quality
- 144 -
Figure 2
Relation between control and surveillance of drinking water quality
- 145 -
Figure 3, depicts the conceptual framework for Environmental Monitoring and Management Action Plan, which we are proposing to be undertaken by the MOH.
PROGRAMME INFORMATION INFORMATION & ORIENTATION INSTITUTIONAL
STRENGTHENING COORDINATION
Priority research
development Curricula
development Review and Cell
development Review &
development
COMPONENTS
Linkage of Env. & Health databases
In-service training Environmental Health legislation
Health cities project development
Pilot Studies Short courses Public awareness Pilot schemes in
Monitoring & action
PURPOSE
To improve Priority setting Through develop- ment of monitoring systems
To generate Motivated decision makers
To improve Departmental policy on environmental health
To provide early Warning system
To develop skill in environmental Epidemiology & Policy development
To improve Departmental and Public understanding of environmental health
To strengthen Mechanism for intersectoral environmental health policy
GOAL Environmental Health Monitoring & Management
SUPER GOAL PROMOTION OF ENVIRONMENTAL HEALTH AND ENVIRONMENTAL PROTECTION
- 146 -
8.6 Specific Action Programmes Recommended for Implementation During
the 11th Plan. Four programmes of action are suggested. Each focuses on a specific area of strengthening and/or development. Thus, the four programmes are:
• Institutional strengthening Programme
• Information System Development Programme
• Training and Orientation Programme
• Programme for Strengthening Co-ordination and Multi-sectoral Action
These four programmes of action are inter-related. They are presented here as separate programmes of work with specific components which can be undertaken by different agencies. They are all envisaged, however to contribute to the same goal. The following sections describe the programmes and their components in detail. They should be independently costed, with tasks and activities outlined in brief. The programmes are recommended for implementation over the next five years. They might also differ in the level of detail identified at this stage. This is intended. The programmes outlined here are designed to develop flexibly. This is in recognition of the need to begin slowly the process of reform and strengthening in the MOH. Figure 3 shows the action plan and its components over time with short, medium and long term activities outlined in brief. The following sections give details of the specific action programmes.
8.6.1 Institutional Strengthening Programme
This programme aims to strengthen the DOH I MOEF to support decision making for environmental health. The programme aims to redress the institutional weakness outlined earlier. It has three components:
• Institutional review and development of a core team on environmental health
within the Department of Health I Environment & Forests (either a separate cell or a strengthening of Public Health);
• Legislative review and development of legislation on environmental health; and
• Public awareness and risk communication component.
8.6.1.1 Development of an Environmental Health Cell
This component aims, over the period of the next five years, to develop a core team on environmental health within the Department of Health I Environment & Forests (potentially either a separate cell or a strengthening of the public health contingent within the DOH I MOEF). The environmental health team should include members with skills in environmental epidemiology; environmental health policy; and social & ecological sciences. The staff will develop intra-departmental skills and will interact with other agencies. It is anticipated that the component will start with an institutional
- 147 -
review. This will be a situational analysis of current DOH/MOEF institutional capacity to undertake its mandate.
8.6.1.2 Development of Legislation
Development of Environmental Health Legislation
There is a need to develop a new law, or amend the existing laws, to introduce provisions for preventing and controlling health problems due to environmental pollution. The environmental health legislation should prioritize objectives for meeting health needs and protecting vulnerable groups without degradation of environment. The environmental health law may include the following health components at local, state and central levels.
• Linking environmental data to possible health hazards (environmental health
indicators)
• Controlling environmental health problems through provision for regular epidemiological surveillance and monitoring of hazardous factors by qualified environmental epidemiologists or engineers and scientists;
• Environmental Impact Assessment regulations may be modified so that a 'health impact assessment' is required for all major development projects including water resource management, urban and rural developments etc, before such projects are implemented.
• Environmental Protection Act, factories Act, Town and Country Planning Act and Municipal Bye-laws need to be suitably modified to ensure health surveillance for preventing environmental pollution and its hazards.
8.6.1.3 Development of Public Awareness Programmes through Improved
Understanding of Risk Perception and Development of Risk Communication Strategies
The component aims to promote a systematic approach for generating public awareness through an Information Education and Communication (IEC) programme on environmental health. The goal of this IEC programme will essentially be to prevent environmental degradation and promote eco-friendly public behaviour.
This lEC programme for environmental health should be built on an improved understanding of existing environmental risk, its spatial distribution; strengths and weaknesses of existing lEC, programmes, appraisal of public awareness on specific high risk environmental issues and, of course, the operational feasibility of the proposed programme through the existing network of health infrastructure.
In order to rationalize the proposed lEC approach towards a demand-driven agenda which promotes environment friendly behavior, the formation of lEC messages, development of key information tools and a multi-media package for communication have to be carefully addressed. An in-built system of monitoring for periodic review
- 148 -
and reinforcement of the system, including appraisal of the Knowledge, Attitude, Practice (KAP) of the target audience at large will also be necessary.
8.6.2 Information System Development Programme
The overall aim of this programme is to strengthen the information system available to the Department of Health I Environment & Forests to guide its priority-setting, monitoring and policy evaluation. Given the current constraints faced by the Department, the programme will concentrate on main areas; key areas of research need and key strengthening of the existing information system. These two programme components are:
• Development of a programme of priority epidemiological research on
environmental health impacts in West Bengal in order to create a basic understanding of priority problems; and
• Development of a systematic database on the distribution (spatial, social, demographic) of preventable environment-related diseases of major public health significance, in order to prioritize environmental interventions to areas and groups in greatest need.
It is anticipated that this programme will involve longer term development of the existing information system and an increased body of basic epidemiological understanding of the key environmental health impacts in West Bengal. In this programme of the five year plan it is anticipated that some of the key epidemiological gaps should be filled. In addition, the programme aims to address the existing information system, particularly the development of data linkage systems. 8.6.2.1 Development of a Programme of Priority Epidemiological Research
on Environmental Health Impacts in the country in order to create basic understanding of priority problems.
This component is aimed at the development of amore systematic research agenda within the state in order to fill key gaps in basic epidemiological and/or policy understanding. It involves the development of an inter-institutional working group to support the Department of Health / Environment & Forests in defining, commissioning and reviewing proposals to undertake research on critical areas of environmental health. Currently, within the State of West Bengal (and for that matter, India as a whole) there are some basic epidemiological information gaps which cannot be filled simply by developing routine information systems. This component will set up the process by which key gaps in understanding can be filled. This component outlines the process and proposes a pilot study on one critical area.
The component involves the setting up of an inter-institutional working group or committee to support the Department of Health I Environment & Forests in identifying and reviewing environmental health research. The following mandate is proposed for the group:
- 149 -
• To identify key areas of priority research and form a consensus on ranking of environmental health research priorities;
• To advise DOH / MOEF on key areas of priority research ranked in order of urgency;
• To provide advise on technical quality of research proposals and to propose mechanisms for the systematic review of research proposals for technical quality; and
• To provide advise on the technical quality of research reports and to propose mechanisms for the systematic review of the technical quality of research reports.
Ultimately, it is anticipated that this group will work directly with the environmental epidemiology team within the proposed environmental health team of the Department of Health I Environment & Forests (see figure). In the short term this working group will work directly to advise the Principal Secretary. The proposal for development of a programme of priority epidemiological research on environmental health impacts is presented in annexure. 8.6.2.2 Development of a Systematic Database on the Distribution (Spatial,
Social, Demographic) of Preventable Environment-Related Diseases of Major Public Health Significance
This component aims to strengthen the existing information system. It focuses particularly on the need to assist the DOH/MOEF prioritizing environmental health interventions in areas and groups in greatest need.
This component will also to contribute to the development of routine environmental health monitoring systems, initially through pilot linkage between environment and health data sets, in order to assess regularly and improve the quality of existing data sets for estimation of environmental health impacts. The process of development of a systematic database on the distribution of preventable environment related diseases is presented in annexure.
8.6.3 Training and Orientation Programme This programme has three main objectives:-
• To review and strengthen educational curricula related environmental health
monitoring and management (e.g. in medicine, public health engineering, urban planning)
• To develop a programme of in-service training/awareness -raising on environmental health priorities and policy for multiple audiences (medical officers; P.H. Engineering, Panchayat leaders; NGOs ; CBOs) ; and
• To develop a programme of training in environmental epidemiology and
- 150 -
environmental health policy in order to build core of expertise in environmental epidemiology and policy in the country.
These components are described below: 8.6.3.1 Review and Development of Environmental Health Curricula
The proposed action will promote rational design of curricular training and an evaluation system for raising: -
• Awareness of values and realities in effective training and education;
• Motivation for environmental health management; and
• Human resources needed for educating health professionals and working under central, state and peripheral institutions.
This will help in promoting:
• Proper assessment of environment health impacts.
• An effective information I education system.
• Meaningful linkages between environmental and health data and
• Effective monitoring and surveillance.
8.6.3.2 Development of In-Service Training
There is an urgent need to develop an in-service training programme for DOH / MOEF and other related Depts. at the Central/State and local levels, health functionaries on environmental health monitoring and management. In-service training for these personnel on EHMM is not available at present and there have been no efforts to initiate such a service. Current levels of motivation in relation to EHMM are low and the absence of the training contributes to the DOH I MOEF's weaknesses, viz.
• A lack of information on environment-related communicable and non-
communicable diseases amongst health professionals.
• A lack of motivation of health functionaries in preventive/health promotion care.
• An absence of an integrated approach for managing environmental health.
• A lack of trained staff.
• A lack of awareness and perception at all levels.
The proposed action is aimed at developing in-service training materials, which will help:
• Staff to develop a rational information collection system on environment related communicable and non-communicable diseases.
- 151 -
• To increase the motivation and skills of environment health monitoring and management staff.
The training will increase the DOH / MOEF and other related Depts. ability to:
• Assess environmental health projects. • Make meaningful linkages between environmental and health data.
• Provide early warnings, when required, and
• Deliver effective environmental health monitoring and surveillance.
The extent of the knowledge gap on EHMM among health functionaries needs to be assessed to ascertain the actual training need. To develop an in-service training programme on EHMM, it would be appropriate to assess the existing training facilities and compare with them with the resources required. The training needs assessment should develop educational (learning) objectives for different categories of health functionaries.
Appropriate training modules (both for training facilitators and trainees) and other teaching/learning materials should be prepared by involving experts in the fields of environmental health monitoring and surveillance, environmental epidemiology etc. Key institutions that are to be involved in conducting the training should be identified. 8.6.3.3 Development of Training in Environmental Epidemiology and Health
Policy
This component aims to strengthen the institutional capacity of the state in basic environmental epidemiology and health policy. Purpose This training should concentrate on the scope and necessity of environmental epidemiology in the overall management of health and environment through proper health planning. The training should be designed to strengthen, educate and train the participants and do research in the field of environmental epidemiology.
Objectives of the Training • To consolidate and broaden the participants understanding of the basic principles
and methods of epidemiology.
• To increase knowledge of environmental and occupational hazards and their health effects, with an emphasis on assessment and prevention.
• To encourage and facilitate collaboration to enable assessment and prevention of environmental and occupational health risks in different geographical areas.
• To encourage public health teachers to apply the knowledge gained in training
- 152 -
for local training activities at medical colleges and at different levels, and
• To understand the factors involved in the process of priority setting for the urban environment.
8.6.4 Programme for Strengthening Co-ordination and Multi-Sectoral Action Agencies which provide environmental services and agencies which provide health services need to collaborate. There is a serious lack of data linkages and information sharing processes on environment and health problems and priorities among the different development agencies and the DOH / MOEF.
Inter-sectoral co-ordination, data linkage and information sharing processes within individual agencies are also missing. For example, co-ordination and information sharing within the various sectors, including the health sectors, of the CMDA are almost absent.
A mechanism for inter and intra-sectoral collaboration is required in order to protect the environmental health of the community. Such a mechanism would promote convergence between environment and health initiatives within the states.
In order to strengthen collaboration, a systematic database on trends in environmental health problems may be developed. Pilot studies on air pollution and respiratory health impacts within the CMA could help to monitor and guide long and short term development decisions.
Similarly, pilot studies on water and sanitation - health linkages may be undertaken in rural areas, involving the DOH / MOEF, Panchayat, Rural Development Department, Public Health Engineering and other agencies. Such a study would help to guide joint decision-making processes to minimize waterborne diseases in rural areas.
8.6.4.1 Review and Development of Inter-Institutional Coordination
As collaboration, co-ordination, data linkage and information sharing processes are rather inadequate among development and health agencies; there is a need to develop inter-institutional co-ordination at policy and operation levels.
It is suggested to take up some pilot projects of collaboration and co-ordination at the operational level. In the rural areas, at village level, diarrhoeal diseases could be controlled by undertaking a water quality and surveillance programme through the Panchayetiraj organization and carrying out parallel disease surveillance through the PHCs. Effective collaboration and co-ordination amongst these organizations would provide improved water supply and sanitation and primary health care. Similarly in urban areas, co-ordination between DOH and MOEF and PCB could help to target air pollution control resulting in reduction of respiratory diseases and malignancies.
- 153 -
Chapter- 9
General Discussions, Key Conclusions and Recommendations
There are inherent difficulties in assessing water-sanitation related disease burden. One is that the exposure often occurs at the house hold and personal level and therefore the disease burden precisely related to a specific exposure is difficult to measure. The macro level data on health and water sanitation coverage are gross and have inherent limitations, involving a number of confounding factors. Diseases transmitted by water such as diarrhoeal diseases are mostly non-specific, therefore creating difficulty in attributing a disease to a specific environmental factor. Confounding and collateral factors include competing pathways of disease exposure and transmission. For example in assessing the impact of contaminated drinking water and lack of sanitary environment on community health, the role of contaminated food, person to person contact, lack of personal & home hygiene, has not been adequately understood or identified.
Having said this, we should also appreciate that there is a great need to improve the evidence based on the links between infectious diseases and water, sanitation and hygiene risk factor. Given the present status of the global, regional as well as national and local disease burden from water supply, sanitation and hygiene risk factors, there is an acute necessity to improve the knowledge of and relative importance of pathways of transmission and use the same for implementing a programme of evidence based advocacy on the part of the health sector.
Water-Sanitation and Health Linkages
The present study made a comprehensive review of the global, regional, and national as well as state/district level data on water, sanitation and hygiene related diseases burden, including the general progress of public health including the WSS services in India and examined the correlation between lack of water safety, sanitation and hygiene and prevalence of related diseases. To further support the findings, the study team conducted two pilot studies in West Bengal, with a rather small sample size,- a. A pilot study in the districts of Murshidabad and Bankura, to assess the health
impact of sanitation improvements in a few villages, declared as “Nirmal Grams”. (100% Sanitation)
b. A pilot study on perception and practice of personal and domestic hygiene and their impact on community health
- 154 -
On the basis of our findings, as elaborately discussed in the foregoing chapters the following general observations could be made.
• The Global burden of diseases from water supply, sanitation and hygiene, risk
factors is huge and particularly critical in the sub-Saharan and South Asian countries including the Indian sub-Continent.
• Water supply, sanitation and hygiene behavior are among the key determinants of IMR and under -5 mortality in the developing countries, along with female literacy and women’s empowerment.
• In India, there has been significant positive public health gains in terms of
increase in life expectancy and decrease in death rate, infant mortality and under -5 mortality, but morbidity of infectious diseases (water-sanitation related and vector-borne) remains unabated.
• Significant investments have been made during the ten 5-Year Plans on water supply and sanitation. Coverage figures on urban and rural water supply show significant increase. But access to safe water by the urban and rural poor remains extremely inadequate. Coverage figures do not reflect on water quality.
• Sanitation coverage lagged significantly till the 90s but since then, it has gathered momentum in states like West Bengal, Maharashtra, etc. But the quality and sustainability of sanitation coverage leave many questions.
• The level of personal and domestic hygiene is poor particularly among the urban and rural unserved people. Peri-domestic environment is insanitary because of poor solid waste management and drainage and this is a key factor behind continued high level of vector-borne infections.
• Health benefits have not been commensurate with the investment made in community water supply programme primarily because of neglect of hygiene, sanitation and water quality.
• Microbial and chemical quality problems affects large portion of the community water supply schemes, Most urban municipal water supply schemes are suffering from faecal contaminations of distribution systems and most ground water based rural water sources are contaminated with chemicals like arsenic and fluoride.
• The present study to establish correlation between water and sanitation coverage and disease prevalence have been partially successful. Though because of confounding and collateral factors, the correlation coefficients have not been very strong always, it has established the need to improve the evidence base on the
- 155 -
links between infectious diseases and water, sanitation and hygiene risk factors. Cross-sectional studies often suffer from confounding variables related to community, household and behavioral factors. It may be worthwhile taking up longitudinal studies with adequate sample size.
• The study in the Nirmal Grams of Murshidabad and Bankura districts, indicated that by providing only toilets in the individual houses, the disease burden may not reduce substantially. Improvements on drainage condition, general sanitation, personal hygiene, food sanitation are also to be taken, simultaneously to minimize the disease burden among the villagers. The issue of sustainability and use of toilets, constructed in the so-called Nirmal Grams need also close examination.
• The pilot study findings on perception and practice of personal and domestic hygiene, among the woman in selected urban and rural house hold, further strengthens the hypothesis, that hygiene behavior of the community do have a strong influence on the health gains from water-sanitation programmes. In order to optimize the health benefits from community water supply and sanitation projects, it is necessary to improve the knowledge of the community on their perception on safe water, sanitation and hygiene and their linkage of health and change their practice of personal and home hygiene, concurrently with the WSS programmes.
• Given the present situation in SEAR countries and India in respect of water, sanitation and hygiene at home water alone can go only part of the way in achieving the basic objective of improving the health status of the community. It would largely depend on the implementation of an integrated strategy aimed at improving water quality and availability and sanitation along with improving hygiene practice at home through changes in attitudes and higher levels of health education. Almost all water-borne water-based and water-washed diseases are spread through exposure of food and drinking water to human faeces. Hence the rate of infection and cross-infection could be reduced by safe disposal of waste, as well as, home hygiene practices, safety and quality of food and drinking water and availability of adequate quantity of water for personal hygiene. The most critical issue could be the promotion of hand washing with soap before eating and before feeding children, and after defecation~ which might prevent 40 to 50% of faecal oral infections. Supply of high quality water would be of little help if the same is contaminated because of unhygienic practices at home. On the other hand improvements in hygiene behavior of a community cannot be sustained without concurrent improvement in the quality of community water supply and environmental sanitation.
- 156 -
Institutional Issues: India Scenario
(a) Key Problem Areas and Basic Maladies
(i) Absence of a core sector of environmental health within the department of
health including experts with skills in environmental epidemiology, environmental health policy and socio-ecological sciences.
(ii) Lack of appropriate legislations related to environment and health. (iii) Lack of information on environmental epidemiological aspects and
environmental health impacts in the country related to air, water, soil, shelter and ecology.
(iv) Lack of training and orientation of the health professionals as well as
engineering and development professionals towards the issues related to environmental health.
(v) Lack of effective mechanism for inter and intra- sectoral collaboration
between the Dept. of Heath and other social, economic and infrastructural development departments.
(vi) Lack of public awareness and understanding and risk perception and
communication strategies for risk abatements.
(b) Key Recommendation for Action Plan to Capacitate Dept. of Health and Other Related Depts.
• Strengthening DOH to support decision making for Environmental health protection.
(i) Development of a core team on environmental health within the
department of Health (either a separate cell or a strengthening of Public Health); including team members with skills in environmental epidemiology; environmental health policy; and social and ecological sciences who will develop intra-departmental skills and will interact with other agencies. Initially starting with a review and situational analysis of current MOH/MOEF institutional capacity and inter-sectoral co-ordination mechanism.
• Development of Appropriate Legislations
(i) Development of legislation related to environment and health. Initially
beginning with a systematic review of existing legislation related to environmental health and possibly leading to development of linked environmental monitoring and health protection legislation.
(ii) Development of public awareness programmes through improved
understanding of risk perception and development of risk communication strategies.
- 157 -
• Strengthening information systems for decision-making
(i) Development of a programme of priority epidemiological research on environmental health impacts in the country related to air, water, soil, shelter and ecology, in order to create understanding of priority problems.
(ii) Development of a systematic database on the distribution (spatial, social,
demographic) of preventable environmental-related diseases of major public health significance, in order to prioritize environmental interventions to areas and groups in greatest need.
(iii) Development of a systematic database on trends in environmental health
problems in order to monitor and guide long and short term development decisions and develop an early warning system.
(iv) Development of routine environmental health monitoring systems, initially
through pilot projects for linkage between environment and health data sets in order to assess regularly and improve the quality of existing data sets for estimation of environmental health impacts.
• Strengthen Training in and Orientation towards environmental health
(i) Develop programme of in-service training/awareness-raising on
environmental health priorities and policy for multiple audiences (medical officers; panchayat leaders; NGOs; GBOs)
(ii) Review and strengthen degree and P.G. level educational curricula related
to environmental health monitoring and management (e.g in medicine; public health engineering; urban planning).
(iii) Develop programme of training in environmental health policy in order to develop expertise in environmental epidemiology and policy in the country.
• Strengthen mechanism for Inter and Intra Collaboration
(i) Development of environment and health monitoring and action projects,
initially through pilot projects in order to guide joint decision making processes (for example water - sanitation and Health at PHC at Panchayat level).
(ii) Development of opportunities for convergence between environment and
health initiatives within the state. Specifically beginning with a systematic institutional review of inter-institution and programme collaborative processes.
REFERENCES
WHO STUDY ON “DISEASE BURDEN DUE TO INADEQUATE WATER & SANITATION FACILITIES IN INDIA”
Sl. No. Name of the Document
Estimating the Burden of Disease from Water, Sanitation and Hygiene at a Global Level 1
WHO, Evidence, Information and Policy, 2000
2 Making Sustainable Commitments —An Environment Strategy for the World Bank, Annex C: Environment and Health
3 PPT of Prof. K. J. Nath, Planning Meeting, 21st July, 2006 4 UNESCO World Water Assessment Programme 6 Overview Paper on Water for Sustainable Development in Asia and the Pacific 8 UNDP Global Annual Report 2006 9 Global Water Supply and Sanitation Assessment 2000 Report
10 WHO, Facts & Figures
11 The Role of Ministries of Health in reducing Disease Burden to Water, Sanitation and Hygiene related illness [This document might be useful while analyzing for the institutional arrangement for the WHO Study]
12 Overview Paper on Water for Sustainable Development in Asia and the Pacific 13 Planning Commission Report, 2001 14 India: Assessment 2002: Water Supply and Sanitation: A WHO UNICEF Sponsored Study 15 Presentation of Diptarup Kahali, Planning Meeting, 21st July, 2007 16 Indian Business Allaince of Water 17 Bridging the Gap, World Bank 2006 18 10 Five-Yr. Plan, GOI 19 Chapter-5, MoH&FW 20 ICMR Report 21 Health Status Indicators, GOI
22 Epidemiological, microbiological & electron microscopic study of a cholera outbreak in a Kolkata slum community, Data collected from the searching of the General Web Sites
23 Health Status Indicators, GOI India: Assessment 2002: Water Supply and Sanitation: A WHO UNICEF Sponsored Study
24 Table: Taken from the “Revised Project Proposal on Fluorosis” – Kahali knows the reference.
25 Chapter-2.8: Health 26 MoH&FW 27 Chapter-2.9: Health 28 Global Health: Challenges in Improving Infectious Disease Surveillance System, WHO 29 Using Climate to Predict Infectious Disease Outbreaks: A Review, WHO 30 Climate Change and Human Health-Risks and Responses – WHO WMO UNEP 31 Public Health in India Five Decades- Published by AIIH&PH, Vol-1
WEB SITES VISITED FOR DESK RESEARCH
1. WHO 2. World Bank 3. Global Environment Outlook 4. Health, Body and Mind 5. WSP/ World Bank 6. Planning Commission GOI 7. ADB 8. UNDP 9. Institute of Global Environmental Strategies 10. WEDC 11. GAO 12. Department of Community, Occupational & Family Medicine 13. American Journal of Epidemiology 14. International Epidemiological association 15. MoH&FW, GOI 16. Department of Health, MoH&FW, GOI 17. Department of Economics, Gulbarga University Gulbarga, Karnataka, 18. Flood relief Organisation 19. Indian Journal of Medicine 20. International Program, National Council for Science and the Environment 21. Literature searched via Google on <individual disease epidemic>, <solution
exchange>, CPHEEO, NICED, NICD, <epidemic based disease> as suggested on 21st July, 2006 workshop.
22. Visited web sites of the concerned boards/agencies of the 6 cities and 10 states.
DISEASE BURDEN DUE TO INADEQUATE WATER SUPPLY AND SANITATION
List of Resource Materials Attachment
No. Name of the Article/Document Author Published By
(Year of Publication) 1 CSE Draft Dossier: Health and Environment –
Overviews. The Environment and Poverty Burden of Disease
- CSE
2 Estimating the Burden of Disease from Water, Sanitation and Hygiene at a Global Level
Annette Pruss, David Kay, Lorna Fewtrell and Jamie Bartram
WHO, Protection of the Human Environment, Geneva; Centre for Research into Environment and Health, University of Wales, UK
3 Water Supply, Sanitation and Hygiene Promotion, Chapter 41
Sandy Cairncross and Vivian Valdmanis
-
4 Disease Control Priorities Project, Working Paper No. 28, Water Supply, Sanitation and Hygiene Promotion
Sandy Cairncross and Vivian Valdmanis
World Bank (July, 2004)
5 Emerging Issues in Water and Infectious Disease
- WHO (2003)
6 Health: Burden of diseases - GEO: Global Environment Outlook 3
7 Contaminated water: A hazard to humanity - By Sajid Hussain in Health, Body and Mind Web Page
8 World Water Day 2001: Sanitation: Controlling Problems at Source
- WHO (May, 2002)
9 The Case for Water and Sanitation – Better Water and Sanitation Make Good Fiscal and Economic Sense, and should be Prominent in PRSPs and Budget Allocations
- WSP/ World Bank
10
India – Water Supply & Sanitation: Bridging the Gap between Infrastructure and Service – Executive Summary
- World Bank (Nov, 2004)
11 Fluorosis management programme in India - A. K. Susheela
12 Water, sanitation and hygiene links to health
- WHO (2006)
13 India: Assessment 2002: Water Supply and Sanitation: A WHO UNICEF Sponsored Study
- Planning Commission GOI (2002)
14 Minimum Standards in Water Supply, Sanitation and Hygiene Promotion, Humanitarian Charter and Minimum Standards
- WHO
15 Rural Infrastructure Indicators in Cambodia, Lao PDR and Mongolia
Philip Lam and Daniel Hoornweg
World Bank (June 2003)
16 The Role of Ministries of Health in reducing Disease Burden to Water, Sanitation and Hygiene related illness [This document might be useful while analyzing for the institutional arrangement for the WHO Study]
- WHO (2001)
17 Water and sanitation related diseases fact sheets
- WHO Web Site (2206)
18 Global Coverage Rural Sanitation - ADB 19 FINAL REPORT: Regional Implementation
Meeting on Water, Sanitation and Human Settlements for Asia and the Pacific, Bangkok, Thailand
- WHO (Oct 2003)
20 UNDP Global Annual Report 2006 - UNDP (2006) 21 Water, Sanitation and Hygiene Links to
Health: Facts and Figures - WHO
22 Facts and Figures on Water and Health - WHO (April, 2006) 23 Water and sanitation: The targets and
challenges Alex Vass studentbmj.com (April, 2003)
24 Overview Paper on Water for Sustainable Development in Asia and the Pacific
Yatsuka Kataoka Institute of Global Environmental Strategies (January, 2002)
25 Making Sustainable Commitments —An Environment Strategy for the World Bank, Annex C: Environment and Health
- World Bank
26 WELL FACTSHEET: Some global statistics for water and sanitation related disease
By Sarah Parry-Jones and
Pete Kolsky
WEDC (June 2005)
27 Country Health Profile India WHO 28 Country Cooperation Strategy India WHO 29 WSS Global Coverage ADB 30 Global Health: Challenges in Improving
Infectious Disease Surveillance System - GAO August 2001
31 Demographic and Epidemiological Transitions in Asia: Towards a Comparative Study of National Health Policies in Responding to Emerging Infectious Diseases
PHUA Kai Hong Department of Community, Occupational & Family Medicine
32 Indian vultures: victims of an infectious disease epidemic?
A. A. Cunningham, V. Prakash, D. Pain, G. R. Ghalsasi, G. A. H. Wells, G. N. Kolte, P. Nighot, M. S. Goudar, S. Kshirsagar and A. Rahmani
33 Laboratory Methods for the Diagnosis of Epidemic Dysentery and Cholera
- WHO (1999)
34 Effect of Early Patient Enrollment on the Time to Completion and Publication of Randomized Controlled Trials
Anna-Bettina Haidich and John P. A. Ioannidis
American Journal of Epidemiology
35 Can we individualize the number needed to treat?
- International Epidemeological association (2002)
36 Using Climate to Predict - WHO (2004)
Infectious Disease Outbreaks: A Review
37 Organizational Structure, Health Services in India
- MoH&FW, GOI
38 Health Policy - Department of Health, MoH&FW, GOI
39 Communicable Disease Bulletin - WHO & NICD
40 Tsunami and Health - WHO (Jan 2005) 41 Evolving a health caring water supply and
sanitation system- public-private partnerships in a developing economy
Prof. Chaya K. Degaonkar
Department of Economics, Gulbarga University Gulbarga, Karnataka,
42 Super cyclone in Orissa - Flood relief.org (1999) 43 Global Cholera pandemic Nevondo TS and
Cloete TE University of Pretoria, Pretoria, SA
44 Epidemiological, microbiological & electron microscopic study of a cholera outbreak in a Kolkata slum community
Dipika Sur, B.L. Sarkar, B. Manna, J. Deen, S. Datta, S.K. Niyogi, A.N. Ghosh, A. Deb, S. Kanungo
A. Palit & S.K. Bhattacharya
Indian J Med (Jan 2006)
45 Serious Environmental and Public Health Impacts of Water Related Diseases and Lack of Sanitation on Adults and Children: A Brief Summary
A. Karim Ahmed International Program, National Council for Science and the Environment, Washington, DC (2006)
ADDITIOAL MATERIALS THAT WERE ALSO CONSULTED
Sl. No. Name of the Article/Document Author Published By (Year of Publication)
1 CSE Draft Dossier: Health and Environment – Overviews. The Environment and Poverty Burden of Disease
- CSE
2 Estimating the Burden of Disease from Water, Sanitation and Hygiene at a Global Level
Annette Pruss, David Kay, Lorna Fewtrell and Jamie Bartram
WHO, Protection of the Human Environment, Geneva; Centre for Research into Environment and Health, University of Wales, UK
3 Water Supply, Sanitation and Hygiene Promotion, Chapter 41
Sandy Cairncross and Vivian Valdmanis
-
4 Disease Control Priorities Project, Working Paper No. 28, Water Supply, Sanitation and Hygiene Promotion
Sandy Cairncross and Vivian Valdmanis
World Bank (July, 2004)
5 Emerging Issues in Water and Infectious Disease
- WHO (2003)
Sl. No. Name of the Article/Document Author Published By (Year of Publication)
6 Health: Burden of diseases - GEO: Global Environment Outlook 3
7 Contaminated water: A hazard to humanity
- By Sajid Hussain in Health, Body and Mind Web Page
8 World Water Day 2001: Sanitation: Controlling Problems at Source
- WHO (May, 2002)
9 The Case for Water and Sanitation – Better Water and Sanitation Make Good Fiscal and Economic Sense, and should be Prominent in PRSPs and Budget Allocations
- WSP/ World Bank
10
India – Water Supply & Sanitation: Bridging the Gap between Infrastructure and Service – Executive Summary
- World Bank (Nov, 2004)
11 Fluorosis management programme in India
- A. K. Susheela
12 Water, sanitation and hygiene links to health
- WHO (2006)
13 India: Assessment 2002: Water Supply and Sanitation: A WHO UNICEF Sponsored Study
- Planning Commission GOI (2002)
14 Minimum Standards in Water Supply, Sanitation and Hygiene Promotion, Humanitarian Charter and Minimum Standards
- WHO
15 Rural Infrastructure Indicators in Cambodia, Lao PDR and Mongolia
Philip Lam and Daniel Hoornweg
World Bank (June 2003)
16 The Role of Ministries of Health in reducing Disease Burden to Water, Sanitation and Hygiene related illness [This document might be useful while analyzing for the institutional arrangement for the WHO Study]
- WHO (2001)
17 Water and sanitation related diseases fact sheets
- WHO Web Site (2206)
18 Global Coverage Rural Sanitation - ADB 19 FINAL REPORT: Regional
Implementation Meeting on Water, Sanitation and Human Settlements for Asia and the Pacific, Bangkok, Thailand
- WHO (Oct 2003)
Sl. No. Name of the Article/Document Author Published By (Year of Publication)
20 UNDP Global Annual Report 2006 - UNDP (2006) 21 Water, Sanitation and Hygiene Links to
Health: Facts and Figures - WHO
22 Facts and Figures on Water and Health - WHO (April, 2006) 23 Water and sanitation: The targets and
challenges Alex Vass studentbmj.com (April,
2003) 24 Overview Paper on Water for Sustainable
Development in Asia and the Pacific Yatsuka Kataoka Institute of Global
Environmental Strategies (January, 2002)
25 Making Sustainable Commitments —An Environment Strategy for the World Bank, Annex C: Environment and Health
- World Bank
26 WELL FACTSHEET: Some global statistics for water and sanitation related disease
By Sarah Parry-Jones and
Pete Kolsky
WEDC (June 2005)
27 Country Health Profile India WHO 28 Country Cooperation Strategy India WHO 29 WSS Global Coverage ADB 30 Global Health: Challenges in Improving
Infectious Disease Surveillance System - GAO August 2001
31 Demographic and Epidemiological Transitions in Asia: Towards a Comparative Study of National Health Policies in Responding to Emerging Infectious Diseases
PHUA Kai Hong Department of Community, Occupational & Family Medicine
32 Indian vultures: victims of an infectious disease epidemic?
A. A. Cunningham, V. Prakash, D. Pain, G. R. Ghalsasi, G. A. H. Wells, G. N. Kolte, P. Nighot, M. S. Goudar, S. Kshirsagar and A. Rahmani
33 Laboratory Methods for the Diagnosis of Epidemic Dysentery and Cholera
- WHO (1999)
34 Effect of Early Patient Enrollment on the Time to Completion and Publication of Randomized Controlled Trials
Anna-Bettina Haidich and John P. A. Ioannidis
American Journal of Epidemiology
35 Can we individualize the number needed to treat?
- International Epidemiological Association
Sl. No. Name of the Article/Document Author Published By (Year of Publication)
(2002) 36 Using Climate to Predict
Infectious Disease Outbreaks: A Review
- WHO (2004)
37 Organizational Structure, Health Services in India
- MoH&FW, GOI
38 Health Policy - Department of Health, MoH&FW, GOI
39 Communicable Disease Bulletin - WHO & NICD 40 Tsunami and Health - WHO (Jan 2005) 41 Evolving a health caring water supply and
sanitation system- public-private partnerships in a developing economy
Prof. Chaya K. Degaonkar
Department of Economics, Gulbarga University Gulbarga, Karnataka,
42 Super cyclone in Orissa - Flood relief.org (1999) 43 Global Cholera pandemic Nevondo TS and
Cloete TE University of Pretoria, Pretoria, SA
44 Epidemiological, microbiological & electron microscopic study of a cholera outbreak in a Kolkata slum community
Dipika Sur, B.L. Sarkar, B. Manna, J. Deen, S. Datta, S.K. Niyogi, A.N. Ghosh, A. Deb, S. Kanungo
A. Palit & S.K. Bhattacharya
Indian J Med (Jan 2006)
45 Serious Environmental and Public Health Impacts of Water Related Diseases and Lack of Sanitation on Adults and Children: A Brief Summary
A. Karim Ahmed International Program, National Council for Science and the Environment, Washington, DC (2006)
REFERENCES
1. Henry Briones, Santanu Lahiri and Ishbaljir Battulga, The Manual on Promotion of Hygiene and
Sanitation in Ger Areas, Mongolia, Community-led Infrastructure Development Project, Project Management Unit of the Second Ulaanbaatar Services Improvement, City of Ulaanbaatar, Mongolia, January 2006
2. R Franceys, J Pickford & R Reed, A guide to the development of on-site sanitation. 3. Kathleen Shordt, Christine van Wijk and François Brikké, Monitoring Millennium Development
Goals, IRC International Water and Sanitation Centre, April 2004 4. Sandy Cairncross and Vivian Valdmanis, Water Supply, Sanitation, and Hygiene Promotion,
Working Paper No. 28 [The Disease Control Priorities Project is a joint effort of The World Bank, the Fogarty International Center of the National Institutes of Health, the Bill & Melinda Gates Foundation, and the World Health Organization], July 2004.
5. Annette Prüss, David Kay, Lorna Fewtrell and Jamie Bartram, Estimating the Burden of Disease from
Water, Sanitation, and Hygiene at a Global Level, World Health Organization, Protection of the Human Environment, Geneva, Switzerland; Centre for Research into Environment and Health, University of Wales, Aberystwyth, Ceredigion, Wales, United Kingdom, Environment Health Perspectives, Volume 110, Number 5, May, 2002.
6. World Bank Health-Nutrition-Population web site: www.worldbank.org/hnp 7. WHO Fact Sheet, WHO Web Site, 2006. 8. Susmita Dasgupta, Uwe Deichmann, Craig Meisner and David Wheeler, The Poverty-Environment
Nexus in Cambodia, Lao PDR and Mongolia, DECRG, World Bank, October, 2002 9. Web Site: <http://india.gov.in/knowindia/profile.php> 10. Country Cooperation Strategy - India, WHO, Version 9, November 2000 11. India: Assessment 2002 – Water & Sanitation, Planning Commission, Government of India. 12. Tenth Five Year Plan Report Health, Planning Commission, Government of India. 13. Guidelines for the Surveillance and Control of Drinking Water Quality, WHO (?)
Study Objectives
Summarized the mini-assessment of the disease burden due to improper hygiene awareness, followed by inadequate supply of safe drinking water and provision of proper sanitation facilities in India, with highlighting the approximate status of disease burden in some of the major states and cities in India.
Scope of work of the Study
The Study is supposed to carry out:-
Intensive desk-research and internet-research to identify potential case studies.
Interaction and feedback from resource institutions, such as, NICD, NICED (ICMR), NIE (Chennai), AIIH&PH, NIOH (ICMR), WHO,UNICEF, WSP (World Bank).
Macro-level study on data obtained from regions and cities on health and environmental quality related to water supply and sanitation.
Review Workshop at New Delhi.
Presentation of the findings to the participants from Resource Institutions and other stakeholders.
Preparation of Report on:-
Water-Sanitation-Health Linkage
Institutional Review & Recommendations for Ministry of Health, Government of India.
Materials and Methods
Database
Following database has been consulted in preparation of the report:-
The data obtained are from existing reports published and/or web pages posted in the web sites by various national and international agencies.
Direct consultation with concerned stakeholders
Comments made or information received by participants attended during various formal and informal meetings.
Study Methodology
Write-ups, Papers and articles published by various agencies either located in the e-library or different journals.
The Study Team is expected to:
Carry out desk research – both from existing reports and web sites related to environmental quality and community health status with special emphasis on lack of safe water and sanitation and hygiene behaviour and diseases caused due to the same.
y the existing gaps. Consultations with selected stakeholders to identif
ther institutions to assess the problem related to environmental health with special emphasis on water and sanitation facilities in the country.
Discuss with various stakeholders including research agencies and o
Analyze the roles of various ministries in the water and sanitation sector and suggest the coordination mechanism with MoH&FW.
the initial findings establish co-relation between health indicators, water and sanitation Based onfacilities.
various regions and states may also be included. A comparative study between
A comparative study amongst the situation in urban slums and rural areas may be brought in to establish the linkages between health issues and water and sanitation facilities.
Conduct Consultation Meetings to share and validate the initial findings and consolidate the lessons
Stu
and other concerned partners, some selection criteria were planned for the study to select the numbers of d ers of states and cities for the study in response of limited resources and time to complete this initial phase.
adopted to select the diseases are:-
ossible chances of scaling-up.
The main crit to select the States and Cites are:-
s more priority for
aling-up.
• dequate water supply, sanitation and poor hygiene practices.
Variab
There a on of eople from rural to urban set-up, high existence of poverty and so on, which might be having impact on
se linkages in this report. However, the constraints to identify ight be considered in future when a bigger
learned.
dy Areas
On the basis of preliminary discussion held on 21st July, 2006 between the Study Team members, WHO
iseases, numb
Therefore, the study mainly focused on five diseases that are occurring in five states and five cities in India and on the basis of that prepare this summarized report.
The main criteria
• The scale of epidemic of the disease – if it has bigger impact it receives more priority for selection.
• The continuous presence of the disease and p
• The direct relation with inadequate water supply, sanitation and poor hygiene practices.
eria adopted
• The scale of epidemic of the disease – if it has bigger impact it receiveselection.
• The continuous presence of the disease and possible chances of sc
• Regional variations and main metropolitan cities in India.
The direct relation with ina
le considered, analysis and validation of data
re various variables, such as, seasonal variation, variation due to natural calamities, migratipburden of diseases. An attempt has been made to explore the
these linkages are also highlighted that mscale of study will initiate.


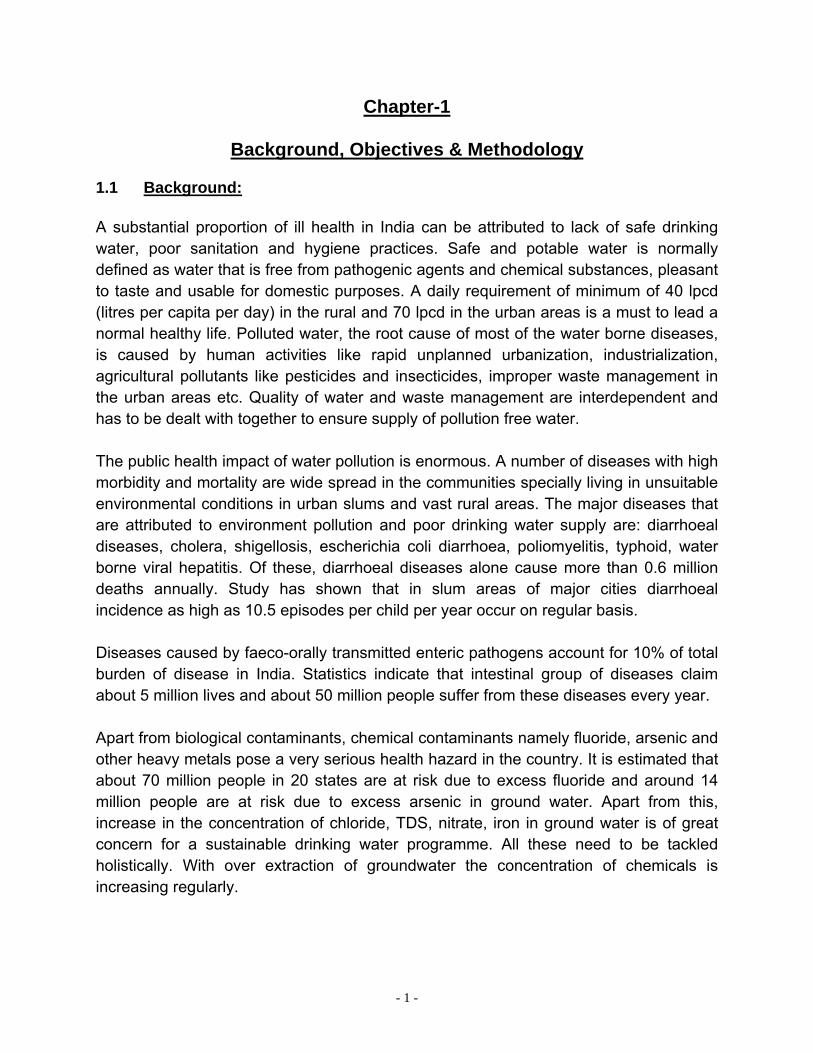


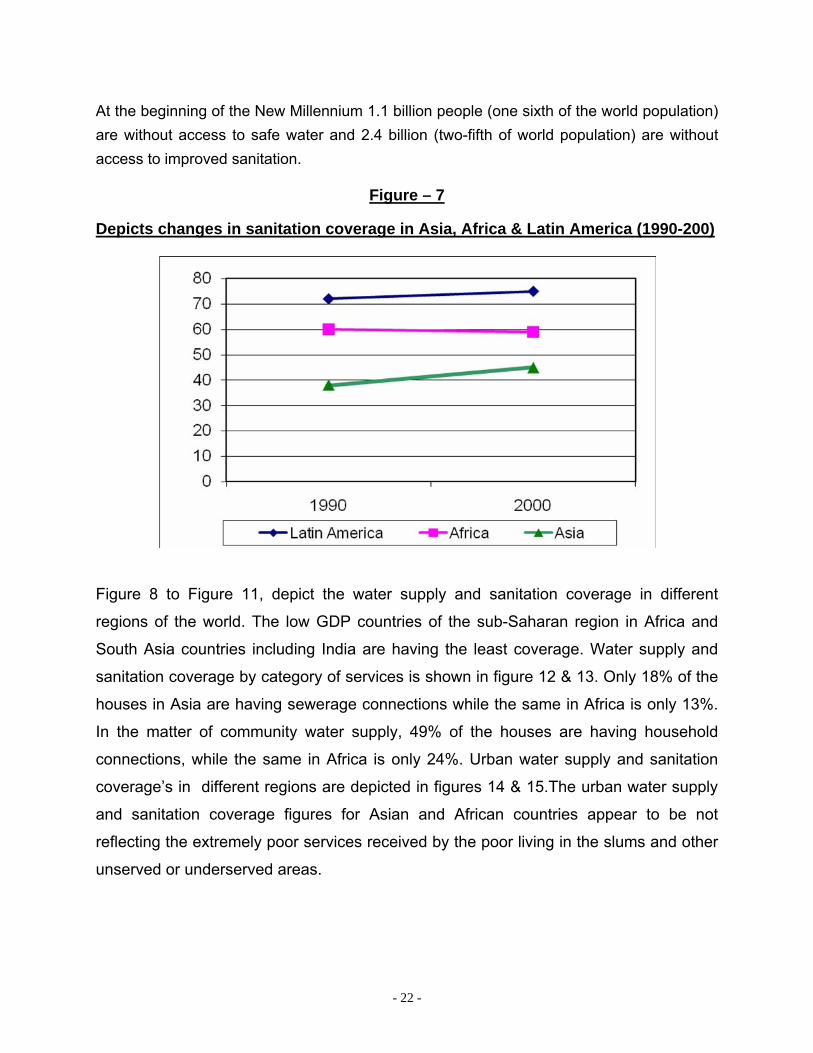


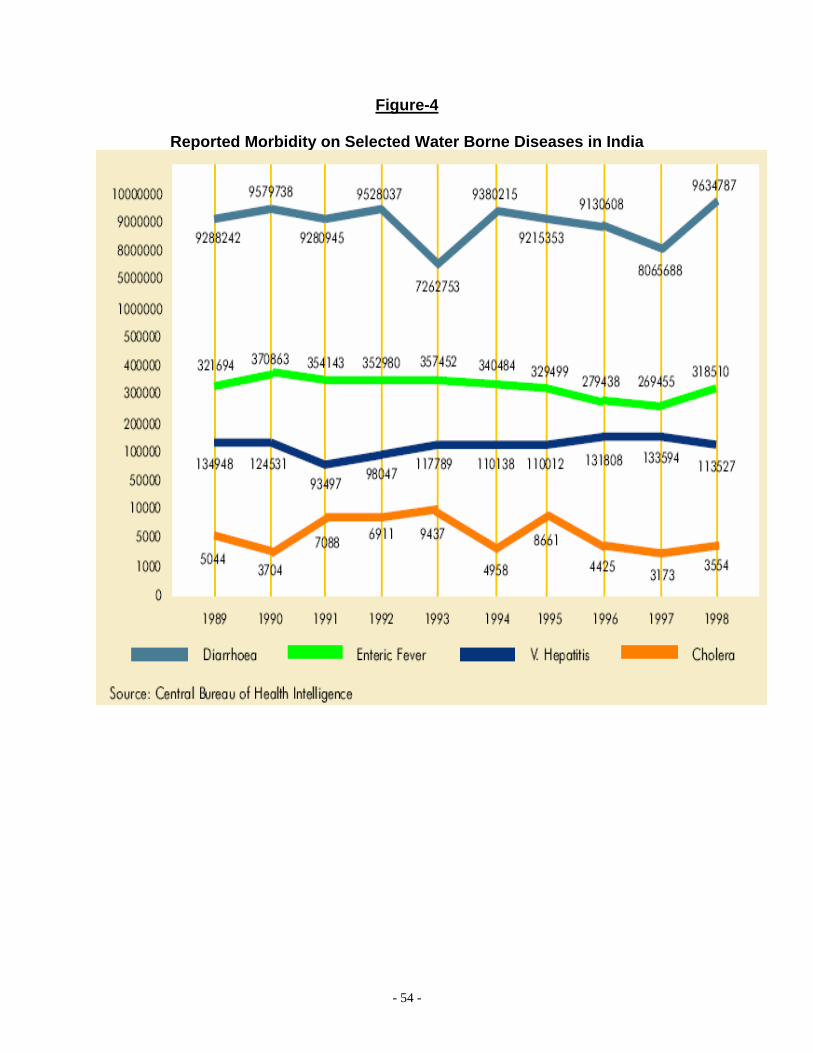


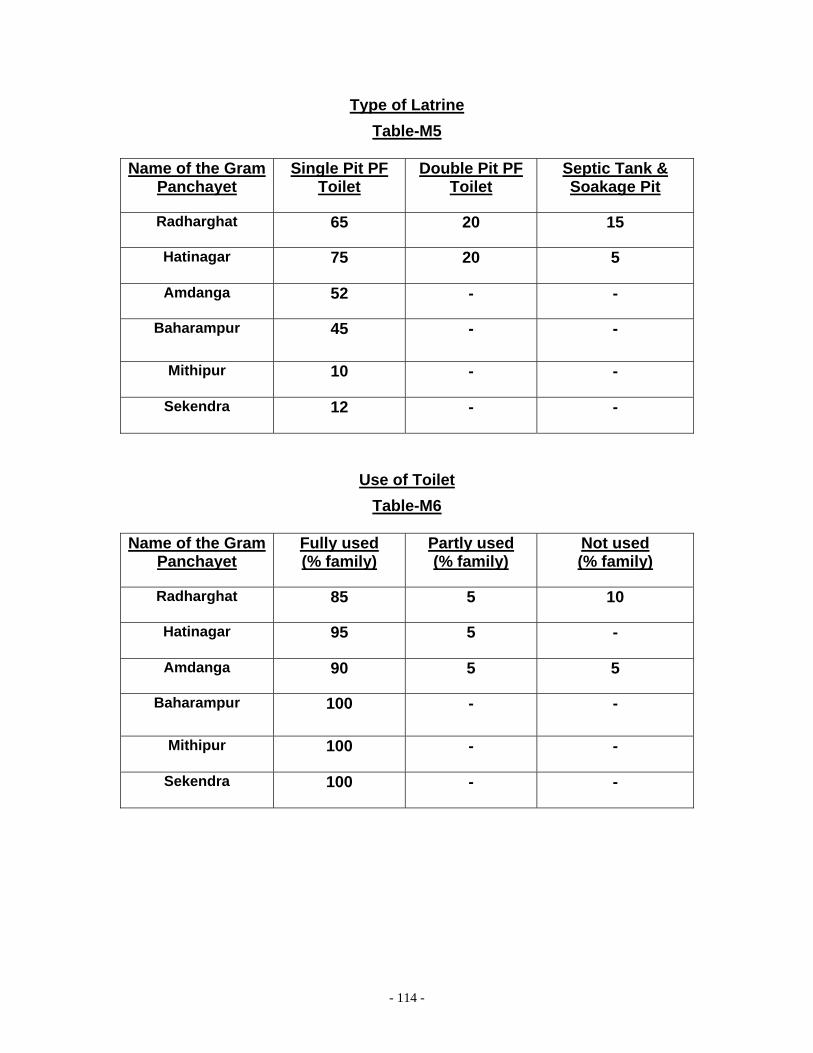


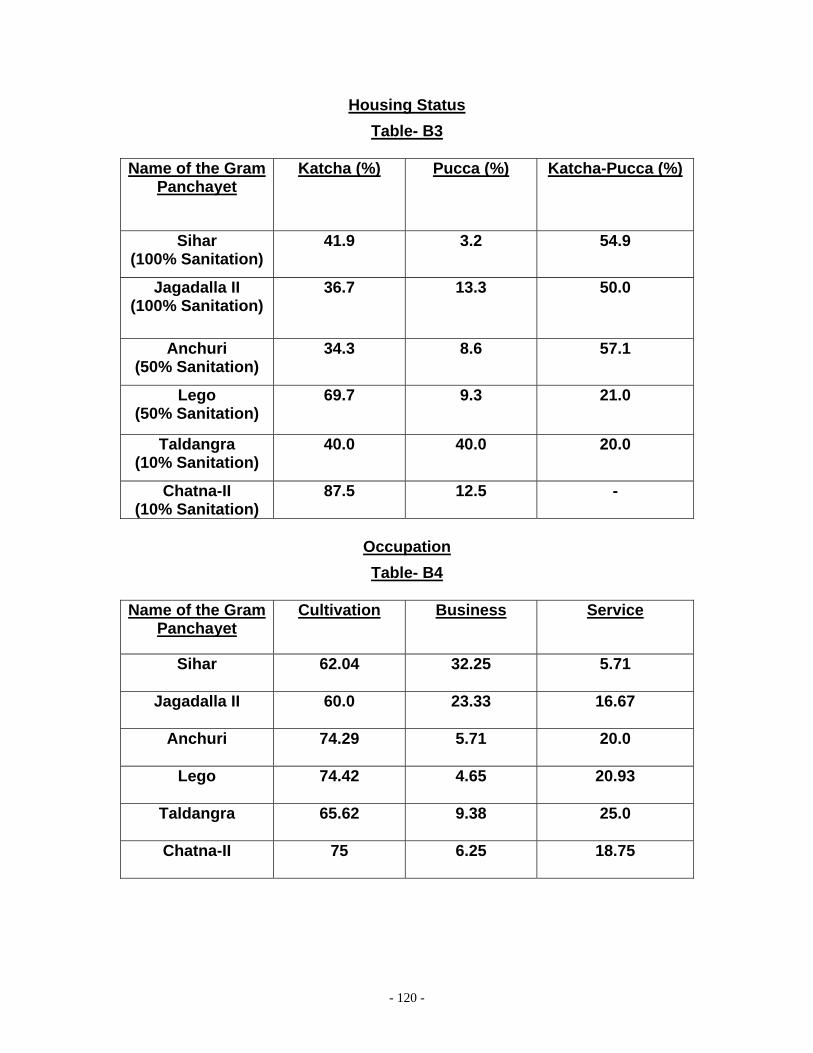


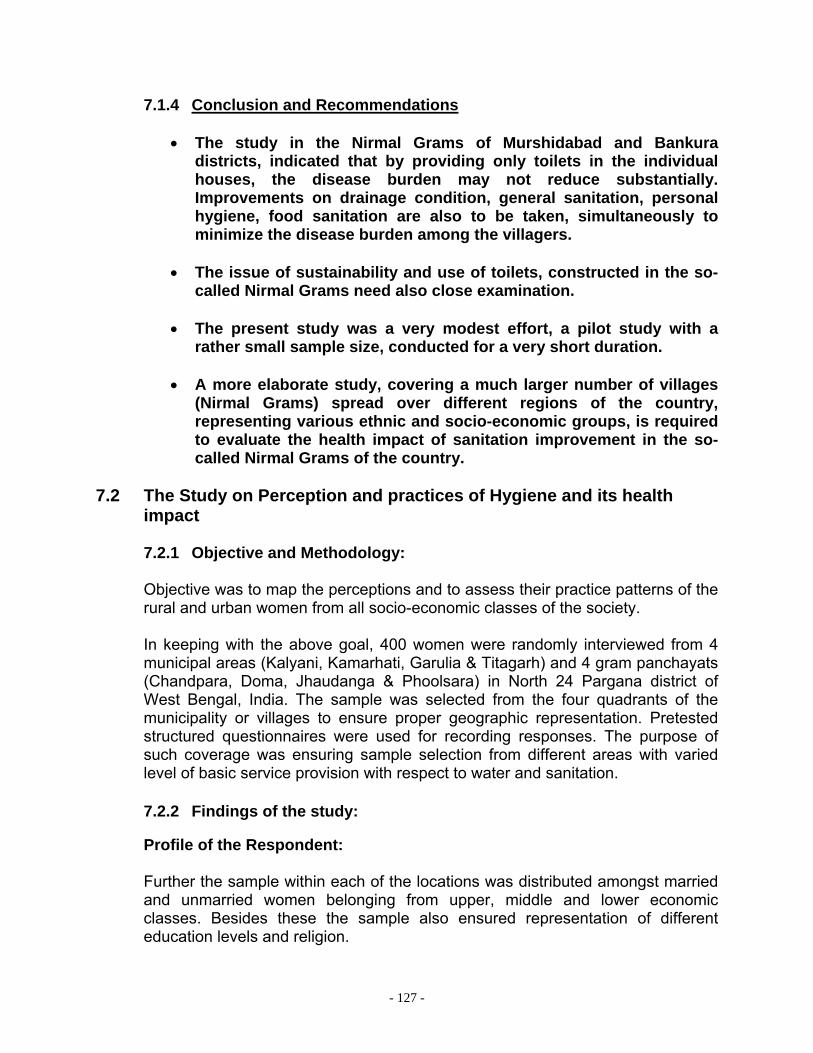


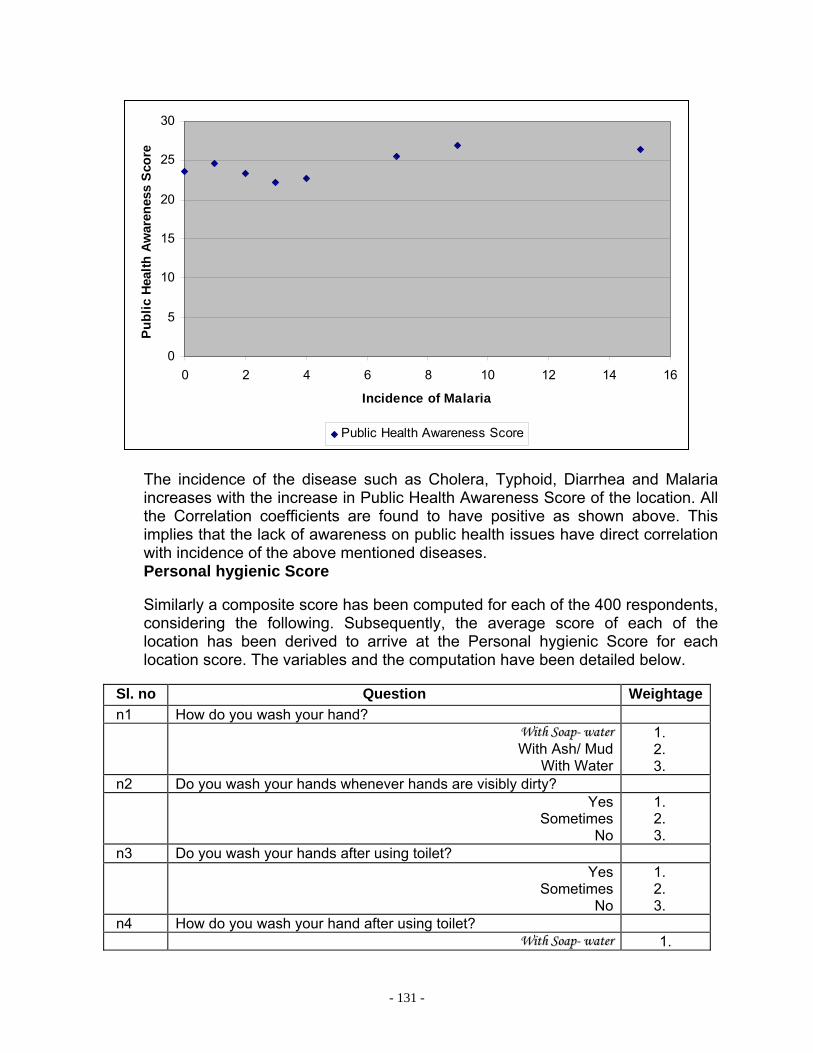


![Water,Sanitation,andHygieneServiceAvailabilityatRural ... · inadequate water supply and sanitation [3]. Inadequate drinking water, sanitation, and hygiene in nonhousehold settings,](https://static.documents.pub/doc/80x56/5e81efd69f9e151ba6551f5b/watersanitationandhygieneserviceavailabilityatrural-inadequate-water-supply.jpg)