University of Nebraska - Lincoln DigitalCommons@University of Nebraska - Lincoln Journal of Actuarial Practice 1993-2006 Finance Department 1994 Disenrollment Paerns of Elderly in Managed Care and Fee for Service Kenneth G. Manton Duke University, [email protected]Dennis H. Tolley Brigham Young University, [email protected]Robert Newcomer University of California-San Francisco James C. Vertrees Duke University Charlene Harrington University of California-San Francisco Follow this and additional works at: hp://digitalcommons.unl.edu/joap Part of the Accounting Commons , Business Administration, Management, and Operations Commons , Corporate Finance Commons , Finance and Financial Management Commons , Insurance Commons , and the Management Sciences and Quantitative Methods Commons is Article is brought to you for free and open access by the Finance Department at DigitalCommons@University of Nebraska - Lincoln. It has been accepted for inclusion in Journal of Actuarial Practice 1993-2006 by an authorized administrator of DigitalCommons@University of Nebraska - Lincoln. Manton, Kenneth G.; Tolley, Dennis H.; Newcomer, Robert; Vertrees, James C.; and Harrington, Charlene, "Disenrollment Paerns of Elderly in Managed Care and Fee for Service" (1994). Journal of Actuarial Practice 1993-2006. 143. hp://digitalcommons.unl.edu/joap/143
Transcript
University of Nebraska - LincolnDigitalCommons@University of Nebraska - Lincoln
Journal of Actuarial Practice 1993-2006 Finance Department
1994
Disenrollment Patterns of Elderly in Managed Careand Fee for ServiceKenneth G. MantonDuke University, [email protected]
Robert NewcomerUniversity of California-San Francisco
James C. VertreesDuke University
Charlene HarringtonUniversity of California-San Francisco
Follow this and additional works at: http://digitalcommons.unl.edu/joap
Part of the Accounting Commons, Business Administration, Management, and OperationsCommons, Corporate Finance Commons, Finance and Financial Management Commons, InsuranceCommons, and the Management Sciences and Quantitative Methods Commons
This Article is brought to you for free and open access by the Finance Department at DigitalCommons@University of Nebraska - Lincoln. It has beenaccepted for inclusion in Journal of Actuarial Practice 1993-2006 by an authorized administrator of DigitalCommons@University of Nebraska -Lincoln.
Manton, Kenneth G.; Tolley, Dennis H.; Newcomer, Robert; Vertrees, James C.; and Harrington, Charlene, "Disenrollment Patterns ofElderly in Managed Care and Fee for Service" (1994). Journal of Actuarial Practice 1993-2006. 143.http://digitalcommons.unl.edu/joap/143
Disenrollment Patterns of Elderly in Managed Care and Fee for Service
Kenneth G. Manton,* H. Dennis Tolley,t Robert Newcomer,* James C. Vertrees,§ and Charlene Harrington~
Abstract
As the trend to provide health care through managed care facilities increases, the need to examine ,vhy insured individuals voluntarily terminate managed care coverage grows. Voluntary termination of coverage, or dis enrollment, has both social and fiscal implications. Particularly among the elderly, patterns of disenrollment likely are related to self assessment of care needs and levels of health. In this paper we examine the patterns of dis enrollment among elderly enrollees as a function of health status and disability. We focus on disenrollment patterns from an experimental prepaid extended care facility, called a social HMO (S/HMO) and compare this pattern with dis enrollment
*Kenneth G. Manton, Ph.D., is Research Professor and Research Director of Demographic Studies at Duke University, and lVfedical Research Professor at Duke University Medical Center's Department of Community and Family Medicine. His research interests include (i) forecasting morbidity and mortality among the nation's elderly; and (ii) maintenance of both acute and long term care services consumed by the elderly.
Dr. Manton's address is: Center for Demographic Studies, Duke University, 2117 Campus Drive, PO Box 90408, Durham NC 27708-0408. Internet address: [email protected]
tHo Dennis Tolley, Ph.D., A.SA, is Professor of Statistics at Brigham Young University. Dr. Tolley's is currently active in analyses of data from mUltiple countries and the limits such data have in formulating forecasts of health scenarios.
Dr. Tolley's address is: 210 TMCB, Department of Statistics, Brigham Young University, Provo UT 84602. Internet address: [email protected]
*Mr. Newcomer's address is: Department of Social and Behaviorial Sciences, School of Nursing - N-631, University of California-San FranciSCO, San Francisco <;.:A 94143.
§ James Vertrees, Ph.D., is Senior Fellow at the Duke University Center for Demographic Studies as well as President of SOLON Consulting Group, Ltd., a private health care evaluation, computer and management consulting firm.
Dr. Vertrees' address is: Solon Consulting Group Ltd., 12501 Prosperity Drive, Suite 150, Silver Spring MD 20904.
~Ms. Harrington's address is: Department of Social and Behaviorial Sciences, School of Nursing - N-631, University of California-San FranciSCO, San Francisco CA 94143.
171
172 Journal of Actuarial Practice, Vol. 2, No.2, 1994
within a sample of HMO enrollees and with a fee for service sample. The analysis is based on a frailty index defined using a fuzzy set model. The results indicate that bias in the enrollment process is exacerbated by disenrollment patterns that depend on the level of frailty and disability. Those with a greater degree of disability and chronic illness tend to disenroll into the fee for service coverage. Healthier persons, on the other hand, have a lower likelihood of disenrollment. This suggests that managed care is not providing for the needs of the patients most in need of care.
Key words and phrases: fuzzy set, health care, health maintenance organization (HMO), Medicare
1 Introduction
This paper presents an analysis of patterns of voluntary termination of coverage among individuals enrolled in an experimental managed care environment and compares these patterns with those enrolled in health maintenance organizations (HMOs) and those covered under fee for service (FFS). Voluntary termination of coverage, or dis enrollment, can result in fortuitous gains or unexpected losses if those disenrolling are more or less healthy and/or disabled than the average of those covered. Differential likelihood of dis enrollment for individuals with differing levels of disability and health care need is considered a prime cause of deterioration in the claims experience for individual and small group coverages. The effects of differential dis enrollment among the enrollees of a managed care provider also can be significant. Although methods of formally recognizing and reserving for differential dis enrollment are not widespread, the trends toward increasing the role of managed care makes understanding the effects of dis enrollment on the profile of the enrollees essential.
It has been proposed that a major cause of dis enrollment under individual health coverage is the individual's ability to assess his or her own probability of making a claim. Those insureds who feel a greater degree of impairment, as measured by their own personal index, are thought to remain with a coverage plan, while those who feel little or no impairment will shop around for cheaper coverage or more extensive coverage for the same price (Bluhm, 1982). Under this model of personal optimization, claims experience deteriorates over and above any attenuation in the selection effect as the block of business matures and over any effect due to aging of the individuals covered. Many feel that accepting this model entails setting up a premium reserving system in
Manton et al.: Disenrollment Patterns 173
an effort to be equitable to the insureds. With no premium reserve, the model predicts increases in the net premium in excess of the increased costs due to aging and selection effects.
The fact that benefit selection can result in increased costs to the insurer is well identified in the literature. l Choice is also often present among those seeking coverage through an HMO or other managed care provider, whether they are seeking coverage as indiViduals, under a group arrangement by a large employer, or as a postretirement beneficiaries. Levels of satisfaction of care received from a managed care provider often are determined by convenience, accessibility, and quality of care. Personal satisfaction, level of insurance protection, and access to alternatives seem to playa primary role in decisions to change the type of coverage or the provider of coverage (Rossiter et al., 1989). Thus, individual choice may have an antiselection effect on managed care plans.
Several studies have found that enrollees who are classified as sicker than average also have a higher likelihood of dis enrolling from HMO coverage (Brown, 1988; Tucker and Langwell, 1989). Such a pattern effectively provides an ongoing selection process among the enrolled, returning those requiring more care to FFS coverage. The principal causes of dis enrollment from HMO coverage identified by these researchers are concern about physician competency, ability to maintain continuity of care, and inconvenience. In studies of the elderly, those Medicare clients switching plans from one HMO to another are found to be in better health than those returning to FFS coverage. The prime motivations for switching from one HMO provider to another are convenience and premium rates, motivations similar to those posited for switching FFS coverages in Bluhm's individual coverage model. (See also Pascoe, 1983 and Zastowny et al., 1983.)
In 1985 the Health Care Financing Administration (HCFA) began a demonstration of SOCial/health maintenance organizations (SjHMOs).2 The demonstration project consisted of four SjHMOs that would provide managed care for the elderly, offering both standard Medicare benefits (e.g., hospital and physician) and expanded Medicare benefits such as drugs, hearing aids, and glasses. Three sites offered dental benefits, though these were reduced or eliminated by 1987 due to high use. Thus, for most members, SjHMOs are high option HMOs offering basic and expanded benefits. Unique to SjHMOs is long-term care coverage (e.g.,
1 See Fuhrer and Shapiro (1992) for illustrations and references. 2Elderplan and SCAN Health Plan were started by long-term care providers. Seniors
Plus (Group Health and the Ebenezer Society) and Medicare Plus-II (Northwest KaiserPermanente) were high option plans in established HMOs (Newcomer et al., 1991).
174 Journal of Actuarial Practice, Vol. 2, No.2, 1994
nursing home care, homemaker care, and respite care) limited to $6,500 to $12,000 per annum (depending on the plan) for those who meet their state's Medicaid criteria for nursing home care. Because of the concern about adverse selection, SjHMOs were required by HCFA to screen applicants for health. Enrollment was designed to limit the number of enrollees initially qualifying for nursing home care to 5 percent. This resulted in a number of nursing home care applicants being placed on a waiting list for subsequent enrollment. Limiting the enrollment so that only 5 percent of individuals enrolled qualified for nursing home care combined with marketing and the perceived filtering effect of a required health assessment produced a healthier membership (Newcomer et al., 1990).
Harrington et al. (1991) and Newcomer et al. (1990, 1991) examine client satisfaction and its effect on SjHMO disenrollment. Previous research on staff and group Medicare HMOs has found that dis enrollment reinforces favorable enrollment bias to give the HMO an increasing advantage over FFS relative to health of the enrolled (Brown, 1988). In this paper we examine whether dis enrollment reinforces or counteracts the initial enrollment bias in the SjHMO. Samples of FFS and HMO members in the same locale were drawn at the beginning of the demonstration. All members in the SjHMO, FFS, and HMO samples were followed for three years. The experiences of these three samples are compared here to examine dis enrollment patterns associated with costs prior to, and health at, enrollment.
To assess the degree to which dis enrollment patterns are functions of poor health or disability, we generate a measure of case mix using the health and disability information obtained at enrollment. Because this information contains many variables, we summarize health and disability status into six sets. The health and disability status of each individual are indexed by a fuzzy grade of membership score3 with respect to each of these six sets (Manton, Woodbury, and Tolley 1994).
3Later on we will describe how these scores can be generated from the data obtained at enrollment. Actuaries can apply this method, provided the same assessment information described below is obtained for each individual enrolled. The overall pattern of the grade of membership scores block defines the case mix of the block.
Manton et al.: Disenrollment Patterns 175
2 Description of Samples Studied
2.1 Locations
The samples used in this paper consist of elderly (65 years and older) Medicare-eligible members from three different types of coverage: (i) S/HMO; (ii) TEFRA 4 HMO; and (iii) Medicare beneficiaries receiving care under FFS. The plans were in four communities:
• Elderplan (Brooklyn, New York);
• SCAN Health Plan (Long Beach, California);
• SeniorPlus (Minneapolis, Minnesota); and
• Medicare Plus-II (Portland, Oregon).
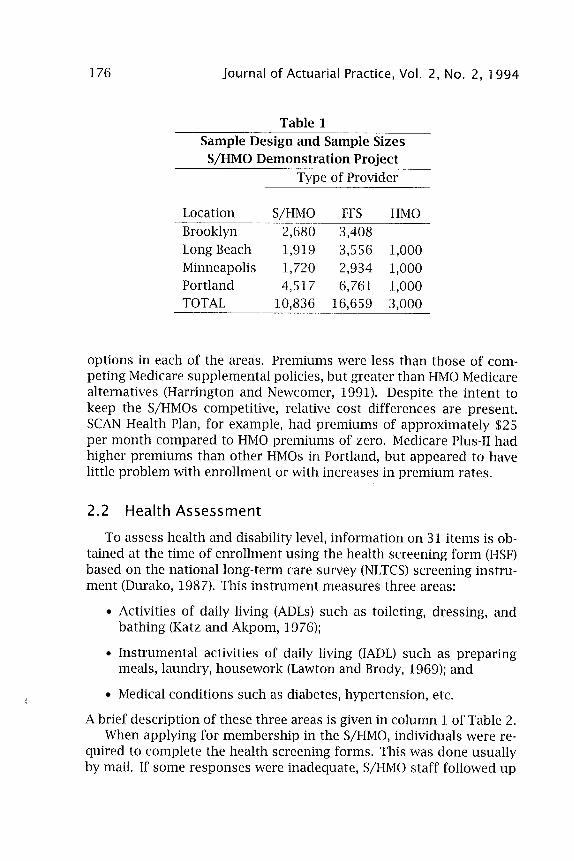
Because the Brooklyn site initially had no TEFRA HMOs, there are 11 different samples. The number of individuals in each sample is given in Table 1. The sample design covers certain age groups to ensure adequate power in forming certain statistical tests. The design effect resulting from this sampling has been removed in the analyses presented here, however, by conditioning on case mix. Because S/HMO clients voluntarily enrolled and were not randomly selected, individual health differences are statistically adjusted.5
Two constraints to enrollment implicitly operating are competition from other locations and relative cost of care. Brooklyn and Portland were relatively new areas for HMO enrollment of the elderly, with 7 percent and 16 percent of the elderly, respectively, enrolled in some HMO at the beginning of the project. Long Beach and Minneapolis were more established, with 24 percent and 60 percent, respectively, of the elderly enrolled. Competition had a negative impact on the ability of the S/HMOs to enroll members quickly. The primary consideration in setting initial premium levels was to be competitive with existing HMO
4The Tax Equity and Fiscal Responsibility Act (TEFRA) allows HMOs the option of providing health care to Medicare beneficiaries under a prepaid contract. In order for the HMO to have a population of interest to sample for comparison with S/HMO, the HMO had to be a operating under the prepaid (or at risk) option of TEFRA.
5To test if case mix represents health factors affecting enrollment, we examine mortality differences between FFS and S/HMO after case mix adjustment. Most differences are explained. Remaining differences due to unmeasured attributes (e.g., market, access, economic and consumption variables) are controlled by using site as a variable. Surveys (Le., consumer chOice, plan satisfaction and dis enrollment) describe marketing and individual preferences (Newcomer et aI., 1990; Harrington et aI., 1991; Newcomer et aI., 1991).
176 Journal of Actuarial Practice, Vol. 2, No.2, 1994
Table 1 Sample Design and Sample Sizes SjHMO Demonstration Project
options in each of the areas. Premiums were less than those of competing Medicare supplemental policies, but greater than HMO Medicare alternatives (Harrington and Newcomer, 1991). Despite the intent to keep the SjHMOs competitive, relative cost differences are present. SCAN Health Plan, for example, had premiums of approximately $25 per month compared to HMO premiums of zero. Medicare Plus-II had higher premiums than other HMOs in Portland, but appeared to have little problem with enrollment or with increases in premium rates.
2.2 Health Assessment
To assess health and disability level, information on 31 items is obtained at the time of enrollment using the health screening form (HSF) based on the national long-term care survey (NLTCS) screening instrument (Durako, 1987). This instrument measures three areas:
• Activities of daily living (ADLs) such as toileting, dreSSing, and bathing (Katz and Akpom, 1976);
• Instrumental activities of daily living (IADL) such as preparing meals, laundry, housework (Lawton and Brody, 1969); and
• Medical conditions such as diabetes, hypertension, etc.
A brief description of these three areas is given in column 1 of Table 2. When applying for membership in the SjHMO, individuals were re
quired to complete the health screening forms. This was done usually by mail. If some responses were inadequate, SjHMO staff followed up
Manton et al.: Disenrollment Patterns 177
by telephone. Consequently, health screens are available for 98.3 percent of S/HMO enrollees.6 For members in FFS samples, health screening forms were done by phone. In either group, if impairments are reported on two or more instrumental activities of daily living or on one or more activities of daily living, a detailed assessment is conducted to confirm impairment. The health screening form response rate is 80.5 percent in FFS and 85.7 percent in HMOs. The response rates do not include 20.3 percent of the FFS and 4.5 percent of the HMO members in samples who were found to be institutionalized or dead (in Medicare files). FFS sample members not located are included in the response rate calculations.
Not all variables associated with health are contained in this list of 31 items. To test for the adequacy of the 31 items as a measure of health, we examine the ability of the health scores generated from these 31 variables to explain mortality. Scores explain most differences between S/HMOs and FFS, suggesting little effect of unobserved health variables (Manton et al., 1994). We also examine site differences in prior costs, mortality, and dis enrollment between S/HMO, FFS, and HMO. Differences not related to case mix suggest the influence of unobserved nonhealth variables, such as psychological, market, and economic factors. Consequently, all analyses presented here are adjusted using site, plan type, and living arrangement variables.
2.3 Prior Use and Expenditures
Medicare Part A and B data are drawn from the Medicare Automated Data Retrieval System (MADRS) for all plans. National file searches are made to locate persons spending part of the time outside a site. Medicare costs (for those 65 and older) in the 12 months prior to being interviewed are determined for FFS sample members (whether or not responding to the health screening form). For individuals who are members of a managed care plan, Medicare costs prior to enrollment are not available. These individuals are not used in any analyses involving prior costs. There are some individuals who had some prior health care cost data but not for the complete 12 months preceding the study. Generally such individuals had previous cost data covering more than 180 days. For these individuals the data available are used to calculate a per diem rate which is inflated to 12 months.
6No health assessment was made at the time the individual terminated SjHMO or HMO coverage. There was a satisfaction questionnaire, however administered at termination. The results of the analysis of the satisfaction data are given in Newcomer et al. (1991).
178 Journal of Actuarial Practice, Vol. 2, No.2, 1994
2.4 Nonresponse Bias
Although the nonresponse rate for SjHMO enrollees on the health screening form is low (less than 2 percent), the nonresponse rates for the health screening form among the FFS sample and HMO sample range from 14 percent to 20 percent. Such a high nonresponse rate may bias measures of prior cost and function, because elderly survey nonrespondents tend to be frail (e.g., Manton et al., 1991). To examine the potential bias we use average Medicare cost of the populations at each site and compare these with the average Medicare cost for the sample populations. Average Medicare costs per utilizer in the site populations ($3,449; $3,139 excluding nursing home residents) are higher than in FFS samples.
We had complete Medicare utilization data for the six counties in the catchment area of the four SjHMOs. These data indicate that 64 percent of eligible persons annually use Medicare-covered services. Applying this 64 percent figure to the per capita cost estimate in the site populations yields $2,009 per annum per eligible person or 15.2 percent higher than in the samples ($1,746) reported here. The bias is in the direction and of the size (15 percent) found in studies of survey nonresponse (Manton et al., 1991; NCHS, 1964). Two year prior average annual costs in the National Medicare HMO Demonstration are $1,102 in HMOs and $1,682 in FFS (Rossiter et al., 1989). Prior costs in SjHMOs ($1,316) are 19.4 percent higher than in those HMOs. Costs for the SjHMO FFS sample are only 4 percent higher than the FFS samples in the National Medicare HMO Demonstration. Because FFS sample costs are lower than for FFS site populations, the nonresponse bias in the FFS sample is against demonstrating favorable enrollment in SjHMOs.
3 Heterogeneity and Case Mix
Dahl (1991) shows that for individual health coverages the effects of rerating, aging of the insured, and antiselection are perfectly confounded without some measure of health and disability on both the continuing insured and those terminating coverage. By perfectly confounded we mean that observed increases in utilization and per capita cost could be generated by changes in premium, aging, or antiselection or by any combination of these in such a way that there is no way to quantitatively determine the sources of these increases. Because of such confounding, it is impossible to determine which of these sources is the cause of claims deterioration. Separating the effects of aging of
Manton et al.: Disenrollment Patterns 179
the members, function, and mortality on choice of provider type for managed care also requires a measure of health and disability. Such a measure must go beyond the standard AAPCC underwriting factors (i.e., age, gender, welfare and institutional status) because these predict less than 1 percent of the individual costs (e.g., Lubitz et al., 1985).
The health screening form assessment provides a basis for developing such a measure. A 31 dimensional index, however, is difficult to implement. As noted in the recent actuarial literature (e.g., Young, 1993), when classification risks for a collection of individuals are to be reduced to a few actuarially viable components, the methods of fuzzy sets are useful. These methods allow the reduction of highly multidimensional data to a few fuzzy sets.7 Each individual is classified as a fuzzy member of these sets using grade of membership scores (Ostaszewski,1993).
A small number of meaningful sets can be determined using a qualitative assessment of past experience or can be generated from the data using computational procedures such as maximum likelihood (Manton, Woodbury, and Tolley, 1994). In either case, the sets should represent a reasonable separation of risks.8 Each individual in the 11 samples is given a grade of membership (GoM) score indicating the degree to which the person is a member of each of these sets. Thus, each of these sets is fuzzy in that the degree to which any individual is a member of any set can vary between 0 (not a member) to 1 (a complete member).
The grade of membership scores are estimated from the data contained on the health screening forms. We denote the grade of membership score for individual i for the kth fuzzy set as Bik with
K
L Bik = 1, 0:::; Bik :::; l. k=l
(1)
Let f.kj denote the probability of individual i giving a positive response to question j for an given that i is a complete member of set k, i.e.,
7Estimation of the fuzzy set structure resembles discrete factor analysis in that the statistical procedure looks for a few explanatory characteristics. (See, for example, Dillon and Goldstein (1984, Chapter 3) for more on factor analysis.) Usually these characteristics are described by a few dimensions of the data space. These characteristics describe sets of individuals. Unlike factor analysis, however, the fuzzy set method does not require each individual to be a crisp member of these sets, but the individual may be a partial member of several sets. Note that a crisp member is a complete member of member of a set in the classical sense. In the classical definition of sets, an element is either a member of a set or not a member of the set.
BEy reasonable separation of risks we mean that the sets need to be more than simply a statistical construct. They should have meaning as regards to level of health, health care need, utilization, mortality risk, and so forth.
180 Journal of Actuarial Practice, Vol. 2, No.2, 1994
who has (Bik = 1). The probability that i gives a positive response to question j is (Woodbury and Clive, 1974):
K
Pij = L BikAkj, k=l
where K is the number of fuzzy sets.
(2)
The probability, Pij, can be viewed as a binomial probability for questionj. As shown by Suppes and Zanotti (1981), there exists a vector of parameters Ajkl ;:: 0 and a set of grade membership scores, Bib for each individual, i, such that the likelihood9 is given by:
1 (K )YiJ1
L = ~ ~ JJ k~l BikAjkl , (3)
where AjkO + Ajkl = 1, YijO + Yijl = 1 and
.. = {I if individual i gives a positive response to question j; and YIJI 0 otherwise.
We choose estimates of both the BikS and the AkjlS that maximize this likelihood (Manton, Woodbury, and Tolley, 1994). Comparing equations (2) and (3) we see that Ajk = Ajkl.
The data indicate that there are six fuzzy groups. These six groups are defined in the listing below. They represent different classifications of healthy, disabled, and frail. A regression formula for calculating these scores for any particular health screening form response profile is given in Table 3.10
Group 1 = Healthy: Means free of medical problems and impairments, young (average age 71 years), often male, married, uses few services, and has low mortality. Such persons may see little benefit to S/HMO long-term care benefits if premiums are high.
9This likelihood is similar to that produced by the product binomial model. When there are more levels of responses than just the two considered here. the model becomes the product multinomial likelihood with different levels of each multinomial indexed by the I subscript of y.
IOThe grade of membership for each set for an individual is obtained by adding the entries in the relevant columns in Table 3 for each of the 31 characteristics present in the individual. This will give six different totals. Negative totals are adjusted to be zero. The totals then are standardized to l. These standardized totals are the grade of membership scores for the individual.
Manton et al.: Disenrollment Patterns 181
Group 2 = Acutely Ill: Has multiple medical conditions (e.g., 56 percent have cancer) but little impairment. It is similar in age to Group 1 (average age 72.2 years) and likely married and male. Group 2 used the most acute care in the prior year (e.g., hospitalization) with mortality higher than Group 1 but lower than Groups 3, 4, and 6. If HMOs provide the most effective acute care, this group may prefer HMOs over S/HMOs. The phrase acutely ill emphasizes differences between groups, i.e., some conditions in Group 2 persist and produce intermittent or terminal disability (e.g., cancer); others are severe and rapidly progress to death (or recovery).
Group 3 = IADL Impaired: Has instrumental activities of daily liVing, mobility, and neurological impairment. The instrumental activities of daily living [money management, telephoning, medications (Manton and Soldo, 1985)] suggest this group is cognitively impaired. This group is older (average age 78.8 years), dependent, uses long-term care, and has high mortality. Because of its longterm care needs, it may be retained by S/HMOs.
Group 4 = Chronic Circulatory: Has diabetes, hypertension, atherosclerosis, and stroke but no cancer or heart trouble. It is old (average age 81.1 years) and female with higher mortality than Group 2. Given high acute care needs, persons in this group may dis enroll from S/HMOs or HMO to FFS.
Group 5 = Older Healthy: Is functional, but has joint problems. It is older than Group 1 (76.2 years) and more female. It has the second highest marital rate. Service use is low, and mortality is similar to Group 1. This group may disenroll to FFS or HMO.
Group 6 = Frail: Has multiple co-morbidities and impairments. It uses the most acute and long-term care services, is old (89 years), and has the highest mortality. Because of its long-term care needs, it may be retained by S/HMOs.
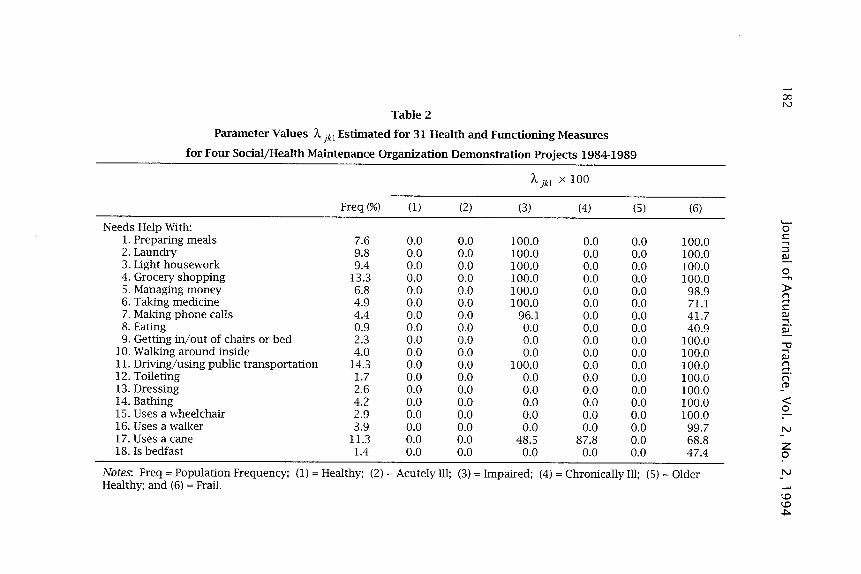
The pure type, or complete member, of any of these six fuzzy sets is characterized by the probabilities of responses on each of the 31 items in the health screening form. The values of i\kjl provide a profile describing the attributes associated with each of the groups. These profiles are in Table 2. For example, 100 percent of the individuals completely in either fuzzy set 3 or fuzzy set 6 will need help preparing meals. None of the individuals completely in the other fuzzy sets will need help with this task.
,.... 00 N
Table 2
Parameter Values A jkl Estimated for 31 Health and Functioning Measures
for Four Social/Health Maintenance Organization Demonstration Projects 1984-1989
186 Journal of Actuarial Practice, Vol. 2, No.2, 1994
Also considering use of a cane (item 17), the percentages of individuals completely in each of the six groups with this characteristic are, respectively, 9 percent, 9 percent, 48.5 percent, 87.8 percent, 0 percent, and 68.8 percent. Recall that these are theoretical individuals. There may be few, if any, individuals who are complete members (i.e., have scores of 100 percent) of any specific fuzzy set. The likelihood of a person being a complete member decreases as the number of items used to describe persons increases.
The grade of membership scores for each individual determine the degree to which the individual may be classified into each of the six sets. These grade of membership scores reflect the level of frailty and disability of each individual and are used to define a case mix. They also may be treated as a type of regression variable with regard to a response of interest. In particular, we are interested in the probability of changing coverage as a function of the level of disability and frailty. Because the Bik score for each individual is a surrogate for the probability of changing coverage, a model for the probability of change should be based on these. For a complete member of the kth fuzzy set let AkT denote the probability of transition to another form of care during an interval. For individual i let PiT denote these same probabilities. Each individual will have different values of such probabilities as indexed by i because each individual will have different grade of membership scores, Bib to each of the fuzzy sets. We use the representation similar to equation (2) above with the subscript j replaced by T. Explicitly,
K
PiT = L BikAkT . k=l
(4)
In equation (4), AkT parameters vary according to the type of provider (SjHMO, HMO, or FFS) and are specific to the period of time since enrollment. The period of time is the three year period of the project. We then set up the likelihood for the dis enrollment data for the three year period as a competing risk model where the end of the study is the competing risk. Thus, individuals terminating the S/HMO and joining the FFS or HMO could be followed as a new entrant into one of those samples. We use PiT as the probability of dis enrollment. Given that the Bik are known (determined using the 31 health variables), the only unknown parameters in this model are the AkT parameters. These are estimated using maximum likelihood similar to equation (3) (Manton et al., 1994).
Once the AkT have been estimated, the likelihood of dis enrollment from the S/HMO or HMO can be determined for any particular hypo-
Manton et al.: Disenrollment Patterns 187
the tical individual for whom the 9ik are known by using equation (4). The probability of voluntary termination of coverage for an individual with 9ik scores determined from the health screening form using the parameters in Table 2 can be estimated by blending the estimated AkT
values as given in equation (4). Naturally one can estimate other characteristics of interest such as
utilization, cost, or mortality. In any case, the actuary can estimate the likely values of the characteristic of interest by determining the profile of 9ik scores for the block of business of interest and then using these scores to blend the relevant estimated AkT values. Below we will report the AkT values estimated for dis enrollment.
4 Enrollment Findings
4.1 Enrollment and Disenrollment
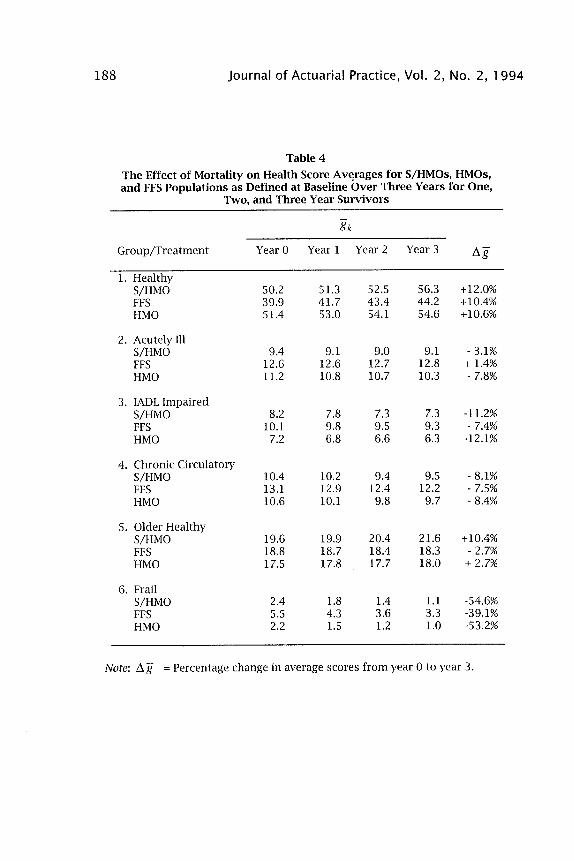
Table 4 lists the average value of the 9ikS for each of the six groups at the beginning of the study and at the end of each of the three years. At baseline (year 0), Group 1 has average values of 50.2 percent for S/HMO members, 39.9 percent for FFS members, and 51.4 percent for HMO members. For the healthy fuzzy set, the S/HMOs and the HMOs attract similar populations. In addition, these two populations are healthier, in general, than the FFS population because of the greater percentages in Groups 1 and 5 (the healthier groups) and the lower percentages in Groups 2, 3, 4, and 6 (the sicker groups). The selection processes that either explicitly or implicitly are established with regard to S/HMO and HMO enrollment are functioning to enroll a healthier population.
Over the three years the average scores for Group 1 increased 10 to 12 percent for the three treatments. Group 5 realized a lower rate of increase for S/HMOs and HMOs and a slight decrease for FFS. Other groups decrease in prevalence with the exception of Group 2 for FFS. Increases in the healthy groups (Group 1 and Group 5) and decreases in the other groups suggest that attrition due to mortality and dis enrollment is favorable for all three treatments. Hence, the S/HMOs receive a positive benefit from the mortality and dis enrollment patterns. Additionally, Group 6, a target group for the S/HMOs, is less prevalent in S/HMOs and HMOs than in the FFS and declines faster than in the FFS. By the end of the third year the average scores for the S/HMO and the HMO have converged to approximately the same value, except for Group 5.
188 Journal of Actuarial Practice, Vol. 2, No.2, 1994
Table 4
The Effect of Mortality on Health Score Av~rages for S/HMOs, HMOs, and FFS Populations as Defined at Baseline Over Three Years for One,
Note: I1g = Percentage change in average scores from year 0 to year 3.
Manton et al.: Disenrollment Patterns 189
4.2 Prior Cost of Care
A surrogate proposed as an indicator of poor health or expected high utilization in managed care (and to a lesser extent for individual health care coverage) is prior utilization. We use prior Medicare costs for the 12 months prior to the study as a measure of this utilization and compare it with the mortality outcome of each of the individuals. The results are listed in Table 5. In year one S/HMOs have the highest per enrollee costs for nonsurvivors ($4,467) and the lowest for survivors ($1,192). FFS costs are highest for survivors ($1,650), and HMOs have the lowest costs for nonsurvivors ($2,629). Over the three years prior costs for S/HMO and HMO nonsurvivors converge toward those of FFS. The difference in prior cost among survivors, however, is relatively constant. This indicates a potentially fundamental difference in the use of health care facilities among those who voluntarily join a managed care organization and those who do not. Additionally, we see that the ability of prior costs to predict mortality declines over time.
5 Disenrollment Findings
The major purpose of this study is to examine the S/HMO and HMO dis enrollment patterns as a function of health status. Disenrollment may increase or decrease any favorable bias in S/HMO or HMO enrollment. Table 6 summarizes episodes by health group. The probabilities of transition reported in Table 6 are estimated using equation (4). The first column in Table 6 describes the six groups and the types of coverage. The next three columns indicate the estimated probabilities that an individual will change coverage, e.g., "moved from an S/HMO to FFS," or "moved from FFS to an HMO," if the individual is a complete member of the group. The next column gives the probability of dying for a complete member of the group. The last column is for the original HMO. An individual may be in the HMO under study and subsequently be discharged to another HMO (column 3). The numbers in parentheses in each column are the average number of days before such a transition. Asterisked values indicate retention rates.
From Table 6 we see that for complete members of Group 1 in the S/HMO, 73.6 percent will remain in the S/HMO for the entire study with the mean number of days equal to 1062.8, and 8.9 percent will be discharged to HMO status. The average length of time remaining in S/HMO for those discharged to HMOs is 525.7 days.
Table 5 Changes in the Prior (to Study Entry) 12 Month Medicare Costs (Reimbursements) for
Survivors and Nonsurvivors Over Three Years
Treatment
SjHMO
FFS
HMO
Year 1 Alive Dead
$1,192 N=8,334
$1,650 N=15,162
$1,203 N=2,831
$4,467 N=311'"
Ratio = 3.75
$3,298 N= 990
Ratio = 2.00
$2,629 N= 140
Ratio = 2.19
Note: Ratio = Dead ($) / Alive ($)
Year 2 Alive Dead
$1,137 N=7,939
$1,591 N=14,251
$1,143 N=2,728
$3,246 N= 706
Ratio = 2.85
$2,951 N = 1901
Ratio = 1.85
$2,689 N = 243
Ratio = 2.35
"Number of deaths with Medicare prior service use data.
Year 3 Alive Dead
$1,067 $2,941 N=7,527 N= 1,118
Ratio = 2.76
$1,522 $2,957 N=13,568 N = 2610
Ratio = 1.94
$1,107 $2,445 N=2,610 N= 361
Ratio = 2.21
...... t;O o
'-o c "'"' :l IlJ
o ....... :t> I"l ..... C IlJ ::::!. !::.
" "'"' IlJ I"l ..... I"l (I)
< o
N
z o N
t;O t;O
"'"
Manton et al.: Disenrollment Patterns 191
We estimate that 12.3 percent of the S/HMO enrollees who are complete members will move to FFS status during a three year period of coverage. These individuals will stay an average of 441.2 days before making the transfer. Last, 5.1 percent of the S/HMO enrollees who are complete members of Group 1 will die, with an average of 584.0 days from enrollment to death. The retention rates for FFS and S/HMO are similar for Group 1 and to a lesser extent for Group 5. For the acutely ill Groups 2, 3, and 6, however, the retention rates are highest for FFS. Additionally, there is a significant outflow of members from S/HMO to FFS status for these groups. The S/HMO concept is designed to serve (Le., to provide long-term care services) those in Group 3 and Group 6. This outflow may be indicative of an unmet need or dissatisfaction among those who are likely to require the greatest health care services.
The probabilities in Table 6 can be used to estimate the retention rate for any individual as follows. First the Bik scores are determined for the individual of interest. If the individual is enrolled in the S/HMO, the likelihood of changing to FFS coverage, for example, is the weighted sum of the probabilities of changing from S/HMO coverage to FFS as given in Table 6 for each of the six groups. The weights used for each of these probabilities are the Bik scores of the individual. The expected retention of a collection of insureds is determined as the average retention all individuals. Depending on the distribution of the Bik scores, there will be a larger or smaller net flow of frail individuals and a relatively larger or smaller retention of healthy individuals among the covered. Other characteristics such as the variation in the aggregate retention, length of stay with the insured, cost, and utilization (not given in this paper) also may be calculated for a collection of insureds using the set of Bik scores for the insureds. Thus, the Bik can be used to define characteristics of the collective even though the collective may not be a homogeneous group of individuals.
In Table 7 we adjust dis enrollment patterns for mortality. The first column describes the initial groups and treatments. The next three columns show the coverage to which persons move. Retention is in the final two columns. The numbers in the parentheses indicate the risks of change relative to the total rate (over all groups).
Most differences between HMO and S/HMO dis enrollment are due to the likelihood the HMO members change plans. In Groups 1 and 5, HMO dis enrollees are less likely than S/HMO dis enrollees to reenter FFS. There is no difference in reentry to FFS by the frail.
192 Journal of Actuarial Practice, Vol. 2, No.2, 1994
Table 6
Episode·Based Analysis of S/HMO, HMO, and FFS Populations
Notes: TDR = Total Discharge Rate; Avg. Dur. = Average Duration in Days; Enders = Percentage ending in the state they started in. Figures in parentheses indicate class speCific risk of transition relative to the marginal rate.
194 Journal of Actuarial Practice, Vol. 2, No.2, 1994
When considering the net change in HMO members relative to the FFS client pool, we see the same pattern as described above. Explicitly, HMOs receive a net relative increase in clients from the FFS sector for the healthy and acutely ill and a net relative decrease from the frail groups. For the chronic care cases, the experience is neutral between the FFS and HMO transfers. Consequently, the HMOs are recipients of fortuitous reverse cumulative antis election, whereas the FFS client pool experiences an accumulation of antiselection.
6 Conclusion
In this paper we present an analysis of dis enrollment patterns of elderly in two different types of managed care plans: the TEFRA HMO and the S/HMO, representing coverage expanded to include long-term care services. The primary purpose of this paper is to examine whether different dis enrollment patterns are observed and if differential enrollment increases or decreases any enrollment bias in a managed care population. To adjust disenrollment for differences in frailty and disability, we develop a case mix index based on fuzzy set theory. A formula based on data gathered on the health screening form survey is included so that individual scores can be determined for other enrolled groups. Comparisons of prior utilization (costs) using this case mix index indicate that it captures differences in health care need as measured by this surrogate.
The results indicate that the S/HMO and the HMO have favorable enrollment in that the case mix for both of these types of managed care is healthier as measured by the case mix index than the FFS sample observed. The differences are confirmed in the differential mortality patterns and the differences in prior utilization. Disenrollment works in favor of the managed care sectors in that those with higher levels of frailty have a higher likelihood of dis enrolling from managed care than healthy enrollees. The result of the observed disenrollment pattern is to give managed care a further advantage in needed care relative to the FFS client population. This is evidence that the cumulative antis election process identified by Bluhm (1982) works in reverse in HMO-FFS transitions. There is evidence, however, that healthier individuals transfer from one HMO to another. Thus, it indicates that as a greater portion of the elderly population is enrolled to receive care under a managed care format, the collective experience for managed care facilities will degenerate as a result of a decrease in the rate of discharges to FFS.
Manton et al.: Disenrollment Patterns 195
In addition to the financial implications of the results presented here, the data suggest that the major reason for dis enrollment could be dissatisfaction with services. Those who are frail or are in more need of care have the highest dis enrollment rate. Apparently, the type of service and care provided by a managed care facility is best for those who need little care or only acute care.
References
Bluhm, W.F. "Cumulative Antiselection Theory." Transactions of the Society of Actuaries 34 (1982): 215-246.
Brown, R.S. Biased Selection in the Medicare Competition Demonstrations. (RFP No. HCFA-83-0RD-29/CP). Princeton, N.J.: Health Care Financing Administration Mathematica Policy, Inc., 1988.
Dahl, AS. "Claims Experience Deterioration for Individual Health Insurance." Masters thesis, Brigham Young University, 1991.
Dillon, W.R. and Goldstein, M. Multivariate Analysis: Methods and Applications. New York: John Wiley & Sons, 1984.
Durako, S. Evaluation of Social/Health Maintenance Organization Demonstration. Rockville, Md.: Westat, Inc., 1987.
Fuhrer, C.S. and Shapiro, AF. "Modeling Flexible Benefit Selection." Transactions of the Society of Actuaries 46 (1992): 13 5-160.
Harrington, C. and Newcomer, R. "Social Maintenance Organization Service Use and Costs, 1985-1989." Health Care Financing Review 12, no. 3 (1991):37-52.
Katz, S. and Akpom, C.A "A Measure of Primary Sociobiological Functions." International Journal of Health Services 6 (1976): 493-508.
Lawton, M. and Brody, E. "Assessment of Older People: Self-Maintaining and Instrumental Activities of Daily Living." Gerontology 9 (1969): 179-186.
Lubitz, ]., Beebe, ]. and Riley, G. "Improving the Medicare HMO Payment Formula to Deal With Biased Selection." In Advances in Health Economics and Health Services Research. (editors, R. SchIeffer and L. Rossiter.) Greenwich, Conn.: JAI Press, 1985: 101-122.
Manton, K.G., Stallard, E. and Woodbury, M.A. "A Multivariate Event History Model Based Upon Fuzzy States: Estimation From Longitudinal Surveys With Informative Nonresponse." Journal of Official Statistics 7 (1991): 261-293.
196 Journal of Actuarial Practice, Vol. 2, No.2, 1994
Manton, K.G., Woodbury, M.A. and Tolley, H.D. Statistical Applications Using Fuzzy Sets. New York: John Wiley & Sons, 1994.
Manton, K.G., Newcomer, R., Vertrees, J,c., Lowrimore, G.L. and Harrington, C. "A Method for Adjusting Capitation Payments to Managed Care Plans Using Multivariate Patterns of Health and Functioning: The Experience of Social/Health Maintenance Organizations." Medical Care 32, no. 3 (1994): 277-297.
National Center for Health Statistics. "Health Survey Procedure: Concepts, Questionnaire Development, and Definitions in the Health Interview Survey." In Vital and Health Statistics. Washington, D.C.: Public Health Service, 1964.
Newcomer, R., Harrington, C. and Friedlob, A. "Social Health Maintenance Organizations: Assessing Their Initial Experience." Health Services Research 25 (1990): 425-454.
Newcomer, R., Preston, S. and Harrington, C. Health Plan Satisfaction Among Members of the Social/Health Maintenance Organization. San Francisco, Calif.: University of California-San Francisco, 1991.
Ostaszewski K. Fuzzy Set Methods in Actuarial Science. Schaumburg, Ill: Society of Actuaries, 1993.
Pasco, G.c. "Patient Satisfaction in Primary Health Care: A Literature Review and Analysis." Evaluation and Program Planning 6 (1983): 185-210.
Rossiter, L., Langwell, K., Wan, T. and Rivnyak, M. "Patient Satisfaction Among Elderly Enrollees and Disenrollees in Medicare Health Maintenance Organizations." Journal of the American Medical Association 262 (1989): 57-63.
Suppes, P. and M. Zanotti. "When are Probabilistic Explanations Possible?" Synthese 48 (1981): 191-199.
Tucker, A.M. and Langwell, K. Disenrollment Patterns in Medicare HMOs: A Preliminary Analysis. Washington, D.C.: Mathematica Policy Research, 1989.
Woodbury, M.A. and Clive, J, "Clinical Pure Types as a Fuzzy Partition." Journal of Cybernetics 4 (1974): 111-121.
Young, V.R. "The Application of Fuzzy Sets to Group Health Underwriting." Transactions of the Society of Actuaries 45 (1993): 551-584.
Zastowny, T.R., Roghman, K.J, and Hengst, S. "Satisfaction With Medical Care: Replications and Theoretic Reevaluation." Medical Care 21 (1983): 298-321.