DISKUSSIONSBEITRÄGE DISCUSSION PAPERS Oil and Intergenerational Redistribution – the Case of Norway der Albert-Ludwigs-Universität Freiburg Friedrich Fichtner Christian Hagist No. 32 – November 2008
Transcript
DISKUSSIONSBEITRÄGE DISCUSSION PAPERS
Oil and Intergenerational Redistribution – the Case of Norway
de
r A
lbe
rt-L
ud
wig
s-U
niv
ers
itä
t F
reib
urg
Friedrich FichtnerChristian Hagist No. 32 – November 2008
Oil and Intergenerational Redistribution –
the Case of Norway *
Friedrich Fichtner Freiburg University (Germany)
and
Christian Hagist
Research Center for Generational Contracts, Freiburg University (Germany)
November 2008
Abstract
The Norwegian population will pass through an ageing process during the next decades which causes that the old-age-dependency ratio rises from currently 22 per cent up to 38 per cent in 2050 and 47 per cent in 2100. This ageing population induces increasing expenditures on old-age and disability pensions together with health and long-term care benefits while the public revenues from wage taxes and social contributions will decrease. At the same time, the revenues from petroleum activities decline. Therefore, it is unclear if the Norwegian fiscal policy is really sustainable or not even despite the formidable current conditions with a budget surplus of nearly 14 per cent of GDP and a net wealth of 26 per cent of GDP. Is Norway over-consuming its petroleum wealth? Generational Accounting, Norway, Fiscal Policy, Intergenerational redistribution JEL Classification: H50, J10
* Corresponding author: Christian Hagist, Forschungszentrum Generationenverträge (Research Center for Generational Contracts), Albert-Ludwigs-Universität Freiburg (Freiburg University), D-79085 Freiburg, Germany (Fax +49-761-203-2290, [email protected]). We would like to thank Yngvar Dyvi, Erling Holmøy, Pål Knudsen, Stefan Moog, Vibeke Nielsen, Bjørn Sandvik, Johannes Vatter and participants of the Statistics Norway Research Seminar for valuable comments. All errors remain our own. Furthermore, financial support of the E.ON-Ruhrgas AG is gratefully acknowledged.
1. Introduction
In a paper in 1993 Auerbach et al. (1993) asked the question: “Norway: Is the nation over-
consuming its petroleum wealth?”. They analyzed this question with the method of generational
accounting and back then their answer was: yes, Norway does over-consume. And this could still
hold today as Norway still has one of the most generous public pension systems and life
expectancy at births rose from 1992 (their base year) to today significantly from 77.3 to 80.5 and
is expected to increase even further. At the same time the fertility rate, although close to the
natural reproduction rate, stagnates at 1.9 children per fertile woman. However, things also have
changed in the other direction: Firstly, net migration hit a record high in 2007 with 40,000
people, most of them relatively young and well educated. Secondly, the Government Pension
Fund (GPF) became over the last decade the very role model how unfunded pay-as-you-go-
systems could become partially funded. And thirdly, and possibly most important of all, oil prices
went through the roof and will probably continue rise even further. In 1992, the base year of the
Auerbach et al. (1993) paper, direct and indirect taxes related to petroleum activities were
around 3.84 per cent of GDP. In 2007 this number was 13.3 per cent (including dividends). While
according to Statistics Norway (2008) Norway had in 1992 a deficit of 14.8 billion Kroner (NOK), it
saw a surplus of 396.6 billion NOK in 2007.
Generational Accounts for Norway were not only calculated by Auerbach et al (1993) but also by
Steigum (1996), Steigum and Gjersem (1999). Steigum (2002) and Gjersem (2002) while certain
aspects of generational accounting were also included in some National Budget reports.
However, our goal is not only to update these studies with the newest developments (see
above) but also to put a focus on the intergenerational dimension of the oil wealth and the
related pension fund.
The paper is structured as follows: Section 2 describes briefly the method of Generational
Accounting and the calculation of the sustainability indicators used. The method of Generational
Accounting was introduced during the early nineties to estimate both explicit and implicit debt
of public coffers in the long run. The sources of data used for these calculations are reported in
section 3. Generational Accounting needs three kinds of data, a population projection, age- and
sex-specific profiles and a general government budget of a certain base-year. Furthermore, we
discuss in section 3 our choice for global parameters (growth and discount rates) and the
influence of the public oil-revenues on the general budget. In section 4 we provide the results of
the Generational Accounting analyses using different kinds of sustainability indicators.
Furthermore we illustrate the findings of the sensitivity analyses, wherein we analyze the effects
of different population scenarios and the choice of several parameters. Section 5 summarizes
and concludes the paper.
1
2. The Methodology of Generational Accounting
To measure the sustainability of a country’s public sector we use the method of Generational
Accounting developed by Auerbach, Gokhale and Kotlikoff (1991, 1992 and 1994). In contrast to
traditional budget indicators which are based on annual cash flow budgets, Generational
Accounting is founded on the intertemporal budget constraint and therefore the long-term
implications of a current policy can be computed.1 The intertemporal budget constraint of the
public sector, expressed in present value terms of a base-year is: b
(1) , ,1
b D
b b kk b k b
b kB N N− ∞
= = +
= +∑ ∑ .
Let denote agents' maximum age and the present value of year b’s net tax payments,
i.e., taxes paid net of transfers received, made by all members of a generation born in year
over the remaining lifecycle. Then, the first right-hand term of equation (1) represents the
aggregate net taxes of all generations alive in the base-year . The second term aggregates the
net tax payments made by future generations born in year
D ,b kN
k
b
1b+ or later. Together this is equal to
the left-hand side of equation (1), , which stands for the net debt in year b . That means if the
sum of all living generations’ net taxes, , is negative (i.e. if they receive a net transfer)
and the net debt, , positive, the sum of future generations’ net taxes has to be positive to
balance the government’s intertemporal budget i.e. in a long-term perspective net transfers
received by living generations plus the net debt of the base-year have to be financed by net
taxes paid by future generations.
bB
,
b D
b kk b
N−
=∑
bB
To calculate generations' aggregated lifecycle net tax payments, the net payment terms in
equation (1) are decomposed into:
(2) . ( )}{
, , ,max ,
1k D
b sb k s k s k
s b k
N T P+
−
=
= +∑ r
In equation (2), denotes the average net tax paid in year by a representative member of
the generation born in year , whereas stands for the number of members of a generation
ksT , s
k ksP ,
1 The further description of the methodology of Generational Accounting is mainly based on Raffelhüschen (1999) and Bonin (2001). For an analytical derivation of the intertemporal budget constraint see Benz and Fetzer (2006) or Fetzer (2006). Hagist (2008) gives an overview about the empirical studies with generational accounting along with a discussion concerning critical points in theoretical as well as empirical terms.
2
born in year who survives until year . To compute the remaining lifetime net payments of
living generations, the future demographic structure is specified conducting long-term
population forecasts.
k s
s
T h
Typically, Generational Accountants disaggregate equation (2) even further. To incorporate
gender-specific differences in average tax payments and transfer receipts by age, separate
aggregation of the average net taxes paid by male and female cohort members is required. The
products aggregated in equation (2) represent the net taxes paid by all members of generation
in year . For generations born prior to the base-year the summation starts from year b, while
for future born cohorts, the summation starts in year . Irrespective of the year of birth, all
payments are discounted back to the base-year b by application of a real interest rate .
k s
k b>
r
The age-specific net tax payment in year of agents born in year k can be decomposed as
(3) , ,s k s k ii
= ,∑ .
iksh ,, stands for the average tax or transfer of type paid or received in year s by agents born in
year , thus of age .
i
k s k− 2 In equation (3), indicates a tax payment, whereas defines
a transfer.
0h > 0h <
Applying the method of Generational Accounting it is conventionally assumed that initial fiscal
policy and economic behavior are constant over time. Under this condition it is possible to
project future average tax payments and transfer receipts per capita from the base-year age
profile of payments according to
(4) ( ) ( ), , , ,1 s b
s k i b b s k ih h g −
− −= + .
where g represents the annual rate of productivity growth. Equation (4) assigns to each agent of
age s-k in year s the tax and transfer payment observed for agents of the same age in base-year
b, uprated for gains in productivity. The base-year cross section of age-specific tax and transfer
payments per capita is generally determined in two steps. First, the relative position of age
cohorts between themselves in the tax and transfer system is estimated from micro-data
profiles. In a second step the relative age profiles are re-evaluated proportionally to fit the
expenditure and tax revenues of the base-year.
2 In case of an isolated analysis of public subsystems like health care or public pension as conducted in the following chapters, i is just chosen so that all relevant payment streams are included in the analysis.
3
For living and future generations, division of the aggregate remaining lifetime net tax payments
by the number of cohort members alive in year s defines the cohort’s Generational Account in
year s:
(5) ,,
,
s ks k
s k
NGA
P= .
Generational Accounts are constructed in a purely forward-looking manner, only the taxes paid
and the transfers received in or after the base-year are considered. As a consequence,
Generational Accounts cannot be compared across living generations because they incorporate
effects of differential lifetime. One may compare, however, the Generational Accounts of base-
year and future born agents, who are observed over their entire lifecycle.
To illustrate the fiscal burden of current fiscal policy we use seven sustainability indicators:3 The
starting point for the first indicators are the intertemporal public liabilities which can be
computed by the assumption that the intertemporal budget constraint of the public sector (1) is
violated:
(6) ,b bk b D
b kIPL B N∞
= −
= − ∑ .
The amount of intertemporal public liabilities measures aggregate unfunded claims on future
budgets, assuming that the present policy will hold for the future. The first sustainability
indicator, the fiscal gap ( bFG ), can be derived if the intertemporal public liabilities are set in
relation to base-year’s GDP ( ). This indicator is akin to the debt quota well known since the
Maastricht treaty but it addresses the debt which will occur in the future and in the past:
bGDP
(7) bb
b
IPLFGGDP
= .
How the policy adjustment required to redeem intertemporal public liabilities will affect
generations' fiscal burdens is uncertain. For illustrative purposes, Generational Accounting
typically assigns the entire adjustment to future generations which is equivalent to k > b. All tax
payments made by members of future born cohorts are adjusted proportionally with the help of
a uniform scaling factor θ . The factor θ is set to ensure balance of the intertemporal public
budget defined in equation (1):
3 For a discussion of measuring fiscal sustainability and the development of sustainability indicators, see Raffelhüschen (1999) and Benz and Fetzer (2006).
4
(8) ( ) ( ), , , ,1 s b
s k i b b s k ih hθ g −
− −= × +
for and instead of equation (4). Computing the average age-specific net taxes paid by
representative future born agents, the burden for future generations can be illustrated as an
absolute difference between the Generational Account of the base-year agent and the
Generational Account of the one year after base-year born agent. This is our second
sustainability indicator, the future generations’ burden:
(9) , ,b b b bFGB GA GAθ
+= − 1
The third indicator that illustrates the burden of current fiscal policy is the revenue gap. In this
case the scaling factor revθ θ= reflects the enhancement of age-specific revenues in per cent
for all generations which is necessary to close the intertemporal public budget constraint. It can
also be interpreted as the ratio of the intertemporal public liabilities to the present value of all
age-specific revenues of the fiscal system :
(10)
( )1Re
(1 )
brev
s s bs b
IPL
vr
θ ∝
−=
=⋅
+∑
with Re sv referring to the sum of revenues in year by all living generations in year .
Analogous to the revenue gap, we compute also the so-called transfer gap. In this case the
scaling factor
s s
trfθ θ= reflects the necessary decrement of age-specific public transfers (Trf)
like health benefits in per cent for all generations that is necessary to close the intertemporal
public budget constraint. Constructing the revenue and transfer gap, we implicitly assume that
the government is able to enforce an immediate adjustment of all taxes and contributions or
transfers respectively.
As Benz and Fetzer (2006) have shown all the used indicators are computed with an infinite time
horizon. In the practical calculation all relevant variables like population or cohorts’ tax
payments are projected for 300 years from the base-year on. Afterwards a geometrical serial is
used to determine the remaining net tax payments. The choice of 300 periods is nearly
completely arbitrary and just reflects a good approximation point for our analysis.
3. Data and Assumptions
To compute Generational Accounts and to calculate the described indicators, a population
projection is needed. Furthermore the calculations require the expenditures and revenues of the
5
Norwegian public sector in 2007, age-sex-profiles for the different expenditure and revenue
types and a growth rate of the productivity as well as a discount rate. The population projection
in the following is calculated with a demographic program developed by Bonin (2001).
3.1 Population Projection
Generational Accounting requires detailed population projections, which distinguish between
three possible scenarios titled medium variant, high variant and low variant. Based on different
assumptions about the three parameters life expectancy, fertility and migration it is possible to
derive a population projection for each of the demographic scenarios. Own calculations are
necessary for the reason of Generational Accounting’s assumed infinite time horizon: The official
projections end in 2060 while we need a 300 years projection period. In these calculations we
use for the parameters of the year 2007 the given data of Statistics Norway. The projected
parameters until year 2060 in the different scenarios originate from the assumptions made by
Statistics Norway (2008a). Table 1 shows those central assumptions of the three scenarios.
Table 1: Central Assumptions of Norwegian Population Projections
Parameter Year Scenario
Medium Variant High Variant Low Variant
Total Fertility Rate 2007 1.90 1.90 1.90
2060 1.85 2.05 1.50
Life Expectancy at birth for females/males in years
2007 82.7/78.2 82.7/78.2 82.7/78.2
2060 90.2/86.3 92.7/87.9 82.7/78.2
Net migration 2007 39,500 39,500 39,500
2060 20,000 32,300 10,000
Source: Statistics Norway (2008a)
In the following the future size and structure of the Norwegian population can be anticipated for
all three different demographic scenarios. The outcomes of these projections are shown in figure
1. Compared to the official calculations of Statistics Norway (2008a), we exactly hit the
Norwegian population in 2050 within our medium projection.
In the medium variant of the Norwegian population projection which is shown in Figure 1 the
population grows over the projection horizon. After this scenario the population increases from
4.7 million in 2007 to 6.3 million in 2100. The high variant causes a constant increase in terms of
population. The population rises to 6.7 million until 2050 and 9.5 million until 2100. Only the low
variant contains a decrease of the population. Until it reaches the year 2036, the population
grows also in this scenario due to the increasing life expectancy of both men and women,
afterwards a shrinkage process begins which causes a population of 5 million in 2050 and 3.9
million in 2100. For the following analysis we take the medium variant as our standard scenario if
6
not stated differently. Outcomes for the two other scenarios can be found in sector 5.2 of this
paper.
Figure 1: Different developments of the Norwegian population until 2100
One can see on the basis of figure 2 that the absolute size of the Norwegian population will
increase in the future. Especially the number of members of cohorts above the age of 60 years
will constantly grow, while the size of the younger cohorts will be almost stable. This is mainly
caused by the augmentation of the life expectancy in Norway combined with more or less
sufficient fertility rates. How and to what extent this future changes in the population structure
include a change of the average age and especially of the ratios between the cohorts can be
demonstrated by the old-age-dependency-ratio. This is defined by the ratio between members
of cohorts older than 66 years to the sum of all generations between 20 and 66years.4 This ratio
shows more or less the proportion between the old part of the society and the younger working
part. Therefore the future development of the old-age-dependency-ratio gives a first hint of how
social security systems organized in a pay as you go-pattern will be imbalanced in the future.
4 In the literature one find various different definitions with different age groups or restricted groups like working people under a certain age. However, in the case of Norway, the official retirement age is 67 years even when the actual retirement age is more likely around 63 years.
8
Figure 3: Development of the age-dependency-ratio until 2100 in Norway
5 For example women receive the major share of family benefits while one could also assume that the incidence is really based on the child or the family (husband, wife, children) as a whole.
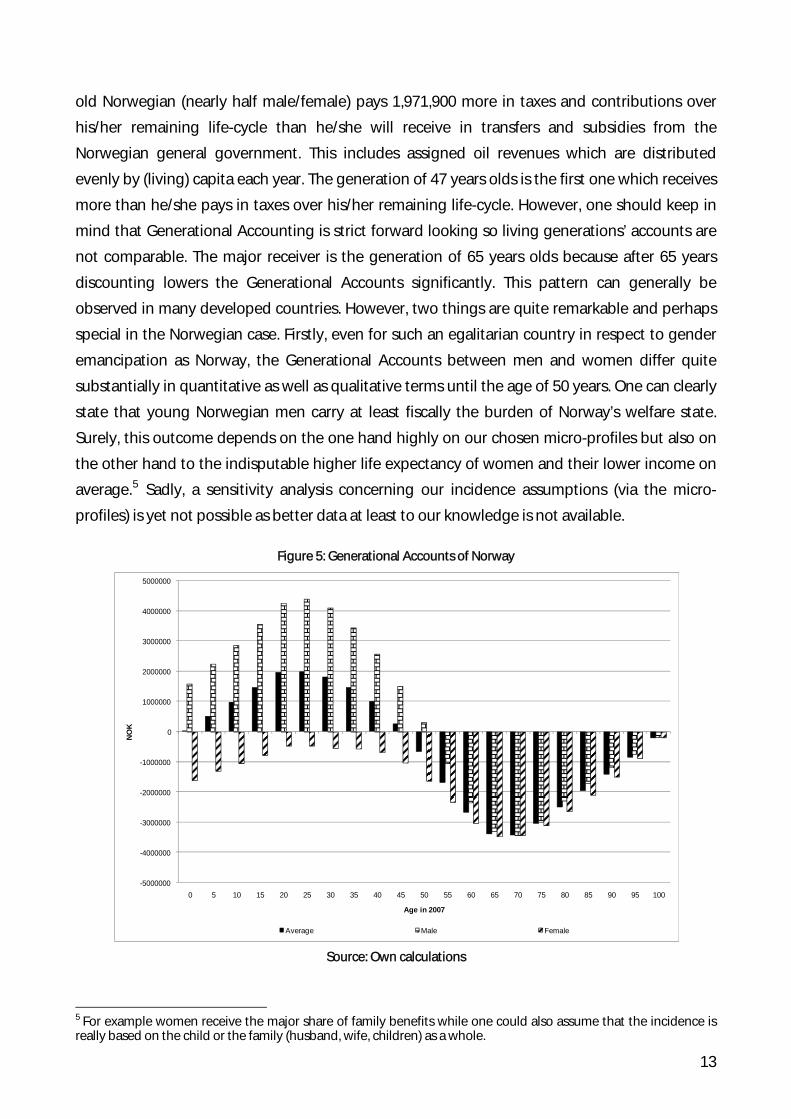
13
The even more remarkable result, however, is the account of the present average newborn. Even
little, it has a positive sign (19,121 NOK). Comparing this to the generational accounts of Austria,
France, Germany, Spain, Switzerland, the UK and the U.S. presented in Hagist et al. (2008), it is a
unique pattern. However, this only holds if one accounts for the petroleum revenues and the
dividends of the net wealth (GPF minus public debt) and only until for newborns in 2007 as
newborns in 2008 are already starting their life with a net transfer of 34,252 NOK in the standard
scenario.
As one can see in figure 6, Generational Accounts of every generation are significant lower
without these two sources of funding. Looking only at the core public finances without oil and
the generation fund the pattern we see in other countries holds also for Norway.
Figure 6: Generational Accounts of Norway: The importance of petroleum
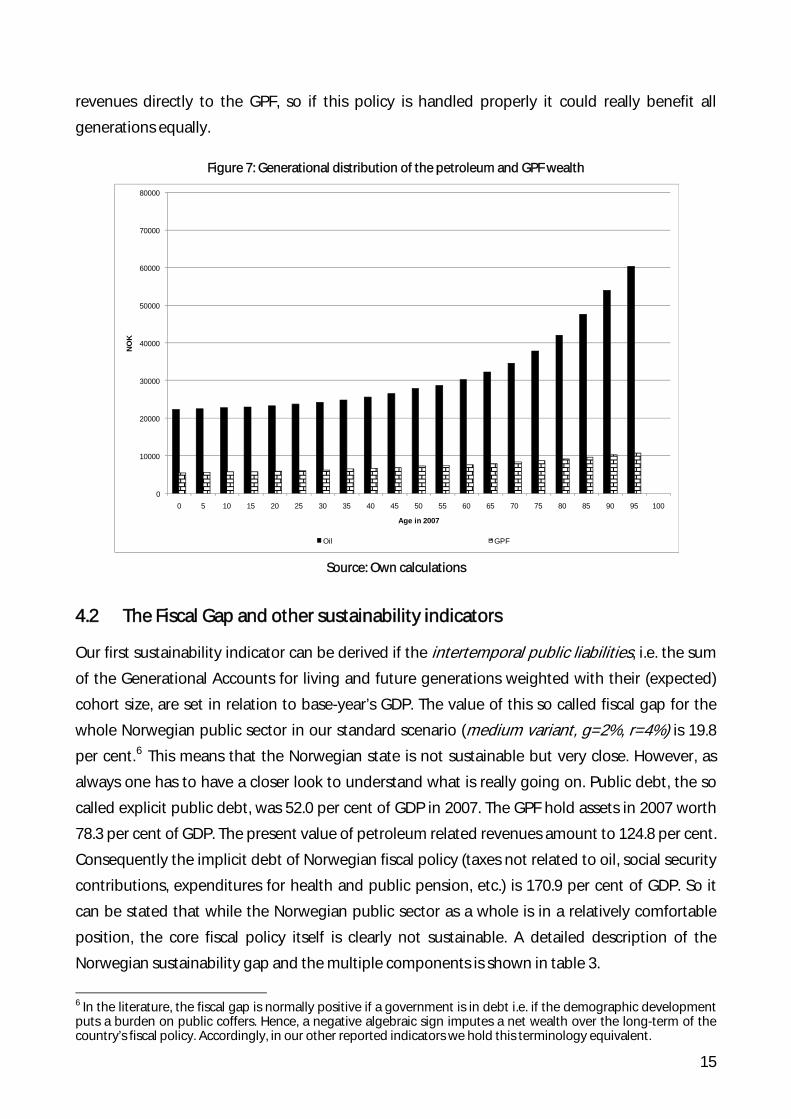
4.2 The Fiscal Gap and other sustainability indicators
Our first sustainability indicator can be derived if the intertemporal public liabilities, i.e. the sum
of the Generational Accounts for living and future generations weighted with their (expected)
cohort size, are set in relation to base-year’s GDP. The value of this so called fiscal gap for the
whole Norwegian public sector in our standard scenario (medium variant, g=2%, r=4%) is 19.8
per cent.6 This means that the Norwegian state is not sustainable but very close. However, as
always one has to have a closer look to understand what is really going on. Public debt, the so
called explicit public debt, was 52.0 per cent of GDP in 2007. The GPF hold assets in 2007 worth
78.3 per cent of GDP. The present value of petroleum related revenues amount to 124.8 per cent.
Consequently the implicit debt of Norwegian fiscal policy (taxes not related to oil, social security
contributions, expenditures for health and public pension, etc.) is 170.9 per cent of GDP. So it
can be stated that while the Norwegian public sector as a whole is in a relatively comfortable
position, the core fiscal policy itself is clearly not sustainable. A detailed description of the
Norwegian sustainability gap and the multiple components is shown in table 3.
6 In the literature, the fiscal gap is normally positive if a government is in debt i.e. if the demographic development puts a burden on public coffers. Hence, a negative algebraic sign imputes a net wealth over the long-term of the country’s fiscal policy. Accordingly, in our other reported indicators we hold this terminology equivalent.
15
Table 3: Overview of components of the fiscal gap and other sustainability indicators (Population Scenario Medium Variant, g=2.0%, r=4.0%)
Sustainability Indicators Public Sector
in %
of G
DP
of
2007
Implicit Debt 170.9
Explicit Debt in 2007 52.0
Petroleum Wealth -124.8
Fund Assets in 2007 -78.3
Fiscal Gap 19.8
Future Generations’ Burden (in NOK) 67,900
in %
Revenue Gap 0.7
Transfer Gap 0.7
Source: Own calculations
Our second indicator is the future generation’s burden. To calculate this indicator, the
intertemporal public liabilities and the number of people in future generations are set in
proportion to each other (equation 9). This indicator implies that the entire adjustment assigns
to future generations. The burden for future generations can be illustrated as an absolute
difference between the generational account of the base-year and the generational account of
the one year after base-year born agent (both not including petroleum revenues, fund assets or
public debt). The future born generation in Norway receive 46,600 NOK per person more in
transfers over their entire life-cycle than they will pay in taxes. On the other hand, the base-year
born agent gets a net-transfer over his/hers remaining life cycle of about 114,500 NOK.
Therefore, the future born agent has to carry a small burden compared to the corresponding
living generation. This is also reflected in our last two sustainability indicators, the revenue and
transfer gap. Norway’s government would have to raise all taxes (except those on petroleum
activities) by 0.7 per cent or could decrease all transfers by 0.7 per cent.
4.3 Sensitivity Analysis
To analyze the sensitivity of our results relating to our exogenous parameters interest and
growth rate, and r g , and to our different population projections we calculate 15 different
cases. Except our standard scenario, we test four more different settings around this
combination: g = 1.5 vs. =4.0 per cent, r g = 2.5 vs. = 4 per cent, r g = 2.0 vs. = 3.5 per cent
and
r
g = 2.0 vs. = 4.5 per cent. Furthermore, we distinguish, how discussed above, between
three possible population scenarios medium, high and low variant. Table 5 shows the
sustainability gap for all possible population scenarios combined with the described growth and
interest rate settings.
r
16
Table 4: Sensitivity Analysis of the Fiscal Gap (in % of GDP of 2007)
Medium Variant High Variant Low Variant
g=1.5% r=4.0% -49.0 -5.4 -96.9
g=2.5% r=4.0% 154.8 329.5 11.2
g=2.0% r=4.0% 19.8 101.5 -57.9
g=2.0% r=3.5% 152.0 324.6 9.8
g=2.0% r=4.5% -47.8 -3.6 -96.1
Source: Own calculations
How can be easily seen, the extent of the fiscal gap and in the case of Norway also its quality
(debt or wealth) depends on the difference between the growth and interest rate. As the spread
widens the fiscal gap decrease, i.e. is better, in all of the three scenarios. Regarding our three
population scenarios it can be stated that the low variant is the most sustainable one when the
growth-interest-spread is low. The most intergenerationally unbalanced situation using the
indicator fiscal gap is therefore achieved by the high variant combined with the smallest
difference between growth and discount rate ( g = 2.5 vs. = 4 per cent). However, this changes
given larger growth-interest-spreads. The intuition behind this is probably the effects of
migration. As seen above this differ quite between the scenarios. When the growth-interest-
spread is low, the relative weight of petroleum revenues increases. As supply of petroleum is
fixed, less people mean more revenues per head. The reverse is true for larger growth-interest-
spreads. Concluding, in five combinations Norway is on an unsustainable path while in the other
situations its public finances are clearly sound. However, this sensitivity analysis suggests that
Norway’s politician should not sit back and wait as even small variations of the exogenous
parameters or different outcomes regarding the demographic development could harm the
currently favorable position.
r
Even other indicators are not as sensitive relating to the different population scenarios like the
fiscal gap, the quality if this argument remains.7 The Norwegian future generation’s burden has
its minimum value in the low variant population scenario as well. But, in other cases the reaction
of the future generation’s burden is different, because the denominator of this indicator relates
to the future size of the population.8 It follows, the more people live in the future generation the
more people can help to finance the given debt of the present generation. The Norwegian
situation is different. The huge petroleum-wealth of the country causes that the smaller the
future population is the higher is the petroleum-wealth per person and therefore the lower is
the future burden per person.
7 For details see table A1 in the appendix. Our ranking from above is also confirmed given both the revenue and transfer gap. 8 For a description of other western Generational Accounts, see Hagist (2008).
17
4.4 Comparison to official fiscal sustainability analysis
As Norway is the only country to our knowledge that reports some measurement of fiscal
sustainability over the long-run in the official budget, it is clearly of interest if our numbers are
comparable to the ones that are announced in the budget of 2007.9
Mainly there are two major differences between our model and the one used by the Ministry of
Finance of Norway. Firstly, while we take the base year’s budget as given, the government of
Norway corrects for the business cycle. As 2007 was quite a good year in terms of economic
growth, these correction lowered the budget surplus from 396.62 to 341.77 billion NOK. For the
corrections the Ministry of Finance uses a Hodrick-Prescott-approach to smooth direct and
indirect taxes as well as unemployment benefits over the business cycle.10 Secondly, the
estimation of the present value of the petroleum wealth is for 2007 3,350 billion NOK which
corresponds to 147.1 per cent of GDP, 22.3 percentage points higher than our estimation via the
OECD data.11 So in sum these two effects should cancel themselves out at least to some degree.
Rather minor effects should have the probably slightly different demographic projections and
micro-profiles as at least for the demographics the key parameters (expected fertility, expected
life expectancy and expected net migration) are the same.
As the Ministry of Finance (2006) does not report fiscal gaps in our definition from equation (7),
we have to transform our fiscal gap to an annuity. Given our model and assumptions about
growth and discount rates, the Norwegian government would have to save 17.3 billion NOK
every year. If we assume a (nominal) growth rate of 3.5 percent and a (nominal) discount rate of
6 percent (the assumptions of the Ministry of Finance (2006)) as well as the petroleum wealth
with 147.1 percent of GDP and correct as the Ministry of Finance (2006) for the business cycle by
about 54.854 billion NOK, this number augments to 78.3 billion NOK every year. The Ministry of
Finance (2007) reports a band between 55.7 and 98.6 billion NOK.12 So one could state that the
official model is fairly comparable to ours. However, the Ministry of Finance (2006) only provides
one sustainability indicator and says nothing specific about the intergenerational redistribution
effects of Norway’s fiscal policy, the Government Pension Fund or the Petroleum Wealth. Given
that the Norwegian government has just recently decided on a major pension reform which will
be law in 2011, the ability to show which generations are affected in which way is not only of
academic but also of political interest. This will be the purpose of future research.
9 The budget is reported by the Ministry of Finance (2006) and can be obtained under http://www.regjeringen.no /nb/dep/fin/dok/regpubl/stmeld/20062007/Stmeld-nr-1-2006-2007-.html?id=136600&epslanguage=NO. 10 Benz and Hagist (2008) show that for Germany corrections for the business cycle do not have great impacts on the analysis with generational accounting. This seems to be different for Norway which should be the focus of more research. 11 See section 2.4 of Ministry of Finance (2006) for the present value of the petroleum wealth. 12 See section 3.3.2 of Ministry of Finance (2006) for the sustainability analysis and results.
18
5. Summary and Conclusion
The Norwegian population will pass through an ageing process during the next decades which
causes that the old-age-dependency ratio rises from currently 22 per cent up to 38 per cent in
2050 and 47 per cent in 2100. This ageing population induces increasing expenditures on old-
age and disability pensions together with health and long-term care benefits while the public
revenues from wage taxes and social contributions will decrease. At the same time, the revenues
from petroleum activities decline. Therefore, it is unclear if the Norwegian fiscal policy is really
sustainable or not even despite the formidable current conditions with a budget surplus of
nearly 14 per cent of GDP and a net wealth of 26 per cent of GDP. Is Norway over-consuming its
petroleum wealth?
The answer to this question is an economist’s favorite: It depends. As it turns out Norway comes
as close to sound public coffers as a nation with such a welfare state gets. Given that our
scenario concerning the petroleum wealth is probably rather conservative given current
developments of the oil price, Norway should have even a little scope to maneuver with only
smaller cuts of social programs compared to other countries as Germany or the U.S. However,
given that parameters are uncertain and also the demographic development remains only
theoretical given, Norway should be cautious. Of our calculated 15 cases of different
demographic developments and different growth and discount assumptions, Norway ends up in
eight of them in an unsustainable situation. As historical evidence and international comparison
shows, reforms are much easier to implement while losers of reforms can at least to a certain
amount be compensated.
To be fair, Norway seems already on this track. The existence of the Government Pension Fund
alone seems not only to restrict government spending but also spreading the petroleum wealth
equally over Norway’s living as well as future generations. If the petroleum wealth would be
consumed as it comes, elderly generations would benefit three times more than younger
generations comparing annuities. Furthermore, women are encouraged to work more which
would clearly benefit the public finances in the long-term as by now only young men carry the
burden of the social welfare state. Last but not least, Norway’s parliament passed a public
pension reform in 2007 starting 2010 which is aimed to give incentives for Norwegians to work
longer and which will take the rising life expectancy into account when calculating pension
benefits. How this will affect our generational accounting analysis will be a topic for future
research.
19
References
Auerbach, A., J. Gokhale and L. Kotlikoff (1994), Generational Accounts: a meaningful way to evaluate fiscal policy, The Journal of Economic Perspectives, 8 (1), 73-94.
Auerbach, A., J. Gokhale, L. Kotlikoff and E. Steigum (1993), Generational Accounting in Norway: Is the Nation Overconsuming its Petroleum Wealth?, Working paper series of the Federal Reserve Bank of Cleveland, 9305.
Auerbach, A., J. Gokhale and L. Kotlikoff (1992), Social security and Medicare policy from the perspective of generational accounting, Tax Policy and the Economy, 6, 129-145.
Auerbach, A., J. Gokhale and L. Kotlikoff (1991), Generational Accounts: a meaningful alternative to deficit accounting, Tax policy and the economy, 5, 55-110.
Benz, U. and C. Hagist (2008), Konjunktur und Generationenbilanz - Eine Analyse anhand des HP-Filters, Jahrbücher für Nationalökonomie und Statistik, mimeo.
Benz, U. and S. Fetzer (2006), Indicators for Measuring Fiscal sustainability: A Comparison of the OECD Method and Generational Accounting, FinanzArchiv, 62 (3), 367-391.
Bonin, H. (2001), Generational Accounting: Theory and Application, Berlin: Springer.
Fetzer, S. (2006), Zur nachhaltigen Finanzierung des gesetzlichen Gesundheitssystems, Frankfurt: Peter Lang.
Fetzer, S., A. Grasdal and B. Raffelhüschen (2005), Health and Demography in Norway, mimeo.
Gjersem, C. (2002), A Presentation of Generational Accounting in Norway, in: Nordic Journal of Political Economy, 28, 61-73.
Hagist, C. (2008), Demography and Social Health Insurance: An International Comparison Using Generational Accounting, Baden-Baden: Nomos.
Ministry of Finance (2008), The Revised National Budget 2008, Oslo.
Ministry of Finance (2006), Storting .melding nr. 1 (2006-2007) Nasjonalbudsjettet 2007, Oslo.
Raffelhüschen, B. (1999), Generational Accounting: Method, Data and Limitations, in: European Commission (eds.), European Economy, Reports and Studies, 6, Brussels, 17-28.
Steigum, E. (2002), Oil Price Risk, Prudent Fiscal Policy, and Generational Accounting, SNF Report, Institute for Research in Economics and Business Administration, 22, Bergen.
Steigum, E. (1996), Okonomisk politikk og pensionssystem i et flergenerasjonsperspektiv, in: Norman, V. (ed.): Næringspolitikk og økonomisk utvikling : Norge fra gjenreisning til gjenreisning, Oslo: Universitaets-Forlag, 167-192.
Steigum, E. and Gjersem, C. (1999), Generational Accounting and Deployable Natural Resources: The Case of Norway, in: Auerbach, A. J., Kotlikoff, L. J. and Leibfritz, W. (eds.), Generational Accounting around the World, Chicago: University of Chicago Press, 369-395.
20
Appendix
Table A1: Sensitivity Analysis of the Sustainability Indicators
Spread Indicators Population Projection
Medium High Low
g=1.5% r=4.0%
Fiscal gap (in % of GDP 2007) -49.0 -5.4 -96.9
Petroleum Revenues(in % of GDP 2007) -117.4 -117.4 -117.4
Seit 2005 erschienene Beiträge No. 1 Christian Hagist/ Norbert Klusen/ Andreas Plate/ Bernd Raffelhüschen Social Health Insurance – the major driver of unsustainable fiscal policy?
No. 2 Stefan Fetzer/ Bernd Raffelhüschen/ Lara Slawik Wie viel Gesundheit wollen wir uns eigentlich leisten?
No. 3 Oliver Ehrentraut/Matthias Heidler/Bernd Raffelhüschen En route to sustainability: history, status quo, and future reforms of the German public pension scheme?
No. 4 Jasmin Häcker/ Bernd Raffelhüschen Die Interne Rendite der Gesetzlichen Pflegeversicherung
No. 5 Jasmin Häcker/ Bernd Raffelhüschen Internal Rates of Return of the German Statutory Long-Term Care Insurance
(Englische Fassung von Diskussionsbeitrag No. 4)
No. 6 Matthias Heidler/ Bernd Raffelhüschen How risky is the German Pension System? The Volatility of the Internal Rates of Return
No. 7 Laurence J. Kotlikoff/ Christian Hagist Who’s going broke? Comparing Growth in Healthcare Costs in Ten OECD Countries
No. 9 Dirk Mevis/ Olaf Weddige Gefahr erkannt – Gefahr gebannt? Nachhaltigkeitsbilanz der 15. Legislaturperiode des deutschen Bundestages 2002-2005
No. 10 Daniel Besendorfer/ Emily Phuong Dang/ Bernd Raffelhüschen Die Schulden und Versorgungsverpflichtungen der Länder: Was ist und was kommt
No. 11 Jasmin Häcker/ Bernd Raffelhüschen Zukünftige Pflege ohne Familie: Konsequenzen des „Heimsog-Effekts“
No. 12 Christian Hagist/ Bernd Raffelhüschen/ Olaf Weddige Brandmelder der Zukunft – Die Generationenbilanz 2004
No. 13 Matthias Heidler/ Arne Leifels/ Bernd Raffelhüschen Heterogenous life expectancy, adverse selection, and retirement behavior
No. 14 Pascal Krimmer/ Bernd Raffelhüschen Grundsicherung in Deutschland - Analyse und Reformbedarf
No. 15 Ulrich Benz/ Christian Hagist Konjunktur und Generationenbilanz – eine Analyse anhand des HP-Filters
No. 16 Jasmin Häcker/ Birgit König/ Bernd Raffelhüschen/ Matthias Wernicke/ Jürgen Wettke Effizienzreserven in der stationären Pflege in Deutschland: Versuch einer Quantifizierung und Im-plikationen für die Reform der Gesetzlichen Pflegeversicherung
No. 17 Christian Hagist/ Matthias Heidler/ Bernd Raffelhüschen/ Jörg Schoder Brandmelder der Zukunft – Die Generationenbilanz Update 2007: Demografie trifft Konjunktur
No. 18 Lukas Mangelsdorff Die Geldsteuer: Vorschlag für eine radikal einfache Steuer
No. 19 Jasmin Häcker/ Tobias Hackmann/ Stefan Moog Demenzkranke und Pflegebedürftige in der Sozialen Pflegeversicherung – Ein intertemporaler Kostenvergleich
No. 20 Oliver Ehrentraut/ Matthias Heidler Demografisches Risiko für die Staatsfinanzen? – Koordinierte Bevölkerungsvorsausberechnungen im Vergleich
No. 21 Oliver Ehrentraut/ Matthias Heidler Zur Nachhaltigkeit der GRV – Status quo, Potenziale und Risiken
No. 22 Ulrich Benz/ Christian Hagist Konjunktur und Generationenbilanz – eine Analyse anhand des HP-Filters
No. 23 Ulrich Benz/ Christian Hagist Technischer Anhang zu „Konjunktur und Generationenbilanz – eine Analyse anhand des HP-Filters“
No. 24 Veronika Deeg/ Christian Hagist The Fiscal Outlook in Austria – An Evaluation with Generational Accounts
No. 25 Oliver Ehrentraut/ Bernd Raffelhüschen Demografischer Wandel und Betriebsrenten – Zur Berücksichtigung der Langlebigkeit bei der Anpassung von Direktzusagen
No. 26 Tobias Hackmann/ Stefan Moog Älter gleich kränker? Auswirkungen des Zugewinns an Lebenserwartung auf die Pflegewahr-scheinlichkeit
No. 27 Klaus Kaier/ Christian Hagist/ Uwe Frank/ Elisabeth Meyer Antimicrobial drug use, alcohol-based hand disinfection and the burden of methicillin-resistant Staphylococcus aureus – A time series approach at a German University Medical Center
No. 28 Jasmin Häcker/ Tobias Hackmann/ Thorsten Henne Sozialgesetzgebung und Beihilfeverordnungen: Ein Leistungsvergleich von Versicherten der Sozialen Pflegeversicherung und Beamten im Pflegefall
No. 29 Stefan Moog MacSim: Ein Simulationsmodell zur Analyse der gesamtwirtschaftlichen Auswirkungen der de-mografischen Entwicklung in Deutschland
No. 30 Christian Hagist/ Stefan Moog/ Bernd Raffelhüschen Ehrbarer Staat? Die Generationenbilanz – Update 2008: Migration und Nachhaltigkeit
No. 31 Klaus Kaier/ Uwe Frank/ Christian Hagist/ Elisabeth Meyer The impact of antimicrobial drug consumption and alcohol-based hand rub use on the emer-gence and spread of extended-spectrum β-lactamase (ESBL)-producing strains – A time series analysis
No. 32 Friedrich Fichtner/ Christian Hagist Oil and Intergenerational Redistribution – The case of Norway