research papers J. Appl. Cryst. (2013). 46, 55–62 doi:10.1107/S0021889812046705 55 Journal of Applied Crystallography ISSN 0021-8898 Received 10 April 2012 Accepted 12 November 2012 # 2013 International Union of Crystallography Printed in Singapore – all rights reserved Dislocation densities and prevailing slip-system types determined by X-ray line profile analysis in a textured AZ31 magnesium alloy deformed at different temperatures Bertalan Jo ´ni, a Talal Al-Samman, b Sandip Ghosh Chowdhury, c Ga ´bor Csisza ´r a and Tama ´s Unga ´r a * a Department of Materials Physics, Eo ¨ tvo ¨ s University Budapest, Hungary, b Department of Metal Physics and Physical Metallurgy, RWTH Aachen University, Germany, and c CSIR–National Metallurgical Laboratory, Jamshedpur 831007, India. Correspondence e-mail: [email protected]Tension experiments were carried out at room temperature, 473 K and 673 K on AZ31-type extruded magnesium alloy samples. The tensile deformation has almost no effect on the typical extrusion texture at any of the investigated temperatures. X-ray diffraction patterns provided by a high-angular-resolution diffractometer were analyzed for the dislocation density and slip activity after deformation to fracture. The diffraction peaks were sorted into two groups corresponding either to the major or to the random texture components in the specimen. The two groups of reflections were evaluated simultaneously as if the two texture components were two different phases. The dislocation densities in the major texture components are found to be always larger than those in the randomly oriented grain populations. The overwhelming fraction of dislocations prevailing in the samples is found to be of hai type, with a smaller fraction of hc + ai-type dislocations. The fraction of hci-type dislocations is always obtained to be zero within experimental error. 1. Introduction Mg alloys have been the subject of intense research during recent years, owing to their excellent properties, such as low density and high specific strength, and because of the increasing interest in weight savings for automotive and aerospace applications. In contrast to cubic crystals, particu- larly face-centered-cubic crystals, there are a wide variety of slip and twinning systems in hexagonal crystals, the activation of which depends strongly on the c/a ratio (Jones & Hutch- inson, 1981). Magnesium has a c/a ratio of 1.624, very close to the ideal ratio of 1.633. The onset of plastic deformation is usually characterized by the yield stress that is related to the beginning of a large scale dislocation motion. Such dislocation motion is driven by a resolved shear stress and takes place preferentially on close-packed crystallographic planes and almost exclusively in close-packed directions. This applies in magnesium to basal slip in the closest-packed plane (0001) along the closest-packed direction h11 20i (hai slip). Less densely packed slip planes and larger slip vectors, e.g. h11 23i (hc + ai slip), are more difficult to activate because the critical resolved shear stress of this slip system is considerably higher than that of basal slip. However, at higher temperatures the hc + ai slip systems can also be activated thermally (Agnew & Duygulu, 2005; Lukac & Mathis, 2002; Mathis, Nyilas et al. , 2004; Mathis et al. , 2005; Obara et al., 1973; Wang et al., 2010). This behavior is in correlation with the limited ductility and poor formability of Mg at around room temperature (Yoo, 1981). The activation of slip and twinning systems during deformation of a polycrystal dictates its texture and micro- structure evolution and thus determines its deformation behavior. The determination of the dislocation density and slip activity in different texture components was attempted by Klimanek (1994) and Klimanek et al. (1996). Hot- and cold-rolled commercial-purity titanium plates were piled together to form thick metal pieces. Plane surfaces in correlation with the texture were explored by cutting and polishing, and line profile analysis was carried out in order to determine the dislocation density in specific texture compo- nents. In the present work a novel procedure is presented with two purposes. On the one hand, for a better understanding of the plastic deformation of magnesium alloys at different temperatures, the method of X-ray line profile analysis is applied to obtain qualitative and quantitative microstructure information about dislocation densities and slip activity as a function of the temperature of deformation. On the other hand, the dislocation density and slip activity in different texture components is determined on the same sample piece without sectioning for the different reflection planes. It is also shown that the parallel-beam geometry with high angular
Transcript
research papers
J. Appl. Cryst. (2013). 46, 55–62 doi:10.1107/S0021889812046705 55
Journal of
AppliedCrystallography
ISSN 0021-8898
Received 10 April 2012
Accepted 12 November 2012
# 2013 International Union of Crystallography
Printed in Singapore – all rights reserved
Dislocation densities and prevailing slip-systemtypes determined by X-ray line profile analysis ina textured AZ31 magnesium alloy deformed atdifferent temperatures
Bertalan Joni,a Talal Al-Samman,b Sandip Ghosh Chowdhury,c Gabor Csiszara and
Tamas Ungara*
aDepartment of Materials Physics, Eotvos University Budapest, Hungary, bDepartment of Metal
Physics and Physical Metallurgy, RWTH Aachen University, Germany, and cCSIR–National
Metallurgical Laboratory, Jamshedpur 831007, India. Correspondence e-mail:
0.001 Ni, Mg (balance). Round tension specimens with 6 mm
diameter and 37 mm gauge length were machined from the
extruded material with the extrusion direction oriented
parallel to the tension direction. The tension tests were
conducted at room temperature (RT), 473 K and 673 K, at a
constant strain rate of 10�2 s�1. The samples were strained to
failure, which took place shortly after necking. The samples
deformed at elevated temperatures were immediately quen-
ched in water after completion of the tests. Stress–strain
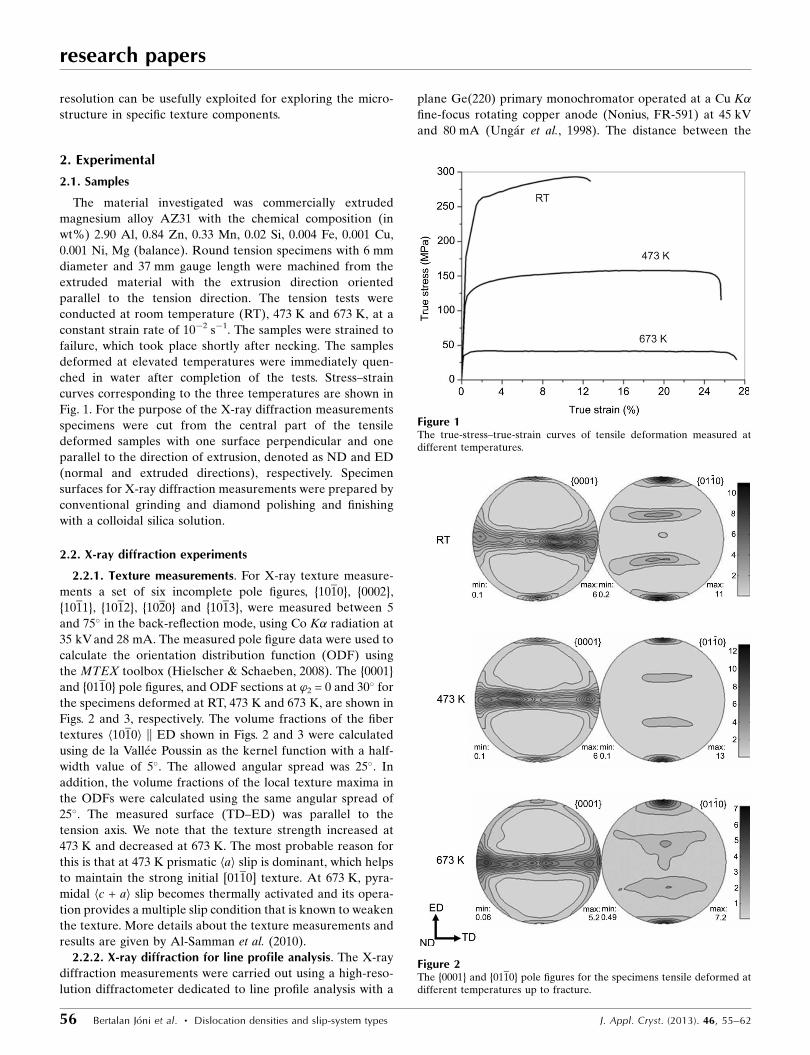
curves corresponding to the three temperatures are shown in
Fig. 1. For the purpose of the X-ray diffraction measurements
specimens were cut from the central part of the tensile
deformed samples with one surface perpendicular and one
parallel to the direction of extrusion, denoted as ND and ED
(normal and extruded directions), respectively. Specimen
surfaces for X-ray diffraction measurements were prepared by
conventional grinding and diamond polishing and finishing
with a colloidal silica solution.
2.2. X-ray diffraction experiments
2.2.1. Texture measurements. For X-ray texture measure-
ments a set of six incomplete pole figures, {1010}, {0002},
{1011}, {1012}, {1020} and {1013}, were measured between 5
and 75� in the back-reflection mode, using Co K� radiation at
35 kV and 28 mA. The measured pole figure data were used to
calculate the orientation distribution function (ODF) using
the MTEX toolbox (Hielscher & Schaeben, 2008). The {0001}
and {0110} pole figures, and ODF sections at ’2 = 0 and 30� for
the specimens deformed at RT, 473 K and 673 K, are shown in
Figs. 2 and 3, respectively. The volume fractions of the fiber
textures h1010i || ED shown in Figs. 2 and 3 were calculated
using de la Vallee Poussin as the kernel function with a half-
width value of 5�. The allowed angular spread was 25�. In
addition, the volume fractions of the local texture maxima in
the ODFs were calculated using the same angular spread of
25�. The measured surface (TD–ED) was parallel to the
tension axis. We note that the texture strength increased at
473 K and decreased at 673 K. The most probable reason for
this is that at 473 K prismatic hai slip is dominant, which helps
to maintain the strong initial [0110] texture. At 673 K, pyra-
midal hc + ai slip becomes thermally activated and its opera-
tion provides a multiple slip condition that is known to weaken
the texture. More details about the texture measurements and
results are given by Al-Samman et al. (2010).
2.2.2. X-ray diffraction for line profile analysis. The X-ray
diffraction measurements were carried out using a high-reso-
lution diffractometer dedicated to line profile analysis with a
plane Ge(220) primary monochromator operated at a Cu K�fine-focus rotating copper anode (Nonius, FR-591) at 45 kV
and 80 mA (Ungar et al., 1998). The distance between the
research papers
56 Bertalan Joni et al. � Dislocation densities and slip-system types J. Appl. Cryst. (2013). 46, 55–62
Figure 1The true-stress–true-strain curves of tensile deformation measured atdifferent temperatures.
Figure 2The {0001} and {0110} pole figures for the specimens tensile deformed atdifferent temperatures up to fracture.
source and the monochromator is 240 mm and a slit of about
160 mm is positioned before the monochromator, at a distance
of 200 mm from the X-ray source. At this distance the K�1 and
K�2 components are received by the Ge(220) crystal at a large
enough separation to allow for cutting off the K�2 component
by means of the 160 mm-wide slit. The Cu K�1 beam has a size
of about 0.2 � 3 mm on the specimen surface. The scattered
radiation is registered by three flat imaging plates (IPs) with a
linear spatial resolution of 50 mm. The first two and the third
IP are placed at distances of 500 and 300 mm from the
specimen, respectively. The first two and the third IP cover the
2� angular ranges from 30 to 52, 56 to 94 and 98 to 127�,
respectively. Since the first two IPs are at a larger distance
from the specimen they allow for a better angular resolution in
the case of the narrower peaks in the smaller angular range. In
the higher angular range the peaks are broader by nature;
therefore the somewhat smaller angular resolution in this case
provides the same relative angular resolution in the entire
angular range measured. At the same time, the shorter
specimen-to-IP distance in the higher angular range provides
better counting statistics for the considerably broader and
weaker peaks. The distances between the specimen and
detector are selected such that the instrumental effect is
always less than 10% of the physical broadening. The
diffraction geometry is of parallel-beam type, and therefore
the specimen does not have to be moved while the angular
resolution is sufficiently good over the entire angular range of
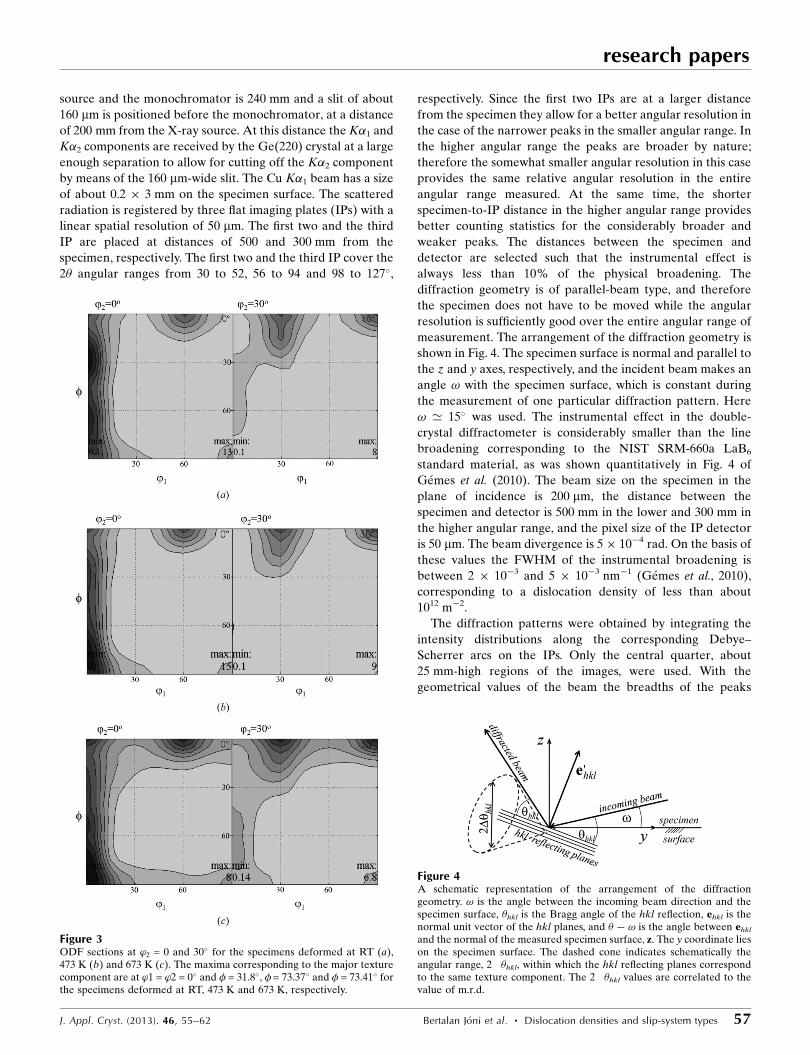
measurement. The arrangement of the diffraction geometry is
shown in Fig. 4. The specimen surface is normal and parallel to
the z and y axes, respectively, and the incident beam makes an
angle ! with the specimen surface, which is constant during
the measurement of one particular diffraction pattern. Here
! ’ 15� was used. The instrumental effect in the double-
crystal diffractometer is considerably smaller than the line
broadening corresponding to the NIST SRM-660a LaB6
standard material, as was shown quantitatively in Fig. 4 of
Gemes et al. (2010). The beam size on the specimen in the
plane of incidence is 200 mm, the distance between the
specimen and detector is 500 mm in the lower and 300 mm in
the higher angular range, and the pixel size of the IP detector
is 50 mm. The beam divergence is 5� 10�4 rad. On the basis of
these values the FWHM of the instrumental broadening is
between 2 � 10�3 and 5 � 10�3 nm�1 (Gemes et al., 2010),
corresponding to a dislocation density of less than about
1012 m�2.
The diffraction patterns were obtained by integrating the
intensity distributions along the corresponding Debye–
Scherrer arcs on the IPs. Only the central quarter, about
25 mm-high regions of the images, were used. With the
geometrical values of the beam the breadths of the peaks
research papers
J. Appl. Cryst. (2013). 46, 55–62 Bertalan Joni et al. � Dislocation densities and slip-system types 57
Figure 4A schematic representation of the arrangement of the diffractiongeometry. ! is the angle between the incoming beam direction and thespecimen surface, �hkl is the Bragg angle of the hkl reflection, ehkl is thenormal unit vector of the hkl planes, and � � ! is the angle between ehkl
and the normal of the measured specimen surface, z. The y coordinate lieson the specimen surface. The dashed cone indicates schematically theangular range, 2��hkl, within which the hkl reflecting planes correspondto the same texture component. The 2��hkl values are correlated to thevalue of m.r.d.
Figure 3ODF sections at ’2 = 0 and 30� for the specimens deformed at RT (a),473 K (b) and 673 K (c). The maxima corresponding to the major texturecomponent are at ’1 = ’2 = 0� and � = 31.8�, �= 73.37� and � = 73.41� forthe specimens deformed at RT, 473 K and 673 K, respectively.
obtained from this region are affected less than 5 �
10�4 nm�1, which is less than 5% in the case of the arcs with
the strongest curvature. This geometrical error becomes
exactly zero when the arcs straighten. Since line profile
analysis depends neither on the absolute nor on the relative
intensities of diffraction peaks, all Debye–Scherrer arcs were
integrated within the same rectangular region in all the
imaging plates used. In order to obtain the precise positions of
the diffraction peaks, diffraction patterns were also measured
in the conventional Bragg–Brentano geometry with a Philips
X’pert diffractometer.
3. Evaluation of the X-ray diffraction experiments
3.1. Identifying the diffraction peaks corresponding to thedifferent texture components
The texture measurements show that the specimens have
well developed fiber textures. The different reflections in the
diffraction patterns correspond to different grain populations.
These different grain populations may correspond to different
texture components and can have different substructures in
terms of Burgers vector types and dislocation densities.
Therefore the groups of reflections belonging to different
texture components have to be evaluated separately. The
grouping of reflections is done as follows.
We define the Cartesian coordinate system of the specimen
by the z axis normal to the specimen surface and the incoming
beam is in the yz plane. When the c and one of the a axes are
parallel to the z and y axes, respectively, the normal vector of
the (hkl) plane is
ehkl ¼ dhkl
2hþ k
31=2a;
k
a;
l
c
� �; ð1Þ
where dhkl is the separation of the (hkl) planes and a and c are
the lattice parameters. The pole figures define the orientation
of the hexagonal unit cell in the specimen. Denoting the
standard three-dimensional rotation matrix by R’1,�,’2, where
’1, �, ’2 are the Eulerian angles of rotation as defined by
Bunge (1996), the normal vectors of the (hkl) planes corre-
sponding to a specific texture are
e0hkl ¼ R’1;�;’2 ehkl: ð2Þ
With this notation, and in accordance with Fig. 4, the
diffraction angle of an (hkl) plane relative to the incoming
beam direction is
�hkl ¼ 90� � arccosðe0y cos!þ e0z sin!Þ: ð3Þ
Taking into account the multiple-of-random-distribution
(m.r.d.) values of the textures, an hkl reflection in the
measured pattern corresponds to the major texture compo-
nent if its �hkl value is within �hkl = �B � 25�, where �B is the
Bragg angle of the hkl reflection. The reflections that do not
satisfy this criterion are considered to correspond to the
random texture component (or grains). Though the reflections
are sorted into two groups, related to either the major (Ma) or
the random (R) texture components, the entire pattern is
evaluated simultaneously as if the two texture components
were two ‘phases’ in the specimen.
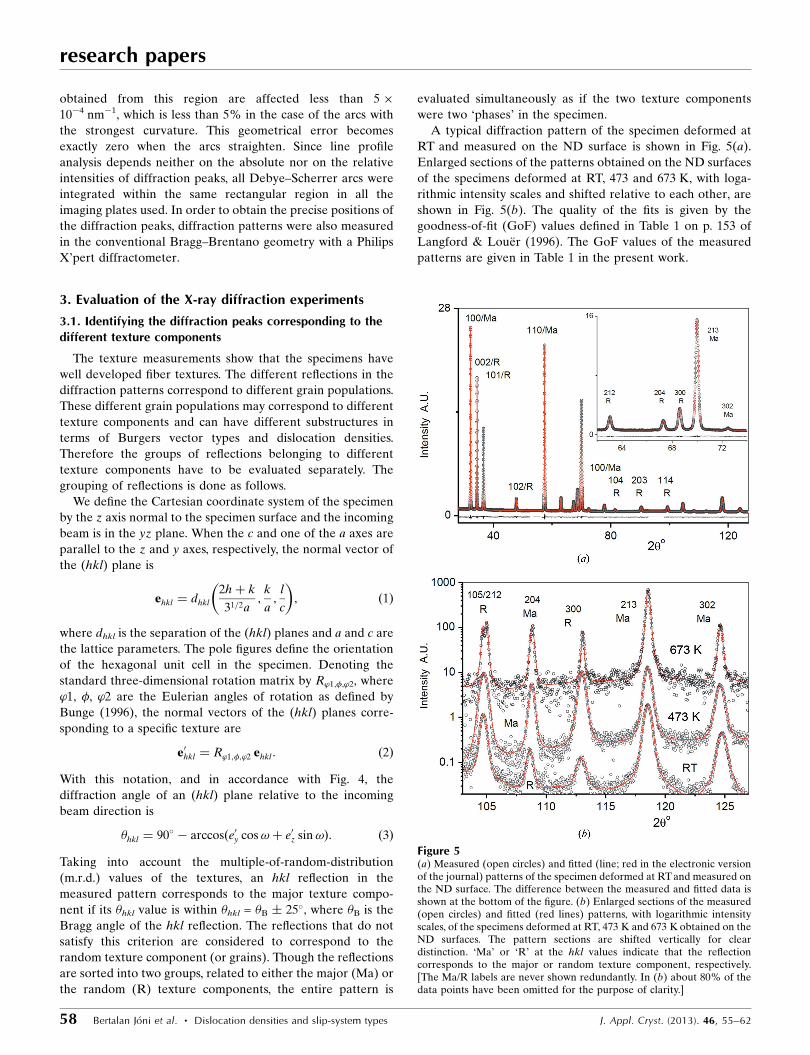
A typical diffraction pattern of the specimen deformed at
RT and measured on the ND surface is shown in Fig. 5(a).
Enlarged sections of the patterns obtained on the ND surfaces
of the specimens deformed at RT, 473 and 673 K, with loga-
rithmic intensity scales and shifted relative to each other, are
shown in Fig. 5(b). The quality of the fits is given by the
goodness-of-fit (GoF) values defined in Table 1 on p. 153 of
Langford & Louer (1996). The GoF values of the measured
patterns are given in Table 1 in the present work.
research papers
58 Bertalan Joni et al. � Dislocation densities and slip-system types J. Appl. Cryst. (2013). 46, 55–62
Figure 5(a) Measured (open circles) and fitted (line; red in the electronic versionof the journal) patterns of the specimen deformed at RT and measured onthe ND surface. The difference between the measured and fitted data isshown at the bottom of the figure. (b) Enlarged sections of the measured(open circles) and fitted (red lines) patterns, with logarithmic intensityscales, of the specimens deformed at RT, 473 K and 673 K obtained on theND surfaces. The pattern sections are shifted vertically for cleardistinction. ‘Ma’ or ‘R’ at the hkl values indicate that the reflectioncorresponds to the major or random texture component, respectively.[The Ma/R labels are never shown redundantly. In (b) about 80% of thedata points have been omitted for the purpose of clarity.]
It is noted here that, though in the present investigation we
used only one single angle of incidence, !, it is easy to apply
two or three different ! values and obtain two or three
diffraction patterns, each corresponding to a different ! value.
By collecting these different patterns the number of reflec-
tions, and thus the number of peak profiles corresponding to
the different texture components, can be increased.
3.2. Determination of the substructure parameters in termsof dislocation densities, slip-system types, twin-boundarydensities and subgrain size
The evaluation of diffraction patterns is done by assuming
that the different physical effects are superimposed by
convolution (Warren, 1959). The measured, IM(2�) diffraction
patterns are matched by the theoretically calculated and
convoluted profile functions of the effects of size, distortion
and planar defects as well as instrumental effects (IShkl, ID
hkl , ISFhkl
and IINSThkl , respectively):
IMð2�Þ ¼
Phkl
IShkl � ID
hkl � ISFhkl � IINST
hkl þ IBG; ð4Þ
whereP
hkl IShkl � ID
hkl � ISFhkl � IINST
hkl is the theoretically calcu-
lated pattern and IBG is the background determined separately
(Ribarik et al., 2004). Assuming an equiaxed shape and
lognormal size distribution the size profile is (Ungar et al.,
2001)
ISðsÞ ¼
Z1
0
xsin2ðx�sÞ
ð�sÞ2 erfc
lnðx=mÞ
21=2�
� �dx; ð5Þ
where s = (2cos�/�)��, erfc is the complementary error
function, and m and � are the median and variance of the
lognormal size-distribution density function. The Fourier
transform of the strain profile is (Warren, 1959)
FTðIDhklÞ ¼ expð�2�2L2g2
h"2g;LiÞ; ð6Þ
where g is the absolute value of the diffraction vector and L is
the Fourier variable. The mean-square strain in dislocated
crystals is given by
h"2g;Li ffi
�Cb2
4�f ðÞ; ð7Þ
where � and b are the density and the magnitude of the
Burgers vector of dislocations and C is the dislocation contrast
factor. f() is the Wilkens function, where = L/Re and Re is
the effective outer cutoff radius of dislocations (Wilkens,
1970). In a polycrystal, or if all possible slip systems are
equally populated, the dislocation contrast factors, C, can be
averaged over the permutations of the hkl indices and the
mean-square strain. If, however, more Burgers vectors can be
present, especially with different absolute values and espe-
cially in hexagonal crystals, the averaging has to be extended
over the Burgers vectors, as indicated by the bar in equation
(8) (Ungar et al., 2007).
In Mg there are a large number of slip-plane families with
three different Burgers vector types (Jones & Hutchison,
1981). The average value of Cb2 can be written as (Ungar et al.,
2007)
Cb2 ¼PNi¼1
fiCðiÞ
b2i ; ð8Þ
where N is the number of slip-plane families, CðiÞ
and bi are the
average dislocation contrast factors and the Burgers vector
magnitudes corresponding to the ith slip-plane family, and fi
are the fractions by which the particular slip-plane families
contribute to the broadening of a specific reflection. In the
case of hexagonal crystals N is equal to 11 (Jones & Hutchison,
1981). In a texture-free polycrystal or if all possible Burgers
vectors are activated in a particular slip system the dislocation
contrast factors can be averaged over the permutations of the
corresponding hkl indices (Ungar & Tichy, 1999). The average
contrast factors for a particular slip-plane family in hexagonal
crystals can be given as (Ungar et al., 1999)
CðiÞ
hk:l ¼ CðiÞ
hk:0½1þ qðiÞ1 xþ q
ðiÞ2 x2; ð9Þ
where x = (2/3)(l/ga)2, qðiÞ1 and q
ðiÞ2 are parameters depending
on the ith slip-plane family and the elastic properties of the
material, CðiÞ
hk:0 is the average contrast factor of the ith slip-
plane family corresponding to the hk.0-type reflections, and a
is the lattice constant in the basal plane. The qðiÞ1 and q
ðiÞ2
parameters and the values of CðiÞ
hk:0 have been evaluated
numerically and compiled for a large number of hexagonal
crystals and compounds by Ungar et al. (1999). The measured
values of q1 and q2, denoted as qðmÞ1 and q
ðmÞ2 , are provided by
the extended convolutional whole profile (eCMWP) evalua-
tion procedure (Balogh et al., 2009). The X-ray measurements
provide only two independent parameters: qðmÞ1 and q
ðmÞ2 . Since
the number of slip-plane families is about 11, it is not possible
to determine the fraction, fi, of each slip-plane family but only
the fractions of slip-plane family types, i.e. the fractions of hai,
hc + ai and hci family types, hhai, hhc+ai and hhci, respectively.
research papers
J. Appl. Cryst. (2013). 46, 55–62 Bertalan Joni et al. � Dislocation densities and slip-system types 59
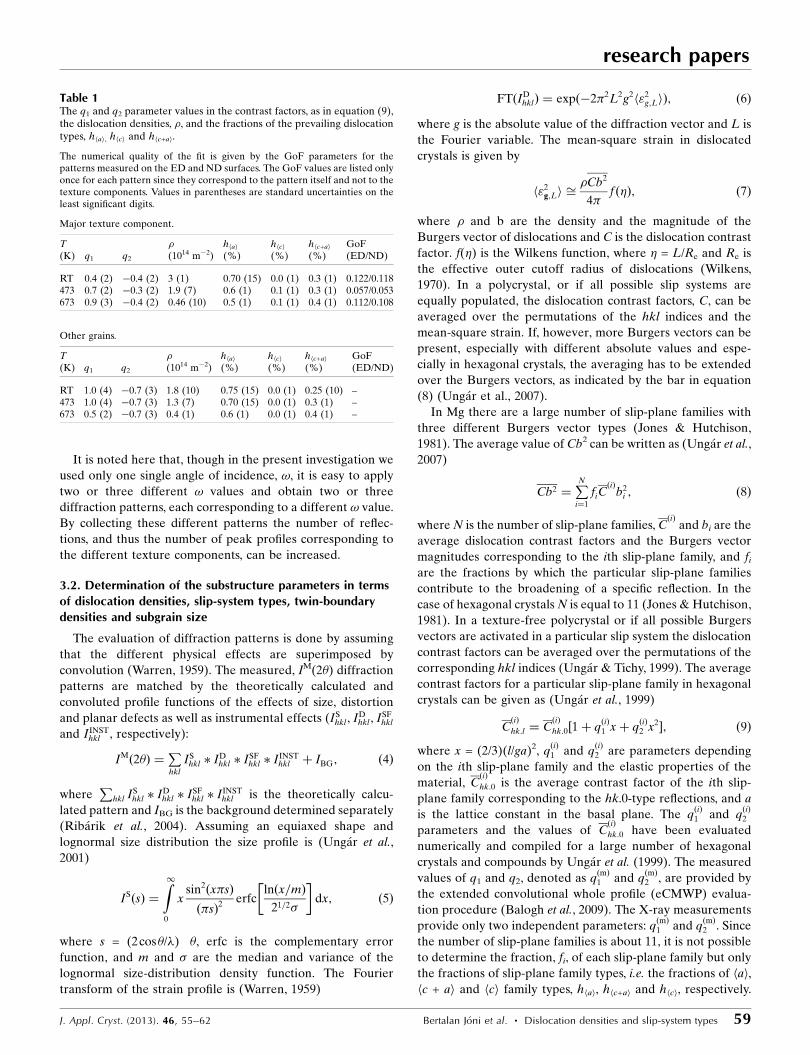
Table 1The q1 and q2 parameter values in the contrast factors, as in equation (9),the dislocation densities, �, and the fractions of the prevailing dislocationtypes, hhai, hhci and hhc+ai.
The numerical quality of the fit is given by the GoF parameters for thepatterns measured on the ED and ND surfaces. The GoF values are listed onlyonce for each pattern since they correspond to the pattern itself and not to thetexture components. Values in parentheses are standard uncertainties on theleast significant digits.
2005). As mentioned above, compression twinning is a
possible deformation mechanism in the current condition,
despite its high activation stress. However, since its volume
fraction is usually quite low, it is not likely that it would affect
the texture evolution and mechanical response in a quantita-
tive manner. At higher temperatures, i.e. at 473 and 673 K,
additional slip systems, such as pyramidal hc + ai, become
thermally activated and can thus contribute to plastic defor-
mation, which is one reason for the ductility enhancement
observed in the flow curves in Fig. 1. However, the corre-
sponding texture evolution in Fig. 2 indicates that prismatic
slip remained the dominant mechanism for strain accom-
modation, simply because the main strain component along
the ED does not require a c-axis accommodation mechanism.
The other reason for the delay of failure is dynamic recrys-
tallization during the deformation process. The calculated
volume fraction of the fiber texture with the h1010i || ED fiber
orientation (see also x2.2.1) was 0.697 at RT, 0.726 at 473 K
and 0.628 at 673 K. The calculated volume fraction of local
maxima (part of the fiber texture) was 0.314 at RT, 0.321 at
473 K and 0.279 at 673 K.
4.2. Dislocation densities and slip-system activity
The values of the q1 and q2 parameters, as defined in
equation (9), the dislocation densities, �, and the fractions of
the slip-system types, hhai, hhci and hhc+ai, corresponding to the
different temperatures of deformation are listed Table 1. All
parameter values are evaluated separately for the main
texture component and for the grain population that does not
belong to the main texture component. The latter are denoted
in the table as ‘other grains’. The values in Table 1 indicate
that (i) the dislocation density decreases strongly with the
temperature of deformation and (ii) in the main texture
component the dislocation density is larger than that in the
other grains when the deformation is performed at RT or
473 K. After deformation at 673 K the dislocation densities
are very small and almost equal within the experimental error.
The results indicate that the major part of deformation and
work hardening is carried within the grain population corre-
sponding to the main texture component. This suggests that
the grain population not within the main texture component,
i.e. the ‘other grains’, most probably acts for balancing strain
incompatibility produced during the deformation of the grain
population inside the major texture component. More specific
conclusions would require numerical polycrystal plasticity
simulations.
The slip-system types are determined by carrying out the
analysis described briefly in x3.2 and equations (8) and (9).
Here the q1 and q2 parameters in the dislocation contrast
factors in equation (9) play a crucial role. In Table 1 it can be
seen that, though these parameter values do change, the
research papers
60 Bertalan Joni et al. � Dislocation densities and slip-system types J. Appl. Cryst. (2013). 46, 55–62
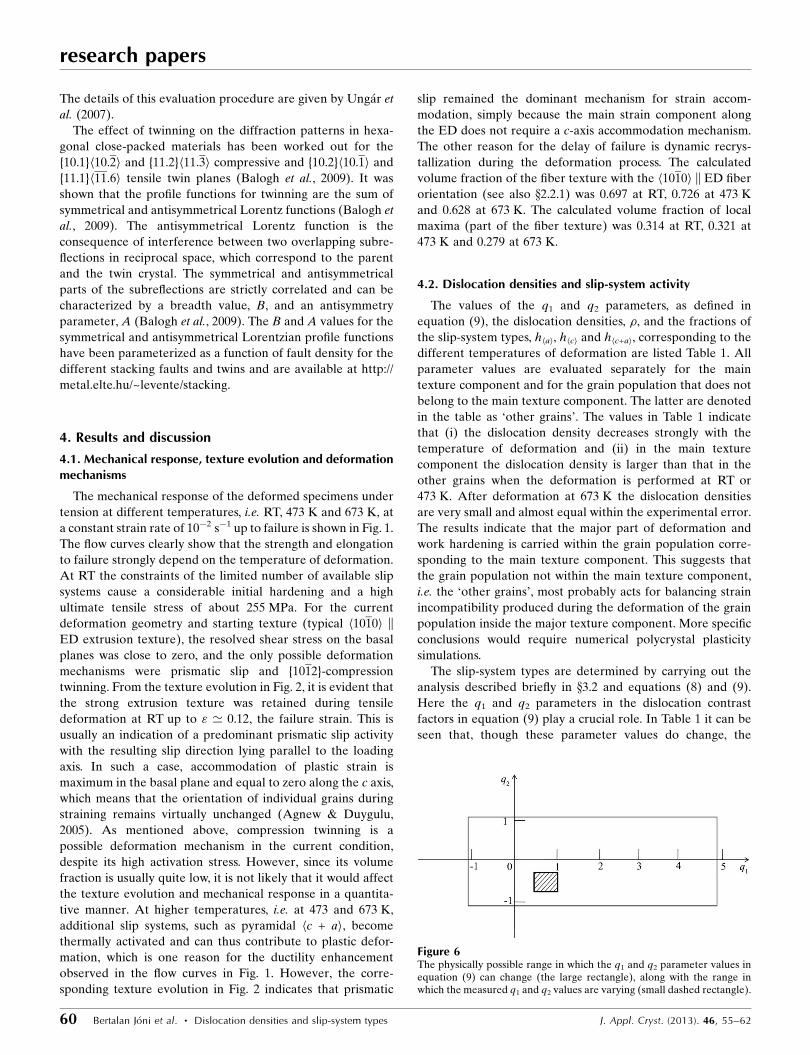
Figure 6The physically possible range in which the q1 and q2 parameter values inequation (9) can change (the large rectangle), along with the range inwhich the measured q1 and q2 values are varying (small dashed rectangle).
variation of the slip-system types is relatively small. In order to
make this situation clear, in Fig. 6 we plot the physically
possible range in which the q1 and q2 parameter values can
change (the large rectangle), along with the range in which the
measured q1 and q2 values are varying (small dashed
rectangle). The figure shows that the measured q1 and q2
values vary in a range that is relatively small compared to the
range of possible values.
From the values in Table 1 it can be seen that the largest
fraction of prevailing dislocations are of hai type, the fraction
of hc + ai-type dislocations varies between 0.25 and 0.4, and
hci-type dislocations are either missing or only present with
fractions within the experimental error. The values also indi-
cate that with increasing temperature of deformation the
fraction of hai-type dislocations decreases, whereas that of the
hc + ai-type dislocations increases concomitantly. This is in
good correlation with earlier X-ray diffraction (Mathis et al.,
2005), acoustic emission (Mathis, Chmelik et al., 2004; Mathis
et al., 2011) and transmission electron microscopy (Agnew et
al., 2002; Jain et al., 2008; Mathis et al., 2005) results. The grain
size of the specimens was of the order of about 100 mm. The
subgrain size provided by the X-ray diffraction analysis is
larger than about 500 nm in all specimens after deformation at
the three temperatures investigated here. This means that
there is practically no size effect on X-ray line broadening.
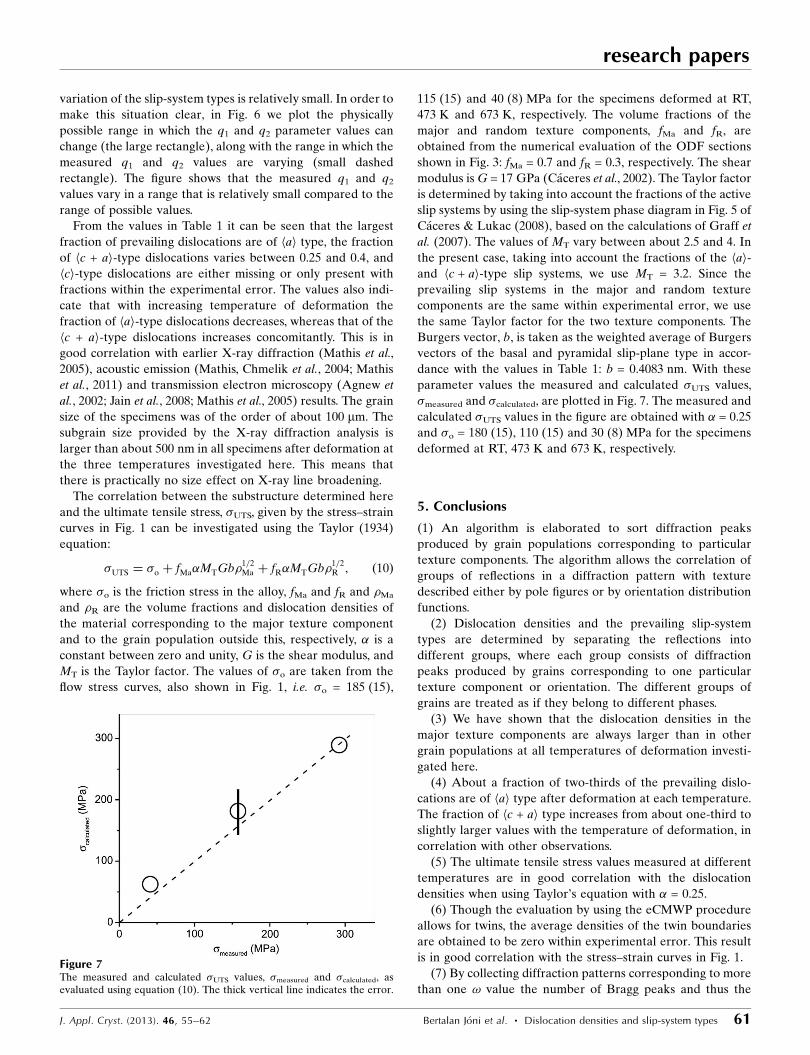
The correlation between the substructure determined here
and the ultimate tensile stress, �UTS, given by the stress–strain
curves in Fig. 1 can be investigated using the Taylor (1934)
equation:
�UTS ¼ �o þ fMa�MTGb�1=2Ma þ fR�MTGb�1=2
R ; ð10Þ
where �o is the friction stress in the alloy, fMa and fR and �Ma
and �R are the volume fractions and dislocation densities of
the material corresponding to the major texture component
and to the grain population outside this, respectively, � is a
constant between zero and unity, G is the shear modulus, and
MT is the Taylor factor. The values of �o are taken from the
flow stress curves, also shown in Fig. 1, i.e. �o = 185 (15),
115 (15) and 40 (8) MPa for the specimens deformed at RT,
473 K and 673 K, respectively. The volume fractions of the
major and random texture components, fMa and fR, are
obtained from the numerical evaluation of the ODF sections
shown in Fig. 3: fMa = 0.7 and fR = 0.3, respectively. The shear
modulus is G = 17 GPa (Caceres et al., 2002). The Taylor factor
is determined by taking into account the fractions of the active
slip systems by using the slip-system phase diagram in Fig. 5 of
Caceres & Lukac (2008), based on the calculations of Graff et
al. (2007). The values of MT vary between about 2.5 and 4. In
the present case, taking into account the fractions of the hai-
and hc + ai-type slip systems, we use MT = 3.2. Since the
prevailing slip systems in the major and random texture
components are the same within experimental error, we use
the same Taylor factor for the two texture components. The
Burgers vector, b, is taken as the weighted average of Burgers
vectors of the basal and pyramidal slip-plane type in accor-
dance with the values in Table 1: b = 0.4083 nm. With these
parameter values the measured and calculated �UTS values,
�measured and �calculated, are plotted in Fig. 7. The measured and
calculated �UTS values in the figure are obtained with � = 0.25
and �o = 180 (15), 110 (15) and 30 (8) MPa for the specimens
deformed at RT, 473 K and 673 K, respectively.
5. Conclusions
(1) An algorithm is elaborated to sort diffraction peaks
produced by grain populations corresponding to particular
texture components. The algorithm allows the correlation of
groups of reflections in a diffraction pattern with texture
described either by pole figures or by orientation distribution
functions.
(2) Dislocation densities and the prevailing slip-system
types are determined by separating the reflections into
different groups, where each group consists of diffraction
peaks produced by grains corresponding to one particular
texture component or orientation. The different groups of
grains are treated as if they belong to different phases.
(3) We have shown that the dislocation densities in the
major texture components are always larger than in other
grain populations at all temperatures of deformation investi-
gated here.
(4) About a fraction of two-thirds of the prevailing dislo-
cations are of hai type after deformation at each temperature.
The fraction of hc + ai type increases from about one-third to
slightly larger values with the temperature of deformation, in
correlation with other observations.
(5) The ultimate tensile stress values measured at different
temperatures are in good correlation with the dislocation
densities when using Taylor’s equation with � = 0.25.
(6) Though the evaluation by using the eCMWP procedure
allows for twins, the average densities of the twin boundaries
are obtained to be zero within experimental error. This result
is in good correlation with the stress–strain curves in Fig. 1.
(7) By collecting diffraction patterns corresponding to more
than one ! value the number of Bragg peaks and thus the
research papers
J. Appl. Cryst. (2013). 46, 55–62 Bertalan Joni et al. � Dislocation densities and slip-system types 61
Figure 7The measured and calculated �UTS values, �measured and �calculated, asevaluated using equation (10). The thick vertical line indicates the error.
number of peak profiles corresponding to each of the different
texture components can be increased.
TU is grateful to the Hungarian National Science Founda-
tion (OTKA; grant Nos. 71594 and 67692) for the support of
this work. The European Union and European Social Fund
have provided financial support to this project under grant
Agnew, S. R. & Duygulu, O. (2005). Int. J. Plast. 21, 1161–1193.Agnew, S. R., Horton, J. A. & Yoo, M. H. (2002). Metall. Mater. Trans.
A, 33, 851–858.Al-Samman, T., Li, X. & Chowdhury, S. G. (2010). Mater. Sci. Eng. A,
527, 3450–3463.Balogh, L., Tichy, G. & Ungar, T. (2009). J. Appl. Cryst. 42, 580–591.Bunge, H. J. (1996). Textures Microstruct. 25, 71–108.Caceres, C. H., Griffiths, J. R., Davidson, C. J. & Newton, C. L. (2002).
Mater. Sci. Eng. A, 325, 344–355.Caceres, C. H. & Lukac, P. (2008). Philos. Mag. 88, 977–989.Gemes, Gy., Balogh, L. & Ungar, T. (2010). Metall. Mater. (Kovove
Mater.), 48, 33–39.Graff, S., Brocks, W. & Steglich, D. (2007). Int. J. Plast. 23, 1957–1978.Hielscher, R. & Schaeben, H. (2008). J. Appl. Cryst. 41, 1024–1037.Jain, A., Duygulu, O., Brown, D. W., Tome, C. N. & Agnew, S. R.
(2008). Mater. Sci. Eng. A, 486, 545–555.Jones, I. P. & Hutchinson, W. B. (1981). Acta Metall. 29, 951–968.Klimanek, P. (1994). Mater. Sci. Forum, 157–162, 1119–1130.Klimanek, P., Weidner, A., Esling, C. & Philippe, M.-J. (1996).
Proceedings of the 11th International Conference on Textures of
Materials, edited by Z. Liang, L. Zuo & Y. Chu, pp. 1443–1448.Beijing: International Academic Publishers,
Langford, J. I. & Louer, D. (1996). Rep. Prog. Phys. 59, 131–234.Lukac, P. & Mathis, K. (2002). Kovove Mater. 40, 281–289.Mathis, K., Capek, J., Zdrazilova, Z. & Trojanova, Z. (2011). Mater.
Sci. Eng. A, 528, 5904–5907.Mathis, K., Chmelik, F., Trojanova, Z., Lukac, P. & Lendvai, J. (2004).
Mater. Sci. Eng. A, 387–389, 331–335.Mathis, K., Gubicza, J. & Nam, N. H. (2005). J. Alloys Compd. 394,
194–199.Mathis, K., Nyilas, K., Axt, A., Dragomir-Cernatescu, I., Ungar, T. &
Lukac, P. (2004). Acta Mater. 52, 2889–2894.Obara, T., Yoshinaga, H. & Morozumi, S. (1973). Acta Metall. 21, 845–
853.Ribarik, G., Gubicza, J. & Ungar, T. (2004). Mater. Sci. Eng. A, 387–
389, 343–347.Taylor, G. I. (1934). Proc. R. Soc. London Ser. A, 145, 362–387.Ungar, T., Castelnau, O., Ribarik, G., Drakopoulos, M., Bechade, J. L.,
Chauveau, T., Snigirev, A., Snigireva, I., Schroer, C. & Bacroix, B.(2007). Acta Mater. 55, 1117–1127.
Ungar, T., Dragomir, I., Revesz, A. & Borbely, A. (1999). J. Appl.Cryst. 32, 992–1002.
Ungar, T., Gubicza, J., Ribarik, G. & Borbely, A. (2001). J. Appl.Cryst. 34, 298–310.
Ungar, T., Ott, S., Sanders, P. G., Borbely, A. & Weertman, J. R.(1998). Acta Mater. 46, 3693–3699.
Ungar, T. & Tichy, G. (1999). Phys. Status Solidi (a), 147, 425–434.Wang, H., Raeisinia, B., Wu, P. D., Agnew, S. R. & Tome, C. N. (2010).
Int. J. Solid Struct. 21, 2905–2917.Warren, B. E. (1959). Prog. Met. Phys. 8, 147–202.Wilkens, M. (1970). Fundamental Aspects of Dislocation Theory,
edited by S. A. Simmons, R. de Wit & R. Bullough, Vol. II, NationalBureau of Standards Special Publication No. 317, p. 1195.Washington, DC: US Government Printing Office.
Yoo, M. H. (1981). Metall. Trans. A, 12, 409–418.
research papers
62 Bertalan Joni et al. � Dislocation densities and slip-system types J. Appl. Cryst. (2013). 46, 55–62