Dislocation slip stress prediction in shape memory alloys J. Wang a , H. Sehitoglu a,⇑ , H.J. Maier b a Department of Mechanical Science and Engineering, University of Illinois at Urbana-Champaign, 1206 W. Green St., Urbana, IL 61801, USA b Institut für Werkstoffkunde, Leibniz Universität Hannover, An der Universität 2, D-30823 Garbsen, Germany article info Article history: Received 25 March 2013 Received in final revised form 26 August 2013 Available online xxxx Keywords: Peierls stress Extended Peierls–Nabarro model Shape memory alloy Dislocation slip Generalized stacking fault energy abstract We provide an extended Peierls–Nabarro (P–N) formulation with a sinusoidal series repre- sentation of generalized stacking fault energy (GSFE) to establish flow stress in a Ni 2 FeGa shape memory alloy. The resultant martensite structure in Ni 2 FeGa is L1 0 tetragonal. The atomistic simulations allowed determination of the GSFE landscapes for the (1 1 1) slip plane and 1 2 ½ 101; 1 2 ½ 110; 1 6 ½ 211and 1 6 ½11 2slip vectors. The energy barriers in the (1 1 1) plane were associated with superlattice intrinsic stacking faults, complex stacking faults and anti-phase boundaries. The smallest energy barrier was determined as 168 mJ/m 2 corresponding to a Peierls stress of 1.1 GPa for the 1 6 ½11 2ð111Þ slip system. Experiments on single crystals of Ni 2 FeGa were conducted under tension where the spec- imen underwent austenite to martensite transformation followed by elasto-plastic mar- tensite deformation. The experimentally determined martensite slip stress (0.75 GPa) was much closer to the P–N stress predictions (1.1 GPa) compared to the theoretical slip stress levels (3.65 GPa). The evidence of dislocation slip in Ni 2 FeGa martensite was also identified with transformation electron microscopy observations. We also investigated dis- location slip in several important shape memory alloys and predicted Peierls stresses in Ni 2 FeGa, NiTi, Co 2 NiGa, Co 2 NiAl, CuZn and Ni 2 TiHf austenite in excellent agreement with experiments. Ó 2013 Elsevier Ltd. All rights reserved. 1. Introduction 1.1. Background Shape memory alloys with high temperature (Chumlyakov et al., 2008; Hamilton et al., 2006a,b, 2007; Hartl et al., 2010; Oikawa et al., 2003; Omori et al., 2004; Santamarta et al., 2006; Sutou et al., 2004) and magnetic actuation capabilities (Arndt et al., 2006; Brown et al., 2002; Kokorin et al., 1992; Planes et al., 1997; Pons et al., 2005; Ullakko et al., 1996; Zheludev et al., 1996) have generated considerable recent interest. The development of such alloys has traditionally relied on processing of different chemical compositions, making polycrystalline ingots, and then taking the expensive route of making single crys- tals. Then, the alloys have been tested under temperature or stress cycling, and in the case of ferromagnetic shape memory alloys under applied magnetic fields (Ullakko et al., 1996). Additional tests may be necessary to establish the elastic con- stants, lattice constants and to determine the twinning stress and the slip stress of the austenite and martensite phases. There are numerous advantages to establishing the material performance in advance of the lengthy experimental procedures with simulations to accelerate the understanding of these alloys and to establish a number of key properties. Therefore, rapid assessment of potential alloys can be ascertained via determination of twinning, slip and phase transformation barriers, the stability of different phases (austenite and martensite), their respective elastic constants, and lattice constants. In this paper 0749-6419/$ - see front matter Ó 2013 Elsevier Ltd. All rights reserved. http://dx.doi.org/10.1016/j.ijplas.2013.08.017 ⇑ Corresponding author. E-mail address: [email protected](H. Sehitoglu). International Journal of Plasticity xxx (2013) xxx–xxx Contents lists available at ScienceDirect International Journal of Plasticity journal homepage: www.elsevier.com/locate/ijplas Please cite this article in press as: Wang, J., et al. Dislocation slip stress prediction in shape memory alloys. Int. J. Plasticity (2013), http:// dx.doi.org/10.1016/j.ijplas.2013.08.017
Transcript
International Journal of Plasticity xxx (2013) xxx–xxx
Contents lists available at ScienceDirect
International Journal of Plasticity
journal homepage: www.elsevier .com/locate / i jp las
Dislocation slip stress prediction in shape memory alloys
0749-6419/$ - see front matter � 2013 Elsevier Ltd. All rights reserved.http://dx.doi.org/10.1016/j.ijplas.2013.08.017
Please cite this article in press as: Wang, J., et al. Dislocation slip stress prediction in shape memory alloys. Int. J. Plasticity (2013)dx.doi.org/10.1016/j.ijplas.2013.08.017
J. Wang a, H. Sehitoglu a,⇑, H.J. Maier b
a Department of Mechanical Science and Engineering, University of Illinois at Urbana-Champaign, 1206 W. Green St., Urbana, IL 61801, USAb Institut für Werkstoffkunde, Leibniz Universität Hannover, An der Universität 2, D-30823 Garbsen, Germany
a r t i c l e i n f o
Article history:Received 25 March 2013Received in final revised form 26 August2013Available online xxxx
Keywords:Peierls stressExtended Peierls–Nabarro modelShape memory alloyDislocation slipGeneralized stacking fault energy
a b s t r a c t
We provide an extended Peierls–Nabarro (P–N) formulation with a sinusoidal series repre-sentation of generalized stacking fault energy (GSFE) to establish flow stress in a Ni2FeGashape memory alloy. The resultant martensite structure in Ni2FeGa is L10 tetragonal. Theatomistic simulations allowed determination of the GSFE landscapes for the (111) slipplane and 1
2 ½�101�; 12 ½�110�; 1
6 ½�211� and 16 ½11 �2� slip vectors. The energy barriers in the
(111) plane were associated with superlattice intrinsic stacking faults, complex stackingfaults and anti-phase boundaries. The smallest energy barrier was determined as168 mJ/m2 corresponding to a Peierls stress of 1.1 GPa for the 1
6 ½11 �2�ð111Þ slip system.Experiments on single crystals of Ni2FeGa were conducted under tension where the spec-imen underwent austenite to martensite transformation followed by elasto-plastic mar-tensite deformation. The experimentally determined martensite slip stress (0.75 GPa)was much closer to the P–N stress predictions (1.1 GPa) compared to the theoretical slipstress levels (3.65 GPa). The evidence of dislocation slip in Ni2FeGa martensite was alsoidentified with transformation electron microscopy observations. We also investigated dis-location slip in several important shape memory alloys and predicted Peierls stresses inNi2FeGa, NiTi, Co2NiGa, Co2NiAl, CuZn and Ni2TiHf austenite in excellent agreement withexperiments.
� 2013 Elsevier Ltd. All rights reserved.
1. Introduction
1.1. Background
Shape memory alloys with high temperature (Chumlyakov et al., 2008; Hamilton et al., 2006a,b, 2007; Hartl et al., 2010;Oikawa et al., 2003; Omori et al., 2004; Santamarta et al., 2006; Sutou et al., 2004) and magnetic actuation capabilities (Arndtet al., 2006; Brown et al., 2002; Kokorin et al., 1992; Planes et al., 1997; Pons et al., 2005; Ullakko et al., 1996; Zheludev et al.,1996) have generated considerable recent interest. The development of such alloys has traditionally relied on processing ofdifferent chemical compositions, making polycrystalline ingots, and then taking the expensive route of making single crys-tals. Then, the alloys have been tested under temperature or stress cycling, and in the case of ferromagnetic shape memoryalloys under applied magnetic fields (Ullakko et al., 1996). Additional tests may be necessary to establish the elastic con-stants, lattice constants and to determine the twinning stress and the slip stress of the austenite and martensite phases.There are numerous advantages to establishing the material performance in advance of the lengthy experimental procedureswith simulations to accelerate the understanding of these alloys and to establish a number of key properties. Therefore, rapidassessment of potential alloys can be ascertained via determination of twinning, slip and phase transformation barriers, thestability of different phases (austenite and martensite), their respective elastic constants, and lattice constants. In this paper
2 J. Wang et al. / International Journal of Plasticity xxx (2013) xxx–xxx
we focus on the slip stress determination with simulations and compare the results to experiments. We combine the ab-ini-tio calculations with a modified mesoscale Peierls–Nabarro based formulation to determine stress levels for slip in closeagreement with experiments.
We utilize the Ni2FeGa as an example system to illustrate our methodology and then show its applicability to the mostimportant SMAs. The Ni2FeGa alloys are a new class of shape memory alloys (SMAs) and have received significant attentionbecause of high transformation strain magnitudes (>12% in tension and >6% in compression) and low temperature hysteresis.They also have the potential for magnetic actuation and high temperature shape memory (Hamilton et al., 2007; Omori et al.,2004). The magnetic actuation requires twinning at low stress magnitudes, and high temperature shape memory can onlyoccur in the presence of considerable slip resistance. These alloys are proposed to be a good alternative to the currently stud-ied ferromagnetic Ni2MnGa-based SMAs due to their superior ductility in tension (Barandiarán et al., 2008; Oikawa et al.,2002; Sutou et al., 2004; Yu et al., 2009). There are several crystal structures identified in Ni2FeGa (Hamilton et al.,2006a, 2007; Whang et al., 1998), which exhibits martensitic transformations from L21 cubic austenite to intermediate10M/14M modulated monoclinic martensites, and finally to the L10 tetragonal martensite (Efstathiou et al., 2008; Hamiltonet al., 2008; Masdeu et al., 2005; Sutou et al., 2004). However, one can get a single stage transformation from L21 to L10 astemperature is increased (Hamilton et al., 2007), also in the case of nano-pillars (Ozdemir et al., 2012), and upon aging treat-ment (Chumlyakov et al., 2012). Therefore, a study on the L10 martensite is both scientifically interesting and technologicallyrelevant. The phase transformation of Ni2FeGa has been experimentally observed and theoretically investigated using atom-istic simulations (Efstathiou et al., 2008; Hamilton et al., 2006a; Martynov, 1995; Segui et al., 2005; Sehitoglu et al., 2012).The results show that the L21 austenite requires high stress levels for dislocation slip while undergoing transformationnucleation at much lower stress magnitudes (Sehitoglu et al., 2012). However, the plastic deformation of L10 martensitevia dislocation slip has not been fully understood, although it is very important in understanding the shape memoryperformance.
Fig. 1 shows a schematic of the stress–strain curve of Ni2FeGa at temperatures in the range 75� C to 300 �C where L21 candirectly transform to L10. These temperatures are significantly above the austenite finish temperature. The initial phase ofNi2FeGa is L21 and it transforms to L10 when the stress level reaches the transformation stress. The transformation occursat a near plateau stress followed by elastic deformation of martensite. With further deformation, dislocation slip (of L10)takes place at a critical stress designated as rslip. This stress is much higher than the transformation stress. During unloading,the reverse phase transformation occurs with plastic (residual) strain remaining in Ni2FeGa as part of the deformation cannotbe recovered.
It is well known that plastic deformation occurs via dislocation glide; and at the atomic level, dislocation glide occursupon shear of atomic layers relative to one another in the lattice. At the dislocation core scale, quantum mechanics describethe atomic level interactions and the forces exerted on atoms; while at the mesoscale level, elastic strain fields of defectsaddress the interactions (Kibey, 2007). The ensemble of dislocations and their interactions with the microstructure definethe continuum behavior.
With atomistic simulations one can gain a better understanding of the lattice parameters and the unstable fault energiesof L10. Therefore, atomistic simulations in this case will provide additional insight into material’s behavior and the deforma-tion mechanisms (Ezaz et al., 2011). Fig. 2 shows the different length scales associated with plasticity of transforming Ni2-
FeGa alloys. The generalized stacking fault energy (GSFE) surface (c-surface) at the atomic level (via atomistic simulationsusing density functional theory (DFT)) is shown at the lowest length scale. Of particular interest is the (111) plane, and from
Fig. 1. Schematic illustration of the stress–strain curve showing the martensitic transformation from L21 to L10, and the dislocation slip in L10 of Ni2FeGa atelevated temperature. After unloading, plastic (residual) strain is observed in the material as deformation cannot be fully recovered.
Please cite this article in press as: Wang, J., et al. Dislocation slip stress prediction in shape memory alloys. Int. J. Plasticity (2013), http://dx.doi.org/10.1016/j.ijplas.2013.08.017
Fig. 2. Schematic description of the different length scales associated with plasticity in Ni2FeGa alloys.
J. Wang et al. / International Journal of Plasticity xxx (2013) xxx–xxx 3
the entire c-surface the propensity of slip in multiple directions can be established. The energy landscape for slip that is cal-culated is rather complex for the case of ordered shape memory alloys resulting in complex faults and anti-phase boundaries.
In the material science and meso-contiunuum mechanics field, coupling the various length scales involved in order tounderstand the plastic deformation still remains a major challenge (McDowell, 2010). The Peierls–Nabarro (P–N) model rep-resents a mesoscale level integration of atomistic and elasticity theory considerations. It accounts for the dislocation cores onone hand and lattice resistance to flow by applying continuum concepts to elastic deformation at the atomic scale (Kibey,2007). The model has stood the test of time over many years, and its main contribution is that the P–N stress level for dis-location glide is much lower than ideal stress calculations (Carrez et al., 2006; Hartford et al., 1998; Nabarro, 1947; Peierls,1940). The calculations for P–N stress represent the breakaway of atoms within the core region of the dislocation. If the coreis narrow the stress required to overcome the barrier is higher compared to the case of a wider core, and smaller Burgersvectors require lower stress for glide. Different slip systems in fcc, bcc and ordered crystals can be evaluated, and the mostfavorable planes and directions can be readily identified. Thus, the P–N model predicts stresses for dislocation slip more pre-cisely than the theoretical shear strength obtained directly from atomistic simulations.
In this study, the P–N model with modifications will be utilized to study the slip resistance. In Fig. 2, the disregistry aboveand below the slip plane is shown which will be explained later in the paper. This results in a solution for the slip distribution(disregistry) within the core that exhibits a non-monotonic variation as a function of core position. We have made observa-tions of slip during experiments in this paper and also in pseudoelasticity experiments at constant temperature. The dislo-cation slip was identified upon heating–cooling within the transformation electron microscopy (TEM) via in-situobservations. Finally, we compared the calculated slip stresses with experimental measurements of slip stress under com-pression loading to strain exceeding 6%. The agreement is excellent considering the complexity of real microstructures andthe idealizations adopted in theoretical models.
The occurrence of dislocation slip is noted at the macro-scale by observing non-closure of the strain-temperature curvesin Fig. 2. For example, upon cooling the austenite reverts to martensite and upon heating the reverse transformation occurs.If the entire process is reversible, the transformation strain in forward and reverse directions is identical. If plastic deforma-tion develops, there is a residual strain upon heating to austenite. We are not attempting to predict the entire strain-tem-perature response at the continuum level (shown in Fig. 2) because multiple slip-twin systems and multi-phaseinteractions are governing. Our purpose is to point out the complexity of an isolated mechanism, mainly the dislocation glidebehavior that contributes to the irreversibility.
1.2. Dislocation slip mechanism
So far, the investigation of L10 Ni2FeGa martensite has been mostly through experimental research. Its properties are notwell understood although it is very important to establish its dislocation slip behavior. The L10 Ni2FeGa has a tetragonalstructure with no modulation (Hamilton et al., 2008; Sutou et al., 2004). The modulation refers to the internally sheared crys-tal structures with periodic displacements. As a fundamental deformation mechanism, dislocation slip plays a critical role indefining the mechanical properties of SMAs, especially their irreversibility of transformation (Ezaz et al., 2013; Gall and Ma-ier, 2002; Sehitoglu et al., 2012). It is likely that the material can exhibit different dislocation slip modes (planes and direc-tions), which are activated at different stress levels. To quantitatively understand the experimentally observed dislocationslip, a detailed study via atomistic simulations is needed to determine active slip systems and compare with experimentalfindings. It is possible to investigate the dislocation slip via generalized stacking fault energy (GSFE) curves. GSFE is the
Please cite this article in press as: Wang, J., et al. Dislocation slip stress prediction in shape memory alloys. Int. J. Plasticity (2013), http://dx.doi.org/10.1016/j.ijplas.2013.08.017
4 J. Wang et al. / International Journal of Plasticity xxx (2013) xxx–xxx
interplanar potential energy determined by rigidly sliding one half of a crystal over the other half (Hartford et al., 1998; Luet al., 2000). It was first introduced by Vitek (1968) and is a comprehensive definition of the fault energy associated withdislocation motion (Sehitoglu et al., 2012). By taking the maximum slope of the GSFE curve, the theoretical shear strengthof the lattice along the slip direction is obtained. This stress is the upper bound on the flow stress of materials (Carrez et al.,2006; Joós and Duesbery, 1997) and is a much larger value compared to the experiments.
The Peierls–Nabarro (P–N) model is essentially based on continuum mechanics applied to lower length scales and ad-dresses the dislocation structure by applying the elasticity theory and energetics from atomistic simulations. This model cal-culates stresses for dislocation slip more precisely. The corresponding Peierls stress sp is the minimum external stressrequired to move a dislocation irreversibly through a crystal and can be considered as the critical resolved shear stress at0 K (Cordier et al., 2012; Wang et al., 2001; Wheeler et al., 2013). The slip system with lowest sp will be the dominant systemin the crystal (Lu et al., 2000; Miranda and Scandolo, 2005; Nabarro, 1997). Recently, there has been renewed interest in cal-culating Peierls stress of dislocation by applying the P–N model (Lu et al., 2000; Schoeck, 1999). This is motivated by theadvance of reliable first-principles calculations using DFT to determine the GSFE (c energy) landscapes. However, whenthe GSFE curve comprises of multiple minima corresponding to various fault configurations, it cannot be approximated wellby a single sinusoidal function as used in the original P–N model. Therefore, the representation of the P–N model needs to bemodified to consider this complexity, which is described in detail in this study and applied for the dislocation slip calcula-tions in L10 Ni2FeGa.
1.3. Purpose and scope
A fundamental understanding of the dislocation slip that plays a key role in the shape memory behavior of L10 Ni2FeGa iscurrently lacking, which is essential for understanding the mechanical response. Four possible slip systems in L10 martensite,12 h�101�ð111Þ, 1
2 h�110�ð111Þ 16 h�211�ð111Þ and 1
6 h11 �2�ð111Þ are considered in Ni2FeGa. Three related types of planar defects,superlattice intrinsic stacking fault (SISF), complex stacking fault (CSF) and anti-phase boundary (APB), are analyzed. Wenote that due to the tetragonality of the L10 lattice of Ni2FeGa, the dislocation behavior of 1
6 ½11 �2� is different from 16 ½�211�
(similarly, 12 ½�101� is different from 1
2 ½�110�), which results in different energy levels as reported in Section 3.2. Thus, in thispaper the Miller indices with mixed parentheses huvw] and {hkl) are used in order to differentiate the first two equivalentindices (corresponding to the a and b axis in the L10 lattice) from the third (corresponding to the tetragonal c axis), whichindicate that all permutations of the first two indices are allowed, whereas the third one is fixed (Appel et al., 2011). Thepurpose of this paper is to investigate the possible slip systems existing in L10 Ni2FeGa, and to determine the most likelyone by calculating the Peierls stresses and compare it with experimental observations. The results indicate that the mobilityof the 1
6 ½11 �2� partial dislocation in the slip plane (111) is controlling the plasticity of L10 Ni2FeGa.
2. DFT calculation setup
We utilized DFT to precisely determine the undeformed and deformed energy states of L10 Ni2FeGa during shearing incertain slip systems. The first-principles total-energy calculations were carried out using the Vienna ab initio SimulationsPackage (VASP) with the projector augmented wave (PAW) method and the generalized gradient approximation (GGA)(Kresse and Furthmuller, 1996; Kresse and Hafner, 1993). Monkhorst Pack 9 � 9 � 9 k-point meshes were used for theBrillouin-zone integration to ensure the convergence of results. An energy cut-off of 500 eV was used for the plane-wavebasis set. The total energy was converged to less than 10�5 eV per atom. We have used an n-layer based cell to calculatefault energies to generate GSFE curves in the different slip systems. We assessed the convergence of the GSFE energieswith respect to increasing n, which indicates that the fault energy interaction in adjacent cells due to periodic boundaryconditions will be negligible. The convergence is ensured once the energy calculations for n and n + 1 layers yield the sameGSFE. In the present work, n was taken as 10 in order to obtain the convergent results. For each shear displacement u, afull internal atom relaxation, including perpendicular and parallel directions to the fault plane, was allowed for minimiz-ing the short-range interaction between misfitted layers near to the fault plane. This relaxation process caused a smalladditional atomic displacement r (jrj ¼ ffiffiffiffiffiffiffiffiffiffiffiffiffiffiffiffiffiffiffiffiffiffiffiffi
rx þ ry þ rzp
) in magnitude within 1% of the Burgers vector b. Thus, the total faultdisplacement is not exactly equal to u but involves additional r. The total energy of the deformed (faulted) crystal wasminimized during this relaxation process through which atoms can avoid coming too close to each other during shear(Fu and Yoo, 1992; Juan and Kaxiras, 1996; Paidar, 1976). From the calculation results of dislocation slip, we note thatthe energy barrier after full relaxation was near 10% lower than the barrier where the relaxation of only perpendicularto the fault plane was allowed.
3. Simulation results and discussion
3.1. The L10 crystal structure
We note that two different unit cells are used in literature to describe the L10 crystal structure. One is directly derivedfrom the L21 body centered cubic (bcc) axes forming a body centered tetragonal (bct) structure (Fig. 3a); the other one is
Please cite this article in press as: Wang, J., et al. Dislocation slip stress prediction in shape memory alloys. Int. J. Plasticity (2013), http://dx.doi.org/10.1016/j.ijplas.2013.08.017
Fig. 3. L10 unit cell of Ni2FeGa. (a) The body centered tetragonal (bct) structure of L10 is constructed from eight bct unit cells and has lattice parametersffiffiffi2p
a,ffiffiffi2p
a and 2c. The blue, red and green atoms correspond to Ni, Fe and Ga atoms, respectively. The Fe and Ga atoms are located at corners and Ni atomsare at the center. The fct structure shown in brown dashed lines is constructed from the principal axes of L10. (b) The fct structure of L10 with latticeparameters a, a and 2c contains two fct unit cells. (For interpretation of the references to color in this figure legend, the reader is referred to the web versionof this article.)
J. Wang et al. / International Journal of Plasticity xxx (2013) xxx–xxx 5
constructed from the principal axes of L10 forming the face centered tetragonal (fct) structure (shown in brown dashed linesin Fig. 3a). We note that if 2c ¼
ffiffiffi2p
a, Fig. 3a represents the L21 cubic structure; while if 2c –ffiffiffi2p
a, it is the L10 tetragonalstructure. In this paper, the L10 fct structure is considered and its corresponding lattice parameters are shown in Fig. 3b. Notethat the tetragonal axis is 2c, so the L10 unit cell contains two fct unit cells.
The lattice parameter of L21 cubic was calculated as 2ao = 5.755 Å in our previous study (Sehitoglu et al., 2012). During themartensitic transformation from L21 cubic to L10 tetragonal in Ni2FeGa, the unit cell volume can be changed since the mate-rial is always energetically more stable with lower energy level. For a certain unit cell volume of L10 tetragonal, there aremany combinations of parameters c and a (or tetragonal ratio c/a), and one of these ratios yields the structure with the min-imum energy level. To compute the unit cell volume change DV during the martensitic transformation, we considered a ser-ies of values DV=V0 (�3% to 3%), where V0 is the L21 unit cell volume as the reference. For any DV=V0, we changed thetetragonal ratio c/a from 0.55 to 1.1 and found that the minimum crystal structural energy almost always remains at a c/a ratio of 0.95. The crystal structural energy as a function of c/a in varying DV=V0 was calculated and is shown inFig. 4(a) (only a part of the calculated curves for a series of DV=V0 is shown for clarity). The lowest energy level among aseries of DV=V0 was found at a DV=V0 of�0.76% and the corresponding crystal structure was L10. Fig. 4(b) is a high resolutionplot of the red dashed lines in (a) showing the minimum energy level at the c/a ratio of 0.95 in the volume change DV=V0 of�0.76%. This energy was lower than L21 by 12.4 meV/atom, which indicates that the L10 is energetically more stable. The L10
lattice parameters were calculated as a = b = 3.68 Å, and c = 3.49 Å in Table 1 and they were in a good agreement with exper-imental measurements (Sutou et al., 2004). We note that the alloy in the experiment is off stoichiometry (Ni54Fe19Ga27) [2]compared to our simulations (Ni50Fe25Ga25), which causes the slight difference of the lattice parameters. These preciselydetermined lattice parameters form the foundation of atomistic simulations in this study. In the following section, we estab-lish GSFE curves based on these parameters.
3.2. Dislocation slip of L10 Ni2FeGa
From the classical dislocation theory, the most favorable slip systems should contain the close-packed lattice planes andthe Burgers vectors with shortest shear displacements. Thus, dislocation slip in the L10 fct structure favors the {111} planesalong close or relatively close packed directions. The {111} planes are preferred planes as in fcc metals (Appel et al., 2011),but the favorable dislocations in these planes are not identified. It is well known that superdislocations of the L10 structure
Please cite this article in press as: Wang, J., et al. Dislocation slip stress prediction in shape memory alloys. Int. J. Plasticity (2013), http://dx.doi.org/10.1016/j.ijplas.2013.08.017
Fig. 4. (a) Crystal structural energy variation with tetragonal ratio c/a for a series of unit cell volume changes DV=V0, where L21 is considered as thereference volume V0. The L10 tetragonal structure was found at a c/a of 0.95 for DV=V0 of �0.76%. (b) High resolution plot corresponding to the red dashedlines in (a). (For interpretation of the references to color in this figure legend, the reader is referred to the web version of this article.)
Table 1VASP-PAW-GGA calculated L10 tetragonal lattice parameters, unit cell volume change DV/V0 and structuralenergy relative to L21 cubic in Ni2FeGa compared with experimental data.
L10 tetragonal structure Experiment (Sutou et al., 2004) Theory (this study)
Lattice parameter (Å) a 3.81 3.68c 3.27 3.49
Volume change DV/V0 (%) �0.65 �0.76Structural energy relative to L21 (meV/atom) – �12.4
The dash indicates that experimental data were not available for comparison.
6 J. Wang et al. / International Journal of Plasticity xxx (2013) xxx–xxx
can split into different types of partial dislocations with smaller Burgers vectors and smaller planar fault energies (Ehmannand Fähnle, 1998; Liu et al., 2007; Paidar, 2004). Fig. 5 shows a top view from the direction perpendicular to the (111) slipplane with three-layers of atoms stacking in L10 Ni2FeGa. Four dislocations in this plane are presented: superdislocations[�110], 1
2 ½11 �2� and ½�101�, and partial dislocations, 16 h�211i. Three types of planar defects, SISF (superlattice intrinsic stacking
fault), CSF (complex stacking fault) and APB (anti-phase boundary) are marked on certain positions. We note that due to thenon-unity tetragonal ratio c/a of 0.95, the 1
6 ½�211� dislocation vector is slightly larger (by 1.03) compared to 16 ½11�2�. The super-
dislocation can split into the related Shockley partials, according to the dislocation reaction:
Pleasedx.doi
ð1Þ
ð2Þ
cite this article in press as: Wang, J., et al. Dislocation slip stress prediction in shape memory alloys. Int. J. Plasticity (2013), http://.org/10.1016/j.ijplas.2013.08.017
Fig. 5. Possible dislocations and atomic configurations of L10 Ni2FeGa in the (111) plane. Different sizes of atoms represent three successive (111) layersfrom the top view. Dislocations ½�1 10�, 1
2 ½11 �2�, ½�101� and 16 h�211i are shown in different colors corresponding to Eqs. (1)–(3). Three types of planar defects,
SISF CSF and APB are marked on certain positions.
1 For
Fig. 6. Schematic of construction of slip movements that result in SISF, CSF and APB in the (111) plane.
J. Wang et al. / International Journal of Plasticity xxx (2013) xxx–xxx 7
Pleasedx.doi
ð3Þ
The different colors1 in these equations correspond to Fig. 5 and represent the different dislocations and fault energies. Wenote that the superdislocation 1
2 ½11 �2� in Eq. (3) cannot be divided into three equal 16 ½11 �2� partials due to a much higher energy
barrier (the detailed analysis is in Appendix A).The planar defects SISF, CSF and APB are defined by pure movement of one half of a crystal over the other half in the (111)
plane. The movement forms metastable positions corresponding to local minimum energies, which govern the dislocationslip behavior of L10 Ni2FeGa. Fig. 6 shows a schematic of the construction of SISF, CSF and APB in the (111) plane due to atommovements along different directions. As denoted earlier, the three different atom sizes indicate three (111) layers of atomsstacking. A SISF is produced, when the in-plane atoms and all atoms above are shifted along the Burgers vector 1
6 ½11 �2�. Thisdisplacement results in a stacking sequence where the in-plane Ga atoms lie directly above the out-of-plane Ga atoms. A CSFis generated, when the in-plane atoms and all atoms above are shifted along the Burgers vector 1
6 ½�12 �1�. This displacementresults in a stacking sequence where the in-plane Ga atoms lie directly above the out-of-plane Ni atoms. An APB is formedwhen the in-plane atoms and all atoms above are shifted along the Burgers vector 1
2 ½�110� (or 12 ½10 �1�). This displacement re-
sults in a stacking sequence where the in-plane Ga atoms lie directly above the in-plane Fe (or Ni) atoms.The slip plane and directions of possible slip systems in L10 Ni2FeGa are shown in Fig. 7. The slip plane (111) is shown in
Fig. 7a (shaded violet), which is the same as in fcc metals. We note that if the tetragonal axis is denoted as c, not 2c, the cor-responding slip plane will be (112). Fig. 7b shows four dislocations 1
2 ½�101�, 12 ½�110�, 1
6 ½�211� and 16 ½11 �2� in the (111) plane
with Burgers vectors 2.54 Å, 2.6 Å, 1.49 Å, and 1.45 Å, respectively. The non-unity tetragonal ratio c/a results in different Bur-gers vectors between 1
2 ½�101� and 12 ½�110�, and 1
6 ½�211� and 16 ½11 �2�.
interpretation of color in Eqs. (1)–(3), the reader is referred to the web version of this article.
cite this article in press as: Wang, J., et al. Dislocation slip stress prediction in shape memory alloys. Int. J. Plasticity (2013), http://.org/10.1016/j.ijplas.2013.08.017
Fig. 7. Slip plane and dislocations of possible slip systems in L10 Ni2FeGa. (a) The shaded violet area represents the slip plane (111) and (b) four dislocations12 ½�101�, 1
2 ½�11 0�, 16 ½�21 1� and 1
6 ½11 �2� are shown in the (111) plane.
Fig. 8. Dislocation slip in the (111) plane with dislocation 16 ½11 �2� of L10 Ni2FeGa. (a) The perfect L10 lattice observed from the ½1 �10� direction. The slip plane
(111) is marked with a brown dashed line. (b) The lattice after a rigid shear with dislocation 16 ½1 1 �2�, u, shown in a red arrow. (For interpretation of the
references to color in this figure legend, the reader is referred to the web version of this article.)
8 J. Wang et al. / International Journal of Plasticity xxx (2013) xxx–xxx
The dislocation slip energy barriers and the faults (SISF, CSF and APB) are all characterized by the GSFE curve, which iscalculated while one elastic half crystal is translated relative to the other in the slip plane along the slip direction (Ezazet al., 2011). The 1
6 ½11 �2�ð111Þ case of L10 Ni2FeGa is illustrated in Fig. 8 showing the configuration of slip in the plane(111) with dislocation 1
6 ½11 �2�. Fig. 8a is the perfect L10 lattice before shear, while Fig. 8b is the lattice after shear by oneBurgers vector, u ¼ 1
6 ½11 �2� (1.45 Å), in the slip plane.All fault energies can be computed as a function of shear displacement u and are determined relative to the energy of the
undeformed L10. The calculated shear displacements for the slip systems 12 ½�101�ð111Þ; 1
2 ½�110�ð111Þ, 16 ½�211�ð111Þ and
16 ½11 �2�ð111Þ were normalized by their respective Burgers vectors, and the corresponding GSFE curves are shown in Fig. 9.
Please cite this article in press as: Wang, J., et al. Dislocation slip stress prediction in shape memory alloys. Int. J. Plasticity (2013), http://dx.doi.org/10.1016/j.ijplas.2013.08.017
Fig. 9. GSFE curves (initial portion for one Burgers vector only) of 12 ½�101�, 1
2 ½�110�, 16 ½�211� and 1
6 ½11 �2� dislocations in the (111) plane of L10 Ni2FeGa. Thecalculated shear displacement, u, was normalized by the respective Burgers vector, b.
J. Wang et al. / International Journal of Plasticity xxx (2013) xxx–xxx 9
We note that the dislocation 12 ½�101� possesses the highest energy barrier of 932 mJ/m2 (APB, 316 mJ/m2). For the other three
dislocations, the energy barriers decrease in the sequence of 12 ½�110�, 1
6 ½�211� and 16 ½11 �2�, corresponding to 723 mJ/m2 (APB,
179 mJ/m2), 360 mJ/m2 (CSF, 273 mJ/m2) and 168 mJ/m2 (SISF, 85 mJ/m2), respectively.The generalized stacking fault energy surface (c surface) describes the energy variation when one half of a crystal is rig-
idly shifted over the other half with different fault vectors lying in a given crystallographic plane. To determine the c surfacecorresponding to the DFT derived c curves shown in Fig. 9, we chose a fourth order cosine-sine polynomial (Liu and Johnson,2009), which can appropriately represent the energy variation in the (111) plane, i.e.
Pleasedx.doi
cðk1; k2Þ ¼Xmþn64
m;n¼0
amn½Xðk1Þ�m½Xðk2Þ�n½1� dm0dn0� þXmþn64
m;n¼1
bmn½Xðk1Þ�m½Yðk2Þ�n ð4Þ
where k1 and k2 are coefficients for fault vectors e in the (111) plane and e = k1e1 + k1e1, where e1 ¼ 16 ½11 �2� and e2 ¼ 1
2 ½�110�are unit vectors along the ½11 �2� and ½�110� directions, respectively. ½XðxÞ� ¼ ½1� cosðpxÞ� and [Y(x)] = [sin(px)]. dij representsKronecker’s delta (dij is 1(0) if i is (not) equal to j). Fig. 10(a) shows the c surface for the (111) plane of L10 Ni2FeGa with the xaxis along the ½11 �2� direction, and the y axis along ½�110�. Fig. 10(b) is a two-dimensional projection of the c surface in the(111) plane.
3.3. Peierls–Nabarro model for dislocation slip
The original P–N framework is based on a simple cubic crystal containing a dislocation with Burgers vector b shownin Fig. 11(a). Glide of the dislocation with this Burgers vector leaves behind a perfect crystal. This approach yields a var-iation in the GSFE with a periodicity of b and thus the c energy can be approximated by using a single sinusoidal func-tion as seen next. To calculate the Peierls stress for dislocation slip, a potential energy of displacement associated withthe dislocation movement, misfit energy Es
cðuÞ, must be determined. This energy depends on the position of the dislo-cation line, u, within a lattice cell and reflects the lattice periodicity, thus it is periodic (Joós et al., 1994; Ogataet al., 2005; Schoeck, 1999) as shown in Fig. 11(b). The misfit energy Es
cðuÞ across the glide plane is defined as thesum of misfit energies between pairs of atomic planes and can be obtained from the GSFE at the local disregistry. Withobtained dislocation profiles and considering the lattice discreteness, the Es
cðuÞ can be expressed as follows (Juan andKaxiras, 1996):
EscðuÞ ¼
Xþ1m¼�1
cðf ðma0 � uÞÞa0 ð5Þ
Where a0 is the periodicity of EscðuÞ and defined as the shortest distance between two equivalent atomic rows in the direction
of the dislocation’s displacement, f(x) is the disregistry function representing the relative displacement (disregistry) of thetwo half crystals in the slip plane along the x direction, and u is the position of the dislocation line (Carrez et al., 2007;Joós and Duesbery, 1997; Lejcek, 1973).By using the Frenkel expression (Tadmor and Miller, 2011), the c[f(x)] from GSFEcan be written as follows:
c½f ðxÞ� ¼ cmax
21� cos
2pf ðxÞb
� �ð6Þ
cite this article in press as: Wang, J., et al. Dislocation slip stress prediction in shape memory alloys. Int. J. Plasticity (2013), http://.org/10.1016/j.ijplas.2013.08.017
Fig. 10. (a) Generalized stacking fault energy surface (c surface) for the (111) plane in L10 Ni2FeGa. (b) A two-dimensional projection of the c surface in the(111) plane. The x axis is taken along the ½11 �2� direction, and y axis along ½�110�.
10 J. Wang et al. / International Journal of Plasticity xxx (2013) xxx–xxx
where cmax is the unstable stacking fault energy for GSFE, and b is the dislocation Burgers vector. Fig. 11(c) shows a schematicof c[f(x)] as a single sinusoidal function of f ðxÞ
b .The solution of the disregistry function f(x) in the dislocation core is assumed to be of the Peierls type (Joós and Duesbery,
1997):
Pleasedx.doi
f ðxÞ ¼ b2þ b
parctan
xf
� �ð7Þ
where f ¼ h2ð1�mÞ is the half-width of the dislocation for an isotropic solid (Joós et al., 1994), h is the interspacing between two
adjacent slip planes and m is Poisson’s ratio. Fig. 11(d) shows the normalized f ðxÞb variation with x
f.After substituting Eqs. (6) and (7) into Eq. (5), we have the following formula of Es
cðuÞ:
EscðuÞ ¼
Xþ1m¼�1
c½f ðma0 � uÞ�a0 ¼Xþ1
m¼�1
cmax
21þ cos 2tan�1 ma0 � u
f
� �� �� �a0 ð8Þ
The Peierls stress sp is the maximum stress required to overcome the periodic barrier in EscðuÞ and defined as the maxi-
mum slope of EscðuÞ with respect to u (shown Fig. 11(d)) as follows:
sp ¼ max1b
dEscðuÞdu
( )ð9Þ
The Peierls stress sp is smaller than the theoretical shear strength (sshear)nuc and predicts experimental values more pre-cisely. This is due to the fact that sp is determined not only by the energy barrier from GSFE curves, but also by the characterof the dislocation slip distribution (Medvedeva et al., 1996). In this study, Peierls stresses of dislocation slip in L10 Ni2FeGawere calculated based on the above equations. However, for the slip case of superdislocations dissociated to partial disloca-tions, the disregistry function f(x) in Eq. (7) needs to be modified to include these partial dislocations with separation
cite this article in press as: Wang, J., et al. Dislocation slip stress prediction in shape memory alloys. Int. J. Plasticity (2013), http://.org/10.1016/j.ijplas.2013.08.017
Fig. 11. Schematic illustration of Peierls–Nabarro model for dislocation slip. (a) A simple cubic crystal containing a dislocation with Burgers vector b. h isthe interspacing between adjacent two slip planes. The relative displacement of the two half crystals in the slip plane along x direction, xA � xB, is defined asthe disregistry function f(x). (b) Schematic illustration showing the periodic misfit energy Es
cðuÞ as a function of the position of the dislocation line, u. ThePeierls stress sp is defined as the maximum slope of Es
cðuÞ with respect to u. (c) Schematic showing the c[f(x)] energy (GSFE curve) as a single sinusoidalfunction of f ðxÞ
b . (d) Schematic showing the normalized f ðxÞb variation with x
f.
J. Wang et al. / International Journal of Plasticity xxx (2013) xxx–xxx 11
distances. Additionally, when the GSFE curve involves local minimum energy locations representing stacking faults, a singlesinusoidal function in Eq. (6) cannot approximate it well and must be revised by applying multiple sinusoidal functions to fitit. The details of these modifications are described in Section 3.4.
3.4. Peierls stress calculations of L10 Ni2FeGa
To determine the Peierls stresses required to move the dislocations, the misfit energies EscðuÞ derived from GSFE curves
must be calculated based on the method described in Section 3.3. However, for the case of GSFE curve comprising SISF,CSF and APB, the Es
cðuÞ description is more complex than for simple fcc or bcc metals as a single sinusoidal function cannotapproximate the GSFE curve well. Thus, revising the misfit energy formulation considering multiple sinusoidal functions tofit GSFE curves is necessary. For the case of the ½�110� superdislocation dissociated into four partials with smaller Burgersvectors as given in Eq. (1), the GSFE curve is shown in Fig. 12.
The separations of the partial dislocations d1 = 0.538 nm and d2 = 1.85 nm are calculated by the condition that the forcedue to the surface tension of stacking faults balances the mutual repulsion of partials (Crawford et al., 1973; Sehitoglu et al.,2012; Stroh, 1958; Whelan et al., 1957) (calculation details in Appendix B). The disregistry function f(x) can be described inEq. (10) by considering the multiple partials, and Fig. 13 shows the normalized f ðxÞ
b variation with xf. In Fig. 13, d1 and d2 are the
distances between partial dislocations, and their values depend on the CSF and APB:
Pleasedx.doi
f ðxÞ ¼ bp
arctanxf
� �þ arctan
x� d1
f
� �þ arctan
x� ðd1 þ d2Þf
� �þ arctan
x� ð2d1 þ d2Þf
� �� �þ 2b ð10Þ
We note that this GSFE curve does not fit a single sinusoidal relation; instead, it is approximated by a sinusoidal seriesfunction. Thus, the corresponding misfit energy is presented as the explicit form in Eq. (11), and Fig. 14 shows the misfitenergy Es
cðuÞ variation with the lattice period a0. Two quantities ðEscÞa0=2
and ðEscÞp in the plot are denoted. The ðEs
cÞa0=2
cite this article in press as: Wang, J., et al. Dislocation slip stress prediction in shape memory alloys. Int. J. Plasticity (2013), http://.org/10.1016/j.ijplas.2013.08.017
Fig. 12. Upon shearing the superdislocation ½�11 0�, the dissociation into four partials and the associated CSF and APB energies are determined. The unstablestacking fault energies cus1 = cus2 = 360 mJ/m2 (energy barriers); the stable stacking fault energies cs1 = 273 mJ/m2 (CSF) and cs2 = 179 mJ/m2 (APB).
Fig. 13. The disregistry function f(x) for the superdislocation ½�110� dissociated into four partials 16 h�21 1�. The separation distances of the partial dislocations
are indicated by d1 and d2.
Fig. 14. Misfit energy EscðuÞ for the superdislocation ½�1 10� dissociated into four partials 1
6 h�2 11�.
12 J. Wang et al. / International Journal of Plasticity xxx (2013) xxx–xxx
represents the minimum of EscðuÞ function and provides an estimate of the core energy of dislocations. The ðEs
cÞp is defined asthe Peierls energy, which is the amplitude of the variation of Es
cðuÞ and the barrier required to move dislocations (Joós et al.,1994).
Pleasedx.doi
cite this article in press as: Wang, J., et al. Dislocation slip stress prediction in shape memory alloys. Int. J. Plasticity (2013), http://.org/10.1016/j.ijplas.2013.08.017
J. Wang et al. / International Journal of Plasticity xxx (2013) xxx–xxx 13
Pleasedx.doi
EscðuÞ ¼
X6
n¼1
ðEscÞnðuÞ ¼
X0
m¼�1
cus1
21� cos
2pf ðma0 � uÞb
� �a0 þ
X1m¼1
cus1 � cs1
21� cos
2pf ðma0 � uÞb
� �� �a0
þX1
m¼�1
cus2 �cs1þcs2
2
2
1� cos2pf ðma0 � uÞ
b
� �� �a0 þ
X1m¼�1
cus2 �cs1þcs2
2
2
1� cos2pf ðma0 � uÞ
b
� �� �a0
þX0
m¼�1
cus1 � cs1
21� cos
2pf ðma0 � uÞb
� �� �a0 þ
X1m¼1
cus1
21� cos
2pf ðma0 � uÞb
� �a0 ð11Þ
Once the misfit energy is determined, the Peierls stress sp can be calculated by the maximum of 1b
dEscðuÞdu . As mentioned be-
fore, by taking the maximum slope of the GSFE curve, the theoretical shear strength ðsshearÞnuc for each slip system is ob-tained. The corresponding shear modulus l can then be approximately determined as l = 2p(sshear)nuc (Hosford, 2005).The calculated shear modulus l, theoretical shear strength (sshear)nuc and Peierls stress sp for the four slip systems of L10 Ni2-
FeGa are shown in Table 2. We note that sp is smaller than (sshear)nuc and predicts experimental values more precisely, asdescribed in Section 3.3. However, the theoretical shear strength (sshear)nuc follows the trend of the Peierls stress sp for thesefour slip systems.
Combining the results of ðsshearÞnuc and sp, we note that the 16 ½11 �2� has the lowest stress levels and will be most likely the
first to activate. Both of the 12 ½�110� and 1
2 ½�101� dislocations possess significantly higher ðsshearÞnuc and sp values than 16 ½�211�
and 16 ½11 �2�, so these superdislocations will split into 1
6 h211i partials and planar defects left between them as shown in Eqs.(1) and (2). However, when the Schmid factor associated with internal shear stresses provides a larger contribution, the glideof 1
2 ½�101� and 12 ½�110� superdislocations can also be activated. Thus, the Peierls stress calculated in combination with the P–N
model and GSFE curves provides a basis for a theoretical study of the dislocation structure and operative slip modes in L10
Ni2FeGa.
4. Experimental observations and viewpoints on martensite deformation behavior
4.1. In-situ TEM observations of dislocation slip
Understanding the dislocation slip behavior of shape memory alloys is extremely relevant to understanding the shapememory performance. The higher the resistance to martensite slip, the superior the shape memory performance.
During dynamic evolution of phase boundaries, both austenite and martensite may undergo slip due to the high internalstress fields. Because observations of slip are difficult to make during the loading experiments, one way to prepare the sam-ples for such observations is to subject the specimens to phase change, remove the sample, and then conduct heating coolingexperiments in an transmission electron microscope (TEM). The first portion of the experiment is sometimes referred to astraining to obtain a two way shape memory effect. During this experiment one can transform the austenite to the L10 phaseunder stress and interrupt the experiment at room temperature, so one can retain the martensite L10 phase. Then, samplesare cut from the L10 specimens, which are observed in the TEM. Cooling in the TEM further allows observations of the evo-lution of dislocation slip behaviors. Such experiments were conducted and the results confirm dislocation slip in the mar-tensitic phase. To ensure that the resultant phase is the L10 phase and not the 10M/14M intermediate martensites, thestress is raised in a stair case fashion to sufficiently high levels, and diffraction peaks were collected to index the martensiteL10 phase. When the stress is not sufficiently high (less than 40 MPa), the diffraction peaks corresponded to 14M, an inter-mediate martensitic structure. When the stress was 80 MPa, the final martensitic phase observed was L10. These results areshown in Figs. 15 and 16 for applied stress levels of 40 MPa and 80 MPa respectively.
At tensile stress of 40 MPa, the transformation steps were L21 � 10M � 14M shown in Fig. 15. We note that the strainsaturates at nearly 6.2% and the formation of 14M structure is confirmed with diffraction measurements at room tempera-ture. The inset shows a selected area diffraction (SAD) pattern of the 14M structure.
When the tensile stress was increased to 80 MPa, the transformation steps (cooling) were L21 ? 10M ? 14M ? L10
shown in Fig. 16. The strain saturates approximately at 9.5% and the crystal structure is L10 at room temperature. The insetshows a SAD pattern of the L10 structure. Compared to the maximum strain of 6.2% in the transformation L21 -� 10M � 14M in Fig. 15, we note that once 14M ? L10 forms, the L10 detwins in tension. Because the test is interruptednear room temperature the specimen has not reverted to the austenitic phase (L21). In the second phase of the experiments,
cite this article in press as: Wang, J., et al. Dislocation slip stress prediction in shape memory alloys. Int. J. Plasticity (2013), http://.org/10.1016/j.ijplas.2013.08.017
Fig. 15. The tensile strain-temperature response at 40 MPa describing the inter-martensitic transformation L21 � 10 M � 14 M. Red arrows along thecurve indicate directions of cooling and heating. A SAD pattern is insetted showing the culmination in formation of the 14 M structure. (For interpretation ofthe references to color in this figure legend, the reader is referred to the web version of this article.)
Fig. 16. The tensile strain-temperature response at 80 MPa indicating the martensitic transformation from the austenite L21 to the non-modulatedmartensite L10. A SAD pattern in the inset shows resulting L10 structure. The sample is removed from the load frame at ‘T’ and studied with TEM under in-situ temperature cycling.
14 J. Wang et al. / International Journal of Plasticity xxx (2013) xxx–xxx
the sample that is shown in Fig. 16 was subsequently studied by TEM via in-situ heating and cooling. The existence of dis-locations slip of L10 at �6 �C is shown in Fig. 17.
4.2. Determination of martensite slip stress from experiments
Our previous compression experiments show that as the temperature increases to 150 �C, the austenite L21 can directlytransform to L10 martensite bypassing the intermartensite 10M/14M (Hamilton et al., 2007). A series of experiments wereconducted to study the martensite slip behavior (L10) subsequent to austenite to martensite transformation. These experi-ments involve compression loading of [001] oriented single crystals of Ni54Fe19Ga27 at a constant temperature of 150 �C. Atypical compressive stress–strain curve is shown in Fig. 18. The samples were originally in the L21 state and directly trans-formed to the L10 regime when the loading reached the martensitic transformation stress of 450 MPa. Upon further loading,the samples were in a fully L10 state and dislocation slip was observed as the stress magnitude exceeded 1500 MPa. Afterunloading, a finite amount of plastic strain remained due to residual dislocations in the L10. Because the [001] orientationin L21 corresponds to [001] in L10 (Fig. 3), the Schmid factor for the compressive axis [001] and dislocation slip system
Please cite this article in press as: Wang, J., et al. Dislocation slip stress prediction in shape memory alloys. Int. J. Plasticity (2013), http://dx.doi.org/10.1016/j.ijplas.2013.08.017
Fig. 17. Upon cooling to �6 �C, the TEM image displays the martensite phase L10 with h112i{111} dislocation slip in a Ni54Fe19Ga27 (at %) single crystal.
Fig. 18. Compressive stress–strain response of Ni54Fe19Ga27 at a constant temperature of 150 �C.
Table 3Comparison of experimental and predicted slip stress levels for L10 N2FeGa.
Slip system Crystal structure Present theory (GPa) Experiment (GPa)
(111) 16 ½11 �2� L10 1.1 0.7–1.0
J. Wang et al. / International Journal of Plasticity xxx (2013) xxx–xxx 15
½11 �2�ð111Þ in L10 is near 0.5. The shear stress of dislocation slip in L10 at a temperature of 150 �C is then calculated as750 MPa. We note that the Peierls stress is the shear stress required to move a dislocation at 0 K, where the thermal activa-tion is absent and the dislocation moves only due to the influence of stress. On the other hand, at finite temperature, thedislocation movement can be assisted by both thermal activation and stress, and thus the shear stress for dislocation motionis lower than the one required at 0 K (Cordier et al., 2012; Wang, 1996). Therefore, our Peierls stress of 1.1 GPa can be com-pared with the experimental value of 750 MPa (Table 3); while the theoretical shear strength of 3.65 GPa is much higherthan the experimental data. This verification demonstrates that the extended P–N formulation provides a useful and rapidprediction of the dislocation slip stress.
Please cite this article in press as: Wang, J., et al. Dislocation slip stress prediction in shape memory alloys. Int. J. Plasticity (2013), http://dx.doi.org/10.1016/j.ijplas.2013.08.017
Table 4Predicted Peierls stresses for shape memory alloys are compared to known reported experimental values. The slip systems and crystal structures of SMAs aregiven. (L21 and B2 are the crystal structures in austenite phase.)
Material Crystalstructure
Slip system Critical shear stress-present theory (GPa)
Critical shear stress-experiment (GPa)
Ni2FeGa L21 ð1 �10Þ 14 ½111� 0.63 0.40–0.65
(Timofeeva et al., 2012)Co2NiGa B2 (011)[100] 0.76 0.40–0.70
(Chumlyakov et al., 2008b; Karaman and Lagoudas, 2006)Co2NiAl B2 (011)[100] 0.72 0.60–0.80
(Chumlyakov et al., 2008b; Dilibal et al., 2011)NiTi B2 (011)[100]
ð011Þ½1 �11�0.711.2
0.40–0.80(Chumlyakov et al., 2008a; Efstathiou and Sehitoglu, 2008; Ezaz et al., 2013;Sehitoglu et al., 2001)
Ni2TiHf B2 (011)[100] 0.78 0.55–0.75(Coughlin et al., 2012; Wang et al., 1999)
CuZn B2 ð011Þ½1 �11� 0.08 0.03–0.07(Romero et al., 1988; Wollmershauser et al., 2009)
16 J. Wang et al. / International Journal of Plasticity xxx (2013) xxx–xxx
5. Prediction of dislocation slip stress for shape memory alloys
To validate the extended P–N formulation for dislocation slip, we calculated Peierls stresses predicted from the model forseveral important shape memory alloys in austenite phase and compared to the experimental slip stress data. The martensiteslip stress levels are rather high as we show in this study (1.1 GPa versus 0.63 GPa). The austenite slip stress levels, on theother hand, are more readily available in the experiments and are also very important. The austenite of these materials (Ni2-
FeGa, Co2NiGa, Co2NiAl, NiTi, CuZn and Ni2TiHf) possess the L21 and B2 cubic structures. We found excellent agreement be-tween the predicted values and experimental data shown in Table 4. For each material, the lattice type, the slip system, andthe experimental range of critical slip stresses and the theory are shown. If the ideal stress levels are included, these exceedseveral GPa and are much higher than experiments. Interestingly, the critical stress for CuZn, which has excellent transfor-mation properties, but suffers from plastic deformation, exhibits the lowest levels. For austenitic NiTi the most likely slipsystem is (011)[100] with a slip stress level of 0.71 GPa consistent with experiments.
The experimental slip stress data are taken from the plot of critical stress vs. temperature. In all the studied materials, asimilar stress vs. temperature correlation is observed such that near the Md temperature the material undergoes slip. Thecritical stress for martensitic transformation increases with temperature above Af and the critical stress for dislocation slipof austenite decreases with temperature. When these two values cross at the temperature Md, the stress-induced martensitictransformation is no longer possible, but the dislocation slip of austenite dominates the mechanical response. The criticalaustenite slip stress at Md is considered as the relevant experimental data for austenite slip and compared to the (Peierlsbased) present theory.
6. Summary
The present work focuses on the dislocation slip mechanism of L10 Ni2FeGa, and the rationalization of why 16 ½11 �2� is the
favorable dislocation slip system. The simulations underscore a significant quantitative understanding of Ni2FeGa and ex-tend the Peierls–Nabarro (P–N) formulation for the study of complex faults.
The calculated lattice parameters of L10 are in good agreement with the available experimental results, which form thefoundation of the GSFE and Peierls stress calculation. We identified the energies and stresses required for dislocations move-ment of L10 Ni2FeGa. To address this issue, we precisely established the GSFE curves and determined energy barriers andplanar faults (SISF, CSF and APB) for possible dislocations, 1
6 ½11 �2�, 16 ½�211�, 1
2 ½�110� and 12 ½�101�. The theoretical shear stresses
(sshear)nuc were estimated from the maximum slope of the GSFE curves in Table 2. The (sshear)nuc forms the upper bound of themechanical strength of the material and it is much higher than experimental results. Once the GSFE curves were established,the Peierls stresses sp were calculated based on the extended P–N model. The determination of misfit energy is rather com-plex and considers the presence of multiple partials.
We illustrated with the energy barrier and Peierls stress sp that 16 ½11 �2� is preferred over other dislocations in L10 Ni2FeGa.
The slip system 16 ½11 �2� (111) possesses the smallest barrier of 168 mJ/m2 and corresponding Peierls stress of 1.1 GPa. We
note that both of the superdislocations 12 ½�110� and 1
2 ½�101� can split into 16 h211i partials while planar defects (SISF, CSF
and APB) are formed during their dissociation process. However, we emphasize that the glide of 12 ½�101� and 1
2 ½�110� can alsobe activated at higher applied stress. In the present study, we performed a fully atomic relaxation to establish the GSFE, sinceunrelaxed GSFE does not represent the precise energy barrier in association with the dislocation glide. We compared unre-laxed and relaxed GSFE of slip system 1
6 ½11 �2� (111) in L10 Ni2FeGa. We note that the barrier for unrelaxed and relaxed GSFEis 180 mJ/m2 and 168 mJ/m2, respectively, which represents a 7% difference between these two values. The results reportedin the paper are the relaxed values. The predicted Peierls stress is 1.15 GPa and 1.1 GPa, respectively, a near 5% difference. We
Please cite this article in press as: Wang, J., et al. Dislocation slip stress prediction in shape memory alloys. Int. J. Plasticity (2013), http://dx.doi.org/10.1016/j.ijplas.2013.08.017
J. Wang et al. / International Journal of Plasticity xxx (2013) xxx–xxx 17
note that the relaxed GSFE predicts a closer result to the experiments. Therefore, by allowing fully atomic relaxation, ourGSFE is modified from the rigid shift condition (Clouet, 2012; Hartford et al., 1998a; Lu, 2005; Paidar, 1976; Tadmor and Mill-er, 2011).
We note that there are alternative approaches to determine the dislocation core by performing direct DFT (Clouet, 2012;Trinkle, 2008; Woodward, 2005; Woodward and Rao, 2002) calculations. These approaches confirm the accuracy of the dis-registry function of the arctan form derived from the PN model (Clouet, 2012). For the case of superdislocation dissociatedinto four partials in the present study, further developments in the direct DFT approach are needed including modificationsof the Lattice Green’s functions (Trinkle, 2008).
To validate our Peierls stress prediction, we conducted a series of experiments to observe the dislocation slip in L10 Ni2-
FeGa and determined the slip stress of L10 approximately as 1.5 GPa (CRSS is 750 MPa) under compression loading of [001]samples. The single crystals underwent slip deformation following austenite to martensite transformation. These resultsconfirmed our Peirerls stress prediction of 1.1 GPa for the 1
6 ½11 �2� (111) slip system. These predicted levels with the P–Nmodel are in far better agreement with experiments in comparison with the theoretical stress level of 3.65 GPa. In additionto the temperature effects discussed earlier, some of the differences may stem from the fact that the actual alloy is off stoi-chiometry (Ni54Fe19Ga27) compared to the simulations (Ni50Fe25Ga25). The theoretical lattice constants are not exactly thesame as the experimental values contributing to some of the differences in stress levels.
We also investigated dislocation slip in several important shape memory alloys and predicted stresses based on the pres-ent theory for Ni2FeGa (austenite), NiTi, Co2NiGa, Co2NiAl, CuZn and Ni2TiHf austenites in excellent agreement with exper-iments. Overall, we note that the stresses calculated with the extended P–N model and GSFE curves provides an excellentbasis for a theoretical study of the dislocation structure and operative slip modes in L10 Ni2FeGa and the some of the mostimportant shape memory alloys. The formulation can be extended to other proposed shape memory alloys with differentcrystal structures as well.
Acknowledgments
The work was supported by the National Science Foundation, CMMI 09-26813. This support is gratefully acknowledged.
Appendix A. GSFE of 12 ½11 �2� dissociation into three 1
6 ½11 �2� partials
Similar to the dislocation dissociation in fcc metals (Kibey et al., 2006), it is very unlikely to dissociate the superdisloca-tion 1
2 ½11 �2� into three 16 ½11 �2� partial dislocations, due to the much higher energy barrier formed when the atoms in the same
plane slide past each other. We calculated the GSFE curve for the superdislocation 12 ½11 �2� dissociated into three 1
6 ½11 �2� par-tial dislocations in Fig. A1. After shearing with a displacement u ¼ 1
6 ½11 �2�, a metastable structure is obtained at point S in thecurve. Similar to fcc metals (Kibey et al., 2006), further shear beyond point S along the ½11 �2� direction results in an unstablestructure at point C (u ¼ 1
3 ½11 �2�). We note that this unstable stacking fault energy (global energy barrier) is 475 mJ/m2, whichis much higher than the energy barrier of 360 mJ/m2 along the direction 1
6 ½�12 �1� shown in Fig. 12. Thus, it is impossible todissociate the superdislocation 1
2 ½11 �2� into three 16 ½11 �2� partial dislocations; instead, it will dissociate into the combination
of 16 ½11 �2� and 1
6 ½�12 �1� shown in Eq. (3).
Fig. A1. GSFE curve of the superdislocation 12 ½11 �2� dissociated into three 1
6 ½1 1 �2� partial dislocations on the (111) plane of L10 Ni2FeGa. We note that inorder to move atoms at position A to the positon C along ½11 �2� direction, a high stress is required due to the high energy barrier formed when atoms at Aslide over atoms at B in the same plane.
Please cite this article in press as: Wang, J., et al. Dislocation slip stress prediction in shape memory alloys. Int. J. Plasticity (2013), http://dx.doi.org/10.1016/j.ijplas.2013.08.017
Fig. B1. Separations of partial dislocations for the superdislocation 12 ½�1 10�.
18 J. Wang et al. / International Journal of Plasticity xxx (2013) xxx–xxx
Appendix B. Separations determination of partial dislocations
The separations, d1 and d2, of partial dislocations can be calculated using the force balance between attraction due to faultenergies and elastic repulsion of partial dislocations (Crawford et al., 1973; Stroh, 1958):
Pleasedx.doi
XF ¼ FattractionðcÞ � FrepulsionðK;dÞ ¼ 0 ðB1Þ
This leads to the following equations for the case of superdislocation ½�110� splitting into four partials 16 h�211� as follows:
cCSF ¼ K1d1þ 1
d1 þ d2þ 1
2d1 þ d2
� �ðB2Þ
cAPB � cCSF ¼ K1d2þ 1
d1 þ d2� 1
d1
� �ðB3Þ
with c and K/d representing the attraction and elastic repulsion force, respectively. These equations can be solved for theseparation distances giving the energy levels and the other material constants as input. As noted earlier, cCSF = 273 mJ/m2
and cAPB = 179 mJ/m2. The factor K is given as K ¼ lb2
2p , where l = 29.5 GPa (obtained from our simulations), b ¼ 1:49 Å: Thisresults in d1 = 0.538 nm and d2 = 1.85 nm shown in Fig. B1.
References
Appel, F., Paul, J.D.H., Oehring, M., 2011. Deformation Behavior of Single-Phase Alloys, Gamma Titanium Aluminide Alloys. Wiley-VCH Verlag GmbH & Co.KGaA, pp. 71–124.
Arndt, M., Griebel, M., Novák, V., Roubícek, T., Šittner, P., 2006. Martensitic transformation in NiMnGa single crystals: numerical simulation andexperiments. International Journal of Plasticity 22, 1943–1961.
Barandiarán, J.M., Gutiérrez, J., Lázpita, P., Chernenko, V.A., Seguí, C., Pons, J., Cesari, E., Oikawa, K., Kanomata, T., 2008. Martensitic transformation in Ni–Fe–Ga alloys. Materials Science and Engineering: A 478, 125–129.
Brown, P.J., Crangle, J., Kanomata, T., Matsumoto, M., Neumann, K.U., Ouladdiaf, B., Ziebeck, K.R.A., 2002. The crystal structure and phase transitions of themagnetic shape memory compound Ni2MnGa. Journal of Physics: Condensed Matter 14, 10159–10171.
Carrez, P., Cordier, P., Mainprice, D., Tommasi, A., 2006. Slip systems and plastic shear anisotropy in Mg2SiO4ringwoodite. European Journal of Mineralogy18, 149–160.
Carrez, P., Ferré, D., Cordier, P., 2007. Peierls–Nabarro model for dislocations in MgSiO3 post-perovskite calculated at 120 GPa from first principles.Philosophical Magazine 87, 3229–3247.
Chumlyakov, Y., Kireeva, I., Panchenko, E., Timofeeva, E., Pobedennaya, Z., Chusov, S., Karaman, I., Maier, H., Cesari, E., Kirillov, V., 2008. High-temperaturesuperelasticity in CoNiGa, CoNiAl, NiFeGa, and TiNi monocrystals. Russian Physics Journal 51, 1016–1036.
Chumlyakov, Y.I., Kireeva, I.V., Panchenko, E.Y., Kirillov, V.A., Timofeeva, E.E., Kretinina, I.V., Danil’son, Y.N., Karaman, I., Maier, H., Cesari, E., 2012.Thermoelastic martensitic transformations in single crystals with disperse particles. Russian Physics Journal 54, 937–950.
Clouet, E., 2012. Screw dislocation in zirconium: an ab initio study. Physical Review B 86, 144104.Cordier, P., Amodeo, J., Carrez, P., 2012. Modelling the rheology of MgO under Earth’s mantle pressure, temperature and strain rates. Nature 481, 177–180.Coughlin, D., Phillips, P., Bigelow, G., Garg, A., Noebe, R., Mills, M., 2012. Characterization of the microstructure and mechanical properties of a 50.3 Ni-29.7
Ti-20Hf shape memory alloy. Scripta Materialia 67, 112–115.Crawford, R.C., Ray, I.L.F., Cockayne, D.J.H., 1973. The weak-beam technique applied to superlattice dislocations in iron-aluminium alloys. Philosophical
Magazine 27, 1–7.Dilibal, S., Sehitoglu, H., Hamilton, R., Maier, H., Chumlyakov, Y., 2011. On the volume change in Co–Ni–Al during pseudoelasticity. Materials Science and
Engineering: A 528, 2875–2881.Efstathiou, C., Sehitoglu, H., 2008. Local transformation strain measurements in precipitated NiTi single crystals. Scripta Materialia 59, 1263–1266.Efstathiou, C., Sehitoglu, H., Carroll, J., Lambros, J., Maier, H.J., 2008. Full-field strain evolution during intermartensitic transformations in single-crystal
NiFeGa. Acta Materialia 56, 3791–3799.Ehmann, J., Fähnle, M., 1998. Generalized stacking-fault energies for TiAl: mechanical instability of the (111) antiphase boundary. Philosophical Magazine A
77, 701–714.Ezaz, T., Sehitoglu, H., Maier, H.J., 2011. Energetics of twinning in martensitic NiTi. Acta Materialia 59, 5893–5904.Ezaz, T., Wang, J., Sehitoglu, H., Maier, H.J., 2013. Plastic deformation of NiTi shape memory alloys. Acta Materialia 61, 67–78.Fu, C.L., Yoo, M.H., 1992. Deformation behavior of B2 type aluminides: FeAl and NiAl. Acta Metallurgica et Materialia 40, 703–711.Gall, K., Maier, H., 2002. Cyclic deformation mechanisms in precipitated NiTi shape memory alloys. Acta Materialia 50, 4643–4657.Hamilton, R.F., Efstathiou, C., Sehitoglu, H., Chumlyakov, Y., 2006a. Thermal and stress-induced martensitic transformations in NiFeGa single crystals under
tension and compression. Scripta Materialia 54, 465.Hamilton, R.F., Sehitoglu, H., Efstathiou, C., Maier, H.J., Chumlyakov, Y., 2006b. Pseudoelasticity in Co–Ni–Al single and polycrystals. Acta Materialia 54, 587.Hamilton, R.F., Sehitoglu, H., Efstathiou, C., Maier, H.J., 2007. Inter-martensitic transitions in Ni–Fe–Ga single crystals. Acta Materialia 55, 4867–4876.Hamilton, R.F., Sehitoglu, H., Aslantas, K., Efstathiou, C., Maier, H.J., 2008. Inter-martensite strain evolution in NiMnGa single crystals. Acta Materialia 56,
2231–2236.Hartford, J., von Sydow, B., Wahnström, G., Lundqvist, B.I., 1998. Peierls barriers and stresses for edge dislocations in Pd and Al calculated from first
principles. Physical Review B 58, 2487–2496.Hartl, D.J., Chatzigeorgiou, G., Lagoudas, D.C., 2010. Three-dimensional modeling and numerical analysis of rate-dependent irrecoverable deformation in
shape memory alloys. International Journal of Plasticity 26, 1485–1507.
cite this article in press as: Wang, J., et al. Dislocation slip stress prediction in shape memory alloys. Int. J. Plasticity (2013), http://.org/10.1016/j.ijplas.2013.08.017
J. Wang et al. / International Journal of Plasticity xxx (2013) xxx–xxx 19
Hosford, W.F., 2005. Mechanical Behavior of Materials. Cambridge University Press.Joós, B., Duesbery, M.S., 1997. The Peierls stress of dislocations: an analytic formula. Physical Review Letters 78, 266–269.Joós, B., Ren, Q., Duesbery, M.S., 1994. Peierls–Nabarro model of dislocations in silicon with generalized stacking-fault restoring forces. Physical Review B 50,
5890–5898.Juan, Y.-M., Kaxiras, E., 1996. Generalized stacking fault energy surfaces and dislocation properties of silicon: a first-principles theoretical study.
Philosophical Magazine A 74, 1367–1384.Karaman, I., Lagoudas, D.C., 2006. Magnetic shape memory alloys with high actuation forces. DTIC Document.Kibey, S.A., 2007. Mesoscale Models for Stacking Faults, Deformation Twins and Martensitic Transformations: Linking Atomistics to Continuum. ProQuest,
pp. 18–20.Kibey, S., Liu, J.B., Curtis, M.J., Johnson, D.D., Sehitoglu, H., 2006. Effect of nitrogen on generalized stacking fault energy and stacking fault widths in high
nitrogen steels. Acta Materialia 54, 2991–3001.Kokorin, V.V., Martynov, V.V., Chernenko, V.A., 1992. Stress-induced martensitic transformations in Ni2MnGa. Scripta metallurgica et materialia 26, 175–
177.Kresse, G., Furthmuller, J., 1996. Efficient iterative schemes for ab initio total-energy calculations using a plane-wave basis set. Physical Review B
(Condensed Matter) 54, 11169.Kresse, G., Hafner, J., 1993. Ab initio molecular dynamics for open-shell transition metals. Physical Review B (Condensed Matter) 48, 13115.Lejcek, L., 1973. On minimum of energy in the Peierls–Nabarro dislocation model. Czechoslovak Journal of Physics 23, 176–178.Liu, J., Johnson, D., 2009. Bcc-to-hcp transformation pathways for iron versus hydrostatic pressure: coupled shuffle and shear modes. Physical Review B 79,
134113.Liu, Y.L., Liu, L.M., Wang, S.Q., Ye, H.Q., 2007. First-principles study of shear deformation in TiAl and Ti3Al. Intermetallics 15, 428–435.Lu, G., 2005. The Peierls–Nabarro model of dislocations: a venerable theory and its current development. Handbook of Materials Modeling. Springer, pp.
793–811.Lu, G., Kioussis, N., Bulatov, V.V., Kaxiras, E., 2000. The Peierls–Nabarro model revisited. Philosophical Magazine Letters 80, 675–682.Martynov, V.V., 1995. X-ray diffraction study of thermally and stress-induced phase transformations in single crystalline Ni–Mn–Ga alloys, C8 ed. Editions
de Physique, Lausanne, Switzerland, pp. 91–99.Masdeu, F., Pons, J., Segui, C., Cesari, E., Dutkiewicz, J., 2005. Some features of Ni–Fe–Ga shape memory alloys under compression. Journal of Magnetism and
Magnetic Materials 290–291, 816.McDowell, D.L., 2010. A perspective on trends in multiscale plasticity. International Journal of Plasticity 26, 1280–1309.Medvedeva, N.I., Mryasov, O.N., Gornostyrev, Y.N., Novikov, D.L., Freeman, A.J., 1996. First-principles total-energy calculations for planar shear and cleavage
decohesion processes in B2-ordered NiAl and FeAl. Physical Review B 54, 13506–13514.Miranda, C.R., Scandolo, S., 2005. Computational materials science meets geophysics: dislocations and slip planes of MgO. Computer Physics
Communications 169, 24–27.Nabarro, F.R.N., 1947. Dislocation in a simple cubic lattice. Proceedings of the Physical Society 59.Nabarro, F.R.N., 1997. Theoretical and experimental estimates of the Peierls stress. Philosophical Magazine A 75, 703–711.Ogata, S., Ju, L., Yip, S., 2005. Energy landscape of deformation twinning in bcc and fcc metals. Physical Review B (Condensed Matter and Materials Physics)
71, 224102.Oikawa, K., Ota, T., Ohmori, T., Tanaka, Y., Morito, H., Fujita, A., Kainuma, R., Fukamichi, K., Ishida, K., 2002. Magnetic and martensitic phase transitions in
ferromagnetic Ni–Ga–Fe shape memory alloys. Applied Physics Letters 81, 5201.Oikawa, K., Omori, T., Sutou, Y., Kainuma, R., Ishida, K., 2003. Development of the Co-Ni-Al ferromagnetic shape memory alloys. Journal De Physique. IV: JP
112 II, 1017–1020.Omori, T., Kamiya, N., Sutou, Y., Oikawa, K., Kainuma, R., Ishida, K., 2004. Phase transformations in Ni–Ga–Fe ferromagnetic shape memory alloys. Materials
Science and Engineering: A 378, 403–408.Ozdemir, N., Karaman, I., Mara, N., Chumlyakov, Y., Karaca, H., 2012. Size effects in the superelastic response of Ni54Fe19Ga27 shape memory alloy pillars
with a two stage martensitic transformation. Acta Materialia 60, 5670–5685.Paidar, V., 1976. Generalized stacking faults in model lattice of ordered Fe-Si alloys. Czechoslovak Journal of Physics 26, 865–874.Paidar, V., 2004. Behaviour of dislocations in TiAl intermetallics. Materials Science and Engineering: A 387–389, 977–980.Peierls, E., 1940. The size of a dislocaiton. Proceedings of the Physical Society 52.Planes, A., Obrado, E., Gonzalez-Comas, A., Manosa, L., 1997. Premartensitic transition driven by magnetoelastic interaction in BCC ferromagnetic Ni2MnGa.
Physical Review Letters 79, 3926–3929.Pons, J., Santamarta, R., Chernenko, V.A., Cesari, E., 2005. Long-period martensitic structures of Ni–Mn–Ga alloys studied by high-resolution transmission
electron microscopy. Journal of Applied Physics 97.Romero, R., Lovey, F., Ahlers, M., 1988. Plasticity in b phase Cu–Zn–Al alloys. Philosophical Magazine A 58, 881–903.Santamarta, R., Font, J., Muntasell, J., Masdeu, F., Pons, J., Cesari, E., Dutkiewicz, J., 2006. Effect of ageing on the martensitic transformation of Ni–Fe–Ga
alloys. Scripta Materialia 54, 1105–1109.Schoeck, G., 1999. Peierls energy of dislocations: a critical assessment. Physical Review Letters 82, 2310–2313.Segui, C., Chernenko, V.A., Pons, J., Cesari, E., Khovailo, V., Takagi, T., 2005. Low temperature-induced intermartensitic phase transformations in Ni–Mn–Ga
single crystal. Acta Materialia 53, 111–120.Sehitoglu, H., Jun, J., Zhang, X., Karaman, I., Chumlyakov, Y., Maier, H.J., Gall, K., 2001. Shape memory and pseudoelastic behavior of 51.5%Ni–Ti single
crystals in solutionized and overaged state. Acta Materialia 49, 3609–3620.Sehitoglu, H., Wang, J., Maier, H.J., 2012. Transformation and slip behavior of Ni2FeGa. International Journal of Plasticity 39, 61–74.Stroh, A.N., 1958. Dislocations and cracks in anisotropic elasticity. Philosophical Magazine 3, 625–646.Sutou, Y., Kamiya, N., Omori, T., Kainuma, R., Ishida, K., Oikawa, K., 2004. Stress-strain characteristics in Ni–Ga–Fe ferromagnetic shape memory alloys.
Applied Physics Letters 84, 1275.Tadmor, E.B., Miller, R.E., 2011. Modeling Materials: Continuum, Atomistic and Multiscale Techniques. Cambridge University Press.Timofeeva, E., Panchenko, E.Y., Chumlyakov, Y.I., Maier, H., 2012. Development of thermoelastic martensitic transformations in ferromagnetic [011]-
oriented NiFeGa single crystals in compression. Russian Physics Journal, 1–4.Trinkle, D.R., 2008. Lattice Green function for extended defect calculations: computation and error estimation with long-range forces. Physical Review B 78,
014110.Ullakko, K., Huang, J.K., Kantner, C., O’Handley, R.C., Kokorin, V.V., 1996. Large magnetic-field-induced strains in Ni2MnGa single crystals. Applied Physics
Letters 69, 1966–1968.Vitek, V., 1968. Intrinsic stacking faults in body-centred cubic crystals. Philosophical Magazine 18, 773.Wang, J.N., 1996. Prediction of Peierls stresses for different crystals. Materials Science and Engineering: A 206, 259–269.Wang, Y., Zheng, Y., Cai, W., Zhao, L., 1999. The tensile behavior of Ti36Ni49Hf15 high temperature shape memory alloy. Scripta Materialia 40,
1327–1331.Wang, G., Strachan, A., Cagin, T., Goddard III, W.A., 2001. Molecular dynamics simulations of 1/2 a h111i screw dislocation in Ta. Materials Science and
Engineering: A 309, 133–137.Whang, S.H., Feng, Q., Gao, Y.Q., 1998. Ordering, deformation and microstructure in L10 type FePt. Acta Materialia 46, 6485–6495.Wheeler, J.M., Niederberger, C., Tessarek, C., Christiansen, S., Michler, J., 2013. Extraction of plasticity parameters of GaN with high temperature, in situ
micro-compression. International Journal of Plasticity 40, 140–151.
Please cite this article in press as: Wang, J., et al. Dislocation slip stress prediction in shape memory alloys. Int. J. Plasticity (2013), http://dx.doi.org/10.1016/j.ijplas.2013.08.017
20 J. Wang et al. / International Journal of Plasticity xxx (2013) xxx–xxx
Whelan, M., Hirsch, P., Horne, R., Bollmann, W., 1957. Dislocations and stacking faults in stainless steel. Proceedings of the Royal Society of London. Series A,Mathematical and Physical Sciences, 524–538.
Wollmershauser, J.A., Kabra, S., Agnew, S.R., 2009. In situ neutron diffraction study of the plastic deformation mechanisms of B2 ordered intermetallicalloys: NiAl, CuZn, and CeAg. Acta Materialia 57, 213–223.
Woodward, C., 2005. First-principles simulations of dislocation cores. Materials Science and Engineering: A 400, 59–67.Woodward, C., Rao, S., 2002. Flexible ab initio boundary conditions: simulating isolated dislocations in bcc Mo and Ta. Physical Review Letters 88, 216402.Yu, H.J., Fu, H., Zeng, Z.M., Sun, J.X., Wang, Z.G., Zhou, W.L., Zu, X.T., 2009. Phase transformations and magnetocaloric effect in NiFeGa ferromagnetic shape
memory alloy. Journal of Alloys and Compounds 477, 732–735.Zheludev, A., Shapiro, S.M., Wochner, P., Tanner, L.E., 1996. Precursor effects and premartensitic transformation in Ni2MnGa. Physical Review B (Condensed
Matter) 54, 15045–15050.
Please cite this article in press as: Wang, J., et al. Dislocation slip stress prediction in shape memory alloys. Int. J. Plasticity (2013), http://dx.doi.org/10.1016/j.ijplas.2013.08.017


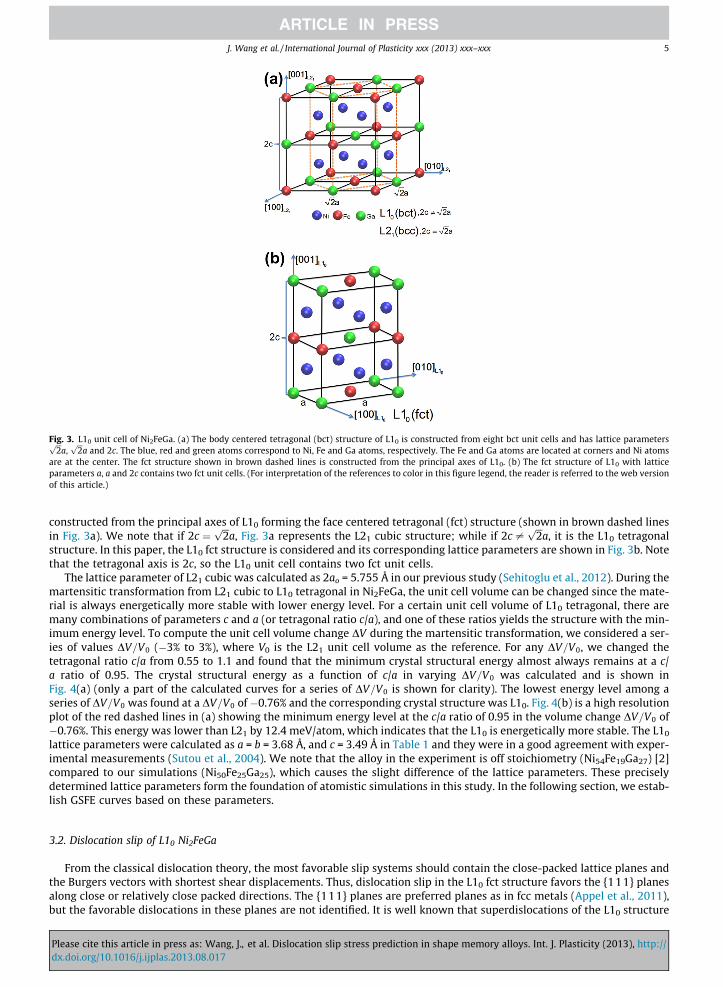


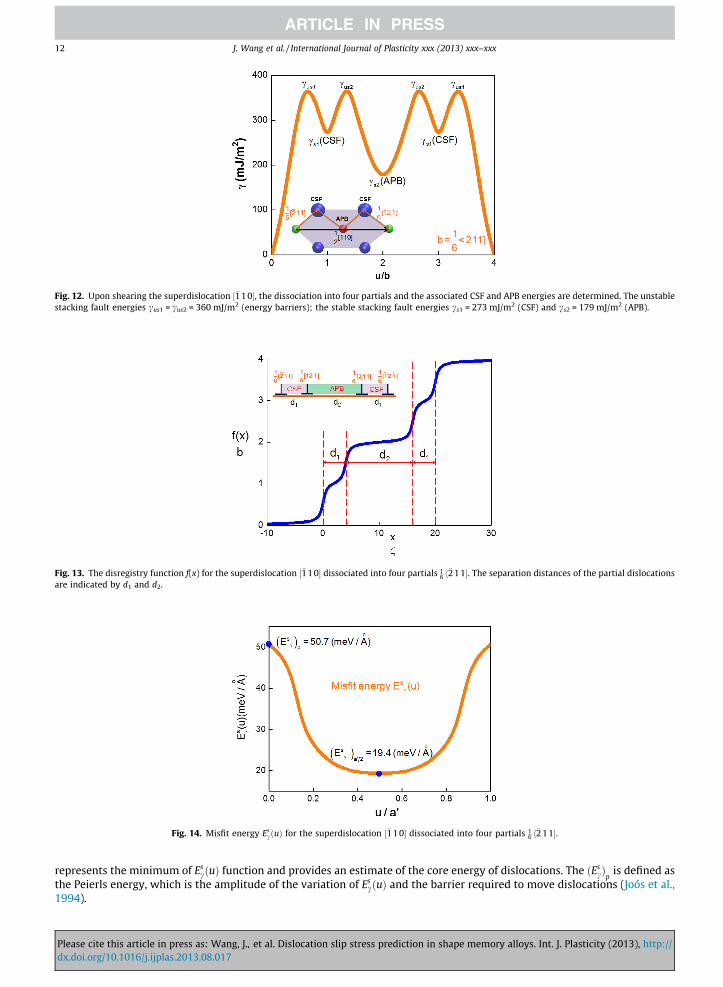
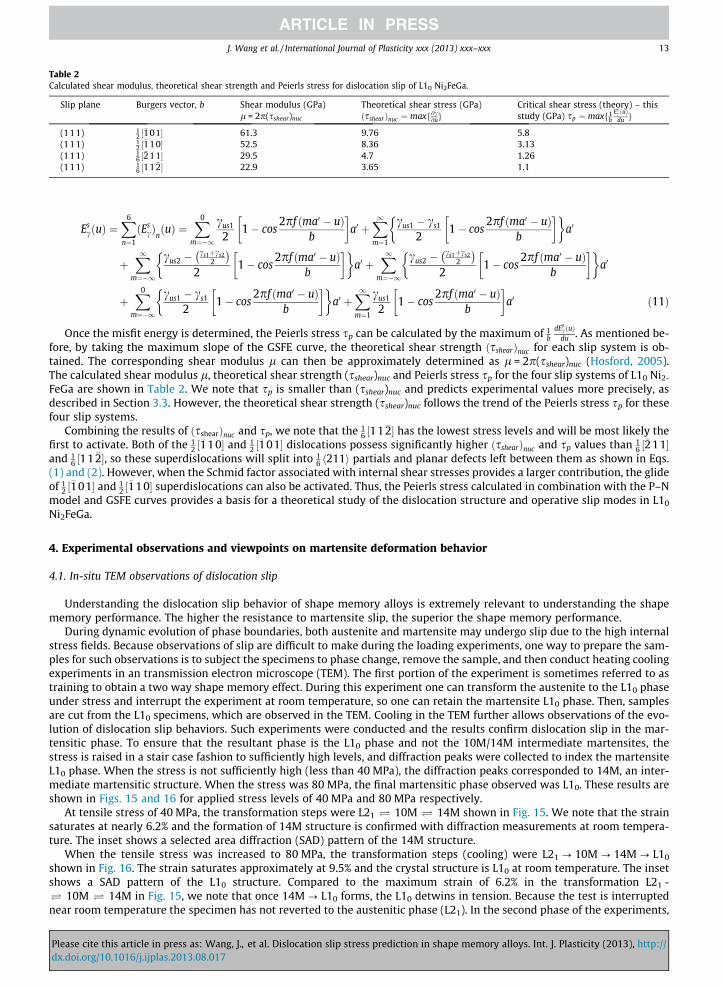

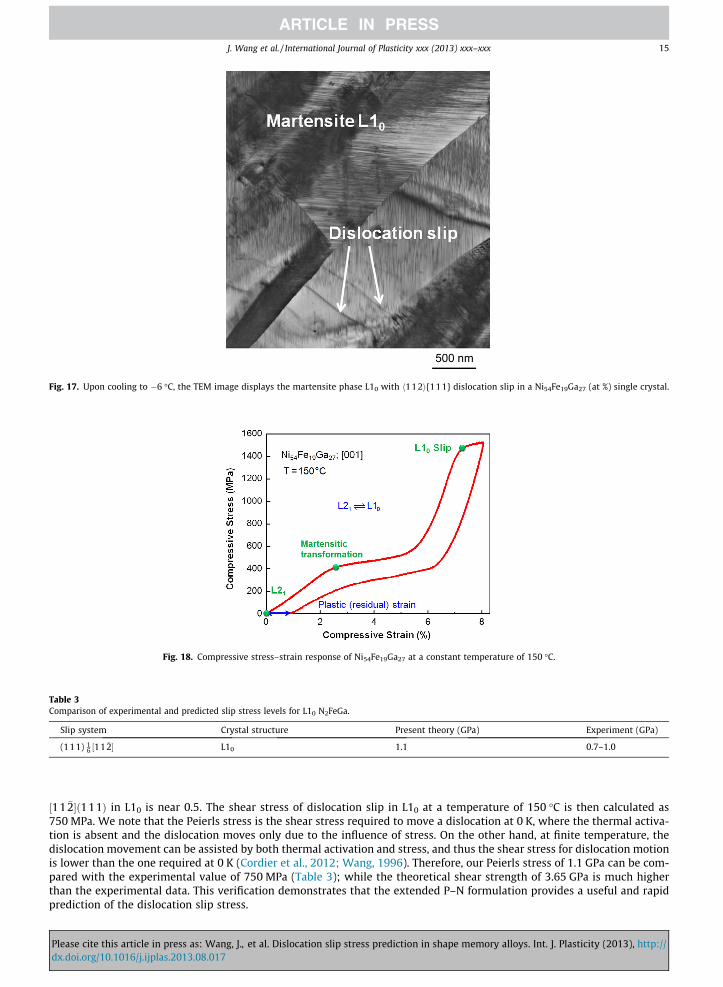

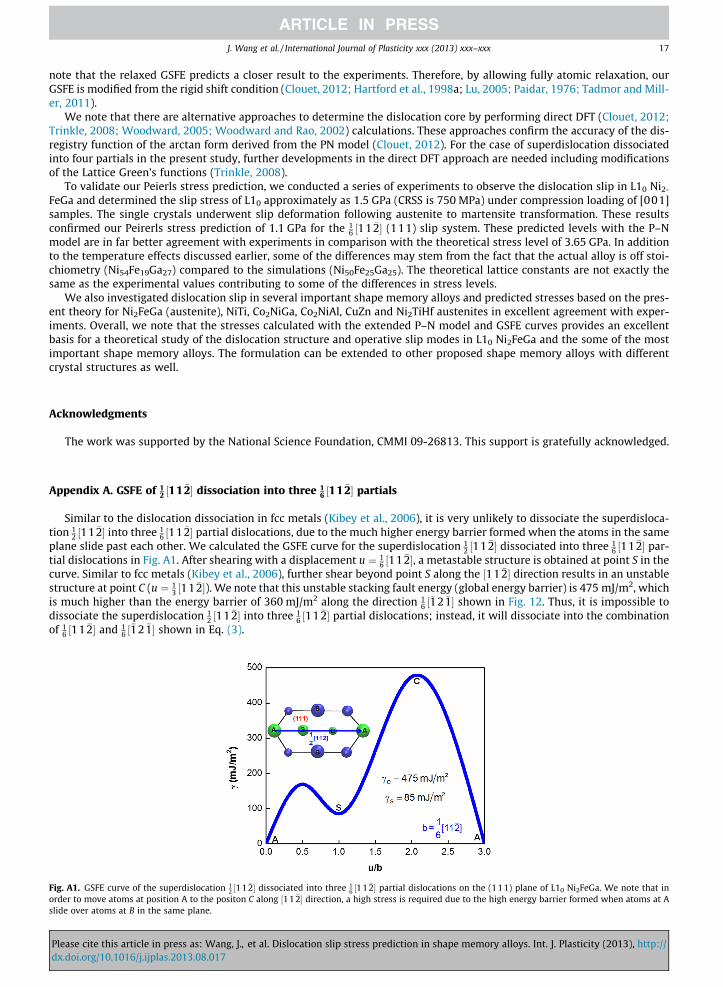


![Dislocation slip and twinning in Ni-based L12 type alloyshtml.mechse.illinois.edu/files/imported/202...mesoscale dislocation theory [10,11]. The former calculations rely on the well-known](https://static.documents.pub/doc/80x56/5f16747905d9ce55f560ed80/dislocation-slip-and-twinning-in-ni-based-l12-type-mesoscale-dislocation-theory.jpg)


