112
Jenni Kulmala Disparities in Physical Activity in Old Age 220 STUDIES IN SPORT, PHYSICAL EDUCATION AND HEALTH Johanna Eronen

Jenni Kulmala
Disparities in Physical Activity in Old Age
220STUDIES IN SPORT, PHYSICAL EDUCATION AND HEALTH
Johanna Eronen

STUDIES IN SPORT, PHYSICAL EDUCATION AND HEALTH 220
Johanna Eronen
Disparities in Physical Activity in Old Age
Esitetään Jyväskylän yliopiston liikuntatieteellisen tiedekunnan suostumuksellajulkisesti tarkastettavaksi yliopiston vanhassa juhlasalissa S212
maaliskuun 13. päivänä 2015 kello 12.
Academic dissertation to be publicly discussed, by permission ofthe Faculty of Sport and Health Sciences of the University of Jyväskylä,
in building Seminarium, auditorium S212, on March 13, 2015 at 12 o’clock noon.
UNIVERSITY OF JYVÄSKYLÄ
JYVÄSKYLÄ 2015
Disparities in Physical Activity in Old Age
STUDIES IN SPORT, PHYSICAL EDUCATION AND HEALTH 220
Johanna Eronen
Disparities in Physical Activity in Old Age
UNIVERSITY OF JYVÄSKYLÄ
JYVÄSKYLÄ 2015
EditorsIna TarkkaDepartment of Health Sciences, University of JyväskyläPekka Olsbo, Ville KorkiakangasPublishing Unit, University Library of Jyväskylä
URN:ISBN:978-951-39-6113-8ISBN 978-951-39-6113-8 (PDF)
ISBN 978-951-39-6112-1 (nid.)ISSN 0356-1070
Copyright © 2015, by University of Jyväskylä
Jyväskylä University Printing House, Jyväskylä 2015
Cover photo by Oiva Eronen.

ABSTRACT
Eronen, Johanna Disparities in physical activity in old age Jyväskylä: University of Jyväskylä, 2015, 86 p. (Studies in Sport, Physical Education, and Health ISSN 0356-1070; 220) ISBN 978-951-39-6112-1 (nid.) ISBN 978-951-39-6113-8 (PDF) Finnish summary Diss. Physical activity is a basic need, also in old age. However, many older people cannot fulfil this need, often due to walking limitations causing imbalance in person-environment fit. Decreased physical activity can lead to unmet physical activity need and restriction on life-space mobility. The opportunities to remain physically active depend on various factors, not all of which are equally achievable for all older adults. The aim was to investigate disparities in physical activity among older community-dwelling people, with a focus on functioning, environmental barriers and facilitators, and socioeconomic status (SES).
The data were drawn from two studies conducted in Central Finland: Screening and Counseling for Physical Activity and Mobility (632 participants, 75% women, mean age 77.6) and Life-Space Mobility in Old Age (848 partici-pants, 62% women, mean age 80.1). Walking limitations, SES, social support, environmental facilitators for outdoor walking and barriers to outdoor physical activity were self-reported. The outcome measures were unmet physical activity need, walking limitation and life-space mobility.
Five outdoor physical activity barrier profiles were identified, in which people differed in health and functioning and vulnerability to the challenges of the environment. A higher number of environmental facilitators decreased the risk for walking limitation. The risk for unmet physical activity need increased along with the number of individual and environmental outdoor physical activ-ity barriers, but was highest among people whose poor health and functioning hindered them from going outdoors. Low SES was associated with more re-stricted life-space mobility and unmet physical activity need, especially among persons with walking limitations.
Disparities in physical activity can be traced back to various individual, social and environmental factors. The importance of the environment for physi-cal activity is considerable especially among older people with walking limita-tions. Keywords: physical activity, older people, outdoor environment, socioeconomic status, walking limitation, life-space mobility
Author’s address Johanna Eronen, MSc Gerontology Research Center Department of Health Sciences University of Jyväskylä
P.O. Box 35 (VIV) 40014 University of Jyväskylä, Finland [email protected] Supervisors Professor Taina Rantanen, PhD Gerontology Research Center Department of Health Sciences University of Jyväskylä Jyväskylä, Finland Mikaela von Bonsdorff, PhD Gerontology Research Center Department of Health Sciences University of Jyväskylä, Jyväskylä, Finland Reviewers Associate Professor Paolo Caserotti, PhD Department of Physiology and Clinical Biomechanics University of Southern Denmark
Odense, Denmark Professor Sari Stenholm, PhD School of Health Sciences
University of Tampere Finland and Department of Public Health University of Turku Finland
Opponent Professor Suzanne Leveille, PhD, RN College of Nursing and Health Sciences
University of Massachusetts Boston Boston, MA, US
ACKNOWLEDGEMENTS
This study was carried out at the Gerontology Research Center, Department of Health Sciences, University of Jyväskylä, Finland.
My deepest gratitude goes to the supervisors of this thesis, Professor Taina Rantanen and Mikaela von Bonsdorff, PhD. Taina, I can’t stop wondering how you always have solutions to the most complex problems and answers to even the trickiest questions. I highly value your knowledge and experience in the field of gerontology and feel proud that I have been able to conduct my PhD thesis under your supervision. Mikaela, thank you for always having time for me and my questions, especially during the first year of my PhD studies. I ad-mire your enthusiasm towards research and appreciate the guidance and advice that you have given me. I feel that we have become friends during these years. I sincerely thank Professor Teppo Kröger for his interest and supportive com-ments on this work. I also want to thank Research Director Katja Kokko at the Gerontology Research Center, and Director of the Department of Health Scienc-es, Professor Ari Heinonen for giving me the opportunity to work and conduct this study in such encouraging and friendly working environment.
I want to express my sincere gratitude to the official reviewers of this the-sis, Associate Professor Paolo Caserotti and Professor Sari Stenholm. I also want to thank Professor Suzanne Leveille for agreeing to be my opponent in the pub-lic defense of this thesis.
I want to thank my co-authors Erja Portegijs PhD and Anne Viljanen PhD for your contribution to this work. Merja Rantakokko PhD has helped me enormously throughout this project with her valuable comments on my papers and sharing her ideas and knowledge in this field. The statistical expertise of Timo Törmäkangas, PhD, and Markku Kauppinen, MSc, has been indispensable. I have enjoyed working with you all.
When gathering data for this study, I had the privilege to visit more than fifty persons at their homes. I want to thank all of you for our interesting dis-cussions, your vivid tales about your lives and of course, for the numerous cups of coffee. You have taught me more about the topic of this thesis than I ever could have learned by sitting at my computer.
I wish to thank Michael Freeman for revising the English language of this thesis, and Timo Törmäkangas, PhD, and Reijo Romppanen for revising the English language of the original papers.
I am grateful for the financial support that I have received for this project. My doctoral studies have been financially supported by personal grants from the Juho Vainio Foundation, the Finnish Cultural Foundation, Central Finland Regional Fund and the University of Jyväskylä. LISPE project has been funded by the Ministry of Education and Culture, Finland, and the Academy of Finland.
The social life at GEREC is in a class of its own. I appreciate the warm at-mosphere and sincere support for each other. I know that I can knock on any-one’s door and receive assistance whether my problem deals with applying for funding, needing help with my computer or circulating kids’ clothes. I have

wonderful memories from the times spent at ten o’clock coffee – or sparkling wine – breaks, congresses and airports. I want to thank especially all of you who have shared an office with me – our inspiring and warm conversations have brightened up the long days at work. I appreciate the advice, opinions and encouragement that you have given me.
The past few years have been busy with many different projects and I would have never made it this far without people close to me. I am very grate-ful to my parents, Päivi and Reijo, and my parents-in-law, Raija and Oiva, for the sincere support that you have given to our family during these years. I ap-preciate that you have been there for us every time we needed help. I also want to thank my brother Tuomas, my sister-in-law Milla and my friends, especially Tii, for your friendship, encouragement and all the precious moments that we have shared.
Even though I like my work very much, the best time of the day is when I come home to my family. Verneri, Saara, Onni and Ilona, thank you for filling my life with love, laughter and your endless chatter. Ville, thank you for your unconditional love and understanding.
I dedicate this thesis to my beloved grandparents Hilkka, Raili and Voitto. Jyväskylä, February 2015 Johanna Eronen

FIGURES
FIGURE 1 An analytical model of the study concepts. The study outcomes are in italics. Factors typed in grey are not tested in the models presented in this study. ..................................... 33
FIGURE 2 Conceptual latent class model for the estimation of group membership based on 17 outdoor physical activity barrier (BOPA) variables. ................................................................................... 41
FIGURE 3 Conceptual path model assessing the association between the barrier variable-based latent classes and unmet physical activity. ..................................................................................................... 42

TABLES
TABLE 1 Summary of study designs, populations and outcomes. ................. 34 TABLE 2 Summary of the study concepts grouped according to
the ecological model of ageing and the theory of fundamental causes. ...................................................................................................... 40
TABLE 3 Baseline characteristics of the participants in the SCAMOB and LISPE projects. ................................................................................. 44
TABLE 4 Percentages of participants reporting different outdoor physical activity barriers in the LISPE study (n=848). ...................... 45
TABLE 5 Profile names and the percentages of persons reporting different outdoor physical activity barriers in the profiles in the LISPE study. ................................................................................. 46
TABLE 6 Characteristics of the LISPE participants in the five profiles for outdoor physical activity (Study I). ............................................... 48
TABLE 7 Age- and gender-adjusted odds ratios and confidence intervals for unmet physical activity need in the five outdoor physical activity barrier profiles in the LISPE study. ....................................... 49
TABLE 8 Characteristics of the SCAMOB participants according to reporting unmet physical activity need at baseline. ......................... 50
TABLE 9 Associations of risk factors with unmet physical activity need. ..... 50 TABLE 10 Risk of unmet physical activity need among people with
walking limitations and other co-existing risk factors compared to people with no walking limitations. ............................ 51
TABLE 11 Baseline characteristics of SCAMOB study participants according to whether or not they developed walking limitation over the 3.5 year follow-up. ................................................ 52
TABLE 12 Baseline prevalences of facilitators in SCAMOB study for all participants and according to development of walking limitation during follow-up, and ORs of single facilitators for development of walking limitation. .................................................... 53
TABLE 13 Development of limitation in walking 0.5 km in older people without walking limitation at baseline according to the number of facilitators for outdoor walking at baseline. SCAMOB study. .... 54
TABLE 14 Covariate means and standard deviations according to life-space and level of education in the LISPE study. ....................... 55
TABLE 15 Marginal means and standard errors and differences between the SES groups in the life-space mobility scores in the LISPE study. ................................................................................. 56

LIST OF ORIGINAL PUBLICATIONS
The thesis is based on the following original publications, which will be re-ferred to in the text by their Roman numerals.
I Eronen J, von Bonsdorff MB, Törmäkangas T Rantakokko M, Portegijs E,
Viljanen A, Rantanen T. Barriers to outdoor physical activity and unmet physical activity need in older adults. Preventive Medicine 2014; 67: 106-111.
II Eronen J, von Bonsdorff MB, Rantakokko M, Rantanen T. Accumulation of disparity in physical activity in old age. Aging Clinical and Experi-mental Research 2012; 24: 475–479.
III Eronen J, von Bonsdorff MB, Rantakokko M, Rantanen T. Environmental
facilitators for outdoor walking and development of walking difficulties in community-dwelling older adults. European Journal of Aging 2013; 11: 67-75.
IV Eronen J, von Bonsdorff MB, Rantakokko M, Portegijs E, Viljanen A,
Rantanen T. Socioeconomic disparities in life-space mobility in old age. Submitted for publication.

ABBREVIATIONS
aBIC Sample size adjusted Bayesian Information Criterion AIC Akaike Information Criterion ADL Activities of Daily Living BIC Bayesian Information Criterion BMI Body Mass Index BOPA Barriers to Outdoor Physical Activity Questionnaire CES-D Center for Epidemiologic Studies Depression Scale CI Confidence Interval HR Hazard Ratio LISPE Life-Space Mobility in Old Age LSA University of Alabama at Birmingham Study of Aging Life-Space
Assessment MMSE Mini-Mental State Examination OR Odds Ratio P-E fit Person-Environment Fit SCAMOB Screening and Counseling for Physical Activity and Mobility SD Standard Deviation SE Standard Error SES Socioeconomic Status SPPB Short Physical Performance Battery
CONTENTS
ABSTRACT ACKNOWLEDGEMENTS FIGURES TABLES LIST OF ORIGINAL PUBLICATIONS ABBREVIATIONS CONTENTS
1 INTRODUCTION .............................................................................................. 13
2 REVIEW OF THE LITERATURE ..................................................................... 15 2.1 The ecological model of aging ................................................................ 15 2.2 Theory of fundamental causes ................................................................ 16 2.3 Disparity ..................................................................................................... 18 2.4 Physical activity in old age ...................................................................... 19
2.4.1 Unmet physical activity need ...................................................... 22 2.4.2 Life-space mobility ........................................................................ 23 2.4.3 Walking limitation ........................................................................ 25
2.5 Barriers to and facilitators of physical activity ..................................... 26 2.5.1 Individual and environmental barriers ..................................... 26 2.5.2 Environmental facilitators for physical activity ....................... 28
2.6 Socioeconomic status in old age ............................................................. 29
3 AIMS OF THE STUDY ...................................................................................... 32
4 DATA AND METHODS ................................................................................... 34 4.1 Study design and participants ................................................................ 34
4.1.1 Screening and Counseling for Physical Activity and Mobility (SCAMOB) ..................................................................... 35
4.1.2 Life-Space Mobility in Old Age (LISPE) .................................... 35 4.2 Ethics ........................................................................................................... 36 4.3 Measurements ........................................................................................... 36
4.3.1 Unmet physical activity need ...................................................... 36 4.3.2 Life-space mobility ........................................................................ 36 4.3.3 Walking limitation ........................................................................ 37 4.3.4 Physical activity ............................................................................. 37 4.3.5 Outdoor physical activity barriers .............................................. 38 4.3.6 Social support ................................................................................ 38 4.3.7 Environmental facilitators ........................................................... 38 4.3.8 Socioeconomic status .................................................................... 39 4.3.9 Background information .............................................................. 39
4.4 Statistical analysis ..................................................................................... 40
5 RESULTS ............................................................................................................. 44 5.1 Characteristics of the participants .......................................................... 44 5.2 Outdoor physical activity barriers (Study I) ......................................... 44 5.3 Risk factors for unmet physical activity need (Study II) ..................... 49 5.4 Environmental facilitators and development of walking
limitation (Study III) ................................................................................. 51 5.5 Life-space mobility (Study IV) ................................................................ 54
6 DISCUSSION ...................................................................................................... 57 6.1 Unmet physical activity need.................................................................. 58 6.2 Walking limitation and environmental facilitators ............................. 61 6.3 Life-space mobility ................................................................................... 62 6.4 Methodological considerations ............................................................... 65 6.5 Future directions ....................................................................................... 67
7 MAIN FINDINGS AND CONCLUSIONS ..................................................... 69
YHTEENVETO (FINNISH SUMMARY) .................................................................. 70
REFERENCES ............................................................................................................... 72

1 INTRODUCTION
Everyone should have the opportunity to be physically active, regardless of health status, place of residence, wealth or age. This generally agreed statement has been included in the Government bill for the Sports Act in Finland (1997), in which it is also acknowledged that some people need support from the com-munity to enable them to be physically active. The aim of the Act itself is to promote physical activity, health and wellbeing of the entire population (Sports Act Finland 1054/1998). According to the government bill (1997), guaranteeing the right to physical activity for all should be regarded in the same way as the basic services provided by local authorities. There are over 1 million people over the age of 65 in Finland and they form a heterogeneous group in terms of their physical activity behavior. Some are veteran athletes, many are Nordic walking enthusiasts and some lead a sedentary life by their own volition. How-ever, many older people do not have opportunities to be physically active, even though they would like to. For some older people even going outdoors is diffi-cult and they might need assistance with such basic activities as going for a walk (Rantanen et al. 2014).
Disparity means a quality or a state of being different, or a difference in measurable things. A difference becomes a disparity when the nature of the dif-ference is such that it is or should be avoidable (Whitehead 1991). This study introduces the concept of disparity in physical activity in old age as a new per-spective on equality within a population group. Disparities in physical activity are defined as differential opportunities that older people have for participating in physical activity. To deepen understanding of the contents, meaning and im-portance of disparities in physical activity, this study applies ideas from two theories: the ecological model of ageing and the theory of fundamental causes.
The ecological model of aging is based on the idea that people are in con-stant interaction with the environment they live in and consequently need to adapt to that environment to achieve a balance between their personal compe-tencies and the demands posed by the environment (Lawton & Nahemow 1973). A similar dualism can be seen in the theory of fundamental causes, in which people’s health status is considered to be the result of the resources they possess

14
and the risks they are exposed to (Link & Phelan 1995). Applying both of these theories, the interrelationships between competencies, demands, risks and re-sources were investigated to find out why some older people are more physical-ly active than others. More precisely, this study examined the risks and re-sources which contribute to the balance between the individual and the envi-ronment.
Socioeconomic status is a central factor in the theory of fundamental caus-es. In this study it is considered as a correlate of disparities in physical activity and examined together with risks and resources. The neighborhood is often highly important for older people, who often carry out most of their daily activ-ities in the proximity of the home, where also most of their physical activity takes place (Yen, Michael & Perdue 2009). The environment includes the entire life-space of older people - home, its immediate surroundings, neighborhood and town – all the areas in which older people’s daily activities take place (Baker, Bodner & Allman 2003). The importance of personal and environmental resources in shaping physical activity and functioning in old age has been acknowledged (Satariano & McAuley 2003, Wahl, Iwarsson & Oswald 2012). In this study, the focus was on both individual and environmental risks and re-sources, and the aim was to find out how, together, they affect opportunities for physical activity among older community-dwelling people.
The idea of disparities in physical activity is adopted from the concept of health disparities, which are a worldwide phenomenon and have been under vigorous research for decades (Braveman & Gottlieb 2014, Marmot & Bell 2012). It is widely acknowledged that people with different backgrounds can show large differences in several health outcomes as well as in access to health care. Further, there is an ethical dimension in the existence of these differences: eve-ryone should have equal possibilities to adequate nutrition, physical activity, housing and access to health care (Braveman & Gottlieb 2014). Social determi-nants of health, i.e. the conditions in which people are born, grow up, live, work and age (Commission on Social Determinants of Health. 2008), have been iden-tified as the main cause of health disparities (Braveman & Gottlieb 2014, Mar-mot & Bell 2012, Shavers 2007). Insufficient opportunities to participate in phys-ical activity may lead to a sedentary life-style, which has been identified as one of the key elements of adverse health outcomes, in addition to poor diet, smok-ing, excess alcohol consumption and other exposures (Lee et al. 2012). Dispari-ties in physical activity can be understood as preceding health disparities: peo-ple who do not have sufficient opportunities for physical activities do not gain the benefits of a physically active lifestyle either. Disparities in physical activity may lead to unequal opportunities for participating in the society according to one’s goals. In addition to being related to health disparities, disparities in physical activity form a topic of research in its own right.

2 REVIEW OF THE LITERATURE
2.1 The ecological model of aging
The ecological model of aging is based on the idea of adaptation: in order for a person or species to survive, they must adapt to the demands of the environ-ment, including the existence of other persons and species (Lawton & Na-hemow 1973). Environmental gerontology applies the ecological model of aging in investigating how well older people function in the environment in which they live. Environmental gerontology is a multidimensional subfield of geron-tology, with a main research focus on the physical environments in which older people live (Wahl & Weisman 2003). An older person is exposed to various challenges presented by the environment, and the capabilities of the person to meet those challenges define the extent of person-environment fit (P-E fit). It has been suggested that, in assessing P-E fit, the concepts of individual agency and belonging should also be taken into account (Wahl, Iwarsson & Oswald 2012). When the balance is optimal, the person has sufficient capabilities to en-counter the environment, and the environment provides sufficient challenges for the person to stay focused and motivated. The docility hypotheses states that people with low competence are more vulnerable to the demands of the environment than individuals with better competence (Lawton & Nahemow 1973). If the environment poses challenges that are too great relative to the per-son’s capabilities, the imbalance in P-E fit leads to maladaptation in functioning. However, even though both components of P-E fit are important, it can be pre-sumed that changes in P-E fit are mostly due to the individual component, meaning decline in functioning. Swedish studies that have focused on the Ac-tivities of Daily Living (ADL) have shown that changes in P-E fit have mainly been due to functional decline (Iwarsson 2005, Werngren-Elgstrom, Carlsson & Iwarsson 2008). It has also been argued that the person-environment fit model doesn’t take sufficiently into account the fact that the environment can be a re-source which encourages people to be active and promotes healthy aging (Sa-tariano 2006).
16
The interplay between the individual and the environment is present in many theories and ideas concerning old age. For example in the disablement process, aging or pathology leads to impairment (organ dysfunction) and, fur-ther, to functional limitation, and finally, when a person with functional limita-tion encounters challenges in the environment which are too difficult to handle with his or her resources, to disability (Verbrugge & Jette 1994). Verbrugge and Jette (1994) also argue, in line with the ecological model, that alleviating disabil-ity can be achieved either by increasing capability or reducing demand. Anoth-er concept which includes the idea of P-E fit is accessibility, which describes the person’s ability to function independently, and includes both personal and en-vironmental aspects (Iwarsson & Stahl 2003).
The ecological model is also applied in studies on physical activity and in-activity among people in all age groups (Bauman et al. 2012). When considering outdoor physical activity from the ecological model point of view, the oppor-tunity of an older person to be physically active, such as walking outdoors re-quires both the person’s perception of his or her ability to manage outside in the streets, and it also poses demands for the physical condition of the streets, such as sidewalks and crossings (Hanson et al. 2013). In promoting mobility and physical activity among older people, both the environment and the individual components need to be taken into account (Rantanen 2013, Satariano & McAuley 2003).
2.2 Theory of fundamental causes
According to the theory of fundamental causes, health disparities result from differences in access to resources and exposures to risks which, in turn, distin-guish people in different SES groups with regard to health (Link & Phelan 1995). It has been argued that people who possess the most resources, such as knowledge, money and social connections, and have the best capacity to utilize them in a flexible manner, have the best prerequisites for preventing risks and thus avoiding adverse health outcomes, such as diseases or disabilities (Phelan, Link & Tehranifar 2010). People with more resources also have a wider range of choices they can select from in order to adapt to risks (Satariano 2006).
The theory of fundamental causes aims at explaining why there are socio-economic disparities in health regardless of the major improvements that have been accomplished in medicine, health care and society in general during the past century. Life expectancy has increased and medicine has taken giant leaps in the treatments available for various diseases and conditions. In spite of these advances, socioeconomic disparities in health have continued to exist. One ex-planation for this is that the advances in the control of diseases benefit those with better resources, such as knowledge, money and power, more than those with less (Phelan & Link 2005). An observation supporting this theory is that despite the major improvements in risk factors that have historically been the link between SES and health status, such as problems in sanitation or lack of

17
medicine, the association between low SES and diseases continues to exist (Willson 2009). A recent study conducted in 16 European countries supports the theory by confirming that people with low education have higher mortality risk; however the risk differs across the causes of death and across populations (Mackenbach et al. 2014).
Incorporating the theory of fundamental causes into the framework of this study entails identifying the risk factors for lack of opportunities to be physical-ly active and the resources which enable older people to be physically active. On the pathway from a risk factor to its outcome, the context in which the risk factor is present needs to be taken into account (Link & Phelan 1995). When considering the risk factors for sedentariness or insufficient physical activity in old age, it should be asked which elements in people’s lives expose them to risk factors or lack of resources. Studies which have adopted a life course perspec-tive have shown that SES in early life has long-lasting effects on physical func-tioning across the whole life course, extending from childhood to old age. For example, a study conducted in the US found that people who had low SES in early life were more likely to be inactive in old age than people who had grown up in high SES families, and that this was partially explained by the resources resulting from good SES (Pudrovska & Anishkin 2013). A study with a 29-year follow-up showed that low SES in midlife was associated with difficulty in walking and negotiating stairs in old age (Groffen et al. 2013). Some biomedical factors, such as high serum levels of inflammatory markers, high body mass index (BMI) and hypertension have been found to explain the increased inci-dence of walking limitation among people with low SES (Koster et al. 2005b). Another part of the pattern behind this process could also be that SES influ-ences the area of residence which in low SES areas may be less encouraging or include more barriers for outdoor activities, thus affecting the possibility to go out for a walk (Stathi et al. 2012).
According to the theory of fundamental causes, health disparities continue to exist because people with higher SES consistently have better resources to tackle these risk factors, which vary with time. Therefore reducing disparities cannot be achieved through intervening in the risk factors but rather through reducing socioeconomic disparities (Link & Phelan 1995). When studying phys-ical activity among older people, it should be noted that during the life course, various risks and resources have shaped the level of a person’s physical capaci-ty which in turn defines the ability to be physically active and the attitude to-wards physical activity. In this study, disparities in physical activity are opera-tionalized as two outcomes: unmet physical activity need and restricted life-space mobility. Thus, in this study the focus is not entirely on the individual but also on the environment with its risks and resources. Disparities in physical ac-tivity are differences between individuals in the opportunities that they have for being physically active and functioning in their environment to their full potential. In accordance with the theory of fundamental causes, disparities in physical activity are the result of risks and resources that are related to the indi-vidual and the environment: the different resources and capacities that older

18
people possess, the individual risks that they encounter, the different environ-mental risks people are exposed to and the resources which the environment can offer.
2.3 Disparity
Disparity is a frequently used concept in social sciences. In health sciences, the causes of health disparities and potential ways to reduce them have in particu-lar been widely investigated (Braveman & Gottlieb 2014). According to the def-inition of Braveman (2006), health disparity is “a difference in which disadvan-taged social groups systematically experience worse health or greater health risks than more advantaged social groups”. According to another definition, proposed by Keppel et al. (2005), health disparity means “the quantity that sep-arates a group from a specified reference point on a particular measure of health that is expressed in terms of a rate, percentage, mean or some other quantitative measure”. Health disparities are often studied as differences be-tween socioeconomic groups, or between men and women, or between racial or ethnical groups. The difference between a disparity and a difference is that dis-parity is a difference which should be avoidable (Whitehead 1991). Disparity is closely related to the term inequity, which also describes the existence of a dif-ference, but includes a moral and ethical dimension, referring to differences which are “unnecessary, avoidable, unfair and unjust” (Whitehead 1991).
Health disparities have been found to result primarily from socioeconomic differences, which affect health through different pathways, such as behavior and lifestyle (Adler & Newman 2002, Link & Phelan 1995). Behavioral and life-style factors, such as eating habits, tobacco use and physical activity have been identified as important correlates for health (Lee et al. 2012). Several studies have confirmed the association between low SES and adverse health outcomes (Braveman & Gottlieb 2014, House, Lantz & Herd 2005). Health disparity re-search has also been conducted from a life course perspective, taking into ac-count factors from the past and the present, thus reflecting resources and risks affecting health over a longer period of time (Braveman 2014b). However, SES might not explain all the variation in health differences and it has been argued that various ascribed statuses, such as age, gender and ethnicity should also be taken into account when investigating health inequalities (Alwin & Wray 2005).
Equal health is considered to include equal access to health care and to the prerequisites needed for good health (Braveman 2014a). If equity in health means equal opportunities for everyone to lead a healthy life (Braveman & Gruskin 2003), it can be presumed that it also means equal opportunities for the determinants or prerequisites for health. Physical activity is a well-known de-terminant of good health and in addition it has been identified as an effective treatment for several diseases and conditions (Pahor et al. 2014, Thompson, Gordon & Pescatello 2010). Hence, the relation between disparities in health
19
and physical activity can be seen as causal, with disparities in physical activity being one of the factors leading to health disparities.
Disparities in physical activity inject a novel viewpoint into the research on disparities. In this study, the term is defined as the different opportunities of older people to participate in physical activities. The term disparity is thus used in this study in a manner similar to that in the health disparity literature, i.e. to underline the perception that the differences are avoidable: everyone should have the possibility to be physically active. In line with the definition of health disparity, disparity in physical activity also refers to the unequal availability of resources and opportunities (Braveman 2014a). Contrary to the general idea of health disparities, the concept of disparities in physical activity in this study refers to differences between individuals, not between groups, thus reflecting the idea of person-environment fit, which stems from the ecology of aging. The aim of this study is to examine how disparities in physical activity are manifest-ed in individuals: which factors are correlates for better and which for lesser opportunities for physical activity. Incorporating the idea of the theory of fun-damental causes (Link & Phelan 1995) the imbalance between risks and re-sources is applied in this study to describe the opportunities for physical activi-ty in old age. The different opportunities for physical activity can result from several reasons: different views or knowledge about the importance of physical activity, various functional statuses and limitations, and different environments which can set up barriers, or motivate and encourage participation in activities.
In the Government resolution for Sports Act in Finland (1997) it is stated that providing opportunities for physical activity should be seen as a basic ser-vice. However, it has been acknowledged that for certain groups of people physical activity is not possible without help from the community. The call for equity in opportunities to physical activity is thus included in the resolution. The reasons behind disparities in physical activity can be both individual and environmental, and it is not always clear whether they are avoidable or not. Some opportunities, such as the opportunity to participate in structured exer-cise groups, may be different for older people who live in rural areas compared to people living close to city centers. However, public policy should aim at im-proving physical activity opportunities for those who have difficulties in partic-ipating on their own regardless of their place of residence. In addition, planning streets and other public areas should follow the idea of a universal design (Iwarsson & Stahl 2003), which would allow everyone to use them, regardless of functional limitations.
2.4 Physical activity in old age
Physical activity is defined as bodily movement resulting from the contraction of skeletal muscle that increases energy expenditure above the basal level (Cas-persen 1989). In order to promote health and prevent disease, the American College of Sports Medicine and the American Heart Association have recom-

20
mended that older adults should engage in moderate-intensity aerobic physical activity for at least 30 minutes on five days per week or vigorous-intensity aer-obic activity for at least 20 minutes on three days per week, as well as muscle strengthening activities and activities that maintain or increase flexibility at least twice a week (Nelson et al. 2007). The contents of the Finnish physical ac-tivity recommendation for older people are similar to the American one; how-ever according to the Finnish Health 2011 –survey, less than 10 percent of peo-ple over the age of 75 comply with it (Koskinen, Lundqvist & Ristiluoma 2012). In a recent British study among 75-90-year-old community-dwelling people, 15% of men and 10% of women reached the recommended physical activity levels (Jefferis et al. 2014). Considering that in that population many people have limi-tations in walking and may face difficulties even in habitual physical activity, adherence to these guidelines is challenging.
In this study, physical activity is defined mainly as habitual everyday ac-tivity, in distinction to exercise which is defined as “planned, structured, repeti-tive movement done specifically in order to maintain or improve physical fit-ness”(Wong et al. 2003). The main focus is on outdoor physical activity. Mobili-ty is a concept which correlates with physical activity; however the concepts do not completely overlap. Mobility simply refers to movement in all its forms, such as walking, riding a bicycle, travelling by bus or driving a car (Satariano et al. 2012), including the amount and frequency of movement. Some forms of mobility require more physical activity than others. If we consider for example getting from home to a store, walking requires a higher amount of physical ac-tivity than taking a bus to the store. Mobility limitations or difficulties refer to difficulties in accomplishing any form of mobility. Walking limitations, which are used as a correlate and an outcome in this study, are a subgroup of mobility limitations, and limitations in walking may affect the ability and willingness to utilize other forms of mobility.
As people age, mobility limitations can start to occur, the level of physical activity often declines, and the number of people who meet the physical activity recommendations decreases (Ashe et al. 2009, Hardy et al. 2011). Willingness to participate in physical activity can be overridden by walking limitations and different barriers to physical activity, such as increasing difficulties in accessing exercise facilities or even in going outdoors (Rasinaho et al. 2007). The im-portance of physical activity is emphasized when investigating the adverse out-comes of inactivity: lack of physical activity has been associated with several chronic conditions such as coronary heart disease, type 2 diabetes, breast cancer and colon cancer (Lee et al. 2012). Low physical activity is associated difficulties in walking and negotiating stairs (Brown & Flood 2013) and going outdoors less than weekly has been shown to predict decline in functioning (Kono et al. 2004). Decreases in physical functioning often lead to subsequent disability which in turn can result in loss of independence (Miller & Weissert 2000). In a recent re-view, sedentary behavior was found to be associated with mortality among older people (Rezende et al. 2014).
21
However, participation in regular physical activity has positive effects on health, functioning and well-being in older people (Bijnen et al. 1998). Physical activity can reduce the risk for disability (Guralnik et al. 1995, Keysor & Jette 2001, Landi et al. 2007, Liu & Latham 2009, Pahor et al. 2014) and is beneficial for health and functioning among older people (Satariano & McAuley 2003, Si-monsick et al. 2005). Habitual physical activity, such as walking is beneficial for cardiorespiratory fitness (Wong et al. 2003) and even light activity, such as go-ing out of the house daily, has been associated with better functioning and self-rated health (Jacobs et al. 2008). In older people with functional limitations, even small amounts of physical activity, such as short walks have been shown to be beneficial in order to maintain walking ability and functional capacity (Simonsick et al. 2005).
The possibility to travel independently, either by using public transport or by driving a car, is an important correlate of physical activity among older peo-ple (Lim & Taylor 2005). In addition, physical activity is dependent on envi-ronmental factors (Humpel, Owen & Leslie 2002). Some studies have found an association between area deprivation and physical activity level (Hillsdon et al. 2008), or lower engagement in physical exercise (Amuzu et al. 2009). Leisure-time physical activity has been found to be more common in neighborhoods which are perceived as safe (Tucker-Seeley et al. 2009). In a British study, a low-er level of physical activity was associated with older age, higher BMI and low-er physical functioning, which in turn were more common in people living in more deprived areas (Fox et al. 2011). It should also be noted that studies inves-tigating the relationship between environment and physical activity among older people have shown diverse associations and it has been suggested that different domains of physical activity may show different associations: recrea-tional, transportation and total physical activity measure different domains and thus the observed associations vary.
Encaging in sufficient amount of physical activity can depend on individ-ual factors in all age groups (Bauman et al. 2012). Among older adults, different life events in old age, such as illness, losing a spouse or transitioning into re-tirement, can increase or decrease physical activity adherence (Kenter et al. 2014). A Finnish study found that transition to old-age retirement was associat-ed with an increase in moderate-intensity leisure-time physical activity (Lahti et al. 2011). A major correlate of physical activity in old age is health. Poor health is associated with lower odds of meeting physical activity recommendations (Macniven et al. 2014), and good self-rated health is associated with more hours of exercise among older adults (McHugh & Lawlor 2013). The risk for physical inactivity has been shown to be higher in obese than in non-obese older people (Sallinen et al. 2009).
Another important correlate for outdoor physical activity is social support. Social support plays a significant role in older people’s physical activity: social support, especially in a supportive environment, is a facilitator for physical ac-tivity (Carlson et al. 2012). Lack of social support, such as loneliness or lack of a spouse or a friend, may also reduce the probability of engaging in physical ac-
22
tivity in old age (Hawkley, Thisted & Cacioppo 2009). It has also been observed that older people who live alone are more likely to be active than people who live with someone: people living with a spouse or a relative can have the other person run errands for them, while people living alone might have no choice but to go out and do their own grocery shopping etc. (Tsai et al. 2013). Lack of social relations, such as living alone and low social participation have been as-sociated with onset of mobility limitations (Nilsson, Avlund & Lund 2011). In an Australian study which investigated barriers and enablers to physical activi-ty among older adults who felt insufficiently active but were willing to be more active, the findings showed that meeting physical activity recommendations was less likely among people who reported ill health as a barrier and felt that having someone to exercise with would help them to be more active (Macniven et al. 2014).
2.4.1 Unmet physical activity need
Physical activity is a basic human need. In the hierarchy of needs, physical ac-tivity may not be one of the primary needs; however it is highly valued as a means to achieve other needs. A basic need is defined as “an energizing state that, if satisfied, conduces toward health and well-being but, if not satisfied, contributes to pathology and ill-being” (Ryan & Deci 2000). In the Maslow hier-archy of needs, the need for physical activity falls under the category of physio-logical needs, which are defined as “lack of internal conditions necessary for the body to survive, such that the extended absence of these things could lead to physiological stress or physical death” (Taormina & Gao 2013). Unmet basic needs, such as insufficient income, inadequate housing and unsafe neighbor-hood, have been associated with depressive symptoms (Blazer, Sachs-Ericsson & Hybels 2007), problems with physical functioning (Sachs-Ericsson, Schatschneider & Blazer 2006) and mortality (Blazer, Sachs-Ericsson & Hybels 2005) among older adults. In a French study, unmet health care needs were as-sociated with older age and homebound status (Herr et al. 2014).
The idea of physical activity need is often seen as an innate characteristic of children: children’s need and right for physical activity is generally accepted and physical activity is associated with being a child, but the right to physical activity in old age does not emerge as often as when talking about younger per-sons. However, the need for physical activity is present throughout the life course, even though, in older people, low activity levels are often accepted as part of the normal life course (Brawley, Rejeski & King 2003).
Unmet physical activity need is the feeling that one’s level of physical ac-tivity is inadequate, meaning that one would like to be more active than one is able to be (Rantakokko et al. 2010a). It is an unwanted condition which poten-tially impairs quality of life (Rantakokko et al. 2010b). It can also indicate a mis-fit between the capabilities of a person and the demands of the environment (Lawton & Nahemow 1973, Rantakokko et al. 2010b). In the study where unmet physical activity need was first defined, it was reported by 14 percent of com-munity-dwelling ambulatory older adults (Rantakokko et al. 2010a). Assessing
23
unmet physical activity need was done with two questions asking about the willingness to increase physical activity and about the opportunity to increase the level of physical activity. Unmet physical activity need may be a transient characteristic. When the level of physical activity decreases, the sense of unmet physical activity need is, at first, strongly perceived, however, during the course of time adaptation to the new decreased level of physical activity may cause the feeling of unmet physical activity need to weaken and cease altogether (Rantakokko et al. 2010a). Unmet physical activity need is a rather new finding and it has not been comprehensively investigated among older people. In order to better understand the phenomenon, knowledge about specific individual and environmental risk factors, and their interplay, is needed.
2.4.2 Life-space mobility
Optimal mobility is defined as a person’s ability to go where, when and how one wants to go (Satariano et al. 2012). The actual mobility of a person moving around in his or her environment can be described with the concept of life-space mobility, that is, the spatial area a person purposely moves through in daily life within a specific time, also taking into account the need for assistance to accomplish that movement (Baker, Bodner & Allman 2003). Life-space mobil-ity thus represents the actual movement, in its broadest sense, of a person in his/her daily life, and thus includes walking, driving and using public or other forms of transportation.
Life-space mobility is a multidimensional concept, combining the area in which one moves, the frequency of movement in that area during the past four weeks and potential assistance needed to accomplish it (Baker, Bodner & All-man 2003). At its smallest, a person’s life-space is his or her bed. The next life-space levels are one’s bedroom, home, immediate surroundings of the home, neighborhood and town. The widest level of life-space extends to areas beyond the town and even abroad. To reach the different levels of life-space, the person may require assistance from another person or from an assistive device, such as a cane or a walker. With the element of assistance, life-space mobility also in-cludes compensation strategies used for moving in the environment. Life-space mobility also takes into account the frequency of moving on different life-space levels: daily, weekly or less. By combining information about the area in which one moves, the frequency of movement and the assistance required, it is possi-ble to measure a person’s overall mobility in his or her environment (Baker, Bodner & Allman 2003).
Several studies have used The University of Alabama at Birmingham Study of Life-Space Assessment when assessing life-space mobility (Baker, Bodner & Allman 2003). Some studies have used Life Space Questionnaire (Barnes et al. 2007, Stalvey et al. 1999). Compared to measuring only mobility or physical activity, the strength of the life-space mobility measure is that in addi-tion to physical activity, it reflects activity patterns and lifestyle (Allman, Saw-yer & Roseman 2006) and provides a number that describes the activity and lifestyle of the person during the four previous weeks (Peel et al. 2005). Life-
24
space assessment has also been used as a measure of physical activity (Ikezoe et al. 2011). Life-space mobility takes into account other forms of mobility than walking, such as driving a car or riding a bus, which is reasonable as among older people the ability to drive a car is important (Stathi et al. 2012). Additional strength of the measure is that it reflects the person’s participation in society (Sawyer & Allman 2010). In addition, a life-space mobility assessment gives an insight of what the person actually does, which may not be captured by as-sessing the abilities to perform certain specific tasks (Peel et al. 2005).
Several studies have investigated the correlates of life-space mobility, and the results have shown that life-space mobility correlates with physical activity, physical performance (Sawyer & Allman 2010) and quality of life among older community dwelling people (Rantakokko et al. 2013). The extent of life-space plays a key role in leading an active lifestyle: larger life-space is associated with active social participation (Barnes et al. 2007) and may have a protective effect against cognitive decline (Crowe et al. 2008). On the other hand, shrinking life-space can reflect forthcoming or existing problems in older people’s lives. Life-space mobility then reflects the decreasing number of journeys which may be due to an increasing number of mobility difficulties (Allman, Sawyer & Rose-man 2006). Restricted life-space can be a sign of reduced resources, as shown in a study which demonstrated its association with poor physical performance and a limited sense of autonomy (Portegijs et al. 2014b). Small life-space is asso-ciated with a higher risk for nursing home admission and frailty (Sheppard et al. 2013). Falls are associated with a decrease in life-space mobility (Lo et al. 2014). The association between life-space mobility and socioeconomic status has been investigated in some studies. In a study among older Mexican Americans, more than 12 years of education was associated with higher life-space mobility scores, indicating less restricted life-space mobility (Al Snih et al. 2012). Another study conducted in Latin America showed that more limited life-space mobility was associated with lower education and insufficient income (Curcio et al. 2013). In addition, higher income was associated with higher life-space scores in the US (Allman, Sawyer & Roseman 2006, Peel et al. 2005). It has also been shown that higher education and income are associated with maintaining high life space in a 4-year follow-up (Sawyer & Allman 2010). However, there seem to be no studies which have specifically addressed socioeconomic disparities in life-space mobility and, moreover, investigated factors which may underlie poten-tial disparities.
Life-space mobility can be dynamic, and change in either direction can oc-cur. In most cases, life-space mobility decreases as people age, but it has been shown that older people can improve their LSA scores, perhaps due to im-provements in health status (Sawyer & Allman 2010). Older people can also adapt their behavior regarding mobility in the community, leaving out less im-portant activities and focusing on the more essential functions, such as walking for errands or doing daily chores (Rush, Watts & Stanbury 2011).

25
2.4.3 Walking limitation
Walking is a corner stone of independent living among older people. Walking, along with driving a car, is one of the main forms of mobility in older people, (Satariano et al. 2012). Walking in itself is an essential form of mobility among older people and, because it is a prerequisite for many other forms of mobility, it is also one of the most popular forms of physical activity (Lim & Taylor 2005, Mäkilä, Hirvensalo & Parkatti 2010). In addition to being a popular form of physical activity, outdoor walking is important for older people in order to run errands, to go outdoors for recreation and to participate in community life and social events, incidentally increasing habitual physical activity. Preserving the ability to walk outdoors is one of the main priorities for older peoples’ well-being and independence and it is also a significant way of maintaining mobility in general. However, the risk for walking limitation increases as people age. Walking limitations have been associated with older age, lower SES, obesity and higher number of chronic conditions (Hardy et al. 2010). Fear of moving outdoors also increases the risk of walking limitations (Rantakokko et al. 2009). Walking limitations can indicate an increasing number of restrictions in other forms of mobility as well (Hardy et al. 2011).
The features of the surrounding environment can be crucial in maintaining the ability to walk outdoors. As Verbrugge and Jette (1994) point out when de-scribing the disablement process, disability can be alleviated not only by in-creasing the person’s capacity but also by reducing the physical demand of the environment. In other words, the effect of walking difficulties could be alleviat-ed by making the environment easier to walk in. Perceiving that the environ-ment has barriers may provoke fear and avoidance thereby reducing habitual physical activity, leading to sedentariness and, further to, walking difficulties. Studies which have investigated the association between environment and mo-bility have often examined features of the broader neighborhood, such as traffic, land-use patterns, safety and lightning (Clarke, Ailshire & Lantz 2009, Shum-way-Cook et al. 2002). In order to gain more knowledge about the factors that affect the everyday mobility of older home-dwelling persons, it is equally im-portant to investigate the facilitators in the close surroundings of the home, where most of the activities of older people take place, including the home en-trance (Yen, Michael & Perdue 2009). Information about factors that can allevi-ate or reduce the importance of walking limitation is also needed.
Walking limitations have often been assessed with self-reports. Questions about walking limitations have enquired about the ability to walk different dis-tances such as a quarter of a mile (approximately 400 meters) (Hardy et al. 2010), half a mile (approx. 800 meters) (Melzer et al. 2001), 400 meters (Newman et al. 2006) or 500 meters of 2 kilometers (Leinonen et al. 2007). The response options have often included being able to walk without difficulties, with some or a great deal of difficulties, or being unable to walk the given destination. In some stud-ies, limitations in walking 2 kilometers have been classified as difficulty in ad-vanced mobility and difficulties in walking 500 meters as difficulty in basic mo-

26
bility (Mänty et al. 2009). Enquiring about walking difficulties over different distances gives an idea about the severity of the condition. When walking abil-ity starts to decline, walking over long distances, such as several kilometers, is affected first. For example, if a person reports difficulty walking a distance of 2 kilometers but no difficulty in walking 500 meters, the older person would be considered to have minor walking difficulties (Rasinaho et al. 2007). If the per-son reports difficulties in walking shorter distances, it would indicate that they have advanced walking difficulties.
2.5 Barriers to and facilitators of physical activity
Opportunities to be physically active are influenced by different barriers and facilitators, which can be either individual or environmental (Stathi et al. 2012). In this study, the focus is on individual and environmental outdoor physical activity barriers and environmental facilitators for outdoor walking.
2.5.1 Individual and environmental barriers
Individual barriers are person-related difficulties, such as illnesses or sensory difficulties which hinder participation in outdoor physical activity. For example age, gender and socioeconomic differences as well as obesity, depression, walk-ing limitations and chronic health conditions, all influence the nature of the physical activity barriers that older people experience (Patel et al. 2013, Rasi-naho et al. 2007, Rosqvist et al. 2009, Sallinen et al. 2009). Poor health is one of the most frequently reported barriers to physical activity among older people (Cohen-Mansfield, Marx & Guralnik 2003, Lim & Taylor 2005, Newson & Kemps 2007, Rasinaho et al. 2007, Schutzer & Graves 2004, Stathi et al. 2012). Interestingly, people who are objectively considered to have good health have also been shown to report poor health as a barrier to physical activity (Macniv-en et al. 2014). Other frequently reported individual barriers, in addition to var-ious environmental barriers, are lack of company, lack of interest and lack of time (Dawson et al. 2007, Kowal & Fortier 2007).
Environment refers to the area the older person lives in, i.e., the home, its immediate surroundings and the area where the person conducts his or her dai-ly activities. Environment is closely related to life-space, which describes the area in which one lives (Baker, Bodner & Allman 2003). However, the physical environment includes not only the area but also the built or natural features that either facilitate or hinder movement. A substantial part of research in ger-ontology is focused on the home or the neighborhood, which is understandable as in old age people spend an increasing amount of their time at home or in its environs (Wahl & Weisman 2003). This highlights the importance of having an accessible environment, as this has been shown to have an effect on older peo-ple’s health and functioning (Yen, Michael & Perdue 2009).

27
Environmental barriers are features that are present in the physical envi-ronment and they can be natural or man-made. Problems in the neighborhood environment, especially excessive noise, poor lighting and heavy traffic have been associated with loss in function, which can in turn lead to lower levels of everyday physical activity and less participation in the community (Balfour & Kaplan 2002). Dangerous street crossings and lack of traffic lights are perceived as barriers among older people who use an assistive device for ambulating (Rosenberg et al. 2012). Poor weather, such as rain, heat, and cold temperatures are common barriers to outdoor activity (Rosenberg et al. 2012, Stathi et al. 2012). In the Finnish context, information about the effect of slipperiness in ad-dition to the above mentioned weather barriers would be needed. Poor condi-tion of sidewalks or lack of them has been identified as a barrier among older people who need an assistive device for walking (Rosenberg et al. 2012). Re-porting community mobility barriers, such as uneven sidewalks or walking are-as and lack of safe walking areas or resting places, has been associated with lim-itations in daily activities (Keysor et al. 2010). Traffic, especially a feeling of not being visible to drivers, causes fear among older people who use assistive de-vices (Rosenberg et al. 2012).
It should be noted that the perception of barriers may not be stable and that observing barriers in the environment can depend on many things: older people can adapt to difficulties and barriers and instead of avoiding outdoor walking invent ways to manage their difficulties (Rosenberg et al. 2012). Per-ceiving barriers may depend on whether the person is walking alone or with someone: people who go outdoors alone are more likely to observe barriers than people who have company outdoors (Tsai et al. 2013).
Self-reported barriers to physical activity are typically ascertained by pre-senting a list of potential barriers and asking participants to mark all those bar-riers which apply to their own situation (Leinonen et al. 2007, Rantanen et al. 2012). Some studies have assessed barriers with a Likert-like scale by asking the participants to rate whether they agree that a factor is a barrier for them (Keysor et al. 2010, Kowal & Fortier 2007). In some studies, assessing barriers has been done retrospectively, by asking participants to give the reasons for their not being physically active during the previous months (Kowal & Fortier 2007). A gap in research exists concerning physical activity barriers among people aged 80 years or more, as emerged in a review of physical activity barriers and moti-vators among the oldest-olds, in which Baert and co-authors found that most studies on physical activity barriers have not included persons over the age of 80 (Baert et al. 2011). In many studies, the number of barriers has been calculat-ed; however, it is not clear how different individual and environmental barriers can manifest simultaneously in people with different backgrounds.
Some studies have used objective evaluations of the neighborhood, such as the Geographical Information System (GIS), or objective walkability measures which have taken into account residential density, street connectivity and land-use mix (Van Holle et al. 2014). To objectively assess the barriers in the
28
close vicinity of the home, the Housing Enabler Screening Tool can be used (Iwarsson & Slaug 2001).
2.5.2 Environmental facilitators for physical activity
The environment should not be seen only as a barrier between people and their potential for being physically active, but as a resource for a variety of activities and experiences. The environment can provide a means for restorative experi-ences (Korpela et al. 2010), increase quality of life among older people (Bossen 2010) and motivate older people for outdoor walking and physical activities (Day 2008, Kowal & Fortier 2007). The availability of recreational facilities pro-motes physical activity among older people (Van Cauwenberg et al. 2011). Among older people with functional limitations, the availability of facilitators for community transport has been associated with fewer limitations in daily activities (Keysor et al. 2010). Access to transport also supports other forms of mobility and independent living (Stathi et al. 2012). Among older people who report having poor health, the availability of an exercise facility can help in meeting physical activity recommendations (Macniven et al. 2014). Services and amenities in the neighborhood are frequently reported to inspire outdoor walk-ing (Stathi et al. 2012). Gardens and parks draw older people outdoors (Rosen-berg et al. 2012, Stathi et al. 2012). A supportive environment is associated with more physical activity (Carlson et al. 2012). Qualitative studies have demon-strated that in addition to the presence of facilitators, their quality counts when studying their influence on physical activity (Moran et al. 2014). Sidewalks in good condition, the availability of resting places, good lighting, and easy access and short distances to services, parks and walking areas have in particular been reported to be good environmental facilitators for walking and physical activity among older adults (Duncan, Spence & Mummery 2005, Lockett, Willis & Ed-wards 2005, Mahmood et al. 2012, Rosenberg et al. 2012, Sawchuk et al. 2011, Stathi et al. 2012, White et al. 2010). Neighborhood safety also has an influence on older people’s physical activity: physical activity levels are higher in safe neighborhoods (Tucker-Seeley et al. 2009). For older people who need an assis-tive device for walking, curb ramps, adequate lighting and resting places can act as facilitators for everyday physical activity (Rosenberg et al. 2012). Even though many studies have shown the positive effects of the environment, in the Finnish context the association of environmental facilitators and walking diffi-culties has not been studied.
Environmental facilitators have in some studies been assessed by asking study participants to rate the presence or applicability of each item on a list of environmental characteristics (Kowal & Fortier 2007, Leinonen et al. 2007, Van Cauwenberg et al. 2013). Another way to investigate potential motivators or facilitators for physical activity is to use neighborhood walkability measures. Walkability has been defined to mean a neighborhood in which there is good street connectivity, people’s target destinations are close to their homes and the routes to those destinations are direct (Frank et al. 2005). In a study conducted in the US, neighborhoods with good walkability were associated with more
29
walking and bicycling among older people (King et al. 2011). A Belgian study found that walkability was associated with self-reported walking for transpor-tation, but not with self-reported recreational physical activity (Van Holle et al. 2014). Walkability measures often cover the broad environment, however they do not always take the close surroundings of the home, such as the home en-trance, into account.
2.6 Socioeconomic status in old age
Socioeconomic status (SES) is a major contributor to health disparities (Marmot & Bell 2012, Shavers 2007). Several studies have shown that people with high SES have better health than people with lower SES, and differences between people with middle and high SES have also been reported (Braveman et al. 2010, Marmot & Bell 2012, Smith et al. 2014). In a Finnish study conducted on nona-genarians, higher education and occupational status was associated with better health (Enroth et al. 2013). Other measures of SES, such as income, have also been associated with health status in old age (Dahl & Birkelund 1997). A social gradient has also been seen in the compression of morbidity and functional lim-itations (House, Lantz & Herd 2005). Childhood SES also has an effect on mor-tality (Giesinger et al. 2014).
SES influences health through different pathways, which are mainly indi-rect, meaning that SES leads to the availability of resources or exposure to risks, which then have more direct effects on health (Adler & Newman 2002, Link & Phelan 1995). The pathways though which SES affects health status are suggest-ed to include environmental exposures, access and use of health care, social en-vironment and behavioral and lifestyle factors (Adler & Newman 2002). Social determinants of health, meaning the conditions in which people are born, grow up, live, work and age (Commission on Social Determinants of Health. 2008), have been identified as the main cause of health disparities while there is also evidence to show that the effect of childhood exposures can accumulate throughout the life course (Marmot & Bell 2012, Shavers 2007). A recent study showed that in Finland, socioeconomic differences in functional capacity among 30- to 74-year-old men and women remained similar from the year 2000 to the year 2011, despite the improvement in general health of that population (Talala et al. 2014). As for older people, functional capacity, measured with ADL diffi-culties, showed a similar trend: people with higher education had better func-tional capacity (Sulander et al. 2006).
Socioeconomic status describes a person’s achieved status in society through education, occupation and/or income whereas social status also in-cludes ascribed statuses such as age, gender and race (Alwin & Wray 2005). In studies on health and functioning, SES is most often assessed using education, occupation or income (Adler & Newman 2002). Financial assets (Nilsson, Avlund & Lund 2011) and subjective SES (Nobles, Weintraub & Adler 2013) have also been used. Each of the measures has its strengths and limitations. Us-

30
ing education as an indicator of SES is perhaps the most common measure, per-haps because it is supported by several factors: it is easy to measure, infor-mation about education is available for most individuals, education is achieved during early adulthood and it remains rather stable throughout life, thus re-flecting life-course circumstances (Shavers 2007). Education can be seen as a resource relevant to socioeconomic resources during the life course such as oc-cupation and work. These in turn influence working conditions, income and knowledge, all of which can affect health behavior and life-style choices (Braveman & Gottlieb 2014). Education can be measured as length of education in years or as highest educational attainment.
The use of occupation as an indicator of SES also has its strengths while it forms a valid link between education and income and it often correlates with working conditions (Shavers 2007). However, occupation can be measured in different ways to reflect different aspects of working life: whether someone is employed or not provides different information than occupational status, where, for example blue-collar workers are compared with white-collar workers (Adler & Newman 2002). One difficulty or limitation in taking occupation as an indica-tor of SES is that categorizing occupations from open-ended questions can be challenging especially in such cases as smallholders’ wives and self-employed persons (Shavers 2007). Using occupation as an indicator of SES may also be problematic especially for older women, in whom SES may depend on their husband’s rather than their own occupation (Melzer et al. 2001). On the other hand, the same argument can be made for education. Some studies have used more than one measure of SES and shown that different SES measures can re-sult in somewhat different results (Enroth et al. 2015, House, Lantz & Herd 2005). Interestingly, a British study, which investigated the relationship be-tween SES and telomere length, found that higher education was associated with longer telomeres among older adults, whereas occupation and income were not (Steptoe et al. 2011). The authors suggest that education, which reflects life-course circumstances, captures the resources from childhood and earlier adulthood better than occupation or income, which more strongly reflect cur-rent status. Subjective assessments of socioeconomic status have also been shown to be predictive of health (Nobles, Weintraub & Adler 2013).
Socioeconomic status has been associated with walking difficulties, low physical performance and physical inactivity in several studies. Low SES has been associated with difficulties in stair climbing (Melzer et al. 2001, Rautio et al. 2006, Sainio et al. 2007), walking half a mile (Melzer et al. 2001), limited ability to walk a quarter of a mile (Hardy et al. 2011), preclinical mobility disability (Gregory et al. 2011), increased risk for mobility decline in chronically ill people (Koster et al. 2005a) and also in increased incidence of walking limitation in well-functioning older people (Koster et al. 2005b). Low SES has also been asso-ciated with chronic musculoskeletal complaints (Hagen et al. 2005) and physio-logical impairments (Coppin et al. 2006). In relation to physical activity, low SES has been associated with lower likelihood of meeting physical activity rec-ommendations (Ashe et al. 2009) and with lower levels of physical activity

31
(Hillsdon et al. 2008, Tucker-Seeley et al. 2009) and inactivity (Farrell et al. 2014). Childhood SES has been associated with physical activity: people who grew up in low SES families had lower levels of physical activity in old age than people from high SES families (Pudrovska & Anishkin 2013). Low SES, measured as financial assets, has been associated with increased odds of onset of mobility limitation both independently (Nilsson, Avlund & Lund 2010) and in combina-tion with low social participation especially among older men (Nilsson, Avlund & Lund 2011). Accordingly, higher SES has been associated with better balance and faster walking speed among 60- to 80-year-old people (Welmer et al. 2013). Among older women, higher education has been associated with lower odds of walking limitation (Latham 2014).

3 AIMS OF THE STUDY
The purpose of the study was to examine how disparities in physical activity are manifested among older people and what factors contribute to these dispar-ities. The specific research questions were:
1. Are outdoor physical activity barriers associated with unmet
physical activity need in old age? (Study I) 2. Does walking limitation influence the risk of unmet physical activ-
ity need similarly in older people with high or low socioeconomic status and does lack of social support add to the risk? (Study II)
3. Do perceived environmental facilitators prevent development of
walking limitations among older people without walking limita-tion at baseline? (Study III)
4. Are there socioeconomic differences in life-space mobility in old
age and what factors explain the potential differences? (Study IV)
An analytical model of the interrelationships of the study predictors and out-comes according to the ecological model of ageing and theory of fundamental causes is described in Figure 1.

FIGURE 1 An analytical model of the study concepts. The study outcomes are in italics. Factors typed in grey are not tested in the models presented in this study.

4 DATA AND METHODS
4.1 Study design and participants
The data for this study are drawn from two projects: Screening and Counseling for Physical Activity and Mobility (SCAMOB) and Life-space Mobility in Old Age (LISPE). The SCAMOB project investigated the effects of physical activity counseling among community-dwelling older people in the city of Jyväskylä. The LISPE project was an observational cohort study which examined life-space mobility among older community-dwelling people resident in Jyväskylä and Muurame. The designs, populations and outcomes of the sub-studies are sum-marized in Table 1.
TABLE 1 Summary of study designs, populations and outcomes.
Paper Study Design Population Age group
Outcome
I LISPE Cross-sectional
848 community-dwelling men and women
75-90 Unmet physical activity need
II SCAMOB Cross-sectional
632 community-dwelling men and women
75-81 Unmet physical activity need
III SCAMOB Observational 3,5-year follow-up
261 community-dwelling men and women
75-81 Walking limitation
IV LISPE Cross-sectional
848 community-dwelling men and women
75-90 Life-space mobility
SD= Standard deviation

35
4.1.1 Screening and Counseling for Physical Activity and Mobility (SCAMOB)
The target population of the SCAMOB project included all the 75-to 81-year-old persons living in the city center area of Jyväskylä, Finland in March 2003 (N=1310). The contact information was obtained from the Finnish population register. All potential participants were sent a letter, followed by a telephone call in which they were preliminarily screened for their potential willingness and suitability to participate in the study. 1 100 persons were willing to partici-pate, of whom 17% were excluded because they did not meet the inclusion cri-teria. To be eligible for the study participants had to be able to walk 500 meters without assistance, be only moderately active or sedentary (at most 4 hours of walking or 2 hours of other exercise weekly), have a Mini-Mental State Exami-nation (MMSE) score over 21 and have no medical contraindications for physi-cal activity (Leinonen et al. 2007). Of the 908 persons considered to be suitable for the study, 181 refused to participate. Thus, 727 persons were then inter-viewed in their homes about, among other things, their level of physical activity and they also completed a memory test during the visit. At that point, 36 per-sons were excluded and 34 refused to take part in the further examinations, leaving 657 persons who took part in the physical assessments and interviews at the study center. After the assessments at the study center, 18 persons were excluded on medical grounds and 7 refused to continue, leaving 632 partici-pants (75% women) who were then randomized into an intervention or a con-trol group.
In the present study, the baseline interview data of the 632 persons, 629 of whom had provided information on the questions concerning unmet physical activity need, was used for the cross-sectional analyses of Study II. In Study III, data from those people in the control group who did not report walking limita-tions at baseline (n=261) was used to follow the naturally occurring changes in walking. After the baseline interviews, the participants were contacted by tele-phone three times at 6-month intervals, and two years after the baseline inter-view face-to-face follow-up interviews were conducted. After the follow-up interviews, another three telephone interviews at 6-month intervals were con-ducted, making the overall follow-up period 3.5 years in total.
4.1.2 Life-Space Mobility in Old Age (LISPE)
The LISPE study targeted all 75-90-year-old community-dwelling people resi-dent in the municipalities of Jyväskylä and Muurame. A random sample of 500 persons from each of three age groups, i.e., 75-79, 80-84 and 85-89 years, was drawn from the Finnish population register in December 2011. In March 2012, an additional sample of 350 persons was drawn for each age group, making the total sample of 2 550 persons. A letter containing information about the research was sent to all of the people in the sample, followed by a telephone call in which the potential participants were screened for willingness to participate and eligibility. To be eligible, persons willing to participate had to live inde-
36
pendently in the recruitment area and be able to communicate. Of the initial sample of 2 550 persons, 2 269 were reached by telephone. 1 111 of them de-clined and 304 did not meet the eligibility criteria, leaving 854 persons who were interviewed in their homes by trained interviewers. During the home in-terviews, four participants were excluded due to communication problems and for two persons the data were lost, hence the final baseline sample was 848 per-sons. The baseline data were used for the cross-sectional analyses of Study I and Study IV.
4.2 Ethics
The SCAMOB project was approved by the Ethical Committee of the Central Finland Health Care District and the LISPE project by the Ethical Committee of the University of Jyväskylä. The participants in both projects were informed about the research and signed an informed consent. The studies were conduct-ed according to the principles of good clinical practice and good scientific prac-tice as outlined in the Helsinki Declaration.
4.3 Measurements
4.3.1 Unmet physical activity need
Unmet physical activity need was assessed in the SCAMOB study and the LISPE study with two questions: “Do you feel that you would have the oppor-tunity to increase your level of physical activity if someone recommended you to do so?” and “Would you like to increase your level of physical activity?” with the response options of yes and no. People who replied that they would like to increase their level of physical activity but did not have the opportunity to do so were defined as experiencing unmet physical activity need (Rantakok-ko et al. 2010a).
4.3.2 Life-space mobility
The University of Alabama at Birmingham Study of Life-Space Assessment (LSA) was used to measure life-space mobility (Baker, Bodner & Allman 2003). The LSA includes 15 items and it assesses mobility in six life-space levels: bed-room, other rooms, outside home, neighborhood, town and beyond town. For each level there are three questions. First the person is asked if they have at-tained the level in question, then how many times a week they have attained that level and finally if they have used an assistive device or needed help from another person. For the analyses, a composite score which reflects distance, fre-quency and potential assistance, was calculated. The LSA composite score rang-
37
es from 0 to 120, with higher scores indicating larger life-space. For descriptive analyses, the LSA composite score was dichotomized into restricted (scores 0-59) and unrestricted (scores 60-120) life-space. The reproducibility of the life-space assessment was found to be fairly good, although the scores showed more vari-ation in the winter than spring (Portegijs et al. 2014a).
4.3.3 Walking limitation
In Study II, the presence of walking limitations was assessed by asking the par-ticipants about the difficulties they experienced in walking 2 km and climbing up 1 flight of stairs. The question was formulated as “Do you have difficulty in walking 2 km?” and “Do you have difficulty in climbing one flight of stairs?”. The response options were 1) able to manage without difficulty, 2) able to man-age with some difficulty, 3) able to manage with great deal of difficulty, 4) able to manage only with help from another person, and 5) unable to manage even with help. For the analyses, the options were dichotomized into no or some dif-ficulties (1-2) and a great deal of difficulties (3-5). Those with a great deal of dif-ficulty in walking 2 km or climbing stairs, or both, were categorized as having walking limitations (Rasinaho et al. 2007).
In Study III, walking limitations were assessed by asking the participants if they had any difficulties in walking 0.5 km. The response options were the same as for difficulties in walking 2 km: 1) able to manage without difficulty, 2) able to manage with some difficulty, 3) able to manage with great deal of diffi-culty, 4) able to manage only with help from another person, and 5) unable to manage even with help. People were considered as having developed walking limitations if at some point during the 3.5-year follow-up they reported some difficulties or a great deal of difficulties, needing help from another person or being unable to walk 0.5 km.
4.3.4 Physical activity
Level of physical activity was assessed using a standardized question modified from the classification of physical activity among elderly people by Grimby (Grimby 1986). The question was formulated as “If you think about the past six months, which of the following best describes your physical activity?” and had seven response alternatives: 1) mainly resting or only minimal physical activity, 2) most activities performed sitting down, 3) light physical activity, 4) moderate physical activity about 3 h a week, 5) moderate physical activity at least 4 h a week or heavy physical activity 3 h a week, 6) physical exercise several times a week or heavy leisure time working at least 3 h a week and 7) competitive sports several times a week. Light physical activity included activities such as light housework or gardening or short walks once or twice a week, moderate physical activity included ordinary housework such as vacuuming, mowing the lawn or walking at least 2 kilometers or bicycling, and heavy physical activity included exercise which cause breathlessness or heavy sweating.

38
4.3.5 Outdoor physical activity barriers
To assess the barriers to outdoor physical activity, we used the Barriers to Out-door Physical Activity Questionnaire (BOPA), which included both individual and environmental barriers to outdoor physical activity. The questionnaire was originally developed by an expert panel for the SCAMOB project (Rasinaho et al. 2007), and it has shown good reliability ( 0.417-1.000) (Leinonen et al. 2007). The questionnaire was further modified for the LISPE project (Rantanen et al. 2012). The participants were asked: “What are the reasons that hinder or pre-vent you from outdoor physical activity, such as walking for fitness or walking to a store? Select from the list all the items that apply to your situation”. This was followed by a list of 17 items, with each item rated as present or absent: 1) Pain and illnesses; 2) I’m too tired, walking limitations are a barrier to outdoor walking; 3) Poor vision; 4) Hearing problems; 5) I’m afraid of falling when I’m outdoors; 6) I’m afraid of falling victim to crime; 7) I feel insecure when I’m outdoors; 8) I’m afraid of getting hit by a car; 9) I have no one to go out with; 10) Poor weather; 11) Slippery roads; 12) Darkness; 13) The environment around my home is not suitable for outdoor walking; 14) I’m not interested in outdoor physical activity; 15) Health care personnel or relatives have told me not to walk outdoors; 16) I’m too old for outdoor walking and 17) I’m not used to out-door physical activity. To calculate a summary score of the items they were summed to form a scale ranging from 0 to 17, with 0 indicating no barriers and 17 barriers in all items.
4.3.6 Social support
The availability of social support was assessed by asking whether the partici-pants had someone to talk to whenever they wanted. The response options were 1) nearly always, 2) fairly often, 3) occasionally, and 4) not at all. For the analyses, the responses were dichotomized as nearly always or fairly often (1-2) and occasionally or not at all (3-4).
4.3.7 Environmental facilitators
Environmental facilitators for outdoor walking were self-reported in face-to-face interviews. The questions concerning environmental facilitators were not grouped under any specific measure but were gathered from the available data. Five items from the SCAMOB questionnaire were included in the summary score of environmental facilitators: 1) Having features in one’s home which make it easy to access the outdoors, such as automatic doors or no doorsteps, 2) Having a park or other green area for physical activity within a walking dis-tance from home, 3) Having outdoor recreational facilities, such as walking routes or ski tracks within walking distance from home, 4) Having features in the nearby environment which attract for outdoor activities, such as proximity of a park or an even pathway, and 5) Perceiving the surrounding environment or facilities nearby as suitable for physical activity. Each item was scored as 0
39
for not present and 1 for present. A summary score for environmental facilita-tors for out-of-home activities was calculated and, ranging from 0 to 5, with 0 indicating no items present and 5 all items present.
4.3.8 Socioeconomic status
In Study II with data from the SCAMOB project, socioeconomic status (SES) was categorized based on a variable which combined the highest level of educa-tion and longest-held occupation. A dichotomous variable for SES was created in the following way: people were categorized as having low SES if they had less than secondary school education and had worked as untrained workers or farmers or had been housewives. Trained workers and entrepreneurs were also included in the low SES group if they had elementary education only. The high SES group consisted of people who had gone through secondary or higher edu-cation or who had held a managerial position. Trained workers with more than elementary education were also included in this group.
In the LISPE project we used the highest educational attainment as an in-dicator of SES. Information about educational attainment is also quite easy to obtain for most populations (Shavers 2007). The highest level of education was assessed with the question “What is the highest level of education you have attained?” with nine response options: 1) Less than elementary school, 2) Ele-mentary school, 3) Elementary school and at least one year of vocational educa-tion, 4) Middle school or folk high school, 5) Middle school or folk high school and at least one year of vocational education, 6) High school, 7) High school and at least one year of vocational education, 8) University degree and 9) Other education. For the analyses, the level of education was categorized into three groups: low (1-2), middle (3-5) and high (6-8) (Sainio et al. 2007). All those who had answered “Other education” in the questionnaire had also provided anoth-er level of education, which was then used to define their level of education.
4.3.9 Background information
Information about the participants health, functioning and demographic char-acteristics was collected in face-to-face interviews. Age and gender were de-rived from the population register. Time of the year of the interview in the LISPE study was divided into winter and spring (I). Physician-diagnosed chronic conditions were self-reported (I, III, IV). Living conditions (alone or with someone) were self-reported (I, II, III, IV). Cognitive capacity was assessed using Mini-Mental State Examination (MMSE) (Folstein, Folstein & McHugh 1975) (I, III, IV). Depressive symptoms were assessed with the Center for Epi-demiologic Studies Depression Scale (CES-D) (Radloff 1977) (I, III, IV). Maximal walking speed was measured in the study-center corridor in the SCAMOB study (III). Lower extremity physical performance in the LISPE study was as-sessed with the Short Physical Performance Battery (SPPB) (Guralnik et al. 1994) and body mass index (BMI) was calculated as self-reported weight in kilograms (kg) divided by height in meters (m) squared (IV).
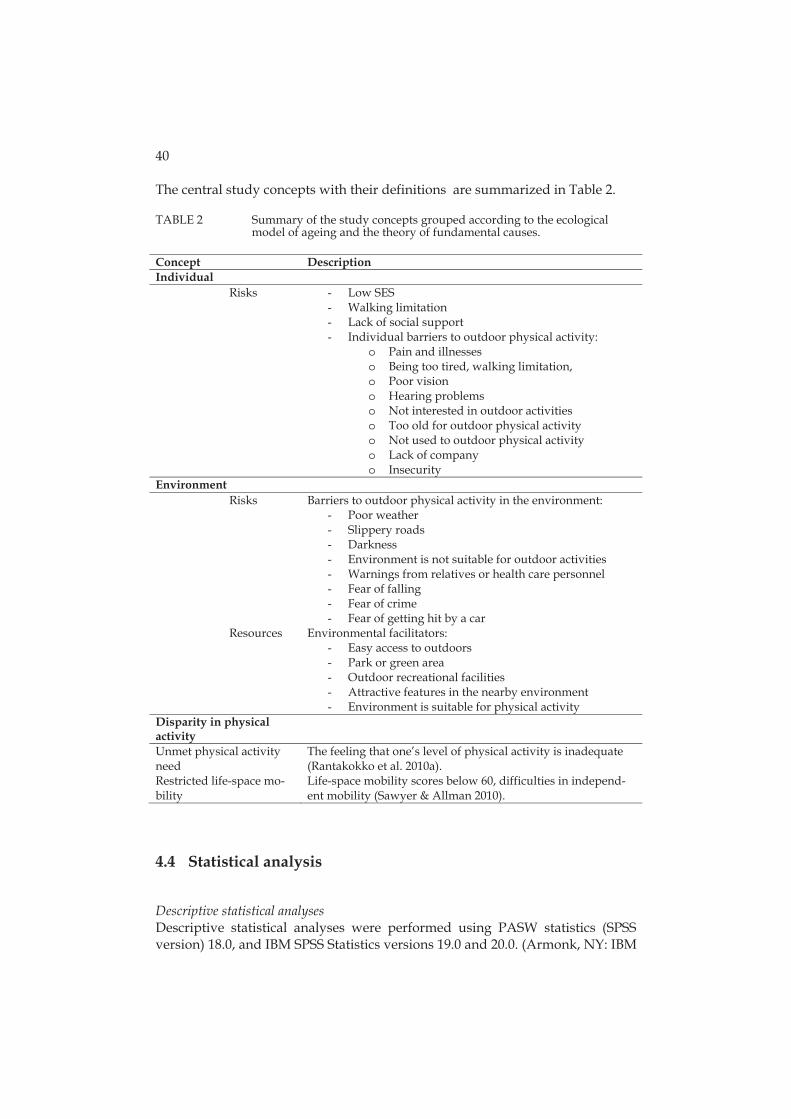
40
The central study concepts with their definitions are summarized in Table 2.
TABLE 2 Summary of the study concepts grouped according to the ecological model of ageing and the theory of fundamental causes.
Concept Description Individual
Risks - Low SES - Walking limitation - Lack of social support - Individual barriers to outdoor physical activity:
o Pain and illnesses o Being too tired, walking limitation, o Poor vision o Hearing problems o Not interested in outdoor activities o Too old for outdoor physical activity o Not used to outdoor physical activity o Lack of company o Insecurity
Environment Risks Barriers to outdoor physical activity in the environment:
- Poor weather - Slippery roads - Darkness - Environment is not suitable for outdoor activities - Warnings from relatives or health care personnel - Fear of falling - Fear of crime - Fear of getting hit by a car
Resources Environmental facilitators: - Easy access to outdoors - Park or green area - Outdoor recreational facilities - Attractive features in the nearby environment - Environment is suitable for physical activity
Disparity in physical activity
Unmet physical activity need
The feeling that one’s level of physical activity is inadequate (Rantakokko et al. 2010a).
Restricted life-space mo-bility
Life-space mobility scores below 60, difficulties in independ-ent mobility (Sawyer & Allman 2010).
4.4 Statistical analysis
Descriptive statistical analyses Descriptive statistical analyses were performed using PASW statistics (SPSS version) 18.0, and IBM SPSS Statistics versions 19.0 and 20.0. (Armonk, NY: IBM
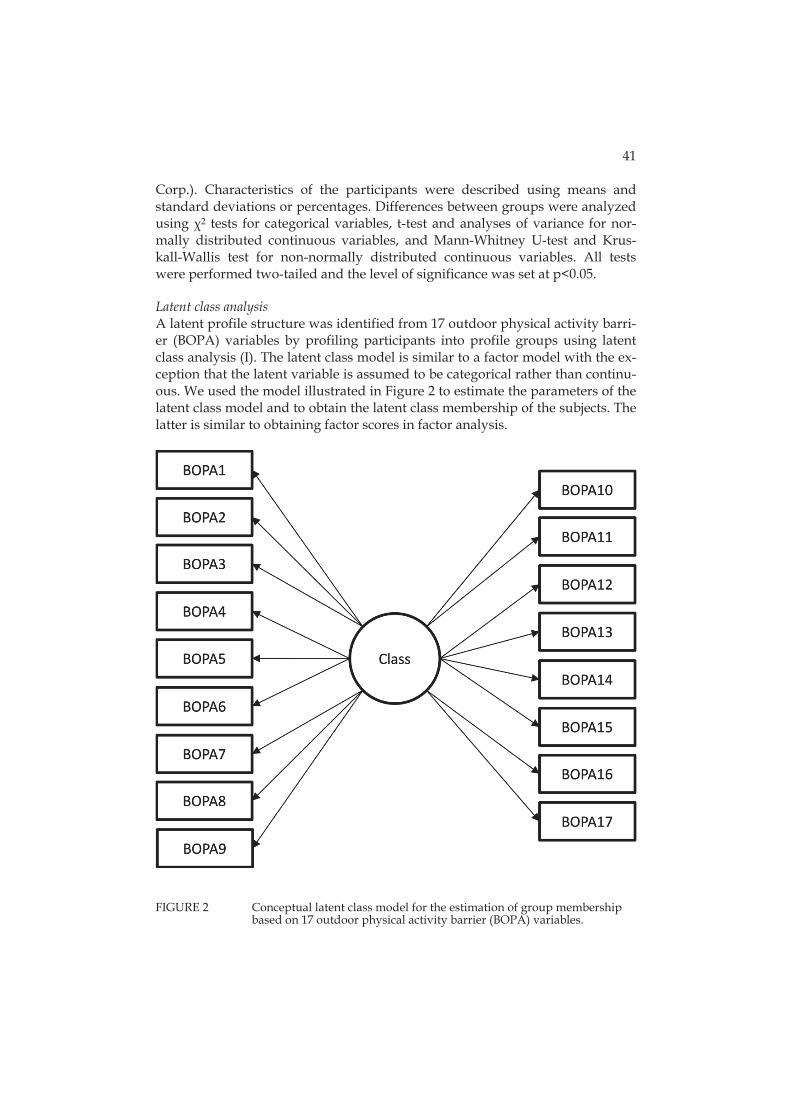
41
Corp.). Characteristics of the participants were described using means and standard deviations or percentages. Differences between groups were analyzed using 2 tests for categorical variables, t-test and analyses of variance for nor-mally distributed continuous variables, and Mann-Whitney U-test and Krus-kall-Wallis test for non-normally distributed continuous variables. All tests were performed two-tailed and the level of significance was set at p<0.05. Latent class analysis A latent profile structure was identified from 17 outdoor physical activity barri-er (BOPA) variables by profiling participants into profile groups using latent class analysis (I). The latent class model is similar to a factor model with the ex-ception that the latent variable is assumed to be categorical rather than continu-ous. We used the model illustrated in Figure 2 to estimate the parameters of the latent class model and to obtain the latent class membership of the subjects. The latter is similar to obtaining factor scores in factor analysis.
FIGURE 2 Conceptual latent class model for the estimation of group membership based on 17 outdoor physical activity barrier (BOPA) variables.

42
The number of latent profiles was based on model information criteria (Akaike information criterion, AIC, Bayesian information criterion, BIC, and sample size adjusted, aBIC) and salience of the configuration obtained. BIC indicated two subgroups, while aBIC indicated five subgroups. Based on the average group membership probability and the interpretability of the barrier clustering in the groups, the characteristics of five groups were further examined.
After the latent class model a conceptual path model (shown in Figure 3) was constructed to assess the association between the barrier-based groupings and unmet physical activity need. In the actual path model the categorical membership variable was represented by four dummy variables with the group Minor barriers as the reference category. Those with no unmet physical activity need formed the reference group. Each dummy variable was permitted to have a unique path coefficient in a logistic regression on the unmet physical activity need variable. The path model was adjusted for gender with men as the refer-ence category, and age, so that the adjusting variables had both direct and indi-rect effects on the unmet physical activity need variable.
FIGURE 3 Conceptual path model assessing the association between the barrier variable-based latent classes and unmet physical activity.
The descriptive statistics on the impact of individual covariate measurements on the profiles was investigated separately for the background variables. Dif-ferences in the distribution of reported barriers between the profiles were com-pared with Kruskall-Wallis –tests for continuous variables and 2 tests for cate-gorized variables. Pairwise comparison p-values were corrected with the Dunn-Šidák correction. Descriptive analyses were performed using IBM SPSS Statis-tics version 20.0. The latent class analyses and path analyses were performed with Mplus version 7.0 (Muthén & Muthén 2009). Logistic regression analyses To identify risk factors associated with unmet physical activity need, logistic regression analysis was used (II). Analyses were adjusted for age and sex. To study the associations of co-existing risk factors and unmet physical activity need, four exclusive groups were formed from walking, SES and the presence
43
of social support: 1) no walking limitations (reference group); 2) walking limita-tions, but no other risk factors, 3) walking limitations and either low SES or lack of social support; and 4) walking limitations, low SES and lack of social support. Logistic regression analyses were performed using PASW statistics (SPSS ver-sion) 18.0.
Cox regression models In Study III, time to walking limitation was calculated as days from the begin-ning of the study until the day of the interview when the participant first re-ported limitation. Participants were censored on the latest day of interview be-fore they died or declined or at the end of the follow-up, whichever happened first. Cox regression models were used to investigate the association between environmental facilitators and incident walking limitation. The model was ad-justed for age, sex and level of physical activity. Results are reported as hazard ratios (HRs) and 95 % confidence intervals (CI). When the 95% CIs did not in-clude one, or p<.05, the differences were regarded as statistically significant. Cox regression analyses were performed using IBM SPSS Statistics version 19.0. General linear model The association between socioeconomic status and life-space mobility was in-vestigated using a general linear model (Study IV). The base model included age, and it was adjusted for gender. Each factor (BMI, cognitive capacity, and physical performance) was then added into the model separately, and finally all the factors were included in the model simultaneously. Marginal means with standard errors of the life-space mobility scores by SES groups and differences in the scores between the groups are presented. General linear model was per-formed using IBM SPSS Statistics versions 19.0 and 22.0.

5 RESULTS
5.1 Characteristics of the participants
Total of 1477 persons participated in the present study. Table 3 summarizes the baseline characteristics of the participants in the SCAMOB and LISPE projects.
TABLE 3 Baseline characteristics of the participants in the SCAMOB and LISPE projects.
SCAMOB (n=629) LISPE (n=848) Mean (SD) Mean SD Age 77.6 1.9 80.1 4.3 Education (years) 9.2 4.3 9.6 4.1 Chronic conditions (number) 3.1 2.0 4.4 2.4 MMSE (score) 27.1 2.1 26.2 2.8 CES-D (score) 10.1 7.5 9.6 6.8 % % Women 74.9 62.0 Living alone 58.0 53.3 Difficulties in walking 0.5 km 15.3 25.6 Difficulties in walking 2 km 34.2 42.0 Physically inactive 25.4 36.1 Unmet physical activity need 13.0 13.6 SD = Standard Deviation
5.2 Outdoor physical activity barriers (Study I)
The percentages of all participants reporting outdoor physical activity barriers are presented in Table 4.
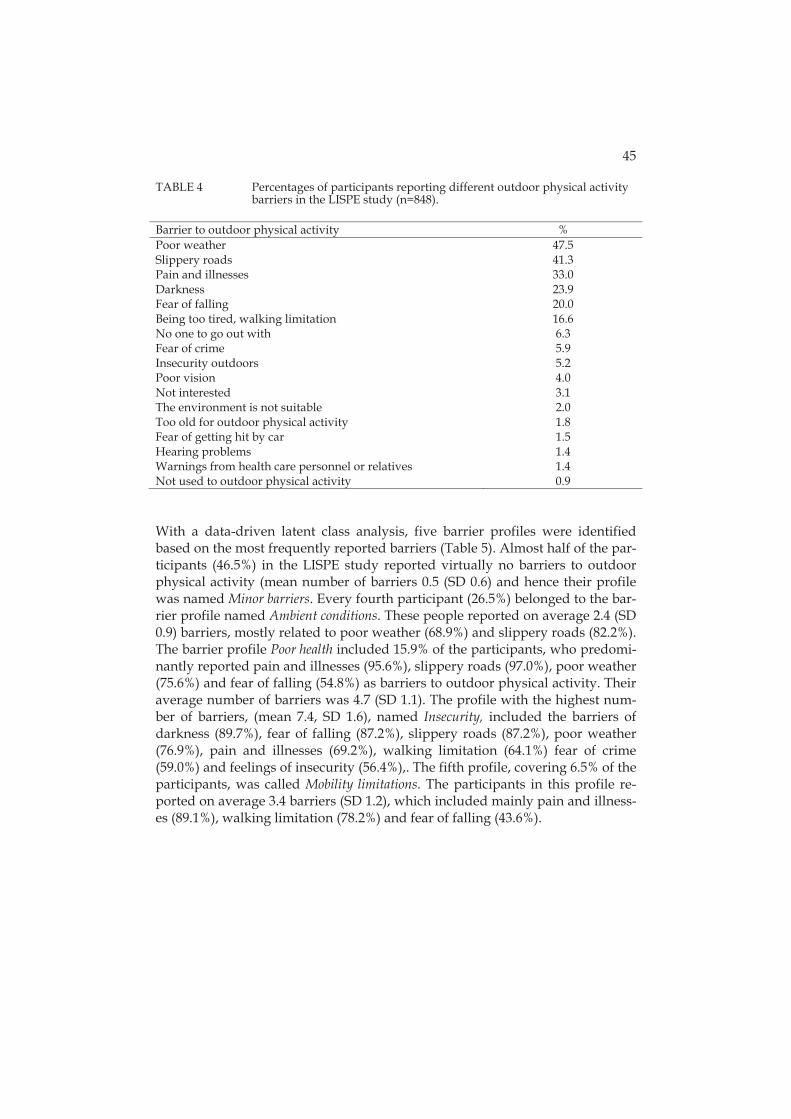
45
TABLE 4 Percentages of participants reporting different outdoor physical activity barriers in the LISPE study (n=848).
Barrier to outdoor physical activity % Poor weather 47.5 Slippery roads 41.3 Pain and illnesses 33.0 Darkness 23.9 Fear of falling 20.0 Being too tired, walking limitation 16.6 No one to go out with 6.3 Fear of crime 5.9 Insecurity outdoors 5.2 Poor vision 4.0 Not interested 3.1 The environment is not suitable 2.0 Too old for outdoor physical activity 1.8 Fear of getting hit by car 1.5 Hearing problems 1.4 Warnings from health care personnel or relatives 1.4 Not used to outdoor physical activity 0.9 With a data-driven latent class analysis, five barrier profiles were identified based on the most frequently reported barriers (Table 5). Almost half of the par-ticipants (46.5%) in the LISPE study reported virtually no barriers to outdoor physical activity (mean number of barriers 0.5 (SD 0.6) and hence their profile was named Minor barriers. Every fourth participant (26.5%) belonged to the bar-rier profile named Ambient conditions. These people reported on average 2.4 (SD 0.9) barriers, mostly related to poor weather (68.9%) and slippery roads (82.2%). The barrier profile Poor health included 15.9% of the participants, who predomi-nantly reported pain and illnesses (95.6%), slippery roads (97.0%), poor weather (75.6%) and fear of falling (54.8%) as barriers to outdoor physical activity. Their average number of barriers was 4.7 (SD 1.1). The profile with the highest num-ber of barriers, (mean 7.4, SD 1.6), named Insecurity, included the barriers of darkness (89.7%), fear of falling (87.2%), slippery roads (87.2%), poor weather (76.9%), pain and illnesses (69.2%), walking limitation (64.1%) fear of crime (59.0%) and feelings of insecurity (56.4%),. The fifth profile, covering 6.5% of the participants, was called Mobility limitations. The participants in this profile re-ported on average 3.4 barriers (SD 1.2), which included mainly pain and illness-es (89.1%), walking limitation (78.2%) and fear of falling (43.6%).
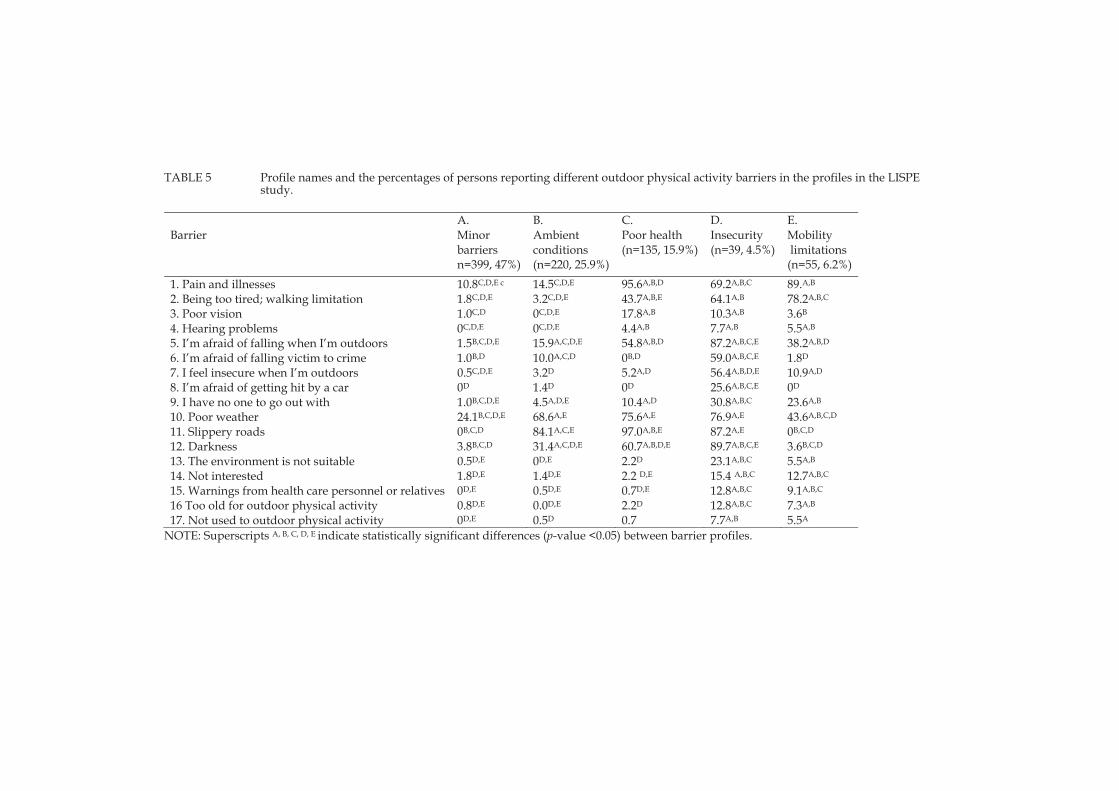
TABLE 5 Profile names and the percentages of persons reporting different outdoor physical activity barriers in the profiles in the LISPE study.
A. B. C. D. E.Barrier Minor
barriers n=399, 47%)
Ambient conditions (n=220, 25.9%)
Poor health (n=135, 15.9%)
Insecurity (n=39, 4.5%)
Mobility limitations (n=55, 6.2%)
1. Pain and illnesses 10.8C,D,E c 14.5C,D,E 95.6A,B,D 69.2A,B,C 89.A,B
2. Being too tired; walking limitation 1.8C,D,E 3.2C,D,E 43.7A,B,E 64.1A,B 78.2A,B,C 3. Poor vision 1.0C,D 0C,D,E 17.8A,B 10.3A,B 3.6B
4. Hearing problems 0C,D,E 0C,D,E 4.4A,B 7.7A,B 5.5A,B 5. I’m afraid of falling when I’m outdoors 1.5B,C,D,E 15.9A,C,D,E 54.8A,B,D 87.2A,B,C,E 38.2A,B,D
6. I’m afraid of falling victim to crime 1.0B,D 10.0A,C,D 0B,D 59.0A,B,C,E 1.8D
7. I feel insecure when I’m outdoors 0.5C,D,E 3.2D 5.2A,D 56.4A,B,D,E 10.9A,D
8. I’m afraid of getting hit by a car 0D 1.4D 0D 25.6A,B,C,E 0D
9. I have no one to go out with 1.0B,C,D,E 4.5A,D,E 10.4A,D 30.8A,B,C 23.6A,B
10. Poor weather 24.1B,C,D,E 68.6A,E 75.6A,E 76.9A,E 43.6A,B,C,D
11. Slippery roads 0B,C,D 84.1A,C,E 97.0A,B,E 87.2A,E 0B,C,D
12. Darkness 3.8B,C,D 31.4A,C,D,E 60.7A,B,D,E 89.7A,B,C,E 3.6B,C,D
13. The environment is not suitable 0.5D,E 0D,E 2.2D 23.1A,B,C 5.5A,B
14. Not interested 1.8D,E 1.4D,E 2.2 D,E 15.4 A,B,C 12.7A,B,C
15. Warnings from health care personnel or relatives 0D,E 0.5D,E 0.7D,E 12.8A,B,C 9.1A,B,C
16 Too old for outdoor physical activity 0.8D,E 0.0D,E 2.2D 12.8A,B,C 7.3A,B
17. Not used to outdoor physical activity 0D,E 0.5D 0.7 7.7A,B 5.5A
NOTE: Superscripts A, B, C, D, E indicate statistically significant differences (p-value <0.05) between barrier profiles.
47
The participants who were profiled under the Minor Barriers –profile were ac-tive outdoors and less than ten percent of them had walking difficulties (Table 6). Those in the Ambient conditions –profile were also active and most of them did not have walking limitations, but they had some concerns regarding poor weather. In the remaining three, profiles the participants were characterized by walking limitations and inactivity. Most of the people in the Insecurity and Poor health –profiles were inactive and had limitations in walking. The number of outdoor physical activity barriers differed statistically significantly between all profiles, the lowest occurring among those in the Minor Barriers –profile and the highest among those in the Insecurity-profile. Compared with the Ambient condi-tions, Poor Health and Insecurity -profiles, the frequency of reported environmen-tal barriers was the smallest among people in the Mobility limitations –profile. Sensitivity analysis showed that the time of the year when the interview was carried out did not influence the results (Wald test for interaction p=0.844).
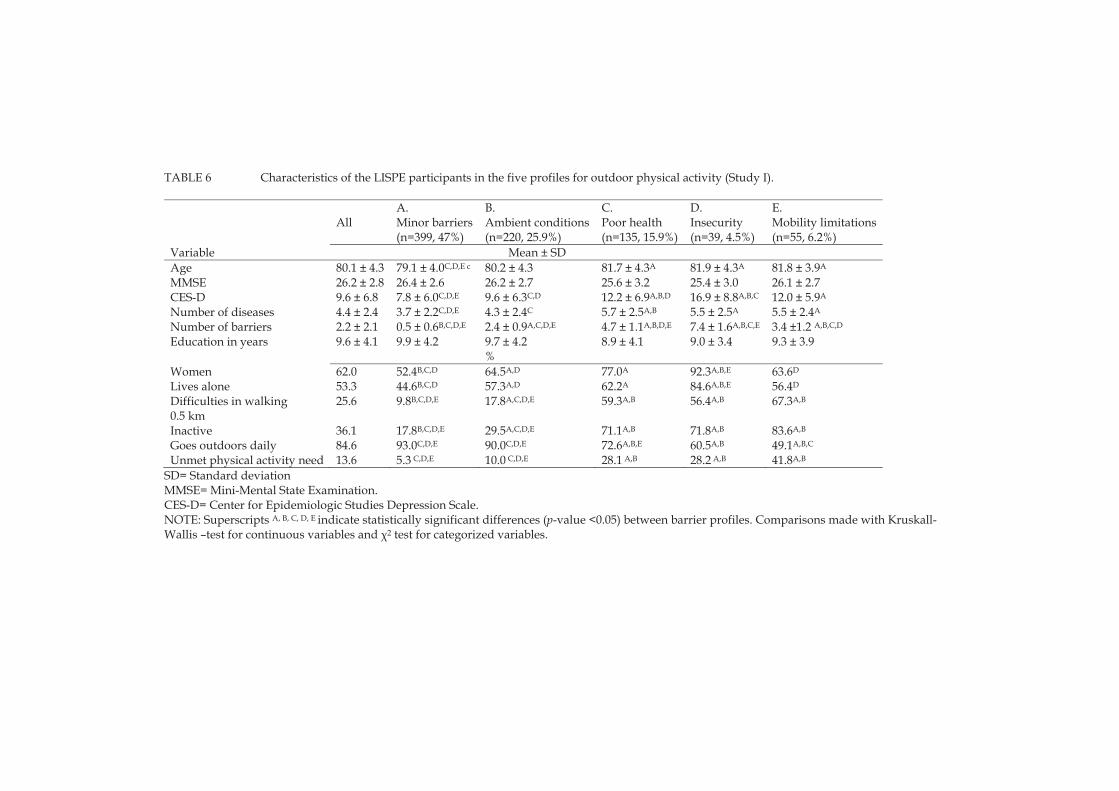
TABLE 6 Characteristics of the LISPE participants in the five profiles for outdoor physical activity (Study I).
A. B. C. D. E.All Minor barriers
(n=399, 47%) Ambient conditions(n=220, 25.9%)
Poor health (n=135, 15.9%)
Insecurity (n=39, 4.5%)
Mobility limitations(n=55, 6.2%)
Variable Mean ± SD
Age 80.1 ± 4.3 79.1 ± 4.0C,D,E c 80.2 ± 4.3 81.7 ± 4.3A 81.9 ± 4.3A 81.8 ± 3.9A
MMSE 26.2 ± 2.8 26.4 ± 2.6 26.2 ± 2.7 25.6 ± 3.2 25.4 ± 3.0 26.1 ± 2.7 CES-D 9.6 ± 6.8 7.8 ± 6.0C,D,E 9.6 ± 6.3C,D 12.2 ± 6.9A,B,D 16.9 ± 8.8A,B,C 12.0 ± 5.9A
Number of diseases 4.4 ± 2.4 3.7 ± 2.2C,D,E 4.3 ± 2.4C 5.7 ± 2.5A,B 5.5 ± 2.5A 5.5 ± 2.4A
Number of barriers 2.2 ± 2.1 0.5 ± 0.6B,C,D,E 2.4 ± 0.9A,C,D,E 4.7 ± 1.1A,B,D,E 7.4 ± 1.6A,B,C,E 3.4 ±1.2 A,B,C,D
Education in years 9.6 ± 4.1 9.9 ± 4.2 9.7 ± 4.2 8.9 ± 4.1 9.0 ± 3.4 9.3 ± 3.9 %
Women 62.0 52.4B,C,D 64.5A,D 77.0A 92.3A,B,E 63.6D
Lives alone 53.3 44.6B,C,D 57.3A,D 62.2A 84.6A,B,E 56.4D
Difficulties in walking 0.5 km
25.6 9.8B,C,D,E 17.8A,C,D,E 59.3A,B 56.4A,B 67.3A,B
Inactive 36.1 17.8B,C,D,E 29.5A,C,D,E 71.1A,B 71.8A,B 83.6A,B
Goes outdoors daily 84.6 93.0C,D,E 90.0C,D,E 72.6A,B,E 60.5A,B 49.1A,B,C
Unmet physical activity need 13.6 5.3 C,D,E 10.0 C,D,E 28.1 A,B 28.2 A,B 41.8A,B
SD= Standard deviation MMSE= Mini-Mental State Examination. CES-D= Center for Epidemiologic Studies Depression Scale. NOTE: Superscripts A, B, C, D, E indicate statistically significant differences (p-value <0.05) between barrier profiles. Comparisons made with Kruskall-Wallis –test for continuous variables and 2 test for categorized variables.
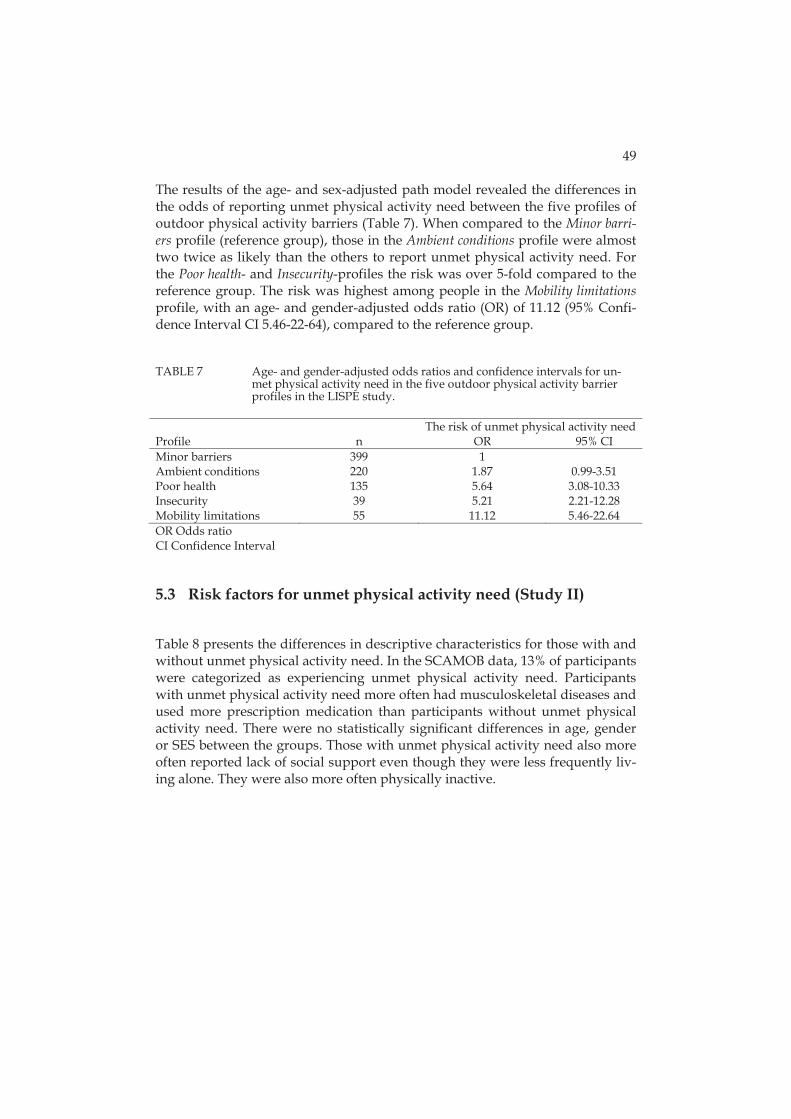
49
The results of the age- and sex-adjusted path model revealed the differences in the odds of reporting unmet physical activity need between the five profiles of outdoor physical activity barriers (Table 7). When compared to the Minor barri-ers profile (reference group), those in the Ambient conditions profile were almost two twice as likely than the others to report unmet physical activity need. For the Poor health- and Insecurity-profiles the risk was over 5-fold compared to the reference group. The risk was highest among people in the Mobility limitations profile, with an age- and gender-adjusted odds ratio (OR) of 11.12 (95% Confi-dence Interval CI 5.46-22-64), compared to the reference group.
TABLE 7 Age- and gender-adjusted odds ratios and confidence intervals for un-met physical activity need in the five outdoor physical activity barrier profiles in the LISPE study.
The risk of unmet physical activity needProfile n OR 95% CI Minor barriers 399 1 Ambient conditions 220 1.87 0.99-3.51 Poor health 135 5.64 3.08-10.33 Insecurity 39 5.21 2.21-12.28 Mobility limitations 55 11.12 5.46-22.64 OR Odds ratio CI Confidence Interval
5.3 Risk factors for unmet physical activity need (Study II)
Table 8 presents the differences in descriptive characteristics for those with and without unmet physical activity need. In the SCAMOB data, 13% of participants were categorized as experiencing unmet physical activity need. Participants with unmet physical activity need more often had musculoskeletal diseases and used more prescription medication than participants without unmet physical activity need. There were no statistically significant differences in age, gender or SES between the groups. Those with unmet physical activity need also more often reported lack of social support even though they were less frequently liv-ing alone. They were also more often physically inactive.

50
TABLE 8 Characteristics of the SCAMOB participants according to reporting un-met physical activity need at baseline.
Unmet physical activity need
Yes (n= 82) No (n=547 ) p-value*
Age, mean (SD) 77.8 (1.9) 77.6 (1.9) 0.333 Female, % 78.0 74.4 0.478 Walking limitations, % 43.2 14.3 <0.001 Low SES, % 51.2 45.3 0.319 Lack of social support, % 26.8 18.3 0.071 Lives alone, % 47.6 59.6 0.039 Physically inactive, % 40.2 23.2 0.001 *Chi-square test and t-test. SD = Standard deviation. The associations of risk factors with unmet physical activity need, adjusted for age and gender, are presented in Table 9. Having walking limitations increased the risk for unmet physical activity need (OR 4.52, 95% CI 2.73-7.48). The asso-ciations of low SES (OR 1.26, 95% CI 0.79-2.00) or lack of social support (OR 1.58, 95% CI 0.92-2.71) and unmet physical activity need did not reach statistical sig-nificance.
TABLE 9 Associations of risk factors with unmet physical activity need.
Risk factor OR ( 95 % CI) Walking limitations 4.52 (2.73-7.48) Low socioeconomic status 1.26 (0.79-2.00) Lack of social support 1.58 (0.92-2.71) OR Odds ratio CI Confidence Interval The associations of co-existing risk factors, including walking limitations, low SES and lack of social support with unmet physical activity need is presented in Table 10. The model was adjusted for age and gender. Compared to those with no walking limitations, having walking limitations but no other risk factors in-creased the risk of unmet physical activity need (OR 3.86, 95% CI 1.86-8.03), having walking limitations and either low SES or lack of social support in-creased the risk (OR 4.11, 95% CI 2.09-8.09) and having walking limitations, low SES and lack of social support further increased the risk of unmet physical ac-tivity need (OR 7.10, 95% CI 2.71-18.57).
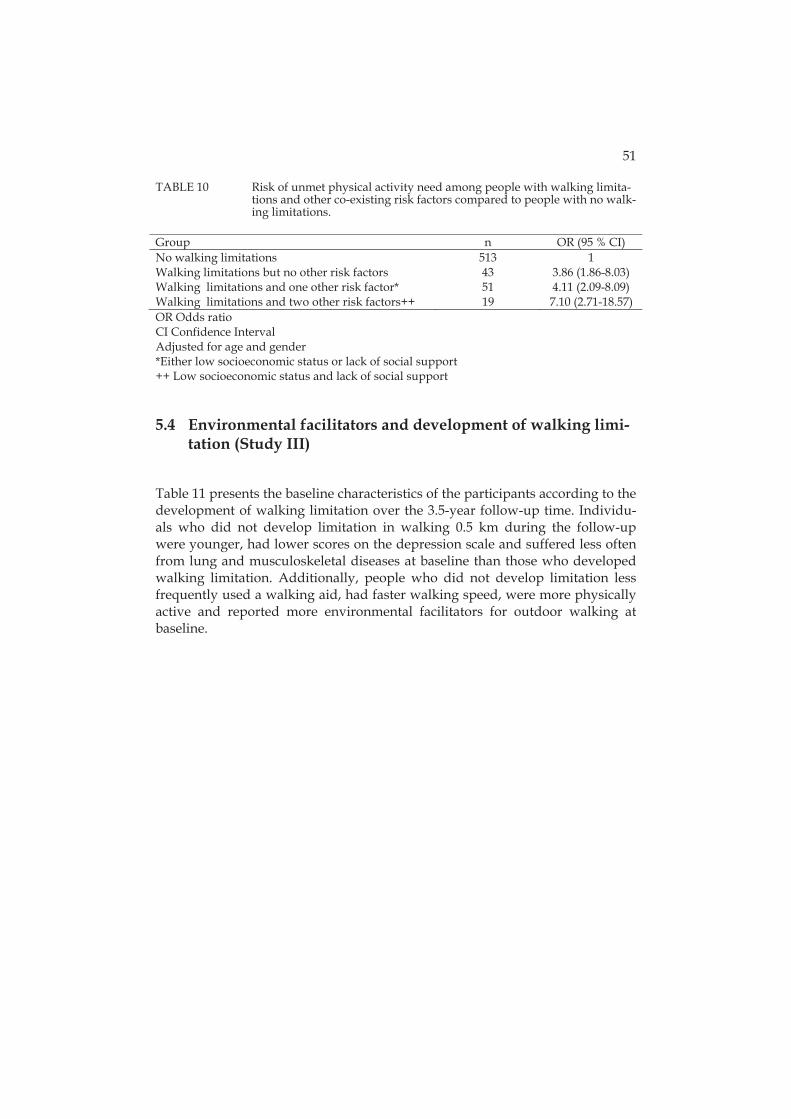
51
TABLE 10 Risk of unmet physical activity need among people with walking limita-tions and other co-existing risk factors compared to people with no walk-ing limitations.
OR Odds ratio CI Confidence Interval Adjusted for age and gender *Either low socioeconomic status or lack of social support ++ Low socioeconomic status and lack of social support
5.4 Environmental facilitators and development of walking limi-tation (Study III)
Table 11 presents the baseline characteristics of the participants according to the development of walking limitation over the 3.5-year follow-up time. Individu-als who did not develop limitation in walking 0.5 km during the follow-up were younger, had lower scores on the depression scale and suffered less often from lung and musculoskeletal diseases at baseline than those who developed walking limitation. Additionally, people who did not develop limitation less frequently used a walking aid, had faster walking speed, were more physically active and reported more environmental facilitators for outdoor walking at baseline.
Group n OR (95 % CI) No walking limitations 513 1 Walking limitations but no other risk factors 43 3.86 (1.86-8.03) Walking limitations and one other risk factor* 51 4.11 (2.09-8.09) Walking limitations and two other risk factors++ 19 7.10 (2.71-18.57)

52
TABLE 11 Baseline characteristics of SCAMOB study participants according to whether or not they developed walking limitation over the 3.5 year fol-low-up.
Variable No limitation (n=143) Limitation (n=118) p-value* Mean SD Mean SD Age (years) 77.4 1.8 78.0 2.0 0.008 MMSE score 27.3 2.2 26.9 2.3 0.214 CES-D score 7.9 5.7 11.1 7.8 0.001 Walking speed (m/s) 1.5 0.3 1.3 0.3 <0.001 Education in years 9.6 4.6 9.0 4.4 0.223 Number of facilitators 3.6 1.0 3.3 1.1 0.035 % % Level of physical activity (Grimby)
Mainly resting 0 0 Most activities performed
sitting down 0.7 0.8 0.891
Light physical activity 1-2 h a week
14.7 25.4 0.029
Moderate physical activity 3 h a week
46.9 55.1 0.186
Moderate physical activity 4 h a week
37.8 18.6 0.001
Women 74.8 76.3 0.787 Lives alone 51.7 53.4 0.792 Lung diseases 9.1 17.8 0.038 Musculoskeletal diseases 37.8 54.2 0.008 Cardiovascular diseases 66.4 73.7 0.202 Uses a walking aid 14.0 34.7 <0.001 *t-test (walking speed), Mann-Whitney U-test (age, MMSE, CES-D, education in years and number of facilitators) and 2 test (level of physical activity, gender, living status, presence of lung, cardiovascular and musculoskeletal diseases and use of a walking aid) SD = Standard Deviation The most common perceived environmental facilitator for outdoor walking, reported by 93.5% (n=244) of the participants, was having a park or other out-door area within walking distance from home. Next in order of frequency was the presence of outdoor recreational facilities, such as walking routes or ski tracks within walking distance from home, which was reported by 92% (n=240) of the participants. Attractive features in the nearby environment that invite engagement in outdoor activities was reported by 64.8% (n=169), perceiving the surrounding environment or facilities nearby as suitable for physical activity was reported by 60.5% (n=158), and having features in one’s home which make it easy to access the outdoors was reported by 37,5% (n=98) of the participants. The results of the logistic regression analyses, in which each facilitator was ana-lyzed separately, show that facilitators were slightly less often reported by peo-ple who subsequently developed walking limitation; however, none of the dif-ferences were statistically significant, see Table 12.
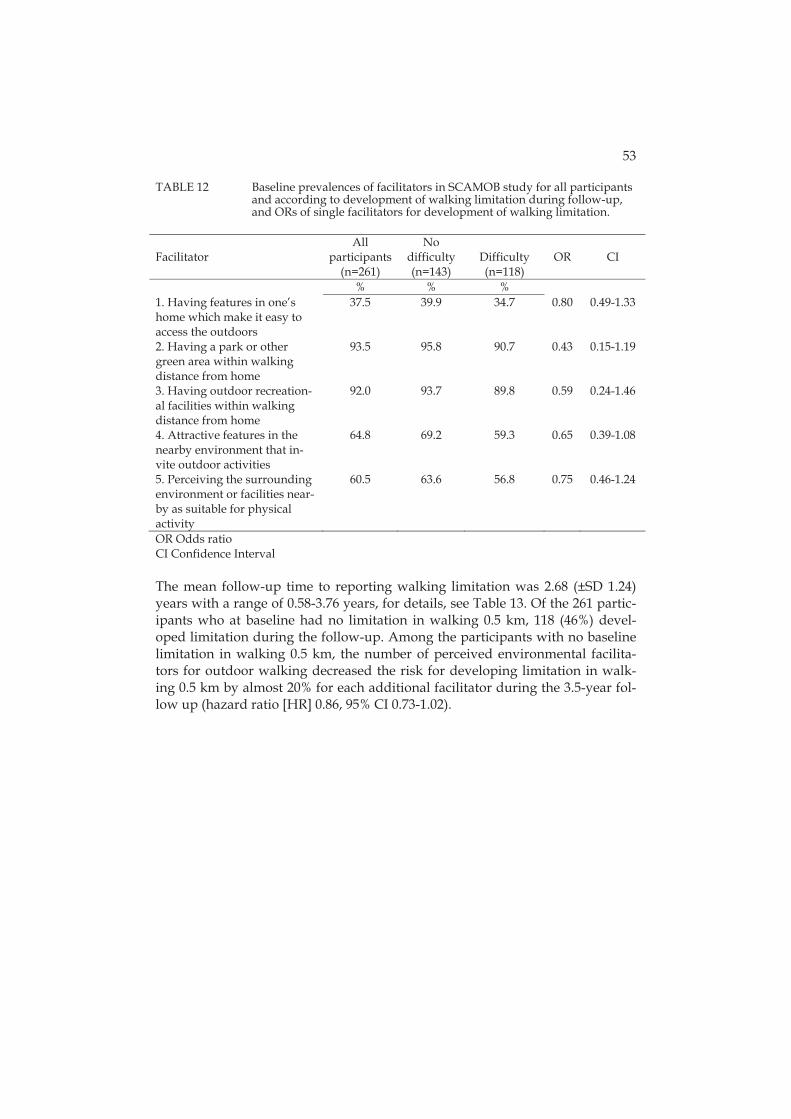
53
TABLE 12 Baseline prevalences of facilitators in SCAMOB study for all participants and according to development of walking limitation during follow-up, and ORs of single facilitators for development of walking limitation.
Facilitator
All participants
(n=261)
No difficulty (n=143)
Difficulty (n=118)
OR
CI
% % % 1. Having features in one’s home which make it easy to access the outdoors
37.5 39.9 34.7 0.80 0.49-1.33
2. Having a park or other green area within walking distance from home
93.5 95.8 90.7 0.43 0.15-1.19
3. Having outdoor recreation-al facilities within walking distance from home
92.0 93.7 89.8 0.59 0.24-1.46
4. Attractive features in the nearby environment that in-vite outdoor activities
64.8 69.2 59.3 0.65 0.39-1.08
5. Perceiving the surrounding environment or facilities near-by as suitable for physical activity
60.5 63.6 56.8 0.75 0.46-1.24
OR Odds ratio CI Confidence Interval The mean follow-up time to reporting walking limitation was 2.68 (±SD 1.24) years with a range of 0.58-3.76 years, for details, see Table 13. Of the 261 partic-ipants who at baseline had no limitation in walking 0.5 km, 118 (46%) devel-oped limitation during the follow-up. Among the participants with no baseline limitation in walking 0.5 km, the number of perceived environmental facilita-tors for outdoor walking decreased the risk for developing limitation in walk-ing 0.5 km by almost 20% for each additional facilitator during the 3.5-year fol-low up (hazard ratio [HR] 0.86, 95% CI 0.73-1.02).

54
TABLE 13 Development of limitation in walking 0.5 km in older people without walking limitation at baseline according to the number of facilitators for outdoor walking at baseline. SCAMOB study.
Number of facilitators n Rates of incident walking disability /100 person years
Model 1
Model 2
HR CI HR CI
0-5* 261 0.82 0.70-0.97 0.86 0.73-1.02 Categorized 0-2 41 23.6 1 1 3 78 13.5 0.48 0.29-0.81 0.56 0.33-0.96 4 103 14.1 0.61 0.38-0.97 0.68 0.42-1.11 5 39 12.8 0.34 0.18-0.68 0.41 0.21-0.84 HR Hazard Ratio CI Confidence Interval Model 1 adjusted for age and sex Model 2 adjusted for age, sex and level of physical activity (Grimby) * Summary score, including all five facilitators (having features in one’s home which make it easy to access the outdoors, having a park or other green area within a walking distance from home, having outdoor recreational facilities within a walking distance from home, having attractive features in the nearby environment, and perceiving the surrounding envi-ronment or nearby facilities as suitable for physical activity.) When the environmental facilitators were grouped as 0-2, 3, 4 or 5 facilitators, relationship between the number of facilitators and reduction in walking limita-tion that emerged was not a strictly linear one: compared to the participants who had 0-2 facilitators, having 3 facilitators decreased the risk of walking limi-tation to HR 0.56 (95% CI 0.33-0.96), having 4 facilitators to HR 0.68 (95% CI 0.42-1.11) and having 5 facilitators to HR 0.41 (95% CI 0.21-0.84) during the fol-low-up.
5.5 Life-space mobility (Study IV)
The mean life-space composite score of all the participants was 63.9 (± 20.6), with a range of 8-120. The unadjusted mean scores for the three SES groups were 60.6 (± 20.4) for low, 64.5 (± 20.6) for middle and 70.1 (± 19.2) for high SES; see Table 14. On average men had higher LSA scores than women (71.1 vs. 59.5, p< 0.001). People in the low SES group were older, had higher BMI, poorer cog-nitive capacity and poorer physical functioning than those in the high SES group but there were no significant differences between the SES groups in the number of chronic conditions, depressive symptoms or living status. When comparing the background variables between participants with restricted vs. unrestricted life-space, it showed that there were differences in each back-ground variable. Because BMI, MMSE score and SPPB score showed to be asso-ciated with both SES and life-space mobility, these three variables were chosen to be included as covariates in the general linear model.
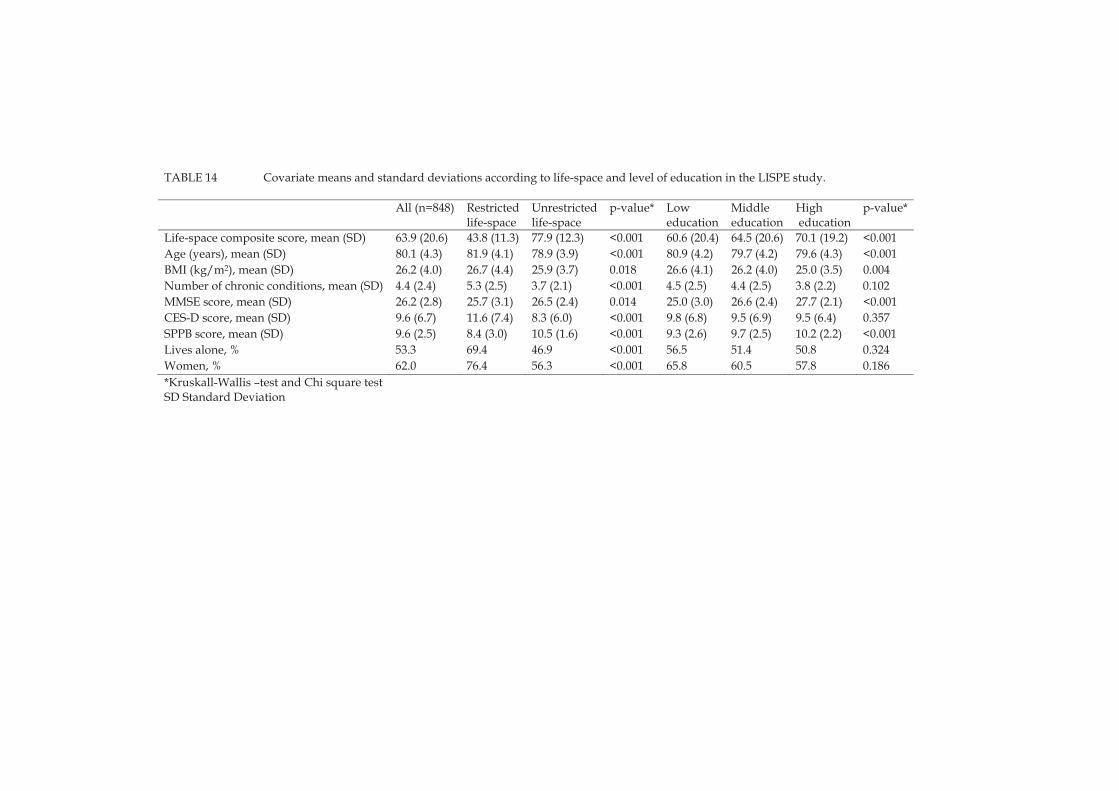
TABLE 14 Covariate means and standard deviations according to life-space and level of education in the LISPE study.
All (n=848) Restrictedlife-space
Unrestrictedlife-space
p-value* Low education
Middle education
High education
p-value*
Life-space composite score, mean (SD) 63.9 (20.6) 43.8 (11.3) 77.9 (12.3) <0.001 60.6 (20.4) 64.5 (20.6) 70.1 (19.2) <0.001 Age (years), mean (SD) 80.1 (4.3) 81.9 (4.1) 78.9 (3.9) <0.001 80.9 (4.2) 79.7 (4.2) 79.6 (4.3) <0.001 BMI (kg/m2), mean (SD) 26.2 (4.0) 26.7 (4.4) 25.9 (3.7) 0.018 26.6 (4.1) 26.2 (4.0) 25.0 (3.5) 0.004 Number of chronic conditions, mean (SD) 4.4 (2.4) 5.3 (2.5) 3.7 (2.1) <0.001 4.5 (2.5) 4.4 (2.5) 3.8 (2.2) 0.102 MMSE score, mean (SD) 26.2 (2.8) 25.7 (3.1) 26.5 (2.4) 0.014 25.0 (3.0) 26.6 (2.4) 27.7 (2.1) <0.001 CES-D score, mean (SD) 9.6 (6.7) 11.6 (7.4) 8.3 (6.0) <0.001 9.8 (6.8) 9.5 (6.9) 9.5 (6.4) 0.357 SPPB score, mean (SD) 9.6 (2.5) 8.4 (3.0) 10.5 (1.6) <0.001 9.3 (2.6) 9.7 (2.5) 10.2 (2.2) <0.001 Lives alone, % 53.3 69.4 46.9 <0.001 56.5 51.4 50.8 0.324 Women, % 62.0 76.4 56.3 <0.001 65.8 60.5 57.8 0.186 *Kruskall-Wallis –test and Chi square testSD Standard Deviation

56
In the general linear model, the differences in life-space mobility scores were analyzed by assigning the high SES group as the reference group and compar-ing the scores in the high SES group to those in the middle and low SES groups. The marginal means from the base model showed that participants who had middle or low SES had lower life-space mobility scores compared to those with high SES: age- and gender-adjusted marginal means 68.79 (SE 1.62) for high SES, 63.57 (SE 0.92) for middle SES and 62.34 (SE 1.02) for low SES, see Table 15. The differences in scores for life-space mobility between the SES groups were the largest in the base model. In each model, the scores were the highest in the high SES group, and the differences between middle SES and low SES groups were rather small. Adding the underlying factors separately into the base model de-creased the differences in the life-space mobility scores between the high SES group and the middle and low SES groups, however the differences in the scores remained statistically significant. When all factors were included in the model simultaneously, the differences between the SES groups were no longer significant.
TABLE 15 Marginal means and standard errors and differences between the SES groups in the life-space mobility scores in the LISPE study.
Marginal mean (SE)
p-value Difference in the scores between
SES groups Base model a High SES 68.79 (1.62) ref. Middle SES 63.57 (0.92) 0.005 -5.22 Low SES 62.34 (1.02) 0.001 -6.45 Base model and BMI High SES 68.0 (1.6) ref. Middle SES 64.07 (0.91) 0.033 -3.93 Low SES 63.06 (1.02) 0.010 -4.93 Base model and MMSE High SES 67.52 (1.65) ref. Middle SES 63.20 (0.92) 0.021 -4.31 Low SES 63.29 (1.05) 0.036 -4.23 Base model and SPPB High SES 67.27 (1.42) ref. Middle SES 64.07 (0.81) 0.050 -3.20 Low SES 63.24 (0.90) 0.017 -4.03 Base model, BMI, MMSE and SPPB
High SES 66.34 (1.47) ref. Middle SES 64.20 (0.82) 0.198 -2.13 Low SES 64.06 (0.94) 0.206 -2.28 SE Standard Error BMI Body Mass Index MMSE Mini-Mental State Examination SPPB Short Physical Performance Battery a Adjusted for age and gender
6 DISCUSSION
The aim of this study was to examine the individual and environmental risks and resources which affect older persons’ opportunities to be physically active. The differences between individuals in opportunities to participate in physical activity have been defined as disparities in physical activity. This definition adds novel content to the term disparity and offers a new way of studying dis-parities across various populations.
Ultimately, the aim of promoting physical activity and providing oppor-tunities for engagement in physical activity is to ensure that as many older peo-ple as possible can live independently in their own homes for as long as possi-ble, have a satisfying social life and ability to participate in community activities. This is in line with the definition of aging well proposed by Wahl et al (2012): “maintaining the highest autonomy, well-being, and preservation of one’s self and identity as possible, even in the face of severe competence loss.” It is also the objective of the Sports Act in Finland (1998), which aims at promoting equality for all in opportunities for physical activity and exercise, including groups with special needs. Living at home for as long as possible is often con-sidered the ideal situation for older people, but in many cases it means that the person may be unable to participate in social and recreational outdoor activities independently, and may become isolated and enter the vicious circle of loneli-ness, depressive symptoms and further deteriorations in functioning (Hirvensalo et al. 2007). Yet today, despite policy statements, home-confined older persons are often poorly served in that they have practically no opportu-nities to be physically active or access the outdoors. They may continue to have a strong desire to be physically active, not necessarily to exercise, but to go out-doors for a walk around the block, to an art exhibition or to take a lottery ticket to a kiosk (Rantanen et al. 2014). This is just one manifestation of disparity in the opportunity for physical activity: some people can choose where to go and when, while others are completely dependent on the assistance of other people, even in the most basic everyday activities.
Older people’s opportunities to be physically active clearly depend on the individual and the environment. In the optimal state, following the idea of the
58
ecological model of aging, the demands of the environment and the capacities of the person will be in balance. The theory of fundamental causes can also be applied in this way: when the resources which a person possesses balance the risks, then the person has optimal opportunities for wellbeing. When the envi-ronmental demands exceed the individual’s capabilities, or the risks are too great in relation to the resources available to the individual, P-E fit is in imbal-ance and wellbeing suffers.
6.1 Unmet physical activity need
Unmet physical activity need was first defined by Rantakokko et al. (2010a), and since then the concept has been further studied in the two samples present-ed in this study. Unmet physical activity need describes the difference between the desired and the true state of physical activity, and is a manifestation of dis-parities in physical activity because it reflects the lack of opportunity for physi-cal activity. The results of this study showed that outdoor physical activity bar-riers and the accumulation of risk factors, including walking limitations, low SES and lack of social support, significantly increased the risk for unmet physi-cal activity need.
Five different profiles of outdoor activity barriers were identified, that re-flected the functional status of older community-dwelling people. The risk of unmet physical activity need – an indicator of imbalance in person-environment fit (Rantakokko et al. 2010a) - increased along with the number of individual problems in health and functioning and in environmental physical activity bar-riers. However, the imbalance in person-environment fit was largest among those with the most severe walking limitations, who rarely reported environ-mental barriers. It is plausible that their individual capabilities would not have met the requirements for physical capacity demanded by their physical envi-ronment. They mostly stayed indoors and were probably largely unaware of the barriers present in the outdoor environment. This suggests that individual difficulties alone can be a sign of problems in person-environment fit (Ben-zinger et al. 2014).
The environment influences people’s actions by setting up barriers or of-fering facilitators. When talking about environmental barriers, we are referring to having control over one’s environment and feelings of safety (Stathi et al. 2012). The identification of barriers to physical activity in person’s home or neighborhood reveals much about the person’s functional capacity and the ex-tent to which he or she has control over the physical features of the immediate environment. Environmental barriers signify lack of control and the inability to function with full potential, and are thus a risk for independent living. Barriers correlate strongly with functioning: people with intact functioning and no walk-ing limitations do not perceive barriers in the environment in a similar way as do those with disabilities. An interesting example of this phenomenon was shown in a study of persons before and after surgery that radically changed
59
their functional status: people who had not reported any barriers in their homes prior to the operation, noticed a number of them after discharge (Greysen et al. 2014).
Thus, it can be concluded that the barriers reported by the older people in this study reflected their functional status. It may be that older people who re-ported only poor weather and slippery roads as barriers were starting to expe-rience minor difficulties in outdoor walking that became more evident in poor weather. Later on, such preclinical difficulties can develop into manifest walk-ing limitations and reduction in physical activity (Weiss et al. 2012), potentially increasing the number of perceived barriers as well.
Person-environment fit demonstrates the balance between the capacities of the individual and the demands of the environment (Lawton & Nahemow 1973). Longitudinal studies have shown that increases in person-environment fit prob-lems are mainly due to functional decline (Iwarsson 2005, Werngren-Elgstrom, Carlsson & Iwarsson 2008). Poor health, which can be a sign of decline in func-tion, was the most frequently reported barrier in this study. Also in previous studies, individual problems such as chronic conditions and pain have been identified as the most frequently reported barriers to physical activity among older people (Cohen-Mansfield, Marx & Guralnik 2003, Moschny et al. 2011, Newson & Kemps 2007). People with chronic conditions have also reported more barriers than healthy people (Schutzer & Graves 2004). Barriers in the en-vironment do not present similar problems to all older people: depending on their functional capacity, people may perceive different barriers or may per-ceive similar barriers differently. For example slipperiness can mean using walking poles for one person and not going out at all for someone else. Barriers are not necessarily an indicator of inactivity: it has been shown that people who report barriers to physical activity can nevertheless be sufficiently active (Lim & Taylor 2005). For example, for some people poor health may be a motivator for physical activity and a way to aspire after better health and wellbeing (Belza et al. 2004).
Although poor health was a frequently reported barrier in this study, the various combinations of barriers derived with the data-driven approach showed that in many older people, outdoor physical activity barriers comprise multiple factors in addition to poor health. Instead of investigating only the fre-quency of single barriers, the latent grouping of barriers demonstrated which barriers are likely to be linked together and what kind of functional status they indicate. The results demonstrated that it was not the highest number of barri-ers that indicated the most severe decline in functioning, but rather that func-tional limitations reflect what is perceived as a barrier, and thus that barriers indicate a person’s functional status. Physical activity is more dependent on functional limitations than environmental barriers (Benzinger et al. 2014). Some studies, however, have found an association between the number of reported barriers and limitation in daily activities (Keysor et al. 2010).
Community-dwelling older people form a heterogeneous group in their perceptions of outdoor physical activity barriers. Accordingly, strategies to im-
60
prove the opportunities for outdoor physical activity among this population need to be tailored to different needs. Although the misfit between personal capabilities and environmental demands becomes concrete in the actions and functioning of the individual and is mainly affected by decline in functioning, it has been argued that disablement is not a feature of the person (Verbrugge & Jette 1994). Improving the opportunities for physical activity among older peo-ple can be achieved by making changes in the environment. Good sidewalks and proper street maintenance benefit most people, and for older people who use walking aids these may serve as facilitators for physical activity (Rosenberg et al. 2012). Insecurity due to fear of falling can be reduced by participation in supervised exercise (Freiberger et al. 2013). Changes do not necessarily have to happen in the built environment, but they can also be achieved in the social en-vironment, for example by offering assistance in going out and walking out-doors with a friend, relative or a lay volunteer (Rantanen et al. 2014).
Based on the results of this study, about 14 percent of 75- to 90-year-old people report unmet physical activity need. Inspection of the individual risk factors showed that older people with walking limitations had an almost four times higher risk for unmet physical activity need than those with no walking limitations. In older people with walking limitations and one additional risk factor, either low SES or lack of social support, the risk was over four-fold. The risk was highest among people who reported walking limitations, low SES and lack of social support simultaneously. These results expanded the earlier find-ings showing that the clustering of other risk factors in addition to walking lim-itations greatly increased the risk for unmet physical activity need. It seems that the accumulation of risk factors created disparity particularly among those old-er people who were the most disadvantaged.
Older people who reported unmet physical activity need also reported lack of social support more often than people without unmet physical activity need. It is possible that lack of social support resulted in unmet physical activity need as people who received less encouragement to engage in physical activity became less physically active. However, it is plausible that a situation leading to unmet physical activity need may also result in reduced availability of social support. People who have difficulties exiting their homes unavoidably experi-ence a reduction in their social contacts as well. The importance of social sup-port for physical activity among older people has been demonstrated earlier (Carlson et al. 2012). It has also been shown that lack of company is more likely to constitute a barrier to physical activity in people with more severe walking limitations compared to people with no walking limitations (Rasinaho et al. 2007).
In line with the theory of fundamental causes (Link & Phelan 1995), the risk factors were associated with lack of opportunities for physical activity. However, it was not possible in this study to determine the causal order of in-dividual risk factors such as SES, walking limitations and lack of social support. The measure of SES was a combination of education and occupation and thus it can be seen as reflecting status achieved earlier in life. Walking limitation and
61
lack of a confidant were reported at the time of the SCAMOB interview, but it was not known how long they had been present. Therefore, it can only be dis-cussed whether, in this case SES, was in fact the fundamental underlying expla-nation for walking limitations, lack of social support and unmet physical activi-ty need.
6.2 Walking limitation and environmental facilitators
The study investigated the effect of environmental facilitators on the develop-ment of walking limitation. Previous studies have shown that walking limita-tion is associated with physical inactivity, disability (Hardy et al. 2011) and unmet physical activity need (Rantakokko et al. 2010a). In this study, the risk for developing of walking limitation was lower in people who reported three environmental facilitators for physical activity and lowest among people report-ing all five facilitators. It is possible that three facilitators are sufficient needed for preventing walking limitation. It could also be that it is not the number of perceived facilitators that is crucial but rather the personal habits that people have regarding their engagement in outdoor activities.
Adjusting the analyses for physical activity attenuated the risk for devel-oping walking limitation, suggesting that the older people who reported more facilitators in their environment were more often physically active and thus less likely to develop walking limitations. Regularly venturing outdoors helps pre-serve a physically active lifestyle, irrespective of functional status (Fox et al. 2011), and physical activity has been associated with lower risk for walking lim-itation among older women (Latham 2014). Facilitators in the environment and lack of individual barriers are important prerequisites for becoming and staying active (Stathi et al. 2012). The results showed that a supportive environment can encourage and motivate older people to take part in outdoor activities, thus preventing the development of walking difficulties. The presence of recreation-al facilities and easy access to them can be important for preserving physical activity (Van Cauwenberg et al. 2011). Parks, gardens and other green areas mo-tivate older people to go outdoors (Rosenberg et al. 2012, Stathi et al. 2012). It seemed, therefore, that engagement in physical activity was not the only expla-nation for maintaining walking ability, but that environmental facilitators also played a role.
One possible explanation for the present results is that physically active older people may perceive parks and other outdoor areas in their neighbor-hoods as facilitators more often than those who are unable to use those facilities, and therefore reporting facilitating factors in the environment may simply re-flect the outdoor activity of these more active individuals (Keysor et al. 2010). However, not reporting any facilitators or reporting only few of them can also simply mean that the informant does not find them personally relevant or that they have not been encountered (Keysor et al. 2010). People with intact walking and functioning and people with limited walking and other difficulties may not

62
perceive the same items as facilitators. Facilitators, such as easy access to out-doors may be crucial for an older person with disabilities who needs to go out-doors in order to go grocery shopping, whereas a person who goes walking for fitness might not even pay attention to the features of the entrance to the home. Moreover, many people are physically active in environments that are not op-timal for outdoor physical activity per se (Van Cauwenberg et al. 2013).
The interest and willingness to use the walking paths and exercise facili-ties that are available derives from the individual and hence the fact that facili-ties are located nearby may function as support for an already existing motiva-tion to be physically active. A recent study on leisure-time physical activity among 20- to 74-year-old Finns found that the main determinant of leisure time physical activity is individual interest and motivation, with the municipality playing a mainly supportive role, such as providing facilities and maintaining parks and walking paths (Nummela et al. 2014). The authors note that that physical activity is mainly determined on an individual level and the environ-ment mostly supports those who would anyway be active (Nummela et al. 2014). Physical activity is also affected by other life events besides those that directly affect walking: changes in social relations and retirement, for example, can influence interest, opportunities and time for physical activity (Kenter et al. 2014).
Outdoor areas and recreational facilities in the close vicinity were the most frequently reported environmental facilitators in this study, indicating that short distances to outdoor recreational facilities are crucial in maintaining walk-ing ability. The present findings are in line with previous studies showing that close distances to outdoor recreational areas and services promote physical ac-tivity (Stathi et al. 2012) and transportation walking (Van Cauwenberg et al. 2013) among older people. However, having a recreational area in the close vi-cinity may not in itself facilitate a person’s physical activity if that person is not able to access it independently (Shumway-Cook et al. 2005). Having features in one’s home which make it easy to access the outdoors, such as automatic doors or no doorsteps was the least frequently reported facilitator, which may be re-lated to the fact that the people who were included in the SCAMOB study did not have baseline difficulty in walking. This was understandable as problems in accessing the outdoors may only arise as walking ability declines. However, easy access to outdoors is important for people with walking limitations, as it provides an opportunity to run errands, enjoy fresh air and go for a walk.
6.3 Life-space mobility
In addition to unmet physical activity need, restricted life-space mobility can be seen as a manifestation of disparity in physical activity among older people. In some studies, life-space mobility has even been used as a proxy for physical activity (Ikezoe et al. 2011). However, life-space mobility describes mobility on a larger scale than physical activity per se, as it includes other forms of trans-
63
portation than just walking or riding a bicycle (Baker, Bodner & Allman 2003). For many older people walking is the main way of getting around and it is of-ten a prerequisite for using other forms of transportation as well. Restricted life-space mobility can thus be an indicator of physical activity disparity because it is a sign of not being able to go where, when and how one wants. People whose life-space is unrestricted have more freedom in mobility and they are more in-dependent in their transportation. Life-space mobility, especially when restrict-ed to areas close to one’s home, can be highly dependent on the possibilities to arrange assistance for getting to places where one wants to go. In such situa-tions, the abilities of the person and the challenges of the environment are not in balance. Being dependent on assistance means that the older person does not have sufficient resources but needs someone to help in activities which are per-ceived as challenging. This study showed socioeconomic disparities in life-space mobility existed among community-dwelling older people. The SES dif-ferences observed in life-space mobility were largely explained by higher BMI, poorer cognitive capacity and poorer physical performance among people in the low SES group.
While knowledge is lacking on the factors mediating the association be-tween SES and life space mobility, some earlier studies have addressed the as-sociations of SES, mobility in general and the underlying factors that we have considered here. Obesity has been shown to explain the association between SES and mobility, especially in women (Sainio et al. 2007). Lower SPPB scores have been associated with lower SES (Coppin et al. 2006), and good balance and walking speed with higher SES (Welmer et al. 2013). In addition, an association between low SPPB scores and lower life-space mobility has been established (Peel et al. 2005, Portegijs et al. 2014b). A relationship between SES and cogni-tive functioning has also been confirmed in that higher education protected from mild cognitive impairment and Alzheimer’s disease (Sattler et al. 2012) whereas low SES was associated with increased risk for cognitive impairment and Alzheimer’s disease (Atti et al. 2010, Karp et al. 2004). The association be-tween cognitive capacity and life-space mobility has also been explored: a larg-er life-space can include more complex environmental structures which can help preserve cognitive capacity (Crowe et al. 2008) whereas impaired cognition can result in restricted life-space mobility (James et al. 2011).
The study confirmed that low SES and restricted life-space mobility often coexisted together with overweight, reduced cognition, and poorer lower ex-tremity functioning. However, it was not possible in this study to determine their temporal order. However, it is reasonable to expect that these events form a vicious circle: when life-space starts to shrink, less mobility outside the home leads to poorer functioning and cognition which in turn further decrease life-space mobility. The home environment is known to be important for older peo-ple’s psychological well-being and independent functioning, but if home be-comes the only environment in which an older person moves, the empowering effect of home can diminish (Gitlin 2003). Also, although it is not possible to draw conclusions about the causality between SES and life-space mobility, it is

64
intuitively more likely that education, which is achieved early in life, modifies the functioning of an individual, rather than life-space mobility affecting educa-tion (Alwin & Wray 2005). It can be hypothesized that underlying the demon-strated association between SES and life-space mobility is a causal chain, which can be summarized as follows: during their life course people with low SES have been exposed to risk factors which manifest as high BMI, cognitive diffi-culties and problems in lower-limb functioning, subsequently leading to lower life-space mobility in old age. This would be in line with the theory of funda-mental causes (Link & Phelan 1995). Higher BMI and poorer cognition and physical functioning can be signs among people with low SES of the accumula-tion of lack of resources during the life-course, which manifest in old age as lower life-space mobility. In turn, among people with higher SES, possession of the relevant resources, which can be either material such as money or equip-ment, or immaterial such as knowledge or power, may enable them to avoid risk factors and adverse health outcomes during the life-course. High life-space mobility in old age can indicate an active lifestyle that has been supported by a good combination of individual and environmental resources (Sawyer & All-man 2010).
In the potential causal chain, the accumulation of risk factors during the life course may lead to restricted life-space mobility, which further impairs the functioning of people with low SES. People with restricted life-space only sel-dom venture further than into their immediate neighborhood (Sawyer & All-man 2010), which in turn can increase the risk of becoming homebound (Cohen-Mansfield, Shmotkin & Hazan 2012) and socially isolated (Iliffe et al. 2007). As-suming that people with high SES are also more likely to possess resources which help them to maintain mobility on the more distant levels of life-space (Link & Phelan 1995, Willson, Shuey & Elder Jr. 2007), larger life-space can in turn provide people in this group with better opportunities to look after their health and obtain health care services.
There might be some other explanations for the association between SES and life-space mobility that were not addressed in this study. It may be that the participants with low SES were living in more disadvantaged neighborhoods than those with high SES, which may be reflected in the association between individual SES and life-space mobility. Neighborhood deprivation is known to be associated with difficulties in walking and climbing stairs (Lang et al. 2008), quality of life (Breeze et al. 2005), chronic conditions (Chaikiat et al. 2012) and reduced physical activity (Amuzu et al. 2009, Hillsdon et al. 2008). A safe neighborhood has been associated with higher levels of leisure-time physical activity than an unsafe neighborhood (Tucker-Seeley et al. 2009). On the other hand, there is also evidence to the contrary: in a British study neighborhood deprivation was not associated with lower physical activity (Fox et al. 2011).

65
6.4 Methodological considerations
Both the participants in the SCAMOB study and those in the LISPE study were rather well-functioning, and thus the analyses are based on information report-ed by independently living older people.
Use of education as an indicator of SES is supported by reasoning from health disparity research, according to which the focus, when investigating health inequalities, should be on the effect of the risk factors encountered early in life, not on statuses achieved later in life (Alwin & Wray 2005). Here, a com-posite measure of SES was chosen to capture as much socioeconomic variation as possible with a single measure. Using education and occupation, or only ed-ucation, as an indicator of SES is not unproblematic. Although education is in-fluenced by the SES of the childhood family, it may in fact mediate the effects of the family SES (Alwin & Wray 2005). When investigating health and wellbeing in old age, exposures to risks and the resources available in childhood should also be taken into account.
This study was conducted in Finland, a country with a comprehensive public health care system, and welfare and social benefits, and hence the socio-economic inequalities in health reported here may not be comparable with those in some other countries. It should be acknowledged, however, that some inequalities in health between socioeconomic groups in Finland have not dimin-ished during recent years (Talala et al. 2014).
As the research was conducted in Finland, it is hardly surprising that am-bient conditions were the most frequently reported barriers to outdoor physical activity in the LISPE study. In a Nordic country, poor weather can include many kinds of weather conditions across the year. In previous studies, weather conditions such as heavy rain, hot temperatures, very cold temperatures or icy conditions have been reported as barriers by older people (Tu et al. 2004). It has also been shown that the length of the day, together with temperature can in-fluence physical activity (Sumukadas et al. 2009, Togo et al. 2005); this combina-tion is likely also to apply in Finland, where days are short in winter and dark-ness was reported to be a barrier by many of the present participants. However, we found no correlation between the time of the year when the interview was conducted and unmet physical activity need. The re-test reproducibility of the life-space mobility score has been shown to be fair in Finland, although scores can change across the seasons (Portegijs et al. 2014a).
The environmental facilitators for outdoor walking were not measured on a validated scale, but were gathered from the available data. For the summary score of environmental facilitators, information about the outdoor environment and recreational facilities was used, as also was information on perceived access to outdoors. Therefore, the list of facilitators was different from those used in validated scales such as the NEWS (Saelens et al. 2003). Here, use of a validated scale for measuring the perceived environmental facilitators for outdoor walk-
66
ing could have yielded stronger results (Owen et al. 2004). It should also be not-ed that the measurement of unmet physical activity need has not been validated.
In this study, the term environment refers to the perceived physical envi-ronment in which people live and spend most of their time, and is thus a sub-jective impression of the environment. Self-perceived measures of the environ-ment have their strengths in capturing the environment in relation to the target person’s abilities. Individuals perceive their environment in light of their own premises, and thus environment is a subjective entity. Perceived facilitators and barriers demonstrate the different ways in which older people see and experi-ence their environment. Functional capacity also has a strong effect on how the environment is perceived, and consequently environmental barriers can be seen as manifestations of difficulties in functioning. It has been suggested that self-reports of environmental barriers can overestimate the impact of the latter, if an encounter with a specific barrier has been very negative (Keysor et al. 2010). The strength of subjective evaluations about neighborhoods is that they can provide information similar to that yielded by objective measures: In the study by Balfour and Kaplan (2002), people rated low SES areas as the most problem-atic, and Fänge and Iwarsson (2003) found that older people are able to accu-rately report on the barriers in their environment.
When investigating the association between risk factors and outcomes in health-related issues, the causal pathway between the two is always under scru-tiny. In studies which have addressed socioeconomic status, the social selection and social causation hypotheses have been the classical alternative explanations for the order of SES and the health outcome in question. The social selection theory posits that an adverse health outcome or illness can have an effect on socioeconomic position, while the social causation hypotheses presumes that socioeconomic position is a determinant of health and diseases (Dohrenwend et al. 1992). However, Link (2008) points out that causation and selection are not unambiguous: the associations of health risks, outcomes and resources are not fixed and the causal pathways can be reversed. More studies have found sup-port for the causality rather than the selection hypothesis. In the Whitehall II study in the United Kingdom, it was found that health status did not explain employment grade and therefore the results did not support the selection hy-pothesis (Chandola et al. 2003).
Owing to the cross-sectional study design in studies I, II and IV, we cannot draw any conclusions about the causality between SES and the disparity out-comes. Therefore, it can only be speculated whether our results support the so-cial causation or social selection hypothesis, leaving the causal pathway to be properly identified in future studies. Intuitively, social causation hypothesis seems a more reasonable explanation for the outcome when educational at-tainment is used as a measure of SES among older people. It is more likely that education, which is achieved early in life, will have had an effect on lifestyle factors, rather than the other way around (Groffen et al. 2013). According to the fundamental cause theory (Link & Phelan 1995), disparities in health are a re-sult of the unequal distribution of resources between people of different socio-
67
economic status (SES). These resources, which can be either material, such as money or equipment, or immaterial such as knowledge or power, affect the likelihood of encountering risk factors, and thus it can be assumed that people with high SES are more likely to possess the kinds of resources which help them maintain mobility across different environments and on different levels of life-space (Willson, Shuey & Elder Jr. 2007, Link & Phelan 1995).
The authors of the theory of fundamental causes suggest that many inter-ventions targeted at improving people’s health fail because they do not take into account the environment in which the participants live (Link & Phelan 1995). The same has been said about interventions aiming at improving health from the ecological point of view: the intervention will fail if the focus is solely on people and not also on the environment (Satariano & McAuley 2003).
6.5 Future directions
After disparities in physical activity among older people have been identified, it should be asked, what can be done to reduce them? An important point to con-sider is whether actions to reduce disparities in physical activity should be aimed at individuals or the environment. According to the theory of fundamen-tal causes, reducing socioeconomic disparities in health will succeed only if the actions are aimed at reducing socioeconomic inequalities (Link & Phelan 1995). This may apply to reducing disparities in physical activity as well, particularly if the differences are considered to be due to socioeconomic inequalities. How-ever, the results of this study cannot confirm that disparities in physical activity are fundamentally caused by socioeconomic disparities. In order to demon-strate a causal pathway between SES and other risk factors identified in this study, and their relationship with physical activity longitudinal studies would be needed. The results obtained from the present cross-sectional analyses can only demonstrate the existence of associations between correlates and outcomes. Therefore, the findings should be regarded as a foundation for constructing hy-potheses for investigation in further studies.
According to studies which have tested the theory of fundamental causes, disparities are due to the fact that the resources needed for better health are more readily available to people with higher SES, and that to decrease dispari-ties the public resources should be targeted more frequently to people in less advantaged positions (House, Lantz & Herd 2005). On individual level, inter-ventions or help can be targeted to those who have the highest risks or the strongest need of help (Cohen, Scribner & Farley 2000). Melzer et al (2001) sug-gest that to reduce socioeconomic disparities in disability, effort should be put into preventing the onset of disability. Keysor and Jette (2001) found in their review that exercise interventions were not effective in reducing disability, and suggested that one reason might have been that the interventions reviewed were focused on the individual, and not on the broader environmental context.
68
The focus in promoting physical activity among older people should not be on the individual or the environment alone, but on their interaction, while interventions targeted at individuals should also take the environment into ac-count (Rantanen 2013, Satariano & McAuley 2003). It is interesting to note, that although imbalance in person-environment fit is for the most part due to de-cline in individual functioning (Iwarsson 2005, Werngren-Elgstrom, Carlsson & Iwarsson 2008), improving functioning is not achieved by focusing on the loss of individual capability but by reducing demands made by the environment (Satariano & McAuley 2003). Thus, addressing disparities in physical activity among older people call for actions from at the societal level. For example, the trend in many Finnish cities small shops closures and transfer of services to hy-permarkets that are often located far from city centers hardly promotes habitual physical activity; on the contrary, it makes it more difficult for older people to run errands by themselves (Van Cauwenberg et al. 2013).
Further interventions should target people who already earlier in life seem to lack resources for conducting healthy and active lives and try to find ways to minimize risks and strengthen resources on the path towards old age. The cur-rent policy of older people’s health and social care in Finland favors home care over institutional care. Future studies could address the effects, and also cost-effectiveness, of offering health promoting physical activity services to people who are still willing to be active but have difficulties in performing those activi-ties on their own, and investigate whether such services could reduce or post-pone the need for other health and social services. In order to extensively inves-tigate the accumulation of risks and resources during life-course and their effect on wellbeing later in life, longitudinal studies extending from childhood to old age are needed.
To reduce disparities means moving towards equity, which in this case means providing older people equal opportunities to participate in physical activity. It should be acknowledged that the simplest and most inexpensive form of physical activity, walking outdoors, is not an option for an older person who cannot get out of his or her home without assistance. Equity can be achieved by increasing the resources of those who are in the most disadvan-taged position (Braveman 2014a), which could simply mean that older people who have difficulties going outdoors or participating in adequate exercise groups, can call on concrete assistance for participation. In addition, the resi-dential environments should be developed to support and facilitate to the mak-ing of choices that are beneficial for individuals’ health and wellbeing.

7 MAIN FINDINGS AND CONCLUSIONS
The main findings and conclusions can be summarized as follows:
1. Disparities in physical activity in old age indicate differential opportuni-ties for participation in physical activities.
2. The major individual outdoor physical activity barriers were associated
with higher risk for unmet physical activity need among community-dwelling older people.
3. Self-reported individual and environmental barriers to outdoor physical
activity reflected the functional status of older community-dwelling people.
4. Older people with walking limitations, low socioeconomic status and
lacking a confidant had a high risk for unmet physical activity need.
5. Environmental facilitators may prevent the development of walking dif-ficulties.
6. Socioeconomic differences exist in life-space mobility among older peo-
ple. The differences were largely explained by higher BMI, poorer cogni-tive status and poorer physical performance among those with low soci-oeconomic status.
7. Individual and environmental risks and resources shaped the person-
environment fit of older community-dwelling persons.

70
YHTEENVETO (FINNISH SUMMARY)
Liikunnan eriarvoisuus iäkkäillä henkilöillä Liikunta on ihmisen perustarve. Iäkkäille henkilöille liikunta on lisäksi itsenäi-sen elämän edellytys. Liikunnalla tarkoitetaan tässä tutkimuksessa päivittäistä arkiliikuntaa sekä muuta iäkkäiden suosimaa ulkoliikuntaa kuten kävelylenk-keilyä. Liikunnan eriarvoisuudella tarkoitetaan sitä, että mahdollisuudet toteut-taa liikuntaa osana päivittäisiä toimia, tai osallistua terveyttä, toimintakykyä ja hyvinvointia edistävään tai ylläpitävään liikuntaan, eivät ole kaikille iäkkäille henkilöille yhtäläiset. Tässä tutkimuksessa puhutaan eriarvoisista mahdolli-suuksista erilaisten mahdollisuuksien sijaan, korostaen sitä että liikuntamahdol-lisuuksien tulisi olla kaikille yhdenvertaiset. Eriarvoisuus liikunnassa voi olla yksi tekijä, joka vaikuttaa edelleen terveyden ja hyvinvoinnin eriarvoisuuteen.
Iän myötä liikunta usein vähenee kävelykyvyn heikkenemisen myötä ja varsinkin ulkona liikkumista hankaloittavat useat eri esteet. Kävelyvaikeuksista ja muista liikunnan esteistä johtuen moni iäkäs henkilö kokee, ettei heillä ole enää mahdollisuuksia liikuntaan, vaikka halu ja tarve liikkua säilyvät vaikeuk-sista huolimatta. Epätasapaino liikuntamahdollisuuksien ja liikuntahalukkuu-den välillä on määritelty tyydyttämättömäksi liikunnan tarpeeksi. Ulkona liik-kumisen vaikeudet voivat johtaa myös elinpiirin kaventumiseen. Elinpiirillä tarkoitetaan sitä aluetta, jossa ihminen arjessaan liikkuu: omaa kotia, kodin pi-ha-aluetta, naapurustoa, kotikaupunkia, ulottuen laajimmillaan aina kaupungin ja jopa maan rajojen ulkopuolelle.
Liikuntaan ja liikuntamahdollisuuksiin vaikuttavat sekä yksilön että ym-päristön tasolla olevat tekijät, jotka tässä tutkimuksessa on jaettu riskeihin ja resursseihin. Yksilötasolla riskitekijöinä on tarkasteltu mm. kävelyvaikeuksia, sairauksia, kaatumisen pelkoa, heikkoa sosioekonomista asemaa sekä sosiaali-sen tuen puutetta. Ympäristöstä puolestaan tarkasteltiin sekä riskejä että resurs-seja: riskejä olivat mm. huono sää, pimeys ja katujen liukkaus ja resursseja esi-merkiksi ulkoilualueiden läheisyys ja ulkoympäristön houkuttelevuus.
Tämän tutkimuksen tarkoituksena oli selvittää erilaisten yksilön ja ympä-ristön riskitekijöiden sekä ympäristön tarjoamien resurssien yhteyttä iäkkäiden henkilöiden tyydyttämättömän liikunnan tarpeen kokemiseen, kävelyvaikeuk-sien syntyyn sekä elinpiirin laajuuteen. Tutkimuksen tulokset perustuvat kah-teen tutkimusaineistoon. Screening and Counseling for Physical Activity and Mobility in Older People (SCAMOB) – projektin alkumittausaineistoa (n=632) käytettiin poikkileikkausanalyysiin ja kontrolliryhmän (n=261) aineistoa pitkit-täisanalyysiin. Life-Space Mobility in Old Age (LISPE) – projektin alkumittaus-aineistoa (n=848) käytettiin poikkileikkausanalyyseihin. SCAMOB-projektissa mukana olleet tutkimushenkilöt olivat 75–81-vuotiaita omissa kodeissaan Jy-väskylän keskustan alueella asuvia naisia ja miehiä. LISPE-projektin tutkimus-henkilöt olivat 75–90-vuotiaita itsenäisesti asuvia naisia ja miehiä Jyväskylästä ja Muuramesta.
71
Ulkona liikkumisen esteiden – sekä yksilöön että ympäristön liittyvien - todettiin olevan yhteydessä tyydyttämättömään liikunnan tarpeeseen. Tyydyt-tämätöntä liikunnan tarvetta selittivät kävelyvaikeudet ja se oli yleisintä niillä henkilöillä, joilla kävelyvaikeuksien lisäksi ei ollut seuraa ja joiden sosioekono-minen asema oli heikko. Myös ympäristön esteiden, kuten huonon sään ja liuk-kaiden katujen, todettiin olevan yhteydessä tyydyttämättömään liikunnan tar-peeseen. Vähän esteitä raportoineilla henkilöillä ei juuri esiintynyt tyydyttämä-töntä liikunnan tarvetta, mutta sen kokeminen oli yleisempää niillä henkilöillä, jotka kertoivat useista ulkona liikkumisen esteistä. Tyydyttämätön liikunnan tarve ei kuitenkaan ollut yleisintä niillä henkilöillä, jotka raportoivat määrälli-sesti eniten ulkona liikkumisen esteitä, vaan niillä, joilla ulkona liikkumisen esteet olivat selkeästi yksilöön liittyviä, kuten sairauksia ja kävelyvaikeuksia. Tulokset osoittivat, etteivät nämä henkilöt tosiasiassa enää juuri liikkuneet ul-kona, eivätkä he siten myöskään kohdanneet ulkoympäristössä olevia esteitä.
Ympäristö voi myös edistää ulkona liikkumista ja ennaltaehkäistä kävely-vaikeuksien syntymistä. Tähän tutkimukseen osallistuneista henkilöistä ne, joi-den kodin lähistöllä hyviä liikuntapaikkoja, viheralueita ja muita ulkona liik-kumiseen motivoivia tekijöitä, olivat vähemmän alttiita kävelyvaikeuksien syn-nylle kolmen ja puolen vuoden seurannan aikana.
Kävelyvaikeuksien lisäksi yksilöön liittyvistä tekijöistä tarkasteltiin erityi-sesti sosioekonomista asemaa. Niillä henkilöillä, joilla oli matala sosioekonomi-nen asema, oli myös todennäköisemmin kaventunut elinpiiri verrattuna niihin henkilöihin, joiden sosioekonominen asema oli korkea. Tuloksia selitti se, että matalassa sosioekonomisessa asemassa olevilla henkilöillä oli myös korkeampi painoindeksi, heikompi kognitiivinen status sekä enemmän vaikeuksia alaraa-jojen toiminnassa. Sosioekonomisen aseman mittarina käytettiin koulutusta. Tulosten tulkinnassa tulee kuitenkin huomioida se, että tutkimusasetelma oli poikkileikkaustutkimus, eikä tuloksista näin ollen voida päätellä sitä, onko hei-kompi sosioekonominen asema myötävaikuttanut elinpiirin kaventumiseen iäkkäänä.
Kaikilla iäkkäillä henkilöillä ei ole yhdenvertaisia mahdollisuuksia toteut-taa päivittäisissä toimissa tarvittavaa liikuntaa tai osallistua ulkoliikuntaan. Ympäristön merkitys iäkkäiden henkilöiden liikunnassa korostuu yksilön liik-kumiskyvyn heiketessä. Tyydyttämätön liikunnan tarve ja kaventunut elinpiiri kertovat siitä, että yksilön mahdollisuudet liikkua omassa ympäristössään ovat heikentyneet. Tässä tutkimuksessa matala sosioekonominen asema lisäsi sekä tyydyttämättömän liikunnan tarpeen että kaventuneen elinpiirin todennäköi-syyttä. Toisaalta, liikuntamahdollisuuksiin yhteydessä olevat tekijät, kuten kä-velyvaikeudet, asunnon sijainti ja mahdollisuus saada ulkoiluseuraa eivät riipu pelkästään henkilön sosioekonomisesta asemasta. Itsenäisen elämän ja omassa kodissa asumisen onnistumiseksi olisi tärkeää, että iäkkäillä henkilöillä olisi mahdollisuus liikuntaan myös silloin, kun sen toteuttamiseen tarvitaan apua. Liikuntamahdollisuuksia voidaan edistää esimerkiksi parantamalla sekä raken-nusten että katujen esteettömyyttä, huolehtimalla katujen hoidosta ja hyvästä valaistuksesta sekä tarjoamalla ulkoilukaveri seuraksi liikkumaan.
72
REFERENCES
Adler, N. E. & Newman, K. 2002. Socioeconomic disparities in health: pathways and policies. Health Affairs (Project Hope) 21 (2), 60-76.
Al Snih, S., Peek, K. M., Sawyer, P., Markides, K. S., Allman, R. M. & Otten-bacher, K. J. 2012. Life-Space Mobility in Mexican Americans Aged 75 and Older. Journal of the American Geriatrics Society 60 (3), 532-537.
Allman, R. M., Sawyer, P. & Roseman, J. M. 2006. The UAB Study of Aging: background and insights into life-space mobility among older Americans in rural and urban settings. Aging Health 2 (3), 417-429.
Alwin, D. F. & Wray, L. A. 2005. A Life-Span Developmental Perspective on Social Status and Health. The Journals of Gerontology Series B: Psychologi-cal Sciences and Social Sciences 60 (Special Issue 2), S7-S14.
Amuzu, A., Carson, C., Watt, H. C., Lawlor, D. A. & Ebrahim, S. 2009. Influence of area and individual lifecourse deprivation on health behaviours: findings from the British Women's Heart and Health Study. European Journal of Cardiovascular Prevention & Rehabilitation 16 (2), 169-173.
Ashe, M. C., Miller, W. C., Eng, J. J., Noreau, L. & Physical Activity and Chronic Conditions Research Team 2009. Older adults, chronic disease and leisure-time physical activity. Gerontology 55 (1), 64-72.
Atti, A. R., Forlani, C., De Ronchi, D., Palmer, K., Casadio, P., Dalmonte, E. & Fratiglioni, L. 2010. Cognitive impairment after age 60: clinical and social correlates in the Faenza Project. Journal of Alzheimer's Disease : JAD 21 (4), 1325-1334.
Baert, V., Gorus, E., Mets, T., Geerts, C. & Bautmans, I. 2011. Motivators and barriers for physical activity in the oldest old: a systematic review. Ageing Research Reviews 10 (4), 464-474.
Baker, P. S., Bodner, E. V. & Allman, R. M. 2003. Measuring life-space mobility in community-dwelling older adults. Journal of the American Geriatrics So-ciety 51 (11), 1610-1614.
Balfour, J. L. & Kaplan, G. A. 2002. Neighborhood environment and loss of physical function in older adults: evidence from the Alameda County Study. American Journal of Epidemiology 155 (6), 507-515.
Barnes, L. L., Wilson, R. S., Bienias, J. L., de Leon, C. F., Kim, H. J., Buchman, A. S. & Bennett, D. A. 2007. Correlates of life space in a volunteer cohort of older adults. Experimental Aging Research 33 (1), 77-93.
Bauman, A. E., Reis, R. S., Sallis, J. F., Wells, J. C., Loos, R. J. & Martin, B. W. 2012. Correlates of physical activity: why are some people physically active and others not? The Lancet 380 (9838), 258-271.
Belza, B., Walwick, J., Shiu-Thornton, S., Schwartz, S., Taylor, M. & LoGerfo, J. 2004. Older adult perspectives on physical activity and exercise: voices from multiple cultures. Preventing Chronic Disease 1 (4), A09.
Benzinger, P., Iwarsson, S., Kroog, A., Beische, D., Lindemann, U., Klenk, J. & Becker, C. 2014. The association between the home environment and physi-
73
cal activity in community-dwelling older adults. Aging Clinical and Exper-imental Research 26 (4), 377-385.
Bijnen, F. C., Caspersen, C. J., Feskens, E. J., Saris, W. H., Mosterd, W. L. & Kromhout, D. 1998. Physical activity and 10-year mortality from cardiovas-cular diseases and all causes: The Zutphen Elderly Study. Archives of In-ternal Medicine 158 (14), 1499-1505.
Blazer, D. G., Sachs-Ericsson, N. & Hybels, C. F. 2007. Perception of unmet basic needs as a predictor of depressive symptoms among community-dwelling older adults. The Journals of Gerontology.Series A, Biological Sciences and Medical Sciences 62 (2), 191-195.
Blazer, D. G., Sachs-Ericsson, N. & Hybels, C. F. 2005. Perception of unmet basic needs as a predictor of mortality among community-dwelling older adults. American Journal of Public Health 95 (2), 299-304.
Bossen, A. 2010. The importance of getting back to nature for people with de-mentia. Journal of Gerontological Nursing 36 (2), 17-22.
Braveman, P. 2014a. What are health disparities and health equity? We need to be clear. Public Health Reports (Washington, D.C.: 1974) 129 Suppl 2, 5-8.
Braveman, P. 2014b. What is health equity: and how does a life-course approach take us further toward it? Maternal and Child Health Journal 18 (2), 366-372.
Braveman, P. 2006. Health disparities and health equity: concepts and meas-urement. Annual Review of Public Health 27, 167-194.
Braveman, P. & Gottlieb, L. 2014. The social determinants of health: it's time to consider the causes of the causes. Public Health Reports (Washington, D.C.: 1974) 129 Suppl 2, 19-31.
Braveman, P. & Gruskin, S. 2003. Defining equity in health. Journal of epidemi-ology and community health 57 (4), 254-258.
Braveman, P. A., Cubbin, C., Egerter, S., Williams, D. R. & Pamuk, E. 2010. So-cioeconomic disparities in health in the United States: what the patterns tell us. American Journal of Public Health 100 Suppl 1, S186-96.
Brawley, L. R., Rejeski, W. J. & King, A. C. 2003. Promoting physical activity for older adults: The challenges for changing behavior. American Journal of Preventive Medicine 25 (3, Supplement 2), 172-183.
Breeze, E., Jones, D. A., Wilkinson, P., Bulpitt, C. J., Grundy, C., Latif, A. M. & Fletcher, A. E. 2005. Area deprivation, social class, and quality of life among people aged 75 years and over in Britain. International Journal of Epidemi-ology 34 (2), 276-283.
Brown, C. J. & Flood, K. L. 2013. Mobility limitation in the older patient: a clini-cal review. JAMA : the Journal of the American Medical Association 310 (11), 1168-1177.
Carlson, J. A., Sallis, J. F., Conway, T. L., Saelens, B. E., Frank, L. D., Kerr, J., Cain, K. L. & King, A. C. 2012. Interactions between psychosocial and built environment factors in explaining older adults' physical activity. Preventive Medicine 54 (1), 68-73.
74
Caspersen, C. J. 1989. Physical activity epidemiology: concepts, methods, and applications to exercise science. Exercise and Sport Sciences Reviews 17, 423-473.
Chaikiat, A., Li, X., Bennet, L. & Sundquist, K. 2012. Neighborhood deprivation and inequities in coronary heart disease among patients with diabetes mellitus: a multilevel study of 334,000 patients. Health & Place 18 (4), 877-882.
Chandola, T., Bartley, M., Sacker, A., Jenkinson, C. & Marmot, M. 2003. Health selection in the Whitehall II study, UK. Social Science & Medicine 56 (10), 2059-2072.
Clarke, P., Ailshire, J. A. & Lantz, P. 2009. Urban built environments and trajec-tories of mobility disability: findings from a national sample of community-dwelling American adults (1986-2001). Social Science & Medicine 69 (6), 964-970.
Cohen, D. A., Scribner, R. A. & Farley, T. A. 2000. A Structural Model of Health Behavior: A Pragmatic Approach to Explain and Influence Health Behav-iors at the Population Level. Preventive Medicine 30 (2), 146-154.
Cohen-Mansfield, J., Marx, M. S. & Guralnik, J. M. 2003. Motivators and barriers to exercise in an older community-dwelling population. Journal of Aging & Physical Activity 11 (2), 242-253.
Cohen-Mansfield, J., Shmotkin, D. & Hazan, H. 2012. Homebound older per-sons: Prevalence, characteristics, and longitudinal predictors. Archives of Gerontology and Geriatrics 54 (1), 55-60.
Commission on Social Determinants of Health. 2008. Closing the gap in a gen-eration. Health equity through action on the social determinants of health. World Health Organization.
Coppin, A. K., Ferrucci, L., Lauretani, F., Phillips, C., Chang, M., Bandinelli, S. & Guralnik, J. M. 2006. Low socioeconomic status and disability in old age: evidence from the InChianti study for the mediating role of physiological impairments. The Journals of Gerontology. Series A, Biological Sciences and Medical sciences 61 (1), 86-91.
Crowe, M., Andel, R., Wadley, V. G., Okonkwo, O. C., Sawyer, P. & Allman, R. M. 2008. Life-space and cognitive decline in a community-based sample of African American and Caucasian older adults. The Journals of Gerontolo-gy.Series A, Biological Sciences and Medical Sciences 63 (11), 1241-1245.
Curcio, C. L., Alvarado, B. E., Gomez, F., Guerra, R., Guralnik, J. & Zunzunegui, M. V. 2013. Life-Space Assessment scale to assess mobility: validation in Latin American older women and men. Aging Clinical and Experimental Research 25 (5), 553-560.
Dahl, E. & Birkelund, G. E. 1997. Health inequalities in later life in a social dem-ocratic welfare state. Social Science & Medicine 44 (6), 871-881.
Dawson, J., Hillsdon, M., Boller, I. & Foster, C. 2007. Perceived barriers to walk-ing in the neighborhood environment: a survey of middle-aged and older adults. Journal of Aging and Physical Activity 15 (3), 318-335.

75
Day, R. 2008. Local environments and older people's health: dimensions from a comparative qualitative study in Scotland. Health & Place 14 (2), 299-312.
Dohrenwend, B. P., Levav, I., Shrout, P. E., Schwartz, S., Naveh, G., Link, B. G., Skodol, A. E. & Stueve, A. 1992. Socioeconomic status and psychiatric dis-orders: the causation-selection issue. Science (New York, N.Y.) 255 (5047), 946-952.
Duncan, M. J., Spence, J. C. & Mummery, W. K. 2005. Perceived environment and physical activity: a meta-analysis of selected environmental characteris-tics. The International Journal of Behavioral Nutrition and Physical Activity 2, 11.
Enroth, L., Raitanen, J., Hervonen, A. & Jylhä, M. 2013. Do Socioeconomic Health Differences Persist in Nonagenarians? The Journals of Gerontology Series B: Psychological Sciences and Social Sciences 68 (5), 837-847.
Enroth, L., Raitanen, J., Hervonen, A., Nosraty, L. & Jylhä, M. 2015. Is socioeco-nomic status a predictor of mortality in nonagenarians? The vitality 90+ study. Age and Ageing 44 (1), 123-129.
Fange, A. & Iwarsson, S. 2003. Accessibility and usability in housing: construct validity and implications for research and practice. Disability and Rehabili-tation 25 (23), 1316-1325.
Farrell, L., Hollingsworth, B., Propper, C. & Shields, M. A. 2014. The socioeco-nomic gradient in physical inactivity: Evidence from one million adults in England. Social Science & Medicine 123 (0), 55-63.
Folstein, M. F., Folstein, S. E. & McHugh, P. R. 1975. "Mini-mental state". A practical method for grading the cognitive state of patients for the clinician. Journal of Psychiatric Research 12, 189-198.
Fox, K. R., Hillsdon, M., Sharp, D., Cooper, A. R., Coulson, J. C., Davis, M., Har-ris, R., McKenna, J., Narici, M., Stathi, A. & Thompson, J. L. 2011. Neigh-bourhood deprivation and physical activity in UK older adults. Health & Place 17 (2), 633-640.
Frank, L. D., Schmid, T. L., Sallis, J. F., Chapman, J. & Saelens, B. E. 2005. Link-ing objectively measured physical activity with objectively measured urban form: findings from SMARTRAQ. American Journal of Preventive Medi-cine 28 (2 Suppl 2), 117-125.
Freiberger, E., Blank, W. A., Salb, J., Geilhof, B., Hentschke, C., Landendoerfer, P., Halle, M. & Siegrist, M. 2013. Effects of a complex intervention on fall risk in the general practitioner setting: a cluster randomized controlled trial. Clinical Interventions in Aging 8, 1079-1088.
Giesinger, I., Goldblatt, P., Howden-Chapman, P., Marmot, M., Kuh, D. & Brunner, E. 2014. Association of socioeconomic position with smoking and mortality: the contribution of early life circumstances in the 1946 birth co-hort. Journal of Epidemiology and Community Health 68 (3), 275-279.
Gitlin, L. N. 2003. Conducting Research on Home Environments: Lessons Learned and New Directions. The Gerontologist 43 (5), 628-637.
Government bill for the Sports Act Finland 236/1997.

76
Gregory, P. C., Szanton, S. L., Xue, Q. L., Tian, J., Thorpe, R. J. & Fried, L. P. 2011. Education predicts incidence of preclinical mobility disability in ini-tially high-functioning older women. The Women's Health and Aging Study II. The Journals of Gerontology. Series A, Biological Sciences and Medical Sciences 66 (5), 577-581.
Greysen, S. R., Hoi-Cheung, D., Garcia, V., Kessell, E., Sarkar, U., Goldman, L., Schneidermann, M., Critchfield, J., Pierluissi, E. & Kushel, M. 2014. Missing Pieces? Functional, Social, and Environmental Barriers to Recovery for Vul-nerable Older Adults Transitioning from Hospital to Home. Journal of the American Geriatrics Society 62 (8), 1556-1561.
Grimby, G. 1986. Physical activity and muscle training in the elderly. Acta medica Scandinavica.Supplementum 711, 233-237.
Groffen, D. A., Koster, A., Bosma, H., van den Akker, M., Aspelund, T., Siggeirsdottir, K., Kempen, G. I., van Eijk, J. T., Eiriksdottir, G., Jonsson, P. V., Launer, L. J., Gudnason, V., Harris, T. B. & Age, Gene/Environment Susceptibility-Reykjavik Study Investigators 2013. Socioeconomic factors from midlife predict mobility limitation and depressed mood three decades later; findings from the AGES-Reykjavik Study. BMC Public Health 13, 101-2458-13-101.
Guralnik, J. M., Ferrucci, L., Simonsick, E. M., Salive, M. E. & Wallace, R. B. 1995. Lower-extremity function in persons over the age of 70 years as a predictor of subsequent disability. The New England Journal of Medicine 332 (9), 556-561.
Guralnik, J. M., Simonsick, E. M., Ferrucci, L., Glynn, R. J., Berkman, L. F., Blaz-er, D. G., Scherr, P. A. & Wallace, R. B. 1994. A Short Physical Performance Battery Assessing Lower Extremity Function: Association With Self-Reported Disability and Prediction of Mortality and Nursing Home Admis-sion. The Journals of Gerontology.Series A, Biological Sciences and Medical Sciences 49 (2), 85-94.
Hagen, K., Zwart, J. A., Svebak, S., Bovim, G. & Jacob Stovner, L. 2005. Low so-cioeconomic status is associated with chronic musculoskeletal complaints among 46,901 adults in Norway. Scandinavian Journal of Public Health 33 (4), 268-275.
Hanson, H. M., Schiller, C., Winters, M., Sims-Gould, J., Clarke, P., Curran, E., Donaldson, M. G., Pitman, B., Scott, V., McKay, H. A. & Ashe, M. C. 2013. Concept mapping applied to the intersection between older adults' outdoor walking and the built and social environments. Preventive Medicine 57 (6), 785-791.
Hardy, S. E., McGurl, D. J., Studenski, S. A. & Degenholtz, H. B. 2010. Biopsy-chosocial characteristics of community-dwelling older adults with limited ability to walk one-quarter of a mile. Journal of the American Geriatrics So-ciety 58 (3), 539-544.
Hardy, S. E., Kang, Y., Studenski, S. A. & Degenholtz, H. B. 2011. Ability to Walk 1/4 Mile Predicts Subsequent Disability, Mortality, and Health Care Costs. Journal of General Internal Medicine 26 (2), 130-135.

77
Hawkley, L. C., Thisted, R. A. & Cacioppo, J. T. 2009. Loneliness predicts re-duced physical activity: cross-sectional & longitudinal analyses. Health psychology : Official Journal of the Division of Health Psychology, Ameri-can Psychological Association 28 (3), 354-363.
Herr, M., Arvieu, J., Aegerter, P., Robine, J. & Ankri, J. 2014. Unmet health care needs of older people: prevalence and predictors in a French cross-sectional survey. The European Journal of Public Health 24 (5), 808-813.
Hillsdon, M., Lawlor, D. A., Ebrahim, S. & Morris, J. N. 2008. Physical activity in older women: associations with area deprivation and with socioeconom-ic position over the life course: observations in the British Women’s Heart and Health Study. Journal of Epidemiology and Community Health 62 (4), 344-350.
Hirvensalo, M., Sakari-Rantala, R., Kallinen, M., Leinonen, R., Lintunen, T. & Rantanen, T. 2007. Underlying factors in the association between depressed mood and mobility limitation in older people. Gerontology 53 (3), 173-178.
House, J. S., Lantz, P. M. & Herd, P. 2005. Continuity and Change in the Social Stratification of Aging and Health Over the Life Course: Evidence From a Nationally Representative Longitudinal Study From 1986 to 2001/2002 (Americans' Changing Lives Study). The Journals of Gerontology Series B: Psychological Sciences and Social Sciences 60 (Special Issue 2), S15-S26.
Humpel, N., Owen, N. & Leslie, E. 2002. Environmental factors associated with adults' participation in physical activity: a review. American Journal of Preventive Medicine 22 (3), 188-199.
Ikezoe, T., Mori, N., Nakamura, M. & Ichihashi, N. 2011. Age-related muscle atrophy in the lower extremities and daily physical activity in elderly women. Archives of Gerontology and Geriatrics 53 (2), e153-e157.
Iliffe, S., Kharicha, K., Harari, D., Swift, C., Gillmann, G. & Stuck, A. E. 2007. Health risk appraisal in older people 2: the implications for clinicians and commissioners of social isolation risk in older people. British Journal of General Practice 57 (537), 277-282.
Iwarsson, S. 2005. A long-term perspective on person-environment fit and ADL dependence among older Swedish adults. The Gerontologist 45 (3), 327-336.
Iwarsson, S. & Slaug, B. 2001. Housing Enabler: An instrument for assessing and analysing accessibility problems in housing . Nävlinge, Sweden: Veten & Skapen HB, Slaug Data Management.
Iwarsson, S. & Stahl, A. 2003. Accessibility, usability and universal design--positioning and definition of concepts describing person-environment rela-tionships. Disability & Rehabilitation 25 (2), 57.
Jacobs, J. M., Cohen, A., Hammerman-Rozenberg, R., Azoulay, D., Maaravi, Y. & Stessman, J. 2008. Going Outdoors Daily Predicts Long-Term Functional and Health Benefits Among Ambulatory Older People. Journal of Aging and Health 20 (3), 259-272.
James, B. D., Boyle, P. A., Buchman, A. S., Barnes, L. L. & Bennett, D. A. 2011. Life space and risk of Alzheimer disease, mild cognitive impairment, and cognitive decline in old age. The American Journal of Geriatric Psychiatry :
78
Official Journal of the American Association for Geriatric Psychiatry 19 (11), 961-969.
Jefferis, B., Sartini, C., Lee, I., Choi, M., Amuzu, A., Gutierrez, C., Casas, J., Ash, S., Lennnon, L., Wannamethee, S. & Whincup, P. 2014. Adherence to physi-cal activity guidelines in older adults, using objectively measured physical activity in a population-based study. BMC Public Health 14 (1), 382.
Karp, A., Kåreholt, I., Qiu, C., Bellander, T., Winblad, B. & Fratiglioni, L. 2004. Relation of Education and Occupation-based Socioeconomic Status to Inci-dent Alzheimer’s Disease. American Journal of Epidemiology 159 (2), 175-183.
Kenter, E. J., Gebhardt, W. A., Lottman, I., van Rossum, M., Bekedam, M. & Crone, M. R. 2014. The influence of life events on physical activity patterns of Dutch older adults: A life history method. Psychology & Health , 1-25.
Keppel, K., Pamuk, E., Lynch, J., Carter-Pokras, O., Kim, I., Mays, V., Pearcy, J., Schoenbach, V. & Weissman, J. S. 2005. Methodological issues in measuring health disparities. Vital and health statistics.Series 2, Data evaluation and methods research July (141), 1-16.
Keysor, J. J., Jette, A. M., LaValley, M. P., Lewis, C. E., Torner, J. C., Nevitt, M. C., Felson, D. T. & Multicenter Osteoarthritis (MOST) group 2010. Commu-nity environmental factors are associated with disability in older adults with functional limitations: the MOST study. The Journals of Gerontolo-gy.Series A, Biological Sciences and Medical sciences 65 (4), 393-399.
Keysor, J. J. & Jette, A. M. 2001. Have We Oversold the Benefit of Late-Life Ex-ercise? The Journals of Gerontology Series A: Biological Sciences and Medi-cal Sciences 56 (7), M412-M423.
King, A. C., Sallis, J. F., Frank, L. D., Saelens, B. E., Cain, K., Conway, T. L., Chapman, J. E., Ahn, D. K. & Kerr, J. 2011. Aging in neighborhoods differ-ing in walkability and income: associations with physical activity and obe-sity in older adults. Social Science & Medicine 73 (10), 1525-1533.
Kono, A., Kai, I., Sakato, C. & Rubenstein, L. Z. 2004. Frequency of Going Out-doors: A Predictor of Functional and Psychosocial Change Among Ambula-tory Frail Elders Living at Home. The Journals of Gerontology Series A: Biological Sciences and Medical Sciences 59 (3), M275-M280.
Korpela, K. M., Ylén, M., Tyrväinen, L. & Silvennoinen, H. 2010. Favorite green, waterside and urban environments, restorative experiences and perceived health in Finland. Health Promotion International 25 (2), 200-209.
Koskinen, S., Lundqvist, A. & Ristiluoma, N. 2012. Terveys, toimintakyky ja hyvinvointi Suomessa 2011. Terveyden ja hyvinvoinnin laitoksen raportteja 68. Tampere.
Koster, A., Bosma, H., van Lenthe, F. J., Kempen, G. I., Mackenbach, J. P. & van Eijk, J. T. 2005a. The role of psychosocial factors in explaining socio-economic differences in mobility decline in a chronically ill population: re-sults from the GLOBE study. Social Science & Medicine 61 (1), 123-132.
Koster, A., Penninx, B. W. J. H., Bosma, H., Kempen, G. I. J. M., Harris, T. B., Newman, A. B., Rooks, R. N., Rubin, S. M., Simonsick, E. M., van Eijk, J. T.
79
M. & Kritchevsky, S. B. 2005b. Is There a Biomedical Explanation for Socio-economic Differences in Incident Mobility Limitation? The Journals of Ger-ontology Series A: Biological Sciences and Medical Sciences 60 (8), 1022-1027.
Kowal, J. & Fortier, M. S. 2007. Physical activity behavior change in middle-aged and older women: the role of barriers and of environmental character-istics. Journal of Behavioral Medicine 30 (3), 233-242.
Lahti, J., Laaksonen, M., Lahelma, E. & Rahkonen, O. 2011. Changes in leisure-time physical activity after transition to retirement: a follow-up study. The International Journal of Behavioral Nutrition and Physical Activity 8, 36.
Landi, F., Onder, G., Carpenter, I., Cesari, M., Soldato, M. & Bernabei, R. 2007. Physical activity prevented functional decline among frail community-living elderly subjects in an international observational study. Journal of Clinical Epidemiology 60 (5), 518-524.
Lang, I. A., Llewellyn, D. J., Langa, K. M., Wallace, R. B. & Melzer, D. 2008. Neighbourhood deprivation and incident mobility disability in older adults. Age and Ageing 37 (4), 403-410.
Latham, K. 2014. Racial and Educational Disparities in Mobility Limitation Among Older Women: What Is the Role of Modifiable Risk Factors? The Journals of Gerontology Series B: Psychological Sciences and Social Sciences 69 (5), 772-783.
Lawton, M. P. & Nahemow, L. 1973. Ecology and the aging process. In C. Eis-dorfer M. P. Lawton (Ed.) Washington, DC, US: American Psychological Association, 619-674.
Lee, I. M., Shiroma, E. J., Lobelo, F., Puska, P., Blair, S. N., Katzmarzyk, P. T. & Lancet Physical Activity Series Working Group 2012. Effect of physical in-activity on major non-communicable diseases worldwide: an analysis of burden of disease and life expectancy. Lancet 380 (9838), 219-229.
Leinonen, R., Heikkinen, E., Hirvensalo, M., Lintunen, T., Rasinaho, M., Sakari-Rantala, R., Kallinen, M., Koski, J., Mottonen, S., Kannas, S., Huovinen, P. & Rantanen, T. 2007. Customer-oriented counseling for physical activity in older people: study protocol and selected baseline results of a randomized-controlled trial (ISRCTN 07330512). Scandinavian Journal of Medicine & Science in Sports 17 (2), 156-164.
Lim, K. & Taylor, L. 2005. Factors associated with physical activity among older people--a population-based study. Preventive Medicine 40 (1), 33-40.
Link, B. G. 2008. Epidemiological Sociology and the Social Shaping of Popula-tion Health. Journal of Health and Social Behavior 49 (4), 367-384.
Link, B. G. & Phelan, J. 1995. Social Conditions As Fundamental Causes of Dis-ease. Journal of Health and Social Behavior 35 (Extra Issue), 80-94.
Liu, C. J. & Latham, N. K. 2009. Progressive resistance strength training for im-proving physical function in older adults. Cochrane database of systematic reviews 3, doi: 10.1002/14651858.CD002759.pub2.
80
Lo, A. X., Brown, C. J., Sawyer, P., Kennedy, R. E. & Allman, R. M. 2014. Life-Space Mobility Declines Associated with Incident Falls and Fractures. Jour-nal of the American Geriatrics Society 62 (5), 919-923.
Lockett, D., Willis, A. & Edwards, N. 2005. Through seniors' eyes: an explorato-ry qualitative study to identify environmental barriers to and facilitators of walking. The Canadian Journal of Nursing Research 37 (3), 48-65.
Mackenbach, J. P., Kulhánová, I., Bopp, M., Deboosere, P., Eikemo, T. A., Hoff-mann, R., Kulik, M. C., Leinsalu, M., Martikainen, P., Menvielle, G., Regi-dor, E., Wojtyniak, B., Östergren, O. & Lundberg, O. 2014. Variations in the relation between education and cause-specific mortality in 19 European populations: A test of the “fundamental causes” theory of social inequali-ties in health. Social science & medicine 127, 51-62.
Macniven, R., Pye, V., Merom, D., Milat, A., Monger, C., Bauman, A. & van der Ploeg, H. 2014. Barriers and Enablers to Physical Activity Among older Australians Who Want to Increase Their Physical Activity Levels. Journal of Physical Activity & Health 11 (7), 1420-1429.
Mahmood, A., Chaudhury, H., Michael, Y. L., Campo, M., Hay, K. & Sarte, A. 2012. A photovoice documentation of the role of neighborhood physical and social environments in older adults' physical activity in two metropoli-tan areas in North America. Social Science & Medicine 74 (8), 1180-1192.
Mäkilä, P., Hirvensalo, M. & Parkatti, T. 2010. Changes in Physical Activity In-volvement and Attitude to Physical Activity in a 16-Year Follow-Up Study among the Elderly. Journal of Aging Research , Article ID 174290.
Mänty, M., Heinonen, A., Leinonen, R., Törmäkangas, T., Hirvensalo, M., Kalli-nen, M., Sakari, R., von Bonsdorff, M. B., Heikkinen, E. & Rantanen, T. 2009. Long-term Effect of Physical Activity Counseling on Mobility Limitation Among Older People: A Randomized Controlled Study. The Journals of Gerontology Series A: Biological Sciences and Medical Sciences 64A (1), 83-89.
Marmot, M. & Bell, R. 2012. Fair society, healthy lives. Public Health 126, Sup-plement 1 (0), S4-S10.
McHugh, J. E. & Lawlor, B. A. 2013. Perceived Health Status Is Associated With Hours of Exercise per Week in Older Adults Independent of Physical Health. Journal of Physical Activity & Health 10 (8), 1102-1108.
Melzer, D., Izmirlian, G., Leveille, S. G. & Guralnik, J. M. 2001. Educational dif-ferences in the prevalence of mobility disability in old age: the dynamics of incidence, mortality, and recovery. The Journals of Gerontology.Series B, Psychological Sciences and Social Sciences 56 (5), S294-301.
Miller, E. A. & Weissert, W. G. 2000. Predicting Elderly People’s Risk for Nurs-ing Home Placement, Hospitalization, Functional Impairment, and Mortali-ty: A Synthesis. Medical Care Research and Review 57 (3), 259-297.
Moran, M., Van Cauwenberg, J., Hercky-Linnewiel, R., Cerin, E., Deforche, B. & Plaut, P. 2014. Understanding the relationships between the physical envi-ronment and physical activity in older adults: a systematic review of quali-
81
tative studies. International Journal of Behavioral Nutrition and Physical Activity 11 (1), 79.
Moschny, A., Platen, P., Klaassen-Mielke, R., Trampisch, U. & Hinrichs, T. 2011. Barriers to physical activity in older adults in Germany: a cross-sectional study. The International Journal of Behavioral Nutrition and Physical Ac-tivity 8, 121.
Muthén, L. K. & Muthén, B. O. 2009. Mplus. Statistical analysis with latent vari-ables - User's guide. (Fifth edition) Los Angeles, CA: Muthen & Muthen.
Nelson, M. E., Rejeski, W. J., Blair, S. N., Duncan, P. W., Judge, J. O., King, A. C., Macera, C. A. & Castaneda-Sceppa, C. 2007. Physical activity and public health in older adults: recommendation from the American College of Sports Medicine and the American Heart Association. Medicine and Sci-ence in Sports and Exercise 39 (8), 1435-1445.
Newman, A. B., Simonsick, E. M., Naydeck, B. L., Boudreau, R. M., Kritchevsky, S. B., Nevitt, M. C., Pahor, M., Satterfield, S., Brach, J. S., Studenski, S. A. & Harris, T. B. 2006. Association of long-distance corridor walk performance with mortality, cardiovascular disease, mobility limitation, and disability. Journal of the American Medical Association 295 (17), 2018-2026.
Newson, R. S. & Kemps, E. B. 2007. Factors that promote and prevent exercise engagement in older adults. Journal of Aging and Health 19 (3), 470-481.
Nilsson, C. J., Avlund, K. & Lund, R. 2011. Onset of mobility limitations in old age: the combined effect of socioeconomic position and social relations. Age and Ageing 40 (5), 607-614.
Nilsson, C. J., Avlund, K. & Lund, R. 2010. Social Inequality in Onset of Mobili-ty Disability Among Older Danes: The Mediation Effect of Social Relations. Journal of Aging and Health 22 (4), 522-541.
Nobles, J., Weintraub, M. R. & Adler, N. E. 2013. Subjective socioeconomic sta-tus and health: Relationships reconsidered. Social Science & Medicine 82 (0), 58-66.
Nummela, O., Hätönen, H., Saaristo, V. & Helakorpi, S. 2014. Kuntalaisten va-paa-ajan liikunta-aktiivisuus - siihen yhteydessä olevat yksilötekijät ja kun-nan aktiivisuus terveyden edistämisessä. Yhteiskuntapolitiikka 79 (4), 388-399.
Owen, N., Humpel, N., Leslie, E., Bauman, A. & Sallis, J. F. 2004. Understanding environmental influences on walking; Review and research agenda. Ameri-can Journal of Preventive Medicine 27 (1), 67-76.
Pahor, M., Guralnik, J. M., Ambrosius, W. T., Blair, S., Bonds, D. E., Church, T. S., Espeland, M. A., Fielding, R. A., Gill, T. M., Groessl, E. J., King, A. C., Kritchevsky, S. B., Manini, T. M., McDermott, M. M., Miller, M. E., New-man, A. B., Rejeski, W. J., Sink, K. M., Williamson, J. D. & LIFE study inves-tigators 2014. Effect of structured physical activity on prevention of major mobility disability in older adults: the LIFE study randomized clinical trial. JAMA : the Journal of the American Medical Association 311 (23), 2387-2396.

82
Patel, A., Schofield, G. M., Kolt, G. S. & Keogh, J. W. L. 2013. Perceived Barriers, Benefits and Motives for Physical Activity: An Examination of Older Adults from Two Primary Care Physical Activity Prescription Programs. Journal of Aging and Physical Activity 21 (1), 85-99.
Peel, C., Baker, P. S., Roth, D. L., Brown, C. J., Bodner, E. V. & Allman, R. M. 2005. Assessing Mobility in Older Adults: The UAB Study of Aging Life-Space Assessment. Physical Therapy 85 (10), 1008-1019.
Phelan, J. C. & Link, B. G. 2005. Controlling Disease and Creating Disparities: A Fundamental Cause Perspective. The Journals of Gerontology Series B: Psy-chological Sciences and Social Sciences 60 (Special Issue 2), S27-S33.
Phelan, J. C., Link, B. G. & Tehranifar, P. 2010. Social Conditions as Fundamen-tal Causes of Health Inequalities: Theory, Evidence, and Policy Implica-tions. Journal of Health and Social Behavior 51 (1 suppl), S28-S40.
Portegijs, E., Iwarsson, S., Rantakokko, M., Viljanen, A. & Rantanen, T. 2014a. Life-space mobility assessment in older people in Finland; measurement properties in winter and spring. BMC Research Notes 7 (1), 323-0500-7-323.
Portegijs, E., Rantakokko, M., Mikkola, T. M., Viljanen, A. & Rantanen, T. 2014b. Association Between Physical Performance and Sense of Autonomy in Outdoor Activities and Life-Space Mobility in Community-Dwelling Older People. Journal of the American Geriatrics Society 62 (4), 615-621.
Pudrovska, T. & Anishkin, A. 2013. Early-Life Socioeconomic Status and Physi-cal Activity in Later Life: Evidence From Structural Equation Models. Jour-nal of Aging and Health 25 (3), 383-404.
Radloff, L. S. 1977. The CES-D Scale. Applied Psychological Measurement 1 (3), 385-401.
Rantakokko, M., Iwarsson, S., Hirvensalo, M., Leinonen, R., Heikkinen, E. & Rantanen, T. 2010a. Unmet physical activity need in old age. Journal of the American Geriatrics Society 58 (4), 707-712.
Rantakokko, M., Iwarsson, S., Kauppinen, M., Leinonen, R., Heikkinen, E. & Rantanen, T. 2010b. Quality of life and barriers in the urban outdoor envi-ronment in old age. Journal of the American Geriatrics Society 58 (11), 2154-2159.
Rantakokko, M., Manty, M., Iwarsson, S., Tormakangas, T., Leinonen, R., Heik-kinen, E. & Rantanen, T. 2009. Fear of moving outdoors and development of outdoor walking difficulty in older people. Journal of the American Ger-iatrics Society 57 (4), 634-640.
Rantakokko, M., Portegijs, E., Viljanen, A., Iwarsson, S. & Rantanen, T. 2013. Life-Space Mobility and Quality of Life in Community-Dwelling Older People. Journal of the American Geriatrics Society 61 (10), 1830-1832.
Rantanen, T. 2013. Promoting mobility in older people. Journal of Preventive Medicine and Public Health 46 Suppl 1, S50-4.
Rantanen, T., Äyräväinen, I., Eronen, J., Lyyra, T., Törmäkangas, T., Vaarama, M. & Rantakokko, M. 2014. The effect of an outdoor activities' intervention delivered by older volunteers on the quality of life of older people with se-vere mobility limitations: a randomized controlled trial. Aging Clinical and
83
Experimental Research Epub ahead of print, DOI 10.1007/s40520-014-0254-7.
Rantanen, T., Portegijs, E., Viljanen, A., Eronen, J., Saajanaho, M., Tsai, L. T., Kauppinen, M., Palonen, E. M., Sipilä, S., Iwarsson, S. & Rantakokko, M. 2012. Individual and environmental factors underlying life space of older people - study protocol and design of a cohort study on life-space mobility in old age (LISPE). BMC Public Health 12, DOI 10.1186/1471-2458-12-1018.
Rasinaho, M., Hirvensalo, M., Leinonen, R., Lintunen, T. & Rantanen, T. 2007. Motives for and barriers to physical activity among older adults with mo-bility limitations. Journal of Aging and Physical Activity 15 (1), 90-102.
Rautio, N., Adamson, J., Heikkinen, E. & Ebrahim, S. 2006. Associations of so-cio-economic position and disability among older women in Britain and Jyvaskyla, Finland. Archives of Gerontology and Geriatrics 42 (2), 141-155.
Rezende, L. F., Rey-Lopez, J., Matsudo, V. K. & Luiz, O. 2014. Sedentary behav-ior and health outcomes among older adults: a systematic review. BMC Public Health 14 (1), 333.
Rosenberg, D. E., Huang, D. L., Simonovich, S. D. & Belza, B. 2012. Outdoor Built Environment Barriers and Facilitators to Activity among Midlife and Older Adults with Mobility Disabilities. The Gerontologist 53 (2), 268-279.
Rosqvist, E., Heikkinen, E., Lyyra, T. M., Hirvensalo, M., Kallinen, M., Leino-nen, R., Rasinaho, M., Pakkala, I. & Rantanen, T. 2009. Factors affecting the increased risk of physical inactivity among older people with depressive symptoms. Scandinavian Journal of Medicine & Science in Sports 19 (3), 398-405.
Rush, K. L., Watts, W. E. & Stanbury, J. 2011. Mobility adaptations of older adults: a secondary analysis. Clinical Nursing Research 20 (1), 81-100.
Ryan, R. M. & Deci, E. L. 2000. Self-Determination Theory and the Facilitation of Intrinsic Motivation, Social Development, and Well-Being. American Psy-chologist 55 (1), 68-78.
Sachs-Ericsson, N., Schatschneider, C. & Blazer, D. G. 2006. Perception of unmet basic needs as a predictor of physical functioning among community-dwelling older adults. Journal of Aging and Health 18 (6), 852-868.
Saelens, B. E., Sallis, J. F., Black, J. B. & Chen, D. 2003. Neighborhood-based dif-ferences in physical activity: an environment scale evaluation. American Journal of Public Health 93 (9), 1552-1558.
Sainio, P., Martelin, T., Koskinen, S. & Heliövaara, M. 2007. Educational differ-ences in mobility: the contribution of physical workload, obesity, smoking and chronic conditions. Journal of Epidemiology and Community Health 61 (5), 401-408.
Sallinen, J., Leinonen, R., Hirvensalo, M., Lyyra, T. M., Heikkinen, E. & Rantanen, T. 2009. Perceived constraints on physical exercise among obese and non-obese older people. Preventive Medicine 49 (6), 506-510.
Satariano, W. A., Guralnik, J. M., Jackson, R. J., Marottoli, R. A., Phelan, E. A. & Prohaska, T. R. 2012. Mobility and aging: new directions for public health action. American Journal of Public Health 102 (8), 1508-1515.

84
Satariano, W. A. & McAuley, E. 2003. Promoting physical activity among older adults: from ecology to the individual. American Journal of Preventive Medicine 25 (3 Suppl 2), 184-192.
Satariano, W. 2006. Epidemiology of aging : an ecological approach. Sudbury, Mass: Jones and Bartlett.
Sattler, C., Toro, P., Schonknecht, P. & Schroder, J. 2012. Cognitive activity, edu-cation and socioeconomic status as preventive factors for mild cognitive impairment and Alzheimer's disease. Psychiatry research 196 (1), 90-95.
Sawchuk, C. N., Russo, J. E., Bogart, A., Charles, S., Goldberg, J., Forquera, R., Roy-Byrne, P. & Buchwald, D. 2011. Barriers and facilitators to walking and physical activity among American Indian elders. Preventing Chronic Dis-ease 8 (3), A63.
Sawyer, P. & Allman, R. M. 2010. Resilience in mobility in the context of chronic disease and aging: cross-sectional and prospective findings from the Uni-versity of Alabama at Birmingham (UAB) Study of Aging. In P. S. Fry & C. L. M. Keyes (Eds.) Frontiers of Resilient Aging: Life-strengths and wellness in late life.New York: Cambridge University Press, 310-339.
Schutzer, K. A. & Graves, B. S. 2004. Barriers and motivations to exercise in old-er adults. Preventive Medicine 39 (5), 1056-1061.
Shavers, V. L. 2007. Measurement of socioeconomic status in health disparities research. Journal of the National Medical Association 99 (9), 1013-1023.
Sheppard, K. D., Sawyer, P., Ritchie, C. S., Allman, R. M. & Brown, C. J. 2013. Life-Space Mobility Predicts Nursing Home Admission Over 6 Years. Jour-nal of Aging and Health 25 (6), 907-920.
Shumway-Cook, A., Patla, A. E., Stewart, A., Ferrucci, L., Ciol, M. A. & Gural-nik, J. M. 2002. Environmental demands associated with community mo-bility in older adults with and without mobility disabilities. Physical Ther-apy 82 (7), 670-681.
Simonsick, E. M., Guralnik, J. M., Volpato, S., Balfour, J. & Fried, L. P. 2005. Just get out the door! Importance of walking outside the home for maintaining mobility: findings from the women's health and aging study. Journal of the American Geriatrics Society 53 (2), 198-203.
Smith, W. C., Anderson, E., Salinas, D., Horvatek, R. & Baker, D. P. 2014. A me-ta-analysis of education effects on chronic disease: The causal dynamics of the Population Education Transition Curve. Social Science & Medicine 127, 29-40.
Sports Act Finland 1054/1998. Stalvey, B. T., Owsley, C., Sloane, M. E. & Ball, K. 1999. The Life Space Ques-
tionnaire: A Measure of the Extent of Mobility of Older Adults. Journal of Applied Gerontology 18 (4), 460-478.
Stathi, A., Gilbert, H., Fox, K. R., Coulson, J., Davis, M., for Exercise, Nutrition and Health Sciences, University,of Bristol & Thompson, J. L. 2012. Determi-nants of Neighborhood Activity of Adults Age 70 and Over: A Mixed-Methods Study. Journal of Aging & Physical Activity 20 (2), 148-170.

85
Steptoe, A., Hamer, M., Butcher, L., Lin, J., Brydon, L., Kivimäki, M., Marmot, M., Blackburn, E. & Erusalimsky, J. D. 2011. Educational attainment but not measures of current socioeconomic circumstances are associated with leu-kocyte telomere length in healthy older men and women. Brain, Behavior, and Immunity 25 (7), 1292-1298.
Sulander, T., Martelin, T., Sainio, P., Rahkonen, O., Nissinen, A. & Uutela, A. 2006. Trends and educational disparities in functional capacity among peo-ple aged 65–84 years. International Journal of Epidemiology 35 (5), 1255-1261.
Sumukadas, D., Witham, M., Struthers, A. & McMurdo, M. 2009. Day length and weather conditions profoundly affect physical activity levels in older functionally impaired people. Journal of Epidemiology and Community Health 63 (4), 305-309.
Talala, K., Härkänen, T., Martelin, T., Karvonen, S., Mäki-Opas, T., Mander-backa, K., Suvisaari, J., Sainio, P., Rissanen, H., Ruokolainen, O., Heloma, A. & Koskinen, S. 2014. Koulutusryhmien väliset terveys- ja hyvinvointierot edelleen suuria. Suomen lääkärilehti 69 (36), 2185-2192.
Taormina, R. J. & Gao, J. H. 2013. Maslow and the Motivation Hierarchy: Meas-uring Satisfaction of the Needs. The American Journal of Psychology 126 (2), 155-177.
Thompson, W. R., Gordon, N. F. & Pescatello, L. S. 2010. ACSM's Guidelines for Exercise Testing and Prescription. (Eight edition edition) Philadelphia, PA, Uniter States: American College of Sports Medicine.
Togo, F., Watanabe, E., Park, H., Shephard, R. J. & Aoyagi, Y. 2005. Meteorology and the physical activity of the elderly: the Nakanojo Study. International Journal of Biometeorology 50 (2), 83-89.
Tsai, L. T., Rantakokko, M., Portegijs, E., Viljanen, A., Saajanaho, M., Eronen, J. & Rantanen, T. 2013. Environmental mobility barriers and walking for er-rands among older people who live alone vs. with others. BMC Public Health 13, 1054-2458-13-1054.
Tu, W., Stump, T. E., Damush, T. M. & Clark, D. O. 2004. The effects of health and environment on exercise-class participation in older, urban women. Journal of Aging and Physical Activity 12 (4), 480-496.
Tucker-Seeley, R. D., Subramanian, S. V., Li, Y. & Sorensen, G. 2009. Neighbor-hood Safety, Socioeconomic Status, and Physical Activity in Older Adults. American Journal of Preventive Medicine 37 (3), 207-213.
Van Cauwenberg, J., Clarys, P., De Bourdeaudhuij, I., Van Holle, V., Verte, D., De Witte, N., De Donder, L., Buffel, T., Dury, S. & Deforche, B. 2013. Older adults' transportation walking: a cross-sectional study on the cumulative influence of physical environmental factors. International Journal of Health Geographics 12 (1), 37.
Van Cauwenberg, J., De Bourdeaudhuij, I., De Meester, F., Van Dyck, D., Salm-on, J., Clarys, P. & Deforche, B. 2011. Relationship between the physical en-vironment and physical activity in older adults: a systematic review. Health & Place 17 (2), 458-469.

86
Van Holle, V., Van Cauwenberg, J., Van Dyck, D., Deforche, B., Van, d. W. & De Bourdeaudhuij, I. 2014. Relationship between neighborhood walkability and older adults' physical activity: results from the Belgian Environmental Physical Activity Study in Seniors (BEPAS Seniors). International Journal of Behavioral Nutrition and Physical Activity 11 (1), 110.
Verbrugge, L. M. & Jette, A. M. 1994. The disablement process. Social Science & Medicine 38 (1), 1-14.
Wahl, H., Iwarsson, S. & Oswald, F. 2012. Aging Well and the Environment: Toward an Integrative Model and Research Agenda for the Future. The Gerontologist 52 (3), 306-316.
Wahl, H. & Weisman, G. D. 2003. Environmental Gerontology at the Beginning of the New Millennium: Reflections on Its Historical, Empirical, and Theo-retical Development. The Gerontologist 43 (5), 616-627.
Weiss, C. O., Wolff, J. L., Egleston, B., Seplaki, C. L. & Fried, L. P. 2012. Incident preclinical mobility disability (PCMD) increases future risk of new difficul-ty walking and reduction in walking activity. Archives of Gerontology and Geriatrics 54 (3), e329-e333.
Welmer, A. K., Kareholt, I., Rydwik, E., Angleman, S. & Wang, H. X. 2013. Edu-cation-related differences in physical performance after age 60: a cross-sectional study assessing variation by age, gender and occupation. BMC Public Health 13 (1), 641.
Werngren-Elgstrom, M., Carlsson, G. & Iwarsson, S. 2008. Changes in person-environmental fit and ADL dependence among older Swedish adults. A 10-year follow-up. Aging Clinical and Experimental Research 20 (5), 469-478.
White, D. K., Jette, A. M., Felson, D. T., Lavalley, M. P., Lewis, C. E., Torner, J. C., Nevitt, M. C. & Keysor, J. J. 2010. Are features of the neighborhood envi-ronment associated with disability in older adults? Disability and Rehabili-tation 32 (8), 639-645.
Whitehead, M. 1991. The concepts and principles of equity and health. Health Promotion International 6 (3), 217-228.
Willson, A. E. 2009. `Fundamental Causes' of Health Disparities: A Comparative Analysis of Canada and the United States. International Sociology 24 (1), 93-113.
Willson, A. E., Shuey, K. M. & Elder Jr., G. H. 2007. Cumulative Advantage Pro-cesses as Mechanisms of Inequality in Life Course Health. American Jour-nal of Sociology 112 (6), 1886-1924.
Wong, C. H., Wong, S. F., Pang, W. S., Azizah, M. Y. & Dass, M. J. 2003. Habitu-al walking and its correlation to better physical function: implications for prevention of physical disability in older persons. The Journals of Geron-tology.Series A, Biological Sciences and Medical Sciences 58 (6), 555-560.
Yen, I. H., Michael, Y. L. & Perdue, L. 2009. Neighborhood environment in stud-ies of health of older adults: a systematic review. American Journal of Pre-ventive Medicine 37 (5), 455-463.

ORIGINAL PUBLICATIONS I
BARRIERS TO OUTDOOR PHYSICAL ACTIVITY AND UNMET PHYSICAL ACTIVITY NEED IN OLDER ADULTS
by
Eronen J, von Bonsdorff M, Törmäkangas T, Rantakokko M, Portegijs E, Vilja-nen A, Rantanen T.
Preventive Medicine 2014, 67: 106-111.
Reproduced with kind permission by Elsevier.
II
ACCUMULATION OF DISPARITY IN PHYSICAL ACTIVITY IN OLD AGE
by
Eronen J, von Bonsdorff M, Rantakokko M, Rantanen T.
Aging Clinical and Experimental Research 2012; 24: 475–479.
Reproduced with kind permission of Springer Science and Business Media.
1
Accumulation of disparity in physical activity in old age
Running Head: Disparity in Physical Activity Johanna Eronen, Mikaela von Bonsdorff, Merja Rantakokko, Taina Rantanen
Department of Health Sciences, Gerontology Research Center, University of Jyväskylä Key words: aging, cross-sectional, mobility limitations, socioeconomic status, social support
Corresponding author:
Johanna Eronen
Gerontology Research Centre
P.O. Box 35 (Viveca)
FI-40014 University of Jyväskylä
Finland
Tel: +358 40 805 3550
Fax: +358 14 260 2001
e-mail: [email protected]
2 Abstract
Background and aims: The level of physical activity often declines in old age, although many older
people would like to be more active than what they are capable of. This leads to unmet physical activity
need, the feeling that one’s level of physical activity is inadequate, which is a manifestation of disparity
in physical activity in old age. The accumulation of risk factors, including mobility limitations, low
socioeconomic status (SES) and lack of social support may increase disparity in physical activity. The
aim of this study was to investigate how the accumulation of risk factors is associated with unmet
physical activity need in older community-living people. Methods: The study was based on cross-
sectional analyses of an observational study with 632 participants. Unmet physical activity need,
socioeconomic status, mobility limitations and availability of social support were self-reported by
standardized questionnaires. Results: Having mobility limitations increased the risk of unmet physical
activity need almost four-fold compared to those with no mobility limitations; having mobility
limitations and either low SES or not having social support increased the risk over four-fold and having
mobility limitations, low SES and no social support further increased the risk over seven-fold.
Conclusions: We found that accumulation of risk factors increases disparity in physical activity.
3 Introduction
In the field of health studies, disparity has been defined as inequality (1) or as a quantity that separates
a group from a specified reference on a particular measure (2). Disparity has been often studied in
social and health sciences but has thus far not gained attention in physical activity research. Physical
activity is one of the basic human needs, but in old age it is also a way to retain autonomy, to carry out
social and personal roles and to maintain health. As people age, their level of physical activity often
declines and the number of people who meet the physical activity recommendations decreases (3).
However, many community-living older people would like to increase their level of physical activity
and be more active. Willingness to participate in physical activity can be overridden by limitations in
mobility or increasing difficulties in accessing exercise facilities or even outdoors (4). From a previous
study we know that many older people report unmet physical activity need, the feeling that one’s level
of physical activity is inadequate (5). Unmet physical activity need is more common among people
with fear of moving outdoors, environmental barriers to outdoor mobility, musculoskeletal diseases,
depressive symptoms and mobility limitations than among those without these risk factors (5).
Mobility declines with age. Mobility limitations, such as difficulties in walking, often result in
decreased physical activity, and may thus lead to further functional decline (6). In older people with
mobility limitations, even small amounts of physical activity, such as short walks have been shown to
be beneficial in order to prevent further mobility loss (7). Another important determinant of physical
activity in old age is socioeconomic status (SES). Differences in SES of older people may create
disparity that can reflect into various aspects of life. Sedentary lifestyle is more common in people with
low SES (8). Low SES is also associated with chronic musculoskeletal complaints (9), limited ability to
walk a quarter of a mile (6), difficulties in climbing up stairs (10), lower likelihood of meeting the
4 physical activity recommendations (3) and an increased risk of mobility decline in chronically ill
people (11). In addition to low SES and mobility limitations, lack of social support i.e. loneliness and
lack of a confidant, such as a spouse or a friend, may also reduce the probability of engaging in
physical activity in old age (12).
In this study the term disparity is used to describe the unequal opportunities to engage in physical
activities which are manifested as unmet physical activity need. Accumulation of disparity in physical
activity refers to a situation in which older people may have unequal opportunities to participate in
physical activity, due to clustering of poor SES, limitations in mobility and lack of social support. The
aim of this study is to investigate the association of accumulation of these risk factors with unmet
physical activity need in older community-living people. In addition, we studied the associations of co-
existing risk factors on unmet need for physical activity among older people.
5 Materials and methods
Design
The study was based on cross-sectional analyses of the observational study entitled “Screening and
Counseling for Physical Activity and Mobility” (SCAMOB) (ISRCTN 07330512). The SCAMOB
study was a project investigating the effects of physical activity counseling in community-living older
people in Finland and the details of the project are described elsewhere (13).
Study population
The target population included all 75-81-year-old persons living in a certain health care district area in
Jyväskylä city centre in 2003 (N=1310). After a four-phased screening process, there were 632
participants in the cross-sectional analysis of whom 629 had provided information on the questions
concerning unmet physical activity need. To be eligible for the study the participants had to be able to
walk 500 meters without assistance, be only moderately active or sedentary, have no severe cognitive
impairment i.e. Mini-Mental State Examination score over 21 (14), no medical contraindications for
physical activity and sign an informed consent to participate. The Ethical Committee of the Central
Finland Central Hospital approved the SCAMOB project.
Measurements
The risk factors included mobility limitations, low SES and lack of social support. Mobility limitations
were assessed by asking the participants about their perceived difficulties in walking 2 km and
climbing up 1 flight of stairs with a structured questionnaire. The questions were “Do you have
difficulty in walking 2 km?” and “Do you have difficulties in climbing up 1 flight of stairs?” and the
6 response options for both questions were 1) I am able to manage without difficulties, 2) I am able to
manage with some difficulty, 3) I am able to manage with great deal of difficulty, 4) I am able to
manage only with help of another person, or 5) I am unable to manage even with help. For the analyses,
the options were dichotomized as no or some difficulties (1-2) and a great deal of difficulties (3-5).
Those with a great deal of difficulty in walking 2 km or climbing stairs, or both, were rated as having
mobility limitations (4).
SES was categorized based on the highest level of education and long-term occupation. A dichotomous
variable for SES was created in the following way. People were categorized as having low SES if they
had gone through less than secondary school education and had worked as untrained workers or
farmers or had been housewives. Trained workers and entrepreneurs were also included in the low SES
group if they had only elementary education. High SES group consisted of people who had gone
through secondary or higher education or who had held a managerial position. In addition, trained
workers with more than elementary education were included in this group.
The availability of social support was assessed by asking whether the participants had someone to talk
to whenever they wanted. The response options were 1) nearly always, 2) fairly often, 3) occasionally,
and 4) not at all. For the analyses, the responses were dichotomized as nearly always or fairly often (1-
2) and occasionally or not at all (3-4).
The outcome measure of this study was unmet physical activity need, which indicates disparity in
physical activity. Unmet physical activity need was studied by asking the participants the following
two questions: “Do you feel that you would have the opportunity to increase your level of physical
activity if someone recommended you to do so?” and “Would you like to increase your level of
7 physical activity?” with response options of yes and no. The dichotomous outcome variable was
created by defining persons who felt that they had no opportunity to engage in physical activity but
were willing to increase their physical activity level as experiencing unmet physical activity need (5).
Physical inactivity was assessed by a standardized question which was modified from the classification
of physical activity among elderly people by Grimby (15). The question included seven alternative
responses: mainly resting or only minimal physical activity, most activities performed sitting down,
light physical activity, moderate physical activity about 3 h a week, moderate physical activity at least
4 h a week or heavy physical activity a week, physical exercise several times a week or heavy leisure
time working at least 3 h a week and competitive sports several times a week. As part of the study
design (13), those in the three highest categories of physical activity were excluded from the study. Of
the four remaining physical activity categories, those participants who belong to the three lowest
categories (most activities performed sitting down, light physical activity or moderate physical activity
about 3 h a week) were categorized as physically inactive (16).
Background characteristics included age, living arrangements (alone or with someone), presence of
lung, cardiovascular and musculoskeletal diseases, and the number of prescription medications checked
during the home interview.
Statistical Analysis
Characteristics of the participants were described by using means and standard deviations or
percentages. Differences between older people with and without unmet physical activity need were
analyzed using chi-square tests for categorical variables and t-tests for continuous variables. Logistic
8 regression analysis was used for identifying factors associated with unmet physical activity need.
Associations were adjusted for age and sex.
To study the associations of co-existing risk factors on unmet physical activity need, four exclusive
groups were formed on the basis of mobility, SES and the presence of social support: 1) no mobility
limitations (the reference group); 2) mobility limitations, but no other risk factors, 3) mobility
limitations and either low SES or lack of social support; 4) mobility limitations, low SES and lack of
social support.
All tests were performed two-tailed and the level of significance was set at p<0.05. Analyses were
carried out with PASW statistics (SPSS version) 18.

9 Results
The mean age of the participants (n=629) was 77.6 ± 1.9 years and 75% of them were women. 13% of
participants were categorized as experiencing unmet physical activity need. Table 1 presents the
differences in descriptive characteristics for those with and without unmet physical activity need.
Participants with unmet physical activity need had more often musculoskeletal diseases (69.1% vs.
49.2%, p=0.001) and used more prescription medication (5.72 vs. 3.83, p<0,001) than participants
without unmet physical activity need. There were no statistically significant differences in SES
between the groups. People with unmet physical activity need reported more often lack of social
support (26.8% vs. 18.3%, p<0.071) even though they less frequently were living alone (47.9% vs.
59.6%, p<0.039). People with unmet physical activity need were more often physically inactive (40.2%
vs. 23.2%, p<0.001).
The associations of risk factors with unmet physical activity need, adjusted for age and sex, are
presented in Table 2. Having mobility limitations increased the risk for unmet physical activity need
OR 4.52 (95% confidence interval (CI) 2.73-7.48). The associations of low SES OR 1.26 (95% CI
0.79-2.00) or lack of social support OR 1.58 (95% CI 0.92-2.71) did not reach statistical significance.
The associations of co-existing risk factors, including mobility limitations, low SES and lack of social
support with unmet physical activity need is presented in Table 3. The model is adjusted for age and
sex. Compared to those with no mobility difficulties (referent), having mobility limitations but no other
risk factors increased the risk of unmet physical activity need OR 3.86 (95% CI 1.86-8.03), having
mobility limitations and either low SES or lack of social support increased the risk OR 4.11 (95% CI

10 2.09-8.09) and having mobility limitations, low SES and lack of social support further increased the
risk OR 7.10 (95% CI 2.71-18.57).

11 Discussion
In this study we showed that the accumulation of risk factors, including mobility limitations, low SES
and lack of social support, increased significantly the risk of unmet physical activity need. In our study,
people with mobility limitations and but no other risk factors had an almost four times higher risk for
unmet physical activity need compared with people with no mobility limitations. In older people with
mobility limitations and one risk factor (either low SES or lack of social support) the risk was over
four-fold. The risk of unmet physical activity need was over 7-fold among people who reported
mobility limitations, low SES and lack of social support.
Unmet physical activity need, defined as the feeling that one’s level of physical activity is inadequate
(5) is an issue that has been recently brought into the scientific discussion and is therefore relatively
unknown. In our previous study, we found that unmet physical activity need is common among old
home-dwelling people who also report mobility limitations and barriers in their near environment (5).
The present study expanded the earlier findings showing that clustering of other risk factors in addition
to mobility limitations greatly increases the risk of unmet physical activity need. The accumulation of
risk factors seems to create disparity that is manifested as increased risk for unmet physical activity
need in those older people with the most disadvantages.
It is possible that these results are due to the fact that older people with deteriorating mobility and good
SES possess resources that alleviate the problems in participating in physical activity. These may be
not only the material resources needed for being physically active and exercising, but also the resources
for and knowledge about a healthy lifestyle (17). The older people who in this study reported unmet
physical activity need also reported lack of social support more often than people without unmet

12 physical activity need. It is possible that lack of social support results in unmet physical activity need as
people who receive less encouragement for physical activity become less physically active. However, it
is plausible that a situation leading to unmet physical activity may also result in reduced availability of
social support. People who have difficulties exiting their homes unavoidably experience a reduction in
their social contacts as well. Our findings are consistent with earlier studies showing that social support
has an important role in the physical activity of older people (18) and that lack of company is more
likely a barrier to physical activity in people with more severe mobility limitations compared to people
with no mobility limitations (4).
In the current study, one out of five of physically inactive people experienced unmet physical activity
need. This indicates that physical inactivity and unmet physical activity need correlate with each other
but do not completely overlap. In our previous study we suggested that unmet physical activity need
may be transient. It may be experienced for some time, but after a while people may adapt to their new
level of lower physical activity and the feeling can disappear (5). Older people, who report unmet
physical activity need, represent a potential target group for physical activity interventions as long as
the interventions are tailored to meet their resources for participation. People with pre-clinical or
manifest mobility limitations probably need interventions which include intensive encouragement and
social support and some form of compensatory approach (such as help from a volunteer worker or
transportation) to enable them to participate in physical activities (16). It should also be taken into
account that availability of inexpensive exercise forms may facilitate participation particularly among
older people with low SES.
13 Study strengths and limitations
The strength of this study is the large population-based sample. The study was limited by the study
sample being a truncated sample of older people living in a city center area. People who were unable to
walk at least 0.5 km were excluded from the study, thus excluding people with the most limited
mobility and also probably the lowest number of social contacts and the lowest physical activity levels.
Therefore, the number of old people who experience unmet physical activity need may be
underestimated. Measures of physical activity were self-reported as no data on objective measurements
such as accelerometers were available. Another limitation of this study is the cross-sectional design
which doesn’t allow interpretation of the temporal order of mobility limitations, lack of social support
and unmet physical activity need. The data collection for this study was performed between April and
June, thus the results do not take into account the possible role of winter conditions in a Nordic country.

14 Conclusions
We found that accumulation of certain disadvantages increases the disparity in physical activity
manifested as unmet physical activity need. This study addressed unmet physical activity need, which
has been recently introduced but so far only little studied. We provide a novel approach into research
on physical activity and aging by emphasizing people’s own views about the adequacy of their present
level of physical activity instead of addressing whether people meet the physical activity
recommendations or not.
Unmet physical activity need should be studied more broadly across diverse populations including
older people who are unable to get out of their homes independently due to mobility limitations. In
addition, research on the temporal occurrence of the risk factors, such as lack of social support and
mobility limitations, is needed to better understand the process leading to unmet physical activity need,
and to find ways to prevent it.

15 References
1. Carter-Pokras O, Baquet C. What is a "health disparity"? Public Health Rep 2002; 117: 426-34.
2. Keppel K, Pamuk E, Lynch J, Carter-Pokras O, Kim I, Mays V, Pearcy J, Schoenbach V, Weissman JS. Methodological issues in measuring health disparities. Vital Health Stat 2005; 2 (141): 1-16.
3. Ashe MC, Miller WC, Eng JJ, Noreau L, Physical Activity and Chronic Conditions Research Team. Older adults, chronic disease and leisure-time physical activity. Gerontology 2009; 55: 64-72.
4. Rasinaho M, Hirvensalo M, Leinonen R, Lintunen T, Rantanen T. Motives for and barriers to physical activity among older adults with mobility limitations. J Aging Phys Act 2007; 15: 90-102.
5. Rantakokko M, Iwarsson S, Hirvensalo M, Leinonen R, Heikkinen E, Rantanen T. Unmet physical activity need in old age. J Am Geriatr Soc 2010; 58: 707-12.
6. Hardy SE, Kang Y, Studenski SA, Degenholtz HB. Ability to walk 1/4 mile predicts subsequent disability, mortality, and health care costs. J Gen Intern Med 2011; 26: 130-5.
7. Simonsick EM, Guralnik JM, Volpato S, Balfour J, Fried LP. Just get out the door! Importance of walking outside the home for maintaining mobility: Findings from the women's health and aging study. J Am Geriatr Soc 2005; 53: 198-203.
8. Adler NE, Newman K. Socioeconomic disparities in health: Pathways and policies. Health Aff 2002; 21: 60-76.
9. Hagen K, Zwart JA, Svebak S, Bovim G, Jacob Stovner L. Low socioeconomic status is associated with chronic musculoskeletal complaints among 46,901 adults in Norway. Scand J Public Health 2005; 33: 268-75.
10. Rautio N, Adamson J, Heikkinen E, Ebrahim S. Associations of socio-economic position and disability among older women in Britain and Jyvaskyla, Finland. Arch Gerontol Geriatr 2006; 42: 141-55.
11. Koster A, Bosma H, van Lenthe FJ, Kempen GI, Mackenbach JP, van Eijk JT. The role of psychosocial factors in explaining socio-economic differences in mobility decline in a chronically ill population: Results from the GLOBE study. Soc Sci Med 2005; 61: 123-32.
12. Hawkley LC, Thisted RA, Cacioppo JT. Loneliness predicts reduced physical activity: Cross-sectional & longitudinal analyses. Health Psychol 2009; 28: 354-63.
13. Leinonen R, Heikkinen E, Hirvensalo M et al. Customer-oriented counseling for physical activity in older people: Study protocol and selected baseline results of a randomized-controlled trial (ISRCTN 07330512). Scand J Med Sci Sports 2007; 17: 156-64.
14. Folstein MF, Folstein SE, McHugh PR. "Mini-mental state". A practical method for grading the cognitive state of patients for the clinician. J Psychiatr Res 1975; 12: 189-98.

16 15. Grimby G. Physical activity and muscle training in the elderly. Acta Med Scand Suppl 1986; 711: 233-7.
16. Rasinaho M, Hirvensalo M, Tormakangas T, Leinonen R, Lintunen T, Rantanen T. Effect of physical activity counseling on physical activity of older people in Finland (ISRCTN 07330512). Health Promot Int 2011, doi:10.1093/heapro/dar057.
17. Willson AE, Shuey KM, Elder Jr. GH. Cumulative advantage processes as mechanisms of inequality in life course health. American Journal of Sociology 2007; 112: 1886-924.
18. Carlson JA, Sallis JF, Conway TL, Saelens BE, Frank LD, Kerr J, Cain KL, King AC. Interactions between psychosocial and built environment factors in explaining older adults' physical activity. Prev Med 2011, doi:10.1016/j.ypmed.2011.10.004
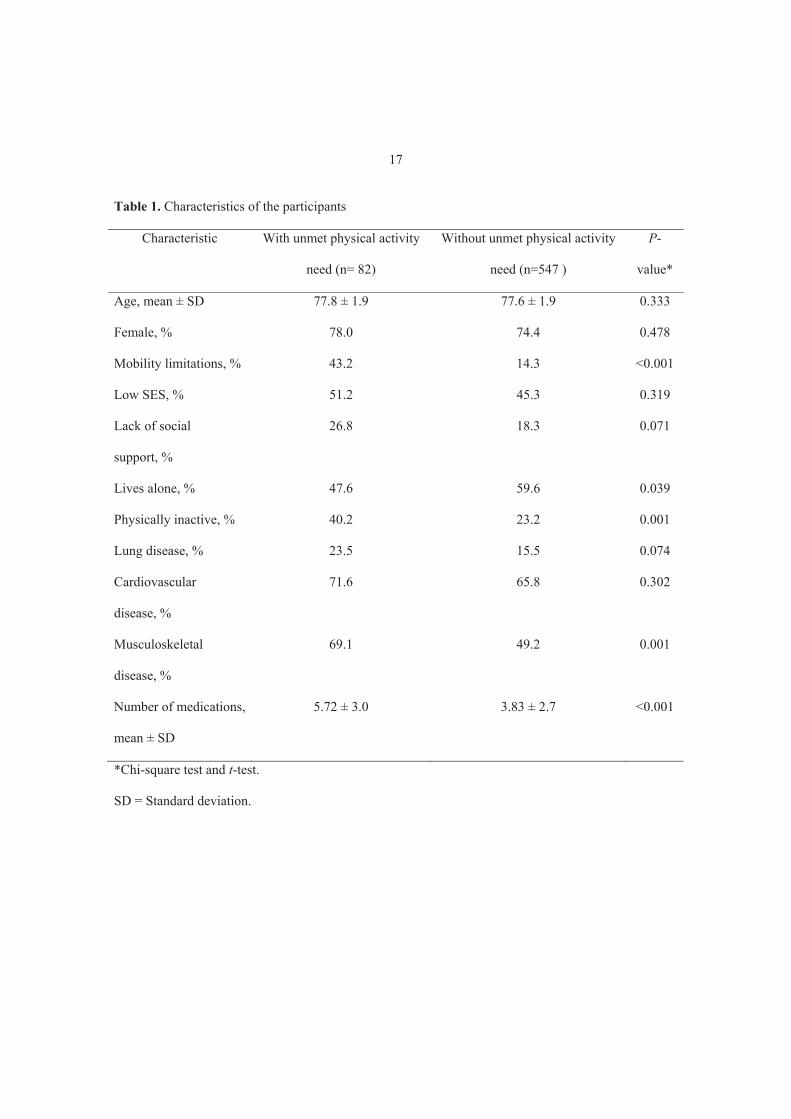
17 Table 1. Characteristics of the participants
Characteristic With unmet physical activity
need (n= 82)
Without unmet physical activity
need (n=547 )
P-
value*
Age, mean ± SD 77.8 ± 1.9 77.6 ± 1.9 0.333
Female, % 78.0 74.4 0.478
Mobility limitations, % 43.2 14.3 <0.001
Low SES, % 51.2 45.3 0.319
Lack of social
support, %
26.8 18.3 0.071
Lives alone, % 47.6 59.6 0.039
Physically inactive, % 40.2 23.2 0.001
Lung disease, % 23.5 15.5 0.074
Cardiovascular
disease, %
71.6 65.8 0.302
Musculoskeletal
disease, %
69.1 49.2 0.001
Number of medications,
mean ± SD
5.72 ± 3.0 3.83 ± 2.7 <0.001
*Chi-square test and t-test.
SD = Standard deviation.
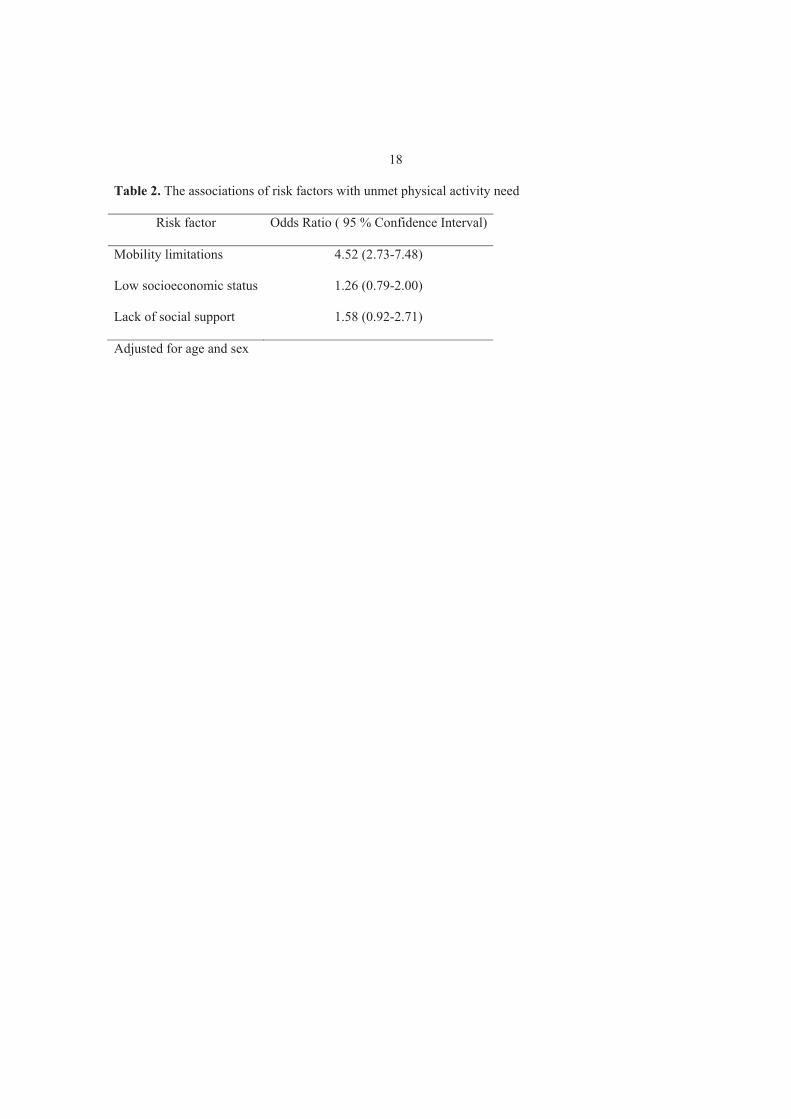
18 Table 2. The associations of risk factors with unmet physical activity need
Risk factor Odds Ratio ( 95 % Confidence Interval)
Mobility limitations 4.52 (2.73-7.48)
Low socioeconomic status 1.26 (0.79-2.00)
Lack of social support 1.58 (0.92-2.71)
Adjusted for age and sex

19 Table 3. Risk of unmet physical activity need among people with mobility limitations and other co-
existing risk factors compared to people with no mobility limitations
Adjusted for age and sex
*Either low socioeconomic status or lack of social support
++ Low socioeconomic status and lack of social support
Variable Number of
participants
Odds Ratio
(95 % Confidence Interval)
No mobility limitations 513 1
Mobility limitations but no other risk
factors
43 3.86 (1.86-8.03)
Mobility limitations and one other risk
factor*
51 4.11 (2.09-8.09)
Mobility limitations and two other risk
factors++
19 7.10 (2.71-18.57)

III
ENVIRONMENTAL FACILITATORS FOR OUTDOOR WALKING AND DEVELOPMENT OF WALKING
DIFFICULTIES IN COMMUNITY-DWELLING OLDER ADULTS
by
Eronen J, von Bonsdorff M, Rantakokko M, Rantanen T.
European Journal of Aging 2013; 11: 67-75.
Reproduced with kind permission from Springer Science and Business Media.

IV
SOCIOECONOMIC DISPARITIES IN LIFE-SPACE MOBILITY IN OLD AGE.
by
Eronen J, von Bonsdorff M, Rantakokko M, Portegijs E, Viljanen A, Rantanen T.
Submitted for publication.


