Taylor’s checkerspot butterfly 1 Progress Report – Institute for Applied Ecology Dispersal behavior and habitat variation of Taylor’s checkerspot butterfly Progress Report 30 July 2011 Thomas N. Kaye Amanda G. Stanley Dana Ross Institute for Applied Ecology Funded jointly by US Fish & Wildlife Service, Lacey, Washington and Portland, Oregon and Institute for Applied Ecology, Corvallis, Oregon
Transcript
Taylor’s checkerspot butterfly 1 Progress Report – Institute for Applied Ecology
Dispersal behavior and habitat variation of Taylor’s checkerspot butterfly
Progress Report 30 July 2011 Thomas N. Kaye Amanda G. Stanley Dana Ross Institute for Applied Ecology Funded jointly by US Fish & Wildlife Service, Lacey, Washington and Portland, Oregon and Institute for Applied Ecology, Corvallis, Oregon
Taylor’s checkerspot butterfly 2 Progress Report – Institute for Applied Ecology
PREFACE
This report is the result of a cost share project between the Institute for Applied Ecology (IAE) and a federal agency. IAE is a nonprofit organization dedicated to natural resource conservation, restoration, research, and education. Our aim is to provide a service to public and private agencies and individuals by developing and communicating information on ecosys‐tems, species, and effective management strategies and by conducting research, monitoring, and experiments. IAE offers educational opportunities through 3‐4 month internships. Questions regarding this report or IAE should be directed to: Thomas N. Kaye Institute for Applied Ecology PO Box 2855 Corvallis, OR 97339‐2855 phone: 541‐753‐3099, ext. 11 fax: 541‐753‐3098 e‐mail: [email protected]
ACKNOWLEDGMENTS
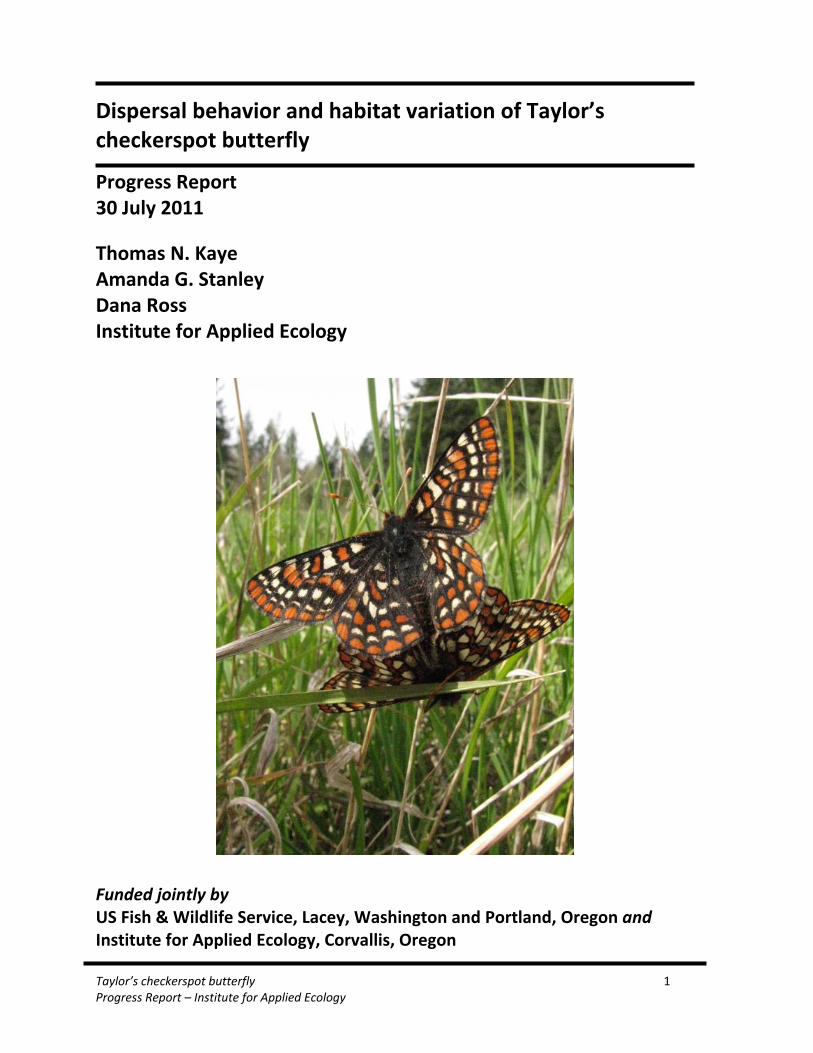
We are grateful to several individuals and organizations for helping with this project. Al Kitzman from Benton County Natural Areas and Parks Department provided permits and access to Beazell Memorial Forest and the Cardwell Hill sites. Mary Linders, Ann Potter and Dave Hays of Washington Department of Fish and Wildlife all generously shared their expertise with us and assisted with site access and permits, as did Rod Gilbert of Joint Base Lewis‐McChord. Karen Holtrop, Jennifer Fujii, and Dean Yoshina of Hood Canal Ranger District, Olympic National Forest provided permits and access to sites on the Olympic Peninsula. Victoria Bennett of Oregon State University kindly shared her behavioral observation and marking protocols and data with us. Nick Page of Raincoast Applied Ecology contributed site and vegetation data from Denman Island in British Columbia. Finally, Ted Thomas of the US Fish and Wildlife Service provided invaluable support and funding for this project. Cover photo: Taylor’s checkerspots at Beazell Memorial Forest, Benton County, Oregon. Photo by T.N. Kaye.
Please cite this report as: Kaye, T. N., A. G. Stanley, and Dana Ross. 2011. Dispersal behavior and habitat selection of Taylor’s checkerspot butterfly. Progress report. Institute for Applied Ecology, Corvallis, Oregon and US Fish and Wildlife Service, Lacey, Washington.
Taylor’s checkerspot butterfly 3 Progress Report – Institute for Applied Ecology
TABLE OF CONTENTS Preface 2 Acknowledgments 2 Table of contents 3 Introduction 4 Dispersal Behavior of Taylor’s Checkerspot Butterfly 6
Summary 24 Literature cited 25 Appendix A. Nectar and Larval Host Species Found in Vegetation Surveys 26
Taylor’s checkerspot butterfly 4 Progress Report – Institute for Applied Ecology
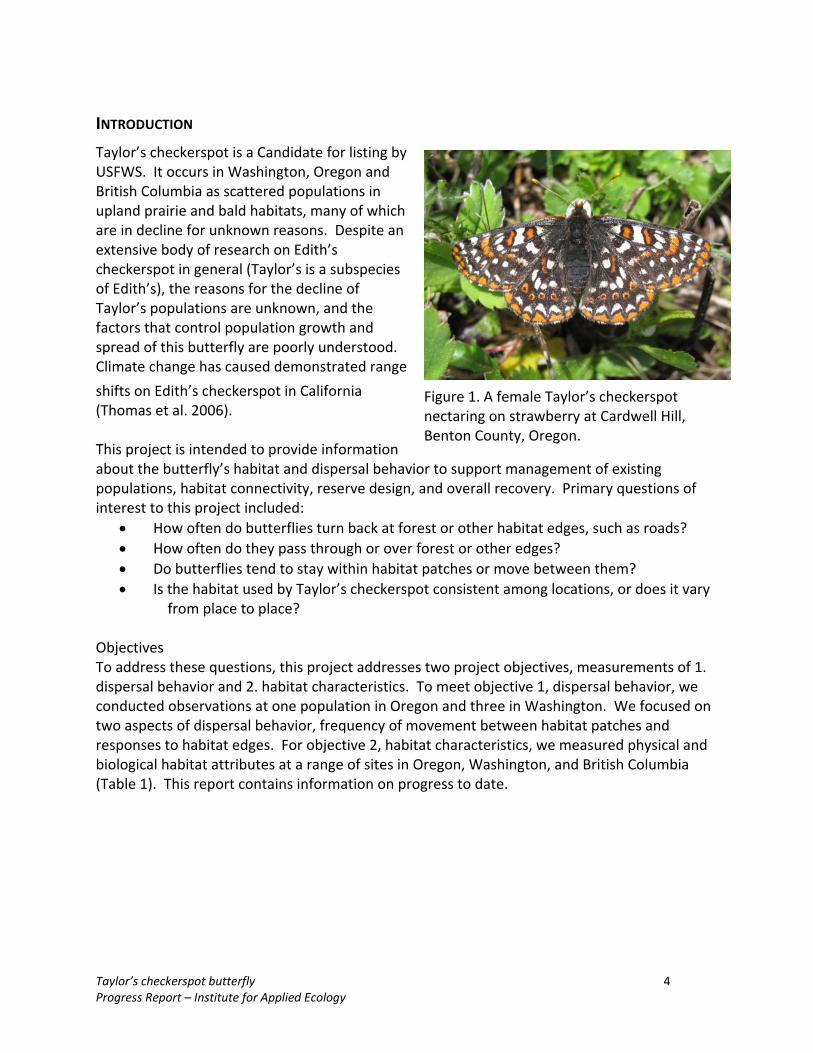
INTRODUCTION Taylor’s checkerspot is a Candidate for listing by USFWS. It occurs in Washington, Oregon and British Columbia as scattered populations in upland prairie and bald habitats, many of which are in decline for unknown reasons. Despite an extensive body of research on Edith’s checkerspot in general (Taylor’s is a subspecies of Edith’s), the reasons for the decline of Taylor’s populations are unknown, and the factors that control population growth and spread of this butterfly are poorly understood. Climate change has caused demonstrated range shifts on Edith’s checkerspot in California (Thomas et al. 2006). This project is intended to provide information about the butterfly’s habitat and dispersal behavior to support management of existing populations, habitat connectivity, reserve design, and overall recovery. Primary questions of interest to this project included:
• How often do butterflies turn back at forest or other habitat edges, such as roads? • How often do they pass through or over forest or other edges? • Do butterflies tend to stay within habitat patches or move between them? • Is the habitat used by Taylor’s checkerspot consistent among locations, or does it vary
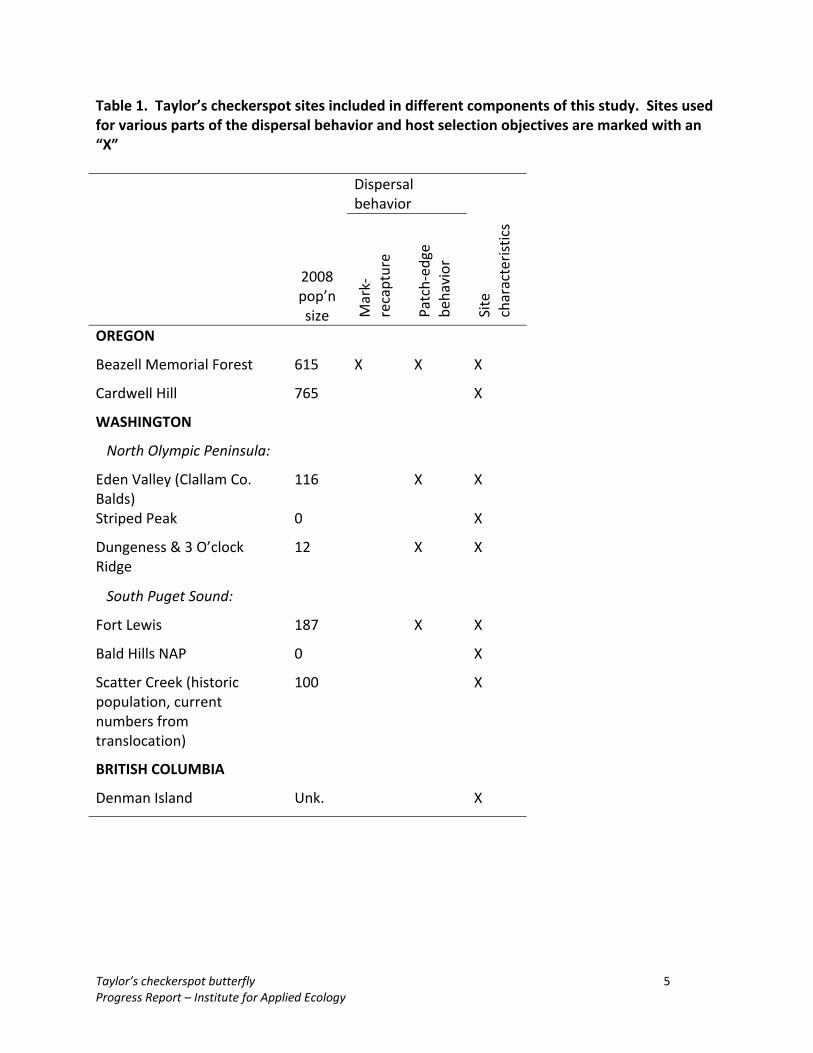
from place to place? Objectives To address these questions, this project addresses two project objectives, measurements of 1. dispersal behavior and 2. habitat characteristics. To meet objective 1, dispersal behavior, we conducted observations at one population in Oregon and three in Washington. We focused on two aspects of dispersal behavior, frequency of movement between habitat patches and responses to habitat edges. For objective 2, habitat characteristics, we measured physical and biological habitat attributes at a range of sites in Oregon, Washington, and British Columbia (Table 1). This report contains information on progress to date.
Figure 1. A female Taylor’s checkerspot nectaring on strawberry at Cardwell Hill, Benton County, Oregon.
Taylor’s checkerspot butterfly 5 Progress Report – Institute for Applied Ecology
Table 1. Taylor’s checkerspot sites included in different components of this study. Sites used for various parts of the dispersal behavior and host selection objectives are marked with an “X”
2008 pop’n size
Dispersal behavior
Mark‐
recapture
Patch‐ed
ge
behavior
Site
characteristics
OREGON
Beazell Memorial Forest 615 X X X
Cardwell Hill 765 X
WASHINGTON
North Olympic Peninsula:
Eden Valley (Clallam Co. Balds)
116 X X
Striped Peak 0 X
Dungeness & 3 O’clock Ridge
12 X X
South Puget Sound:
Fort Lewis 187 X X
Bald Hills NAP 0 X
Scatter Creek (historic population, current numbers from translocation)
100 X
BRITISH COLUMBIA
Denman Island Unk. X
Taylor’s checkerspot butterfly 6 Progress Report – Institute for Applied Ecology
DISPERSAL BEHAVIOR OF TAYLOR’S CHECKERSPOT BUTTERFLY
Methods
Edge behavior To determine whether habitat edges create barriers for Taylor’s checkerspot dispersal, we used direct observations of butterfly movements at a variety of habitat edges at sites in Oregon and Washington. At Beazell Memorial Forest in Oregon and three Washington sites (Fort Lewis, Eden Valley, and Dungeness). All field work was conducted in April and May of 2010. We used field methods similar to Kuefler and Haddad (2006) and specifically implemented for Taylor’s checkerspot with guidance from Dr. Victoria Bennett. We categorized edges into four main types (Figures 3‐5):
1. Forest – typically a boundary of a meadow marked by trees, mostly Douglas‐firs that were 20‐30 m in height. These observations were made in Oregon at various meadows at Beazell Memorial Forest, and in Washington on the Olympic Peninsula at Eden Valley and Upper Dungeness.
2. Road – unpaved tracks through prairies at Fort Lewis, Washington. 3. Shrub – patches of shrubby vegetation, generally without nectar or host plant resources,
that border prairie habitat. This was observed at Fort Lewis in Washington. 4. Slope break – a substantial change in slope in a prairie. This was present at Beazell
Memorial Forest in Oregon where the South meadow dropped steeply then became flat. Forest edges (Figure 3) were of particular interest at Beazell Memorial Forest, Eden Valley, and Olympic Peninsula sites because they represent the primary edge‐type at those sites. At each edge type, we established a 3 m by 10 m belt‐plot parallel to and adjacent to edge (Figures 4 and 5). At each belt‐plot we stationed a single observer and recorded butterfly behavior when individuals entered the box. We scored butterflies as successful if they passed over the habitat edge and unsuccessful if they turned back without crossing the edge. Weather conditions varied during these observations and due to butterfly responses to climatic conditions (primarily temperature) we were able to record observations only during sunny weather. Poor weather conditions prevailed during many of our observation periods, limiting the number of observations we were able to record. To test if the frequency of crossing habitat edges differed among edge types, we used χ2 tests to compare all edges, and to compare forest edges with all other types combined. We estimated the 95% confidence intervals for frequency of successful crossing at each edge type with a normal approximation of a binomial distribution.
Patch dispersal rates To measure dispersal rates of Taylor’s checkerspots between habitat patches, we conducted capture‐mark‐recapture procedures in a network of meadows at Beazell Memorial Forest in
Taylor’s checkerspot butterfly 7 Progress Report – Institute for Applied Ecology
Benton County, Oregon (Figure 7). Mark‐recapture procedures are often used to estimate population sizes, but used them to determine frequency of between‐patch movements and estimate distance individuals travel (e.g., Haddad 1998). Seven of the meadows at this site are occupied by populations of Taylor’s checkerspots. The meadows varied in population size of Taylor’s checkerspot and in habitat area (Table 3). Some of the meadows were adjacent to one another with little or no barrier to movement while others are completely surrounded by forest. This diversity of isolation made for a useful landscape to measure dispersal rates among habitat patches of various separation distances and sizes. We marked individuals in four meadows, North, Middle, Summit Ridge and Lower New. Marking was accomplished by capturing butterflies with a net, placing them in shade, gently opening their wings, and drawing on a wing portion with a soft‐tipped, metallic‐ink pen. Different wings (left forewing, left hindwing, etc.) were used for marking in different meadows to improve accuracy of identification if the re‐sighted insect could not actually be netted. We compared different methods before selecting this one on the basis that the butterflies could be handled briefly (1‐2 minutes) and gently, and appeared to recover immediately after handling. Our observations confirmed that they returned to whatever activity they were engaged in prior to capture (basking, chasing, nectaring, etc) within moments of release. Marking was conducted over a period of 20 days from 13 April 2010 to 2 May 2010, beginning as soon as males began to emerge for the season. Recaptures and resightings were conducted in all meadows immediately after the first individuals were marked through 16 May, when the butterfly season was nearly done and no more marked butterflies were observed. We focused recapture resources on individuals that clearly moved between meadows, rather than on individuals in the same meadow where they were marked, to maximize the accuracy of our estimates of dispersal. We marked only males to minimize any unintended impacts to the populations. Males emerged earlier in the season and were more active, in general, than females. We avoided marking females to avoid damage or mortality to them. By marking males only, our resulting estimates of dispersal may be higher than the population on average and for females in particular, since females appear to be more sedentary and slower flyers early in the season (and soon after they eclose), possibly because they are heavy with eggs. Even so, females appear to be capable of very strong flight later in the season and our observations are that they may disperse more often as the season progresses. Dispersal rates were calculated as the frequency of butterfly movement between meadows where butterflies were marked and where they were recaptured. We measured the straight‐line distance between meadow centers with the ruler tool in Google Earth. We used linear regression to determine if dispersal rate was correlated with distance between meadows.
Taylor’s checkerspot butterfly 8 Progress Report – Institute for Applied Ecology
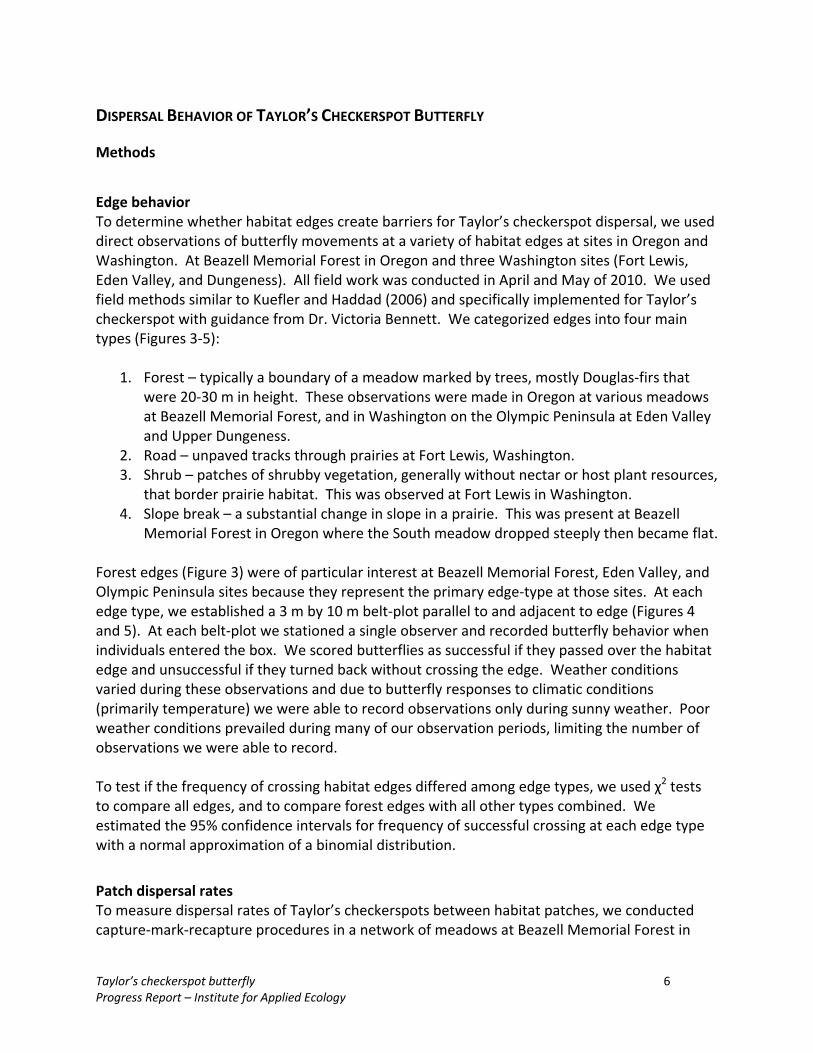
Figure 2. A typical forest edge at Beazell Memorial Forest (North meadow).
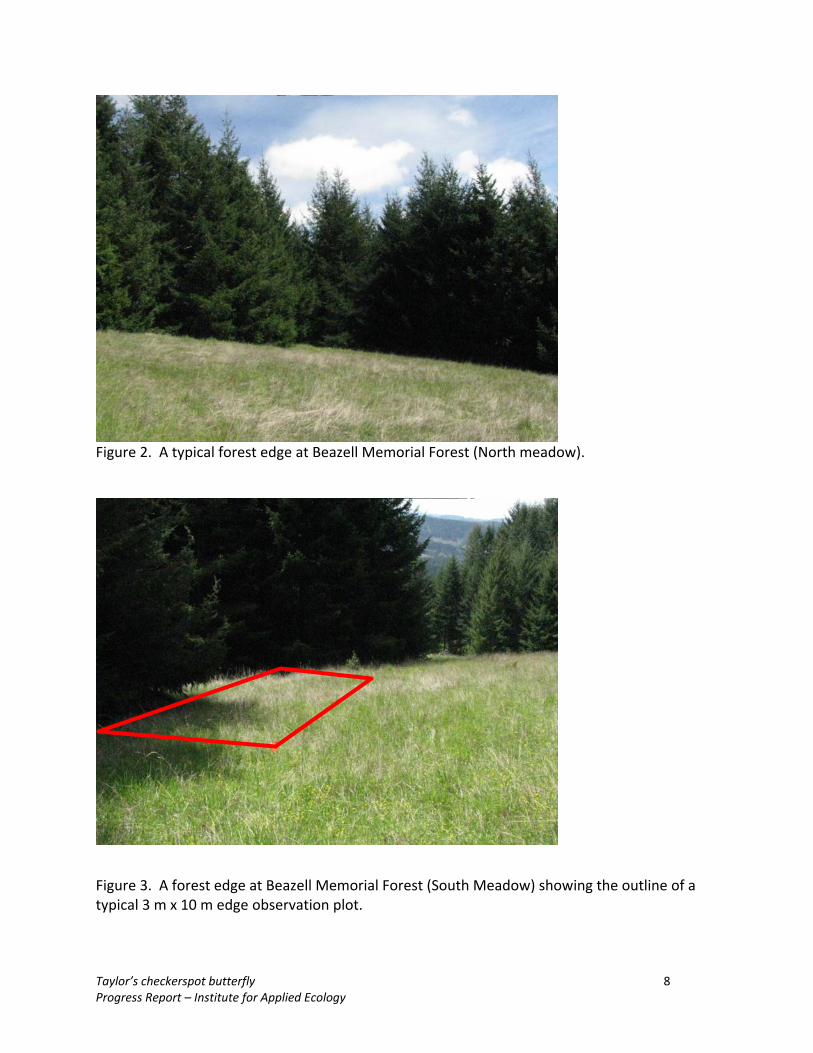
Figure 3. A forest edge at Beazell Memorial Forest (South Meadow) showing the outline of a typical 3 m x 10 m edge observation plot.
Taylor’s checkerspot butterfly 9 Progress Report – Institute for Applied Ecology
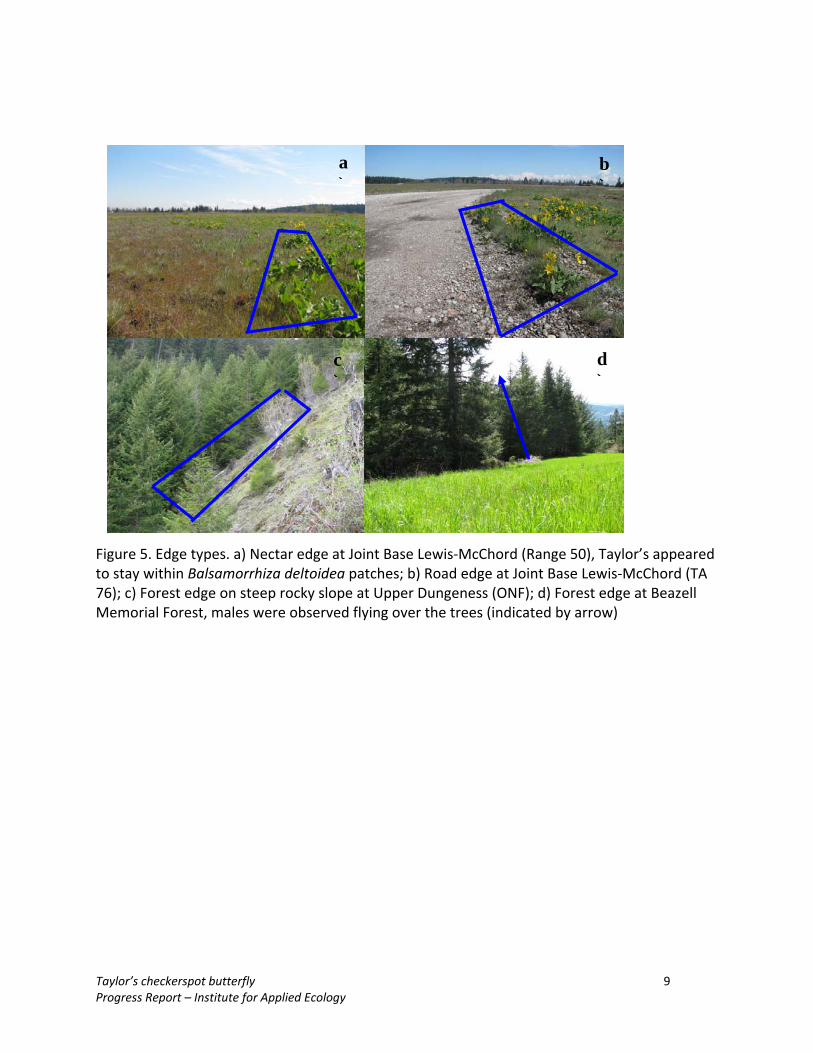
Figure 5. Edge types. a) Nectar edge at Joint Base Lewis‐McChord (Range 50), Taylor’s appeared to stay within Balsamorrhiza deltoidea patches; b) Road edge at Joint Base Lewis‐McChord (TA 76); c) Forest edge on steep rocky slope at Upper Dungeness (ONF); d) Forest edge at Beazell Memorial Forest, males were observed flying over the trees (indicated by arrow)
a)
d)
c)
b)
Taylor’s checkerspot butterfly 10 Progress Report – Institute for Applied Ecology
Table 2. Edge behavior observation events for Taylor’s checkerspot butterflies in Oregon and Washington in 2010. Edge type Location Date No. observations
Forest Beazell, Lower New 5/2
16
Beazell, Upper New 5/8 13 Beazell, North 5/2 14 Beazell, South 5/2 65 ONF, Upper Dungeness
5/18 5/24 6/12
9 17 28
ONP, Eden Valley 5/12 13 total 176 Road Fort Lewis, Range 76
5/6 5/7
total
10 28 38
Shrub Fort Lewis, Range 76
5/6 total
7 7
Slope break Beazell, South
5/2 total
19 19
Table 3. Seven meadows at Beazell Memorial Forest occupied by Taylor’s checkerspot with 2010 population estimates (from Ross 2010) and meadow sizes. Meadow Population estimate Meadow size (ha) North 105 To be added Middle 13 Summit Main 66 Summit Ridge 100 Upper New 235 Lower New 50 South 280
Taylor’s checkerspot butterfly 11 Progress Report – Institute for Applied Ecology
Figure 4. Marking butterflies involved capturing them with a net and drawing a number on a wing with a metallic‐ink pen: a) Dana Ross netting a butterfly, b) releasing a butterfly after marking, c) a marked individual basking after marking, and d) a marked individual in worn condition 9 days after marking.
a)
d)
b)
c)
Taylor’s checkerspot butterfly 12 Progress Report – Institute for Applied Ecology
Figure 7. Meadow complex at Beazell Memorial Forest. Meadows occupied by Taylor’s checkerspot are shaded light blue. Black numbers indicate the number of males marked in each meadow. Red arrows with white numbers denote the direction and recapture rates for movements between meadows.
South
Taylor’s checkerspot butterfly 13 Progress Report – Institute for Applied Ecology
Results
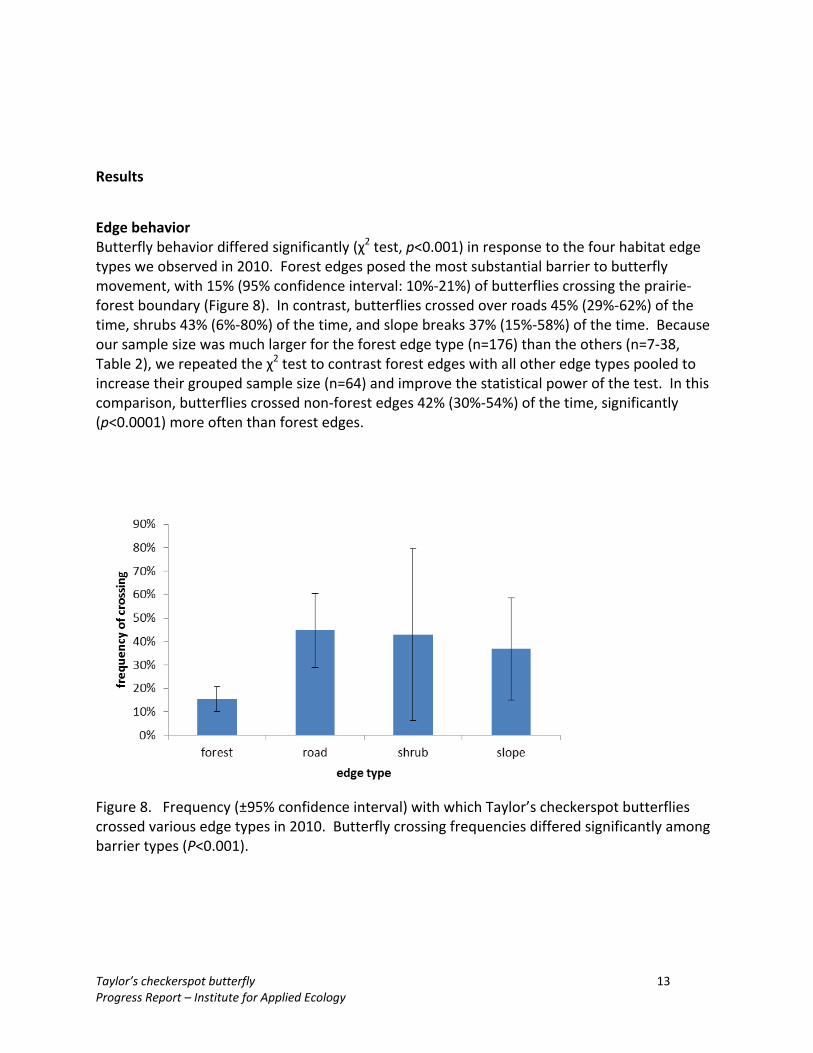
Edge behavior Butterfly behavior differed significantly (χ2 test, p<0.001) in response to the four habitat edge types we observed in 2010. Forest edges posed the most substantial barrier to butterfly movement, with 15% (95% confidence interval: 10%‐21%) of butterflies crossing the prairie‐forest boundary (Figure 8). In contrast, butterflies crossed over roads 45% (29%‐62%) of the time, shrubs 43% (6%‐80%) of the time, and slope breaks 37% (15%‐58%) of the time. Because our sample size was much larger for the forest edge type (n=176) than the others (n=7‐38, Table 2), we repeated the χ2 test to contrast forest edges with all other edge types pooled to increase their grouped sample size (n=64) and improve the statistical power of the test. In this comparison, butterflies crossed non‐forest edges 42% (30%‐54%) of the time, significantly (p<0.0001) more often than forest edges.
Figure 8. Frequency (±95% confidence interval) with which Taylor’s checkerspot butterflies crossed various edge types in 2010. Butterfly crossing frequencies differed significantly among barrier types (P<0.001).
Taylor’s checkerspot butterfly 14 Progress Report – Institute for Applied Ecology
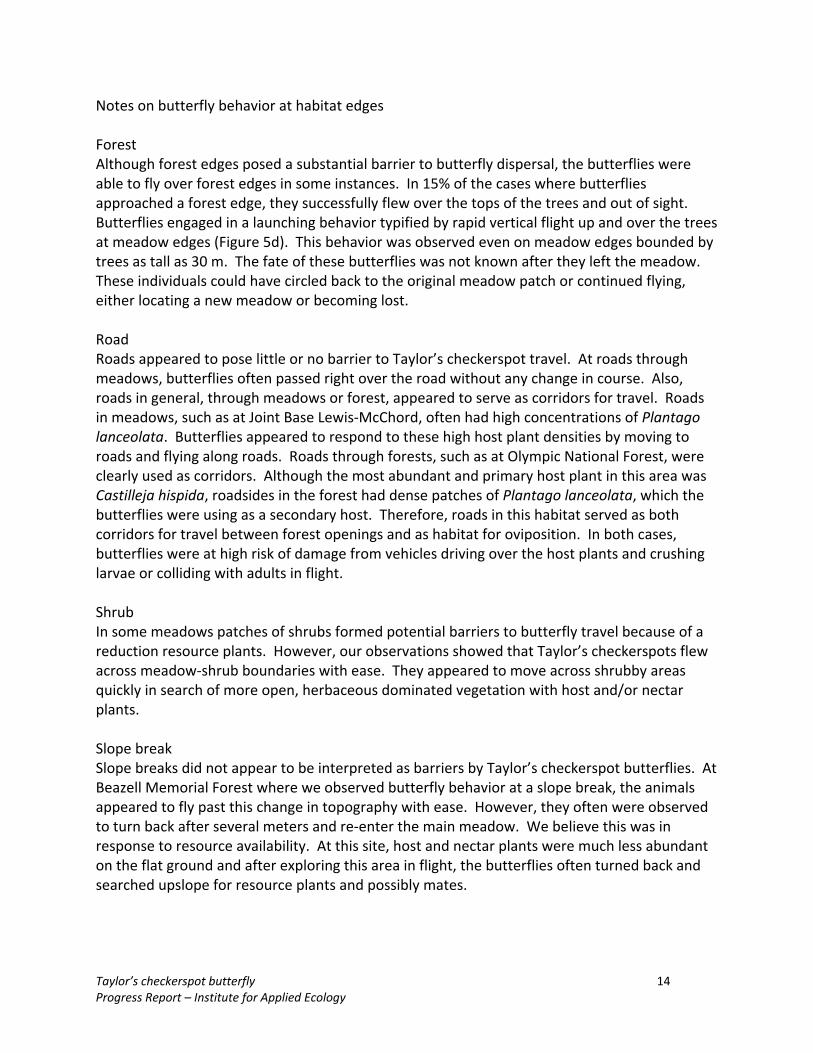
Notes on butterfly behavior at habitat edges Forest Although forest edges posed a substantial barrier to butterfly dispersal, the butterflies were able to fly over forest edges in some instances. In 15% of the cases where butterflies approached a forest edge, they successfully flew over the tops of the trees and out of sight. Butterflies engaged in a launching behavior typified by rapid vertical flight up and over the trees at meadow edges (Figure 5d). This behavior was observed even on meadow edges bounded by trees as tall as 30 m. The fate of these butterflies was not known after they left the meadow. These individuals could have circled back to the original meadow patch or continued flying, either locating a new meadow or becoming lost. Road Roads appeared to pose little or no barrier to Taylor’s checkerspot travel. At roads through meadows, butterflies often passed right over the road without any change in course. Also, roads in general, through meadows or forest, appeared to serve as corridors for travel. Roads in meadows, such as at Joint Base Lewis‐McChord, often had high concentrations of Plantago lanceolata. Butterflies appeared to respond to these high host plant densities by moving to roads and flying along roads. Roads through forests, such as at Olympic National Forest, were clearly used as corridors. Although the most abundant and primary host plant in this area was Castilleja hispida, roadsides in the forest had dense patches of Plantago lanceolata, which the butterflies were using as a secondary host. Therefore, roads in this habitat served as both corridors for travel between forest openings and as habitat for oviposition. In both cases, butterflies were at high risk of damage from vehicles driving over the host plants and crushing larvae or colliding with adults in flight. Shrub In some meadows patches of shrubs formed potential barriers to butterfly travel because of a reduction resource plants. However, our observations showed that Taylor’s checkerspots flew across meadow‐shrub boundaries with ease. They appeared to move across shrubby areas quickly in search of more open, herbaceous dominated vegetation with host and/or nectar plants. Slope break Slope breaks did not appear to be interpreted as barriers by Taylor’s checkerspot butterflies. At Beazell Memorial Forest where we observed butterfly behavior at a slope break, the animals appeared to fly past this change in topography with ease. However, they often were observed to turn back after several meters and re‐enter the main meadow. We believe this was in response to resource availability. At this site, host and nectar plants were much less abundant on the flat ground and after exploring this area in flight, the butterflies often turned back and searched upslope for resource plants and possibly mates.
Taylor’s checkerspot butterfly 15 Progress Report – Institute for Applied Ecology
Patch dispersal rates A total of 246 male Taylor’s checkerspot butterflies were marked at the Beazell sites combined (Table 4). We recaptured a total of 36 (14.5%) of the marked butterflies in the Beazell Memorial Forest meadow complex, 17 (6.8%) in non‐natal meadows. All individual recapture rates were between 0% and 9% between meadows. No marked butterflies were recaptured in the South meadow, the furthest and most isolated habitat patch. In general, the recapture rates were higher in meadows adjacent to one another. Butterflies were more likely to be re‐caught in meadows closer to where they were marked (Figure 7). The strength of this association was weak and statistically non‐significant (R2=0.126, p=0.434) when all data points were included. However, two points in particular may have confounded this relationship. Movement between Middle and North meadows (7%) may have been high because resources and butterfly numbers were low at Middle, and males may have left to find better nectar plants, as well as mates. The North meadow, although separated from Middle by over 100 m of forest, was the closest meadow for them to reach; movement the opposite direction, from North to Middle, was only 1%. Also, movement from Summit Ridge to Summit Main may have been high because these meadows are poorly separated on the landscape, with no major barriers or habitat edges to separate them, and therefore functionally a single meadow. When these two points were omitted from the analysis, the correlation between patch‐distance and recapture rate was much stronger (R2=0.951, p=0.005, Figure 9).
Taylor’s checkerspot butterfly 16 Progress Report – Institute for Applied Ecology
Figure 9. Effect of distance on dispersal of male Taylor’s checkerspot butterflies. Dispersal was weakly correlated with distance (top, solid line). When the top two points, which represent travel from Middle to North (a resource poor meadow to a resource rich meadow) and Summit Ridge to Summit Main (two meadows with no strong boundary), are excluded the correlation is very strong (bottom, dashed line). Table 4. Total number of Taylor’s checkerspot males marked at each meadow at Beazell Memorial Forest, from 13 April to 9 May 2010.
Taylor’s checkerspot butterfly 17 Progress Report – Institute for Applied Ecology
HABITAT CHARACTERISTICS OF TAYLOR’S CHECKERSPOT BUTTERFLY
Methods We measured vegetation and abiotic characteristics at eight sites with extant Taylor’s checkerspot butterfly populations and three sites where Taylor’s once occurred but had since become absent (Table 5). At each major site, we measured as many habitat patches as possible, for a combined total of 31 plots. In each habitat patch, we established releve‐type plots of sizes appropriate to the vegetation patch, and recorded the size of the plot in meters. Within each plot, we measured the cover of all vascular plants and ground cover. Non‐vegetation ground covers included litter, moss, lichen, bare soil, and rock. We assigned each species or ground cover to cover classes as follows: t = trace (<1% cover); 1= 1‐5% cover; 2 = 5‐25% cover; 3 = 25‐50%, 4= 50‐75% cover; 5 = 75‐100% cover. We also recorded the average vegetation height. We noted which potential nectar plants were in bloom. The area of the habitat patch, the slope, aspect, and elevation were obtained from GIS layers. Plant community data were arranged in a spreadsheet of plots by species as a main matrix, and the physical and biological characteristics of each site were arranged as a secondary (environmental) matrix. We used Nonmetric Multidimensional Scaling in PC‐ORD (McCune and Mefford 1995) to ordinate the main matrix of plant community data. Ordination was used to reduce the dimensionality of the data and visually display the plant communities (MCune and Grace 2002) occupied by Taylor’s checkerspot butterflies throughout its geographic range and document similarities and differences between habitats at different butterfly populations. The sites we sampled came from a broad latitudinal and elevation gradient in the Pacific Northwest, and therefore are likely to differ floristically and in details of the plant community. Therefore, we performed ordinations with data summarized in two ways. In the first, we used the raw species data to document differences in plant communities among sites and regions. In the second, we combined species into functional groups to determine if there was substantial variation between sites and regions in overall vegetation structure (Lawrence and Kaye 2006), differences that might be of greater significant to Taylor’s checkerspot butterflies. Functional groups were defined base on plant attributes including lifespan (annual or perennial), habit (grass, forb, shrub or tree), and provenance (native or introduced), for a total of 16 potential functional groups.
Taylor’s checkerspot butterfly 18 Progress Report – Institute for Applied Ecology
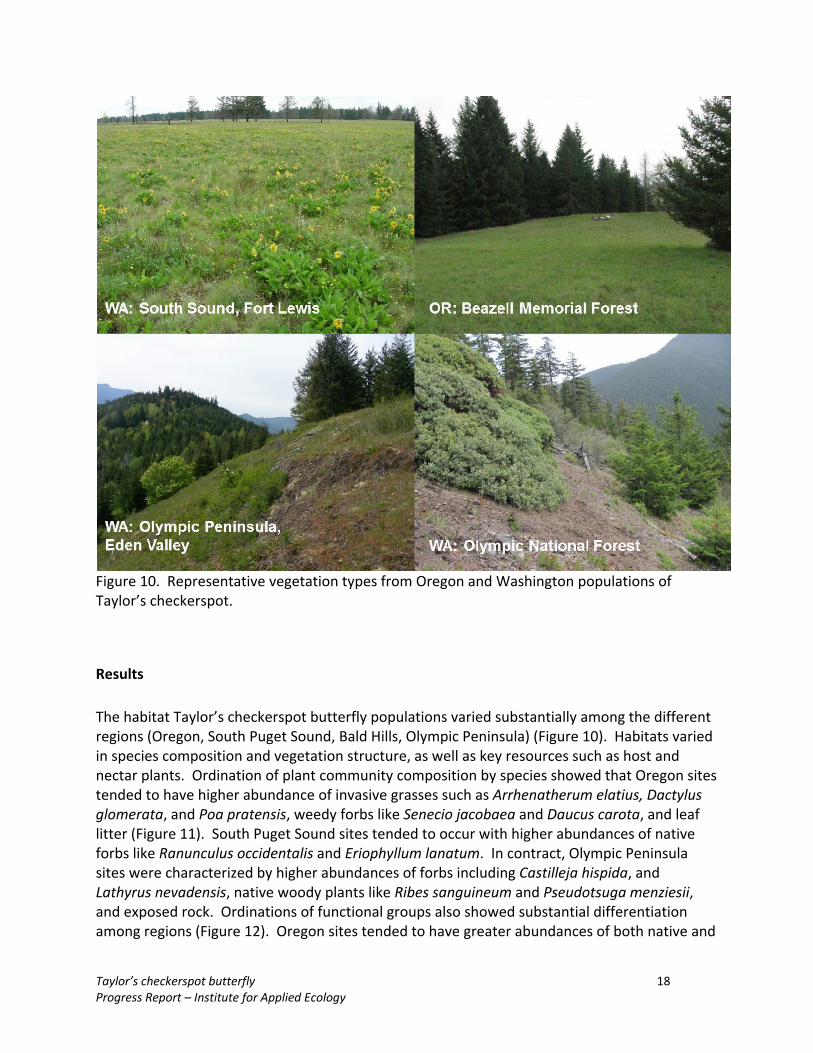
Figure 10. Representative vegetation types from Oregon and Washington populations of Taylor’s checkerspot.
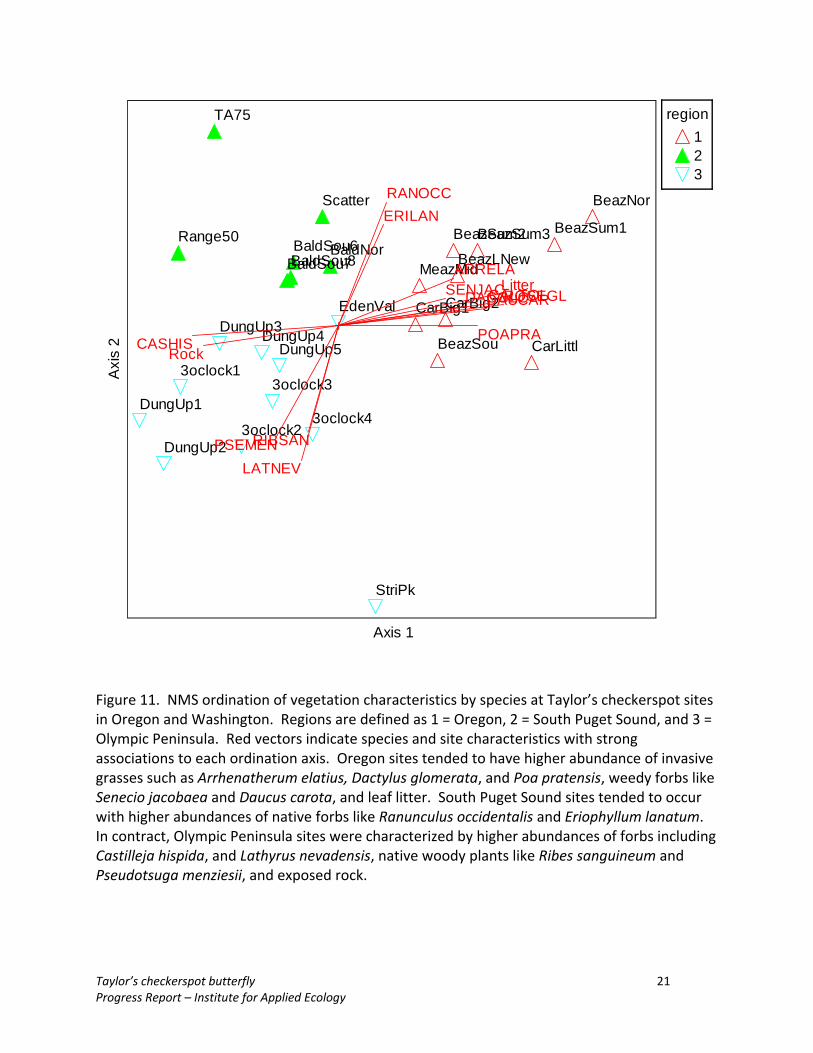
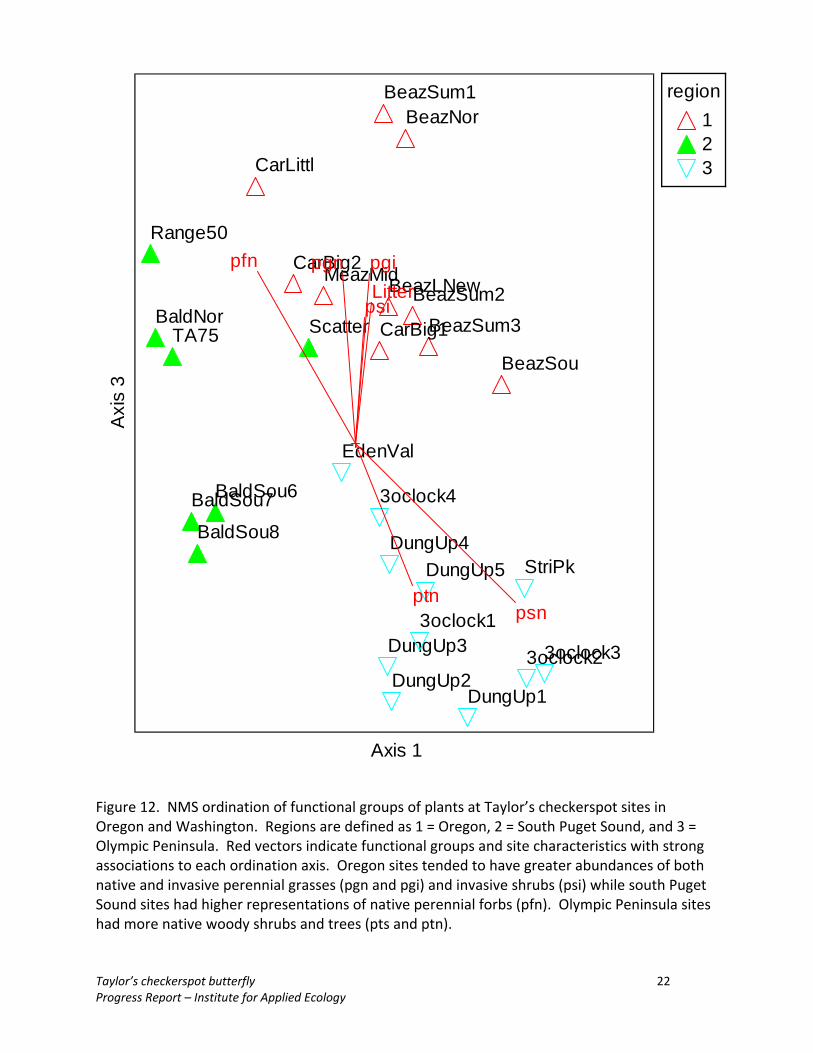
Results The habitat Taylor’s checkerspot butterfly populations varied substantially among the different regions (Oregon, South Puget Sound, Bald Hills, Olympic Peninsula) (Figure 10). Habitats varied in species composition and vegetation structure, as well as key resources such as host and nectar plants. Ordination of plant community composition by species showed that Oregon sites tended to have higher abundance of invasive grasses such as Arrhenatherum elatius, Dactylus glomerata, and Poa pratensis, weedy forbs like Senecio jacobaea and Daucus carota, and leaf litter (Figure 11). South Puget Sound sites tended to occur with higher abundances of native forbs like Ranunculus occidentalis and Eriophyllum lanatum. In contract, Olympic Peninsula sites were characterized by higher abundances of forbs including Castilleja hispida, and Lathyrus nevadensis, native woody plants like Ribes sanguineum and Pseudotsuga menziesii, and exposed rock. Ordinations of functional groups also showed substantial differentiation among regions (Figure 12). Oregon sites tended to have greater abundances of both native and
Taylor’s checkerspot butterfly 19 Progress Report – Institute for Applied Ecology
invasive perennial grasses and invasive shrubs while South Puget Sound sites had higher representations of native perennial forbs. Olympic Peninsula sites had more native woody shrubs and trees.
Regional summaries At the Oregon sites (Beazell Memorial Forest and Cardwell Hill) butterflies occupied meadow patches surrounded by Douglas‐fir forests on south‐facing hillsides, with clearly defined and abrupt habitat edges. Within the meadows, non‐native grasses dominated, and a thick layer of thatch was often present revealing little bare soil. The main larval host plant was Plantago lanceolata (Castilleja hispida is now uncommon in meadows in and around the Willamette Valley) and the main nectar species was Fragaria virginiana, with Lomatium utriculatum and Ranunculus occidentalis commonly used as well (Appendix A). Vegetation at these sites was fairly uniformly short, likely due to habitat management (mowing and burning) to prevent woody plant encroachment. Populations in the South Puget Sound (Joint Base Lewis‐McChord and Scatter Creek) occurred in open prairie habitat, where trees and shrubs were uncommon. Habitat edges at these sites were much less clearly defined (at least to us). These sites generally had a high abundance and diversity of native forbs and grasses. Non‐native grasses were much less abundant. Both Castilleja hispida and Plantago lanceolata were found at these sites, and the main nectar plant was Balsamorrhiza deltoidea. Fragaria virginana was less common at these sites; where dense patches occurred, many Taylor’s checkerspot butterfly were observed nectaring, but on the whole they appeared to prefer B. deltoidea. The vegetation was short‐statured, also likely due to frequent burning and management activities. Shrubs and trees were uncommon at these sites. Litter cover was low; instead bare soil, gravel, and low growing mosses had high cover. Sites at the Bald Hills Natural Areas Preserve (WDNR) were higher in elevation than other South Puget Sound sites, and were similar to Oregon sites as having a complex of meadows in a matrix of dense forested habitat. Taylor’s checkerspot has declined to extinction at this site. The meadows at Bald Hills were on shallow soil, rocky balds, with high moss cover, and sparser vegetation, with abrupt and discrete habitat edges. Non‐native grasses were abundant at these sites, particularly annual grasses like Cynosaurus echinatus and Vulpia species. These sites currently lack large populations of both Plantago lanceolata and Castilleja hispida. Instead, the common potential host species for Taylor’s checkerspot butterfly were all annuals, such as Collinsia spp. and Plectritis congesta. Also, the two preferred nectar plants at most other sites, Fragaria virginiana and Balsamorrhiza deltoidea, were absent but there was a large diversity of other potential nectar species (Appendix A). The shallow soils and southern exposure of these balds leads to low available soil moisture in the summer, a likely reason why annuals are favored in these habitats. Where Castilleja hispida occurred historically, it was typically found near forest edges, where shading may have enabled it to persist. The sites on the Olympic Peninsula (Eden Valley, Striped Peak, Olympic National Forest) ranged in elevation ranged in elevation from around 1000 feet to over 3000 feet. Eden Valley had a substantial population of Taylor’s checkerspot using Castilleja hispida as its primary host (although Plantago lanceolata was present in a few disturbed areas and Taylors checkerspot
Taylor’s checkerspot butterfly 20 Progress Report – Institute for Applied Ecology
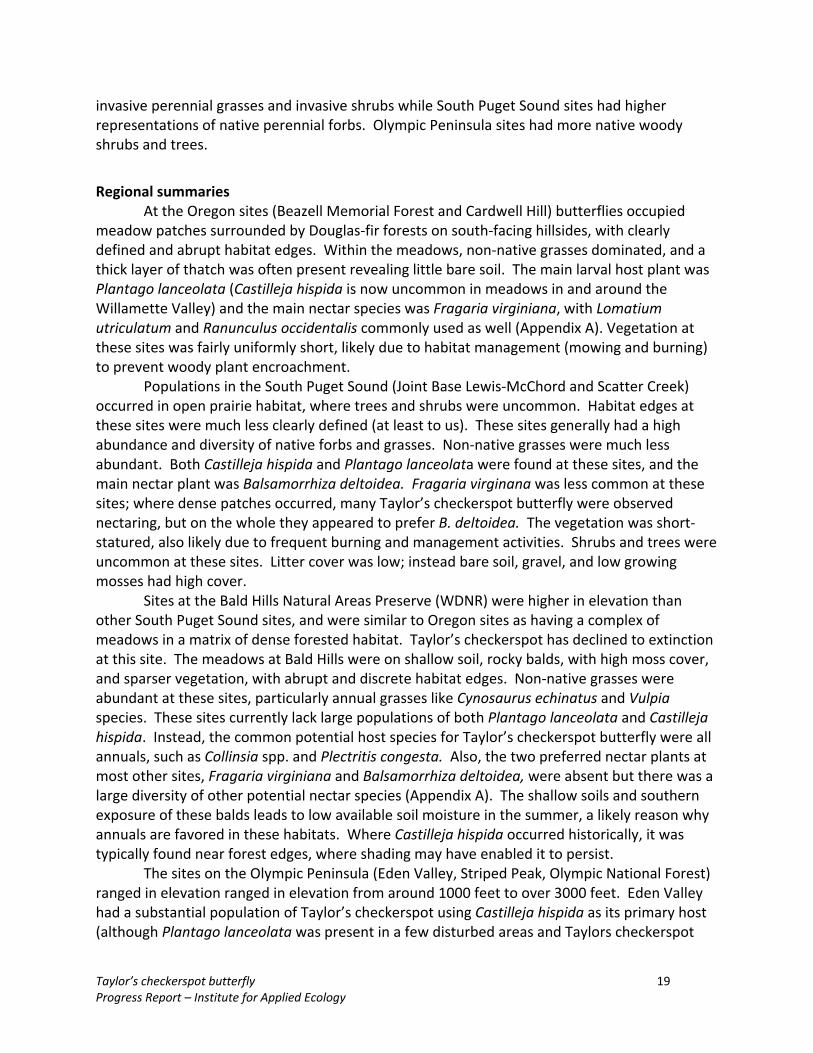
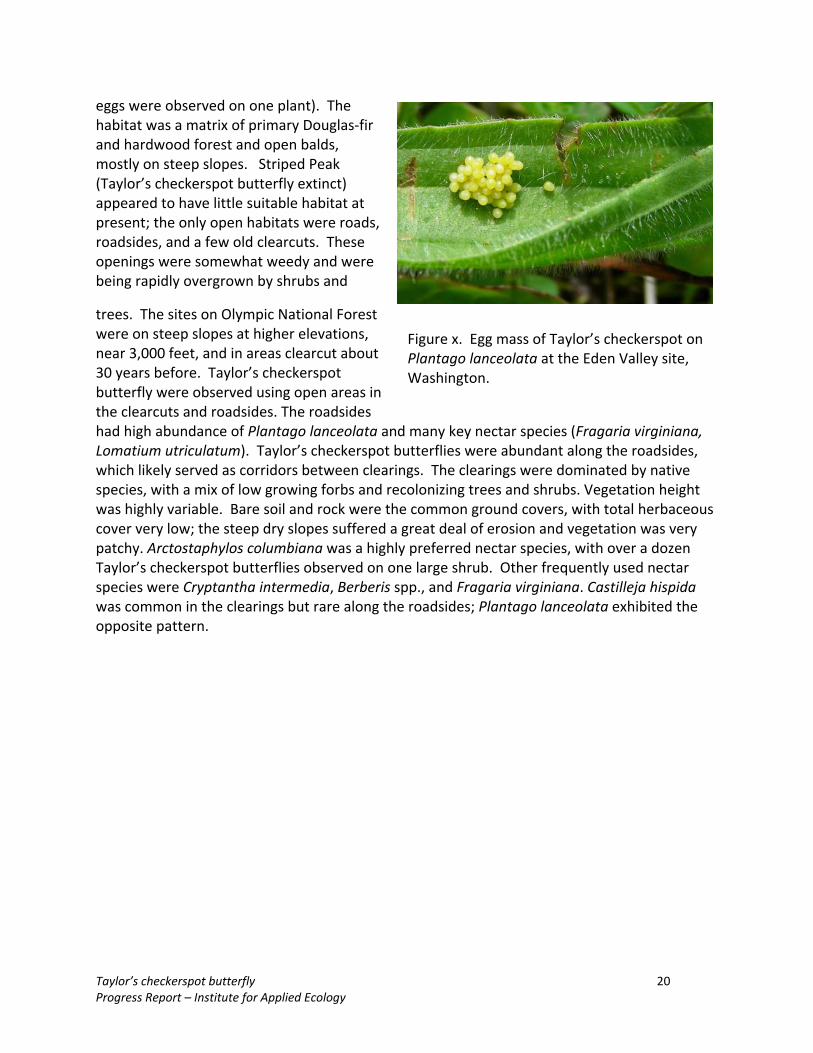
Figure x. Egg mass of Taylor’s checkerspot on Plantago lanceolata at the Eden Valley site, Washington.
eggs were observed on one plant). The habitat was a matrix of primary Douglas‐fir and hardwood forest and open balds, mostly on steep slopes. Striped Peak (Taylor’s checkerspot butterfly extinct) appeared to have little suitable habitat at present; the only open habitats were roads, roadsides, and a few old clearcuts. These openings were somewhat weedy and were being rapidly overgrown by shrubs and
trees. The sites on Olympic National Forest were on steep slopes at higher elevations, near 3,000 feet, and in areas clearcut about 30 years before. Taylor’s checkerspot butterfly were observed using open areas in the clearcuts and roadsides. The roadsides had high abundance of Plantago lanceolata and many key nectar species (Fragaria virginiana, Lomatium utriculatum). Taylor’s checkerspot butterflies were abundant along the roadsides, which likely served as corridors between clearings. The clearings were dominated by native species, with a mix of low growing forbs and recolonizing trees and shrubs. Vegetation height was highly variable. Bare soil and rock were the common ground covers, with total herbaceous cover very low; the steep dry slopes suffered a great deal of erosion and vegetation was very patchy. Arctostaphylos columbiana was a highly preferred nectar species, with over a dozen Taylor’s checkerspot butterflies observed on one large shrub. Other frequently used nectar species were Cryptantha intermedia, Berberis spp., and Fragaria virginiana. Castilleja hispida was common in the clearings but rare along the roadsides; Plantago lanceolata exhibited the opposite pattern.
Taylor’s checkerspot butterfly 21 Progress Report – Institute for Applied Ecology
BeazNor
BeazSum1BeazSum2
BeazSou
MeazMid
BeazSum3
BeazLNew
CarLittl
CarBig2CarBig1
BaldNorBaldSou6BaldSou7BaldSou8
Scatter
TA75
Range50
EdenVal
StriPk
DungUp5
DungUp1
DungUp2
DungUp3DungUp4
3oclock1
3oclock2
3oclock3
3oclock4
CALTOL
CASHIS
DAUCAR
ERILAN
LATNEV
RANOCC
SENJACARRELA
DACGLO
POAPRA
PSEMENRIBSAN
ROSEGLLitter
Rock
Axis 1
Axi
s 2
region123
Figure 11. NMS ordination of vegetation characteristics by species at Taylor’s checkerspot sites in Oregon and Washington. Regions are defined as 1 = Oregon, 2 = South Puget Sound, and 3 = Olympic Peninsula. Red vectors indicate species and site characteristics with strong associations to each ordination axis. Oregon sites tended to have higher abundance of invasive grasses such as Arrhenatherum elatius, Dactylus glomerata, and Poa pratensis, weedy forbs like Senecio jacobaea and Daucus carota, and leaf litter. South Puget Sound sites tended to occur with higher abundances of native forbs like Ranunculus occidentalis and Eriophyllum lanatum. In contract, Olympic Peninsula sites were characterized by higher abundances of forbs including Castilleja hispida, and Lathyrus nevadensis, native woody plants like Ribes sanguineum and Pseudotsuga menziesii, and exposed rock.
Taylor’s checkerspot butterfly 22 Progress Report – Institute for Applied Ecology
Figure 12. NMS ordination of functional groups of plants at Taylor’s checkerspot sites in Oregon and Washington. Regions are defined as 1 = Oregon, 2 = South Puget Sound, and 3 = Olympic Peninsula. Red vectors indicate functional groups and site characteristics with strong associations to each ordination axis. Oregon sites tended to have greater abundances of both native and invasive perennial grasses (pgn and pgi) and invasive shrubs (psi) while south Puget Sound sites had higher representations of native perennial forbs (pfn). Olympic Peninsula sites had more native woody shrubs and trees (pts and ptn).
BeazNorBeazSum1
BeazSum2
BeazSou
MeazMid
BeazSum3
BeazLNew
CarLittl
CarBig2
CarBig1BaldNor
BaldSou6BaldSou7
BaldSou8
ScatterTA75
Range50
EdenVal
StriPkDungUp5
DungUp1DungUp2
DungUp3
DungUp4
3oclock1
3oclock23oclock3
3oclock4
pfn pgn pgi
psn
psi
ptn
Litter
Axis 1
Axi
s 3region
123
Taylor’s checkerspot butterfly 23 Progress Report – Institute for Applied Ecology
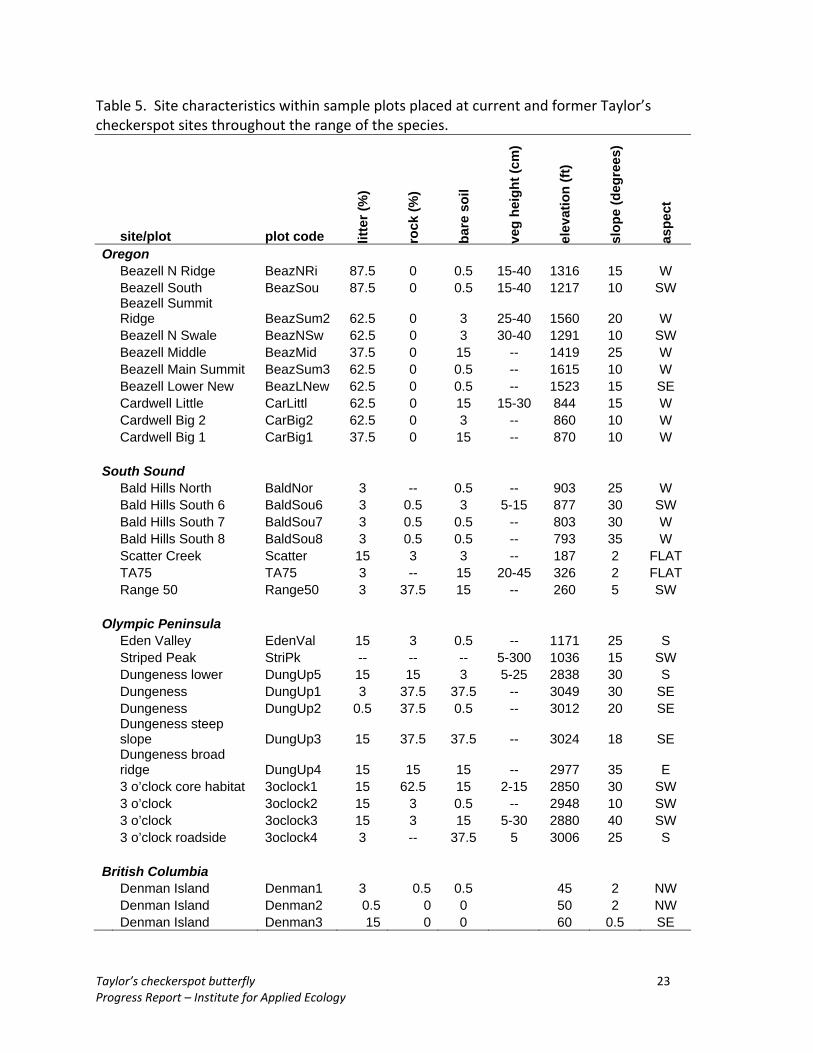
Table 5. Site characteristics within sample plots placed at current and former Taylor’s checkerspot sites throughout the range of the species.
site/plot plot code litte
r (%
)
rock
(%)
bare
soi
l
veg
heig
ht (c
m)
elev
atio
n (ft
)
slop
e (d
egre
es)
aspe
ct
Oregon Beazell N Ridge BeazNRi 87.5 0 0.5 15-40 1316 15 W Beazell South BeazSou 87.5 0 0.5 15-40 1217 10 SW Beazell Summit Ridge BeazSum2 62.5 0 3 25-40 1560 20 W Beazell N Swale BeazNSw 62.5 0 3 30-40 1291 10 SW Beazell Middle BeazMid 37.5 0 15 -- 1419 25 W Beazell Main Summit BeazSum3 62.5 0 0.5 -- 1615 10 W Beazell Lower New BeazLNew 62.5 0 0.5 -- 1523 15 SE Cardwell Little CarLittl 62.5 0 15 15-30 844 15 W Cardwell Big 2 CarBig2 62.5 0 3 -- 860 10 W Cardwell Big 1 CarBig1 37.5 0 15 -- 870 10 W
South Sound Bald Hills North BaldNor 3 -- 0.5 -- 903 25 W Bald Hills South 6 BaldSou6 3 0.5 3 5-15 877 30 SW Bald Hills South 7 BaldSou7 3 0.5 0.5 -- 803 30 W Bald Hills South 8 BaldSou8 3 0.5 0.5 -- 793 35 W Scatter Creek Scatter 15 3 3 -- 187 2 FLAT TA75 TA75 3 -- 15 20-45 326 2 FLAT Range 50 Range50 3 37.5 15 -- 260 5 SW
British Columbia Denman Island Denman1 3 0.5 0.5 45 2 NW Denman Island Denman2 0.5 0 0 50 2 NW
Denman Island Denman3 15 0 0 60 0.5 SE
Taylor’s checkerspot butterfly 24 Progress Report – Institute for Applied Ecology
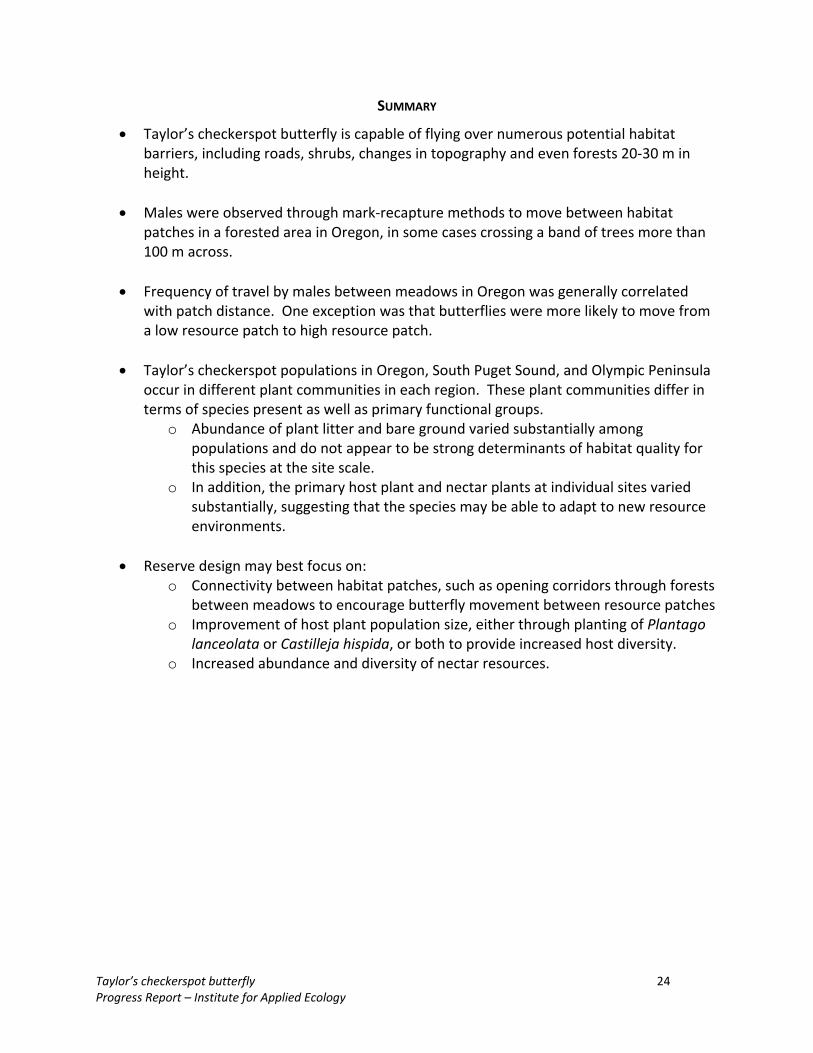
SUMMARY
• Taylor’s checkerspot butterfly is capable of flying over numerous potential habitat barriers, including roads, shrubs, changes in topography and even forests 20‐30 m in height.
• Males were observed through mark‐recapture methods to move between habitat
patches in a forested area in Oregon, in some cases crossing a band of trees more than 100 m across.
• Frequency of travel by males between meadows in Oregon was generally correlated with patch distance. One exception was that butterflies were more likely to move from a low resource patch to high resource patch.
• Taylor’s checkerspot populations in Oregon, South Puget Sound, and Olympic Peninsula
occur in different plant communities in each region. These plant communities differ in terms of species present as well as primary functional groups.
o Abundance of plant litter and bare ground varied substantially among populations and do not appear to be strong determinants of habitat quality for this species at the site scale.
o In addition, the primary host plant and nectar plants at individual sites varied substantially, suggesting that the species may be able to adapt to new resource environments.
• Reserve design may best focus on:
o Connectivity between habitat patches, such as opening corridors through forests between meadows to encourage butterfly movement between resource patches
o Improvement of host plant population size, either through planting of Plantago lanceolata or Castilleja hispida, or both to provide increased host diversity.
o Increased abundance and diversity of nectar resources.
Taylor’s checkerspot butterfly 25 Progress Report – Institute for Applied Ecology
LITERATURE CITED
Barclay, E., M. Arnold, M. Andersen, D. Shepherdson. 2009. Oregon Zoo Taylor’s Checkerspot
(Euphydryas editha taylori) Rearing 2008‐2009 Final Report. Oregon Zoo, Portland. Benton County, Oregon. 2010. Benton County Prairie Species Habitat Conservation Plan.
Corvallis, Oregon. http://www.co.benton.or.us/parks/hcp/documents/ Ehrlich, P.R. and I. Hanksi. 2004. On the Wings of Checkerspots: A Model System for
Population Biology. Oxford University Press, New York, New York. Haddad, N.M. 1998. Corridor and distance effects on interpatch movements: a landscape
experiment with butterflies. Ecological Applications 9:612‐622. Kuefler, D. and Haddad, N. M. 2006. Local versus landscape determinants of butterfly
movement behaviors. Ecography 29: 549‐560. Lawrence, B.A. and T.N. Kaye. 2006. Habitat variation throughout the historic range of golden
paintbrush, a Pacific Northwest prairie endemic: Implications for reintroduction. Northwest Science 80:140‐152.
Linders, M. J. 2007. Development of captive rearing and translocation methods for Taylor’s checkerspot (Euphydryas editha taylori) in south Puget Sound, Washington: 2006‐2007 Annual Report. Washington Department of Fish and Wildlife, Wildlife Program, Olympia. 29 pp.
McCune, B and J.B. Grace. 2002. Analysis of Ecological Communities. MjM Software Design, Gleneden Beach, Oregon, USA.
McCune, B. and M.J., Mefford. 1995. PC‐ORD Multivariate analysis of ecological data, version 2.0. MjM Software Design, Gleneden Beach, Oregon, USA.
Ross, D. 2010. 2010 Population Estimates for Taylor’s Checkerspot at Fitton Green Natural Area & Beazell Memorial Forest. Unpublished report to Benton County Natural Areas & Parks Department, Corvallis, Oregon and U.S. Fish and Wildlife Service, Portland, Oregon.
Thomas, C.D., A.M.A. Franco, and J.K. Hill. 2006. Range retractions and extinction in the face of climate warming. Trends in Ecology and Evolution 21:415‐416.
USFWS. 2009. U.S. Fish and Wildlife Service Species Assessment and Listing Priority Assignment Form. March 2009. Washington Fish and Wildlife Office, Lacey, Washington.
Taylor’s checkerspot butterfly 26 Progress Report – Institute for Applied Ecology
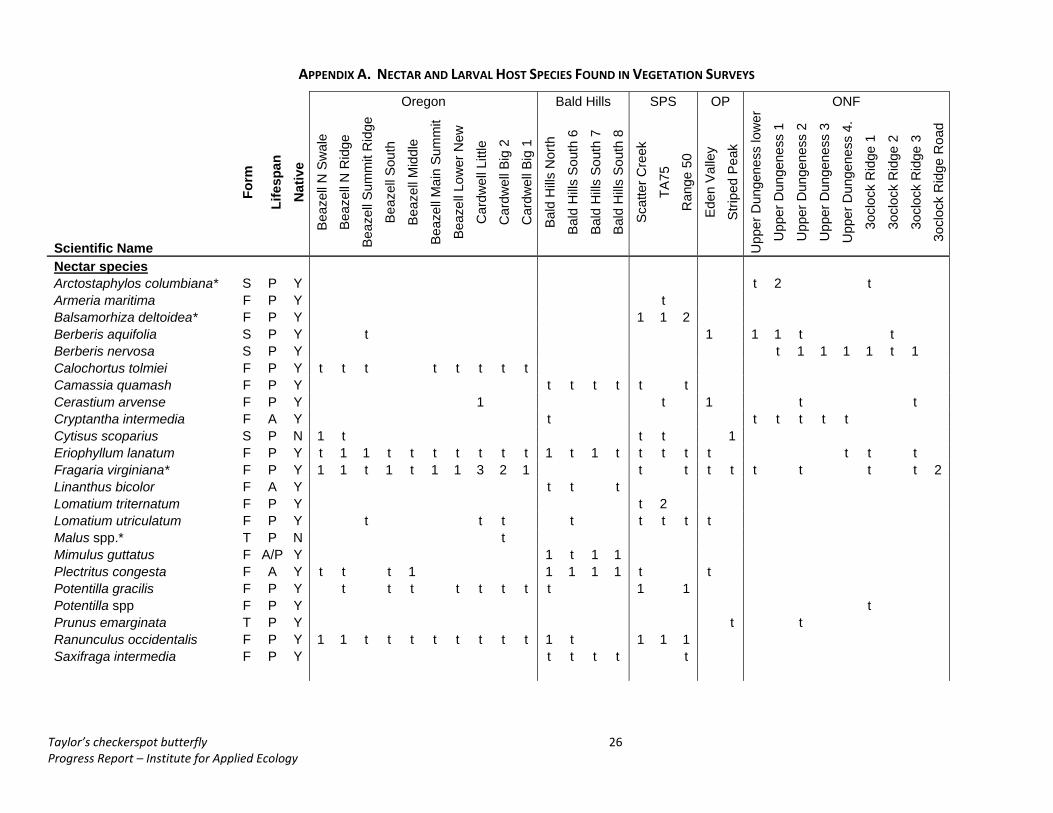
APPENDIX A. NECTAR AND LARVAL HOST SPECIES FOUND IN VEGETATION SURVEYS
Oregon Bald Hills SPS OP ONF
Scientific Name Fo
rm
Life
span
N
ativ
e B
eaze
ll N
Sw
ale
Bea
zell
N R
idge
Bea
zell
Sum
mit
Rid
ge
Bea
zell
Sou
th
Bea
zell
Mid
dle
Bea
zell
Mai
n S
umm
it
Bea
zell
Low
er N
ew
Car
dwel
l Litt
le
Car
dwel
l Big
2
Car
dwel
l Big
1
Bal
d H
ills N
orth
Bal
d H
ills S
outh
6
Bal
d H
ills S
outh
7
Bal
d H
ills S
outh
8
Sca
tter C
reek
TA75
Ran
ge 5
0
Ede
n V
alle
y
Stri
ped
Pea
k
Upp
er D
unge
ness
low
er
Upp
er D
unge
ness
1
Upp
er D
unge
ness
2
Upp
er D
unge
ness
3
Upp
er D
unge
ness
4.
3ocl
ock
Rid
ge 1
3ocl
ock
Rid
ge 2
3ocl
ock
Rid
ge 3
3ocl
ock
Rid
ge R
oad
Nectar species
Arctostaphylos columbiana* S P Y t 2 t Armeria maritima F P Y t Balsamorhiza deltoidea* F P Y 1 1 2 Berberis aquifolia S P Y t 1 1 1 t t Berberis nervosa S P Y t 1 1 1 1 t 1 Calochortus tolmiei F P Y t t t t t t t t Camassia quamash F P Y t t t t t t Cerastium arvense F P Y 1 t 1 t t Cryptantha intermedia F A Y t t t t t t Cytisus scoparius S P N 1 t t t 1 Eriophyllum lanatum F P Y t 1 1 t t t t t t t 1 t 1 t t t t t t t t Fragaria virginiana* F P Y 1 1 t 1 t 1 1 3 2 1 t t t t t t t t 2 Linanthus bicolor F A Y t t t Lomatium triternatum F P Y t 2 Lomatium utriculatum F P Y t t t t t t t t Malus spp.* T P N t Mimulus guttatus F A/P Y 1 t 1 1 Plectritus congesta F A Y t t t 1 1 1 1 1 t t Potentilla gracilis F P Y t t t t t t t t 1 1 Potentilla spp F P Y t Prunus emarginata T P Y t t Ranunculus occidentalis F P Y 1 1 t t t t t t t t 1 t 1 1 1 Saxifraga intermedia F P Y t t t t t
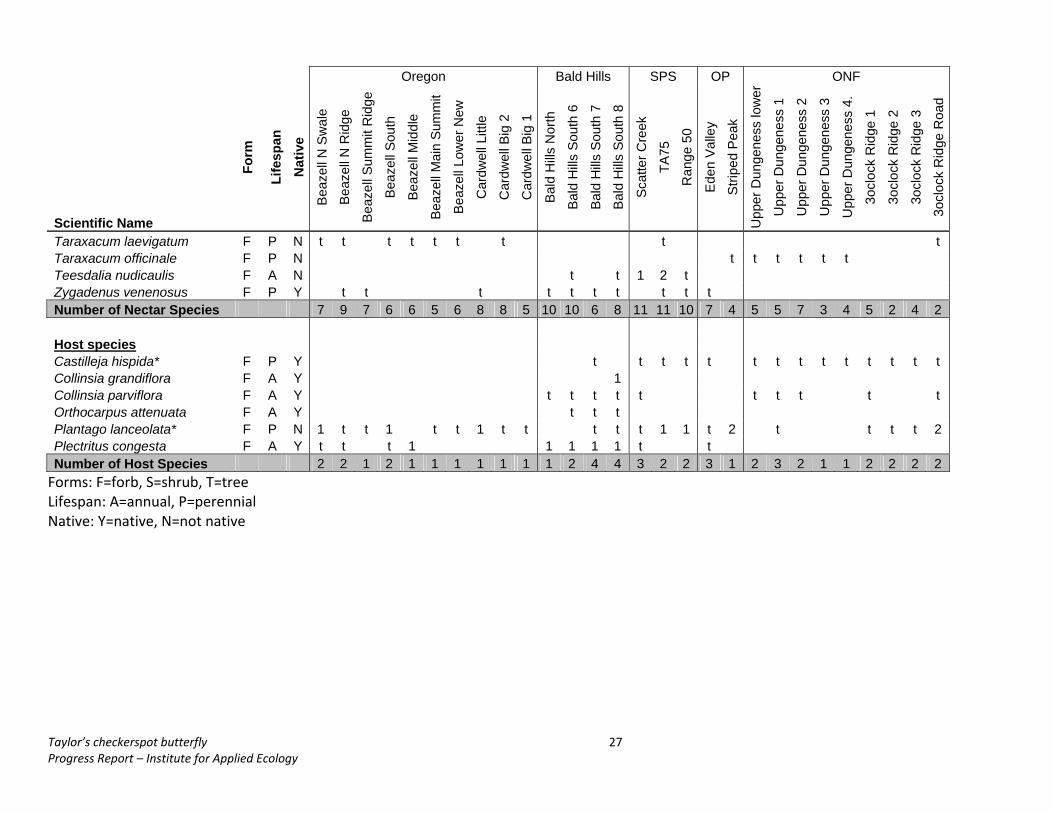
Taylor’s checkerspot butterfly 27 Progress Report – Institute for Applied Ecology
Oregon Bald Hills SPS OP ONF
Scientific Name
Form
Life
span
N
ativ
e B
eaze
ll N
Sw
ale
Bea
zell
N R
idge
Bea
zell
Sum
mit
Rid
ge
Bea
zell
Sou
th
Bea
zell
Mid
dle
Bea
zell
Mai
n S
umm
it
Bea
zell
Low
er N
ew
Car
dwel
l Litt
le
Car
dwel
l Big
2
Car
dwel
l Big
1
Bal
d H
ills N
orth
Bal
d H
ills S
outh
6
Bal
d H
ills S
outh
7
Bal
d H
ills S
outh
8
Sca
tter C
reek
TA75
Ran
ge 5
0
Ede
n V
alle
y
Stri
ped
Pea
k
Upp
er D
unge
ness
low
er
Upp
er D
unge
ness
1
Upp
er D
unge
ness
2
Upp
er D
unge
ness
3
Upp
er D
unge
ness
4.
3ocl
ock
Rid
ge 1
3ocl
ock
Rid
ge 2
3ocl
ock
Rid
ge 3
3ocl
ock
Rid
ge R
oad
Taraxacum laevigatum F P N t t t t t t t t t Taraxacum officinale F P N t t t t t t Teesdalia nudicaulis F A N t t 1 2 t Zygadenus venenosus F P Y t t t t t t t t t t Number of Nectar Species 7 9 7 6 6 5 6 8 8 5 10 10 6 8 11 11 10 7 4 5 5 7 3 4 5 2 4 2 Host species Castilleja hispida* F P Y t t t t t t t t t t t t t t Collinsia grandiflora F A Y 1 Collinsia parviflora F A Y t t t t t t t t t t Orthocarpus attenuata F A Y t t t Plantago lanceolata* F P N 1 t t 1 t t 1 t t t t t 1 1 t 2 t t t t 2 Plectritus congesta F A Y t t t 1 1 1 1 1 t t Number of Host Species 2 2 1 2 1 1 1 1 1 1 1 2 4 4 3 2 2 3 1 2 3 2 1 1 2 2 2 2 Forms: F=forb, S=shrub, T=tree Lifespan: A=annual, P=perennial Native: Y=native, N=not native