23
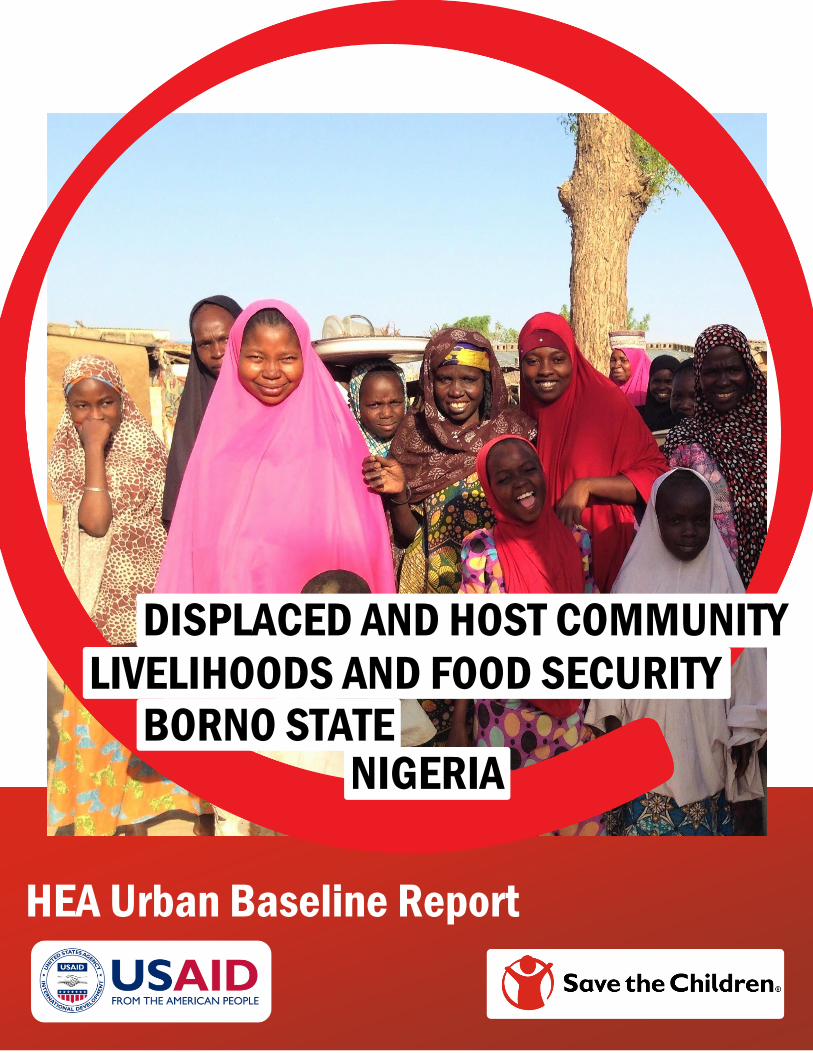
HEA Urban Baseline Report DISPLACED AND HOST COMMUNITY LIVELIHOODS BORNO STATE NIGERIA LIVELIHOODS AND FOOD SECURITY
0
HEA Urban Baseline Report
DISPLACED AND HOST COMMUNITY LIVELIHOODS
BORNO STATE NIGERIA
LIVELIHOODS AND FOOD SECURITY
HEA Urban Baseline Report
1
Contents
Acknowledgements ................................................................. 2
Glossary .................................................................................. 2
Introduction ............................................................................ 3
Overview of the HEA Conceptual Approach ..................... 3
Urban Livelihood Zone Description ................................... 4
Assessment Objectives and Conceptual Approach ............ 4
Fieldwork constraints .......................................................... 5
Host Community Livelihoods ................................................. 6
Wealth Breakdown ............................................................. 6
Income Sources ................................................................... 6
Food needs .......................................................................... 7
Expenditure Patterns ........................................................... 7
Coping Strategies ................................................................ 7
Displaced Community Livelihoods.......................................... 8
Wealth Breakdown ............................................................. 8
Income Sources ................................................................... 9
Food needs .........................................................................10
Expenditure Patterns ..........................................................11
Coping Strategies ...............................................................12
Analysis of livelihood and coping strategies ...........................12
Livelihood strategies...........................................................12
Coping strategies ................................................................13
Impact of NGO transfers .......................................................13
Outcome Analysis ..................................................................15
Background on Outcome Analysis .....................................15
Programme Implications of Outcome Analysis Modelling
for Maiduguri Urban Livelihood Zone ...............................16
Recommendations ..................................................................18
Limitations of the HEA data ...................................................21
References ..............................................................................22
This study and report were made possible by the generous support
of the American people through the United States Agency for
International Development (USAID). The contents are the
responsibility of Save the Children and do not necessarily reflect the
views of USAID or the United States Government.

HEA Urban Baseline Report
2
Acknowledgements
During the course of this HEA baseline fieldwork and analysis,
Save the Children was joined by colleagues from World Food
Programme, the International Rescue Committee, and
Ekklisiyar yan’uwa a Nigeria (EYN). Save the Children extends
its warmest thanks to colleagues from partner organisations
who have contributed to the collection and analysis of this
baseline field data. Members of the Food Economy Group
contributed to the baseline and outcome analysis.
FFP Project Director: Andrew Simbwa
HEA Coordinator: Chinedu Anyaegbu (team leader, Host)
HEA Specialist: Ria Lewis (team leader, IDP)
TEAM MEMBERS:
Ibrahim Blama Hena (SCI)
Mercy Haruna (WFP)
Benedicta Onyemenam (WFP)
Ifeoma Omesiete (WFP)
Umar Ali Mustapha (IRC)
Laraba M Sarki (FWANCE)
Israel Uche (EYN/SCI)
Mohammed Haruna (EYN/SCI)
Nelson Obadiah Yidawi (EYN/SCI)
Bunu Grema Alkali (EYN/SCI)
Esther Suya (EYN/SCI)
Aishatu Aliyu (EYN/SCI)
Stephen Adamu (EYN/SCI)
Sarah Philibus (EYN/SCI)
Grace Dauda (EYN/SCI)
Kamdadi Samson Msheila (EYN/SCI)
This report was written by Ria Lewis and Chinedu Anyaegbu.
Photographs were taken by Ria Lewis. For queries or further
details, please contact:
Partners involved in the data collection and analysis:
EKKLISIYAR YAN’UWA A NIGERA (EYN)
Glossary
HEA Household Economy Approach
IDP Internally displaced person
LIAS Livelihoods Integrated Analysis Spreadsheet
HEA Urban Baseline Report
3
Introduction
Overview of the HEA Conceptual
Approach
The Household Economy Approach (HEA) was developed in
the early 1990s by Save the Children-UK in order to assist
humanitarian practitioners in predicting short-term changes in
a population’s access to food. It is a livelihoods-based
framework for analysing the way households gain access to
the things they need to survive and prosper. This focus on
access was derived from Amartya Sen’s entitlement theory
which suggested that famines occur not as a result of an
absence of food itself, but from people’s inability to obtain
access to food. HEA begins with an understanding of how
households gain access to income and food, and how they
spend their income. Central to the methodology of HEA is
the notion that without knowing how households live
normally, it will not be possible to understand nor quantify
how they will be impacted by a shock or hazard. In essence,
HEA enables the practitioner to understand how many
people will need how much assistance, where, and for how
long.
The information gathered in an HEA baseline on households’
food and income is converted into a ‘common currency’ that
can be used to compare against internationally-accepted
thresholds of food security. HEA uses the measure of 2100
kilocalories per person per day to determine whether
households are able to survive – both in a normal period and
during a shock or hazard. This is not to say that energy alone
is a sufficient indicator of nutritional adequacy. However, it is
the first indicator of whether or not a person will starve.
HEA baselines depict a typical food habits diet for households
across the wealth spectrum. Moreover, the information
contained within an HEA baseline can be used to help
practitioners select locally appropriate foods that meet
SPHERE standards for a food basket.
The HEA conceptual framework is translated into six steps.
The baseline provides a picture of how households are living
normally, and has three core components: a livelihood zoning,
a wealth breakdown, and an analysis of livelihood strategies. It
is the analysis of livelihood strategies that quantifies
household access to food and income for different wealth
groups within a given livelihood zone. This quantification
provides the basis for the final step: outcome analysis.
Outcome analysis investigates how household food and
income changes in reaction to a shock. It begins by translating
the hazard into economic consequences at household level,
known as the problem specification. Next, households’
capacity to cope is analysed and incorporated into the
reaction to the shock. Finally, predicted access to food and
income for households is to compare projected total income
against two clearly defined thresholds to determine whether
an intervention of some kind is required.
The final result – called the ‘projected outcome’ – can be
compared with baseline-level access, and can provide a
picture of whether households are failing to meet even their
basic needs. It is intended for use by decision-makers in
program planning and development.
For further reference to the HEA process, please see the
HEA Guide for Programme and Policy Makers in the bibliography.
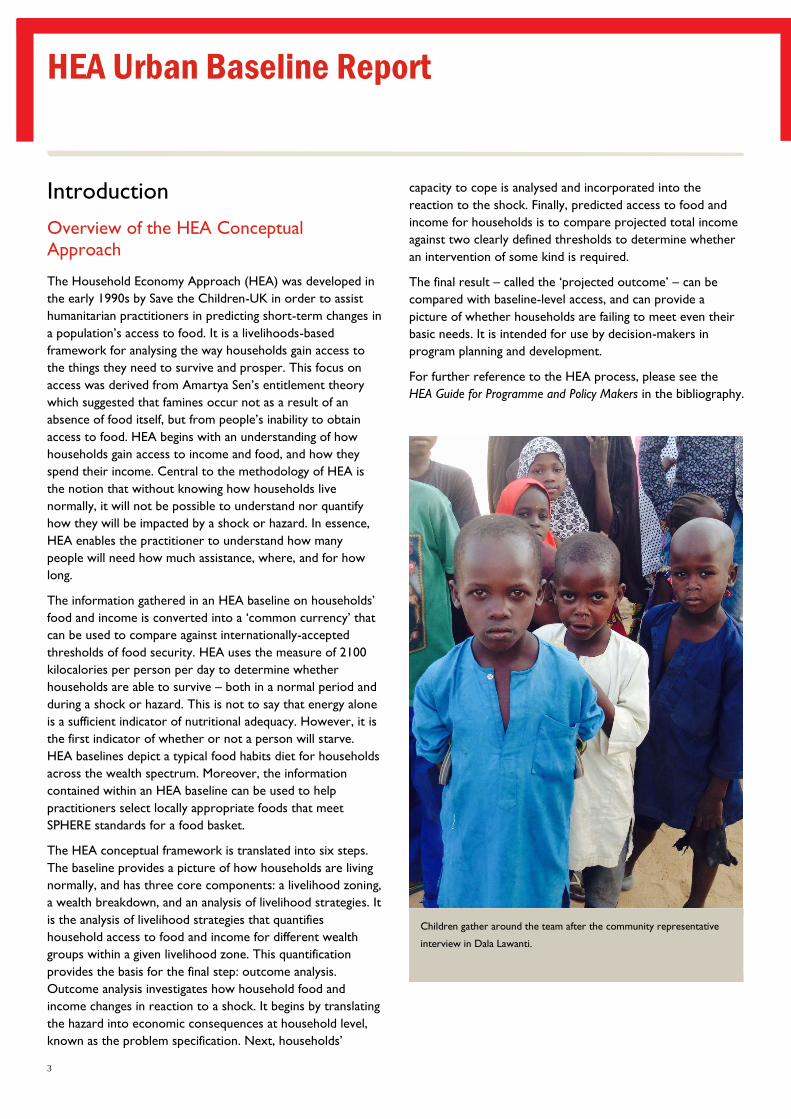
Children gather around the team after the community representative
interview in Dala Lawanti.
HEA Urban Baseline Report
4
Urban Livelihood Zone Description
In the HEA framework, the first step is to define the area to
be surveyed; the ‘livelihood zone’. In any given country,
patterns of livelihood vary clearly from one location to the
next as a result of local factors including climate, geography,
and market access. Prior to beginning the fieldwork, it is
therefore necessary to create a ‘livelihood zone map’ that
delineates the geographical areas in which a population shares
the same access to food, markets, and has a similar
geography. This is intended to allow for a robust and
comparable analysis of livelihood patterns. Furthermore, a
livelihood zone map can assist practitioners in planning the
location for appropriate livelihoods interventions.
Urban livelihood zones differ from the typical rural HEA
livelihood zones in that there is generally a far less significant
dependence on agriculture as a means of existence. As a
result, households are much more susceptible to fluctuations
in market conditions, and to changes in the price of basic
food and non-food items. Moreover, in an urban livelihood
zone, the type and number of income-generating activities
varies according to wealth group. Well-remunerated, formal
employment tends to be the reserve of middle and better off
households, whereas the poorer households tend to engage
in a variety of both semi-skilled and unskilled activities within
the informal economy. A technical discussion was held with
Save the Children’s implementing partners in Maiduguri prior
to the start of the fieldwork in order to determine the main
criteria for community selection.
Chief among these criteria was the areas where displaced
communities and host communities overlap – this is because
the pattern of livelihoods within settlement areas is likely to
be different than the livelihoods of those living in IDP camps.
Moreover, according to available data, over 86 per cent of
IDPs within Maiduguri are living outside of camps, within the
host community.
Another important criterion for community selection was the
location of the community on the urban map of Maiduguri,
which was directly related to the type of livelihood
opportunities available within that area. More vulnerable
communities tend to be found away from the urban centre.
The livelihood zoning in Maiduguri that was completed with
technical stakeholders, as well as the HEA field team found
the following distinct zones within Maiduguri.
1. Periurban – areas on the outskirts of town, along the
waterways with some cereal production, livestock rearing,
fishing, firewood sales, and casual labour. In periurban
Maiduguri these wards include Dalori, Dusuman,
Gongulong, and Auno.
2. Lower urban – little to no land access, poor infrastructure,
poor hygiene and sanitation conditions, and a large
amount of casual labour. The lower urban wards of
Maiduguri include Modusulumri and Madinatu.
3. Intermediate urban – quarters near the centre of town
close to commercial centres and socio-economic
infrastructure. Higher concentration of civil servants,
commerce, and salaried employment. In Maiduguri the
intermediate urban wards include Kusheri, Polo, Kululori
and Dala Alamderi.
4. Urban centre – residential areas with a high level of
permanent infrastructure, and a high concentration of
upper cadre civil servants, government officials, and
NGOs. The urban centre of Maiduguri includes New and
Old GRA, Gwange, Customs area, Bolori, and Bama road
wards.
During the urban HEA baseline in Maiduguri, the areas
surveyed included communities from both the lower and
intermediate urban zones. The selection of communities was
dependent on a number of factors including; overlap of IDP
and host community, type of livelihood activities available, and
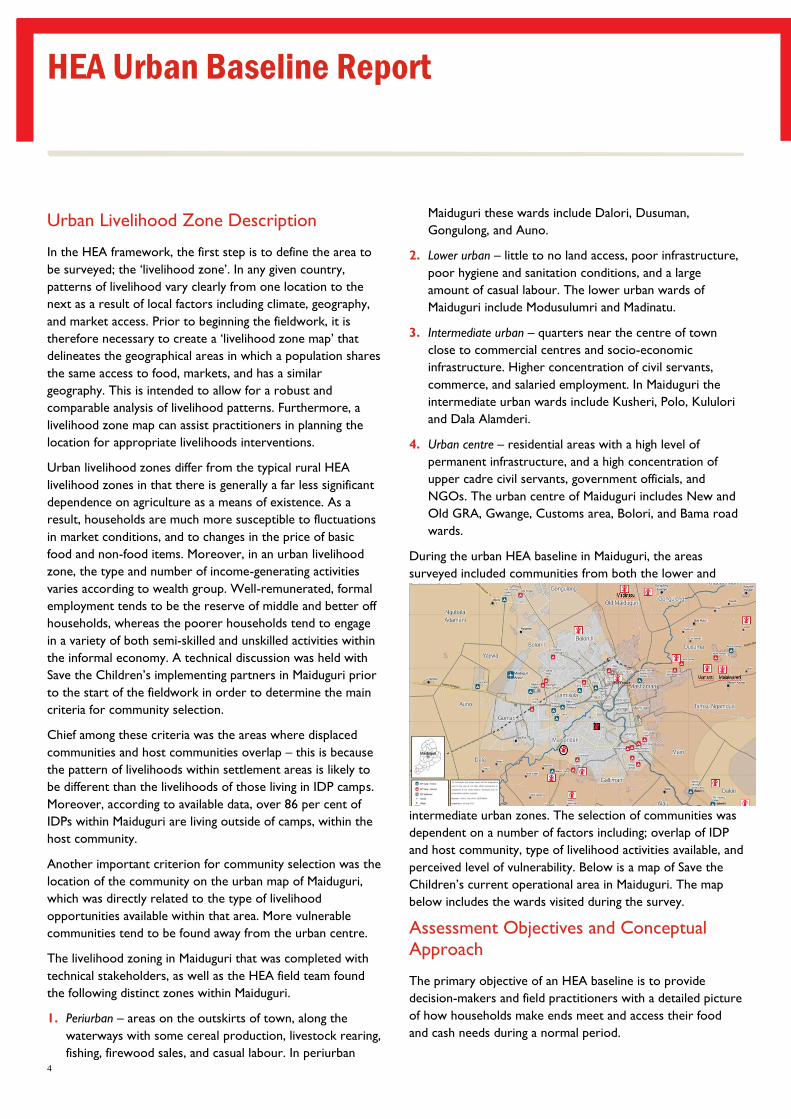
perceived level of vulnerability. Below is a map of Save the
Children’s current operational area in Maiduguri. The map
below includes the wards visited during the survey.
Assessment Objectives and Conceptual Approach
The primary objective of an HEA baseline is to provide
decision-makers and field practitioners with a detailed picture
of how households make ends meet and access their food
and cash needs during a normal period.

HEA Urban Baseline Report
5
Urban HEA baselines differ from the typical rural baseline in
their conceptual approach. In rural settings it is useful to
distinguish between how better off and poorer households
obtain access to food and income because within rural areas,
members of a given wealth group tend to share a similar set
of livelihood strategies that allow them to obtain food and
income. In urban settings, however, the predominance of
market access (and the higher level of market dependence)
means that access to multiple income-generating activities is
higher, and access to a variety of food sources is common.
The basis of enquiry for an urban baseline therefore shifts
from a focus on agriculture to a focus on cash income and
expenditures. This is because although income-generating
activities in urban settings tend to be heterogeneous, patterns
of expenditure do not. It is typical to see poorer households
spending in a similar way on similar items. Within an urban
livelihood zone, the types of income-generating activities tend
to be an important distinguishing factor between wealth
groups.
The information gathered during an HEA baseline typically
corresponds to a ‘normal’ year for livelihood and food
security within a given livelihood zone. In an agricultural
setting, a normal year could be considered to be a recent
year in which harvest yields were average and rainfall was
adequate. The concept of a ‘normal’ year is less easily applied
to urban settings due to the rapidly growing and shifting
nature of many urban economies in the developing world.
This is particularly true for conflict-affected settings where
displacement, NGO assistance and insecurity have become
the new normal. For this HEA baseline, the reference year
was taken as the twelve months preceding the survey, March
2016 to February 2017. The recent reference year improved
the ability of recall among household representatives during
the interviews.
However, due to the volatile nature of the security situation,
as well as the rapidly changing economy that is typical of
urban areas, the current baseline results are not expected to
remain valid for as long as a typical rural baseline. It is likely
that the results of the urban HEA baseline in Maiduguri will
need to be revalidated again next year.
Due in part to the urgent need to understand and quantify
livelihood strategies among vulnerable households in
Maiduguri, and in part to the considerable differences
between poorer and better of livelihood options, it was
decided that the urban baseline in Maiduguri should focus
only on the poorest households: the very poor and poor.
Additionally, it was considered important to understand what
differences exist between the host and the IDP community at
the level of the most vulnerable households. This urban study
consists of two baselines: one for the very poor and poor IDP
households, and one for the very poor and poor host
community households.
It is critical to note that the results of this HEA are valid only
for the livelihood zone in which the HEA was conducted:
Maiduguri Lower and Intermediate Urban livelihood zone.
The results of this HEA cannot be extrapolated to displaced
or host community households living outside of this zone.
A comparison between the livelihood options, and the level
of access to food and cash income between very poor and
poor host and IDP households will provide a critical
understanding of what makes households vulnerable within
the communities forming part of the livelihood zone.
Importantly, it will also highlight whether in fact there are
significant differences between the most vulnerable among
the IDP and the host community.
The final section of this report will draw comparisons
between the poorest among the IDP and the host community
to aid practitioners in understanding the key differences and
similarities between these wealth groups that can be
important in targeting interventions.
Fieldwork constraints
As with any type of fieldwork, this baseline was subject to a
number of both logistical and conceptual constraints. Most
significantly, completing fieldwork in an urban centre affected
by conflict and displacement made security considerations
paramount when planning for team movement and organising
community meetings.
The community representative interviews from which the
wealth breakdown is derived were held at community level,
and mobilisation occurred for the follow-up household
representative interviews. The household representative
interviews were held with community members in the Save
the Children office in Maiduguri. The decision was taken not
to expose either community members or enumerators in the
sun in crowded communities for extended periods of time.
The remainder of this report will investigate the livelihoods
and coping strategies of both the host community and the
IDPs, before concluding with an analysis of coping strategies
and a projected outcome.
HEA Urban Baseline Report
6
Host Community Livelihoods
The insecurity in the northeast continues to affect livelihoods
within the host communities. Most farmlands are located on
the outskirts of town and are currently inaccessible due to
frequent attacks on farmers. This has largely reduced farm
activity, affecting both food and cash from agricultural labour.
The presence of the displaced population within the
community also resulted in increased staple food prices,
renting costs, reduced labour wage, and an increase in
household size as some displaced households depend on their
host relatives and friends thereby increasing household
expenditure.
Wealth Breakdown
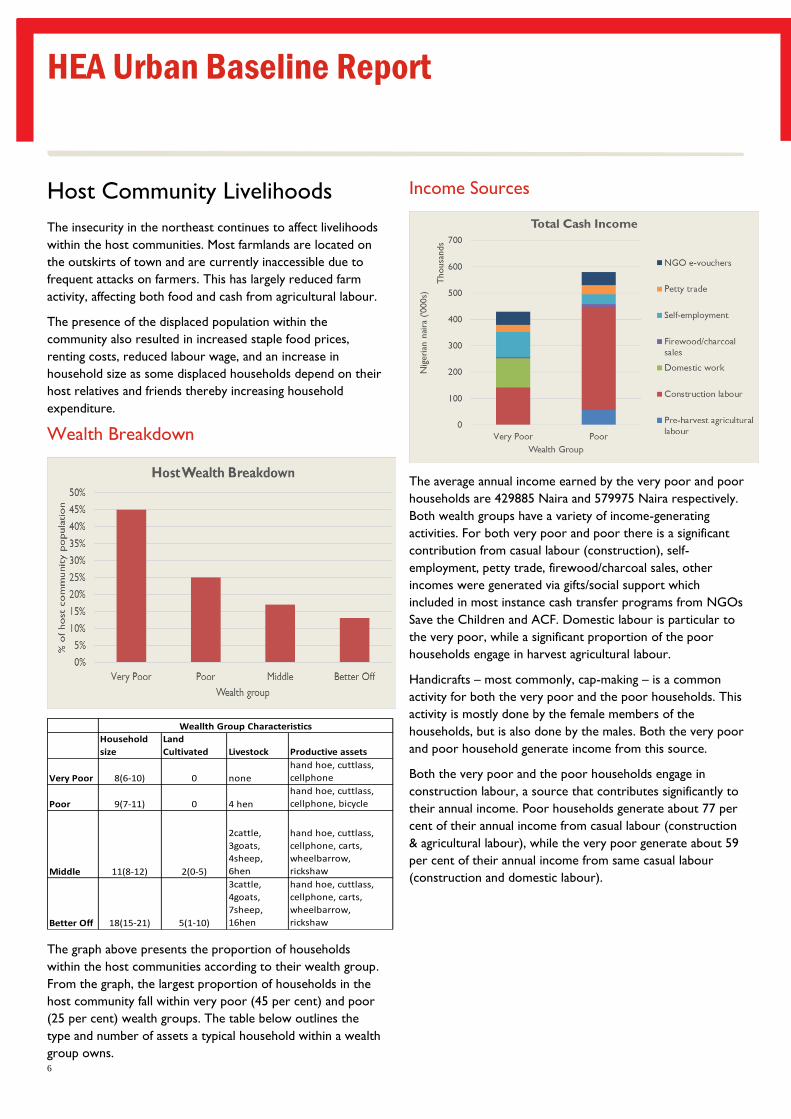
The graph above presents the proportion of households
within the host communities according to their wealth group.
From the graph, the largest proportion of households in the
host community fall within very poor (45 per cent) and poor
(25 per cent) wealth groups. The table below outlines the
type and number of assets a typical household within a wealth
group owns.
Income Sources
The average annual income earned by the very poor and poor
households are 429885 Naira and 579975 Naira respectively.
Both wealth groups have a variety of income-generating
activities. For both very poor and poor there is a significant
contribution from casual labour (construction), self-
employment, petty trade, firewood/charcoal sales, other
incomes were generated via gifts/social support which
included in most instance cash transfer programs from NGOs
Save the Children and ACF. Domestic labour is particular to
the very poor, while a significant proportion of the poor
households engage in harvest agricultural labour.
Handicrafts – most commonly, cap-making – is a common
activity for both the very poor and the poor households. This
activity is mostly done by the female members of the
households, but is also done by the males. Both the very poor
and poor household generate income from this source.
Both the very poor and the poor households engage in
construction labour, a source that contributes significantly to
their annual income. Poor households generate about 77 per
cent of their annual income from casual labour (construction
& agricultural labour), while the very poor generate about 59
per cent of their annual income from same casual labour
(construction and domestic labour).
Household
size
Land
Cultivated Livestock Productive assets
Very Poor 8(6-10) 0 none
hand hoe, cuttlass,
cellphone
Poor 9(7-11) 0 4 hen
hand hoe, cuttlass,
cellphone, bicycle
Middle 11(8-12) 2(0-5)
2cattle,
3goats,
4sheep,
6hen
hand hoe, cuttlass,
cellphone, carts,
wheelbarrow,
rickshaw
Better Off 18(15-21) 5(1-10)
3cattle,
4goats,
7sheep,
16hen
hand hoe, cuttlass,
cellphone, carts,
wheelbarrow,
rickshaw
Weallth Group Characteristics

HEA Urban Baseline Report
7
Food needs
The graph above illustrates the total percentage of food
needs being met by all food sources consumed by host
community households during the reference year.
Poor households met 104 per cent of their food needs, with
food gained from coping strategies included. More than three
quarters of their food needs came from staple purchase, and
almost a third from non-staple purchase (28 per cent). Very
poor only met 97 per cent of their food needs (of which 68
came from staple purchase and 23 per cent from non-staple
purchase), even with the application of various coping
strategies.
The key staple food purchased is maize grain, which
contributes 47 per cent and 32 per cent to the poor and very
poor household food needs respectively; this implies that the
major food purchase for these households is maize. Purchase
on maize flour contributes 19 per cent and 8 per cent of the
food needs for the poor and very poor respectively. Poor
households purchase more maize grain than the very poor.
When ground, maize grain provides both maize flour and grit,
both of which can be prepared separately as meal. On the
other hand, the very poor, in an attempt to reduce
expenditure on grinding purchase more maize flour. The
opposite trend is found among displaced households, who
prefer to purchase maize grain, but only do so when they
receive e-vouchers.
Labour exchange – food received in exchange for work
performed – contributes 7 per cent to very poor households’
food needs. Local rice purchase for the very poor and poor
contributes 14 per cent and 18 per cent respectively to these
wealth groups’ annual food needs.
Other items purchased include wheat flour, beans, sweet
potatoes, dry fish, palm oil, vegetable oil, groundnut, sugar,
and vegetable. The poor purchase yam and fruits occasionally.
Expenditure Patterns
The graph above highlights the pattern of expenditure across
the two wealth groups.
The major expenditures for the poor and very poor in the
host community are, in descending order of importance,
staple food, non-staple food, household items (tea, salt, soap,
firewood and grinding), water, social services (school fees and
medical bills), clothing and transport. Expenditure on tea is
specific to the poor households, as the very poor do not
purchase tea.
The lower annual expenditure of the very poor is largely
because of the difference in total income as well as household
size. Very poor households spend on average 21 per cent less
than the poor on staple food, 33 per cent less on non-staple
and 25 per cent less on water.
Coping Strategies
The most common coping strategy among very poor
households, is the reduction in the number of meals per day.
Poor households tend to cut down on the meal size. The very
poor households increase the amount of domestic work to
increase income. Among the very poor, women and children
within the households also practise begging.
The poor and very poor households pull children out of
schools to cut down expenditure. Once out of school, these
children are sent to hawk in the markets.
Both wealth groups increase the amount of casual labour in
order to increase their income during a bad year. This

HEA Urban Baseline Report
8
includes carrying goods for both traders and customers at the
market.
Both wealth groups cut down expenditure on rice, etc. which
are more expensive to cheaper staple.
Displaced Community Livelihoods
The ongoing insurgency in the northeast of Nigeria continues
to have a profound impact on the lives and livelihoods of
those displaced by the violence and conflict, as well as those
who host them. A significant number of those displaced have
been living in Maiduguri for at least two years if not more. As
such they have become a more or less permanent fixture on
the landscape of the urban centre.
The majority of the IDP households interviewed by the field
team during this baseline hailed from the local government
areas (LGAs) most predominantly affected by the Boko
Haram insurgency: the LGAs surrounding the Sambisa forest
axis (Bama, Gwoza, and Konduga). Maiduguri also plays host
to IDPs from Jere, Monguno, Kalabage, Ngala, Damboa,
Damasak, Marte, and Guzamala.
Those who have fled the insurgency and made it into
Maiduguri have come by foot, by car, and in some cases,
through neighbouring countries such as Cameroon and Niger
to Borno’s capital city. While here, those with relatives and
friends have been able to rely on their social networks to find
shelter, clothing, and much-needed cash for their households’
survival. Those without such social capital struggle to make
ends meet, in spite of receiving a warm welcome from the
host community. Indeed, it is the social, financial, and physical
capital with which displaced families fled that determines their
level of wealth within the host community. This section will
focus on the livelihood and coping strategies of displaced
households, and will look in detail at their annual cash and
food income sources, and their ability to spend what they
earn.
Wealth Breakdown
The graph above summarises proportion of households within
the IDP community falling into each wealth group. The table
below it summarises the types and numbers of productive
assets that typical households within each wealth group own
and/or manage. As the graph demonstrates, the largest
percentage of households fall within the very poor and poor
wealth groups.
The wealth breakdown for IDP households was designed to
understand the determinants of wealth among the IDP
communities within Maiduguri since the displacement began.
Accordingly, the vast majority of IDP households residing in
Maiduguri (over two thirds) are either poor or very poor.
Relative levels of wealth within one’s community of origin do
seem to influence one’s wealth group within the settlements,
Household size Land cultivated Livestock Productive assets
Very Poor 6 (5-7) 0 nonehand hoe, cutlass,
cellphone
Poor 8 (7-10) 0 nonehand hoe, cutlass,
cellphone
Middle 9 (8-10) 0.5 Ha (0-1) 1-2 goats; 0-1 sheep
hand hoes, cutlass,
cell phone, cart,
rickshaw,
wheelbarrow
Better Off 11 (9-15) 1 Ha (0-2) 2-3 goats, 1-2 sheep
hand hoes, cutlass,
cell phone, cart,
rickshaw,
wheelbarrow
Wealth Group CharacteristicsVendor stall from which beneficiary households purchase their monthly food needs.

HEA Urban Baseline Report
9
however, these were not found to be a key influence on a
household’s level of wealth.
The main determinant of wealth among IDPs appears to be
possessing the social, physical, and financial capital to support
one’s household in a context of displacement. Better off
households typically rely on government salaries (although
they are no longer working since having been displaced), and
as a result they are more resilient to the type of shocks faced
by households who have been displaced, including lack of
shelter, transport, food, and livelihood sources. Better off and
middle IDP households also tend to own productive assets
such as generators, bicycles, carts, kiosks, and in some cases
even shops. Both better off and middle households have the
capacity to rent land and to cultivate. Some even own
livestock. Both better off and middle households engage in
trading and small businesses including taxi driving, key-cutting,
tailoring, carpentry, and the selling of animal hides. A key
distinction between better off and middle households is that
the former can own the land that they live on, whereas
middle households are either renting or living with relatives.
Poorer households have recourse to few if any of the types of
capital available to middle and better off households. Most
poor and very poor households were engaged in farming,
fishing, and livestock rearing in their communities of origin
and they came to Maiduguri having little capital to begin with.
Poorer households tend to be engaged in both semiskilled
and non-skilled casual labour, as well as agricultural labour.
They do not own either land or livestock, although in their
communities of origin these assets may have been their
principal source of livelihood.
Household size increases with wealth among the IDPs. Better
off households are generally able to take in children from
poorer households, including from their own poorer
relatives. For their part, very poor households can send
between two to three children to be looked after by the
better off.
Poor households typically send one to two children to the
better off. These children help their hosts with domestic
work, and in turn, the better off households pay for them to
attend government schools. Very poor households are
typically around 7 people, and poor households are typically
around 8 people. The typical composition of a very poor or
poor household includes a mother, father, and four to six
children, including infants.
Income Sources
The graph above illustrates the total cash income for very
poor and poor IDP households during the reference year.
Very poor households earned on average 285,670 Naira
throughout the year, and poor households earned 396,650
Naira. The legend on the right indicates the different income-
generating sources – some of which are shared by both very
poor and poor households (such as pre-harvest agricultural
labour, and NGO e-vouchers/cash transfers), and some of
which are exclusive to a particular wealth group, such as
water vending.
Although poor and very poor households both tend to
engage in semiskilled and unskilled labour, the types of
income-generating activities performed by each wealth group
are an important indicator of their status within the
community.
Very poor households, with little to no social, physical, or
financial capital tend to perform domestic work such as
laundry and housekeeping for the better off within their
communities. Very poor households are also more typically
engaged in self-employment activities such as water vending
and charcoal sales, as they lack the skills to perform the
semiskilled labour activities such as carpentry and
construction that are done by the poor households.
Domestic work is the domain of women, as is cap-making,
which is an important income-generating activity for women
in both very poor and poor households. The ability to learn a
skill such as handicraft-making is a lifeline, particularly to
female-headed households, who often depend almost
exclusively on the income they receive from cap-making to
sustain themselves and their children throughout the year.
Women from very poor and poor households are also
engaged in small-scale petty trade such as selling sundry items

HEA Urban Baseline Report
10
from a small table outside their homes. Approximately forty-
one per cent of very poor households’ annual income is
generated through self-employment activities.
Men in very poor households are typically engaged in
agricultural labour (both pre- and post-harvest), and water
vending. Within very poor households, it is typically only the
man (father) who can go to engage in agricultural labour.
Poor households have access to more human capital, and the
father typically goes to work with an older child from within
the household. To do their water vending, very poor
households rent carts and jerry cans from middle and better
off households within the host community. They pay the
borehole owners within their communities to fill up their
jerry cans, and then push the jerry cans around the
community selling water on a daily basis, during the dry
season. These activities are included under ‘self-employment’.
Poor households make the bulk of their annual cash income
(sixty per cent) from casual employment activities such as
house construction, brick production, and carpentry. They
are not as skilled carpenters as the middle households, and
typically make chairs and furniture to sell within the
communities. However, although poor households have more
stable sources of income, construction-related work tends to
dip during the rainy season
E-vouchers and cash transfers from NGOs, most prominently
Save the Children’s e-transfer system, constitute a significant
proportion of both very poor and poor households’ annual
income. For very poor households, NGO assistance makes
up a third of their income. Poor households are receiving just
under a quarter of their income from NGO assistance. On
average, IDP households were receiving this assistance for
five months of the reference year.
Because households could receive transfers from NGOs both
as cash or as vouchers, the decision was made to show this
under total income, for the purpose of comparing the
proportion of household income coming from this source. A
later section on the Impact of NGO Transfers draws a
comparison between total monthly food expenditure and e-
vouchers, and compares this with the total income received
per household in each wealth group.
The difference between the total cash income (minus NGO
assistance) of the very poor and poor households can be
attributed to the fact that poor households, due to their
higher physical and social capital, have access to more stable
income-generating activities. Casual employment guarantees a
certain daily level of cash-in-hand, and moreover occurs at
regular intervals during the year. Overall, poor households
are earning twice as much from casual employment (their
main source of income), as the very poor are earning from
self-employment (their main source of income).
Food needs
The graph above illustrates the total percentage of food
needs being met by all food sources consumed by IDP
households during the reference year. Neither very poor nor
poor IDP households were meeting 100% of their food needs
during the reference year. More than sixty per cent of both
very poor and poor household kilocalorie needs were met by
staple purchase alone. Maize grain contributes the greatest
percentage of kilocalorie needs (24 per cent) to very poor
households. Poor households receive the largest proportion
of their food needs from maize flour (27 per cent). Both very
poor and poor households prefer to purchase maize – either
in flour or as grain – rather than rice. Indeed, it is interesting
to note that household expenditure patterns on key staple
food items changed quite considerably since they began
receiving e-vouchers and cash assistance. Prior to receiving
assistance, many households limited their purchase of staple
foods to maize flour and, very occasionally, local rice. With
the e-vouchers, however, many households are purchasing
imported rice – the preferred type of rice due to its higher
quality – and maize grain instead of maize flour. According to
the beneficiaries, maize grain bought in mudus and then
ground yields a higher volume of flour than purchasing maize
flour directly from the vendor. This method has the additional
advantage of producing maize grit, which is both consumed
and sold by the household. Poor and very poor households
are also buying maize grit.
‘Other’ items include vegetables, oil, beans, sweet potatoes,
dried fish, pasta, and groundnut. These items are critical in
providing a balanced diet to all IDP households, including
beneficiaries. However, given the low frequency with which

HEA Urban Baseline Report
11
households are purchasing these items, it is unlikely that their
diet – which comprises over sixty per cent of staple foods –
is sufficiently varied to meet their micronutrient needs.
The e-vouchers households receive from Save the Children
can only be used to purchase food, from a specific food
basket including a number of grains, pulses, salt, and oil.
However, across the communities surveyed, households
were receiving assistance from multiple NGOs, although at
different periods of the year. This was taken into account
under their income sources, and the amounts shown below
represent the average amount received by households from
all NGOs1. Very poor households received about 88,210
Naira, and poor households about 96,750 Naira in e-vouchers
throughout the course of the reference year. These
comparisons are discussed further in the section on the
Impact of NGO Transfers. Some households received in-kind
assistance during the reference year from organisations such
as Oxfam and Dangote. However, the amount received was
often small and rarely contributed more than a small
percentage of annual kilocalorie needs for households.
As mentioned, household purchasing patterns changed quite
substantially after they began receiving e-vouchers – for
example, households increased their consumption of both
local and imported rice. Households also began to buy in
larger quantities upon receiving e-vouchers. Indeed, a WFP
report produced in 2016 indicates that over two thirds of
IDPs had either poor or borderline food consumption during
the previous year2.
The graph above makes clear, however, that without
resorting to coping strategies such as begging and asking for
handouts from better off households, neither poor nor very
poor IDP households would be meeting even ninety per cent
of their needs. Households consuming below this threshold
for extended periods of time are most likely beginning to
starve. Given the precariousness of their livelihoods, it is
expected that the most vulnerable IDP households will
engage in coping strategies in order to meet their needs.
However, resorting to negative and damaging coping
strategies, such as sending children to beg in the markets and
at night at the houses of the better off, risks further degrading
IDPs’ livelihoods below a level which is sustainable.
These strategies are discussed in a later section of this report.
1 HEA includes only the sources of food, income, and expenditure that are
‘most common’ among households of a particular wealth group.
Expenditure Patterns
The graph above shows a breakdown of total annual
expenditures for very poor and poor households. The values
are shown as a percent of total expenditure, rather than as
absolute expenditure, to allow for comparison across the two
wealth groups. Both wealth groups spent almost exactly as
much as they earned during the reference year, and were not
generally able to save money.
The first thing that is clear from looking at the graph is that
very poor and poor households are spending an almost
equivalent proportion (approximately fifty per cent) on staple
foods. When compared to the previous graph on food
income, it is clear that very poor and poor households have
different preferences for staple foods purchased. Very poor
households have a preference for maize grain, whereas poor
households prefer to buy maize flour. Maize grain requires
grinding, which is an extra cost to households. The extra cash
very poor households are spending on grinding grain (and
other staples including sorghum and millet) is reflected under
‘other’ expenditure which, as can be seen on the graph, they
spend more on than poor households. It is unclear why very
poor households prefer to purchase maize grain, which would
incur the cost of grinding. It is possible that they calculate
having a higher total edible yield, rather than prioritising the
overall cost of eating maize grain, which would include paying
for grinding.
Poor households spent more of their total cash income on
food (both staple and non-staple purchase) than very poor
households. For both wealth groups, more than seventy per
2 See reference in bibliography.
HEA Urban Baseline Report
12
cent of their total cash income during the reference year was
spent on food.
Very poor households are spending a similar amount of their
income on household items to the poor. However, because
their overall income is lower than that of the poor by
approximately 100,000 Naira, very poor households are
consequently spending a larger proportion of their total
expenditure on household items. This can also be attributed
to the fact that very poor households are spending more on
charcoal and firewood throughout the year3. On most
household items, including tea, salt, soap, Vaseline, matches,
and sanitary items and diapers, poor households are spending
slightly more than very poor households.
Poor households are sending their children to government
schools, and are paying for their school fees. Very poor
households do not tend to send their children to school, and
those who do prefer to send their children to Islamic schools,
which are free to attend.
Coping Strategies
For very poor households, begging – for both food and
money – is by far the most common coping strategy. They
will typically send their children and sometimes women to
markets and to the homes of the better off households to
beg. When children bring home food – typically leftovers
from better off households – the meal is rarely sufficient for
anyone besides the children themselves. This practice
contributed a small percentage to the household kilocalorie
needs during the reference year. Reduction in the number of
meals per day, and reducing the portion size of meals are also
common coping strategies among poorer households, who
tend to live hand-to-mouth and may not have the ability to
purchase the food necessary to meet their needs on a daily
basis4. Those who are able to do so rely on their relatives for
food. In a number of communities, better off households give
bags of rice and smaller items such as salt and Maggi to the
poorer households within their community.
Some households also collect and sell more firewood during
hard times. Wild food collection in the nearby bush is also a
common coping strategy among the vulnerable displaced
households. However, venturing far into the bush is a risk to
individual security, as insurgents are known to hide out in
these areas.
3 Very poor households live on a lower daily income than poor households
and as a result they buy charcoal and firewood on a daily basis, whereas poor households prefer to buy in large bags. As a result, very poor households ultimately spend more in total on firewood/charcoal than poor households. 4 WFP, 2016.
For households that perform casual employment, they will try
to increase the number of hours per day worked during a bad
year. However, this is not always possible due to a high
supply but limited demand for workers. For agricultural
labour, households can double the number of people per
household working as well as the number of days worked.
Analysis of livelihood and coping
strategies
Livelihood strategies
A comparison of host community and displaced community
livelihood and coping strategies can help humanitarian
practitioners to understand where the primary differences lie
between the lives and livelihoods of the most vulnerable
among both communities.
Both the very poor and poor host community households are
earning more than their displaced counterparts. On average,
very poor IDPs are earning 30 per cent less than very poor
hosts, and poor IDPs are also earning thirty per cent less than
poor hosts. Indeed, although both host and displaced
households are earning their income from similar sources,
proportionally, host communities earn more from semiskilled
and skilled labour activities than the displaced households.
Both very poor and poor host community households earned
the bulk of their income during the reference year from
casual employment activities such as construction labour and
domestic work. Construction labour accounts for 30 per cent
of very poor households’ annual income, and 67 per cent of
poor households’ annual income. Poor IDP households also
earned a significant proportion of their income from
construction labour.
According to information gathered during the HEA
interviews, a significant number of the displaced households
were engaged in farming and fishing activities before fleeing to
Maiduguri. Displaced households appear to be earning more
from agricultural labour activities than the host community.
Among the latter, only poor households engage in harvest
labour5. It remains unclear whether displaced households
have been able to undertake any of the same income-
generating activities within Maiduguri from their communities
5 It is possible that host community households moved more towards
construction labour as a source of income as the displacement intensified. However, a further analysis would be required to determine whether or not this was the case.

HEA Urban Baseline Report
13
of origin. Indeed, some activities such as cap-making – which
is generally done by IDP women – were skills learned from
neighbours within the host community and settlements.
However, those women who engaged in cap-making prior to
displacement were in a better position to be able to gain
some small income from this activity.
It appears that social, financial, and physical capital are
important not only in determining the level of wealth at which
displaced households find themselves within the host
community, but they are also key to a household’s ability to
earn a stable income. Very poor IDP households have limited
physical capital, and are less able to engage in skilled or
semiskilled activities such as construction work.
Consequently, they earn most of their income from self-
employment activities including cap-making, water vending,
firewood and charcoal sales, and petty trade. While their
livelihood strategies are more diversified than those of either
the poor IDPs or the poorest among the host community,
very poor IDP households remain more vulnerable. Their
livelihood sources are less stable, and more precarious than
construction labour, which supplies a reasonably regular and
guaranteed amount of cash for a household.
Female IDPs in particular have limited access to income-
generating activities. They generally engage in handicraft-
making, domestic work, and petty trade. The income that
women are able to earn from handicrafts and petty trade
contributes approximately 20 per cent to very poor IDP
household annual income, or about 58,000 Naira per year.
Female-headed households, while not considered
representative of any wealth group among the IDPs, are in a
highly vulnerable position, as their ability to generate enough
income for them to meet their needs on a monthly or even
daily basis is uncertain. Moreover, investment in an activity
such as petty trading – where buying the sundry items for re-
sale can cost a significant amount of what female households
earn – may not ultimately be a very profitable livelihood
strategy. A more detailed analysis of the livelihood strategies
available to female-headed households may be necessary to
determine the impact these activities have both on household
income, and childcare within the household. This is discussed
in the section on Recommendations.
Based upon the HEA analysis, it is clear that among the most
vulnerable households, the ability to engage in semiskilled or
skilled labour is key to securing a higher level of income.
Nonetheless, this is not sufficient to prevent households from
engaging in negative coping strategies.
Coping strategies
Coping strategies are the strategies households employ to try
and increase their food and cash income after a shock.
Households at different levels of wealth will employ different
coping strategies, depending on the resources and assets they
have available to them. Understanding what coping strategies
are available to households, and the extent to which these
options can contribute to food and cash income is important
in analysing the overall impact of a shock on access to food
and cash. It is important to note that these are strategies that
are being employed over a long period of time, during which
households are already facing crisis levels of food insecurity.
Very poor and poor households from both the host and
displaced communities engage in similar coping strategies to
increase income such as increasing the number of days
worked for casual labour. Households also try to increase
their firewood/charcoal sales.
Apart from the aforementioned strategies, it appears that the
poorest among the host and IDP communities generally
employ negative coping strategies such as sending children to
beg, reducing the number and size of meals, and pulling
children out of school. Very poor IDP households generally
do not send their children to school, due to the cost of
purchasing the necessary items such as books and uniforms.
Poor IDP households can send their children to school.
Pulling children out of school was noted as a common coping
strategy among the host community households.
Increased firewood sales – a common strategy, and indeed
one that is employed by more than one wealth group – is
considered a negative coping strategy, due to the irreversible
impact it has on the environment. Moreover, there is an
additional security risk to households that venture into
insecure areas outside of Maiduguri to collect firewood.
That households from both the host and the displaced
community are engaging in negative coping strategies is
symptomatic of the impact high levels of displacement have
had upon the community as a whole.
Impact of NGO transfers
NGO transfers had a very tangible impact on IDP households’
ability to meet their needs during the reference year.
As aforementioned, very poor and poor IDPS households
received 88,210 Naira, and 96,750 Naira respectively in e-
vouchers during the reference year. Respectively, this sum is
enough to cover 60 per cent of staple food expenditure for

HEA Urban Baseline Report
14
the very poor, and 50 per cent of staple food expenditure for
the poor. When non-staple expenditures are included, the e-
voucher is sufficient to cover 41 per cent of food expenditure
for the very poor, and 32 per cent of food expenditure for
the poor. It is worth noting that these sums are being
compared to very poor and poor IDP households’ annual
expenditures. Comparing the SCI e-voucher sum of 17,000
Naira per month to the monthly food expenditures will yield
a slightly different result.
The graphs below for the IDP and host community
households depict a comparison of monthly food expenditure
with the average monthly e-voucher transfer amount of
17,000 Naira. This is based on the SCI monthly e-transfer
amount, intended to cover 70 per cent of household food
needs.
Overall, host community households – due in part to their
larger household sizes, and their greater income levels – are
spending more per month on food. Consequently, the e-
vouchers they receive cover a smaller proportion of their
monthly food expenditure than that of the IDPs. It is
important to note that neither IDP nor host households were
receiving e-vouchers for all months of the reference year
(March 2016-February 2017). Moreover, for both hosts and
IDPs, purchasing patterns of staple foods changed upon
receiving e-vouchers. Prior to receiving vouchers, households
were buying more frequently – daily or weekly – and in
smaller amounts – half mudus (‘shakade’). Upon receiving e-
vouchers, households began to buy in bulk, in mudus, on a
monthly basis. However, due to the limitations of the data
collection software, the amount purchased is reflected for the
whole year.
The items included as part of food expenditure are shown
below.
Households were typically only receiving e-vouchers for
around 5 months of the reference year. When IDP
households began receiving e-vouchers, the amount they
received, as can be seen in the graph above, over two thirds
of their monthly food expenses. These figures differ from
those given above in the IDP Food Needs section because the
total amount from e-vouchers received during the reference
year covered slightly under half of household food needs (or
5 months).
For very poor IDP households, whose average household size
is six, 96 per cent of their monthly food expenditure is
covered by the transfer amount. For poor IDPs, whose
household size is eight, 66 per cent of their monthly food
expenditure is covered by the transfer amount.
For very poor host households, whose household size is
eight, 69 per cent of their monthly food expenditure is
covered by the transfer amount. For poor hosts, whose
household size is nine, 51 per cent of their monthly food
expenditure is covered by the transfer amount.
Food purchase items
Staple Non-staple
Rice (imported and local)
Maize grain
Maize flour
Millet
Sorghum
Wheat
Beans
Yam
Sweet potato
Dried fish
Palm oil
Vegetable oil
Pasta
Vegetables
Groundnut
Groundnut paste
Sugar
Fruits

HEA Urban Baseline Report
15
The poorest host community households have significantly
higher income levels than the poorest IDP households, and
they can secure more semiskilled labour jobs that guarantee a
stable source of cash. Additionally, the e-vouchers constitute
a proportionally smaller percentage of host community
households’ overall annual income levels than those of the
IDPs. As a result, host community households are less reliant
on e-vouchers to supplement their needs.
The following section will look at the outcome analysis that
was prepared for the urban livelihood zone in Maiduguri,
comprising lower and intermediate urban areas, as discussed
in the beginning of this report.
Outcome Analysis
Background on Outcome Analysis
One of the principal uses of HEA baseline information is to
investigate the effects of hazards on future access to food and
income, so that decisions can be taken about the most
appropriate types of intervention to implement. The output
of an outcome analysis is the ‘projected outcome’.
Understanding how people have coped in the past provides a
good basis for projecting their survival in the future. In order
to create a projected outcome, three types of information
are combined for the analysis; information on baseline access,
information on hazard (such as factors affecting access to
food and cash income) and information on coping strategies.
The approach can be summarised as follows:
Baseline + Hazard + Coping = Outcome
HEA outcome analysis provides a detailed modelling of the
total food or cash requirements needed to meet the
minimum food energy requirements (i.e. 2,100 kilocalories
per person per day) of households in different wealth groups.
In order to determine the appropriate levels of external
assistance that are required to protect households’ food
access and livelihood assets the model is based on the
assumption that households prioritize meeting their minimum
food energy requirement over other expenditure and that
they avoid the use of destructive coping mechanisms. By
leaving coping strategies out of the projected outcome, the
intention is to establish that an intervention should occur
before households resort to those strategies (e.g.
prostitution, child labour, begging, excess charcoal
production).
As mentioned in the introduction, HEA outcome analysis
models households’ ability to cope with a shock, in reference
to two clearly defined thresholds.
The first – survival – threshold, assesses whether households
can meet their food and cash needs to cover both food and
non-food items necessary for survival in the short term. In
the HEA baseline, the survival threshold is the cash required
to purchase the cheapest staple grain and a pulse in addition
to such basic items as salt and oil that are required to
prepare food. In this outcome analysis, the staple grain
selected for the survival basket is maize grain. Also included
under the survival threshold is the cost of grinding the grain
(required to prepare the food), and water for humans (if
purchased during the baseline).
The livelihoods protection threshold is the total income
required to sustain a locally-acceptable standard of living. This
includes cash required to cover the food and non-food items
in the survival basket in addition to the cash required to
maintain basic access to services, sustain livelihoods in the
medium to long term, and maintain a locally acceptable
standard of living. The items included in the livelihoods
protection basket are generated based on the key livelihoods
expenditures in the baseline. Host community households
possess a wider variety of baseline livelihoods protection
expenditures, and they spend more than IDP households. For
this reason, the items in the livelihoods protection basket
differ between these two groups, as does the total Naira
amount of the basket.
The items included in the livelihoods protection basket for
hosts and IDPs are shown below.
Livelihoods protection basket items
Hosts IDPs
Tea
Salt
Soap
Sanitary napkins
School expenses (poor HH
only)
Medicine
Tea
Salt
Soap
Sanitary napkins
School expenses
Medicine
Cosmetics
Jewellery

HEA Urban Baseline Report
16
Programme Implications of Outcome
Analysis Modelling for Maiduguri Urban Livelihood Zone
The primary objective of the outcome analysis conducted for
very poor and poor host community and IDP households in
Maiduguri was to model households’ ability to meet their
needs without cash or food assistance, and without recourse
to negative coping strategies such as begging and charcoal
sales. This is not intended to be used as an early warning, as
outcome analyses typically are, but rather to feed into
programme planning for decision-makers. Analysing the
impact of eliminating coping strategies and cash assistance
from households’ food and cash income demonstrates the
level of need among the IDP population.
The Livelihoods Integrated Analysis Spreadsheet (LIAS) used
to generate and model the projected outcome was set to
model food and income levels without access to coping
strategies. This is because the only quantifiable coping
strategies employed by households during the reference year
were negative (such as receiving food from begging). Access
to income-generating activities was set at 100 per cent of
baseline access. This means that households were considered
to have the same level of access to these activities as during
the baseline reference year (the twelve-month period prior
to the HEA study). The analysis therefore excludes the
percentage contribution to both cash and food income that
was generated from the aforementioned negative coping
strategies during the baseline.
The impact of seasonality on livelihoods activities was not a
particularly important factor during this baseline, since the
most vulnerable households among the host and IDPs were
not typically engaged in crop production during the reference
year. However, household purchasing power was certainly
influenced by the seasonal fluctuations in prices, as well as the
depreciation of the Naira towards the end of the reference
year. It is important to note, however, that agricultural and
livestock-rearing activities were an important source of
livelihood both for host community households and the
displaced before the insurgency began.
The data gathered in this baseline refers to a specific
reference year, in an urban zone within a humanitarian
emergency context. Therefore, it is critical to note that the
results of the baseline and the outcome analysis are specific
to this particular context. An analysis of seasonality would be
appropriate for a different livelihood zone, in a context where
households have not ceased to cultivate due to insecurity.
The table below highlights the amount, in Nigerian Naira per
year, required to cover IDP households’ survival and
livelihoods protection thresholds. Poor households are
regularly purchasing water during the reference year. This
expense is included under the survival threshold for poor
IDPs, which explains why the poor have a higher survival
threshold than the very poor.
IDP households – annual per household thresholds
in Nigerian Naira
Very poor Poor
Survival 332,451 445,358
LH protection 336,444 453,935
The figure for the livelihoods protection threshold includes
the total survival threshold, plus the extra cash required to
cover livelihoods protection expenditures. The livelihoods
protection amount for very poor IDPs is 3,993 Naira per
year. Poor IDP households’ livelihoods protection amount is
8,577 Naira per year. The figure for the livelihoods
protection threshold includes the total expenditure on
survival (Staple and non-staple food) needs, plus the extra
cash required to cover other non-survival household
expenditures such as education, medicine, and basic
household items. This amount is based on each wealth
group’s baseline spending.
The table below highlights the amount, in Nigerian Naira per
year, required to cover host community households’ survival
and livelihoods protection thresholds. Both poor and very
poor host community households are regularly purchasing
water during the reference year and as a result, this expense
was included in their survival basket.
Host community households – annual per
household thresholds in Nigerian Naira
Very poor Poor
Survival 444,509 503,378
LH protection 494,188 574,577
The livelihoods protection amount for very poor hosts is
49,679 Naira per year. Poor households’ livelihoods
protection amount is 71,199 Naira per year.
According to the parameters introduced to the LIAS as
mentioned at the beginning of this section, only very poor and

HEA Urban Baseline Report
17
poor IDP households are facing survival and livelihoods
protection deficits. Host community households are facing
neither a survival nor a livelihoods protection deficit. This
means that, with baseline access and coping strategies taken
into account, host community households have sufficient
income to meet 100 per cent of their kilocalorie needs, as
well as to cover their essential livelihoods expenditures.
Very poor and poor IDP households, as previously noted, are
earning significantly below the levels of their host
counterparts. Moreover, the proportion of annual income
coming from NGO e-vouchers is significantly higher for IDPs
than for hosts. NGO e-vouchers constitute 30 per cent of
very poor IDP annual income, and 24 per cent of poor IDP
annual income. Because IDP households are far more reliant
on NGO vouchers than host community households,
extracting this income from their total annual income results
in a significant deficit.
Without access to NGO vouchers or begging, very poor
households would face a survival deficit of 15 per cent while
the poor IDP households would face 2 per cent survival
deficit. According to IPC phase classification, very poor and
poor IDP households with survival deficits under 20% would
be placed under IPC phase 3. Both very poor and poor IDP
households are facing livelihoods protection deficits. Among
the IDP population in the LGAs of Jere and MMC, 71 per
cent of the population could be considered under IPC phase
3 or higher.
It is important to consider that neither very poor nor poor
IDP households were meeting 100 per cent of their
kilocalorie needs during the reference year. Indeed, very poor
IDP households were only able to reach above 90 per cent of
their food needs during the reference year by sending
children to beg for food, a negative coping strategy. As a
result, without cash assistance, very poor and poor IDP
households are already facing a deficit. Host community
households were not receiving any kilocalories from this
source, and consequently this was not factored into the
analysis of their food and income access.
The graph shown below depicts the baseline and current year
access to cash income for very poor IDP households, i.e., the
wealth group facing the most significant deficit.
The ‘total income’ shown in the left-hand column in the graph
above refers to the total percentage of kilocalorie needs that
are met if all available income is used to exclusively
purchase staple foods. The calculation for ‘total income’
assumes that, in the event of a hazard, households will use the
majority if not all of their remaining income to purchase food.
As can be seen from the column in the middle – ‘current
year’, i.e., the level of access households have without cash
assistance – very poor IDP households are falling below their
survival threshold. In other words, households have
insufficient cash of their own to cover 100 per cent of their
survival food and non-food needs.
The outcome analysis for the Maiduguri urban livelihood zone
was completed using IOM displacement tracking data (Round
XIV) for the total number of IDP households in MMC and
Jere LGAs. The population data used for host community
households is from Cadre Harmonisé 2016-2017 data.
Very poor IDP baseline and current year cash income access
compared with their survival and livelihoods protection
thresholds.

HEA Urban Baseline Report
18
With 71 per cent of the IDP population of MMC and Jere at
IPC phase 3 or higher, approximately 1,525 metric tonnes of
staple food would be required to fill the survival deficit of
households. If the survival deficit were to be filled with cash,
904,1936 US Dollars would be required to purchase the
necessary survival basket items. It is important to note that
these figures are for this particular livelihood zone. Moreover,
due to the difficulty in capturing accurate population data on
IDPs, it is possible that the needs are indeed higher.
The final section of this report will outline programmatic
recommendations based on the HEA data.
Recommendations
The results of an HEA baseline and outcome analysis can be
used to support a variety of programmatic and technical
objectives.
This section outlines briefly how the different elements of the
HEA conducted in the Maiduguri Urban livelihood zone can
be used in programme planning and implementation.
TARGETING
The HEA wealth breakdown details the factors that
distinguish between poorer and better off households,
according to locally-defined criteria. In an urban zone, as
aforementioned, access to social, physical, and financial capital
are the key determinants of household wealth. The wealth
breakdown section in both the host community and IDP
sections of this report contains the key characteristics that
distinguish between wealth groups. Between the host and IDP
communities, the main differences include the total income
level, and household size. Within each of the communities,
type of income-generating activity is critical to determining
whether a household is poor or very poor. Incorporating the
specific determinants of very poor and poor households into
beneficiary selection criteria during registration at the
community level permits humanitarian practitioners to target
the most vulnerable households within the community.
The key criteria for targeting both IDP and host community
households are shown in the table below.
6 This is based upon an exchange rate of 421.7 Naira to one US Dollar.
IDP Key targeting criteria
Very Poor Poor
Income At least 20% of
income from
self-employment
(cap-knitting,
water vending)
Earning income
from firewood
sales
Receiving cash
from begging
At least 40% of
income from
construction-
related work
Food Receiving food
from begging
At least 70% of
income spent on
food
At least 70% of
income spent on
food
Host Key targeting criteria
Very Poor Poor
Income At least 30% of
income from
construction-
related work
Earning income
from firewood
sales
At least 70% of
income from
construction-
related work
Food At least 70% of
income spent on
food
At least 70% of
income spent on
food
OUTCOME MEASUREMENT
HEA data provides relevant and useful information on
household key income sources, expenditure sources, and
food preferences. These elements could be used to define
outcome indicators for programme monitoring and
development. However, in the context of protracted
displacement in Maiduguri, where continuous population
movement and a lack of community cohesion are common,
using HEA data to determine outcome indicators may be
difficult.
MONITORING
Key parameters, in HEA, are sources of food or cash that
contribute at least 5 per cent to the total food or cash
income of one wealth group, or at least 10 per cent to the
total food or cash income of more than one wealth group.
Determining key parameters enables practitioners to
understand which factors are directly and indirectly affected

HEA Urban Baseline Report
19
by a particular shock or hazard7. The importance of
establishing key parameters is to have an indication of how
total access would change if these factors were affected. A
reduction in access to any of these key parameters would
disproportionately reduce a household’s ability to meet their
needs. This is particularly the case in a situation of conflict
and displacement, where households already struggle to meet
their minimum needs.
In an urban area, wage labour rates, as well as informal and
self-employment rates will likely be key parameters due to
the fact that households rely heavily on non-agricultural
income-generating activities. In addition, firewood and
charcoal prices and production levels are also likely to be key
parameters. The aforementioned factors will be both directly
and indirectly affected by the impact of a hazard. For example,
firewood production may rise as households increasingly turn
to this coping strategy to make ends meet.
The key parameters for both IDP and host community
households are listed in the table below. These should be
monitored to indicate potential losses or gains to local
household economies, either through on-going monitoring
systems or through periodic assessments. Knowing how
much households can expect to earn from these activities –
and whether the rates are being affected by the influx of
displaced households – is critical to understanding how
household purchasing power will be affected.
IDP key parameters
Very Poor Poor
Cash income Agricultural
labour (cultivation
& harvest)
Domestic work
Firewood/charcoal
Petty trade
Self-employment
(water vending,
handicrafts)
NGO e-vouchers
Agricultural
labour
(cultivation)
Construction
work
Petty trade
Self-
employment
(handicrafts)
NGO e-
vouchers
‘Other’ food Food from
begging N/A
7 More information can be found in the HEA Guide for Programme Planners and
Policy-Makers and the HEA Practitioner’s Guide.
Host key parameters
Very Poor Poor
Cash income Construction
work (house
construction,
digging latrines)
Domestic work
Petty trade
Self-employment
(handicrafts, hair
weaving, water
vendor)
Construction
work (house
construction,
painting, roofing,
brick
production)
Petty trade
Self-employment
(handicrafts)
NGO e-
vouchers
Additionally, key expenditure items for each wealth group can
be extracted from the baseline data. This can help to
determine which are the main items that require monitoring
as part of households’ key food and non-food expenditures.
Key expenditure items for Host and IDP
households
Non-food
IDPs Salt, soap, grinding, water
(poor HH only), school (poor
HH only), medicine, transport,
radio batteries, phones, phone
credit, sanitary items
Hosts Tea, salt, soap, grinding, water,
school, medicine, transport,
rent, radio batteries, phone
credit, festivals, electricity,
sanitary items
FOOD BASKET
There are multiple elements of the HEA baseline that can be
used to determine the items within the food basket. The two
baskets that are typically generated in an HEA study are the
survival and livelihoods protection baskets. However, the
survival basket calculates only the cost of covering 100% of
minimum staple and non-staple needs as defined by the HEA
basket – i.e., the main staple, pulse, oil, salt, grinding costs (if
appropriate), and water (if purchased). The HEA outcome
analysis process allows for the inclusion of only one key
staple in the survival basket. The key staple selected for this

HEA Urban Baseline Report
20
survival basket is maize grain. This is because it is the
cheapest staple grain, as well as the one that contributes the
largest percentage of kilocalorie needs to the majority of
households. It is also the staple of preference for the poorest
households. Household consumption preferences can be
determined using HEA baseline data.
The Naira amount for each wealth group’s survival basket
(indicated above in the outcome analysis section, and shown
in the table below) provides an indicative yearly amount
required to meet the survival needs for a typical household in
each wealth group.
IDP households – annual per household survival
threshold in Nigerian Naira
Very poor Poor
Survival 332,451 445,358
For instance, for a typical very poor IDP household of six
people people, the monthly survival threshold is
approximately 27,704 Naira8. Per person, the monthly
survival amount is therefore 4,617 Naira9. The per person
amount can be used as an indicative per capita transfer
amount. However, this depends both on the items in the
basket, and the person (i.e., whether they are a child, or
adult10). If using a per capita transfer to vulnerable
households, it is possible to use an average monthly HEA
survival basket amount based on the average of the very poor
and poor survival basket amounts.
However, it is important to note that these household sizes
will differ within and across wealth groups. HEA defines what
is most common among each wealth group. As such, the
survival threshold amounts for each of the wealth groups
should be considered indicative of household needs, rather
than as set amounts upon which to base a transfer value. This
is also due to the fact that the items in the HEA basket will
likely differ somewhat from the items included in typical
NGO food baskets.
A short guide on how to use the HEA survival basket
amounts in conjunction with per capita transfer values
modelled with the Cost of the Diet software will be
produced by Save the Children to accompany the
8 332,451 Naira per year divided by 12 months per year = 27,704 Naira per
month. 9 27,704 Naira per month divided by six people per household = 4,617 Naira
per person per month.
harmonisation work being carried out for the emergency
response in Borno.
LIVELIHOODS OPPORTUNITIES
The livelihoods of IDPs are likely to remain precarious within
the context of displacement, as households are uncertain
whether or when they can return home. Earning a decent
wage is very challenging for female-headed households in
particular, due to their limited physical capital, and their
additional childcare responsibilities.
Women tend to engage in income-generating activities that
require some start-up capital, such as cap-knitting, and petty
trade. They do not generally earn much income from these
activities on a monthly basis. For petty trade, they must
purchase their sundry items from the market, and for cap-
knitting they must also purchase the thread, cloth, and needle
to make their caps. Moreover, due to the lower quality of the
caps produced by IDPs, these women do not generate much
income from their sale.
Women who are relying solely on income-generating
activities such as petty trade could be provided with
conditional grants to expand their business. Combined with
vocational skills training that could provide the opportunity to
improve and diversify their skills, would aslo empower them
to negotiate for improved market prices for their products.
As skilled labour is a significant determinant of household
wealth, building the skills of vulnerable males in these trades,
while creating links with market actors would also significantly
impact longer-term income earning opportunities.
As such, it would be advisable to analyse in greater detail the
value chain of the livelihoods options of IDP households, and
compare them with the feasibility of the livelihoods activities
of the host community, in order to determine what livelihood
strategies exist for displaced households in the medium to
long term.
10 Different household members will have different food consumption needs
based on their age, weight, and level of activity.

HEA Urban Baseline Report
21
Limitations of the HEA data
The HEA data presented in this report can provide a useful
and informative basis for the development of program
activities such as targeting, developing the food basket and
transfer value, and setting monitoring items. However, there
are limitations to the data itself, and the way in which it can
be used.
To begin with, the HEA data is valid only for the livelihood
zone in which the data collection was completed. This will
likely differ from the areas of intervention targeted for each
organization. Moreover, this HEA did not assess middle and
better off households. However, wealth group characteristics
identified during the household interviews can be used to
improve targeting within communities.
HEA can inform the setting of transfer amounts, but food
basket composition must incorporate nutritional assessments
of individual goods, prices, and availability. The items included
in the HEA survival basket are also likely different from the
baskets determined per organization. The items used to
calculate the survival deficit for this HEA are: maize grain,
beans, salt, and oil. As such, the survival deficit amounts
shown in this report should be taken as an indicative, rather
than a set amount for a transfer value.
The HEA baseline includes income earned from negative
coping strategies. The outcome analysis does not. Thus, the
fact that a household does not face a survival deficit does not
imply that they are not vulnerable; it demonstrates the extent
to which they are relying on unsustainable strategies to cope
with a shock. All response analysis must factor this in.
Moreover, seasonality was not considered in the outcome
analysis, because it did not have a significant impact on
households’ income-generating activities during the reference
year. However, seasonal price fluctuations must be
considered to determine transfer value. These fluctuations, as
well as the inflation rate were taken into consideration during
the outcome analysis.
Finally, HEA outcome analysis data identifies total cash and
food requirements to meet household kilocalorie and cash
gap for households within the defined livelihood zone, but not
the total funding gap needed for a response.
Female IDPs knitting caps for sale in their local community,
Jiddari Polo.

22
References
2007. The Food Economy Group. The Practitioner’s Guide to HEA
2008. Save the Children Fund and The Food Economy Group. The Household Economy Approach: A guide for programme planners
and policy-makers.
2016. World Food Programme. Emergency Food and Nutrition Security Assessment in Maiduguri Urban Area – Borno State, Nigeria.


