Page 1
DISSERTATION
BLOOD PRESSURE PATTERN AMONG APPARENTLY HEALTHY
SECONDARY SCHOOL ADOLESCENTS IN JALINGO TARABA STATE
THIS DISSERTATION IS SUBMITTED IN PART FULFILLMENT OF THE
REQUIREMENTS FOR THE AWARD OF THE FELLOWSHIP OF THE
NATIONAL POSTGRADUATE MEDICAL COLLEGE OF NIGERIA IN
THE FACULTY OF PAEDIATRICS
BY
DR PETER TERU YARU (MBBS UNIMAID 1998)
MAY 2015
2
DECLARATION
I hereby declare that this dissertation is original It has not been presented by me or any other
person to another college or submitted elsewhere for publication
Date and Signature___________________________________________________
Dr Peter Teru Yaru
3
ATTESTATION
We certify that this dissertation was carried out by Dr Peter Teru Yaru of the Department of
Paediatrics Ahmadu Bello University Teaching Hospital Zaria under our supervision
Signature and Date__________________________________________
Professor WN Ogala MBBS FMCPaed FWACP DCH
Professor and Consultant Paediatrician
Ahmadu Bello University Teaching Hospital Zaria
Signature and Date__________________________________________
Dr HW Idris MBBS FWACP
Senior Lecturer and Consultant Paediatrician
Ahmadu Bello University Teaching Hospital Zaria
Signature and Date_________________________________________
DR AJ Uniga MB BCh FMCPaed
Consultant Paediatrician Dept of Paediatrics
Federal Medical Centre Jalingo
4
TABLE OF CONTENTS Title page i
Declaration ii
Attestation iii
Table of contents iv
Dedication v
Acknowledgement vi
List of abbreviations vii
Definition of terms viii
List of tablesrsquo ix
List of figures x
Summary xi
Introduction 1
Literature review 4
Aims and objectives 22
Materials and methods 23
Results 33
Discussion 47
Conclusions 53
Recommendations 54
Limitations 55
Lines of future research 56
References 57
Appendices 71
5
DEDICATION
This work is dedicated to my dearest wife and lovely children for their patience and
understanding during this period Above all I dedicate it to God Almighty for sustaining me
to this stage and beyond
6
ACKNOWLEDGEMENTS
I first and foremost acknowledge my supervisors in the persons of Professor WN Ogala Dr
HW Idris and Dr AJ Uniga for their untiring guidance and assistance throughout the period of
this work I am also grateful to all the consultants and residents of the Department of
Paediatrics ABUTH for their advice criticism and suggestions
The study would have been unsuccessful without the cooperation of the Taraba State
Post Primary Schools Board The school principals and the students were all wonderful and I
highly appreciate their cooperation during the study
My research assistants were very committed and dedicated and I really appreciate them
I particularly appreciate Dr AO Awolowo for his untiring participation in the study
Similarly I want to acknowledge the nurseMr E Joseph and Miss F Geoffrey the female
youth corper who both assisted with the anthropometric measurements
I acknowledge my primary institution the Federal Medical Centre Jalingo for
sponsoring me for the residency training I appreciate their moral and financial assistance
The management of ABUTH is also highly appreciated for giving me the opportunity of
training in her institution
Finally the support prayers and encouragement of my family kept me going during this
period I specially appreciate my dearest wife Susan and our children for standing by me even
when I was not always available when they needed me I also acknowledge my senior brother
Joseph Teru all my friends and other people who have contributed in one way or the other to
the successful completion of this work I thank them all
7
LIST OF ABBREVIATIONS
ADH Antidiuretic Hormone
ANP Atrial Natriuretic Peptide
BMI Body Mass Index
BP Blood pressure
CDC Centre for Disease Control
CVA Cerebro-vascular accident
DASH Dietary approach to stop hypertension
DBP Diastolic blood pressure
Ht Height
JSS Junior secondary school
Kg Kilogramme
M Meter
mmHg Millimeters of Mercury
NHBPEPWG National High Blood Pressure Education Programme Working Group
NCHS National Centre for Health Statistics
PGS Pubertal Growth Spurt
PHC Primary Health Care
QI Queteletrsquos index
SBP Systolic blood pressure
SSS Senior secondary school
SMR Sexual maturity rating
USA United States of America
WC Waist circumference
WHO World Health Organization
WHR Waist-hip ratio
Wt Weight
8
LIST OF TABLES
Table I Result of pilot study 26
Table II List of schools and number of students selected 28
Table III Age and sex distribution of the study subjects 33
Table IV Overall ean anthropometric measurements of the study subjects 35
Table V Mean anthropometric indices of 628 boys 36
Table VI Mean anthropometric indices of 722 girls 37
Table VII Mean and ranges of blood pressure of 1350 subjects 38
Table VIII Mean blood pressure in relation to age and sex 39
Table IX Mean blood pressureaccording to sex and stages of adolescence 41
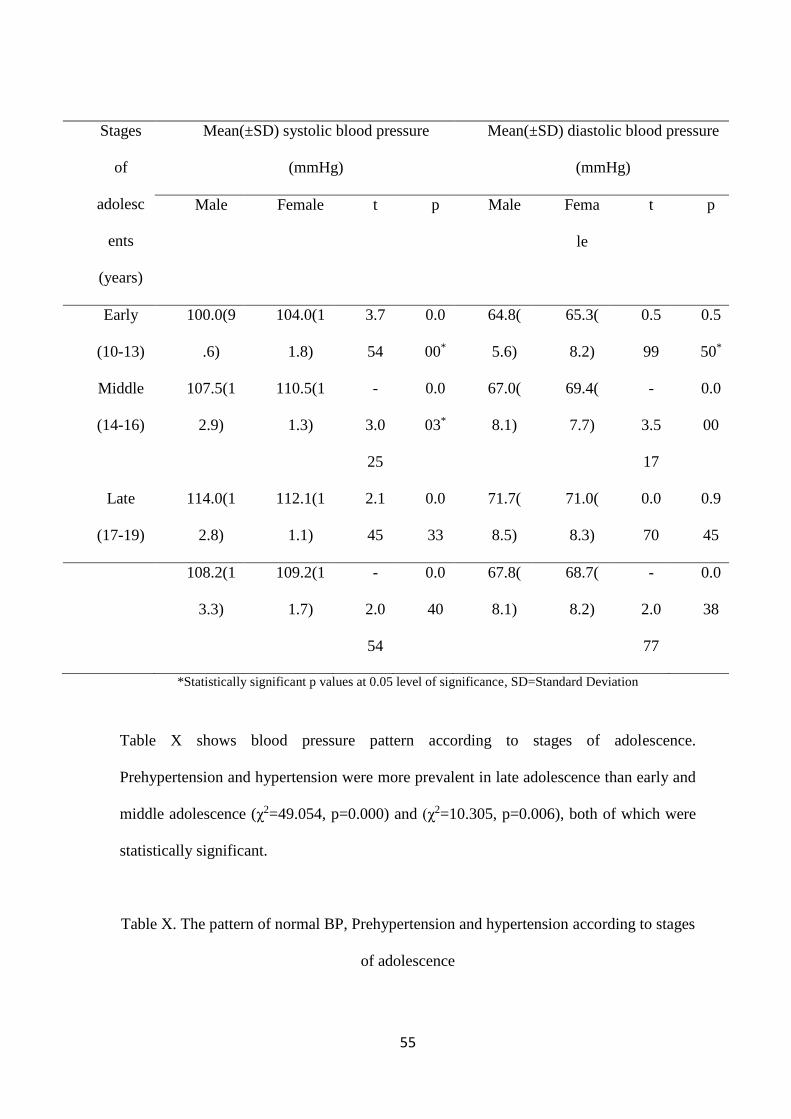
Table X The pattern of normal BP prehypertension and hypertension according to stages of
adolescence 41
Table XI Correlation between blood pressure and anthropometry 42
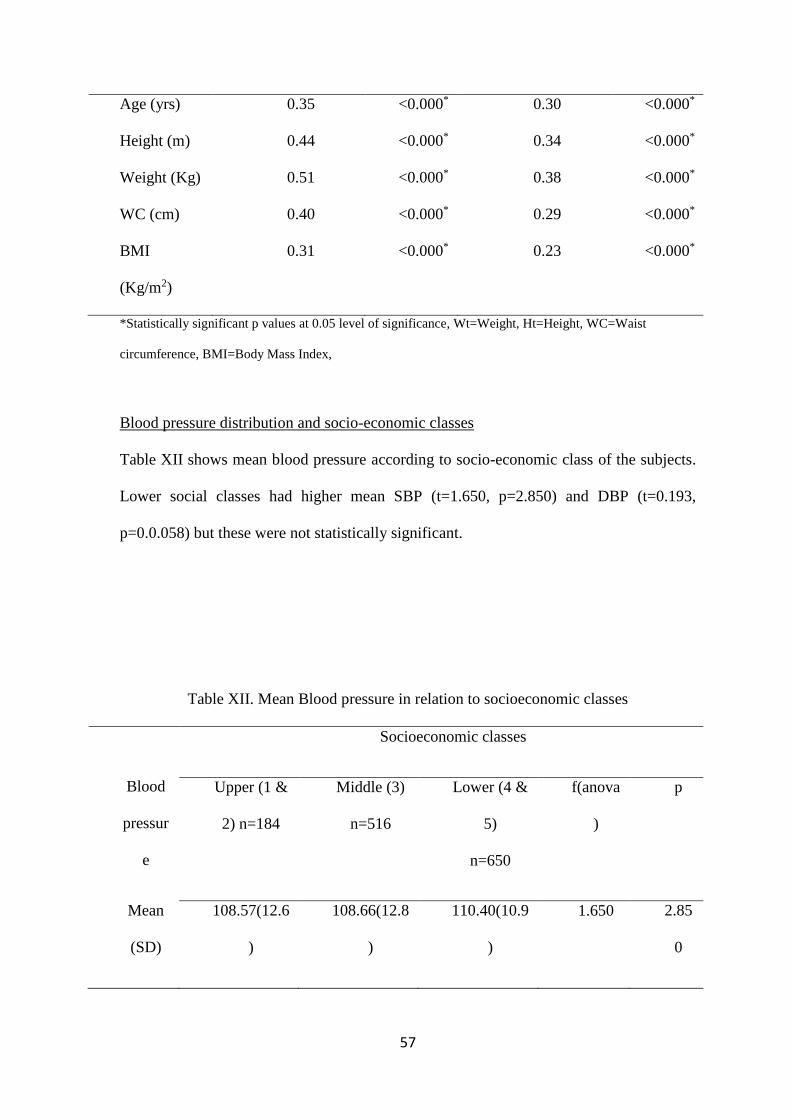
Table XII Mean blood pressure in relation to socioeconomic classes 43
Table XIII Blood pressure pattern in relation to socioeconomic classes 43
Table XIV Overall Blood pressure pattern and prevalence of hypertension 45
9
LIST OF FIGURES
Figure 1 Studentsrsquo distribution according to socioeconomic classes 34
Figure 2 Blood pressure distribution in relation to age and sex 40
10
SUMMARY
A cross sectional study of blood pressure pattern in apparently healthy secondary school
adolescents aged 10-19years in Jalingo Taraba state was carried out over six months period
from January to July 2014 One thousand three hundred and fifty (1350) students
participated comprising 628 (465) boys and 722 (535) girls Variables measured
included blood pressure weight height waist circumference and body mass index was
calculated from the weight and height
Overall the mean anthropometric values and blood pressure increased with age
irrespective of sex The mean weight of the students was 486plusmn109kg with a range of 23-
100kg while the mean height was 16plusmn01m and ranged from 12-19m The mean waist
circumference was 656plusmn89cm and ranged from 22-100cm while the meanbody mass index
(BMI) was 189plusmn31 with a range of 114-420
The overall mean systolic blood pressure was 1089plusmn125mmHg with a range of 76-
165mmHg whilethe mean diastolic blood pressure was683plusmn82mmHg and ranged from 47-
95mmHg The gender related differences in blood pressure showed mean systolic blood
pressure for boys and girls to be 1081plusmn133mmHg and 1095plusmn117mmHg (t=-2054
p=0040) while the mean diastolic blood pressurewas 678plusmn81mmHg and
687plusmn82mmHg(t=-2077 p=0038) respectively Girls generally had a higher mean systolic
blood pressure than boys from early adolescence (t=3754 p=0007) to middle adolescence
(t=-3025 p=0011) but reversed during late adolescence with boys having higher mean
systolic blood pressure (t=2145 p=0033) and these differences were statistically significant
Girls also showed dominance in the diastolic blood pressurein early and middle adolescence
but only statistically significant during middle adolescence (t=-3517 plt0000) Adolescents
from private schools had higher meansystolic blood pressure of 1102plusmn123mmHg than those
11
from public schools with 1084plusmn125mmHg(t=-222 plt0027)and higher mean diastolic
blood pressure of 703plusmn80mmHg than those from public schools with 677plusmn81mmHg(t=-
461 p=0000)
Blood pressure correlated positively with age (r=030-035 plt0000) height (r=034-
044 plt0000) weight (r=038-051 plt0000) body mass index (r=029-040 plt0000) and
waist circumference (r=023-031 plt0000) The socio-economic class associated negatively
with blood pressure withthose from upper socio-economic classeshavinga relatively
lowermean blood pressure than their counterparts from lower socio-economic classes but the
differences were not statistically significant for both systolic (f=1650 p=2850) and diastolic
blood pressure (f=0193 p=0058)
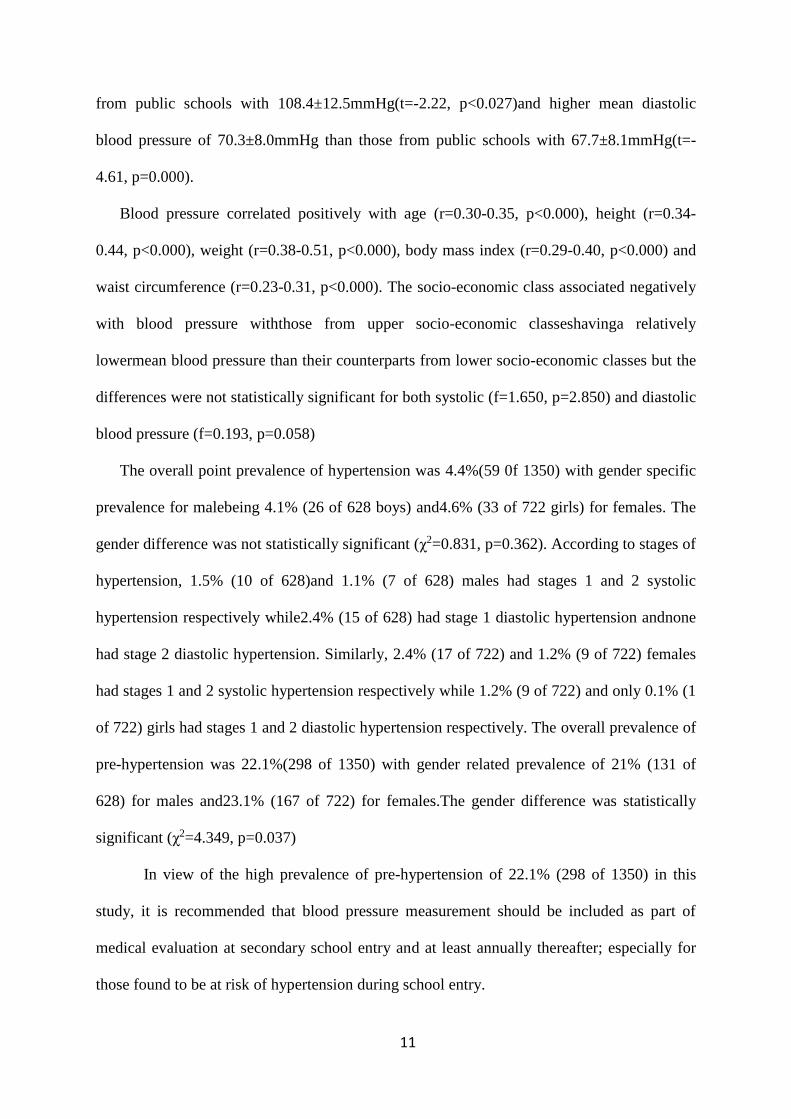
The overall point prevalence of hypertension was 44(59 0f 1350) with gender specific
prevalence for malebeing 41 (26 of 628 boys) and46 (33 of 722 girls) for females The
gender difference was not statistically significant (χ2=0831 p=0362) According to stages of
hypertension 15 (10 of 628)and 11 (7 of 628) males had stages 1 and 2 systolic
hypertension respectively while24 (15 of 628) had stage 1 diastolic hypertension andnone
had stage 2 diastolic hypertension Similarly 24 (17 of 722) and 12 (9 of 722) females
had stages 1 and 2 systolic hypertension respectively while 12 (9 of 722) and only 01 (1
of 722) girls had stages 1 and 2 diastolic hypertension respectively The overall prevalence of
pre-hypertension was 221(298 of 1350) with gender related prevalence of 21 (131 of
628) for males and231 (167 of 722) for femalesThe gender difference was statistically
significant (χ2=4349 p=0037)
In view of the high prevalence of pre-hypertension of 221 (298 of 1350) in this
study it is recommended that blood pressure measurement should be included as part of
medical evaluation at secondary school entry and at least annually thereafter especially for
those found to be at risk of hypertension during school entry
12
INTRODUCTION
Blood pressure (BP) is the pressure exerted by circulating blood volume on the walls of
blood vessels1 It is one of the vital signs measured during routine physical examination2
Blood pressure measurement is done to screen for hypertension and other cardiovascular
risk factors determining risk for various medical procedures identifying patients in
potential or actual clinical deterioration and determining individualrsquos fitness for an
occupation3 Its value as a screening tool in adults has long been documented and is an
established important component of routine paediatric physical examination4
The importance of BP measurement in children and adolescents is based on the fact
that hypertension is now increasingly diagnosed among them5-8 The American Academy
of Paediatrics now recommends routine screening of asymptomatic adolescents and
children during preventive care visits Such screening will identify potentially treatable
and preventable causes of hypertension and initiate early treatment to prevent
complications5
Hypertension is an important health problem all over the world5-9 because it is
usually silent and the presence of symptoms may indicate end organ damage10 It is
known to track well into adulthood thus making BP measurements in youths valuable for
identifying adolescents at risk of essential hypertension in adulthood11 Individuals with
high BP in their childhood are more likely to have high BP in subsequent years12 The
phenomenon of BP tracking into adulthood and the demonstration of the beginnings of
hypertensive target organ damage during childhood together with the increased
prevalence of childhood essential hypertension have raised concern of an impending
epidemic of cardiovascular morbidity and mortality10
The consequences of hypertension in children range from increased morbidity
from its causes complications or its treatment to high mortality13 The most frequently
13
and perhaps severely affected organs are the heart kidneys brain and the eyes leading to
lowered life expectancy and premature death13 In addition hypertension is a component
of the metabolic syndrome associated with similar and perhaps more severe consequences
in affected individuals14 Abdulrahaman and Babaoye15 in a study of hypertension in
Nigerian children observed a mortality rate of 28 within the first year after diagnosis
Similar mortality of 275 was reported by Aderele and Seriki9 Hypertension also places
an excessive financial burden on the population and health system consuming scarce
resources16
Adolescence is the transitional period of development between childhood and
adulthood The World Health Organization (WHO) defines adolescents as individuals
between the ages of 10 and 19 years and they account for 40 of Nigeriarsquos population1718
Adolescence is characterized by rapid biological psychological and cognitive changes
largely dependent on hormonal and environmental influences19 Many of the responses to
these influences include behaviours that have direct implications on health such as harmful
dietary intake alcoholism smoking substance abuse and sedentary lifestyle19 These
coupled with social stresses such as city traffic congestion have negative health impact and
predispose to obesity and increased risk of cardiovascular disease such as hypertension and
metabolic syndromes10 20 It has been shown that if preventive measures are started early in
childhood and adolescence they may lead to significant reduction in the high prevalence of
hypertension and metabolic syndrome currently observed in adults81320
JUSTIFICATION FOR THE STUDY
Hypertension is associated with high morbidity affecting major organs of the body such as
the heart kidneys and the brain1314 and a mortality of up to 275-28915 It is now diagnosed
frequently in adolescents with a reported prevalence of 35-952122 The younger the age of
14
onset of hypertension the greater the reduction in life expectancy if left untreated13 Even
asymptomatic adolescents with mild blood pressure elevations can have target organ
damage10 Studies121420 have shown that early identification and intervention may lead to a
significant reduction in the high prevalence of hypertension and metabolic syndrome
currently observed in adults In view of this routine blood pressure check-ups for children
and adolescents have been advocated during medical evaluations8 Blood pressure is
however not routinely measured in most paediatric clinical practices in Nigeria
Consequently only few children will have their blood pressure measured when they fall sick
or during preventive care visits In addition hospital and clinic BP measurements may be
associated with falsely elevated BP called lsquolsquowhite coat hypertensionrsquorsquo8 BP measurement of
children outside of the hospital setting such as in schools will provide opportunity for
apparently healthy individuals and possibly eliminate white coat hypertension The need for
surveillance for the early identification of adolescents in Jalingo who are at risk of
hypertension and to initiate measures aimed at preventing its consequences is therefore the
justification for this study In addition the study will add to the body of knowledge on
adolescent blood pressure as there has been no previous study on BP from Jalingo and
northeastern Nigeria as a whole This will help inform public health policies regarding blood
pressure control and prevention in Taraba State in particular and in Nigeria in general
15
LITERATURE REVIEW
HISTORICAL PERSPECTIVE
Blood pressure measurement first started in the eighteenth century with the experiment of
Stephen Hales to whom its discovery can be attributed as reported by Jeremy2324
Accurate study of blood pressure as reported by Crile25 began with the introduction of a
manometer by Poiseuille a century later The first truly accurate blood pressure
measurement in man was by the Surgeon Faivre in 1856 when he connected an artery to a
mercury manometer to obtain direct readings24 Non-invasive methods of BP
measurement started with the discovery of the sphygmograph in 1855 by Vierordt as
reported by Crile25 and improvement by Potain in 1889 gave birth to the
sphygmomanometer26 In 1896 Scipione Riva-Rocci developed the method upon which
present-day technique is based27
Segal28 reported that the use of stethoscope for BP measurement was first highlighted
in 1905 by a Russian surgeon Korotkoff who documented hearing a tapping sound using a
stethoscope placed over the brachial artery as the Riva-Rocci cuff was deflated Goodman
and Howell29 recommended the division of the changing sounds into five distinct phases and
physicians subsequently determined blood pressure according to the point of appearance and
muffling or disappearance of the sounds30
DEFINITION AND REGULATION OF BLOOD PRESSURE
Blood pressure is defined as the product of cardiac output and peripheral vascular
resistance131 During each heartbeat BP varies between a maximum (systolic) and a
minimum (diastolic) pressure and is measured in millimeters of mercury (mmHg)1 Blood
16
pressure is regulated by different mechanisms acting either rapidly or slowly to maintain it
within normal range for optimal cellular performance3132
Intrinsic Regulation
Intrinsic factors regulating BP include stroke volume and heart rate which both influence
cardiac output31 Stroke volume depends on the volume of blood that fills the ventricles and
this depends on the preload and afterload33 A higher afterload will decrease stroke volume
causing low cardiac output and low BP and vice versa When cardiac output increases more
volume is derived from the venous pool increasing preload Similarly an increased heart rate
will lead to increased cardiac output and BP3134
Reflex Regulation
The baroreceptors within the aortic arch and carotid sinuses contain sympathetic and
parasympathetic nerve fibres3435 These are sensory nerves which run from the medulla
and they respond to stretch of the tissue in which they lie by increasing or decreasing the
rate of signaling36 and act fast in regulating BP34 Sympathetic stimulation causes
increased heart rate and widespread vasoconstriction to increase BP while
parasympathetic stimulation produces the opposite3537
Hormonal Regulation
Hormones regulating blood pressure include renin-angiotensin-aldosterone and
antidiuretic hormone (ADH) They act slowly by responding to changes in intravascular
volume and osmolality38 Angiotensin II is a potent vasoconstrictor and stimulates the
release of aldosterone from the adrenal gland39 Aldosterone increases sodium absorption
and fluid retention leading to increased BP ADH is a potent vasoconstrictor and plasma
volume regulator and its stimulation results in fluid retention and vasoconstriction39
Other hormones regulating BP include the sex hormones thyroid parathyroid cortisol
and ACTH They act on the rennin-angiotensin-aldosterone system to regulate BP3940
17
Renal Regulation
The kidneys control blood pressure through the retention and excretion of extracellular
fluid35 An increase in renal fluid retention will increase extracellular volume and higher
blood pressure whereas increased renal excretion leads to lower blood pressure41 This is
achieved through the action of ADH aldosterone and atrial natriuretic peptide (ANP)41
METHODS OF MEASURING BLOOD PRESSURE
Blood pressure can be measured by invasive and non-invasive methods
1) Invasive (or direct) method - Blood pressure is most accurately measured invasively
through an arterial line4243 It is the gold standard by which the accuracy of other blood
pressure measuring devices and methods are assessed4344 Chyun43 compared direct and
indirect blood pressure readings in 14 intensive care unit patients and found that the
auscultatory method overestimates the systolic and diastolic BP especially if the VI Kortkoff
sounds is used as an indicator of diastolic BP This can often over estimate reading by as
much as 20 mm Hg43 This study is made up of very small sample size to make general
conclusion on the differences in BP values from the two methods compared Although the
invasive method is the gold standard for true BP measurement it is associated with serious
complications related to arterial catheterization and the procedure itself may be technically
difficult It is mainly used in experimental procedures and in monitoring critically ill patients
in intensive care units42
2) Non invasive (indirect) methods These are simpler and quicker than the invasive
method and are commonly used for routine blood pressure examinations They may
however yield lower accuracy and small systematic differences in numerical results43
These methods include-
18
a) Palpation method - A minimum systolic value can be estimated by palpation Deakin
and Low45 reported that a palpable radial femoral or carotid pulse indicates a minimum
systolic BP of 80 70 and 60 mmHg respectively The study was carried out among adults
and these values could not be applicable in children and neonate whose maximum
systolic BP may be lower than the reported minimum values A more accurate systolic BP
value can be determined by inflating and then deflating sphygmomanometer cuff while
palpating the pulse The systolic BP corresponds to the pressure at which the radial pulse
becomes palpable45 Its disadvantages are that pressure obtained is usually 2-5mmHg less
than those obtained by auscultation and diastolic BP cannot be measured32
b) Auscultation method- Also called the Korotkoff method is the method of choice in
clinical practice142 It involves using a stethoscope and a sphygmomanometer46 The
mercury sphygmomanometer is the gold standard for BP measurement A Riva-Rocci
cuff 27 is placed over the arm and inflated to occlude the brachial artery It is then
gradually deflated until blood flow is re-established accompanied by a tapping sound
which can be detected by the stethoscope held over the artery Five sounds are
traditionally heard and classified into phases30 The first phase corresponds to the systolic
BP while the last or fifth phase corresponds to the diastolic BP30 The fourth phase
alternatively is used to measure the diastolic pressure if a 10 mmHg or greater
differences exist between the initiation of phases fourth and five or if the fifth sound is
heard down to 0 mmHg8 This may occur in cases of high cardiac output or peripheral
vasodilatation children or in pregnancy This method though the method of choice in
clinical practice may however be associated with errors arising from faulty technique and
equipment4748 as well as observer bias49 This method was used for this study because of
its widespread general usage its reliability and accuracy Unlike other methods the
instruments (mercury sphygmomanometer and stethoscope) do not require any
19
calibration and values obtained do not require validation by other methods The standard
World Health OrganizationCenter for Disease Control (WHOCDC) blood pressure
reference percentile tables were generated using the mercury sphygmomanometer hence
the auscultation method is the gold standard for BP evaluation258
The aneroid sphygmomanometer measures BP by mechanical system of metal
bellows that expand as the cuff pressure increases in a series of levers that register the
pressure on a circular scale The hybrid shygmomanometer combines some of the features
of the two and uses an electric transducer to record blood pressure2
c) Oscillometric technique- This uses the oscillometric device Oscillation of pressure in a
sphygmomanometer cuff is recorded during gradual deflation The point of maximum
oscillation corresponds to the mean arterial pressure50 The oscillation begins well above
systolic BP and continues below diastolic BP so that systolic and diastolic BP can only
be estimated indirectly according to some empirically derived algorithm
d) Ultrasound method - This uses an ultrasound transmitter and receiver placed over the
brachial artery under a sphygmomanometer cuff As the cuff is deflated the movement of
the arterial wall and systolic BP cause a Doppler phase shift in the reflected ultrasound
The diastolic BP is recorded as the point of diminished arterial motion51 Its advantage
includes the ability to detect diastolic BP in atrial fibrillation and hypotension where
Korotkoff sound is faint152
FACTORS AFFECTING BLOOD PRESSURE IN ADOLESCENTS
Several inter-related factors affect blood pressure These include-
Age - A progressive BP elevation with age has been observed in several studies2153-55
The rate of rise varies in boys and girls5455 The average systolic increase ranges between
20
166 and 286 mmHgyr for boys and 144 and 263mmHgyr for girls while that of
diastolic BP ranges from 083 and 177mmHgyr for boys and 077 and 148mmHg for
girls2155 Bugaje Yakubu and Ogala21 studied blood pressure pattern among 2035
adolescents in Zaria and found a consistent rise of BP with age The rate of rise was fairly
constant until 11-13 years in boys and 12-14 years in girls when the rise became rapid A
similar study53 also found a BP rise with age among 650 healthy school children in Jos In
a large population studies in Lebanon56 and Saudi Arabia55 BP was similarly reported to
increase consistently with age Rapid growth and biological maturation of organs which
are normal occurrences during adolescence were thought to be responsible rather than the
chronological age56 The results of these studies showed increasing blood pressure with
age despite the fact that one study55 used oscillometric method for their study while the
standard auscultation was used in the other studies Also the studied sample sizes across
these studies varied greatly with sizes of 65053 203521 571054 and 1622655 Despite this
the findings were similar
Gender ndash Results of studies on the effect of gender on BP showed that sex positively
affects blood pressure2153-55 Merhi Al-Hajj and Al-Tannir et al54 studied BP pattern in
5710 Lebanese school children while Al-Salloum El-Mouzan and Al-Herbish et al55
studied BP pattern in 16226 Saudi children and adolescents The authors reported a
higher BP in girls than boys at all ages A study21 of BP pattern in adolescents in Zaria
Nigeria demonstrated an initial higher BP in boys before puberty which reversed with the
onset of puberty up to the age of 14-15yrs when it reversed again to be higher in boys
Akinkugbe Akinwolere and Kayode56 reported no sex differences in adolescent BP in
Ibadan The reported sex difference is said to be likely due to differences in sex hormone
and pattern of growth in boys and girls57 Differences in age range of the study population
may however be responsible for the observed BP variation For instance these studies5455
21
comprised of both adolescents and pre-adolescent age groups combined in one study
while the other two studies2156 were purely adolescents21 Blood pressure is reported to be
equal in both sexes before adolescence after which the gender difference starts to
manifest most likely due to physical and hormonal changes
Socioeconomic Factors - Belonging to either end of the socioeconomic strata is found to
be associated with elevated blood pressure5859 A study in Ibadan56 reported an inverse
relationship between parental socioeconomic status and level of BP in adolescents The
authors suggested that this might be the result of the health behaviours and problems
characteristic of the lower socioeconomic class On the other hand Ejeke Ugwu and
Ezeanyika et al60 in Lokoja and another study53 in Jos both found higher BP in children
from high socioeconomic class Colhoun Hemminway and Poulter61 in a meta-analysis of
BP and socioeconomic status in developed and developing countries found an inverse
relationship of BP with socioeconomic status in developed nations and a direct correlation
in developing countries These different findings may be due to methodological
differences in socio-demographic stratification For instance Akinkugbe and
colleagues59 used fatherrsquos level of education for social classification Parentrsquos educational
level may however not equate well with level of family income The other study60 used an
automated device for their study whose values may require validation using the
recommended auscultation method Difference in environmental stresses may also be
different considering the level of development of the areas where the studies were carried
out
GeneticFamilial Factors - The effect of geneticfamilial factors on BP has been
demonstrated in some studies62-64 Familialgenetic correlations reflected in BP and other
anthropometry generally are higher among genetically close relatives such as brother-
sisters or parent-offspring than among spouses62 Levshit and Gerber63 surveyed 514
22
individuals from 135 nuclear families in Russia while Budaruddoza62 studied 1400
individuals from 380 families in India and found significant genetic influence on BP
Mijinyawa Iliyasu and Borodo65 also reported family history of hypertension as risk
factor for developing high BP in a study on prevalence of hypertension among 1000
teenagers in Kano The authors concluded that this could be due to genetic predisposition
They however did not evaluate further to determine the genetic defects The authors did
not also consider shared environmental factors known to influence blood pressure in
individuals Molecular genetic studies have identified genes as possible regulators of
BP6667 These genes regulate the renin-angiotensin-aldosterone system involved in renal
salt handling69 Mutations that increase sodium reabsorption and salt sensitivity is
associated with higher BP and vice versa68 while shared environmental risk factors may
potentiate the development of such familial conditions which might have been
responsible for outcome of the above studies6364
Environmental Factors ndash Environmental factors greatly influence BP variation in a
population592269 Akinkugbe and Ojo70 reported a consistently higher BP in Nigerian
adolescents than their counterparts of similar ages in black and white American children
The authors are of the view that this could be due to different environmental factors of the
study population Obika Adedoyin and Olowoyeye22 studied BP pattern in 2526
children aged 1-14 years in rural semi-urban and urban communities in Ilorin Nigeria
and demonstrated a hypertension prevalence of 95 in urban compared to 63 in rural
communities This was similar to the study59 in Ghana and Gambia69 The authors592269
argued that the differences were due to socioeconomic status which is higher in the urban
than the rural areas The BP variation could be accounted for by the nature of dietary
intake since the rural communities generally consume more of natural foods with less salt
and lsquojunk foodsrsquo compared to the urban populace This was demonstrated by one study61
23
which reported higher mean BP among urban communities in developing nations due to
changes in their dietary pattern Rural areas are also less exposed to the stress and hassle
of the urban cities It is of interest to note however that urban areas are a mixture of
social classes as a result of migrant workers seeking lsquogreener pasturesrsquo Okagua Anochie
and Akani71 on the other hand reported higher mean BP among rural adolescents than
their urban counter parts in Port Harcourt The authors could not identify the reason(s) for
their finding but concluded that the seemingly protective privilege of rural life may be
fading gradually The differences in the reports could however result from the sample size
composition comprising of preadolescents22 adolescents71 and adults69
Race - Higher BP levels have been reported in African-American and Hispanic school-
age children than their Caucasian counterparts and among African-Americans than the
Hispanics7273 Akinkugbe and Ojo70 demonstrated a consistently high systolic and
diastolic BP in Nigerian children compared with black and white American children of
similar age Exposure to chronic environmental stress low socioeconomic status and high
obesity rate among African American and Hispanic youths could contribute to higher
BP72-74 It can be inferred from the study that race alone may not be responsible for the
observed differences but shared environmental factors and socioeconomic status may be
contributory77 Other studies7475 however found no significant BP differences in relation
to race
Anthropometry and blood pressure (BP) - A positive correlation has been observed
between BP and anthropometry in various studies58-5977 These studies585678 observed a
significant correlation between systolic BP and weight height and body mass index
(BMI) in boys but only with weight in girls Body mass index (BMI) is used as a
measure of overall obesity but it is known to be a poor indicator of actual body fat79
Waist circumference (WC) is an aggregate measurement of the actual amount of total and
24
abdominal fat accumulation80 It is therefore a better predictor of BP and other
cardiovascular diseases8081 Guagnano Ballone and Colagrande et al81 studied the
relationship between BP and BMI WC and waist hip ratio (WHR) in 461 people and
found WC to be the most consistent anthropometry affecting BP It is of interest to note
that the study by Guagnano et al81 was in adults population while the other studies56-59
were in children and adolescents WC was also found to be a better predictor of BP in an
Italian study8081 while it was not in others56-6982 Comparing BMI and waist
circumference and their effects on BP Arauzo Lopes and Moriera et al83 in Brazilian
children found BMI to be a better predictor of BP than waist circumference This was
similar to the study by Sebanjo and Oshikoya82 in Nigerian adolescents in Akure Thus
waist circumference measurements may not be useful in the evaluation of obesity andor
hypertension in children and adolescents This may partly be explained by the uniform fat
distribution due to hormonal effect at puberty in adolescents compared to the
disproportionate fat distribution in adults Possible mechanisms for the positive
relationship between BP and high BMI includes decreased physical activity increased
salt intake impaired pulmonary functions and development of metabolic abnormalities
such as dyslipidaemia and insulin resistance8084
Nutritional factors - Diet has been a primary link between humans and their environment
and substantial evidence supports the concept that multiple dietary factors affect BP85
Well-established dietary modifications that lower BP are reduced salt intake increased
potassium intake increased protein particularly plant protein high vegetable and
polyunsaturated fats85 High sodium intake on the other hand is said to be associated with
elevated blood pressure86 A series of 3 large controlled feeding studies tested the effects
of dietary patterns on BP86-89 Of the 3 diets studied the dietary approach to stop
hypertension (DASH) emphasized fruits vegetables low-fat dairy products whole
25
grains poultry fish nuts potassium magnesium calcium and fibre as the most effective
diet89 Among all participants the DASH diet significantly lowered mean systolic BP by
55 mm Hg and mean diastolic BP by 30 mm Hg each net of changes in the control diet
DEFINITION AND CLASSIFICATION OF ADOLESCENCE
Adolescence is the transitional stage between childhood and adulthood during which many
life patterns are learnt and established90 According to World Health Organization (WHO)
adolescents are individuals between the age range of 10-19 years17 The most significant
feature of adolescence is puberty characterized by an exceptionally rapid rate of biological
growth and development including physical and sexual maturation9091 The pubertal changes
have been described by Tanner and Marshal92 and are grouped into five stages This utilizes
definite criteria for growth and development of secondary sexual characteristics like pubic
hair and breast in females and pubic hair and genitalia in males9092 The timing of these
events and the rate of growth vary due to genetic and environmental factors in different
populations92 Adolescence is divided into early middle and late periods17
Early adolescence (10-13 years) ndash This is a period of rapid growth and development of
secondary sexual characteristics and varies according to sex It corresponds to Tanner stages
1 and 290 The main features of this stage are breast bud development and menarche in girls
while testicular enlargement and seminal emission occurs in boys93
Middle adolescence (14-16 years) ndash In this stage rapid growth decreases and there is more
cognitive development as the adolescents move from concrete thinking to formal operation
and develop greater competence at abstract thinking91 This corresponds to Tanner stages 3
and 4
Late adolescence (17-19 years) ndash Here slowing of physical changes continue which permits
the emergence of a more stable body image Cognition tends to be less self-centered with
26
demonstration of care for others with increasing thought about concepts such as justice
patriotism and history It corresponds to Tanner stage 59092
ADOLESCENCE AND BLOOD PRESSURE
Adolescence is characteristically associated with increasing blood pressure because of the
physical growth and hormonal changes associated with puberty5794 After the age of one year
normal BP increases more during puberty than probably at any other time in an individualrsquos
lifetime95 Wanzhu Eckert and Saha et al57 examined data from a cohort of 182 normotensive
children in Indiana who had blood pressure measurements taken semi-annually for up to 12
yr The authors found that the rate of change in BP and weight peaked at the age of maximum
pubertal growth spurt (PGS) This BP spurt roughly coincides with growth spurt during
puberty94 Surveys of BP patterns from childhood through adolescence shows systolic and
diastolic pressures increase with age and in adolescents the increase in males is more marked
than in females especially the systolic pressure5458229495
CLASSIFICATION OF BLOOD PRESSURE IN ADOLESCENTS
The National High Blood Pressure Education Program Working Group (NHBPEPWG) of the
United States established guidelines for the definition of normal and elevated blood pressures
in children in 19876 These guidelines were revised in 20048 The definition of childhood
hypertension in the guidelines are based upon the normative distribution of blood pressure
(BP) in healthy children rather than clinical outcome data as in adults The guidelines
classified BP as normal prehypertensive or hypertensive Hypertension is graded into stage
one and two8
Normal BP - Blood pressure lt90th percentile for age sex and height Children and
adolescents with normal BP should be followed annually from the age of 3 years5 They
27
should be encouraged to maintain a healthy life style such as good dietary intake physical
activities and adequate rest8
Pre-hypertension - Blood pressure between the 90th and lt 95th or if BP exceeds
12080mmHg (even if lt90th percentile) but lt95th It was previously called high normal
BP This new description was introduced to help identify children at risk for the
development of persistent hypertension for whom targeted prevention programmes would
be most beneficial96 While recommendations for the diagnosis of hypertension in
children require that BP remains elevated on three separate occasions repeated
measurements are not necessary to classify an adolescent as pre-hypertensive11 The
prevalence of childhoodadolescence pre-hypertension in US is reported to be between
12-1796-98 In Nigeria Ejeke Ugwu and Ezeanyika99 in a study of the prevalence of
point prehypertension and hypertension in 843 adolescents in Lokoja reported a
prevalence of point prehypertension of 222 and 250 in semi urban and urban
communities respectively Ujunwa Ikefuna and Nwokocha et al100 reported 175
prehypertension prevalence among adolescents in Enugu Among adults with pre-
hypertension it is reported that as much as 10 per year develop hypertension101 There
is little information on the time course for children and adolescents with prehypertension
developing hypertension A value of between 11-7 per year has been reported in US
adolescents98 There is no known study on rate of progression of prehypertension to
hypertension in Nigerian adolescents The NHBPEP recommended that children with
pre-hypertension should have their BP checked after every six (6) months to monitor for
progression to hypertension They should be encouraged to engage in physical activity
healthy dietary behaviours and weight management if overweight Pharmacologic therapy
is not indicated except if there is strong evidence of renal disease heart failure left
ventricular hypertrophy or diabetes mellitus8
28
Hypertension Hypertension is BP persistently equal to or above the 95th percentile for
age sex and height measured on three or more separate occasions If the blood pressure
measurement obtained is gt 95th percentile the degree of hypertension should be staged
Stage 1 hypertension- BP value between the 95th and the 99th percentile plus 5mmHg It
is recommended that BP should be rechecked in 1ndash2 wks or sooner if the patient is
symptomatic If persistently elevated on 2 additional occasions it should be evaluated or
referred to source of care for pharmacologic treatment within 1 month 8
Stage 2 hypertension- BP value gt99th percentile plus 5mmHg This stage calls for more
prompt evaluation and commencement of pharmacologic therapy102 It is recommended
that the individual be evaluated or referred to source of care within 1wk or immediately if
the patient is symptomatic8
Aetiology of hypertension
Hypertension is classified as primary (essential) when there is no identifiable cause
or secondary if due to an underlying disease31 Factors such as heredity diet stress drugs and
obesity play a role in the development of essential hypertension103104 Causes of secondary
hypertension include umbilical artery catheterization renal diseases coarctation of the aorta
and endocrine disorders105106 Aderele and Sereki6 in their study of hypertension in children
reported hypertension secondary to renal pathology as the commonest cause of elevated BP
in children This study was mainly in preadolescent population in which secondary
hypertension is a common finding On the other hand Antia-Obong and Antia-Obong107
reported no apparent cause in greater than 90 of the studied subjects with elevated BP and
also reported proteinuria of 1 in the same population without any associated elevated blood
pressure The study did not however evaluate the etiology of the proteinuria A study65 of BP
in teenagers in Kano found family history of hypertension a risk factor in the study
population Another study in Enugu100 examined modifiable risk factors associated with
29
hypertension in 2694 adolescents and found only 1 and 06 of the hypertensive subjects
to be overweight and obese respectively The authors also found that smoking and alcohol
consumption were not significant risk for hypertension This may however be due to the
shorter period of consumption of these products by the students as a cumulative effect from
long term consumption is known to be associated with adverse health outcomes
Prevalence of hypertension in adolescents
The prevalence of hypertension in adolescents varies widely due to arbitrary and imprecise
definition by different researchers It was in view of this that the National High Blood
Pressure Education Program Working Group (NHBPEPWG) of the United States established
guidelines for the definition of normal and elevated blood pressures in children and
adolescents for uniformity68 In the USA the prevalence is about 20 in normal weight and
50 in their obese counterparts108 A prevalence rate of 77109 10554 and 223110 has
been reported in Spain Lebanon and South Africa respectively In Kano Nigeria a study65
on the prevalence of hypertension among 1000 teenagers found a prevalence of 72 Similar
study in Enugu100 on the prevalence of hypertension among 2694 secondary school
adolescents reported a hypertension prevalence of 54 It is of interest to note that different
prevalence was reported because of the different methodology used by the authors While the
study in Kano65 applied the adult blood pressure criterion of BP greater than 14090mmHg as
hypertension the study in Enugu100 used blood pressure greater than 95th percentile for age
and sex Also the study in Kano65 took a single set of measurement while the study100 in
Enugu measured blood pressure of the subject three times at weekly intervals Bugaje
Yakubu and Ogala21 on the other hand defined hypertension as blood pressure greater than
two standard deviations from the mean and also took six readings over thirty minutes and got
a prevalence of hypertension of 34 A prevalence rate of 48107 and 9522 in Southern
and Western region of the Nigeria respectively was also reported It is obvious that because
30
of the various defining criteria for hypertension in adolescents the prevalence of adolescent
hypertension remains imprecise
Clinical presentation- Hypertension is usually asymptomatic unless it has been
sustained or is rising rapidly109 Adolescents with essential hypertension are usually
detected during routine evaluation96 Non-specific symptoms such as lethargy headache
dizziness drowsiness visual disturbance and confusion may be present109 These could
also be signs of complications111 Secondary hypertension may show obvious features of
the underlying disease such as growth failure heat intolerance abdominal stria tremors
body swelling and haematuria8102 Croix and Feig112 studied the spectrum of symptoms in
409 children aged 7-18 years newly diagnosed hypertensive in Texas USA and reported
15 common symptoms than in the controls The symptoms were said to resolve after
commencement of antihypertensive medications The authors concluded that hypertensive
children had a variety of non-specific symptoms The three most common symptoms
reported were headache daytime tiredness and difficulty initiating sleep The study
however did not specify if other possible causes of these symptoms were excluded
Complications of hypertension - Hypertension is usually asymptomatic in adolescents
which if left unidentified overtime can cause serious complications109 Organs commonly
affected in the complication of hypertension are the heart kidneys brain and the eyes
leading to lowered life expectancy and premature death13 Left ventricular hypertrophy
(LVH) is the most prominent clinical evidence of end organ damage10 Studies have
shown that LVH can be seen in as many as 41 of patients even in adolescents with
asymptomatic hypertension10103 Adolescents with severe cases of hypertension are also
at increased risk of developing hypertensive encephalopathy seizures cerebrovascular
accidents and congestive heart failure103109 However data documenting such
complications in children and adolescents are generally lacking In a study of
31
hypertension among teenagers in Kano the researchers65 could not find any
complications in all the 1000 teenagers studied
Investigations and treatment- Basic investigations are all that may be required in
adolescents who are obese and with a family history of hypertension stage 1 disease and
normal findings on physical examination113 This is because primary hypertension is
commoner in adolescents Adolescents that are symptomatic or with stage 2 hypertension or
have features of secondary hypertension should be evaluated in more detail
Treatment of hypertension includes non-pharmacological and pharmacological
methods Non-pharmacologic management involves life style modification such as weight
reduction increased physical activities and dietary adjustment114 In a study to evaluate the
effect of diet and salt on treatment and prevention of hypertension Sacks Svetkey and
Vollmer et al86 reported the beneficial effect of both reduced salt intake and appropriate
dietary adjustment in the control of hypertension Similar benefits were reported in other
studies8788 Although both studies had fairly good sample size (n=412) the studies did not
specify if participants were on other substances or activities other than antihypertensive that
might have affected their BP The studies were also in adults and whether it has the same
effects in children and adolescents has not been evaluation However there is no doubt that
the outcome will be similar in adolescents as dietary modifications have been advocated as
non-pharmacologic management in them Non pharmacologic treatment is usually the initial
treatment in essential hypertension and as adjuvant to drug therapy in those with secondary or
complicated hypertension101114 Pharmacologic (drug) treatment includes diuretics beta-
blockers calcium channel blockers angiotensin converting enzyme inhibitors (ACEIs) and
angiotensin receptor blockers (ARB) among others106114 They are used in those with
symptomatic disease and in acute or chronic complications106
32
Prevention of hypertension may be viewed as part of the prevention of cardiovascular
disease102 In adolescents approaches to prevention include reduction in obesity
discouraging cigarette smoking and alcohol intake113 reduction in sodium intake and increase
in physical activity through community and school-based programmes103104 Growth
monitoring BP check during preventive care visit physical activity and urine screening for
proteinuria and haematuria can be used starting from early childhood
33
AIM AND OBJECTIVES
GENERAL AIM
To determine the blood pressure pattern of apparently healthy secondary school adolescents
in Jalingo Taraba State
SPECIFIC OBJECTIVES
To determine
1 Blood pressure pattern in relation to age and sex among adolescents aged 10-19
years
2 The relationship if any between blood pressure and the anthropometric parameters of
weight height BMI and waist circumference
3 The association between blood pressure and parental social-economic status
4 The point prevalence of prehypertension and hypertension in adolescents
34
MATERIALS AND METHODS
Study area
A cross-sectional survey of the blood pressure pattern of apparently healthy secondary
school adolescents aged 10-19 years was conducted in Jalingo over a six month period
from January to June 2014 Jalingo is the capital of Taraba State and lies within the
savannah belt of North Eastern Nigeria It lies between latitude 80 54rsquo north and longitude
110 21rsquo east and at an altitude of 360 meters above sea level115 Jalingo had a population of
118198 people18 The primary inhabitants are the Konas Mumuyes and Fulanis who are
mostly farmers Other indigenous ethnic groups include the Jukun Kuteb WurkumTiv
and host of other tribes The Ibos Hausas Yorubas among others are the non-indigenous
ethnic groups and are mostly civil servants and businessmen Jalingo has a tertiary health
centre the Federal Medical Centre Jalingo and the state specialist hospital It also has 15
private clinicshospital and many primary health care centres There are also tertiary
education institutions including Taraba State University As at 2013 there were 56
secondary schools in Jalingo 24 public and 32 private all of which were mixed schools
except one which is a girlsrsquo only school
Study design
The study was a cross sectional descriptive study of 1350 apparently healthy secondary
school adolescents in Jalingo
Ethical approval
Ethical approval for this study was obtained from the Scientific and Health Ethics Research
Committee of Ahmadu Bello University Teaching Hospital Zaria (Appendix 4) The Taraba
State Ministry of Education also gave the approval and permission to conduct the study in the
35
selected schools Consent was given by the studentsrsquo parents or guardian (Appendix 2) All
students whose parents gave consent voluntarily participated in the study
Sample size determination
The minimum sample size was calculated using the formula116
N=Z2 (pq) E2
Where N = minimum sample size
p = Prevalence of hypertension in adolescents A prevalence of 3421 was used
q = 1- p
E = margin of error tolerated =1
Z = 196 at 95 confidence level
N = 1962 x 0034 x (1-0034) 0012 = 1262
Therefore the minimum sample size was one thousand two hundred and sixty two
Allowance for non-responders of 5 63 extra subjects were added to the calculated
minimum sample size bringing the total to 1325 students To enhance representativeness of
the sample and to compensate for missing information and poorly filled proforma while
maintaining the sample size a total of 1350 was decided upon
Inclusion criteria
1 Students (ages 10-19 years) in the selected secondary schools
2 Students whose parents gave consent to participate in the study
3 Students who gave assent to participate in the study
Exclusion criteria
1 Students who had obvious skeletal deformities of the spine and legs which can affect
the height and ultimately the BMI
36
2 Students with known chronic disease (or history of such disease) like anaemia
chronic renal disease and cardiac disease because they are not apparently healthy and
these conditions could affect their blood pressure
3 Students with present or past history of chronic drug ingestion that can affect blood
pressure such as steriods and contraceptives
4 Students with high blood pressure already on antihypertensive
Pilot study
A pilot study was carried out in one of the schools a week before the commencement of
the study The school was selected by random sampling method using balloting and did
not participate in the main study The pilot study was carried out with the aim of
assessing the competence of the research assistants in the various measurements
following their training to ensure reliability It was also used to test the questionnaire
before its use during the main study and to provide information on the number of students
that can be measured in a day Consequently twenty students had their blood pressure
and anthropometry measured independently by the researcher and the research assistants
and data were compared using Students t-test There were no statistically significant
differences between the measurements The result of the pilot study is highlighted in
Table I It was also found that some parts of the questionnaire were not well understood
by most students and were adjusted appropriately in the main study (Appendix 1) The 20
students had their measurements done over a period of 3-4 hours (between 8am - 12noon)
by the researcher and the research assistants
Table I Result of pilot study
Variables Researcher Research t p
37
assistants
Mean(plusmnSD) SBP
mmHg
106(11) 104(12) 0550 0586
Mean(plusmnSD) DBP
mmHg
617(83) 63(10) 0450 0657
Mean(plusmnSD) Weight
kg
544(82) 527(122) 0520 0608
Mean(plusmnSD) Height m 16(01) 16(01) 0000 1000
Mean(plusmnSD) BMI
kgm2
198(36) 202(33) 0370 0716
Mean(plusmnSD) WC cm 692(72) 682(133) 0300 0769
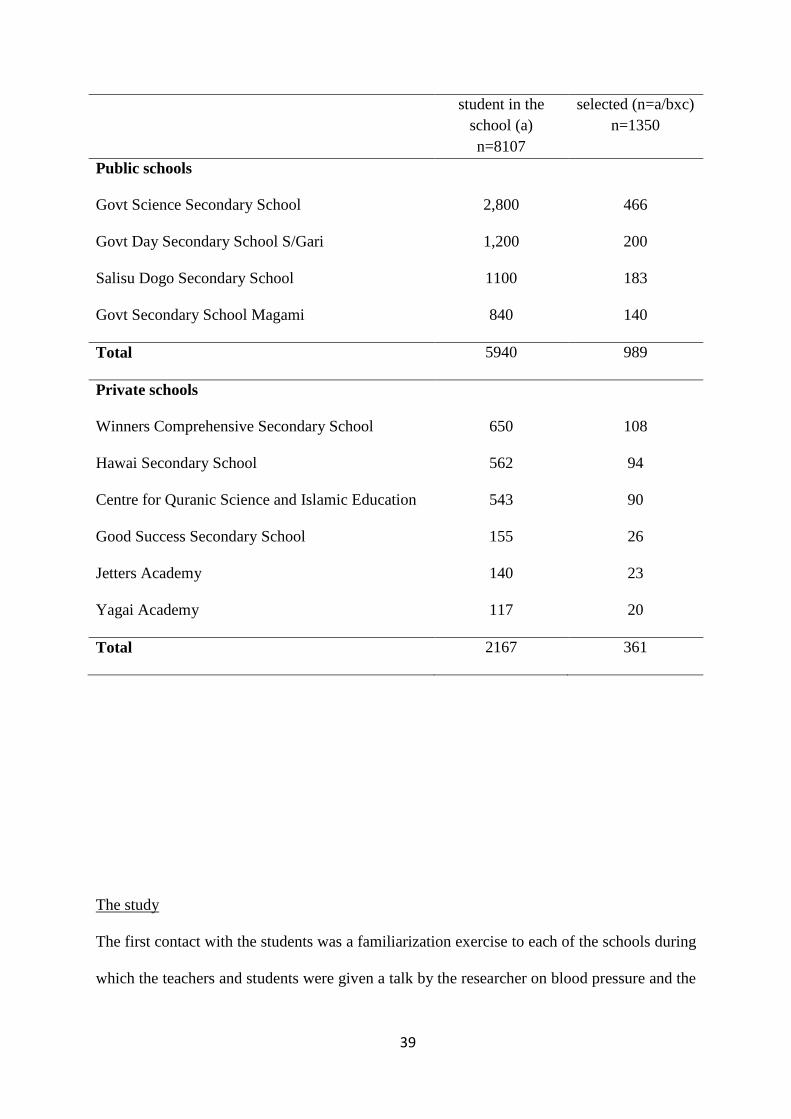
Sampling method
Students were selected by multistage random sampling technique The list of secondary
schools obtained from the Taraba State Post Primary Schools Board served as the sampling
frame for schools There were 56 secondary schools 24 of which were public and 32 were
private schools a ratio of 113 Ten (10) schools were randomly selected by balloting four
(4) from public schools six (6) from private based on the number and approximately similar
ratio of private to public schools of 115 (46) Ten schools were selected to ensure wider
coverage and even distribution of students so that it could be truly representative of the
community All the ten schools had an overall total of eight thousand one hundred and seven
(8107) students The public schools had a total of five thousand nine hundred and forty
(5940) with nine hundred and eighty nine (989) students participating The private schools
had a total of two thousand one hundred and sixty-seven (2167) students with three hundred
and sixty one (361) participating These number (989 and 361) was calculated based on the
38
relative population of each school and proportionate to number of students in each school
Thereafter the number of students to participate per school was calculated proportionately to
the number of students in each school based on the number given by the school authority
Then the number in each class was also calculated proportionately from JSS1 to SS3 to
ensure fair and equal chance of participation for all age groups The calculation was done
thus n= a b x c
Where n= number of students per selected school
a= total numberpopulation of students in the school
b= total numberpopulation of students in all 10 selected schools (8107)
c= calculated total sample size (1350)
Students in each class from junior secondary school (JSS) 1-3 and senior secondary school
(SS) 1-3 were then randomly selected by balloting The number of selected schools total
number of students in a school and the number of students selected per school is outlined in
Table II
Table II Selected schools and number of students in each of the ten schools in Jalingo
Selected schools Total no of No of students
39
student in the
school (a)
n=8107
selected (n=abxc)
n=1350
Public schools
Govt Science Secondary School 2800 466
Govt Day Secondary School SGari 1200 200
Salisu Dogo Secondary School 1100 183
Govt Secondary School Magami 840 140
Total 5940 989
Private schools
Winners Comprehensive Secondary School 650 108
Hawai Secondary School 562 94
Centre for Quranic Science and Islamic Education 543 90
Good Success Secondary School 155 26
Jetters Academy 140 23
Yagai Academy 117 20
Total 2167 361
The study
The first contact with the students was a familiarization exercise to each of the schools during
which the teachers and students were given a talk by the researcher on blood pressure and the
40
importance of periodic blood pressure measurement They were given the opportunity to ask
questions which were responded to Both the students and their teachers actively participated
in the lectures
On the second day students were selected as described above and those selected
underwent general physical examination in the presence of a chaperon to identify those
who did not fulfilled the inclusion criteria Each selected student was given a proforma
(Appendix 1) in which information on their biodata and medical history were recorded
Other information obtained was parentrsquos medical history and their socioeconomic status
using the format described by Olusanya Okpere and Ezimokhai117 (Appendix 3) The
study was carried out in a relatively quiet and empty classroom to ensure privacy for both
male and female students The procedure for blood pressure measurement was
demonstrated on one of the research assistants and sometimes on one of the teachers by
the researcher to assure the students and allay their anxiety BP and anthropometric values
obtained were recorded in the study proforma An average of 15-20 students per day were
attended to over a period of 3-4 hours (between 8am - 12noon daily) by the researcher
one of the research assistants who is a medical officer a male nurse and a lady Youth
Corper (NYSC)
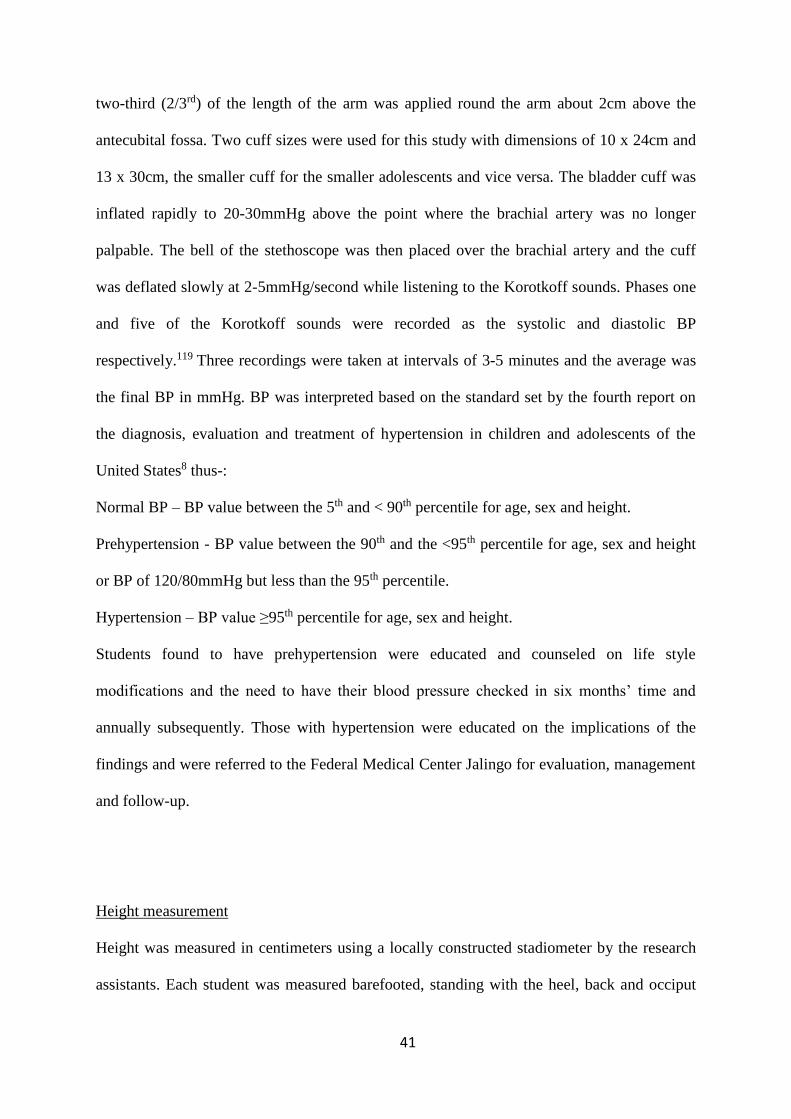
Blood pressure measurement
This was measured by the researcher and the research assistant (the medical officer) The
standard auscultation method was employed using a mercury sphygmomanometer (Acosson)
and a standard Littman stethoscope according to the guideline of the fourth report on the
diagnosis evaluation and treatment of hypertension in children and adolescents8 Each
students was rest-seated for 5 minutes before BP measurement With the student seated the
right arm rested on a table at the level of the heart an appropriate cuff size which covered
41
two-third (23rd) of the length of the arm was applied round the arm about 2cm above the
antecubital fossa Two cuff sizes were used for this study with dimensions of 10 x 24cm and
13 x 30cm the smaller cuff for the smaller adolescents and vice versa The bladder cuff was
inflated rapidly to 20-30mmHg above the point where the brachial artery was no longer
palpable The bell of the stethoscope was then placed over the brachial artery and the cuff
was deflated slowly at 2-5mmHgsecond while listening to the Korotkoff sounds Phases one
and five of the Korotkoff sounds were recorded as the systolic and diastolic BP
respectively119 Three recordings were taken at intervals of 3-5 minutes and the average was
the final BP in mmHg BP was interpreted based on the standard set by the fourth report on
the diagnosis evaluation and treatment of hypertension in children and adolescents of the
United States8 thus-
Normal BP ndash BP value between the 5th and lt 90th percentile for age sex and height
Prehypertension - BP value between the 90th and the lt95th percentile for age sex and height
or BP of 12080mmHg but less than the 95th percentile
Hypertension ndash BP value ge95th percentile for age sex and height
Students found to have prehypertension were educated and counseled on life style
modifications and the need to have their blood pressure checked in six monthsrsquo time and
annually subsequently Those with hypertension were educated on the implications of the
findings and were referred to the Federal Medical Center Jalingo for evaluation management
and follow-up
Height measurement
Height was measured in centimeters using a locally constructed stadiometer by the research
assistants Each student was measured barefooted standing with the heel back and occiput
42
against the stadiometre The head was held straight looking forward with the lower border of
the eye socket at a horizontal plane with that of the external auditory meatus The movable
part of the stadiometre was adjusted to rest on the vertex and the corresponding value read to
the nearest 01cm
Weight measurement
The weight was measured in kilograms by the researcher and the research assistants using a
bathroom scale (HANSON) Students were weighed in their approved school uniform
without caps head ties or cardigan and with their shoes removed The scale was checked
daily for accuracy using standard calibrated weight before and midway through each session
The weight of the student was measured to the nearest 01 kg
Body mass index (BMI)
This was calculated from the measured weight and height of the subject using the
formula118
BMI= Weight (kg) Height (m2)
Waist circumference measurement
WC was measured in centimeters using a measuring tape by the research assistants The
male assistant measured for boys and the lady Youth Corper measured for girls
Measurement was taken with the student standing completely relax and breathing
normally Clothing was pulled up or down and an inelastic measuring tape was placed
around the waist mid-way between the iliac crest and the lowest rib margin The ends of
the tape were pulled together lightly towards each other and the value read to the nearest
01cm117120
43
Data analysis
Data obtained were analyzed using Epi-Info statistical software package version 7 The
results obtained were presented in figures tables graphs and charts as appropriate Individual
mean BP levels were used as dependent variables and other measured variables as
independent variables The means and standard deviations were used to summarize
quantitative variables such as BP weight height waist circumference and BMI The chi-
squared test was used to test the significance of associations between categorical variables
Studentrsquos t-test was used to compare means of any two normally distributed continuous
variables Pearsonrsquos correlation coefficient and regression analysis were used to examine the
strength of association between BP and the anthropometries Probability level of statistical
significance value was set at lt005
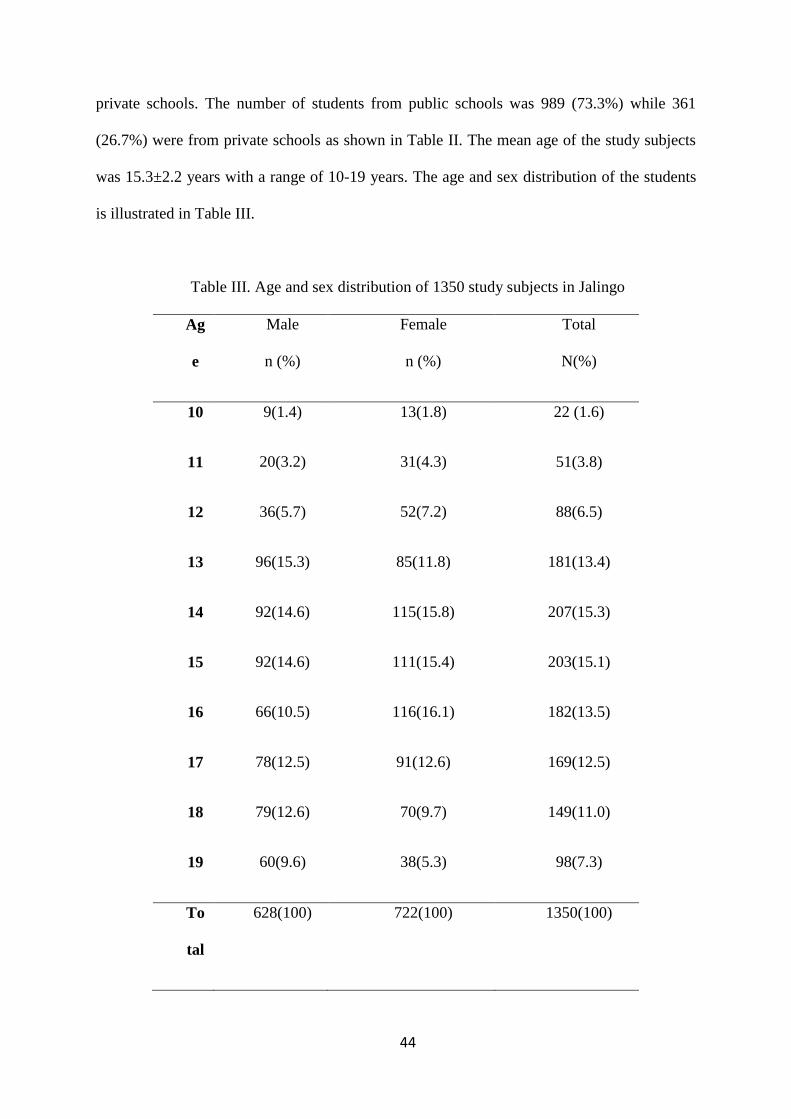
RESULTS
General characteristics
A total of 1350 students were enrolled between January and June 2014 to determine their
blood pressure pattern 628 (465) were males and 722 (535) were females with
malefemale ratio of 111 Students enrolled in the study were drawn from both public and
44
private schools The number of students from public schools was 989 (733) while 361
(267) were from private schools as shown in Table II The mean age of the study subjects
was 153plusmn22 years with a range of 10-19 years The age and sex distribution of the students
is illustrated in Table III
Table III Age and sex distribution of 1350 study subjects in Jalingo
Ag
e
Male
n ()
Female
n ()
Total
N()
10 9(14) 13(18) 22 (16)
11 20(32) 31(43) 51(38)
12 36(57) 52(72) 88(65)
13 96(153) 85(118) 181(134)
14 92(146) 115(158) 207(153)
15 92(146) 111(154) 203(151)
16 66(105) 116(161) 182(135)
17 78(125) 91(126) 169(125)
18 79(126) 70(97) 149(110)
19 60(96) 38(53) 98(73)
To
tal
628(100) 722(100) 1350(100)
45
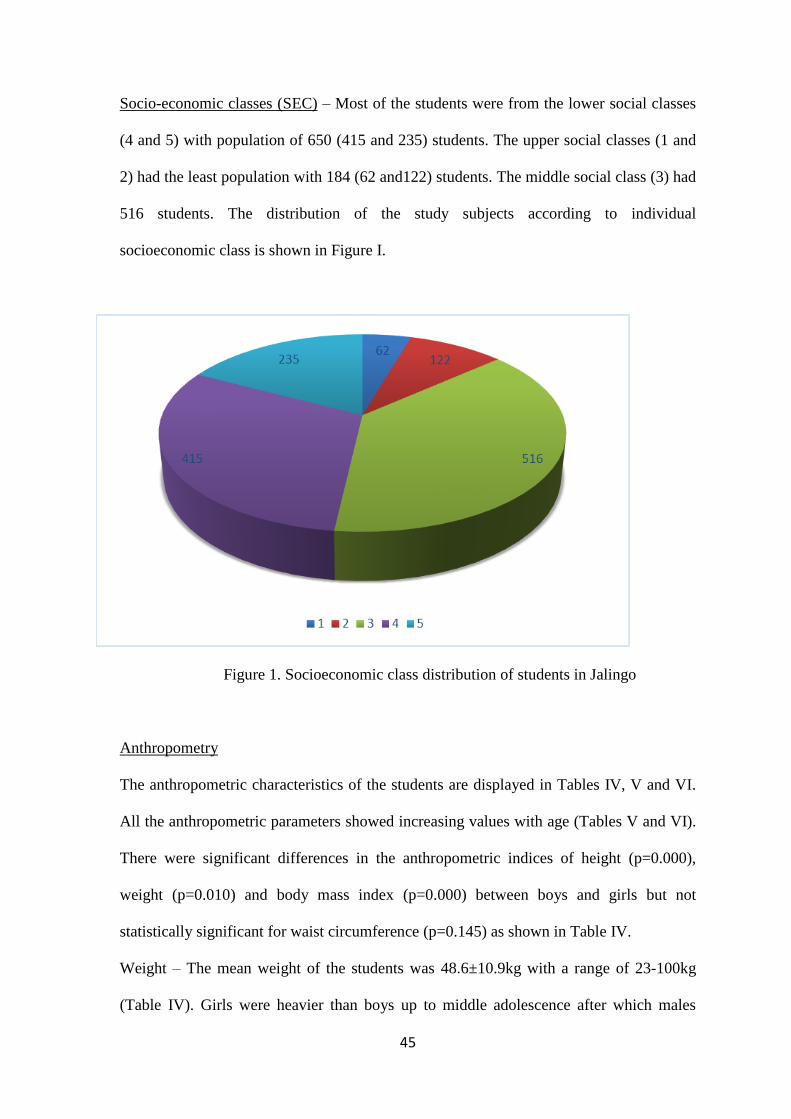
Socio-economic classes (SEC) ndash Most of the students were from the lower social classes
(4 and 5) with population of 650 (415 and 235) students The upper social classes (1 and
2) had the least population with 184 (62 and122) students The middle social class (3) had
516 students The distribution of the study subjects according to individual
socioeconomic class is shown in Figure I
Figure 1 Socioeconomic class distribution of students in Jalingo
Anthropometry
The anthropometric characteristics of the students are displayed in Tables IV V and VI
All the anthropometric parameters showed increasing values with age (Tables V and VI)
There were significant differences in the anthropometric indices of height (p=0000)
weight (p=0010) and body mass index (p=0000) between boys and girls but not
statistically significant for waist circumference (p=0145) as shown in Table IV
Weight ndash The mean weight of the students was 486plusmn109kg with a range of 23-100kg
(Table IV) Girls were heavier than boys up to middle adolescence after which males
46
were heavier than the females (Table V and VI) and this was statistically significant (t= -
256 p=0010)
Table IV Overall mean anthropometric measurements of the study subjects
Anthropometr
y
Male Female Total
n=628 n=722 N=1350 t p
Wt (kg)
Mean(plusmnSD) 4773(115
)
4926(103
)
4855(plusmn109
)
-
25
6
0007
Range 236-848 227-100 23-100
Ht (m)
Mean(plusmnSD) 159(012) 157(008) 158(plusmn010) 35
5
0000
Range 122-185 126-179 122-185
WC (cm)
Mean(plusmnSD) 6524(91) 6595(86) 6562(plusmn89) -
14
6
0145
Range 225-905 215-100 22-100
47
BMI (kgm2)
Mean(plusmnSD) 1825(27) 1947(33) 1891(plusmn31) -
74
1
0000
Range 117-325 114-42 114-42
Statistically significant p values at 005 level of significance Wt=Weight Ht=Height WC=Waist
Circumference BMI=Body Mass Index SD=Standard Deviation
Height- The mean height of the study population was 158plusmn09m and ranged from 122-
185m (Table IV) Girls were taller than boys at early and middle adolescence but these
reversed from 16 years in favour of the boys (Table V and VI) This differences was
statistically significant (t=448 p=0000)
Waist circumference (WC) - The overall mean waist circumference was 6562plusmn89cm and
a range of 225-100cm Girls had higher WC until late adolescence (18 years) when it
reversed but this was not statistically significant (t=-146 p=0145) This is displayed in
Tables IV V and VI
Body Mass Index (BMI) - Overall mean BMI was 189plusmn31 with a range of 114-42
There was a statistically significant difference between girls and boys (t=-741 p=0000)
Tables IV V and VI illustrate this findings
Table V Mean anthropometric measurements of 628 boys
Age No of
studen
ts
Wt(plusmnSD)
Kg
Ht(plusmnSD)
m
WC(plusmnSD)
cm
BMI(plusmnSD)
Kgm2)
48
10 9 349(50) 143(001
)
613(06) 169(01)
11 20 354(25) 143(002
)
617(13) 170(07)
12 36 363(51) 146(002
)
616(14) 167(06)
13 96 379(51) 150(003
)
602(40) 165(08)
14 92 412(50) 154(003
)
623(32) 169(08)
15 92 471(60) 160(003
)
634(39) 178(08)
16 66 525(52) 164(002
)
672(24) 192(09)
17 78 555(51) 167(002
)
680(31) 197(08)
18 79 576(61) 169(002
)
707(18) 200(08)
19 60 590(57) 170(002
)
716(16) 203(07)
Total 628 477(115 16(01) 652(91) 183(27)
49
)
Wt=Weight Ht=Height WC=Waist Circumference BMI=Body Mass Index SD=Standard Deviation
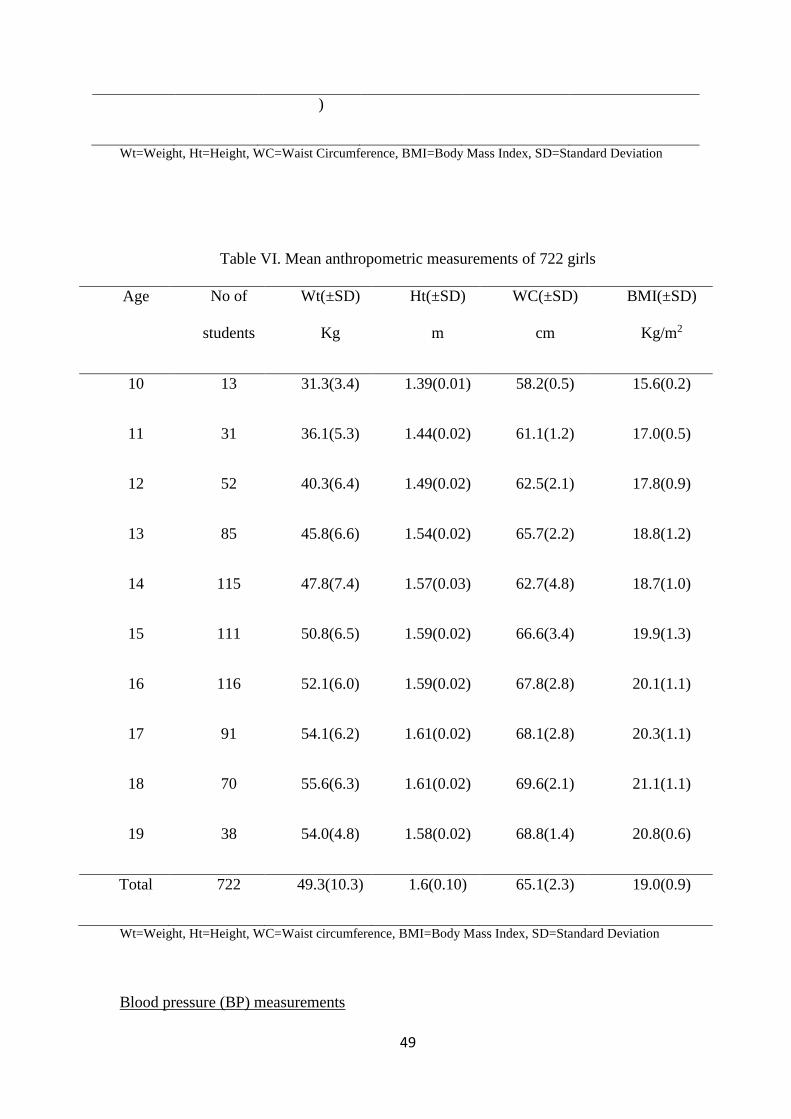
Table VI Mean anthropometric measurements of 722 girls
Age No of
students
Wt(plusmnSD)
Kg
Ht(plusmnSD)
m
WC(plusmnSD)
cm
BMI(plusmnSD)
Kgm2
10 13 313(34) 139(001) 582(05) 156(02)
11 31 361(53) 144(002) 611(12) 170(05)
12 52 403(64) 149(002) 625(21) 178(09)
13 85 458(66) 154(002) 657(22) 188(12)
14 115 478(74) 157(003) 627(48) 187(10)
15 111 508(65) 159(002) 666(34) 199(13)
16 116 521(60) 159(002) 678(28) 201(11)
17 91 541(62) 161(002) 681(28) 203(11)
18 70 556(63) 161(002) 696(21) 211(11)
19 38 540(48) 158(002) 688(14) 208(06)
Total 722 493(103) 16(010) 651(23) 190(09)
Wt=Weight Ht=Height WC=Waist circumference BMI=Body Mass Index SD=Standard Deviation
Blood pressure (BP) measurements
50
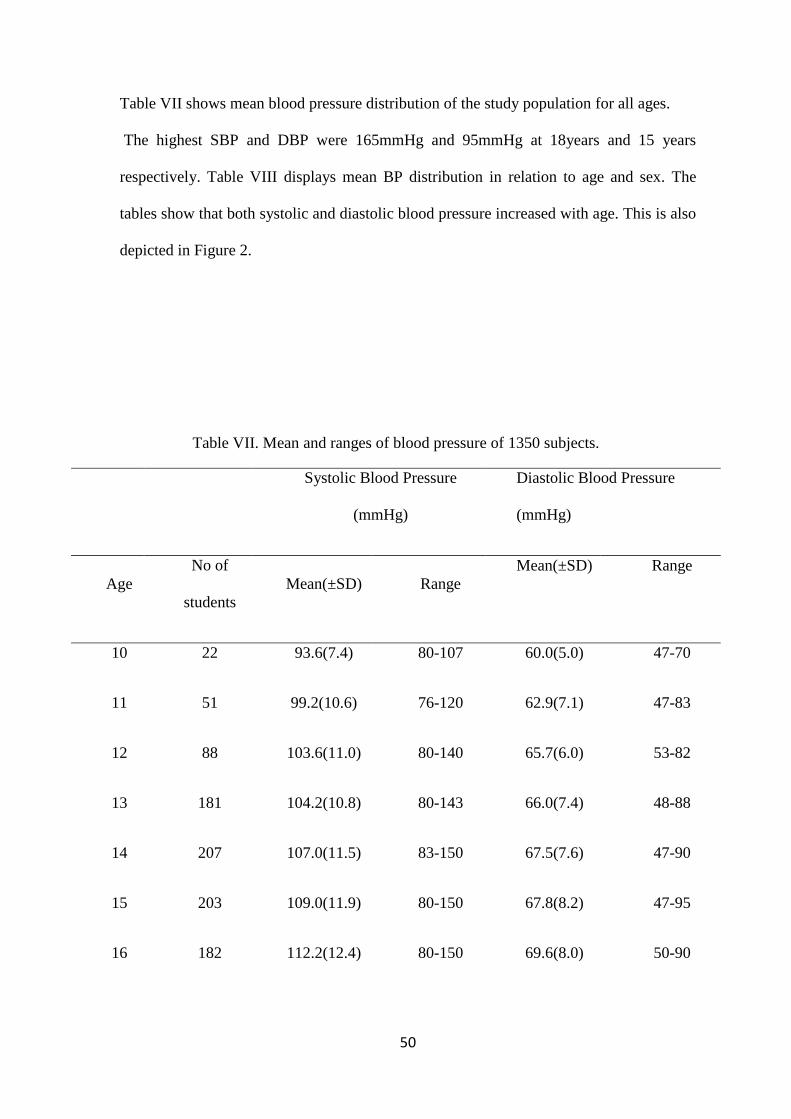
Table VII shows mean blood pressure distribution of the study population for all ages
The highest SBP and DBP were 165mmHg and 95mmHg at 18years and 15 years
respectively Table VIII displays mean BP distribution in relation to age and sex The
tables show that both systolic and diastolic blood pressure increased with age This is also
depicted in Figure 2
Table VII Mean and ranges of blood pressure of 1350 subjects
Systolic Blood Pressure
(mmHg)
Diastolic Blood Pressure
(mmHg)
Age
No of
students
Mean(plusmnSD) Range
Mean(plusmnSD) Range
10 22 936(74) 80-107 600(50) 47-70
11 51 992(106) 76-120 629(71) 47-83
12 88 1036(110) 80-140 657(60) 53-82
13 181 1042(108) 80-143 660(74) 48-88
14 207 1070(115) 83-150 675(76) 47-90
15 203 1090(119) 80-150 678(82) 47-95
16 182 1122(124) 80-150 696(80) 50-90
51
17 169 1132(118) 90-153 698(83) 48-93
18 149 1138(121) 90-165 712(88) 50-90
19 98 1131(127) 90-143 726(76) 57-90
Total 1350 1089(125) 76-165 683(82) 47-95
Table VIII Mean blood pressure in relation to age and sex
Mean(plusmnSD) Systolic blood pressure
(mmHg)
Mean(plusmnSD) Diastolic blood
pressure (mmHg)
A
ge
Male
n=628
Female
n=722
t p Male
n=62
8
Fema
le
n=72
2
t p
52
10 954(3
9)
923(6
0)
1
02
03
20
619(
32)
586(
46)
1
36
0
01
91
11 985(5
5)
997(9
2)
0
42
0
06
80
648(
39)
617(
57)
1
56
0
01
26
12 999(8
9)
1062(
117)
2
84
0
00
06
653(
29)
660(
52)
-
0
52
0
06
07
13 1012(
73)
1075(
73)
4
03
4
00
00
649(
43)
672(
59)
-
0
03
0
00
44
14 1036(
78)
1098(
78)
3
93
0
00
01
653(
44)
693(
58)
3
90
0
00
01
15 1071(
80)
1105(
87)
2
05
0
00
42
665(
58)
689(
56)
-
2
10
0
00
37
16 1135(
82)
1114(
91)
1
03
0
03
10
697(
51)
695(
61)
0
15
0
08
81
53
17 1152(
87)
1115(
77)
2
04
00
43
698(
59)
698(
58)
0
02
0
09
81
18 1141(
96)
1135(
74)
0
27
0
07
91
704(
62)
721(
63)
1
61
0
02
49
19 1146(
97)
1108(
80)
1
41
0
01
64
733(
63)
714(
43)
1
21
0
02
28
To
tal
1081(
133)
1095(
117)
-
2
05
4
00
40
678(
81)
687(
82)
-
2
07
7
00
38
Statistically significant p values at 005 levels of significance
54
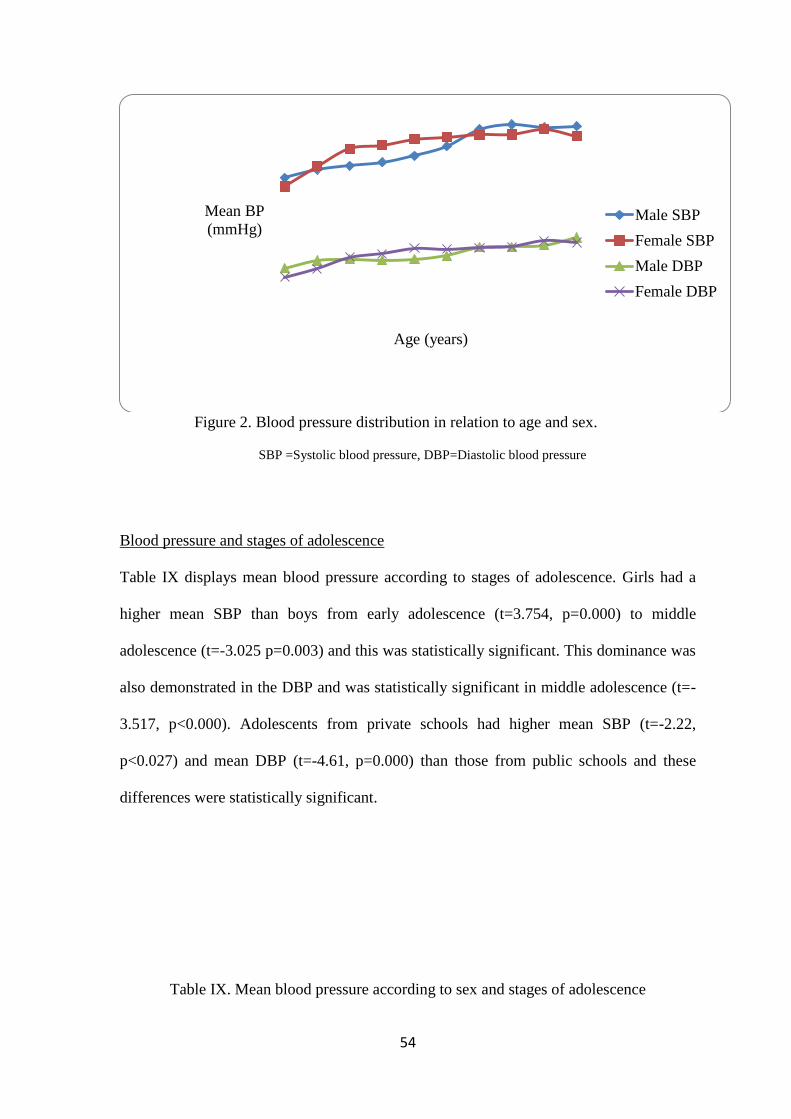
Figure 2 Blood pressure distribution in relation to age and sex
SBP =Systolic blood pressure DBP=Diastolic blood pressure
Blood pressure and stages of adolescence
Table IX displays mean blood pressure according to stages of adolescence Girls had a
higher mean SBP than boys from early adolescence (t=3754 p=0000) to middle
adolescence (t=-3025 p=0003) and this was statistically significant This dominance was
also demonstrated in the DBP and was statistically significant in middle adolescence (t=-
3517 plt0000) Adolescents from private schools had higher mean SBP (t=-222
plt0027) and mean DBP (t=-461 p=0000) than those from public schools and these
differences were statistically significant
Table IX Mean blood pressure according to sex and stages of adolescence
Mean BP
(mmHg)
Age (years)
Male SBP
Female SBP
Male DBP
Female DBP
55
Stages
of
adolesc
ents
(years)
Mean(plusmnSD) systolic blood pressure
(mmHg)
Mean(plusmnSD) diastolic blood pressure
(mmHg)
Male Female t p Male Fema
le
t p
Early
(10-13)
1000(9
6)
1040(1
18)
37
54
00
00
648(
56)
653(
82)
05
99
05
50
Middle
(14-16)
1075(1
29)
1105(1
13)
-
30
25
00
03
670(
81)
694(
77)
-
35
17
00
00
Late
(17-19)
1140(1
28)
1121(1
11)
21
45
00
33
717(
85)
710(
83)
00
70
09
45
1082(1
33)
1092(1
17)
-
20
54
00
40
678(
81)
687(
82)
-
20
77
00
38
Statistically significant p values at 005 level of significance SD=Standard Deviation
Table X shows blood pressure pattern according to stages of adolescence
Prehypertension and hypertension were more prevalent in late adolescence than early and
middle adolescence (χ2=49054 p=0000) and (χ2=10305 p=0006) both of which were
statistically significant
Table X The pattern of normal BP Prehypertension and hypertension according to stages
of adolescence
56
Blood
pressure
pattern
Stages of adolescence
Early
n()
Middle
n()
Late
n()
Total
N()
χ2 p
Normal 290(84
8)
428(72
3)
275(66
1)
993(73
5)
429
79
000
0
prehypertens
ion
43(12
6)
135(22
8)
120(28
8)
298(22
1)
490
54
000
0
Hypertensio
n
9(26) 29(49) 21(51) 59(44) 103
05
000
6
342(10
0)
592(10
0)
416(10
0)
1350(1
00)
350
93
000
0
Statistically significant p value at 005 level of significance
Relationship between blood pressure and the measured anthropometry
There was a positive correlation between SBP and DBP with age and the anthropometric
variables of weight height waist circumference and BMI (Table XI) SBP showed a
stronger correlation with the anthropometries than the DBP and was stronger for weight
(r=051) and height (r=044) The waist circumference though statistically significant
showed the weakest correlation
Table XI Correlation between blood pressure age (yrs) and anthropometry
Parameters
Systolic Blood Pressure Diastolic Blood Pressure
Correlation
coefficient
p Correlation
coefficient
p
57
Age (yrs) 035 lt0000 030 lt0000
Height (m) 044 lt0000 034 lt0000
Weight (Kg) 051 lt0000 038 lt0000
WC (cm) 040 lt0000 029 lt0000
BMI
(Kgm2)
031 lt0000 023 lt0000
Statistically significant p values at 005 level of significance Wt=Weight Ht=Height WC=Waist
circumference BMI=Body Mass Index
Blood pressure distribution and socio-economic classes
Table XII shows mean blood pressure according to socio-economic class of the subjects
Lower social classes had higher mean SBP (t=1650 p=2850) and DBP (t=0193
p=00058) but these were not statistically significant
Table XII Mean Blood pressure in relation to socioeconomic classes
Blood
pressur
e
Socioeconomic classes
Upper (1 amp
2) n=184
Middle (3)
n=516
Lower (4 amp
5)
n=650
f(anova
)
p
Mean
(SD)
10857(126
)
10866(128
)
11040(109
)
1650 285
0
58
SBP
Mean
(DBP)
6820(83) 6791(83) 6957(76) 0193 005
8
SEC= Socioeconomic class SBP=Systolic Blood Pressure DBP=Diastolic Blood Pressure SD=Standard
Deviation
Table XIII shows blood pressure pattern in relation to socioeconomic classes of the
subjects The percentage of students with prehypertension was higher in the upper social
class ((χ2=3067 p=0216) while the percentage of hypertension were higher in the lower
socioeconomic classes (χ2=1037 p=0568) but these differences were not statistically
significant
Table XIII Blood pressure pattern in relation to socioeconomic status
Blood
pressure
pattern
Socioeconomic classes
Upper
(1 amp 2)
n()
Middle
(3)
n()
Lower
(4 amp 5)
n()
Total
N()
χ2 p
Normal 127(69
)
383(74
2)
483(74
3)
993(73
6)
417
6
012
4
Prehypertens
ion
52(28
3)
108(20
9)
138(21
2)
298(22
1)
306
7
021
6
Hypertension 5(27) 25(48) 29(45) 59(44) 103 056
59
7 8
184(10
0)
516(10
0)
650(10
0)
1350(10
0)
573
0
022
0
Prevalence of Hypertension and Prehypertension
Table XIV shows the prevalence of hypertension in the study population The total
number of students with hypertension was 59 giving an overall prevalence of 44
Thirty four students (25) had systolic hypertension sixteen (12) had diastolic
hypertension and nine students (07) had both systolic and diastolic hypertension
Systolic hypertension was more prevalent in the females and was more at the age of 16
years while diastolic hypertension was higher in males and this also occurred at 16 years
Among those with hypertension 27 and 16 subjects had stage 1 and 2 systolic
hypertension respectively With regard to diastolic hypertension 24 and 1 subjects had
stage 1 and 2 hypertension respectively The gender difference in the prevalence of
hypertension is not statistically significant (χ2=0831 p=0362)
The number of students with pre-hypertension was 298 giving an overall prevalence of
221 Of this 131 were males and 167 are females This is illustrated in Table XIV
Prehypertension is more prevalent in females than males and this was statistically
significant (χ2=4349 p=0037)
60
Table XIV Overall Blood pressure pattern and prevalence of hypertension and
prehypertension of 1350 students in Jalingo
Blood pressure
pattern
Males
n=()
Females
n=()
Total
N()
χ2 p
Normal 471(750) 522(723) 993(735) 2619 0106
Prehypertension 131(209) 167(231) 298(221) 4349 0037
Hypertension 26(41) 33(46) 59(44) 0831 0362
628(100) 722(100) 1350(100) 1260 0533
statistically significant p value at 005 level of significance
61
DISCUSSION
The findings of this study showed that the BP of secondary school adolescents in Jalingo
was similar in terms of mean values range and trend of progression with age to that of
other adolescents from Ibadan63 and Kogi60 (Nigeria) Ashanti (Ghana)59 and Lebanon54
The mean value was however lower than the mean BP of adolescents from Zaria
(Nigeria)21 Belgrade ( Serbia)78 and Fortaleza-Cearaacute (Brazil)83 who had higher mean BP
in both sexes and at all ages The lower mean BP in this study compared to that of
adolescents from Zaria21 Belgrade78 and Brazil83 could be due to lower mean
anthropometry of weight height and BMI in adolescents from Jalingo resulting in lower
mean BP The sample sizes of these studies7883 were also different and could have
affected the mean BP of the study population For instance the sample size in the
Brazilian study83 is 151 compared to the study in Lebanon54 with 5710 subjects The use
of the fifth Korotkoff sounds as DBP in this study21 could also have accounted for the
lower mean BP in contrast to a similar study in Zaria21 where the fourth Korotkoff sound
was used as the DBP
A progressive increase in blood pressure with age was found in this study This
was similar to most findings by researchers in Nigeria 215358-606566107 and
worldwide54555961 The peak age of rise in BP in this study was in middle adolescence
between 15-16 years in boys but much earlier in girls for both systolic and diastolic BP
This was similar to the study by Akinkugbe Akinwolere and Kayode56 in Ibadan and
Ejeke Ugwu and Ezeanyika et al60 in Lokoja This age group is usually the period of
onset of puberty The chronologic age is not the main factor responsible for BP increase
62
with age but rather the progressive increase in size of the individual Increase in body
size with growth and maturity of organs associated with the physical and hormonal
changes during puberty potentially lead to increasing BP The simultaneous increase in
weight height and other anthropometric indices alongside BP with age seen in this study
and others is in agreement with that The implication of this increase in blood pressure
with age is that those with prehypertensionhypertension in childhood may continue into
adulthood hence further increasing the high prevalence of hypertension in the adult
population with its attendant morbidity disability and mortality
Overall significant higher mean BP was recorded in girls than boys in this study
This was seen from early to middle adolescence after which it reversed in favour of the
boys Reports on the relationship between BP and sex have been inconsistent Some have
reported higher mean BP in females54-56 others higher in males5883 while yet another
reported no sex differences22 The findings of this study were similar to those of Bugaje
Yakubu and Ogala21 and Ujunwa Ikefuna and Nwokocha100 who reported a consistently
higher mean blood pressure in female adolescents up to 16 years compared to their male
counterparts of similar ages Early female predominance in mean blood pressure was also
reports by Agyemang Redekop and Owusu-Dabo et al59 in Ashanti adolescents in Ghana
and Obika Adedoyin and Olowoyeye22 in Illorin The finding was however in contrast
with the study in Calabar58 where higher mean BP was found in boys than girls at all
ages The reason for the higher mean BP in females than boys could be because of earlier
onset of puberty in girls The differences in blood pressure between boys and girls in this
study could also be accounted for by variation in the anthropometric variables of the
individuals as girls were seen to be heavier and taller up to middle adolescence
This study demonstrated a consistently positive relationship between blood
pressure and the anthropometric variables of weight height body mass index and waist
63
circumference as widely reported in other studies 545558-6165107100 Weight is reported to
correlate positively with blood pressure in several studies53565871 Body mass index
(BMI) also showed a positive relation with BP in this study as reported in other
studies5978-81 This is in-keeping with the findings in Port Hacourt71 Abeokuta83 the
Gambia69 Brazil82 and Belgrade77 children Some of these studies however were made
up of younger and older age groups Even in lean populations BMI is known to correlate
positively with BP Waist circumference was also found in this study to correlate
positively with BP This was similar to reports from other studies79-8183 It was found to
be a better predictor of BP in two Italian study8081 while it was not in another82
Comparing BMI and waist circumference and their effects on BP Arauzo Lopes and
Moriera et al82 in Brazilian children found BMI to be a better predictor of BP than waist
circumference This was similar to the report by Sebanjo and Oshikoya83 in Nigerian
adolescents in Akure Guagnano Ballone and Colagrande et al81 however found waist
circumference to be better than BMI The study81 however involved adults and may not
be applicable in children and adolescents The present study demonstrated BMI and WC
to be significant but found BMI to be a better determinant of BP than waist
circumference BMI and waist circumference measure obesity in an individual Whereas
BMI is a measure of overall obesity WC measures centralabdominal fat accumulation
and thus said to be more predictive of adverse health risk79 Obese individuals may be
prone to such condition as dyslipidaemia insulin resistance and hypertension with
reduction in the quality of life Weight BMI and or waist circumference affects blood
pressure through decreased physical activity increased cardiac output insulin resistance
impaired pulmonary function and other hormonal abnormalities8084 It seems therefore
that BMI is a better predictor of BP in adolescents than waist circumference The reason
64
for this is not obvious but it may be because of the nature of uniform fat distribution in
adolescents associated with growth and hormonal changes at puberty
Blood pressure distribution in relation to the parental socio-economic class in this
study showed that students from low socio-economic classes had higher mean blood
pressure than those from upper socioeconomic classes but this was not statistically
significant A study in Ibadanl56 reported a statistically significant negative relation
between blood pressure and parental socio-economic status It was also similar to the
study58 in Calabar In contrast other studies found the reverse536022 The reasons for the
inverse relationship between BP and socioeconomic includes exposure to chronic
environmental stress with sustained sympathetic nervous system stimulation Others are
poor health seeking behaviours due to low income andor inadequate health knowledge
high low birth weight rate and inadequate healthy diets among others97101 In the same
environment individuals from a high social class are believed to be more educated with
high income61 They have easy access to health education and awareness on hypertension
prevention and control and better accessibility and adherence to medical treatment617374
The former might be responsible for the finding of this study as Jalingo is a semi urban
community Most of its inhabitants are subsistent farmers civil servants and traders with
low income The high number of students in the lower socioeconomic class lays credence
to that
The overall point prevalence of hypertension in this study was 44 while that of
pre-hypertension was 221 This prevalence of hypertension is similar to the prevalence
of 48 by Antia-Obong and Antia-Obong107 but higher than the prevalence rate of 37
reported in Zaria21 and lower than the prevalence of 58 reported in Ibadan56 54 in
Enugu100 and the 72 reported in Kano65 The prevalence of pre-hypertension was lower
than that reported by Ejeke Ugwu and Ezeanyika99 who found a prehypertensive
65
prevalence of 25 among adolescents in Lokoja It is higher than the 173 reported by
Ujunwa Ikefuna and Nwokocha et al100 in Enugu and 12-17 by Redwine and
Daniels96 among US adolescents The differences in the reported prevalence of
hypertension and prehypertension in adolescents could have resulted from the different
criteria applied by the various researchers in defining hypertension For instance whereas
this study used BP greater than 95th percentile as hypertension a study in Kano65 used the
adult hypertensive value of BPgt14090mmHg as hypertension and got a prevalence of
72 The prevalence in that study65 could have been higher if the percentile or the
statistical definition was used as many children with BP 14090mmHg would probably be
at stage 2 hypertension This was demonstrated in the study by Bugaje Yakubu and
Ogala21 who found a prevalence of hypertension in their study to be 06 when the adult
cut off value of gt14090mmHg was used but it increased to 37 when the statistical
definition of BPgt 2 standard deviations was used
The number of times blood pressure is taken could affect the outcome as repeated
measurements over a time interval is known to give lower BP values than if BP is taken
once This study used the average of three blood pressure values taken at one sitting but
Ujunwa Ekefuna and Nwokocha100 took three readings at five minutes interval with two
other readings at a week interval In that study100 the prevalence of prehypertension
dropped from 745 during the first set of readings to 173 after the third week
readings The prevalence of hypertension also dropped from 135 to 54 over the same
period Similar decrease in the prevalence of both prehypertension and hypertension was
reported by Redwine and Daniels96 in US adolescents when blood pressure was taken
over time interval Another factor which might have affected the overall prevalence is the
Korotkoff sound used for diastolic pressure23 The 4th or 5th Korotkoff sounds has been
used by different researchers resulting in different diastolic BP The study21 in Zaria used
66
the 4th Korotkoff sound while most other researchers2265100 used the 5th About 5-
10mmHg difference is said to exist between the 4th and 5th Korotkoff sounds230 In this
study the 5th Korotkoff sound was used thus giving a higher prevalence of hypertension
in the studied population than in those where the 4th sound was used
The implication of the outcome of this study is that 44 of adolescents in Jalingo
are already hypertensive while 221 of them are at risk of developing hypertension as
they are pre-hypertensive Since 856 (255 of 298) of the prehypertensives were in the
middle and late adolescence these individuals are likely to be adults with high blood
pressure Therefore regular screening of this group of individuals who were assumed to
be a healthy population is highly important for early detection of hypertension and
intervention such as life style changes and treatment
67
CONCLUSIONS
The following conclusions can be made from this study
1 The mean and range of blood pressure of adolescents in Jalingo was similar to
those of other adolescents in Nigeria and other parts of the world Blood pressure
increased progressively with age
2 All measured anthropometry of weight height body mass index and waist
circumference correlated positively with BP but weight was the most significant
variable in BP determination
3 Socioeconomic status was not significantly related with blood pressure
4 The point prevalence of hypertension and pre-hypertension was 44 and 221
respectively using a recommended definition
RECOMMENDATIONS
1 In view of the high prevalence of prehypertension in this study it is recommended
that students should have their blood pressure measured at school entry as this will
68
help identify those with abnormal BP for early intervention Thereafter BP check
should be offered at least once a year at the beginning of a new session especially for
those found with abnormal BP at school entry
2 Physical and health education should be revived in all the schools This will lead to
increased physical activity and reduced risk of obesity and its consequences
3 School health programmes should be strengthened in schools where it already exist
and effort made to establish same in schools where it is yet to exist The programme
should include measures to detect early prehypertension and hypertension and other
health related needs of the students
LIMITATIONS
The following limitations were encountered in the course of the study
1 Exclusion and inclusion of students that were based on volunteered information and
physical evaluation This could have led to inclusion andor exclusion of adolescentss
69
with or without background renal diseases which could have affected the result of this
study
2 Home blood pressure measurement especially early morning measurement for those
with high blood pressure to possibly eliminate the effect of stress traffic andor
trekking and other school related stresses which may affect blood pressure during the
day
LINES OF FUTURE RESEARCH
This study was questionnaire based and time bound Consequently students were not
investigated for background diseases co-mordid conditions target organ damage or risk
factors for high blood pressure They were also not followed up In view of this future
research on blood pressure in adolescents should include-
70
1 Investigations such as urinalysis electrolytes urea and creatinine random blood
sugar (RBS) lipid profile and echocardiography as part of blood pressure evaluation
in adolescents
2 A long period of study to allow for follow-up over months or years to identify those
that are truly hypertensive considering the definition of hypertension It will also
reveal the rate of progression from pre-hypertension to hypertension
3 Risk factors evaluation for high blood pressure including genetic predispositions
REFERENCES
1 Blood pressure from Wikipedia the free Error Hyperlink reference not valid
Accessed 24th November 2011
2 Pickering TG Hall JE Appel LJ Falkner BE Graves J Hill MN Jones DW Kurtz T
Sheps SG Roccella EJ Recommendations for blood pressure measurement in humans
and experimental animals Part 1 Blood pressure measurement in humans A
statement for professionals from the subcommittee of professional and public
71
education of the American Heart Association council on high blood pressure research
Hypertension 2005 45 142-61
3 da Silva IRR de Souza MDG de Camargo CAC Blood pressure measurement in
children and adolescents Guidelines of high blood pressure recommendations and
current clinical practice Arq Bras Cardiol 2007 88 434-7
4 Sinaiko AR Hypertension in children N Engl J Med 1996 3351968-73
5 US Preventive Services Task Force Screening for high blood pressure
recommendations and rationale Am J Prev Med 2003 25 159-64
6 Report of the second task force on blood pressure control in children Pediatrics 1987
79 1-25
7 National high blood pressure education programme working group on hypertension
control in children and adolescents update on the 1987 task force report on high blood
pressure in children and adolescents A working group report from the national high
blood pressure education program Pediatrics 1996 98 649-58
8 National high blood pressure education program working group on high blood
pressure in children and adolescents The fourth report on the diagnosis evaluation
and treatment of high blood pressure in children and adolescents Pediatrics 2004
114 255-76
9 Aderele WI Seriki O Hypertension in Nigerian children Arch Dis Child 1974
49313-7
10 Bo S Gambino R Gentile L Pagano G Rosato R Saracco GM Cassader M
Durazzo M Cavallo-Perin P High-normal blood pressure is associated with a cluster
of cardiovascular and metabolic risk factors a population based study J Hypertens
2009 27 102-8
72
11 Bao W Threefoot SA Srinivasan SR Berenson GS Essential hypertension
predicted by tracking of elevated blood pressure from childhood to adulthood The
Bogalusa Heart Study Am J Hypertens 1995 8 657- 65
12 Richard A Rodgers M Hedley AJ Mitchel JRA Changes in blood pressure and
blood lipid during adolescence BMJ 1980 28 1563-6
13 Sundstroumlm J Neovius M Tynelius P Rasmussen F Association of blood pressure in
late adolescence with subsequent mortality cohort study of Swedish male conscripts
BMJ 2011 342 643-8
14 Zimmet P Alberti G Kaufman F Tajima N Silink M Arslanian S Wong S Bennett
P Shaw J Caprio S On behalf of the International Diabetes Federation Task Force on
Epidemiology and Prevention of Diabetes The metabolic syndrome in children and
adolescents the IDF consensus Diabetic Voice 20075229-32
15 Abdulrahman FA Babaoye AA Childhood hypertension in northern Nigeria West
Afr J Med 1978 1 7-11
16 Adediran O Jimoh A Di M Relationship between body mass index and blood
pressure in rural Nigerian dwellers Internet J Nutri Wellness 2009 7 431-4
17 World Health Organization (WHO)UNICEF Adolescence at a glance 2003 p 2
18 The National Population Commission constitution of the Federal Republic of Nigeria
(AP 23 LFN) legal notice on publication issued April 21st 2007
19 Heald FP and Gong EJ Diet Nutrition and adolescents In Shils ME and Ross AC
(eds) Modern Nutrition in Health and Disease 9th ed William and Wilkins
Maryland USA 1999 p 32
20 Okonkon CT The prevalence of Hypertension among civil servants in Calabar Nig
Med J 1979 7422-5
21 Bugaje MA Yakubu AM Ogala WN Prevalence of adolescent hypertension in Zaria
Nig J Paediatr 2005 32 77-82
73
22 Obika LF Adedoyin MA Olowoyeye JO Pattern of paediatric blood pressure in
rural semi urban and urban communities in Ilorin Nigeria Afri J Med Sci 1995 24
371-7
23 Jeremy B A short history of blood pressure measurement section of the history of
medicine Proc Roy Soc Med 1977 70 793-9
24 Lewis O Stephen Hales and the measurement of blood pressure J Hum Hypertens
1994 8 865-71
25 Crile GW Blood Pressure in Surgery An experimental and Clinical Research
Philadelphia Lippincott 1903 p 358
26 Lewis WH The evolution of clinical sphygmomanometer Bull N Y Acad Med 1941
17 871-81
27 Browne WC OrsquoBrien ET Semple PF The sphygmomanometer of Riva Roci 1896-
1996 J Hum Hypertens 1994 610 723-4
28 Segal HN How Korotkoff the Surgeon discovered the auscultatory method of
measuring arterial pressure Ann Intern Med1975 83 561-2
29 Goodman FH and Howell AA Clinical studies in the auscultatory method of
determining blood pressure University of Pennsylvania Bulletin 1911 23 469-75
30 Crenner CW Introduction of the blood pressure cuff into US medical practice
technology and skilled practice Ann Intern Med 1998 128 488-493
31 Ganon WF Circulation In Review of Medical Physiol Lange Medical Publication
New York 22nd edition 2005 p 234-63
32 Beth C Homeostatic Regulation of Blood pressure Available from
URLhttpwwweHowcom Accessed on 1st December 2011
33 Rajinder KG Fahim M Regulation of cardiovascular functions during acute blood
loss Indian J Physiol Pharmacol 2005 49 213ndash9
74
34 Dampney AL Coleman MJ Fonts MAP Hirooka Y Horiuchi J Polson JW Potts
PD Tagawa T Central mechanisms underlying short-term and long-term regulation
of the cardiovascular system Proc Austr Physio Pharmacosociety 2001 32 333-44
35 Koshiya N Guyenet PG Noradrenergic neurons and the carotid sympathetic
chemoreflex Am J Physiol 1994 267 519-26
36 Prakash ES The ultimate goal in neural regulation of cardiovascular function Adv
Phyiol Educ 2008 32 107-8
37 Allen AM Inhibition of the hypothalamic paraventricular nucleus reduces
sympathetic nerve discharge and blood pressure Proc Austr Neuroscience Society
2001 29 44-7
38 Reid IA Interactions between ANG II sympathetic nervous system and
baroreceptor reflexes in regulation of blood pressure Am J Physiol 1992 262 763-
78
39 Brooks VL Osborn JW Hormonal-sympathetic interactions in long-term
regulation of arterial pressure A hypothesis Am J Physiol 1995 268 1343-58
40 Reckelhoff JF Gender Differences in the Regulation of Blood Pressure
Hypertension 2001 37 1199-208
41 Fink GD The systemic circulation as a regulated free-market economy A new
approach for understanding the long-term control of blood pressure Clin Exp
Pharmacol Physiol 2005 32 377ndash83
42 Benard K Sources of error in blood pressure measurement Hospital Physician 2002
12 33-7 Available from URLhttp wwwturnerwhitecom
43 Chyun DA A comparism of intra arterial and auscultatory blood pressure readings
Heart lung 1985 14 223-31
75
44 Nwankwo MU Lorenz JM Gardiner JC A Standard Protocol for Blood Pressure
Measurement in the Newborn Pediatrics 1997 99 1342-9
45 Deakin CD Low JL Accuracy of the advanced trauma life support guidelines for
predicting systolic blood pressure using carotid femoral and radial pulses
observational study BMJ 2000 321 673ndash4
46 OrsquoBrian E Replacing mercury sphygmomanometers require clinician to demand
better automated device BMJ 2000 320 815-6
47 McKay DW Raju MK Campbell NR Assessment of blood pressure measuring
techniques Med Educ 1992 26 208ndash12
48 Baker RH Ende J Confounders of auscultatory blood pressure measurement J Gen
Intern Med 1995 10 223ndash31
49 Neufeld PD Johnson DL Observer error in blood pressure measurement CMAJ
1986 135 633ndash7
50 van Montfrans GA Oscillometric blood pressure measurement progress and
problems Blood Press Monit 2001 6 287ndash90
51 Ware RW Laenger CJ Indirect blood pressure measurement by Doppler ultrasonic
kinetoartriography Proceedings 20th Annual Conference Engineering Medical
Biology 1967 9 27-30
52 Matthew Fox Blood pressure measurement technique Available from URL http
wwwlivestrongcom Last edited 2nd September 2010 Accessed on 30th November
2011
53 Akor F Okolo SN Okolo AA Blood pressure and anthropometric measurements in
healthy Primary School entrants in Jos Nigeria SAJCH 2010 4 42-5
54 Merhi BM Al-Hajj F Al-Tannir M Zaide F El-Rajab M A survey of blood pressure
in Lebanese children and adolescents North Am J Med Sci 2011 3 24-9
76
55 Al-Salloum AA El-Mouzan AH Al-Herbish AS Al-Umar AA Qurashi MM Blood
pressure standard for Saudi children and adolescents Ann Saudi Med 2009 29 173-8
56 Akinkugbe FM Akinwolere AO Kayode CM Blood Pressure Pattern in
Adolescence West Afri J Med 1999 18 196-202
57 Wanzhu T Eckert GJ Saha C and Pratt JH Synchronization of Adolescent Blood
Pressure and Pubertal Somatic Growth J Clin Endo Metab 2009 94
58 Ansa VO Anah MU Odey FA Mbu PN Agbor EI Relationship between parental
socioeconomic status and casual blood pressure in coastal Nigeria Adolescents West
Afri J Med 2010 29146-52
59 Agyemang C Redekop WK Owusu-Dabo E Bruijnzeels MA Blood pressure
patterns in rural semi-urban and urban children in the Ashanti region of Ghana West
Africa BMC Public Health 2005 5114-21
60 Ejeke CCE Ugwu CE Ezeanyika LUS Olayemi AT Blood pressure patterns in
relation to geographic area of residence a cross-sectional study of adolescents in Kogi
state Nigeria BMC Public Health 2008 8 411-5
61 Colhoun HM Hemminway H Poulter WR Socioeconomic status and blood
pressure an overview analysis J Human Hypertension 1998 12 91-110
62 Badaruddoza KR Familial aggregation and heritability for cardiovascular risk factors
a family based study in Punjab India Natural Science 2010 2 732-6
63 Livshits G Gerber LM Familial factors of blood pressure and adiposity co-variation
Hypertension 2001 37 928-35
64 Fermino RC Seabra A Garganta R Antoacutenio J Maia R Genetic factors in familial
aggregation of blood pressure of Portuguese nuclear families Arq Bras Cardiol 2009
92 463-9
77
65 Mijinyawa MS Iliyasu Z Borodo MM Prevalence of hypertension among teenage
students in Kano Nigeria Nig J Med 2008 17 173-7
66 The Wellcome Trust case control consortium Genome-wide association study of
14000 cases of seven common diseases and 3000 shared controls Nature 2007 447
661-78
67 Levy D Destefano AL Larson MG ODonnell CJ Lifton RP Gavras H Evidence for
a gene influencing blood pressure on chromosome 17 genome scan linkage results for
longitudinal blood pressure phenotypes in subjects from the Framingham heart study
Hypertension 2000 36 477- 83
68 Lifton RP Wilson FH Choate KA Geller DS Salt and blood pressure new insight
from human genetic studies Cold Spring Harb Symp Quant Biol 2002 67 445ndash50
69 van der Sande MA Milligan PJ Nyan OA Rowley JT Banya WA Ceesay SM
Dolmans WM Blood pressure patterns and cardiovascular risk factors in rural and
urban Gambian communities J Hum Hypertens 2000 14 489-96
70 Akinkugbe OO Ojo OA Arterial blood pressure in rural and urban population of
Nigeria BMJ 1969 2 22-4
71 Okagua J Anochie IC Akani NA Adolescent blood pressure in Rivers State Nigeria
A rural-urban comparism NJP 20154221-7
72 Urrutia-Rojas X Egbuchunam CU Bae S Menchaca J Bayona M Rivers PA Singh
KP High blood pressure in school children Prevalence and risk factors BMC
Pediatrics 2006 6 32-9
73 Sorof JM Lai D Turner J Poffenbarger T Potman R Overweight ethnicity and the
prevalence of hypertension in school-aged children Pediatrics 2004 113 475-82
78
74 Rosner B Prineas R Daniels SR Blood pressure differences between blacks and
whites in relation to body size among US children and adolescents Am J Epidemiol
2000 151 1007-18
75 Harding S Whitrow M Lenguerrand E Maynard M Teyhan A Cruickshank JK Der
G Ethnic differences in blood pressure in adolescence the determinants of adolescent
social well-being and health study Hypertension 2010 55 1063-9
76 Cruickshank JK Mzayek F Liu L Kieltyka L Sherwin R Webber LS Srinavasan SR
Berenson GS Origins of the ldquoblackwhiterdquo difference in blood pressure roles of birth
77 Vlajinac H Miljus D Adanja B Marinkoic J ipetic S Kocev N Blood pressure levels
in 7 to 14-year-old Belgrade children J Human Hypertension 2003 17 761ndash5
78 Menezes AMB Hallal PC Dumith SC Adolescent blood pressure body mass index
and skin folds sorting out the effects of early weight and length gains J Epid Comm
Health 2011 12 42-8
79 Karelis AD St-Pierre DH Conus F Rabasa-Lhoret R Poehlman EJ Metabolic and
body composition factors in subgroups of obesity what do we know J Clin Endo
Metab 2004 89 2569-75
80 Katzmarzyk PT Srinivasan ER Chen W Malina RM Bouchard C Berenson GS
Body mass index waist circumference and clustering of cardiovascular disease risk
factors in a biracial sample of children and adolescents Pediatrics 2004 114 198-205
81 Guagnano MT Ballone E Colagrande V Della Vecchia R Manigrasso MR Merlitti
D Riccioni G Sensi S Large waist circumference and risk of hypertension Int J
Obesity 2001 25 1360 ndash 4
82 Araujo TA Lopes MVO Moriera RP Cavalcante TF Gurdes NG MartinS dA Silva
V Blood pressure of children and teenagers from a public school in Fortaleza - Cearaacute
Acta paul enferm 200720103-15
79
83 Sebanjo IO Oshikoya KA Obesity and blood pressure levels of adolescents in
Abeokuta Nigeria Cardiovasc J Afr 2011 221-5
84 Messerli FN Obesity and essential hypertension Haemodynamics sodium excretion
and plasma rennin activity Arch Int Med 1981 141 81-5
85 Appel LJ Brands MW Daniels SR Karanja N Elmer PJ Sacks FM Dietary
Approaches to Prevent and Treat Hypertension A Scientific Statement from the
American Heart Association Hypertension 2006 47 296-308
86 Sacks FM Svetkey LP Vollmer WM Appel LJ Bray GA Harsha D Obarzanek E
Conlin PR Miller ER 3rd Simons-Morton DG Karanja N Lin PH for the DASH-
Sodium Collaborative Research Group Effects on blood pressure of reduced dietary
sodium and the Dietary Approaches to Stop Hypertension (DASH) diet DASH-
Sodium Collaborative Research Group N Engl J Med 2001 344 3ndash10
87 Appel LJ Moore TJ Obarzanek E Vollmer WM Svetkey LP Sacks FM Bray GA
Vogt TM Cutler JA Windhauser MM Lin PH Karanja N A clinical trial of the
effects of dietary patterns on blood pressure DASH Collaborative Research Group N
Engl J Med 1997 3361117ndash24
88 Appel LJ Sacks FM Carey VJ Obarzanek E Swain JF Miller ER 3rd Conlin PR
Erlinger TP Rosner BA Laranjo NM Charleston J McCarron P Bishop LM for the
OmniHeart Collaborative Research Group Effects of protein monounsaturated fat and
carbohydrate intake on blood pressure and serum lipids results of the OmniHeart
randomized trial JAMA 2005 294 2455ndash64
89 Karanja NM Obarzanek E Lin PH McCullough ML Phillips KM Swain JF
Champagne CM Hoben KP Descriptive characteristics of the dietary patterns used in
the Dietary Approaches to Stop Hypertension Trial DASH Collaborative Research
Group J Am Diet Assoc 1999 99 19ndash27
80
90 Nwokocha ARC Adolescence and associated problems In Azubuike JC and
Nkanginieme KEO (eds) Paediatrics and Child Health in a Tropical Region African
Educational Services Owerri Nigeria 2nd edition 2007 p 84-99
91 Rogol RT Roemmich JN Clark PA Growth and puberty J Adol Hlth 2002 31 192-
200
92 Tanner JM Marshal WA Variation in the pattern of puberty changes in boys and girls
Arch Dis Child 1970 45 13-23
93 Nwakoro SO Ifoda K Onochie O Olomu JM Anthropometric assessment of
nutritional status and growth of 10-20 years individuals in Benin City metropolis
Nigeria Pakistan J Nutr 2006 5 117-21
94 Shankar RR Eckert GJ Saha C Tu W Pratt JH The change in blood pressure during
pubertal growth J Clin Endo Metab 2005 90 163-7
95 Department of Health and Human Services 2000 CDC Growth Charts for the United
States methods and development Series Report 11 No 246 Available from URL
httpwwwcdcgovGrowthCharts
96 Redwine KM Daniels SR Prehypertension in Adolescents Risk and Progression
Journ Clin Hypertension 2012 14 360ndash4
97 Falkner B Gidding SS Portman R Rosner B Blood pressure variability and
classification of prehypertension and hypertension in adolescence Pediatrics 2008
122238ndash42
98 Redwine KM Acosta AA Poffenbarger T Development of hypertension in
adolescents with pre-hypertension J Pediatr 2012 16098ndash103
99 Ejike ECCC Ugwu CE and Ezeanyika LUS Variations in the prevalence of point
prehypertension in a Nigerian school-going adolescent population living in a semi-
urban and an urban area BMC Pediatr 2010 1013
81
100 Ujunwa FA Ikefuna AN Nwokocha AR Chinawa JM Hypertension and
prehypertension among adolescents in secondary schools in Enugu South East Nigeria
Italian J Pediatr 20133970-5
101 Chobanian AV Bakris GL Black HR Seventh report of the Joint National
Committee on Prevention Detection Evaluation and Treatment of High Blood
Pressure Hypertension2003 421206ndash52
102 Lande MB Systemic Hypertension In Kliegman RM Behrman RE Jenson HG and
Stanton BF (eds) Nelson Textbook of Pediatrics Saunders Elsevier Philadelphia 19th
Edition 2011 pg 1592-8
103 Luma GB Spiotta RT Hypertension in Children and Adolescent Am Fam Physician
2006 73 1558-68
104 Arvind B Rupesh J Vijayakumar M Madhuri K Ali U Evaluation and management
of hypertension Indian Paediatr 2007 44 103-21
105 Flynn JT Neonatal hypertension Diagnosis and management Pediatr Nephrol 2000
14 332-41
106 Steyn K de Wet T Richter L Cameron N Levitt NS Morrel C Cardiovascular
diseases risk factors in 5-year old urban South African children- The Birth to Ten
Study SAMJ 2000 90 7126
107 Antia-Obong OE Antia-obong LE Arterial blood pressure of Nigerian Urban and
Rural school children Nig J Paediatr 1991 18 3-11
108 Nguyen NT Magno CP Lane KT Hinojosa MW Lane JS Association of
hypertension diabetes dyslipidemia and metabolic syndrome with obesity findings
from the National Health and Nutrition Examination Survey 1999 to 2004 J Am Coll
Surg 2008 207 928-34
82
109 Solar MB Gill A Rey J Epidemiology of arterial blood pressure in school children
population Aten Primaria 1992 9 212-4
110 Steyn K de Wet T Richter L Cameron N Levitt NS Morrel C Cardiovascular
diseases risk factors in 5-year old urban South African children- The Birth to Ten
Study SAMJ 2000 90 7126
111 Linkas J The assessment and management of hypertensive emergencies and
urgencies in children Pediatr Emerg Care 2005 21391-6
112 Croix B Feig DI Childhood hypertension is not a silent disease Pediatr Nephrol
2006 21527-32
113 Flynn JT Anderson MH Characteristics of children with primary hypertension seen
at a referral centre Pediatr Nephrol 2007 44 103-21
114 Nakao M Yano E Nomura S Kuboki T Blood pressure lowering effects of
biofeedback treatment in hypertension a meta-analysis of randomized controlled trials
Hypertension 2003 26 37- 46
115 Jalingo Available from URLhttpwwwencyclopedia Britanica Accessed on 3rd
December 2011
116 Araoye MO Research Methodology with Statistics for Health and Social Sciences
Nathadex Publishers Saw-Mill Ilorin Nigeria 2004 pg 115-21
117 Olusanya O Okpere E Ezimokhai M The importance of social class in voluntary
fertility control in a developing country West Afr J Med 1985 4 205-12
118 World Health Organization expert committee Physical status the use and
interpretation of anthropometry WHO technical report series No 894 Geneva WHO
1995 p 424ndash38
119 Guidelines subcommittee WHOISH guideline for management of hypertension J
Hypertens 1999 17 151-83
83
120 Aubay B How to measure waist circumference Available from
URLhttpwwwehowcom Last updated August 10th 2011 and accessed on December
9th 2011
APPENDICES
Appendix 1
PROFORMA ON BLOOD PRESSURE PATTERN IN APPARENTLY HEALTHY
SECONDARY SCHOOL ADOLESCENTS IN JALINGO
PUBLIC SCHOOL [ ]
Serial No
84
PRIVATE SCHOOL [ ]
A BIODATA
1 Age (years) 10[ ] 11[ ] 12[ ] 13[ ] 14[ ] 15[ ] 16[ ] 17[ ] 18[ ] 19[ ]
2 Gender M [ ] F [ ]
3 Class JSS 1-3 [ ] SS1-3 [ ]
B MEDICAL AND SOCIAL HISTORY Yes [1] No [2]
1 Have you ever passed blood in your urine [ ]
2 Have you ever had your face or legs swollen [ ]
3 Are you on any drug for long time (such as pills steroids marijuana codeine
NSAIDs containing drugs tramal and others) [ ]
If yes specifyhelliphelliphellip
C SOCIO-ECONOMIC CLASSIFICATION
Fatherrsquos occupation
Score 1 Professionals top civil servants politicians and top businessmen
2Middle-level civil servants technicians skilled-artisans and well-to-do
traders
3 Unskilled workers and those in general whose income would be at or below
the national minimum wage
Mothers educational level
Score 0 Education up to University level
1 Secondary or tertiary level below the University
2 No formal education or up to primary level only
D ANTHROPOMETRY
i Weight (Kg) ndash 1helliphellip 2helliphelliphellip Averagehelliphelliphelliphellip
ii Height (m) ndash 1helliphellip 2helliphellip Averagehelliphelliphelliphellip
85
iii Body mass index = weightheight (kgm2)
v Waist circumference (cm) ndash 1helliphellip 2helliphelliphellip Averagehelliphelliphelliphellip
iv Blood Pressure (mmHg) - 1helliphellip 2hellip 3helliphellip Averagehelliphelliphelliphellip
Appendix 2
AUTHORIZATION AND CONSENT TO PARTICIPATE IN A RESEARCH
I Dr Peter Teru Yaru of the Department of Paediatrics Ahmadu Bello University
Teaching Hospital (ABUTH) Zaria Irsquom conducting a research on the blood pressure
pattern among secondary school adolescents in Jalingo
The aim of the study is to know the level of blood pressure among their age
groups Those with high blood pressure (or hypertension) will be identified appropriately
advised and referred for further care The study will involve taking their weight height
blood pressure and waist circumference Female assistants shall be responsible for
86
measuring waist circumference of female students Students will also be given a
questionnaire on some of their activities drug use among others all aimed at looking for
factors which can affect their blood pressure Information obtained shall be treated with
utmost confidentiality and for this research work only Please note that participation is
voluntary I will be glad if you give consent for your childward to participate in the
study
Statement by parents Irsquove read and understood this consent form and agreed for my
child to be included in the study
Parents name Researcherrsquos name and sign
Parents phone no if any Date
Parents signthumb print Phone no
87
Appendix 3
SOCIO-ECONOMIC SCORE
The classification of socio-economic scores based on fatherrsquos occupation and motherrsquos
education by Olusanya et al117
A Husband (fatherrsquos occupation)
Score 1 Professionals top civil servants politicians and businessmen
2 Middle-level bureaucrats technicians skilled-artisans and well-to-do traders
3 Unskilled workers and those in general whose income would be at or below
the national minimum wage
B Mothers educational level
Score 0 Education up to University level
1 Secondary or tertiary level below the University
2 No formal education or up to primary level only
The socio-economic class of the childrsquos mother is obtained by adding the scores from A
and B above and graded I-V as appropriate for example
Score (1) from A plus score (0) from B = social class I
Score (2) from A plus score (0) from B = social class II
Score (2) from A plus score (1) from B = social class III
Score (2) from A plus score (2) from B = social class IV
Score (3) from A plus score (0) from B = social class III
Score (3) from A plus score (1) from B = social class IV
Score (3) from A plus score (2) from B= social class V
Page 2
2
DECLARATION
I hereby declare that this dissertation is original It has not been presented by me or any other
person to another college or submitted elsewhere for publication
Date and Signature___________________________________________________
Dr Peter Teru Yaru
3
ATTESTATION
We certify that this dissertation was carried out by Dr Peter Teru Yaru of the Department of
Paediatrics Ahmadu Bello University Teaching Hospital Zaria under our supervision
Signature and Date__________________________________________
Professor WN Ogala MBBS FMCPaed FWACP DCH
Professor and Consultant Paediatrician
Ahmadu Bello University Teaching Hospital Zaria
Signature and Date__________________________________________
Dr HW Idris MBBS FWACP
Senior Lecturer and Consultant Paediatrician
Ahmadu Bello University Teaching Hospital Zaria
Signature and Date_________________________________________
DR AJ Uniga MB BCh FMCPaed
Consultant Paediatrician Dept of Paediatrics
Federal Medical Centre Jalingo
4
TABLE OF CONTENTS Title page i
Declaration ii
Attestation iii
Table of contents iv
Dedication v
Acknowledgement vi
List of abbreviations vii
Definition of terms viii
List of tablesrsquo ix
List of figures x
Summary xi
Introduction 1
Literature review 4
Aims and objectives 22
Materials and methods 23
Results 33
Discussion 47
Conclusions 53
Recommendations 54
Limitations 55
Lines of future research 56
References 57
Appendices 71
5
DEDICATION
This work is dedicated to my dearest wife and lovely children for their patience and
understanding during this period Above all I dedicate it to God Almighty for sustaining me
to this stage and beyond
6
ACKNOWLEDGEMENTS
I first and foremost acknowledge my supervisors in the persons of Professor WN Ogala Dr
HW Idris and Dr AJ Uniga for their untiring guidance and assistance throughout the period of
this work I am also grateful to all the consultants and residents of the Department of
Paediatrics ABUTH for their advice criticism and suggestions
The study would have been unsuccessful without the cooperation of the Taraba State
Post Primary Schools Board The school principals and the students were all wonderful and I
highly appreciate their cooperation during the study
My research assistants were very committed and dedicated and I really appreciate them
I particularly appreciate Dr AO Awolowo for his untiring participation in the study
Similarly I want to acknowledge the nurseMr E Joseph and Miss F Geoffrey the female
youth corper who both assisted with the anthropometric measurements
I acknowledge my primary institution the Federal Medical Centre Jalingo for
sponsoring me for the residency training I appreciate their moral and financial assistance
The management of ABUTH is also highly appreciated for giving me the opportunity of
training in her institution
Finally the support prayers and encouragement of my family kept me going during this
period I specially appreciate my dearest wife Susan and our children for standing by me even
when I was not always available when they needed me I also acknowledge my senior brother
Joseph Teru all my friends and other people who have contributed in one way or the other to
the successful completion of this work I thank them all
7
LIST OF ABBREVIATIONS
ADH Antidiuretic Hormone
ANP Atrial Natriuretic Peptide
BMI Body Mass Index
BP Blood pressure
CDC Centre for Disease Control
CVA Cerebro-vascular accident
DASH Dietary approach to stop hypertension
DBP Diastolic blood pressure
Ht Height
JSS Junior secondary school
Kg Kilogramme
M Meter
mmHg Millimeters of Mercury
NHBPEPWG National High Blood Pressure Education Programme Working Group
NCHS National Centre for Health Statistics
PGS Pubertal Growth Spurt
PHC Primary Health Care
QI Queteletrsquos index
SBP Systolic blood pressure
SSS Senior secondary school
SMR Sexual maturity rating
USA United States of America
WC Waist circumference
WHO World Health Organization
WHR Waist-hip ratio
Wt Weight
8
LIST OF TABLES
Table I Result of pilot study 26
Table II List of schools and number of students selected 28
Table III Age and sex distribution of the study subjects 33
Table IV Overall ean anthropometric measurements of the study subjects 35
Table V Mean anthropometric indices of 628 boys 36
Table VI Mean anthropometric indices of 722 girls 37
Table VII Mean and ranges of blood pressure of 1350 subjects 38
Table VIII Mean blood pressure in relation to age and sex 39
Table IX Mean blood pressureaccording to sex and stages of adolescence 41
Table X The pattern of normal BP prehypertension and hypertension according to stages of
adolescence 41
Table XI Correlation between blood pressure and anthropometry 42
Table XII Mean blood pressure in relation to socioeconomic classes 43
Table XIII Blood pressure pattern in relation to socioeconomic classes 43
Table XIV Overall Blood pressure pattern and prevalence of hypertension 45
9
LIST OF FIGURES
Figure 1 Studentsrsquo distribution according to socioeconomic classes 34
Figure 2 Blood pressure distribution in relation to age and sex 40
10
SUMMARY
A cross sectional study of blood pressure pattern in apparently healthy secondary school
adolescents aged 10-19years in Jalingo Taraba state was carried out over six months period
from January to July 2014 One thousand three hundred and fifty (1350) students
participated comprising 628 (465) boys and 722 (535) girls Variables measured
included blood pressure weight height waist circumference and body mass index was
calculated from the weight and height
Overall the mean anthropometric values and blood pressure increased with age
irrespective of sex The mean weight of the students was 486plusmn109kg with a range of 23-
100kg while the mean height was 16plusmn01m and ranged from 12-19m The mean waist
circumference was 656plusmn89cm and ranged from 22-100cm while the meanbody mass index
(BMI) was 189plusmn31 with a range of 114-420
The overall mean systolic blood pressure was 1089plusmn125mmHg with a range of 76-
165mmHg whilethe mean diastolic blood pressure was683plusmn82mmHg and ranged from 47-
95mmHg The gender related differences in blood pressure showed mean systolic blood
pressure for boys and girls to be 1081plusmn133mmHg and 1095plusmn117mmHg (t=-2054
p=0040) while the mean diastolic blood pressurewas 678plusmn81mmHg and
687plusmn82mmHg(t=-2077 p=0038) respectively Girls generally had a higher mean systolic
blood pressure than boys from early adolescence (t=3754 p=0007) to middle adolescence
(t=-3025 p=0011) but reversed during late adolescence with boys having higher mean
systolic blood pressure (t=2145 p=0033) and these differences were statistically significant
Girls also showed dominance in the diastolic blood pressurein early and middle adolescence
but only statistically significant during middle adolescence (t=-3517 plt0000) Adolescents
from private schools had higher meansystolic blood pressure of 1102plusmn123mmHg than those
11
from public schools with 1084plusmn125mmHg(t=-222 plt0027)and higher mean diastolic
blood pressure of 703plusmn80mmHg than those from public schools with 677plusmn81mmHg(t=-
461 p=0000)
Blood pressure correlated positively with age (r=030-035 plt0000) height (r=034-
044 plt0000) weight (r=038-051 plt0000) body mass index (r=029-040 plt0000) and
waist circumference (r=023-031 plt0000) The socio-economic class associated negatively
with blood pressure withthose from upper socio-economic classeshavinga relatively
lowermean blood pressure than their counterparts from lower socio-economic classes but the
differences were not statistically significant for both systolic (f=1650 p=2850) and diastolic
blood pressure (f=0193 p=0058)
The overall point prevalence of hypertension was 44(59 0f 1350) with gender specific
prevalence for malebeing 41 (26 of 628 boys) and46 (33 of 722 girls) for females The
gender difference was not statistically significant (χ2=0831 p=0362) According to stages of
hypertension 15 (10 of 628)and 11 (7 of 628) males had stages 1 and 2 systolic
hypertension respectively while24 (15 of 628) had stage 1 diastolic hypertension andnone
had stage 2 diastolic hypertension Similarly 24 (17 of 722) and 12 (9 of 722) females
had stages 1 and 2 systolic hypertension respectively while 12 (9 of 722) and only 01 (1
of 722) girls had stages 1 and 2 diastolic hypertension respectively The overall prevalence of
pre-hypertension was 221(298 of 1350) with gender related prevalence of 21 (131 of
628) for males and231 (167 of 722) for femalesThe gender difference was statistically
significant (χ2=4349 p=0037)
In view of the high prevalence of pre-hypertension of 221 (298 of 1350) in this
study it is recommended that blood pressure measurement should be included as part of
medical evaluation at secondary school entry and at least annually thereafter especially for
those found to be at risk of hypertension during school entry
12
INTRODUCTION
Blood pressure (BP) is the pressure exerted by circulating blood volume on the walls of
blood vessels1 It is one of the vital signs measured during routine physical examination2
Blood pressure measurement is done to screen for hypertension and other cardiovascular
risk factors determining risk for various medical procedures identifying patients in
potential or actual clinical deterioration and determining individualrsquos fitness for an
occupation3 Its value as a screening tool in adults has long been documented and is an
established important component of routine paediatric physical examination4
The importance of BP measurement in children and adolescents is based on the fact
that hypertension is now increasingly diagnosed among them5-8 The American Academy
of Paediatrics now recommends routine screening of asymptomatic adolescents and
children during preventive care visits Such screening will identify potentially treatable
and preventable causes of hypertension and initiate early treatment to prevent
complications5
Hypertension is an important health problem all over the world5-9 because it is
usually silent and the presence of symptoms may indicate end organ damage10 It is
known to track well into adulthood thus making BP measurements in youths valuable for
identifying adolescents at risk of essential hypertension in adulthood11 Individuals with
high BP in their childhood are more likely to have high BP in subsequent years12 The
phenomenon of BP tracking into adulthood and the demonstration of the beginnings of
hypertensive target organ damage during childhood together with the increased
prevalence of childhood essential hypertension have raised concern of an impending
epidemic of cardiovascular morbidity and mortality10
The consequences of hypertension in children range from increased morbidity
from its causes complications or its treatment to high mortality13 The most frequently
13
and perhaps severely affected organs are the heart kidneys brain and the eyes leading to
lowered life expectancy and premature death13 In addition hypertension is a component
of the metabolic syndrome associated with similar and perhaps more severe consequences
in affected individuals14 Abdulrahaman and Babaoye15 in a study of hypertension in
Nigerian children observed a mortality rate of 28 within the first year after diagnosis
Similar mortality of 275 was reported by Aderele and Seriki9 Hypertension also places
an excessive financial burden on the population and health system consuming scarce
resources16
Adolescence is the transitional period of development between childhood and
adulthood The World Health Organization (WHO) defines adolescents as individuals
between the ages of 10 and 19 years and they account for 40 of Nigeriarsquos population1718
Adolescence is characterized by rapid biological psychological and cognitive changes
largely dependent on hormonal and environmental influences19 Many of the responses to
these influences include behaviours that have direct implications on health such as harmful
dietary intake alcoholism smoking substance abuse and sedentary lifestyle19 These
coupled with social stresses such as city traffic congestion have negative health impact and
predispose to obesity and increased risk of cardiovascular disease such as hypertension and
metabolic syndromes10 20 It has been shown that if preventive measures are started early in
childhood and adolescence they may lead to significant reduction in the high prevalence of
hypertension and metabolic syndrome currently observed in adults81320
JUSTIFICATION FOR THE STUDY
Hypertension is associated with high morbidity affecting major organs of the body such as
the heart kidneys and the brain1314 and a mortality of up to 275-28915 It is now diagnosed
frequently in adolescents with a reported prevalence of 35-952122 The younger the age of
14
onset of hypertension the greater the reduction in life expectancy if left untreated13 Even
asymptomatic adolescents with mild blood pressure elevations can have target organ
damage10 Studies121420 have shown that early identification and intervention may lead to a
significant reduction in the high prevalence of hypertension and metabolic syndrome
currently observed in adults In view of this routine blood pressure check-ups for children
and adolescents have been advocated during medical evaluations8 Blood pressure is
however not routinely measured in most paediatric clinical practices in Nigeria
Consequently only few children will have their blood pressure measured when they fall sick
or during preventive care visits In addition hospital and clinic BP measurements may be
associated with falsely elevated BP called lsquolsquowhite coat hypertensionrsquorsquo8 BP measurement of
children outside of the hospital setting such as in schools will provide opportunity for
apparently healthy individuals and possibly eliminate white coat hypertension The need for
surveillance for the early identification of adolescents in Jalingo who are at risk of
hypertension and to initiate measures aimed at preventing its consequences is therefore the
justification for this study In addition the study will add to the body of knowledge on
adolescent blood pressure as there has been no previous study on BP from Jalingo and
northeastern Nigeria as a whole This will help inform public health policies regarding blood
pressure control and prevention in Taraba State in particular and in Nigeria in general
15
LITERATURE REVIEW
HISTORICAL PERSPECTIVE
Blood pressure measurement first started in the eighteenth century with the experiment of
Stephen Hales to whom its discovery can be attributed as reported by Jeremy2324
Accurate study of blood pressure as reported by Crile25 began with the introduction of a
manometer by Poiseuille a century later The first truly accurate blood pressure
measurement in man was by the Surgeon Faivre in 1856 when he connected an artery to a
mercury manometer to obtain direct readings24 Non-invasive methods of BP
measurement started with the discovery of the sphygmograph in 1855 by Vierordt as
reported by Crile25 and improvement by Potain in 1889 gave birth to the
sphygmomanometer26 In 1896 Scipione Riva-Rocci developed the method upon which
present-day technique is based27
Segal28 reported that the use of stethoscope for BP measurement was first highlighted
in 1905 by a Russian surgeon Korotkoff who documented hearing a tapping sound using a
stethoscope placed over the brachial artery as the Riva-Rocci cuff was deflated Goodman
and Howell29 recommended the division of the changing sounds into five distinct phases and
physicians subsequently determined blood pressure according to the point of appearance and
muffling or disappearance of the sounds30
DEFINITION AND REGULATION OF BLOOD PRESSURE
Blood pressure is defined as the product of cardiac output and peripheral vascular
resistance131 During each heartbeat BP varies between a maximum (systolic) and a
minimum (diastolic) pressure and is measured in millimeters of mercury (mmHg)1 Blood
16
pressure is regulated by different mechanisms acting either rapidly or slowly to maintain it
within normal range for optimal cellular performance3132
Intrinsic Regulation
Intrinsic factors regulating BP include stroke volume and heart rate which both influence
cardiac output31 Stroke volume depends on the volume of blood that fills the ventricles and
this depends on the preload and afterload33 A higher afterload will decrease stroke volume
causing low cardiac output and low BP and vice versa When cardiac output increases more
volume is derived from the venous pool increasing preload Similarly an increased heart rate
will lead to increased cardiac output and BP3134
Reflex Regulation
The baroreceptors within the aortic arch and carotid sinuses contain sympathetic and
parasympathetic nerve fibres3435 These are sensory nerves which run from the medulla
and they respond to stretch of the tissue in which they lie by increasing or decreasing the
rate of signaling36 and act fast in regulating BP34 Sympathetic stimulation causes
increased heart rate and widespread vasoconstriction to increase BP while
parasympathetic stimulation produces the opposite3537
Hormonal Regulation
Hormones regulating blood pressure include renin-angiotensin-aldosterone and
antidiuretic hormone (ADH) They act slowly by responding to changes in intravascular
volume and osmolality38 Angiotensin II is a potent vasoconstrictor and stimulates the
release of aldosterone from the adrenal gland39 Aldosterone increases sodium absorption
and fluid retention leading to increased BP ADH is a potent vasoconstrictor and plasma
volume regulator and its stimulation results in fluid retention and vasoconstriction39
Other hormones regulating BP include the sex hormones thyroid parathyroid cortisol
and ACTH They act on the rennin-angiotensin-aldosterone system to regulate BP3940
17
Renal Regulation
The kidneys control blood pressure through the retention and excretion of extracellular
fluid35 An increase in renal fluid retention will increase extracellular volume and higher
blood pressure whereas increased renal excretion leads to lower blood pressure41 This is
achieved through the action of ADH aldosterone and atrial natriuretic peptide (ANP)41
METHODS OF MEASURING BLOOD PRESSURE
Blood pressure can be measured by invasive and non-invasive methods
1) Invasive (or direct) method - Blood pressure is most accurately measured invasively
through an arterial line4243 It is the gold standard by which the accuracy of other blood
pressure measuring devices and methods are assessed4344 Chyun43 compared direct and
indirect blood pressure readings in 14 intensive care unit patients and found that the
auscultatory method overestimates the systolic and diastolic BP especially if the VI Kortkoff
sounds is used as an indicator of diastolic BP This can often over estimate reading by as
much as 20 mm Hg43 This study is made up of very small sample size to make general
conclusion on the differences in BP values from the two methods compared Although the
invasive method is the gold standard for true BP measurement it is associated with serious
complications related to arterial catheterization and the procedure itself may be technically
difficult It is mainly used in experimental procedures and in monitoring critically ill patients
in intensive care units42
2) Non invasive (indirect) methods These are simpler and quicker than the invasive
method and are commonly used for routine blood pressure examinations They may
however yield lower accuracy and small systematic differences in numerical results43
These methods include-
18
a) Palpation method - A minimum systolic value can be estimated by palpation Deakin
and Low45 reported that a palpable radial femoral or carotid pulse indicates a minimum
systolic BP of 80 70 and 60 mmHg respectively The study was carried out among adults
and these values could not be applicable in children and neonate whose maximum
systolic BP may be lower than the reported minimum values A more accurate systolic BP
value can be determined by inflating and then deflating sphygmomanometer cuff while
palpating the pulse The systolic BP corresponds to the pressure at which the radial pulse
becomes palpable45 Its disadvantages are that pressure obtained is usually 2-5mmHg less
than those obtained by auscultation and diastolic BP cannot be measured32
b) Auscultation method- Also called the Korotkoff method is the method of choice in
clinical practice142 It involves using a stethoscope and a sphygmomanometer46 The
mercury sphygmomanometer is the gold standard for BP measurement A Riva-Rocci
cuff 27 is placed over the arm and inflated to occlude the brachial artery It is then
gradually deflated until blood flow is re-established accompanied by a tapping sound
which can be detected by the stethoscope held over the artery Five sounds are
traditionally heard and classified into phases30 The first phase corresponds to the systolic
BP while the last or fifth phase corresponds to the diastolic BP30 The fourth phase
alternatively is used to measure the diastolic pressure if a 10 mmHg or greater
differences exist between the initiation of phases fourth and five or if the fifth sound is
heard down to 0 mmHg8 This may occur in cases of high cardiac output or peripheral
vasodilatation children or in pregnancy This method though the method of choice in
clinical practice may however be associated with errors arising from faulty technique and
equipment4748 as well as observer bias49 This method was used for this study because of
its widespread general usage its reliability and accuracy Unlike other methods the
instruments (mercury sphygmomanometer and stethoscope) do not require any
19
calibration and values obtained do not require validation by other methods The standard
World Health OrganizationCenter for Disease Control (WHOCDC) blood pressure
reference percentile tables were generated using the mercury sphygmomanometer hence
the auscultation method is the gold standard for BP evaluation258
The aneroid sphygmomanometer measures BP by mechanical system of metal
bellows that expand as the cuff pressure increases in a series of levers that register the
pressure on a circular scale The hybrid shygmomanometer combines some of the features
of the two and uses an electric transducer to record blood pressure2
c) Oscillometric technique- This uses the oscillometric device Oscillation of pressure in a
sphygmomanometer cuff is recorded during gradual deflation The point of maximum
oscillation corresponds to the mean arterial pressure50 The oscillation begins well above
systolic BP and continues below diastolic BP so that systolic and diastolic BP can only
be estimated indirectly according to some empirically derived algorithm
d) Ultrasound method - This uses an ultrasound transmitter and receiver placed over the
brachial artery under a sphygmomanometer cuff As the cuff is deflated the movement of
the arterial wall and systolic BP cause a Doppler phase shift in the reflected ultrasound
The diastolic BP is recorded as the point of diminished arterial motion51 Its advantage
includes the ability to detect diastolic BP in atrial fibrillation and hypotension where
Korotkoff sound is faint152
FACTORS AFFECTING BLOOD PRESSURE IN ADOLESCENTS
Several inter-related factors affect blood pressure These include-
Age - A progressive BP elevation with age has been observed in several studies2153-55
The rate of rise varies in boys and girls5455 The average systolic increase ranges between
20
166 and 286 mmHgyr for boys and 144 and 263mmHgyr for girls while that of
diastolic BP ranges from 083 and 177mmHgyr for boys and 077 and 148mmHg for
girls2155 Bugaje Yakubu and Ogala21 studied blood pressure pattern among 2035
adolescents in Zaria and found a consistent rise of BP with age The rate of rise was fairly
constant until 11-13 years in boys and 12-14 years in girls when the rise became rapid A
similar study53 also found a BP rise with age among 650 healthy school children in Jos In
a large population studies in Lebanon56 and Saudi Arabia55 BP was similarly reported to
increase consistently with age Rapid growth and biological maturation of organs which
are normal occurrences during adolescence were thought to be responsible rather than the
chronological age56 The results of these studies showed increasing blood pressure with
age despite the fact that one study55 used oscillometric method for their study while the
standard auscultation was used in the other studies Also the studied sample sizes across
these studies varied greatly with sizes of 65053 203521 571054 and 1622655 Despite this
the findings were similar
Gender ndash Results of studies on the effect of gender on BP showed that sex positively
affects blood pressure2153-55 Merhi Al-Hajj and Al-Tannir et al54 studied BP pattern in
5710 Lebanese school children while Al-Salloum El-Mouzan and Al-Herbish et al55
studied BP pattern in 16226 Saudi children and adolescents The authors reported a
higher BP in girls than boys at all ages A study21 of BP pattern in adolescents in Zaria
Nigeria demonstrated an initial higher BP in boys before puberty which reversed with the
onset of puberty up to the age of 14-15yrs when it reversed again to be higher in boys
Akinkugbe Akinwolere and Kayode56 reported no sex differences in adolescent BP in
Ibadan The reported sex difference is said to be likely due to differences in sex hormone
and pattern of growth in boys and girls57 Differences in age range of the study population
may however be responsible for the observed BP variation For instance these studies5455
21
comprised of both adolescents and pre-adolescent age groups combined in one study
while the other two studies2156 were purely adolescents21 Blood pressure is reported to be
equal in both sexes before adolescence after which the gender difference starts to
manifest most likely due to physical and hormonal changes
Socioeconomic Factors - Belonging to either end of the socioeconomic strata is found to
be associated with elevated blood pressure5859 A study in Ibadan56 reported an inverse
relationship between parental socioeconomic status and level of BP in adolescents The
authors suggested that this might be the result of the health behaviours and problems
characteristic of the lower socioeconomic class On the other hand Ejeke Ugwu and
Ezeanyika et al60 in Lokoja and another study53 in Jos both found higher BP in children
from high socioeconomic class Colhoun Hemminway and Poulter61 in a meta-analysis of
BP and socioeconomic status in developed and developing countries found an inverse
relationship of BP with socioeconomic status in developed nations and a direct correlation
in developing countries These different findings may be due to methodological
differences in socio-demographic stratification For instance Akinkugbe and
colleagues59 used fatherrsquos level of education for social classification Parentrsquos educational
level may however not equate well with level of family income The other study60 used an
automated device for their study whose values may require validation using the
recommended auscultation method Difference in environmental stresses may also be
different considering the level of development of the areas where the studies were carried
out
GeneticFamilial Factors - The effect of geneticfamilial factors on BP has been
demonstrated in some studies62-64 Familialgenetic correlations reflected in BP and other
anthropometry generally are higher among genetically close relatives such as brother-
sisters or parent-offspring than among spouses62 Levshit and Gerber63 surveyed 514
22
individuals from 135 nuclear families in Russia while Budaruddoza62 studied 1400
individuals from 380 families in India and found significant genetic influence on BP
Mijinyawa Iliyasu and Borodo65 also reported family history of hypertension as risk
factor for developing high BP in a study on prevalence of hypertension among 1000
teenagers in Kano The authors concluded that this could be due to genetic predisposition
They however did not evaluate further to determine the genetic defects The authors did
not also consider shared environmental factors known to influence blood pressure in
individuals Molecular genetic studies have identified genes as possible regulators of
BP6667 These genes regulate the renin-angiotensin-aldosterone system involved in renal
salt handling69 Mutations that increase sodium reabsorption and salt sensitivity is
associated with higher BP and vice versa68 while shared environmental risk factors may
potentiate the development of such familial conditions which might have been
responsible for outcome of the above studies6364
Environmental Factors ndash Environmental factors greatly influence BP variation in a
population592269 Akinkugbe and Ojo70 reported a consistently higher BP in Nigerian
adolescents than their counterparts of similar ages in black and white American children
The authors are of the view that this could be due to different environmental factors of the
study population Obika Adedoyin and Olowoyeye22 studied BP pattern in 2526
children aged 1-14 years in rural semi-urban and urban communities in Ilorin Nigeria
and demonstrated a hypertension prevalence of 95 in urban compared to 63 in rural
communities This was similar to the study59 in Ghana and Gambia69 The authors592269
argued that the differences were due to socioeconomic status which is higher in the urban
than the rural areas The BP variation could be accounted for by the nature of dietary
intake since the rural communities generally consume more of natural foods with less salt
and lsquojunk foodsrsquo compared to the urban populace This was demonstrated by one study61
23
which reported higher mean BP among urban communities in developing nations due to
changes in their dietary pattern Rural areas are also less exposed to the stress and hassle
of the urban cities It is of interest to note however that urban areas are a mixture of
social classes as a result of migrant workers seeking lsquogreener pasturesrsquo Okagua Anochie
and Akani71 on the other hand reported higher mean BP among rural adolescents than
their urban counter parts in Port Harcourt The authors could not identify the reason(s) for
their finding but concluded that the seemingly protective privilege of rural life may be
fading gradually The differences in the reports could however result from the sample size
composition comprising of preadolescents22 adolescents71 and adults69
Race - Higher BP levels have been reported in African-American and Hispanic school-
age children than their Caucasian counterparts and among African-Americans than the
Hispanics7273 Akinkugbe and Ojo70 demonstrated a consistently high systolic and
diastolic BP in Nigerian children compared with black and white American children of
similar age Exposure to chronic environmental stress low socioeconomic status and high
obesity rate among African American and Hispanic youths could contribute to higher
BP72-74 It can be inferred from the study that race alone may not be responsible for the
observed differences but shared environmental factors and socioeconomic status may be
contributory77 Other studies7475 however found no significant BP differences in relation
to race
Anthropometry and blood pressure (BP) - A positive correlation has been observed
between BP and anthropometry in various studies58-5977 These studies585678 observed a
significant correlation between systolic BP and weight height and body mass index
(BMI) in boys but only with weight in girls Body mass index (BMI) is used as a
measure of overall obesity but it is known to be a poor indicator of actual body fat79
Waist circumference (WC) is an aggregate measurement of the actual amount of total and
24
abdominal fat accumulation80 It is therefore a better predictor of BP and other
cardiovascular diseases8081 Guagnano Ballone and Colagrande et al81 studied the
relationship between BP and BMI WC and waist hip ratio (WHR) in 461 people and
found WC to be the most consistent anthropometry affecting BP It is of interest to note
that the study by Guagnano et al81 was in adults population while the other studies56-59
were in children and adolescents WC was also found to be a better predictor of BP in an
Italian study8081 while it was not in others56-6982 Comparing BMI and waist
circumference and their effects on BP Arauzo Lopes and Moriera et al83 in Brazilian
children found BMI to be a better predictor of BP than waist circumference This was
similar to the study by Sebanjo and Oshikoya82 in Nigerian adolescents in Akure Thus
waist circumference measurements may not be useful in the evaluation of obesity andor
hypertension in children and adolescents This may partly be explained by the uniform fat
distribution due to hormonal effect at puberty in adolescents compared to the
disproportionate fat distribution in adults Possible mechanisms for the positive
relationship between BP and high BMI includes decreased physical activity increased
salt intake impaired pulmonary functions and development of metabolic abnormalities
such as dyslipidaemia and insulin resistance8084
Nutritional factors - Diet has been a primary link between humans and their environment
and substantial evidence supports the concept that multiple dietary factors affect BP85
Well-established dietary modifications that lower BP are reduced salt intake increased
potassium intake increased protein particularly plant protein high vegetable and
polyunsaturated fats85 High sodium intake on the other hand is said to be associated with
elevated blood pressure86 A series of 3 large controlled feeding studies tested the effects
of dietary patterns on BP86-89 Of the 3 diets studied the dietary approach to stop
hypertension (DASH) emphasized fruits vegetables low-fat dairy products whole
25
grains poultry fish nuts potassium magnesium calcium and fibre as the most effective
diet89 Among all participants the DASH diet significantly lowered mean systolic BP by
55 mm Hg and mean diastolic BP by 30 mm Hg each net of changes in the control diet
DEFINITION AND CLASSIFICATION OF ADOLESCENCE
Adolescence is the transitional stage between childhood and adulthood during which many
life patterns are learnt and established90 According to World Health Organization (WHO)
adolescents are individuals between the age range of 10-19 years17 The most significant
feature of adolescence is puberty characterized by an exceptionally rapid rate of biological
growth and development including physical and sexual maturation9091 The pubertal changes
have been described by Tanner and Marshal92 and are grouped into five stages This utilizes
definite criteria for growth and development of secondary sexual characteristics like pubic
hair and breast in females and pubic hair and genitalia in males9092 The timing of these
events and the rate of growth vary due to genetic and environmental factors in different
populations92 Adolescence is divided into early middle and late periods17
Early adolescence (10-13 years) ndash This is a period of rapid growth and development of
secondary sexual characteristics and varies according to sex It corresponds to Tanner stages
1 and 290 The main features of this stage are breast bud development and menarche in girls
while testicular enlargement and seminal emission occurs in boys93
Middle adolescence (14-16 years) ndash In this stage rapid growth decreases and there is more
cognitive development as the adolescents move from concrete thinking to formal operation
and develop greater competence at abstract thinking91 This corresponds to Tanner stages 3
and 4
Late adolescence (17-19 years) ndash Here slowing of physical changes continue which permits
the emergence of a more stable body image Cognition tends to be less self-centered with
26
demonstration of care for others with increasing thought about concepts such as justice
patriotism and history It corresponds to Tanner stage 59092
ADOLESCENCE AND BLOOD PRESSURE
Adolescence is characteristically associated with increasing blood pressure because of the
physical growth and hormonal changes associated with puberty5794 After the age of one year
normal BP increases more during puberty than probably at any other time in an individualrsquos
lifetime95 Wanzhu Eckert and Saha et al57 examined data from a cohort of 182 normotensive
children in Indiana who had blood pressure measurements taken semi-annually for up to 12
yr The authors found that the rate of change in BP and weight peaked at the age of maximum
pubertal growth spurt (PGS) This BP spurt roughly coincides with growth spurt during
puberty94 Surveys of BP patterns from childhood through adolescence shows systolic and
diastolic pressures increase with age and in adolescents the increase in males is more marked
than in females especially the systolic pressure5458229495
CLASSIFICATION OF BLOOD PRESSURE IN ADOLESCENTS
The National High Blood Pressure Education Program Working Group (NHBPEPWG) of the
United States established guidelines for the definition of normal and elevated blood pressures
in children in 19876 These guidelines were revised in 20048 The definition of childhood
hypertension in the guidelines are based upon the normative distribution of blood pressure
(BP) in healthy children rather than clinical outcome data as in adults The guidelines
classified BP as normal prehypertensive or hypertensive Hypertension is graded into stage
one and two8
Normal BP - Blood pressure lt90th percentile for age sex and height Children and
adolescents with normal BP should be followed annually from the age of 3 years5 They
27
should be encouraged to maintain a healthy life style such as good dietary intake physical
activities and adequate rest8
Pre-hypertension - Blood pressure between the 90th and lt 95th or if BP exceeds
12080mmHg (even if lt90th percentile) but lt95th It was previously called high normal
BP This new description was introduced to help identify children at risk for the
development of persistent hypertension for whom targeted prevention programmes would
be most beneficial96 While recommendations for the diagnosis of hypertension in
children require that BP remains elevated on three separate occasions repeated
measurements are not necessary to classify an adolescent as pre-hypertensive11 The
prevalence of childhoodadolescence pre-hypertension in US is reported to be between
12-1796-98 In Nigeria Ejeke Ugwu and Ezeanyika99 in a study of the prevalence of
point prehypertension and hypertension in 843 adolescents in Lokoja reported a
prevalence of point prehypertension of 222 and 250 in semi urban and urban
communities respectively Ujunwa Ikefuna and Nwokocha et al100 reported 175
prehypertension prevalence among adolescents in Enugu Among adults with pre-
hypertension it is reported that as much as 10 per year develop hypertension101 There
is little information on the time course for children and adolescents with prehypertension
developing hypertension A value of between 11-7 per year has been reported in US
adolescents98 There is no known study on rate of progression of prehypertension to
hypertension in Nigerian adolescents The NHBPEP recommended that children with
pre-hypertension should have their BP checked after every six (6) months to monitor for
progression to hypertension They should be encouraged to engage in physical activity
healthy dietary behaviours and weight management if overweight Pharmacologic therapy
is not indicated except if there is strong evidence of renal disease heart failure left
ventricular hypertrophy or diabetes mellitus8
28
Hypertension Hypertension is BP persistently equal to or above the 95th percentile for
age sex and height measured on three or more separate occasions If the blood pressure
measurement obtained is gt 95th percentile the degree of hypertension should be staged
Stage 1 hypertension- BP value between the 95th and the 99th percentile plus 5mmHg It
is recommended that BP should be rechecked in 1ndash2 wks or sooner if the patient is
symptomatic If persistently elevated on 2 additional occasions it should be evaluated or
referred to source of care for pharmacologic treatment within 1 month 8
Stage 2 hypertension- BP value gt99th percentile plus 5mmHg This stage calls for more
prompt evaluation and commencement of pharmacologic therapy102 It is recommended
that the individual be evaluated or referred to source of care within 1wk or immediately if
the patient is symptomatic8
Aetiology of hypertension
Hypertension is classified as primary (essential) when there is no identifiable cause
or secondary if due to an underlying disease31 Factors such as heredity diet stress drugs and
obesity play a role in the development of essential hypertension103104 Causes of secondary
hypertension include umbilical artery catheterization renal diseases coarctation of the aorta
and endocrine disorders105106 Aderele and Sereki6 in their study of hypertension in children
reported hypertension secondary to renal pathology as the commonest cause of elevated BP
in children This study was mainly in preadolescent population in which secondary
hypertension is a common finding On the other hand Antia-Obong and Antia-Obong107
reported no apparent cause in greater than 90 of the studied subjects with elevated BP and
also reported proteinuria of 1 in the same population without any associated elevated blood
pressure The study did not however evaluate the etiology of the proteinuria A study65 of BP
in teenagers in Kano found family history of hypertension a risk factor in the study
population Another study in Enugu100 examined modifiable risk factors associated with
29
hypertension in 2694 adolescents and found only 1 and 06 of the hypertensive subjects
to be overweight and obese respectively The authors also found that smoking and alcohol
consumption were not significant risk for hypertension This may however be due to the
shorter period of consumption of these products by the students as a cumulative effect from
long term consumption is known to be associated with adverse health outcomes
Prevalence of hypertension in adolescents
The prevalence of hypertension in adolescents varies widely due to arbitrary and imprecise
definition by different researchers It was in view of this that the National High Blood
Pressure Education Program Working Group (NHBPEPWG) of the United States established
guidelines for the definition of normal and elevated blood pressures in children and
adolescents for uniformity68 In the USA the prevalence is about 20 in normal weight and
50 in their obese counterparts108 A prevalence rate of 77109 10554 and 223110 has
been reported in Spain Lebanon and South Africa respectively In Kano Nigeria a study65
on the prevalence of hypertension among 1000 teenagers found a prevalence of 72 Similar
study in Enugu100 on the prevalence of hypertension among 2694 secondary school
adolescents reported a hypertension prevalence of 54 It is of interest to note that different
prevalence was reported because of the different methodology used by the authors While the
study in Kano65 applied the adult blood pressure criterion of BP greater than 14090mmHg as
hypertension the study in Enugu100 used blood pressure greater than 95th percentile for age
and sex Also the study in Kano65 took a single set of measurement while the study100 in
Enugu measured blood pressure of the subject three times at weekly intervals Bugaje
Yakubu and Ogala21 on the other hand defined hypertension as blood pressure greater than
two standard deviations from the mean and also took six readings over thirty minutes and got
a prevalence of hypertension of 34 A prevalence rate of 48107 and 9522 in Southern
and Western region of the Nigeria respectively was also reported It is obvious that because
30
of the various defining criteria for hypertension in adolescents the prevalence of adolescent
hypertension remains imprecise
Clinical presentation- Hypertension is usually asymptomatic unless it has been
sustained or is rising rapidly109 Adolescents with essential hypertension are usually
detected during routine evaluation96 Non-specific symptoms such as lethargy headache
dizziness drowsiness visual disturbance and confusion may be present109 These could
also be signs of complications111 Secondary hypertension may show obvious features of
the underlying disease such as growth failure heat intolerance abdominal stria tremors
body swelling and haematuria8102 Croix and Feig112 studied the spectrum of symptoms in
409 children aged 7-18 years newly diagnosed hypertensive in Texas USA and reported
15 common symptoms than in the controls The symptoms were said to resolve after
commencement of antihypertensive medications The authors concluded that hypertensive
children had a variety of non-specific symptoms The three most common symptoms
reported were headache daytime tiredness and difficulty initiating sleep The study
however did not specify if other possible causes of these symptoms were excluded
Complications of hypertension - Hypertension is usually asymptomatic in adolescents
which if left unidentified overtime can cause serious complications109 Organs commonly
affected in the complication of hypertension are the heart kidneys brain and the eyes
leading to lowered life expectancy and premature death13 Left ventricular hypertrophy
(LVH) is the most prominent clinical evidence of end organ damage10 Studies have
shown that LVH can be seen in as many as 41 of patients even in adolescents with
asymptomatic hypertension10103 Adolescents with severe cases of hypertension are also
at increased risk of developing hypertensive encephalopathy seizures cerebrovascular
accidents and congestive heart failure103109 However data documenting such
complications in children and adolescents are generally lacking In a study of
31
hypertension among teenagers in Kano the researchers65 could not find any
complications in all the 1000 teenagers studied
Investigations and treatment- Basic investigations are all that may be required in
adolescents who are obese and with a family history of hypertension stage 1 disease and
normal findings on physical examination113 This is because primary hypertension is
commoner in adolescents Adolescents that are symptomatic or with stage 2 hypertension or
have features of secondary hypertension should be evaluated in more detail
Treatment of hypertension includes non-pharmacological and pharmacological
methods Non-pharmacologic management involves life style modification such as weight
reduction increased physical activities and dietary adjustment114 In a study to evaluate the
effect of diet and salt on treatment and prevention of hypertension Sacks Svetkey and
Vollmer et al86 reported the beneficial effect of both reduced salt intake and appropriate
dietary adjustment in the control of hypertension Similar benefits were reported in other
studies8788 Although both studies had fairly good sample size (n=412) the studies did not
specify if participants were on other substances or activities other than antihypertensive that
might have affected their BP The studies were also in adults and whether it has the same
effects in children and adolescents has not been evaluation However there is no doubt that
the outcome will be similar in adolescents as dietary modifications have been advocated as
non-pharmacologic management in them Non pharmacologic treatment is usually the initial
treatment in essential hypertension and as adjuvant to drug therapy in those with secondary or
complicated hypertension101114 Pharmacologic (drug) treatment includes diuretics beta-
blockers calcium channel blockers angiotensin converting enzyme inhibitors (ACEIs) and
angiotensin receptor blockers (ARB) among others106114 They are used in those with
symptomatic disease and in acute or chronic complications106
32
Prevention of hypertension may be viewed as part of the prevention of cardiovascular
disease102 In adolescents approaches to prevention include reduction in obesity
discouraging cigarette smoking and alcohol intake113 reduction in sodium intake and increase
in physical activity through community and school-based programmes103104 Growth
monitoring BP check during preventive care visit physical activity and urine screening for
proteinuria and haematuria can be used starting from early childhood
33
AIM AND OBJECTIVES
GENERAL AIM
To determine the blood pressure pattern of apparently healthy secondary school adolescents
in Jalingo Taraba State
SPECIFIC OBJECTIVES
To determine
1 Blood pressure pattern in relation to age and sex among adolescents aged 10-19
years
2 The relationship if any between blood pressure and the anthropometric parameters of
weight height BMI and waist circumference
3 The association between blood pressure and parental social-economic status
4 The point prevalence of prehypertension and hypertension in adolescents
34
MATERIALS AND METHODS
Study area
A cross-sectional survey of the blood pressure pattern of apparently healthy secondary
school adolescents aged 10-19 years was conducted in Jalingo over a six month period
from January to June 2014 Jalingo is the capital of Taraba State and lies within the
savannah belt of North Eastern Nigeria It lies between latitude 80 54rsquo north and longitude
110 21rsquo east and at an altitude of 360 meters above sea level115 Jalingo had a population of
118198 people18 The primary inhabitants are the Konas Mumuyes and Fulanis who are
mostly farmers Other indigenous ethnic groups include the Jukun Kuteb WurkumTiv
and host of other tribes The Ibos Hausas Yorubas among others are the non-indigenous
ethnic groups and are mostly civil servants and businessmen Jalingo has a tertiary health
centre the Federal Medical Centre Jalingo and the state specialist hospital It also has 15
private clinicshospital and many primary health care centres There are also tertiary
education institutions including Taraba State University As at 2013 there were 56
secondary schools in Jalingo 24 public and 32 private all of which were mixed schools
except one which is a girlsrsquo only school
Study design
The study was a cross sectional descriptive study of 1350 apparently healthy secondary
school adolescents in Jalingo
Ethical approval
Ethical approval for this study was obtained from the Scientific and Health Ethics Research
Committee of Ahmadu Bello University Teaching Hospital Zaria (Appendix 4) The Taraba
State Ministry of Education also gave the approval and permission to conduct the study in the
35
selected schools Consent was given by the studentsrsquo parents or guardian (Appendix 2) All
students whose parents gave consent voluntarily participated in the study
Sample size determination
The minimum sample size was calculated using the formula116
N=Z2 (pq) E2
Where N = minimum sample size
p = Prevalence of hypertension in adolescents A prevalence of 3421 was used
q = 1- p
E = margin of error tolerated =1
Z = 196 at 95 confidence level
N = 1962 x 0034 x (1-0034) 0012 = 1262
Therefore the minimum sample size was one thousand two hundred and sixty two
Allowance for non-responders of 5 63 extra subjects were added to the calculated
minimum sample size bringing the total to 1325 students To enhance representativeness of
the sample and to compensate for missing information and poorly filled proforma while
maintaining the sample size a total of 1350 was decided upon
Inclusion criteria
1 Students (ages 10-19 years) in the selected secondary schools
2 Students whose parents gave consent to participate in the study
3 Students who gave assent to participate in the study
Exclusion criteria
1 Students who had obvious skeletal deformities of the spine and legs which can affect
the height and ultimately the BMI
36
2 Students with known chronic disease (or history of such disease) like anaemia
chronic renal disease and cardiac disease because they are not apparently healthy and
these conditions could affect their blood pressure
3 Students with present or past history of chronic drug ingestion that can affect blood
pressure such as steriods and contraceptives
4 Students with high blood pressure already on antihypertensive
Pilot study
A pilot study was carried out in one of the schools a week before the commencement of
the study The school was selected by random sampling method using balloting and did
not participate in the main study The pilot study was carried out with the aim of
assessing the competence of the research assistants in the various measurements
following their training to ensure reliability It was also used to test the questionnaire
before its use during the main study and to provide information on the number of students
that can be measured in a day Consequently twenty students had their blood pressure
and anthropometry measured independently by the researcher and the research assistants
and data were compared using Students t-test There were no statistically significant
differences between the measurements The result of the pilot study is highlighted in
Table I It was also found that some parts of the questionnaire were not well understood
by most students and were adjusted appropriately in the main study (Appendix 1) The 20
students had their measurements done over a period of 3-4 hours (between 8am - 12noon)
by the researcher and the research assistants
Table I Result of pilot study
Variables Researcher Research t p
37
assistants
Mean(plusmnSD) SBP
mmHg
106(11) 104(12) 0550 0586
Mean(plusmnSD) DBP
mmHg
617(83) 63(10) 0450 0657
Mean(plusmnSD) Weight
kg
544(82) 527(122) 0520 0608
Mean(plusmnSD) Height m 16(01) 16(01) 0000 1000
Mean(plusmnSD) BMI
kgm2
198(36) 202(33) 0370 0716
Mean(plusmnSD) WC cm 692(72) 682(133) 0300 0769
Sampling method
Students were selected by multistage random sampling technique The list of secondary
schools obtained from the Taraba State Post Primary Schools Board served as the sampling
frame for schools There were 56 secondary schools 24 of which were public and 32 were
private schools a ratio of 113 Ten (10) schools were randomly selected by balloting four
(4) from public schools six (6) from private based on the number and approximately similar
ratio of private to public schools of 115 (46) Ten schools were selected to ensure wider
coverage and even distribution of students so that it could be truly representative of the
community All the ten schools had an overall total of eight thousand one hundred and seven
(8107) students The public schools had a total of five thousand nine hundred and forty
(5940) with nine hundred and eighty nine (989) students participating The private schools
had a total of two thousand one hundred and sixty-seven (2167) students with three hundred
and sixty one (361) participating These number (989 and 361) was calculated based on the
38
relative population of each school and proportionate to number of students in each school
Thereafter the number of students to participate per school was calculated proportionately to
the number of students in each school based on the number given by the school authority
Then the number in each class was also calculated proportionately from JSS1 to SS3 to
ensure fair and equal chance of participation for all age groups The calculation was done
thus n= a b x c
Where n= number of students per selected school
a= total numberpopulation of students in the school
b= total numberpopulation of students in all 10 selected schools (8107)
c= calculated total sample size (1350)
Students in each class from junior secondary school (JSS) 1-3 and senior secondary school
(SS) 1-3 were then randomly selected by balloting The number of selected schools total
number of students in a school and the number of students selected per school is outlined in
Table II
Table II Selected schools and number of students in each of the ten schools in Jalingo
Selected schools Total no of No of students
39
student in the
school (a)
n=8107
selected (n=abxc)
n=1350
Public schools
Govt Science Secondary School 2800 466
Govt Day Secondary School SGari 1200 200
Salisu Dogo Secondary School 1100 183
Govt Secondary School Magami 840 140
Total 5940 989
Private schools
Winners Comprehensive Secondary School 650 108
Hawai Secondary School 562 94
Centre for Quranic Science and Islamic Education 543 90
Good Success Secondary School 155 26
Jetters Academy 140 23
Yagai Academy 117 20
Total 2167 361
The study
The first contact with the students was a familiarization exercise to each of the schools during
which the teachers and students were given a talk by the researcher on blood pressure and the
40
importance of periodic blood pressure measurement They were given the opportunity to ask
questions which were responded to Both the students and their teachers actively participated
in the lectures
On the second day students were selected as described above and those selected
underwent general physical examination in the presence of a chaperon to identify those
who did not fulfilled the inclusion criteria Each selected student was given a proforma
(Appendix 1) in which information on their biodata and medical history were recorded
Other information obtained was parentrsquos medical history and their socioeconomic status
using the format described by Olusanya Okpere and Ezimokhai117 (Appendix 3) The
study was carried out in a relatively quiet and empty classroom to ensure privacy for both
male and female students The procedure for blood pressure measurement was
demonstrated on one of the research assistants and sometimes on one of the teachers by
the researcher to assure the students and allay their anxiety BP and anthropometric values
obtained were recorded in the study proforma An average of 15-20 students per day were
attended to over a period of 3-4 hours (between 8am - 12noon daily) by the researcher
one of the research assistants who is a medical officer a male nurse and a lady Youth
Corper (NYSC)
Blood pressure measurement
This was measured by the researcher and the research assistant (the medical officer) The
standard auscultation method was employed using a mercury sphygmomanometer (Acosson)
and a standard Littman stethoscope according to the guideline of the fourth report on the
diagnosis evaluation and treatment of hypertension in children and adolescents8 Each
students was rest-seated for 5 minutes before BP measurement With the student seated the
right arm rested on a table at the level of the heart an appropriate cuff size which covered
41
two-third (23rd) of the length of the arm was applied round the arm about 2cm above the
antecubital fossa Two cuff sizes were used for this study with dimensions of 10 x 24cm and
13 x 30cm the smaller cuff for the smaller adolescents and vice versa The bladder cuff was
inflated rapidly to 20-30mmHg above the point where the brachial artery was no longer
palpable The bell of the stethoscope was then placed over the brachial artery and the cuff
was deflated slowly at 2-5mmHgsecond while listening to the Korotkoff sounds Phases one
and five of the Korotkoff sounds were recorded as the systolic and diastolic BP
respectively119 Three recordings were taken at intervals of 3-5 minutes and the average was
the final BP in mmHg BP was interpreted based on the standard set by the fourth report on
the diagnosis evaluation and treatment of hypertension in children and adolescents of the
United States8 thus-
Normal BP ndash BP value between the 5th and lt 90th percentile for age sex and height
Prehypertension - BP value between the 90th and the lt95th percentile for age sex and height
or BP of 12080mmHg but less than the 95th percentile
Hypertension ndash BP value ge95th percentile for age sex and height
Students found to have prehypertension were educated and counseled on life style
modifications and the need to have their blood pressure checked in six monthsrsquo time and
annually subsequently Those with hypertension were educated on the implications of the
findings and were referred to the Federal Medical Center Jalingo for evaluation management
and follow-up
Height measurement
Height was measured in centimeters using a locally constructed stadiometer by the research
assistants Each student was measured barefooted standing with the heel back and occiput
42
against the stadiometre The head was held straight looking forward with the lower border of
the eye socket at a horizontal plane with that of the external auditory meatus The movable
part of the stadiometre was adjusted to rest on the vertex and the corresponding value read to
the nearest 01cm
Weight measurement
The weight was measured in kilograms by the researcher and the research assistants using a
bathroom scale (HANSON) Students were weighed in their approved school uniform
without caps head ties or cardigan and with their shoes removed The scale was checked
daily for accuracy using standard calibrated weight before and midway through each session
The weight of the student was measured to the nearest 01 kg
Body mass index (BMI)
This was calculated from the measured weight and height of the subject using the
formula118
BMI= Weight (kg) Height (m2)
Waist circumference measurement
WC was measured in centimeters using a measuring tape by the research assistants The
male assistant measured for boys and the lady Youth Corper measured for girls
Measurement was taken with the student standing completely relax and breathing
normally Clothing was pulled up or down and an inelastic measuring tape was placed
around the waist mid-way between the iliac crest and the lowest rib margin The ends of
the tape were pulled together lightly towards each other and the value read to the nearest
01cm117120
43
Data analysis
Data obtained were analyzed using Epi-Info statistical software package version 7 The
results obtained were presented in figures tables graphs and charts as appropriate Individual
mean BP levels were used as dependent variables and other measured variables as
independent variables The means and standard deviations were used to summarize
quantitative variables such as BP weight height waist circumference and BMI The chi-
squared test was used to test the significance of associations between categorical variables
Studentrsquos t-test was used to compare means of any two normally distributed continuous
variables Pearsonrsquos correlation coefficient and regression analysis were used to examine the
strength of association between BP and the anthropometries Probability level of statistical
significance value was set at lt005
RESULTS
General characteristics
A total of 1350 students were enrolled between January and June 2014 to determine their
blood pressure pattern 628 (465) were males and 722 (535) were females with
malefemale ratio of 111 Students enrolled in the study were drawn from both public and
44
private schools The number of students from public schools was 989 (733) while 361
(267) were from private schools as shown in Table II The mean age of the study subjects
was 153plusmn22 years with a range of 10-19 years The age and sex distribution of the students
is illustrated in Table III
Table III Age and sex distribution of 1350 study subjects in Jalingo
Ag
e
Male
n ()
Female
n ()
Total
N()
10 9(14) 13(18) 22 (16)
11 20(32) 31(43) 51(38)
12 36(57) 52(72) 88(65)
13 96(153) 85(118) 181(134)
14 92(146) 115(158) 207(153)
15 92(146) 111(154) 203(151)
16 66(105) 116(161) 182(135)
17 78(125) 91(126) 169(125)
18 79(126) 70(97) 149(110)
19 60(96) 38(53) 98(73)
To
tal
628(100) 722(100) 1350(100)
45
Socio-economic classes (SEC) ndash Most of the students were from the lower social classes
(4 and 5) with population of 650 (415 and 235) students The upper social classes (1 and
2) had the least population with 184 (62 and122) students The middle social class (3) had
516 students The distribution of the study subjects according to individual
socioeconomic class is shown in Figure I
Figure 1 Socioeconomic class distribution of students in Jalingo
Anthropometry
The anthropometric characteristics of the students are displayed in Tables IV V and VI
All the anthropometric parameters showed increasing values with age (Tables V and VI)
There were significant differences in the anthropometric indices of height (p=0000)
weight (p=0010) and body mass index (p=0000) between boys and girls but not
statistically significant for waist circumference (p=0145) as shown in Table IV
Weight ndash The mean weight of the students was 486plusmn109kg with a range of 23-100kg
(Table IV) Girls were heavier than boys up to middle adolescence after which males
46
were heavier than the females (Table V and VI) and this was statistically significant (t= -
256 p=0010)
Table IV Overall mean anthropometric measurements of the study subjects
Anthropometr
y
Male Female Total
n=628 n=722 N=1350 t p
Wt (kg)
Mean(plusmnSD) 4773(115
)
4926(103
)
4855(plusmn109
)
-
25
6
0007
Range 236-848 227-100 23-100
Ht (m)
Mean(plusmnSD) 159(012) 157(008) 158(plusmn010) 35
5
0000
Range 122-185 126-179 122-185
WC (cm)
Mean(plusmnSD) 6524(91) 6595(86) 6562(plusmn89) -
14
6
0145
Range 225-905 215-100 22-100
47
BMI (kgm2)
Mean(plusmnSD) 1825(27) 1947(33) 1891(plusmn31) -
74
1
0000
Range 117-325 114-42 114-42
Statistically significant p values at 005 level of significance Wt=Weight Ht=Height WC=Waist
Circumference BMI=Body Mass Index SD=Standard Deviation
Height- The mean height of the study population was 158plusmn09m and ranged from 122-
185m (Table IV) Girls were taller than boys at early and middle adolescence but these
reversed from 16 years in favour of the boys (Table V and VI) This differences was
statistically significant (t=448 p=0000)
Waist circumference (WC) - The overall mean waist circumference was 6562plusmn89cm and
a range of 225-100cm Girls had higher WC until late adolescence (18 years) when it
reversed but this was not statistically significant (t=-146 p=0145) This is displayed in
Tables IV V and VI
Body Mass Index (BMI) - Overall mean BMI was 189plusmn31 with a range of 114-42
There was a statistically significant difference between girls and boys (t=-741 p=0000)
Tables IV V and VI illustrate this findings
Table V Mean anthropometric measurements of 628 boys
Age No of
studen
ts
Wt(plusmnSD)
Kg
Ht(plusmnSD)
m
WC(plusmnSD)
cm
BMI(plusmnSD)
Kgm2)
48
10 9 349(50) 143(001
)
613(06) 169(01)
11 20 354(25) 143(002
)
617(13) 170(07)
12 36 363(51) 146(002
)
616(14) 167(06)
13 96 379(51) 150(003
)
602(40) 165(08)
14 92 412(50) 154(003
)
623(32) 169(08)
15 92 471(60) 160(003
)
634(39) 178(08)
16 66 525(52) 164(002
)
672(24) 192(09)
17 78 555(51) 167(002
)
680(31) 197(08)
18 79 576(61) 169(002
)
707(18) 200(08)
19 60 590(57) 170(002
)
716(16) 203(07)
Total 628 477(115 16(01) 652(91) 183(27)
49
)
Wt=Weight Ht=Height WC=Waist Circumference BMI=Body Mass Index SD=Standard Deviation
Table VI Mean anthropometric measurements of 722 girls
Age No of
students
Wt(plusmnSD)
Kg
Ht(plusmnSD)
m
WC(plusmnSD)
cm
BMI(plusmnSD)
Kgm2
10 13 313(34) 139(001) 582(05) 156(02)
11 31 361(53) 144(002) 611(12) 170(05)
12 52 403(64) 149(002) 625(21) 178(09)
13 85 458(66) 154(002) 657(22) 188(12)
14 115 478(74) 157(003) 627(48) 187(10)
15 111 508(65) 159(002) 666(34) 199(13)
16 116 521(60) 159(002) 678(28) 201(11)
17 91 541(62) 161(002) 681(28) 203(11)
18 70 556(63) 161(002) 696(21) 211(11)
19 38 540(48) 158(002) 688(14) 208(06)
Total 722 493(103) 16(010) 651(23) 190(09)
Wt=Weight Ht=Height WC=Waist circumference BMI=Body Mass Index SD=Standard Deviation
Blood pressure (BP) measurements
50
Table VII shows mean blood pressure distribution of the study population for all ages
The highest SBP and DBP were 165mmHg and 95mmHg at 18years and 15 years
respectively Table VIII displays mean BP distribution in relation to age and sex The
tables show that both systolic and diastolic blood pressure increased with age This is also
depicted in Figure 2
Table VII Mean and ranges of blood pressure of 1350 subjects
Systolic Blood Pressure
(mmHg)
Diastolic Blood Pressure
(mmHg)
Age
No of
students
Mean(plusmnSD) Range
Mean(plusmnSD) Range
10 22 936(74) 80-107 600(50) 47-70
11 51 992(106) 76-120 629(71) 47-83
12 88 1036(110) 80-140 657(60) 53-82
13 181 1042(108) 80-143 660(74) 48-88
14 207 1070(115) 83-150 675(76) 47-90
15 203 1090(119) 80-150 678(82) 47-95
16 182 1122(124) 80-150 696(80) 50-90
51
17 169 1132(118) 90-153 698(83) 48-93
18 149 1138(121) 90-165 712(88) 50-90
19 98 1131(127) 90-143 726(76) 57-90
Total 1350 1089(125) 76-165 683(82) 47-95
Table VIII Mean blood pressure in relation to age and sex
Mean(plusmnSD) Systolic blood pressure
(mmHg)
Mean(plusmnSD) Diastolic blood
pressure (mmHg)
A
ge
Male
n=628
Female
n=722
t p Male
n=62
8
Fema
le
n=72
2
t p
52
10 954(3
9)
923(6
0)
1
02
03
20
619(
32)
586(
46)
1
36
0
01
91
11 985(5
5)
997(9
2)
0
42
0
06
80
648(
39)
617(
57)
1
56
0
01
26
12 999(8
9)
1062(
117)
2
84
0
00
06
653(
29)
660(
52)
-
0
52
0
06
07
13 1012(
73)
1075(
73)
4
03
4
00
00
649(
43)
672(
59)
-
0
03
0
00
44
14 1036(
78)
1098(
78)
3
93
0
00
01
653(
44)
693(
58)
3
90
0
00
01
15 1071(
80)
1105(
87)
2
05
0
00
42
665(
58)
689(
56)
-
2
10
0
00
37
16 1135(
82)
1114(
91)
1
03
0
03
10
697(
51)
695(
61)
0
15
0
08
81
53
17 1152(
87)
1115(
77)
2
04
00
43
698(
59)
698(
58)
0
02
0
09
81
18 1141(
96)
1135(
74)
0
27
0
07
91
704(
62)
721(
63)
1
61
0
02
49
19 1146(
97)
1108(
80)
1
41
0
01
64
733(
63)
714(
43)
1
21
0
02
28
To
tal
1081(
133)
1095(
117)
-
2
05
4
00
40
678(
81)
687(
82)
-
2
07
7
00
38
Statistically significant p values at 005 levels of significance
54
Figure 2 Blood pressure distribution in relation to age and sex
SBP =Systolic blood pressure DBP=Diastolic blood pressure
Blood pressure and stages of adolescence
Table IX displays mean blood pressure according to stages of adolescence Girls had a
higher mean SBP than boys from early adolescence (t=3754 p=0000) to middle
adolescence (t=-3025 p=0003) and this was statistically significant This dominance was
also demonstrated in the DBP and was statistically significant in middle adolescence (t=-
3517 plt0000) Adolescents from private schools had higher mean SBP (t=-222
plt0027) and mean DBP (t=-461 p=0000) than those from public schools and these
differences were statistically significant
Table IX Mean blood pressure according to sex and stages of adolescence
Mean BP
(mmHg)
Age (years)
Male SBP
Female SBP
Male DBP
Female DBP
55
Stages
of
adolesc
ents
(years)
Mean(plusmnSD) systolic blood pressure
(mmHg)
Mean(plusmnSD) diastolic blood pressure
(mmHg)
Male Female t p Male Fema
le
t p
Early
(10-13)
1000(9
6)
1040(1
18)
37
54
00
00
648(
56)
653(
82)
05
99
05
50
Middle
(14-16)
1075(1
29)
1105(1
13)
-
30
25
00
03
670(
81)
694(
77)
-
35
17
00
00
Late
(17-19)
1140(1
28)
1121(1
11)
21
45
00
33
717(
85)
710(
83)
00
70
09
45
1082(1
33)
1092(1
17)
-
20
54
00
40
678(
81)
687(
82)
-
20
77
00
38
Statistically significant p values at 005 level of significance SD=Standard Deviation
Table X shows blood pressure pattern according to stages of adolescence
Prehypertension and hypertension were more prevalent in late adolescence than early and
middle adolescence (χ2=49054 p=0000) and (χ2=10305 p=0006) both of which were
statistically significant
Table X The pattern of normal BP Prehypertension and hypertension according to stages
of adolescence
56
Blood
pressure
pattern
Stages of adolescence
Early
n()
Middle
n()
Late
n()
Total
N()
χ2 p
Normal 290(84
8)
428(72
3)
275(66
1)
993(73
5)
429
79
000
0
prehypertens
ion
43(12
6)
135(22
8)
120(28
8)
298(22
1)
490
54
000
0
Hypertensio
n
9(26) 29(49) 21(51) 59(44) 103
05
000
6
342(10
0)
592(10
0)
416(10
0)
1350(1
00)
350
93
000
0
Statistically significant p value at 005 level of significance
Relationship between blood pressure and the measured anthropometry
There was a positive correlation between SBP and DBP with age and the anthropometric
variables of weight height waist circumference and BMI (Table XI) SBP showed a
stronger correlation with the anthropometries than the DBP and was stronger for weight
(r=051) and height (r=044) The waist circumference though statistically significant
showed the weakest correlation
Table XI Correlation between blood pressure age (yrs) and anthropometry
Parameters
Systolic Blood Pressure Diastolic Blood Pressure
Correlation
coefficient
p Correlation
coefficient
p
57
Age (yrs) 035 lt0000 030 lt0000
Height (m) 044 lt0000 034 lt0000
Weight (Kg) 051 lt0000 038 lt0000
WC (cm) 040 lt0000 029 lt0000
BMI
(Kgm2)
031 lt0000 023 lt0000
Statistically significant p values at 005 level of significance Wt=Weight Ht=Height WC=Waist
circumference BMI=Body Mass Index
Blood pressure distribution and socio-economic classes
Table XII shows mean blood pressure according to socio-economic class of the subjects
Lower social classes had higher mean SBP (t=1650 p=2850) and DBP (t=0193
p=00058) but these were not statistically significant
Table XII Mean Blood pressure in relation to socioeconomic classes
Blood
pressur
e
Socioeconomic classes
Upper (1 amp
2) n=184
Middle (3)
n=516
Lower (4 amp
5)
n=650
f(anova
)
p
Mean
(SD)
10857(126
)
10866(128
)
11040(109
)
1650 285
0
58
SBP
Mean
(DBP)
6820(83) 6791(83) 6957(76) 0193 005
8
SEC= Socioeconomic class SBP=Systolic Blood Pressure DBP=Diastolic Blood Pressure SD=Standard
Deviation
Table XIII shows blood pressure pattern in relation to socioeconomic classes of the
subjects The percentage of students with prehypertension was higher in the upper social
class ((χ2=3067 p=0216) while the percentage of hypertension were higher in the lower
socioeconomic classes (χ2=1037 p=0568) but these differences were not statistically
significant
Table XIII Blood pressure pattern in relation to socioeconomic status
Blood
pressure
pattern
Socioeconomic classes
Upper
(1 amp 2)
n()
Middle
(3)
n()
Lower
(4 amp 5)
n()
Total
N()
χ2 p
Normal 127(69
)
383(74
2)
483(74
3)
993(73
6)
417
6
012
4
Prehypertens
ion
52(28
3)
108(20
9)
138(21
2)
298(22
1)
306
7
021
6
Hypertension 5(27) 25(48) 29(45) 59(44) 103 056
59
7 8
184(10
0)
516(10
0)
650(10
0)
1350(10
0)
573
0
022
0
Prevalence of Hypertension and Prehypertension
Table XIV shows the prevalence of hypertension in the study population The total
number of students with hypertension was 59 giving an overall prevalence of 44
Thirty four students (25) had systolic hypertension sixteen (12) had diastolic
hypertension and nine students (07) had both systolic and diastolic hypertension
Systolic hypertension was more prevalent in the females and was more at the age of 16
years while diastolic hypertension was higher in males and this also occurred at 16 years
Among those with hypertension 27 and 16 subjects had stage 1 and 2 systolic
hypertension respectively With regard to diastolic hypertension 24 and 1 subjects had
stage 1 and 2 hypertension respectively The gender difference in the prevalence of
hypertension is not statistically significant (χ2=0831 p=0362)
The number of students with pre-hypertension was 298 giving an overall prevalence of
221 Of this 131 were males and 167 are females This is illustrated in Table XIV
Prehypertension is more prevalent in females than males and this was statistically
significant (χ2=4349 p=0037)
60
Table XIV Overall Blood pressure pattern and prevalence of hypertension and
prehypertension of 1350 students in Jalingo
Blood pressure
pattern
Males
n=()
Females
n=()
Total
N()
χ2 p
Normal 471(750) 522(723) 993(735) 2619 0106
Prehypertension 131(209) 167(231) 298(221) 4349 0037
Hypertension 26(41) 33(46) 59(44) 0831 0362
628(100) 722(100) 1350(100) 1260 0533
statistically significant p value at 005 level of significance
61
DISCUSSION
The findings of this study showed that the BP of secondary school adolescents in Jalingo
was similar in terms of mean values range and trend of progression with age to that of
other adolescents from Ibadan63 and Kogi60 (Nigeria) Ashanti (Ghana)59 and Lebanon54
The mean value was however lower than the mean BP of adolescents from Zaria
(Nigeria)21 Belgrade ( Serbia)78 and Fortaleza-Cearaacute (Brazil)83 who had higher mean BP
in both sexes and at all ages The lower mean BP in this study compared to that of
adolescents from Zaria21 Belgrade78 and Brazil83 could be due to lower mean
anthropometry of weight height and BMI in adolescents from Jalingo resulting in lower
mean BP The sample sizes of these studies7883 were also different and could have
affected the mean BP of the study population For instance the sample size in the
Brazilian study83 is 151 compared to the study in Lebanon54 with 5710 subjects The use
of the fifth Korotkoff sounds as DBP in this study21 could also have accounted for the
lower mean BP in contrast to a similar study in Zaria21 where the fourth Korotkoff sound
was used as the DBP
A progressive increase in blood pressure with age was found in this study This
was similar to most findings by researchers in Nigeria 215358-606566107 and
worldwide54555961 The peak age of rise in BP in this study was in middle adolescence
between 15-16 years in boys but much earlier in girls for both systolic and diastolic BP
This was similar to the study by Akinkugbe Akinwolere and Kayode56 in Ibadan and
Ejeke Ugwu and Ezeanyika et al60 in Lokoja This age group is usually the period of
onset of puberty The chronologic age is not the main factor responsible for BP increase
62
with age but rather the progressive increase in size of the individual Increase in body
size with growth and maturity of organs associated with the physical and hormonal
changes during puberty potentially lead to increasing BP The simultaneous increase in
weight height and other anthropometric indices alongside BP with age seen in this study
and others is in agreement with that The implication of this increase in blood pressure
with age is that those with prehypertensionhypertension in childhood may continue into
adulthood hence further increasing the high prevalence of hypertension in the adult
population with its attendant morbidity disability and mortality
Overall significant higher mean BP was recorded in girls than boys in this study
This was seen from early to middle adolescence after which it reversed in favour of the
boys Reports on the relationship between BP and sex have been inconsistent Some have
reported higher mean BP in females54-56 others higher in males5883 while yet another
reported no sex differences22 The findings of this study were similar to those of Bugaje
Yakubu and Ogala21 and Ujunwa Ikefuna and Nwokocha100 who reported a consistently
higher mean blood pressure in female adolescents up to 16 years compared to their male
counterparts of similar ages Early female predominance in mean blood pressure was also
reports by Agyemang Redekop and Owusu-Dabo et al59 in Ashanti adolescents in Ghana
and Obika Adedoyin and Olowoyeye22 in Illorin The finding was however in contrast
with the study in Calabar58 where higher mean BP was found in boys than girls at all
ages The reason for the higher mean BP in females than boys could be because of earlier
onset of puberty in girls The differences in blood pressure between boys and girls in this
study could also be accounted for by variation in the anthropometric variables of the
individuals as girls were seen to be heavier and taller up to middle adolescence
This study demonstrated a consistently positive relationship between blood
pressure and the anthropometric variables of weight height body mass index and waist
63
circumference as widely reported in other studies 545558-6165107100 Weight is reported to
correlate positively with blood pressure in several studies53565871 Body mass index
(BMI) also showed a positive relation with BP in this study as reported in other
studies5978-81 This is in-keeping with the findings in Port Hacourt71 Abeokuta83 the
Gambia69 Brazil82 and Belgrade77 children Some of these studies however were made
up of younger and older age groups Even in lean populations BMI is known to correlate
positively with BP Waist circumference was also found in this study to correlate
positively with BP This was similar to reports from other studies79-8183 It was found to
be a better predictor of BP in two Italian study8081 while it was not in another82
Comparing BMI and waist circumference and their effects on BP Arauzo Lopes and
Moriera et al82 in Brazilian children found BMI to be a better predictor of BP than waist
circumference This was similar to the report by Sebanjo and Oshikoya83 in Nigerian
adolescents in Akure Guagnano Ballone and Colagrande et al81 however found waist
circumference to be better than BMI The study81 however involved adults and may not
be applicable in children and adolescents The present study demonstrated BMI and WC
to be significant but found BMI to be a better determinant of BP than waist
circumference BMI and waist circumference measure obesity in an individual Whereas
BMI is a measure of overall obesity WC measures centralabdominal fat accumulation
and thus said to be more predictive of adverse health risk79 Obese individuals may be
prone to such condition as dyslipidaemia insulin resistance and hypertension with
reduction in the quality of life Weight BMI and or waist circumference affects blood
pressure through decreased physical activity increased cardiac output insulin resistance
impaired pulmonary function and other hormonal abnormalities8084 It seems therefore
that BMI is a better predictor of BP in adolescents than waist circumference The reason
64
for this is not obvious but it may be because of the nature of uniform fat distribution in
adolescents associated with growth and hormonal changes at puberty
Blood pressure distribution in relation to the parental socio-economic class in this
study showed that students from low socio-economic classes had higher mean blood
pressure than those from upper socioeconomic classes but this was not statistically
significant A study in Ibadanl56 reported a statistically significant negative relation
between blood pressure and parental socio-economic status It was also similar to the
study58 in Calabar In contrast other studies found the reverse536022 The reasons for the
inverse relationship between BP and socioeconomic includes exposure to chronic
environmental stress with sustained sympathetic nervous system stimulation Others are
poor health seeking behaviours due to low income andor inadequate health knowledge
high low birth weight rate and inadequate healthy diets among others97101 In the same
environment individuals from a high social class are believed to be more educated with
high income61 They have easy access to health education and awareness on hypertension
prevention and control and better accessibility and adherence to medical treatment617374
The former might be responsible for the finding of this study as Jalingo is a semi urban
community Most of its inhabitants are subsistent farmers civil servants and traders with
low income The high number of students in the lower socioeconomic class lays credence
to that
The overall point prevalence of hypertension in this study was 44 while that of
pre-hypertension was 221 This prevalence of hypertension is similar to the prevalence
of 48 by Antia-Obong and Antia-Obong107 but higher than the prevalence rate of 37
reported in Zaria21 and lower than the prevalence of 58 reported in Ibadan56 54 in
Enugu100 and the 72 reported in Kano65 The prevalence of pre-hypertension was lower
than that reported by Ejeke Ugwu and Ezeanyika99 who found a prehypertensive
65
prevalence of 25 among adolescents in Lokoja It is higher than the 173 reported by
Ujunwa Ikefuna and Nwokocha et al100 in Enugu and 12-17 by Redwine and
Daniels96 among US adolescents The differences in the reported prevalence of
hypertension and prehypertension in adolescents could have resulted from the different
criteria applied by the various researchers in defining hypertension For instance whereas
this study used BP greater than 95th percentile as hypertension a study in Kano65 used the
adult hypertensive value of BPgt14090mmHg as hypertension and got a prevalence of
72 The prevalence in that study65 could have been higher if the percentile or the
statistical definition was used as many children with BP 14090mmHg would probably be
at stage 2 hypertension This was demonstrated in the study by Bugaje Yakubu and
Ogala21 who found a prevalence of hypertension in their study to be 06 when the adult
cut off value of gt14090mmHg was used but it increased to 37 when the statistical
definition of BPgt 2 standard deviations was used
The number of times blood pressure is taken could affect the outcome as repeated
measurements over a time interval is known to give lower BP values than if BP is taken
once This study used the average of three blood pressure values taken at one sitting but
Ujunwa Ekefuna and Nwokocha100 took three readings at five minutes interval with two
other readings at a week interval In that study100 the prevalence of prehypertension
dropped from 745 during the first set of readings to 173 after the third week
readings The prevalence of hypertension also dropped from 135 to 54 over the same
period Similar decrease in the prevalence of both prehypertension and hypertension was
reported by Redwine and Daniels96 in US adolescents when blood pressure was taken
over time interval Another factor which might have affected the overall prevalence is the
Korotkoff sound used for diastolic pressure23 The 4th or 5th Korotkoff sounds has been
used by different researchers resulting in different diastolic BP The study21 in Zaria used
66
the 4th Korotkoff sound while most other researchers2265100 used the 5th About 5-
10mmHg difference is said to exist between the 4th and 5th Korotkoff sounds230 In this
study the 5th Korotkoff sound was used thus giving a higher prevalence of hypertension
in the studied population than in those where the 4th sound was used
The implication of the outcome of this study is that 44 of adolescents in Jalingo
are already hypertensive while 221 of them are at risk of developing hypertension as
they are pre-hypertensive Since 856 (255 of 298) of the prehypertensives were in the
middle and late adolescence these individuals are likely to be adults with high blood
pressure Therefore regular screening of this group of individuals who were assumed to
be a healthy population is highly important for early detection of hypertension and
intervention such as life style changes and treatment
67
CONCLUSIONS
The following conclusions can be made from this study
1 The mean and range of blood pressure of adolescents in Jalingo was similar to
those of other adolescents in Nigeria and other parts of the world Blood pressure
increased progressively with age
2 All measured anthropometry of weight height body mass index and waist
circumference correlated positively with BP but weight was the most significant
variable in BP determination
3 Socioeconomic status was not significantly related with blood pressure
4 The point prevalence of hypertension and pre-hypertension was 44 and 221
respectively using a recommended definition
RECOMMENDATIONS
1 In view of the high prevalence of prehypertension in this study it is recommended
that students should have their blood pressure measured at school entry as this will
68
help identify those with abnormal BP for early intervention Thereafter BP check
should be offered at least once a year at the beginning of a new session especially for
those found with abnormal BP at school entry
2 Physical and health education should be revived in all the schools This will lead to
increased physical activity and reduced risk of obesity and its consequences
3 School health programmes should be strengthened in schools where it already exist
and effort made to establish same in schools where it is yet to exist The programme
should include measures to detect early prehypertension and hypertension and other
health related needs of the students
LIMITATIONS
The following limitations were encountered in the course of the study
1 Exclusion and inclusion of students that were based on volunteered information and
physical evaluation This could have led to inclusion andor exclusion of adolescentss
69
with or without background renal diseases which could have affected the result of this
study
2 Home blood pressure measurement especially early morning measurement for those
with high blood pressure to possibly eliminate the effect of stress traffic andor
trekking and other school related stresses which may affect blood pressure during the
day
LINES OF FUTURE RESEARCH
This study was questionnaire based and time bound Consequently students were not
investigated for background diseases co-mordid conditions target organ damage or risk
factors for high blood pressure They were also not followed up In view of this future
research on blood pressure in adolescents should include-
70
1 Investigations such as urinalysis electrolytes urea and creatinine random blood
sugar (RBS) lipid profile and echocardiography as part of blood pressure evaluation
in adolescents
2 A long period of study to allow for follow-up over months or years to identify those
that are truly hypertensive considering the definition of hypertension It will also
reveal the rate of progression from pre-hypertension to hypertension
3 Risk factors evaluation for high blood pressure including genetic predispositions
REFERENCES
1 Blood pressure from Wikipedia the free Error Hyperlink reference not valid
Accessed 24th November 2011
2 Pickering TG Hall JE Appel LJ Falkner BE Graves J Hill MN Jones DW Kurtz T
Sheps SG Roccella EJ Recommendations for blood pressure measurement in humans
and experimental animals Part 1 Blood pressure measurement in humans A
statement for professionals from the subcommittee of professional and public
71
education of the American Heart Association council on high blood pressure research
Hypertension 2005 45 142-61
3 da Silva IRR de Souza MDG de Camargo CAC Blood pressure measurement in
children and adolescents Guidelines of high blood pressure recommendations and
current clinical practice Arq Bras Cardiol 2007 88 434-7
4 Sinaiko AR Hypertension in children N Engl J Med 1996 3351968-73
5 US Preventive Services Task Force Screening for high blood pressure
recommendations and rationale Am J Prev Med 2003 25 159-64
6 Report of the second task force on blood pressure control in children Pediatrics 1987
79 1-25
7 National high blood pressure education programme working group on hypertension
control in children and adolescents update on the 1987 task force report on high blood
pressure in children and adolescents A working group report from the national high
blood pressure education program Pediatrics 1996 98 649-58
8 National high blood pressure education program working group on high blood
pressure in children and adolescents The fourth report on the diagnosis evaluation
and treatment of high blood pressure in children and adolescents Pediatrics 2004
114 255-76
9 Aderele WI Seriki O Hypertension in Nigerian children Arch Dis Child 1974
49313-7
10 Bo S Gambino R Gentile L Pagano G Rosato R Saracco GM Cassader M
Durazzo M Cavallo-Perin P High-normal blood pressure is associated with a cluster
of cardiovascular and metabolic risk factors a population based study J Hypertens
2009 27 102-8
72
11 Bao W Threefoot SA Srinivasan SR Berenson GS Essential hypertension
predicted by tracking of elevated blood pressure from childhood to adulthood The
Bogalusa Heart Study Am J Hypertens 1995 8 657- 65
12 Richard A Rodgers M Hedley AJ Mitchel JRA Changes in blood pressure and
blood lipid during adolescence BMJ 1980 28 1563-6
13 Sundstroumlm J Neovius M Tynelius P Rasmussen F Association of blood pressure in
late adolescence with subsequent mortality cohort study of Swedish male conscripts
BMJ 2011 342 643-8
14 Zimmet P Alberti G Kaufman F Tajima N Silink M Arslanian S Wong S Bennett
P Shaw J Caprio S On behalf of the International Diabetes Federation Task Force on
Epidemiology and Prevention of Diabetes The metabolic syndrome in children and
adolescents the IDF consensus Diabetic Voice 20075229-32
15 Abdulrahman FA Babaoye AA Childhood hypertension in northern Nigeria West
Afr J Med 1978 1 7-11
16 Adediran O Jimoh A Di M Relationship between body mass index and blood
pressure in rural Nigerian dwellers Internet J Nutri Wellness 2009 7 431-4
17 World Health Organization (WHO)UNICEF Adolescence at a glance 2003 p 2
18 The National Population Commission constitution of the Federal Republic of Nigeria
(AP 23 LFN) legal notice on publication issued April 21st 2007
19 Heald FP and Gong EJ Diet Nutrition and adolescents In Shils ME and Ross AC
(eds) Modern Nutrition in Health and Disease 9th ed William and Wilkins
Maryland USA 1999 p 32
20 Okonkon CT The prevalence of Hypertension among civil servants in Calabar Nig
Med J 1979 7422-5
21 Bugaje MA Yakubu AM Ogala WN Prevalence of adolescent hypertension in Zaria
Nig J Paediatr 2005 32 77-82
73
22 Obika LF Adedoyin MA Olowoyeye JO Pattern of paediatric blood pressure in
rural semi urban and urban communities in Ilorin Nigeria Afri J Med Sci 1995 24
371-7
23 Jeremy B A short history of blood pressure measurement section of the history of
medicine Proc Roy Soc Med 1977 70 793-9
24 Lewis O Stephen Hales and the measurement of blood pressure J Hum Hypertens
1994 8 865-71
25 Crile GW Blood Pressure in Surgery An experimental and Clinical Research
Philadelphia Lippincott 1903 p 358
26 Lewis WH The evolution of clinical sphygmomanometer Bull N Y Acad Med 1941
17 871-81
27 Browne WC OrsquoBrien ET Semple PF The sphygmomanometer of Riva Roci 1896-
1996 J Hum Hypertens 1994 610 723-4
28 Segal HN How Korotkoff the Surgeon discovered the auscultatory method of
measuring arterial pressure Ann Intern Med1975 83 561-2
29 Goodman FH and Howell AA Clinical studies in the auscultatory method of
determining blood pressure University of Pennsylvania Bulletin 1911 23 469-75
30 Crenner CW Introduction of the blood pressure cuff into US medical practice
technology and skilled practice Ann Intern Med 1998 128 488-493
31 Ganon WF Circulation In Review of Medical Physiol Lange Medical Publication
New York 22nd edition 2005 p 234-63
32 Beth C Homeostatic Regulation of Blood pressure Available from
URLhttpwwweHowcom Accessed on 1st December 2011
33 Rajinder KG Fahim M Regulation of cardiovascular functions during acute blood
loss Indian J Physiol Pharmacol 2005 49 213ndash9
74
34 Dampney AL Coleman MJ Fonts MAP Hirooka Y Horiuchi J Polson JW Potts
PD Tagawa T Central mechanisms underlying short-term and long-term regulation
of the cardiovascular system Proc Austr Physio Pharmacosociety 2001 32 333-44
35 Koshiya N Guyenet PG Noradrenergic neurons and the carotid sympathetic
chemoreflex Am J Physiol 1994 267 519-26
36 Prakash ES The ultimate goal in neural regulation of cardiovascular function Adv
Phyiol Educ 2008 32 107-8
37 Allen AM Inhibition of the hypothalamic paraventricular nucleus reduces
sympathetic nerve discharge and blood pressure Proc Austr Neuroscience Society
2001 29 44-7
38 Reid IA Interactions between ANG II sympathetic nervous system and
baroreceptor reflexes in regulation of blood pressure Am J Physiol 1992 262 763-
78
39 Brooks VL Osborn JW Hormonal-sympathetic interactions in long-term
regulation of arterial pressure A hypothesis Am J Physiol 1995 268 1343-58
40 Reckelhoff JF Gender Differences in the Regulation of Blood Pressure
Hypertension 2001 37 1199-208
41 Fink GD The systemic circulation as a regulated free-market economy A new
approach for understanding the long-term control of blood pressure Clin Exp
Pharmacol Physiol 2005 32 377ndash83
42 Benard K Sources of error in blood pressure measurement Hospital Physician 2002
12 33-7 Available from URLhttp wwwturnerwhitecom
43 Chyun DA A comparism of intra arterial and auscultatory blood pressure readings
Heart lung 1985 14 223-31
75
44 Nwankwo MU Lorenz JM Gardiner JC A Standard Protocol for Blood Pressure
Measurement in the Newborn Pediatrics 1997 99 1342-9
45 Deakin CD Low JL Accuracy of the advanced trauma life support guidelines for
predicting systolic blood pressure using carotid femoral and radial pulses
observational study BMJ 2000 321 673ndash4
46 OrsquoBrian E Replacing mercury sphygmomanometers require clinician to demand
better automated device BMJ 2000 320 815-6
47 McKay DW Raju MK Campbell NR Assessment of blood pressure measuring
techniques Med Educ 1992 26 208ndash12
48 Baker RH Ende J Confounders of auscultatory blood pressure measurement J Gen
Intern Med 1995 10 223ndash31
49 Neufeld PD Johnson DL Observer error in blood pressure measurement CMAJ
1986 135 633ndash7
50 van Montfrans GA Oscillometric blood pressure measurement progress and
problems Blood Press Monit 2001 6 287ndash90
51 Ware RW Laenger CJ Indirect blood pressure measurement by Doppler ultrasonic
kinetoartriography Proceedings 20th Annual Conference Engineering Medical
Biology 1967 9 27-30
52 Matthew Fox Blood pressure measurement technique Available from URL http
wwwlivestrongcom Last edited 2nd September 2010 Accessed on 30th November
2011
53 Akor F Okolo SN Okolo AA Blood pressure and anthropometric measurements in
healthy Primary School entrants in Jos Nigeria SAJCH 2010 4 42-5
54 Merhi BM Al-Hajj F Al-Tannir M Zaide F El-Rajab M A survey of blood pressure
in Lebanese children and adolescents North Am J Med Sci 2011 3 24-9
76
55 Al-Salloum AA El-Mouzan AH Al-Herbish AS Al-Umar AA Qurashi MM Blood
pressure standard for Saudi children and adolescents Ann Saudi Med 2009 29 173-8
56 Akinkugbe FM Akinwolere AO Kayode CM Blood Pressure Pattern in
Adolescence West Afri J Med 1999 18 196-202
57 Wanzhu T Eckert GJ Saha C and Pratt JH Synchronization of Adolescent Blood
Pressure and Pubertal Somatic Growth J Clin Endo Metab 2009 94
58 Ansa VO Anah MU Odey FA Mbu PN Agbor EI Relationship between parental
socioeconomic status and casual blood pressure in coastal Nigeria Adolescents West
Afri J Med 2010 29146-52
59 Agyemang C Redekop WK Owusu-Dabo E Bruijnzeels MA Blood pressure
patterns in rural semi-urban and urban children in the Ashanti region of Ghana West
Africa BMC Public Health 2005 5114-21
60 Ejeke CCE Ugwu CE Ezeanyika LUS Olayemi AT Blood pressure patterns in
relation to geographic area of residence a cross-sectional study of adolescents in Kogi
state Nigeria BMC Public Health 2008 8 411-5
61 Colhoun HM Hemminway H Poulter WR Socioeconomic status and blood
pressure an overview analysis J Human Hypertension 1998 12 91-110
62 Badaruddoza KR Familial aggregation and heritability for cardiovascular risk factors
a family based study in Punjab India Natural Science 2010 2 732-6
63 Livshits G Gerber LM Familial factors of blood pressure and adiposity co-variation
Hypertension 2001 37 928-35
64 Fermino RC Seabra A Garganta R Antoacutenio J Maia R Genetic factors in familial
aggregation of blood pressure of Portuguese nuclear families Arq Bras Cardiol 2009
92 463-9
77
65 Mijinyawa MS Iliyasu Z Borodo MM Prevalence of hypertension among teenage
students in Kano Nigeria Nig J Med 2008 17 173-7
66 The Wellcome Trust case control consortium Genome-wide association study of
14000 cases of seven common diseases and 3000 shared controls Nature 2007 447
661-78
67 Levy D Destefano AL Larson MG ODonnell CJ Lifton RP Gavras H Evidence for
a gene influencing blood pressure on chromosome 17 genome scan linkage results for
longitudinal blood pressure phenotypes in subjects from the Framingham heart study
Hypertension 2000 36 477- 83
68 Lifton RP Wilson FH Choate KA Geller DS Salt and blood pressure new insight
from human genetic studies Cold Spring Harb Symp Quant Biol 2002 67 445ndash50
69 van der Sande MA Milligan PJ Nyan OA Rowley JT Banya WA Ceesay SM
Dolmans WM Blood pressure patterns and cardiovascular risk factors in rural and
urban Gambian communities J Hum Hypertens 2000 14 489-96
70 Akinkugbe OO Ojo OA Arterial blood pressure in rural and urban population of
Nigeria BMJ 1969 2 22-4
71 Okagua J Anochie IC Akani NA Adolescent blood pressure in Rivers State Nigeria
A rural-urban comparism NJP 20154221-7
72 Urrutia-Rojas X Egbuchunam CU Bae S Menchaca J Bayona M Rivers PA Singh
KP High blood pressure in school children Prevalence and risk factors BMC
Pediatrics 2006 6 32-9
73 Sorof JM Lai D Turner J Poffenbarger T Potman R Overweight ethnicity and the
prevalence of hypertension in school-aged children Pediatrics 2004 113 475-82
78
74 Rosner B Prineas R Daniels SR Blood pressure differences between blacks and
whites in relation to body size among US children and adolescents Am J Epidemiol
2000 151 1007-18
75 Harding S Whitrow M Lenguerrand E Maynard M Teyhan A Cruickshank JK Der
G Ethnic differences in blood pressure in adolescence the determinants of adolescent
social well-being and health study Hypertension 2010 55 1063-9
76 Cruickshank JK Mzayek F Liu L Kieltyka L Sherwin R Webber LS Srinavasan SR
Berenson GS Origins of the ldquoblackwhiterdquo difference in blood pressure roles of birth
77 Vlajinac H Miljus D Adanja B Marinkoic J ipetic S Kocev N Blood pressure levels
in 7 to 14-year-old Belgrade children J Human Hypertension 2003 17 761ndash5
78 Menezes AMB Hallal PC Dumith SC Adolescent blood pressure body mass index
and skin folds sorting out the effects of early weight and length gains J Epid Comm
Health 2011 12 42-8
79 Karelis AD St-Pierre DH Conus F Rabasa-Lhoret R Poehlman EJ Metabolic and
body composition factors in subgroups of obesity what do we know J Clin Endo
Metab 2004 89 2569-75
80 Katzmarzyk PT Srinivasan ER Chen W Malina RM Bouchard C Berenson GS
Body mass index waist circumference and clustering of cardiovascular disease risk
factors in a biracial sample of children and adolescents Pediatrics 2004 114 198-205
81 Guagnano MT Ballone E Colagrande V Della Vecchia R Manigrasso MR Merlitti
D Riccioni G Sensi S Large waist circumference and risk of hypertension Int J
Obesity 2001 25 1360 ndash 4
82 Araujo TA Lopes MVO Moriera RP Cavalcante TF Gurdes NG MartinS dA Silva
V Blood pressure of children and teenagers from a public school in Fortaleza - Cearaacute
Acta paul enferm 200720103-15
79
83 Sebanjo IO Oshikoya KA Obesity and blood pressure levels of adolescents in
Abeokuta Nigeria Cardiovasc J Afr 2011 221-5
84 Messerli FN Obesity and essential hypertension Haemodynamics sodium excretion
and plasma rennin activity Arch Int Med 1981 141 81-5
85 Appel LJ Brands MW Daniels SR Karanja N Elmer PJ Sacks FM Dietary
Approaches to Prevent and Treat Hypertension A Scientific Statement from the
American Heart Association Hypertension 2006 47 296-308
86 Sacks FM Svetkey LP Vollmer WM Appel LJ Bray GA Harsha D Obarzanek E
Conlin PR Miller ER 3rd Simons-Morton DG Karanja N Lin PH for the DASH-
Sodium Collaborative Research Group Effects on blood pressure of reduced dietary
sodium and the Dietary Approaches to Stop Hypertension (DASH) diet DASH-
Sodium Collaborative Research Group N Engl J Med 2001 344 3ndash10
87 Appel LJ Moore TJ Obarzanek E Vollmer WM Svetkey LP Sacks FM Bray GA
Vogt TM Cutler JA Windhauser MM Lin PH Karanja N A clinical trial of the
effects of dietary patterns on blood pressure DASH Collaborative Research Group N
Engl J Med 1997 3361117ndash24
88 Appel LJ Sacks FM Carey VJ Obarzanek E Swain JF Miller ER 3rd Conlin PR
Erlinger TP Rosner BA Laranjo NM Charleston J McCarron P Bishop LM for the
OmniHeart Collaborative Research Group Effects of protein monounsaturated fat and
carbohydrate intake on blood pressure and serum lipids results of the OmniHeart
randomized trial JAMA 2005 294 2455ndash64
89 Karanja NM Obarzanek E Lin PH McCullough ML Phillips KM Swain JF
Champagne CM Hoben KP Descriptive characteristics of the dietary patterns used in
the Dietary Approaches to Stop Hypertension Trial DASH Collaborative Research
Group J Am Diet Assoc 1999 99 19ndash27
80
90 Nwokocha ARC Adolescence and associated problems In Azubuike JC and
Nkanginieme KEO (eds) Paediatrics and Child Health in a Tropical Region African
Educational Services Owerri Nigeria 2nd edition 2007 p 84-99
91 Rogol RT Roemmich JN Clark PA Growth and puberty J Adol Hlth 2002 31 192-
200
92 Tanner JM Marshal WA Variation in the pattern of puberty changes in boys and girls
Arch Dis Child 1970 45 13-23
93 Nwakoro SO Ifoda K Onochie O Olomu JM Anthropometric assessment of
nutritional status and growth of 10-20 years individuals in Benin City metropolis
Nigeria Pakistan J Nutr 2006 5 117-21
94 Shankar RR Eckert GJ Saha C Tu W Pratt JH The change in blood pressure during
pubertal growth J Clin Endo Metab 2005 90 163-7
95 Department of Health and Human Services 2000 CDC Growth Charts for the United
States methods and development Series Report 11 No 246 Available from URL
httpwwwcdcgovGrowthCharts
96 Redwine KM Daniels SR Prehypertension in Adolescents Risk and Progression
Journ Clin Hypertension 2012 14 360ndash4
97 Falkner B Gidding SS Portman R Rosner B Blood pressure variability and
classification of prehypertension and hypertension in adolescence Pediatrics 2008
122238ndash42
98 Redwine KM Acosta AA Poffenbarger T Development of hypertension in
adolescents with pre-hypertension J Pediatr 2012 16098ndash103
99 Ejike ECCC Ugwu CE and Ezeanyika LUS Variations in the prevalence of point
prehypertension in a Nigerian school-going adolescent population living in a semi-
urban and an urban area BMC Pediatr 2010 1013
81
100 Ujunwa FA Ikefuna AN Nwokocha AR Chinawa JM Hypertension and
prehypertension among adolescents in secondary schools in Enugu South East Nigeria
Italian J Pediatr 20133970-5
101 Chobanian AV Bakris GL Black HR Seventh report of the Joint National
Committee on Prevention Detection Evaluation and Treatment of High Blood
Pressure Hypertension2003 421206ndash52
102 Lande MB Systemic Hypertension In Kliegman RM Behrman RE Jenson HG and
Stanton BF (eds) Nelson Textbook of Pediatrics Saunders Elsevier Philadelphia 19th
Edition 2011 pg 1592-8
103 Luma GB Spiotta RT Hypertension in Children and Adolescent Am Fam Physician
2006 73 1558-68
104 Arvind B Rupesh J Vijayakumar M Madhuri K Ali U Evaluation and management
of hypertension Indian Paediatr 2007 44 103-21
105 Flynn JT Neonatal hypertension Diagnosis and management Pediatr Nephrol 2000
14 332-41
106 Steyn K de Wet T Richter L Cameron N Levitt NS Morrel C Cardiovascular
diseases risk factors in 5-year old urban South African children- The Birth to Ten
Study SAMJ 2000 90 7126
107 Antia-Obong OE Antia-obong LE Arterial blood pressure of Nigerian Urban and
Rural school children Nig J Paediatr 1991 18 3-11
108 Nguyen NT Magno CP Lane KT Hinojosa MW Lane JS Association of
hypertension diabetes dyslipidemia and metabolic syndrome with obesity findings
from the National Health and Nutrition Examination Survey 1999 to 2004 J Am Coll
Surg 2008 207 928-34
82
109 Solar MB Gill A Rey J Epidemiology of arterial blood pressure in school children
population Aten Primaria 1992 9 212-4
110 Steyn K de Wet T Richter L Cameron N Levitt NS Morrel C Cardiovascular
diseases risk factors in 5-year old urban South African children- The Birth to Ten
Study SAMJ 2000 90 7126
111 Linkas J The assessment and management of hypertensive emergencies and
urgencies in children Pediatr Emerg Care 2005 21391-6
112 Croix B Feig DI Childhood hypertension is not a silent disease Pediatr Nephrol
2006 21527-32
113 Flynn JT Anderson MH Characteristics of children with primary hypertension seen
at a referral centre Pediatr Nephrol 2007 44 103-21
114 Nakao M Yano E Nomura S Kuboki T Blood pressure lowering effects of
biofeedback treatment in hypertension a meta-analysis of randomized controlled trials
Hypertension 2003 26 37- 46
115 Jalingo Available from URLhttpwwwencyclopedia Britanica Accessed on 3rd
December 2011
116 Araoye MO Research Methodology with Statistics for Health and Social Sciences
Nathadex Publishers Saw-Mill Ilorin Nigeria 2004 pg 115-21
117 Olusanya O Okpere E Ezimokhai M The importance of social class in voluntary
fertility control in a developing country West Afr J Med 1985 4 205-12
118 World Health Organization expert committee Physical status the use and
interpretation of anthropometry WHO technical report series No 894 Geneva WHO
1995 p 424ndash38
119 Guidelines subcommittee WHOISH guideline for management of hypertension J
Hypertens 1999 17 151-83
83
120 Aubay B How to measure waist circumference Available from
URLhttpwwwehowcom Last updated August 10th 2011 and accessed on December
9th 2011
APPENDICES
Appendix 1
PROFORMA ON BLOOD PRESSURE PATTERN IN APPARENTLY HEALTHY
SECONDARY SCHOOL ADOLESCENTS IN JALINGO
PUBLIC SCHOOL [ ]
Serial No
84
PRIVATE SCHOOL [ ]
A BIODATA
1 Age (years) 10[ ] 11[ ] 12[ ] 13[ ] 14[ ] 15[ ] 16[ ] 17[ ] 18[ ] 19[ ]
2 Gender M [ ] F [ ]
3 Class JSS 1-3 [ ] SS1-3 [ ]
B MEDICAL AND SOCIAL HISTORY Yes [1] No [2]
1 Have you ever passed blood in your urine [ ]
2 Have you ever had your face or legs swollen [ ]
3 Are you on any drug for long time (such as pills steroids marijuana codeine
NSAIDs containing drugs tramal and others) [ ]
If yes specifyhelliphelliphellip
C SOCIO-ECONOMIC CLASSIFICATION
Fatherrsquos occupation
Score 1 Professionals top civil servants politicians and top businessmen
2Middle-level civil servants technicians skilled-artisans and well-to-do
traders
3 Unskilled workers and those in general whose income would be at or below
the national minimum wage
Mothers educational level
Score 0 Education up to University level
1 Secondary or tertiary level below the University
2 No formal education or up to primary level only
D ANTHROPOMETRY
i Weight (Kg) ndash 1helliphellip 2helliphelliphellip Averagehelliphelliphelliphellip
ii Height (m) ndash 1helliphellip 2helliphellip Averagehelliphelliphelliphellip
85
iii Body mass index = weightheight (kgm2)
v Waist circumference (cm) ndash 1helliphellip 2helliphelliphellip Averagehelliphelliphelliphellip
iv Blood Pressure (mmHg) - 1helliphellip 2hellip 3helliphellip Averagehelliphelliphelliphellip
Appendix 2
AUTHORIZATION AND CONSENT TO PARTICIPATE IN A RESEARCH
I Dr Peter Teru Yaru of the Department of Paediatrics Ahmadu Bello University
Teaching Hospital (ABUTH) Zaria Irsquom conducting a research on the blood pressure
pattern among secondary school adolescents in Jalingo
The aim of the study is to know the level of blood pressure among their age
groups Those with high blood pressure (or hypertension) will be identified appropriately
advised and referred for further care The study will involve taking their weight height
blood pressure and waist circumference Female assistants shall be responsible for
86
measuring waist circumference of female students Students will also be given a
questionnaire on some of their activities drug use among others all aimed at looking for
factors which can affect their blood pressure Information obtained shall be treated with
utmost confidentiality and for this research work only Please note that participation is
voluntary I will be glad if you give consent for your childward to participate in the
study
Statement by parents Irsquove read and understood this consent form and agreed for my
child to be included in the study
Parents name Researcherrsquos name and sign
Parents phone no if any Date
Parents signthumb print Phone no
87
Appendix 3
SOCIO-ECONOMIC SCORE
The classification of socio-economic scores based on fatherrsquos occupation and motherrsquos
education by Olusanya et al117
A Husband (fatherrsquos occupation)
Score 1 Professionals top civil servants politicians and businessmen
2 Middle-level bureaucrats technicians skilled-artisans and well-to-do traders
3 Unskilled workers and those in general whose income would be at or below
the national minimum wage
B Mothers educational level
Score 0 Education up to University level
1 Secondary or tertiary level below the University
2 No formal education or up to primary level only
The socio-economic class of the childrsquos mother is obtained by adding the scores from A
and B above and graded I-V as appropriate for example
Score (1) from A plus score (0) from B = social class I
Score (2) from A plus score (0) from B = social class II
Score (2) from A plus score (1) from B = social class III
Score (2) from A plus score (2) from B = social class IV
Score (3) from A plus score (0) from B = social class III
Score (3) from A plus score (1) from B = social class IV
Score (3) from A plus score (2) from B= social class V
Page 3
3
ATTESTATION
We certify that this dissertation was carried out by Dr Peter Teru Yaru of the Department of
Paediatrics Ahmadu Bello University Teaching Hospital Zaria under our supervision
Signature and Date__________________________________________
Professor WN Ogala MBBS FMCPaed FWACP DCH
Professor and Consultant Paediatrician
Ahmadu Bello University Teaching Hospital Zaria
Signature and Date__________________________________________
Dr HW Idris MBBS FWACP
Senior Lecturer and Consultant Paediatrician
Ahmadu Bello University Teaching Hospital Zaria
Signature and Date_________________________________________
DR AJ Uniga MB BCh FMCPaed
Consultant Paediatrician Dept of Paediatrics
Federal Medical Centre Jalingo
4
TABLE OF CONTENTS Title page i
Declaration ii
Attestation iii
Table of contents iv
Dedication v
Acknowledgement vi
List of abbreviations vii
Definition of terms viii
List of tablesrsquo ix
List of figures x
Summary xi
Introduction 1
Literature review 4
Aims and objectives 22
Materials and methods 23
Results 33
Discussion 47
Conclusions 53
Recommendations 54
Limitations 55
Lines of future research 56
References 57
Appendices 71
5
DEDICATION
This work is dedicated to my dearest wife and lovely children for their patience and
understanding during this period Above all I dedicate it to God Almighty for sustaining me
to this stage and beyond
6
ACKNOWLEDGEMENTS
I first and foremost acknowledge my supervisors in the persons of Professor WN Ogala Dr
HW Idris and Dr AJ Uniga for their untiring guidance and assistance throughout the period of
this work I am also grateful to all the consultants and residents of the Department of
Paediatrics ABUTH for their advice criticism and suggestions
The study would have been unsuccessful without the cooperation of the Taraba State
Post Primary Schools Board The school principals and the students were all wonderful and I
highly appreciate their cooperation during the study
My research assistants were very committed and dedicated and I really appreciate them
I particularly appreciate Dr AO Awolowo for his untiring participation in the study
Similarly I want to acknowledge the nurseMr E Joseph and Miss F Geoffrey the female
youth corper who both assisted with the anthropometric measurements
I acknowledge my primary institution the Federal Medical Centre Jalingo for
sponsoring me for the residency training I appreciate their moral and financial assistance
The management of ABUTH is also highly appreciated for giving me the opportunity of
training in her institution
Finally the support prayers and encouragement of my family kept me going during this
period I specially appreciate my dearest wife Susan and our children for standing by me even
when I was not always available when they needed me I also acknowledge my senior brother
Joseph Teru all my friends and other people who have contributed in one way or the other to
the successful completion of this work I thank them all
7
LIST OF ABBREVIATIONS
ADH Antidiuretic Hormone
ANP Atrial Natriuretic Peptide
BMI Body Mass Index
BP Blood pressure
CDC Centre for Disease Control
CVA Cerebro-vascular accident
DASH Dietary approach to stop hypertension
DBP Diastolic blood pressure
Ht Height
JSS Junior secondary school
Kg Kilogramme
M Meter
mmHg Millimeters of Mercury
NHBPEPWG National High Blood Pressure Education Programme Working Group
NCHS National Centre for Health Statistics
PGS Pubertal Growth Spurt
PHC Primary Health Care
QI Queteletrsquos index
SBP Systolic blood pressure
SSS Senior secondary school
SMR Sexual maturity rating
USA United States of America
WC Waist circumference
WHO World Health Organization
WHR Waist-hip ratio
Wt Weight
8
LIST OF TABLES
Table I Result of pilot study 26
Table II List of schools and number of students selected 28
Table III Age and sex distribution of the study subjects 33
Table IV Overall ean anthropometric measurements of the study subjects 35
Table V Mean anthropometric indices of 628 boys 36
Table VI Mean anthropometric indices of 722 girls 37
Table VII Mean and ranges of blood pressure of 1350 subjects 38
Table VIII Mean blood pressure in relation to age and sex 39
Table IX Mean blood pressureaccording to sex and stages of adolescence 41
Table X The pattern of normal BP prehypertension and hypertension according to stages of
adolescence 41
Table XI Correlation between blood pressure and anthropometry 42
Table XII Mean blood pressure in relation to socioeconomic classes 43
Table XIII Blood pressure pattern in relation to socioeconomic classes 43
Table XIV Overall Blood pressure pattern and prevalence of hypertension 45
9
LIST OF FIGURES
Figure 1 Studentsrsquo distribution according to socioeconomic classes 34
Figure 2 Blood pressure distribution in relation to age and sex 40
10
SUMMARY
A cross sectional study of blood pressure pattern in apparently healthy secondary school
adolescents aged 10-19years in Jalingo Taraba state was carried out over six months period
from January to July 2014 One thousand three hundred and fifty (1350) students
participated comprising 628 (465) boys and 722 (535) girls Variables measured
included blood pressure weight height waist circumference and body mass index was
calculated from the weight and height
Overall the mean anthropometric values and blood pressure increased with age
irrespective of sex The mean weight of the students was 486plusmn109kg with a range of 23-
100kg while the mean height was 16plusmn01m and ranged from 12-19m The mean waist
circumference was 656plusmn89cm and ranged from 22-100cm while the meanbody mass index
(BMI) was 189plusmn31 with a range of 114-420
The overall mean systolic blood pressure was 1089plusmn125mmHg with a range of 76-
165mmHg whilethe mean diastolic blood pressure was683plusmn82mmHg and ranged from 47-
95mmHg The gender related differences in blood pressure showed mean systolic blood
pressure for boys and girls to be 1081plusmn133mmHg and 1095plusmn117mmHg (t=-2054
p=0040) while the mean diastolic blood pressurewas 678plusmn81mmHg and
687plusmn82mmHg(t=-2077 p=0038) respectively Girls generally had a higher mean systolic
blood pressure than boys from early adolescence (t=3754 p=0007) to middle adolescence
(t=-3025 p=0011) but reversed during late adolescence with boys having higher mean
systolic blood pressure (t=2145 p=0033) and these differences were statistically significant
Girls also showed dominance in the diastolic blood pressurein early and middle adolescence
but only statistically significant during middle adolescence (t=-3517 plt0000) Adolescents
from private schools had higher meansystolic blood pressure of 1102plusmn123mmHg than those
11
from public schools with 1084plusmn125mmHg(t=-222 plt0027)and higher mean diastolic
blood pressure of 703plusmn80mmHg than those from public schools with 677plusmn81mmHg(t=-
461 p=0000)
Blood pressure correlated positively with age (r=030-035 plt0000) height (r=034-
044 plt0000) weight (r=038-051 plt0000) body mass index (r=029-040 plt0000) and
waist circumference (r=023-031 plt0000) The socio-economic class associated negatively
with blood pressure withthose from upper socio-economic classeshavinga relatively
lowermean blood pressure than their counterparts from lower socio-economic classes but the
differences were not statistically significant for both systolic (f=1650 p=2850) and diastolic
blood pressure (f=0193 p=0058)
The overall point prevalence of hypertension was 44(59 0f 1350) with gender specific
prevalence for malebeing 41 (26 of 628 boys) and46 (33 of 722 girls) for females The
gender difference was not statistically significant (χ2=0831 p=0362) According to stages of
hypertension 15 (10 of 628)and 11 (7 of 628) males had stages 1 and 2 systolic
hypertension respectively while24 (15 of 628) had stage 1 diastolic hypertension andnone
had stage 2 diastolic hypertension Similarly 24 (17 of 722) and 12 (9 of 722) females
had stages 1 and 2 systolic hypertension respectively while 12 (9 of 722) and only 01 (1
of 722) girls had stages 1 and 2 diastolic hypertension respectively The overall prevalence of
pre-hypertension was 221(298 of 1350) with gender related prevalence of 21 (131 of
628) for males and231 (167 of 722) for femalesThe gender difference was statistically
significant (χ2=4349 p=0037)
In view of the high prevalence of pre-hypertension of 221 (298 of 1350) in this
study it is recommended that blood pressure measurement should be included as part of
medical evaluation at secondary school entry and at least annually thereafter especially for
those found to be at risk of hypertension during school entry
12
INTRODUCTION
Blood pressure (BP) is the pressure exerted by circulating blood volume on the walls of
blood vessels1 It is one of the vital signs measured during routine physical examination2
Blood pressure measurement is done to screen for hypertension and other cardiovascular
risk factors determining risk for various medical procedures identifying patients in
potential or actual clinical deterioration and determining individualrsquos fitness for an
occupation3 Its value as a screening tool in adults has long been documented and is an
established important component of routine paediatric physical examination4
The importance of BP measurement in children and adolescents is based on the fact
that hypertension is now increasingly diagnosed among them5-8 The American Academy
of Paediatrics now recommends routine screening of asymptomatic adolescents and
children during preventive care visits Such screening will identify potentially treatable
and preventable causes of hypertension and initiate early treatment to prevent
complications5
Hypertension is an important health problem all over the world5-9 because it is
usually silent and the presence of symptoms may indicate end organ damage10 It is
known to track well into adulthood thus making BP measurements in youths valuable for
identifying adolescents at risk of essential hypertension in adulthood11 Individuals with
high BP in their childhood are more likely to have high BP in subsequent years12 The
phenomenon of BP tracking into adulthood and the demonstration of the beginnings of
hypertensive target organ damage during childhood together with the increased
prevalence of childhood essential hypertension have raised concern of an impending
epidemic of cardiovascular morbidity and mortality10
The consequences of hypertension in children range from increased morbidity
from its causes complications or its treatment to high mortality13 The most frequently
13
and perhaps severely affected organs are the heart kidneys brain and the eyes leading to
lowered life expectancy and premature death13 In addition hypertension is a component
of the metabolic syndrome associated with similar and perhaps more severe consequences
in affected individuals14 Abdulrahaman and Babaoye15 in a study of hypertension in
Nigerian children observed a mortality rate of 28 within the first year after diagnosis
Similar mortality of 275 was reported by Aderele and Seriki9 Hypertension also places
an excessive financial burden on the population and health system consuming scarce
resources16
Adolescence is the transitional period of development between childhood and
adulthood The World Health Organization (WHO) defines adolescents as individuals
between the ages of 10 and 19 years and they account for 40 of Nigeriarsquos population1718
Adolescence is characterized by rapid biological psychological and cognitive changes
largely dependent on hormonal and environmental influences19 Many of the responses to
these influences include behaviours that have direct implications on health such as harmful
dietary intake alcoholism smoking substance abuse and sedentary lifestyle19 These
coupled with social stresses such as city traffic congestion have negative health impact and
predispose to obesity and increased risk of cardiovascular disease such as hypertension and
metabolic syndromes10 20 It has been shown that if preventive measures are started early in
childhood and adolescence they may lead to significant reduction in the high prevalence of
hypertension and metabolic syndrome currently observed in adults81320
JUSTIFICATION FOR THE STUDY
Hypertension is associated with high morbidity affecting major organs of the body such as
the heart kidneys and the brain1314 and a mortality of up to 275-28915 It is now diagnosed
frequently in adolescents with a reported prevalence of 35-952122 The younger the age of
14
onset of hypertension the greater the reduction in life expectancy if left untreated13 Even
asymptomatic adolescents with mild blood pressure elevations can have target organ
damage10 Studies121420 have shown that early identification and intervention may lead to a
significant reduction in the high prevalence of hypertension and metabolic syndrome
currently observed in adults In view of this routine blood pressure check-ups for children
and adolescents have been advocated during medical evaluations8 Blood pressure is
however not routinely measured in most paediatric clinical practices in Nigeria
Consequently only few children will have their blood pressure measured when they fall sick
or during preventive care visits In addition hospital and clinic BP measurements may be
associated with falsely elevated BP called lsquolsquowhite coat hypertensionrsquorsquo8 BP measurement of
children outside of the hospital setting such as in schools will provide opportunity for
apparently healthy individuals and possibly eliminate white coat hypertension The need for
surveillance for the early identification of adolescents in Jalingo who are at risk of
hypertension and to initiate measures aimed at preventing its consequences is therefore the
justification for this study In addition the study will add to the body of knowledge on
adolescent blood pressure as there has been no previous study on BP from Jalingo and
northeastern Nigeria as a whole This will help inform public health policies regarding blood
pressure control and prevention in Taraba State in particular and in Nigeria in general
15
LITERATURE REVIEW
HISTORICAL PERSPECTIVE
Blood pressure measurement first started in the eighteenth century with the experiment of
Stephen Hales to whom its discovery can be attributed as reported by Jeremy2324
Accurate study of blood pressure as reported by Crile25 began with the introduction of a
manometer by Poiseuille a century later The first truly accurate blood pressure
measurement in man was by the Surgeon Faivre in 1856 when he connected an artery to a
mercury manometer to obtain direct readings24 Non-invasive methods of BP
measurement started with the discovery of the sphygmograph in 1855 by Vierordt as
reported by Crile25 and improvement by Potain in 1889 gave birth to the
sphygmomanometer26 In 1896 Scipione Riva-Rocci developed the method upon which
present-day technique is based27
Segal28 reported that the use of stethoscope for BP measurement was first highlighted
in 1905 by a Russian surgeon Korotkoff who documented hearing a tapping sound using a
stethoscope placed over the brachial artery as the Riva-Rocci cuff was deflated Goodman
and Howell29 recommended the division of the changing sounds into five distinct phases and
physicians subsequently determined blood pressure according to the point of appearance and
muffling or disappearance of the sounds30
DEFINITION AND REGULATION OF BLOOD PRESSURE
Blood pressure is defined as the product of cardiac output and peripheral vascular
resistance131 During each heartbeat BP varies between a maximum (systolic) and a
minimum (diastolic) pressure and is measured in millimeters of mercury (mmHg)1 Blood
16
pressure is regulated by different mechanisms acting either rapidly or slowly to maintain it
within normal range for optimal cellular performance3132
Intrinsic Regulation
Intrinsic factors regulating BP include stroke volume and heart rate which both influence
cardiac output31 Stroke volume depends on the volume of blood that fills the ventricles and
this depends on the preload and afterload33 A higher afterload will decrease stroke volume
causing low cardiac output and low BP and vice versa When cardiac output increases more
volume is derived from the venous pool increasing preload Similarly an increased heart rate
will lead to increased cardiac output and BP3134
Reflex Regulation
The baroreceptors within the aortic arch and carotid sinuses contain sympathetic and
parasympathetic nerve fibres3435 These are sensory nerves which run from the medulla
and they respond to stretch of the tissue in which they lie by increasing or decreasing the
rate of signaling36 and act fast in regulating BP34 Sympathetic stimulation causes
increased heart rate and widespread vasoconstriction to increase BP while
parasympathetic stimulation produces the opposite3537
Hormonal Regulation
Hormones regulating blood pressure include renin-angiotensin-aldosterone and
antidiuretic hormone (ADH) They act slowly by responding to changes in intravascular
volume and osmolality38 Angiotensin II is a potent vasoconstrictor and stimulates the
release of aldosterone from the adrenal gland39 Aldosterone increases sodium absorption
and fluid retention leading to increased BP ADH is a potent vasoconstrictor and plasma
volume regulator and its stimulation results in fluid retention and vasoconstriction39
Other hormones regulating BP include the sex hormones thyroid parathyroid cortisol
and ACTH They act on the rennin-angiotensin-aldosterone system to regulate BP3940
17
Renal Regulation
The kidneys control blood pressure through the retention and excretion of extracellular
fluid35 An increase in renal fluid retention will increase extracellular volume and higher
blood pressure whereas increased renal excretion leads to lower blood pressure41 This is
achieved through the action of ADH aldosterone and atrial natriuretic peptide (ANP)41
METHODS OF MEASURING BLOOD PRESSURE
Blood pressure can be measured by invasive and non-invasive methods
1) Invasive (or direct) method - Blood pressure is most accurately measured invasively
through an arterial line4243 It is the gold standard by which the accuracy of other blood
pressure measuring devices and methods are assessed4344 Chyun43 compared direct and
indirect blood pressure readings in 14 intensive care unit patients and found that the
auscultatory method overestimates the systolic and diastolic BP especially if the VI Kortkoff
sounds is used as an indicator of diastolic BP This can often over estimate reading by as
much as 20 mm Hg43 This study is made up of very small sample size to make general
conclusion on the differences in BP values from the two methods compared Although the
invasive method is the gold standard for true BP measurement it is associated with serious
complications related to arterial catheterization and the procedure itself may be technically
difficult It is mainly used in experimental procedures and in monitoring critically ill patients
in intensive care units42
2) Non invasive (indirect) methods These are simpler and quicker than the invasive
method and are commonly used for routine blood pressure examinations They may
however yield lower accuracy and small systematic differences in numerical results43
These methods include-
18
a) Palpation method - A minimum systolic value can be estimated by palpation Deakin
and Low45 reported that a palpable radial femoral or carotid pulse indicates a minimum
systolic BP of 80 70 and 60 mmHg respectively The study was carried out among adults
and these values could not be applicable in children and neonate whose maximum
systolic BP may be lower than the reported minimum values A more accurate systolic BP
value can be determined by inflating and then deflating sphygmomanometer cuff while
palpating the pulse The systolic BP corresponds to the pressure at which the radial pulse
becomes palpable45 Its disadvantages are that pressure obtained is usually 2-5mmHg less
than those obtained by auscultation and diastolic BP cannot be measured32
b) Auscultation method- Also called the Korotkoff method is the method of choice in
clinical practice142 It involves using a stethoscope and a sphygmomanometer46 The
mercury sphygmomanometer is the gold standard for BP measurement A Riva-Rocci
cuff 27 is placed over the arm and inflated to occlude the brachial artery It is then
gradually deflated until blood flow is re-established accompanied by a tapping sound
which can be detected by the stethoscope held over the artery Five sounds are
traditionally heard and classified into phases30 The first phase corresponds to the systolic
BP while the last or fifth phase corresponds to the diastolic BP30 The fourth phase
alternatively is used to measure the diastolic pressure if a 10 mmHg or greater
differences exist between the initiation of phases fourth and five or if the fifth sound is
heard down to 0 mmHg8 This may occur in cases of high cardiac output or peripheral
vasodilatation children or in pregnancy This method though the method of choice in
clinical practice may however be associated with errors arising from faulty technique and
equipment4748 as well as observer bias49 This method was used for this study because of
its widespread general usage its reliability and accuracy Unlike other methods the
instruments (mercury sphygmomanometer and stethoscope) do not require any
19
calibration and values obtained do not require validation by other methods The standard
World Health OrganizationCenter for Disease Control (WHOCDC) blood pressure
reference percentile tables were generated using the mercury sphygmomanometer hence
the auscultation method is the gold standard for BP evaluation258
The aneroid sphygmomanometer measures BP by mechanical system of metal
bellows that expand as the cuff pressure increases in a series of levers that register the
pressure on a circular scale The hybrid shygmomanometer combines some of the features
of the two and uses an electric transducer to record blood pressure2
c) Oscillometric technique- This uses the oscillometric device Oscillation of pressure in a
sphygmomanometer cuff is recorded during gradual deflation The point of maximum
oscillation corresponds to the mean arterial pressure50 The oscillation begins well above
systolic BP and continues below diastolic BP so that systolic and diastolic BP can only
be estimated indirectly according to some empirically derived algorithm
d) Ultrasound method - This uses an ultrasound transmitter and receiver placed over the
brachial artery under a sphygmomanometer cuff As the cuff is deflated the movement of
the arterial wall and systolic BP cause a Doppler phase shift in the reflected ultrasound
The diastolic BP is recorded as the point of diminished arterial motion51 Its advantage
includes the ability to detect diastolic BP in atrial fibrillation and hypotension where
Korotkoff sound is faint152
FACTORS AFFECTING BLOOD PRESSURE IN ADOLESCENTS
Several inter-related factors affect blood pressure These include-
Age - A progressive BP elevation with age has been observed in several studies2153-55
The rate of rise varies in boys and girls5455 The average systolic increase ranges between
20
166 and 286 mmHgyr for boys and 144 and 263mmHgyr for girls while that of
diastolic BP ranges from 083 and 177mmHgyr for boys and 077 and 148mmHg for
girls2155 Bugaje Yakubu and Ogala21 studied blood pressure pattern among 2035
adolescents in Zaria and found a consistent rise of BP with age The rate of rise was fairly
constant until 11-13 years in boys and 12-14 years in girls when the rise became rapid A
similar study53 also found a BP rise with age among 650 healthy school children in Jos In
a large population studies in Lebanon56 and Saudi Arabia55 BP was similarly reported to
increase consistently with age Rapid growth and biological maturation of organs which
are normal occurrences during adolescence were thought to be responsible rather than the
chronological age56 The results of these studies showed increasing blood pressure with
age despite the fact that one study55 used oscillometric method for their study while the
standard auscultation was used in the other studies Also the studied sample sizes across
these studies varied greatly with sizes of 65053 203521 571054 and 1622655 Despite this
the findings were similar
Gender ndash Results of studies on the effect of gender on BP showed that sex positively
affects blood pressure2153-55 Merhi Al-Hajj and Al-Tannir et al54 studied BP pattern in
5710 Lebanese school children while Al-Salloum El-Mouzan and Al-Herbish et al55
studied BP pattern in 16226 Saudi children and adolescents The authors reported a
higher BP in girls than boys at all ages A study21 of BP pattern in adolescents in Zaria
Nigeria demonstrated an initial higher BP in boys before puberty which reversed with the
onset of puberty up to the age of 14-15yrs when it reversed again to be higher in boys
Akinkugbe Akinwolere and Kayode56 reported no sex differences in adolescent BP in
Ibadan The reported sex difference is said to be likely due to differences in sex hormone
and pattern of growth in boys and girls57 Differences in age range of the study population
may however be responsible for the observed BP variation For instance these studies5455
21
comprised of both adolescents and pre-adolescent age groups combined in one study
while the other two studies2156 were purely adolescents21 Blood pressure is reported to be
equal in both sexes before adolescence after which the gender difference starts to
manifest most likely due to physical and hormonal changes
Socioeconomic Factors - Belonging to either end of the socioeconomic strata is found to
be associated with elevated blood pressure5859 A study in Ibadan56 reported an inverse
relationship between parental socioeconomic status and level of BP in adolescents The
authors suggested that this might be the result of the health behaviours and problems
characteristic of the lower socioeconomic class On the other hand Ejeke Ugwu and
Ezeanyika et al60 in Lokoja and another study53 in Jos both found higher BP in children
from high socioeconomic class Colhoun Hemminway and Poulter61 in a meta-analysis of
BP and socioeconomic status in developed and developing countries found an inverse
relationship of BP with socioeconomic status in developed nations and a direct correlation
in developing countries These different findings may be due to methodological
differences in socio-demographic stratification For instance Akinkugbe and
colleagues59 used fatherrsquos level of education for social classification Parentrsquos educational
level may however not equate well with level of family income The other study60 used an
automated device for their study whose values may require validation using the
recommended auscultation method Difference in environmental stresses may also be
different considering the level of development of the areas where the studies were carried
out
GeneticFamilial Factors - The effect of geneticfamilial factors on BP has been
demonstrated in some studies62-64 Familialgenetic correlations reflected in BP and other
anthropometry generally are higher among genetically close relatives such as brother-
sisters or parent-offspring than among spouses62 Levshit and Gerber63 surveyed 514
22
individuals from 135 nuclear families in Russia while Budaruddoza62 studied 1400
individuals from 380 families in India and found significant genetic influence on BP
Mijinyawa Iliyasu and Borodo65 also reported family history of hypertension as risk
factor for developing high BP in a study on prevalence of hypertension among 1000
teenagers in Kano The authors concluded that this could be due to genetic predisposition
They however did not evaluate further to determine the genetic defects The authors did
not also consider shared environmental factors known to influence blood pressure in
individuals Molecular genetic studies have identified genes as possible regulators of
BP6667 These genes regulate the renin-angiotensin-aldosterone system involved in renal
salt handling69 Mutations that increase sodium reabsorption and salt sensitivity is
associated with higher BP and vice versa68 while shared environmental risk factors may
potentiate the development of such familial conditions which might have been
responsible for outcome of the above studies6364
Environmental Factors ndash Environmental factors greatly influence BP variation in a
population592269 Akinkugbe and Ojo70 reported a consistently higher BP in Nigerian
adolescents than their counterparts of similar ages in black and white American children
The authors are of the view that this could be due to different environmental factors of the
study population Obika Adedoyin and Olowoyeye22 studied BP pattern in 2526
children aged 1-14 years in rural semi-urban and urban communities in Ilorin Nigeria
and demonstrated a hypertension prevalence of 95 in urban compared to 63 in rural
communities This was similar to the study59 in Ghana and Gambia69 The authors592269
argued that the differences were due to socioeconomic status which is higher in the urban
than the rural areas The BP variation could be accounted for by the nature of dietary
intake since the rural communities generally consume more of natural foods with less salt
and lsquojunk foodsrsquo compared to the urban populace This was demonstrated by one study61
23
which reported higher mean BP among urban communities in developing nations due to
changes in their dietary pattern Rural areas are also less exposed to the stress and hassle
of the urban cities It is of interest to note however that urban areas are a mixture of
social classes as a result of migrant workers seeking lsquogreener pasturesrsquo Okagua Anochie
and Akani71 on the other hand reported higher mean BP among rural adolescents than
their urban counter parts in Port Harcourt The authors could not identify the reason(s) for
their finding but concluded that the seemingly protective privilege of rural life may be
fading gradually The differences in the reports could however result from the sample size
composition comprising of preadolescents22 adolescents71 and adults69
Race - Higher BP levels have been reported in African-American and Hispanic school-
age children than their Caucasian counterparts and among African-Americans than the
Hispanics7273 Akinkugbe and Ojo70 demonstrated a consistently high systolic and
diastolic BP in Nigerian children compared with black and white American children of
similar age Exposure to chronic environmental stress low socioeconomic status and high
obesity rate among African American and Hispanic youths could contribute to higher
BP72-74 It can be inferred from the study that race alone may not be responsible for the
observed differences but shared environmental factors and socioeconomic status may be
contributory77 Other studies7475 however found no significant BP differences in relation
to race
Anthropometry and blood pressure (BP) - A positive correlation has been observed
between BP and anthropometry in various studies58-5977 These studies585678 observed a
significant correlation between systolic BP and weight height and body mass index
(BMI) in boys but only with weight in girls Body mass index (BMI) is used as a
measure of overall obesity but it is known to be a poor indicator of actual body fat79
Waist circumference (WC) is an aggregate measurement of the actual amount of total and
24
abdominal fat accumulation80 It is therefore a better predictor of BP and other
cardiovascular diseases8081 Guagnano Ballone and Colagrande et al81 studied the
relationship between BP and BMI WC and waist hip ratio (WHR) in 461 people and
found WC to be the most consistent anthropometry affecting BP It is of interest to note
that the study by Guagnano et al81 was in adults population while the other studies56-59
were in children and adolescents WC was also found to be a better predictor of BP in an
Italian study8081 while it was not in others56-6982 Comparing BMI and waist
circumference and their effects on BP Arauzo Lopes and Moriera et al83 in Brazilian
children found BMI to be a better predictor of BP than waist circumference This was
similar to the study by Sebanjo and Oshikoya82 in Nigerian adolescents in Akure Thus
waist circumference measurements may not be useful in the evaluation of obesity andor
hypertension in children and adolescents This may partly be explained by the uniform fat
distribution due to hormonal effect at puberty in adolescents compared to the
disproportionate fat distribution in adults Possible mechanisms for the positive
relationship between BP and high BMI includes decreased physical activity increased
salt intake impaired pulmonary functions and development of metabolic abnormalities
such as dyslipidaemia and insulin resistance8084
Nutritional factors - Diet has been a primary link between humans and their environment
and substantial evidence supports the concept that multiple dietary factors affect BP85
Well-established dietary modifications that lower BP are reduced salt intake increased
potassium intake increased protein particularly plant protein high vegetable and
polyunsaturated fats85 High sodium intake on the other hand is said to be associated with
elevated blood pressure86 A series of 3 large controlled feeding studies tested the effects
of dietary patterns on BP86-89 Of the 3 diets studied the dietary approach to stop
hypertension (DASH) emphasized fruits vegetables low-fat dairy products whole
25
grains poultry fish nuts potassium magnesium calcium and fibre as the most effective
diet89 Among all participants the DASH diet significantly lowered mean systolic BP by
55 mm Hg and mean diastolic BP by 30 mm Hg each net of changes in the control diet
DEFINITION AND CLASSIFICATION OF ADOLESCENCE
Adolescence is the transitional stage between childhood and adulthood during which many
life patterns are learnt and established90 According to World Health Organization (WHO)
adolescents are individuals between the age range of 10-19 years17 The most significant
feature of adolescence is puberty characterized by an exceptionally rapid rate of biological
growth and development including physical and sexual maturation9091 The pubertal changes
have been described by Tanner and Marshal92 and are grouped into five stages This utilizes
definite criteria for growth and development of secondary sexual characteristics like pubic
hair and breast in females and pubic hair and genitalia in males9092 The timing of these
events and the rate of growth vary due to genetic and environmental factors in different
populations92 Adolescence is divided into early middle and late periods17
Early adolescence (10-13 years) ndash This is a period of rapid growth and development of
secondary sexual characteristics and varies according to sex It corresponds to Tanner stages
1 and 290 The main features of this stage are breast bud development and menarche in girls
while testicular enlargement and seminal emission occurs in boys93
Middle adolescence (14-16 years) ndash In this stage rapid growth decreases and there is more
cognitive development as the adolescents move from concrete thinking to formal operation
and develop greater competence at abstract thinking91 This corresponds to Tanner stages 3
and 4
Late adolescence (17-19 years) ndash Here slowing of physical changes continue which permits
the emergence of a more stable body image Cognition tends to be less self-centered with
26
demonstration of care for others with increasing thought about concepts such as justice
patriotism and history It corresponds to Tanner stage 59092
ADOLESCENCE AND BLOOD PRESSURE
Adolescence is characteristically associated with increasing blood pressure because of the
physical growth and hormonal changes associated with puberty5794 After the age of one year
normal BP increases more during puberty than probably at any other time in an individualrsquos
lifetime95 Wanzhu Eckert and Saha et al57 examined data from a cohort of 182 normotensive
children in Indiana who had blood pressure measurements taken semi-annually for up to 12
yr The authors found that the rate of change in BP and weight peaked at the age of maximum
pubertal growth spurt (PGS) This BP spurt roughly coincides with growth spurt during
puberty94 Surveys of BP patterns from childhood through adolescence shows systolic and
diastolic pressures increase with age and in adolescents the increase in males is more marked
than in females especially the systolic pressure5458229495
CLASSIFICATION OF BLOOD PRESSURE IN ADOLESCENTS
The National High Blood Pressure Education Program Working Group (NHBPEPWG) of the
United States established guidelines for the definition of normal and elevated blood pressures
in children in 19876 These guidelines were revised in 20048 The definition of childhood
hypertension in the guidelines are based upon the normative distribution of blood pressure
(BP) in healthy children rather than clinical outcome data as in adults The guidelines
classified BP as normal prehypertensive or hypertensive Hypertension is graded into stage
one and two8
Normal BP - Blood pressure lt90th percentile for age sex and height Children and
adolescents with normal BP should be followed annually from the age of 3 years5 They
27
should be encouraged to maintain a healthy life style such as good dietary intake physical
activities and adequate rest8
Pre-hypertension - Blood pressure between the 90th and lt 95th or if BP exceeds
12080mmHg (even if lt90th percentile) but lt95th It was previously called high normal
BP This new description was introduced to help identify children at risk for the
development of persistent hypertension for whom targeted prevention programmes would
be most beneficial96 While recommendations for the diagnosis of hypertension in
children require that BP remains elevated on three separate occasions repeated
measurements are not necessary to classify an adolescent as pre-hypertensive11 The
prevalence of childhoodadolescence pre-hypertension in US is reported to be between
12-1796-98 In Nigeria Ejeke Ugwu and Ezeanyika99 in a study of the prevalence of
point prehypertension and hypertension in 843 adolescents in Lokoja reported a
prevalence of point prehypertension of 222 and 250 in semi urban and urban
communities respectively Ujunwa Ikefuna and Nwokocha et al100 reported 175
prehypertension prevalence among adolescents in Enugu Among adults with pre-
hypertension it is reported that as much as 10 per year develop hypertension101 There
is little information on the time course for children and adolescents with prehypertension
developing hypertension A value of between 11-7 per year has been reported in US
adolescents98 There is no known study on rate of progression of prehypertension to
hypertension in Nigerian adolescents The NHBPEP recommended that children with
pre-hypertension should have their BP checked after every six (6) months to monitor for
progression to hypertension They should be encouraged to engage in physical activity
healthy dietary behaviours and weight management if overweight Pharmacologic therapy
is not indicated except if there is strong evidence of renal disease heart failure left
ventricular hypertrophy or diabetes mellitus8
28
Hypertension Hypertension is BP persistently equal to or above the 95th percentile for
age sex and height measured on three or more separate occasions If the blood pressure
measurement obtained is gt 95th percentile the degree of hypertension should be staged
Stage 1 hypertension- BP value between the 95th and the 99th percentile plus 5mmHg It
is recommended that BP should be rechecked in 1ndash2 wks or sooner if the patient is
symptomatic If persistently elevated on 2 additional occasions it should be evaluated or
referred to source of care for pharmacologic treatment within 1 month 8
Stage 2 hypertension- BP value gt99th percentile plus 5mmHg This stage calls for more
prompt evaluation and commencement of pharmacologic therapy102 It is recommended
that the individual be evaluated or referred to source of care within 1wk or immediately if
the patient is symptomatic8
Aetiology of hypertension
Hypertension is classified as primary (essential) when there is no identifiable cause
or secondary if due to an underlying disease31 Factors such as heredity diet stress drugs and
obesity play a role in the development of essential hypertension103104 Causes of secondary
hypertension include umbilical artery catheterization renal diseases coarctation of the aorta
and endocrine disorders105106 Aderele and Sereki6 in their study of hypertension in children
reported hypertension secondary to renal pathology as the commonest cause of elevated BP
in children This study was mainly in preadolescent population in which secondary
hypertension is a common finding On the other hand Antia-Obong and Antia-Obong107
reported no apparent cause in greater than 90 of the studied subjects with elevated BP and
also reported proteinuria of 1 in the same population without any associated elevated blood
pressure The study did not however evaluate the etiology of the proteinuria A study65 of BP
in teenagers in Kano found family history of hypertension a risk factor in the study
population Another study in Enugu100 examined modifiable risk factors associated with
29
hypertension in 2694 adolescents and found only 1 and 06 of the hypertensive subjects
to be overweight and obese respectively The authors also found that smoking and alcohol
consumption were not significant risk for hypertension This may however be due to the
shorter period of consumption of these products by the students as a cumulative effect from
long term consumption is known to be associated with adverse health outcomes
Prevalence of hypertension in adolescents
The prevalence of hypertension in adolescents varies widely due to arbitrary and imprecise
definition by different researchers It was in view of this that the National High Blood
Pressure Education Program Working Group (NHBPEPWG) of the United States established
guidelines for the definition of normal and elevated blood pressures in children and
adolescents for uniformity68 In the USA the prevalence is about 20 in normal weight and
50 in their obese counterparts108 A prevalence rate of 77109 10554 and 223110 has
been reported in Spain Lebanon and South Africa respectively In Kano Nigeria a study65
on the prevalence of hypertension among 1000 teenagers found a prevalence of 72 Similar
study in Enugu100 on the prevalence of hypertension among 2694 secondary school
adolescents reported a hypertension prevalence of 54 It is of interest to note that different
prevalence was reported because of the different methodology used by the authors While the
study in Kano65 applied the adult blood pressure criterion of BP greater than 14090mmHg as
hypertension the study in Enugu100 used blood pressure greater than 95th percentile for age
and sex Also the study in Kano65 took a single set of measurement while the study100 in
Enugu measured blood pressure of the subject three times at weekly intervals Bugaje
Yakubu and Ogala21 on the other hand defined hypertension as blood pressure greater than
two standard deviations from the mean and also took six readings over thirty minutes and got
a prevalence of hypertension of 34 A prevalence rate of 48107 and 9522 in Southern
and Western region of the Nigeria respectively was also reported It is obvious that because
30
of the various defining criteria for hypertension in adolescents the prevalence of adolescent
hypertension remains imprecise
Clinical presentation- Hypertension is usually asymptomatic unless it has been
sustained or is rising rapidly109 Adolescents with essential hypertension are usually
detected during routine evaluation96 Non-specific symptoms such as lethargy headache
dizziness drowsiness visual disturbance and confusion may be present109 These could
also be signs of complications111 Secondary hypertension may show obvious features of
the underlying disease such as growth failure heat intolerance abdominal stria tremors
body swelling and haematuria8102 Croix and Feig112 studied the spectrum of symptoms in
409 children aged 7-18 years newly diagnosed hypertensive in Texas USA and reported
15 common symptoms than in the controls The symptoms were said to resolve after
commencement of antihypertensive medications The authors concluded that hypertensive
children had a variety of non-specific symptoms The three most common symptoms
reported were headache daytime tiredness and difficulty initiating sleep The study
however did not specify if other possible causes of these symptoms were excluded
Complications of hypertension - Hypertension is usually asymptomatic in adolescents
which if left unidentified overtime can cause serious complications109 Organs commonly
affected in the complication of hypertension are the heart kidneys brain and the eyes
leading to lowered life expectancy and premature death13 Left ventricular hypertrophy
(LVH) is the most prominent clinical evidence of end organ damage10 Studies have
shown that LVH can be seen in as many as 41 of patients even in adolescents with
asymptomatic hypertension10103 Adolescents with severe cases of hypertension are also
at increased risk of developing hypertensive encephalopathy seizures cerebrovascular
accidents and congestive heart failure103109 However data documenting such
complications in children and adolescents are generally lacking In a study of
31
hypertension among teenagers in Kano the researchers65 could not find any
complications in all the 1000 teenagers studied
Investigations and treatment- Basic investigations are all that may be required in
adolescents who are obese and with a family history of hypertension stage 1 disease and
normal findings on physical examination113 This is because primary hypertension is
commoner in adolescents Adolescents that are symptomatic or with stage 2 hypertension or
have features of secondary hypertension should be evaluated in more detail
Treatment of hypertension includes non-pharmacological and pharmacological
methods Non-pharmacologic management involves life style modification such as weight
reduction increased physical activities and dietary adjustment114 In a study to evaluate the
effect of diet and salt on treatment and prevention of hypertension Sacks Svetkey and
Vollmer et al86 reported the beneficial effect of both reduced salt intake and appropriate
dietary adjustment in the control of hypertension Similar benefits were reported in other
studies8788 Although both studies had fairly good sample size (n=412) the studies did not
specify if participants were on other substances or activities other than antihypertensive that
might have affected their BP The studies were also in adults and whether it has the same
effects in children and adolescents has not been evaluation However there is no doubt that
the outcome will be similar in adolescents as dietary modifications have been advocated as
non-pharmacologic management in them Non pharmacologic treatment is usually the initial
treatment in essential hypertension and as adjuvant to drug therapy in those with secondary or
complicated hypertension101114 Pharmacologic (drug) treatment includes diuretics beta-
blockers calcium channel blockers angiotensin converting enzyme inhibitors (ACEIs) and
angiotensin receptor blockers (ARB) among others106114 They are used in those with
symptomatic disease and in acute or chronic complications106
32
Prevention of hypertension may be viewed as part of the prevention of cardiovascular
disease102 In adolescents approaches to prevention include reduction in obesity
discouraging cigarette smoking and alcohol intake113 reduction in sodium intake and increase
in physical activity through community and school-based programmes103104 Growth
monitoring BP check during preventive care visit physical activity and urine screening for
proteinuria and haematuria can be used starting from early childhood
33
AIM AND OBJECTIVES
GENERAL AIM
To determine the blood pressure pattern of apparently healthy secondary school adolescents
in Jalingo Taraba State
SPECIFIC OBJECTIVES
To determine
1 Blood pressure pattern in relation to age and sex among adolescents aged 10-19
years
2 The relationship if any between blood pressure and the anthropometric parameters of
weight height BMI and waist circumference
3 The association between blood pressure and parental social-economic status
4 The point prevalence of prehypertension and hypertension in adolescents
34
MATERIALS AND METHODS
Study area
A cross-sectional survey of the blood pressure pattern of apparently healthy secondary
school adolescents aged 10-19 years was conducted in Jalingo over a six month period
from January to June 2014 Jalingo is the capital of Taraba State and lies within the
savannah belt of North Eastern Nigeria It lies between latitude 80 54rsquo north and longitude
110 21rsquo east and at an altitude of 360 meters above sea level115 Jalingo had a population of
118198 people18 The primary inhabitants are the Konas Mumuyes and Fulanis who are
mostly farmers Other indigenous ethnic groups include the Jukun Kuteb WurkumTiv
and host of other tribes The Ibos Hausas Yorubas among others are the non-indigenous
ethnic groups and are mostly civil servants and businessmen Jalingo has a tertiary health
centre the Federal Medical Centre Jalingo and the state specialist hospital It also has 15
private clinicshospital and many primary health care centres There are also tertiary
education institutions including Taraba State University As at 2013 there were 56
secondary schools in Jalingo 24 public and 32 private all of which were mixed schools
except one which is a girlsrsquo only school
Study design
The study was a cross sectional descriptive study of 1350 apparently healthy secondary
school adolescents in Jalingo
Ethical approval
Ethical approval for this study was obtained from the Scientific and Health Ethics Research
Committee of Ahmadu Bello University Teaching Hospital Zaria (Appendix 4) The Taraba
State Ministry of Education also gave the approval and permission to conduct the study in the
35
selected schools Consent was given by the studentsrsquo parents or guardian (Appendix 2) All
students whose parents gave consent voluntarily participated in the study
Sample size determination
The minimum sample size was calculated using the formula116
N=Z2 (pq) E2
Where N = minimum sample size
p = Prevalence of hypertension in adolescents A prevalence of 3421 was used
q = 1- p
E = margin of error tolerated =1
Z = 196 at 95 confidence level
N = 1962 x 0034 x (1-0034) 0012 = 1262
Therefore the minimum sample size was one thousand two hundred and sixty two
Allowance for non-responders of 5 63 extra subjects were added to the calculated
minimum sample size bringing the total to 1325 students To enhance representativeness of
the sample and to compensate for missing information and poorly filled proforma while
maintaining the sample size a total of 1350 was decided upon
Inclusion criteria
1 Students (ages 10-19 years) in the selected secondary schools
2 Students whose parents gave consent to participate in the study
3 Students who gave assent to participate in the study
Exclusion criteria
1 Students who had obvious skeletal deformities of the spine and legs which can affect
the height and ultimately the BMI
36
2 Students with known chronic disease (or history of such disease) like anaemia
chronic renal disease and cardiac disease because they are not apparently healthy and
these conditions could affect their blood pressure
3 Students with present or past history of chronic drug ingestion that can affect blood
pressure such as steriods and contraceptives
4 Students with high blood pressure already on antihypertensive
Pilot study
A pilot study was carried out in one of the schools a week before the commencement of
the study The school was selected by random sampling method using balloting and did
not participate in the main study The pilot study was carried out with the aim of
assessing the competence of the research assistants in the various measurements
following their training to ensure reliability It was also used to test the questionnaire
before its use during the main study and to provide information on the number of students
that can be measured in a day Consequently twenty students had their blood pressure
and anthropometry measured independently by the researcher and the research assistants
and data were compared using Students t-test There were no statistically significant
differences between the measurements The result of the pilot study is highlighted in
Table I It was also found that some parts of the questionnaire were not well understood
by most students and were adjusted appropriately in the main study (Appendix 1) The 20
students had their measurements done over a period of 3-4 hours (between 8am - 12noon)
by the researcher and the research assistants
Table I Result of pilot study
Variables Researcher Research t p
37
assistants
Mean(plusmnSD) SBP
mmHg
106(11) 104(12) 0550 0586
Mean(plusmnSD) DBP
mmHg
617(83) 63(10) 0450 0657
Mean(plusmnSD) Weight
kg
544(82) 527(122) 0520 0608
Mean(plusmnSD) Height m 16(01) 16(01) 0000 1000
Mean(plusmnSD) BMI
kgm2
198(36) 202(33) 0370 0716
Mean(plusmnSD) WC cm 692(72) 682(133) 0300 0769
Sampling method
Students were selected by multistage random sampling technique The list of secondary
schools obtained from the Taraba State Post Primary Schools Board served as the sampling
frame for schools There were 56 secondary schools 24 of which were public and 32 were
private schools a ratio of 113 Ten (10) schools were randomly selected by balloting four
(4) from public schools six (6) from private based on the number and approximately similar
ratio of private to public schools of 115 (46) Ten schools were selected to ensure wider
coverage and even distribution of students so that it could be truly representative of the
community All the ten schools had an overall total of eight thousand one hundred and seven
(8107) students The public schools had a total of five thousand nine hundred and forty
(5940) with nine hundred and eighty nine (989) students participating The private schools
had a total of two thousand one hundred and sixty-seven (2167) students with three hundred
and sixty one (361) participating These number (989 and 361) was calculated based on the
38
relative population of each school and proportionate to number of students in each school
Thereafter the number of students to participate per school was calculated proportionately to
the number of students in each school based on the number given by the school authority
Then the number in each class was also calculated proportionately from JSS1 to SS3 to
ensure fair and equal chance of participation for all age groups The calculation was done
thus n= a b x c
Where n= number of students per selected school
a= total numberpopulation of students in the school
b= total numberpopulation of students in all 10 selected schools (8107)
c= calculated total sample size (1350)
Students in each class from junior secondary school (JSS) 1-3 and senior secondary school
(SS) 1-3 were then randomly selected by balloting The number of selected schools total
number of students in a school and the number of students selected per school is outlined in
Table II
Table II Selected schools and number of students in each of the ten schools in Jalingo
Selected schools Total no of No of students
39
student in the
school (a)
n=8107
selected (n=abxc)
n=1350
Public schools
Govt Science Secondary School 2800 466
Govt Day Secondary School SGari 1200 200
Salisu Dogo Secondary School 1100 183
Govt Secondary School Magami 840 140
Total 5940 989
Private schools
Winners Comprehensive Secondary School 650 108
Hawai Secondary School 562 94
Centre for Quranic Science and Islamic Education 543 90
Good Success Secondary School 155 26
Jetters Academy 140 23
Yagai Academy 117 20
Total 2167 361
The study
The first contact with the students was a familiarization exercise to each of the schools during
which the teachers and students were given a talk by the researcher on blood pressure and the
40
importance of periodic blood pressure measurement They were given the opportunity to ask
questions which were responded to Both the students and their teachers actively participated
in the lectures
On the second day students were selected as described above and those selected
underwent general physical examination in the presence of a chaperon to identify those
who did not fulfilled the inclusion criteria Each selected student was given a proforma
(Appendix 1) in which information on their biodata and medical history were recorded
Other information obtained was parentrsquos medical history and their socioeconomic status
using the format described by Olusanya Okpere and Ezimokhai117 (Appendix 3) The
study was carried out in a relatively quiet and empty classroom to ensure privacy for both
male and female students The procedure for blood pressure measurement was
demonstrated on one of the research assistants and sometimes on one of the teachers by
the researcher to assure the students and allay their anxiety BP and anthropometric values
obtained were recorded in the study proforma An average of 15-20 students per day were
attended to over a period of 3-4 hours (between 8am - 12noon daily) by the researcher
one of the research assistants who is a medical officer a male nurse and a lady Youth
Corper (NYSC)
Blood pressure measurement
This was measured by the researcher and the research assistant (the medical officer) The
standard auscultation method was employed using a mercury sphygmomanometer (Acosson)
and a standard Littman stethoscope according to the guideline of the fourth report on the
diagnosis evaluation and treatment of hypertension in children and adolescents8 Each
students was rest-seated for 5 minutes before BP measurement With the student seated the
right arm rested on a table at the level of the heart an appropriate cuff size which covered
41
two-third (23rd) of the length of the arm was applied round the arm about 2cm above the
antecubital fossa Two cuff sizes were used for this study with dimensions of 10 x 24cm and
13 x 30cm the smaller cuff for the smaller adolescents and vice versa The bladder cuff was
inflated rapidly to 20-30mmHg above the point where the brachial artery was no longer
palpable The bell of the stethoscope was then placed over the brachial artery and the cuff
was deflated slowly at 2-5mmHgsecond while listening to the Korotkoff sounds Phases one
and five of the Korotkoff sounds were recorded as the systolic and diastolic BP
respectively119 Three recordings were taken at intervals of 3-5 minutes and the average was
the final BP in mmHg BP was interpreted based on the standard set by the fourth report on
the diagnosis evaluation and treatment of hypertension in children and adolescents of the
United States8 thus-
Normal BP ndash BP value between the 5th and lt 90th percentile for age sex and height
Prehypertension - BP value between the 90th and the lt95th percentile for age sex and height
or BP of 12080mmHg but less than the 95th percentile
Hypertension ndash BP value ge95th percentile for age sex and height
Students found to have prehypertension were educated and counseled on life style
modifications and the need to have their blood pressure checked in six monthsrsquo time and
annually subsequently Those with hypertension were educated on the implications of the
findings and were referred to the Federal Medical Center Jalingo for evaluation management
and follow-up
Height measurement
Height was measured in centimeters using a locally constructed stadiometer by the research
assistants Each student was measured barefooted standing with the heel back and occiput
42
against the stadiometre The head was held straight looking forward with the lower border of
the eye socket at a horizontal plane with that of the external auditory meatus The movable
part of the stadiometre was adjusted to rest on the vertex and the corresponding value read to
the nearest 01cm
Weight measurement
The weight was measured in kilograms by the researcher and the research assistants using a
bathroom scale (HANSON) Students were weighed in their approved school uniform
without caps head ties or cardigan and with their shoes removed The scale was checked
daily for accuracy using standard calibrated weight before and midway through each session
The weight of the student was measured to the nearest 01 kg
Body mass index (BMI)
This was calculated from the measured weight and height of the subject using the
formula118
BMI= Weight (kg) Height (m2)
Waist circumference measurement
WC was measured in centimeters using a measuring tape by the research assistants The
male assistant measured for boys and the lady Youth Corper measured for girls
Measurement was taken with the student standing completely relax and breathing
normally Clothing was pulled up or down and an inelastic measuring tape was placed
around the waist mid-way between the iliac crest and the lowest rib margin The ends of
the tape were pulled together lightly towards each other and the value read to the nearest
01cm117120
43
Data analysis
Data obtained were analyzed using Epi-Info statistical software package version 7 The
results obtained were presented in figures tables graphs and charts as appropriate Individual
mean BP levels were used as dependent variables and other measured variables as
independent variables The means and standard deviations were used to summarize
quantitative variables such as BP weight height waist circumference and BMI The chi-
squared test was used to test the significance of associations between categorical variables
Studentrsquos t-test was used to compare means of any two normally distributed continuous
variables Pearsonrsquos correlation coefficient and regression analysis were used to examine the
strength of association between BP and the anthropometries Probability level of statistical
significance value was set at lt005
RESULTS
General characteristics
A total of 1350 students were enrolled between January and June 2014 to determine their
blood pressure pattern 628 (465) were males and 722 (535) were females with
malefemale ratio of 111 Students enrolled in the study were drawn from both public and
44
private schools The number of students from public schools was 989 (733) while 361
(267) were from private schools as shown in Table II The mean age of the study subjects
was 153plusmn22 years with a range of 10-19 years The age and sex distribution of the students
is illustrated in Table III
Table III Age and sex distribution of 1350 study subjects in Jalingo
Ag
e
Male
n ()
Female
n ()
Total
N()
10 9(14) 13(18) 22 (16)
11 20(32) 31(43) 51(38)
12 36(57) 52(72) 88(65)
13 96(153) 85(118) 181(134)
14 92(146) 115(158) 207(153)
15 92(146) 111(154) 203(151)
16 66(105) 116(161) 182(135)
17 78(125) 91(126) 169(125)
18 79(126) 70(97) 149(110)
19 60(96) 38(53) 98(73)
To
tal
628(100) 722(100) 1350(100)
45
Socio-economic classes (SEC) ndash Most of the students were from the lower social classes
(4 and 5) with population of 650 (415 and 235) students The upper social classes (1 and
2) had the least population with 184 (62 and122) students The middle social class (3) had
516 students The distribution of the study subjects according to individual
socioeconomic class is shown in Figure I
Figure 1 Socioeconomic class distribution of students in Jalingo
Anthropometry
The anthropometric characteristics of the students are displayed in Tables IV V and VI
All the anthropometric parameters showed increasing values with age (Tables V and VI)
There were significant differences in the anthropometric indices of height (p=0000)
weight (p=0010) and body mass index (p=0000) between boys and girls but not
statistically significant for waist circumference (p=0145) as shown in Table IV
Weight ndash The mean weight of the students was 486plusmn109kg with a range of 23-100kg
(Table IV) Girls were heavier than boys up to middle adolescence after which males
46
were heavier than the females (Table V and VI) and this was statistically significant (t= -
256 p=0010)
Table IV Overall mean anthropometric measurements of the study subjects
Anthropometr
y
Male Female Total
n=628 n=722 N=1350 t p
Wt (kg)
Mean(plusmnSD) 4773(115
)
4926(103
)
4855(plusmn109
)
-
25
6
0007
Range 236-848 227-100 23-100
Ht (m)
Mean(plusmnSD) 159(012) 157(008) 158(plusmn010) 35
5
0000
Range 122-185 126-179 122-185
WC (cm)
Mean(plusmnSD) 6524(91) 6595(86) 6562(plusmn89) -
14
6
0145
Range 225-905 215-100 22-100
47
BMI (kgm2)
Mean(plusmnSD) 1825(27) 1947(33) 1891(plusmn31) -
74
1
0000
Range 117-325 114-42 114-42
Statistically significant p values at 005 level of significance Wt=Weight Ht=Height WC=Waist
Circumference BMI=Body Mass Index SD=Standard Deviation
Height- The mean height of the study population was 158plusmn09m and ranged from 122-
185m (Table IV) Girls were taller than boys at early and middle adolescence but these
reversed from 16 years in favour of the boys (Table V and VI) This differences was
statistically significant (t=448 p=0000)
Waist circumference (WC) - The overall mean waist circumference was 6562plusmn89cm and
a range of 225-100cm Girls had higher WC until late adolescence (18 years) when it
reversed but this was not statistically significant (t=-146 p=0145) This is displayed in
Tables IV V and VI
Body Mass Index (BMI) - Overall mean BMI was 189plusmn31 with a range of 114-42
There was a statistically significant difference between girls and boys (t=-741 p=0000)
Tables IV V and VI illustrate this findings
Table V Mean anthropometric measurements of 628 boys
Age No of
studen
ts
Wt(plusmnSD)
Kg
Ht(plusmnSD)
m
WC(plusmnSD)
cm
BMI(plusmnSD)
Kgm2)
48
10 9 349(50) 143(001
)
613(06) 169(01)
11 20 354(25) 143(002
)
617(13) 170(07)
12 36 363(51) 146(002
)
616(14) 167(06)
13 96 379(51) 150(003
)
602(40) 165(08)
14 92 412(50) 154(003
)
623(32) 169(08)
15 92 471(60) 160(003
)
634(39) 178(08)
16 66 525(52) 164(002
)
672(24) 192(09)
17 78 555(51) 167(002
)
680(31) 197(08)
18 79 576(61) 169(002
)
707(18) 200(08)
19 60 590(57) 170(002
)
716(16) 203(07)
Total 628 477(115 16(01) 652(91) 183(27)
49
)
Wt=Weight Ht=Height WC=Waist Circumference BMI=Body Mass Index SD=Standard Deviation
Table VI Mean anthropometric measurements of 722 girls
Age No of
students
Wt(plusmnSD)
Kg
Ht(plusmnSD)
m
WC(plusmnSD)
cm
BMI(plusmnSD)
Kgm2
10 13 313(34) 139(001) 582(05) 156(02)
11 31 361(53) 144(002) 611(12) 170(05)
12 52 403(64) 149(002) 625(21) 178(09)
13 85 458(66) 154(002) 657(22) 188(12)
14 115 478(74) 157(003) 627(48) 187(10)
15 111 508(65) 159(002) 666(34) 199(13)
16 116 521(60) 159(002) 678(28) 201(11)
17 91 541(62) 161(002) 681(28) 203(11)
18 70 556(63) 161(002) 696(21) 211(11)
19 38 540(48) 158(002) 688(14) 208(06)
Total 722 493(103) 16(010) 651(23) 190(09)
Wt=Weight Ht=Height WC=Waist circumference BMI=Body Mass Index SD=Standard Deviation
Blood pressure (BP) measurements
50
Table VII shows mean blood pressure distribution of the study population for all ages
The highest SBP and DBP were 165mmHg and 95mmHg at 18years and 15 years
respectively Table VIII displays mean BP distribution in relation to age and sex The
tables show that both systolic and diastolic blood pressure increased with age This is also
depicted in Figure 2
Table VII Mean and ranges of blood pressure of 1350 subjects
Systolic Blood Pressure
(mmHg)
Diastolic Blood Pressure
(mmHg)
Age
No of
students
Mean(plusmnSD) Range
Mean(plusmnSD) Range
10 22 936(74) 80-107 600(50) 47-70
11 51 992(106) 76-120 629(71) 47-83
12 88 1036(110) 80-140 657(60) 53-82
13 181 1042(108) 80-143 660(74) 48-88
14 207 1070(115) 83-150 675(76) 47-90
15 203 1090(119) 80-150 678(82) 47-95
16 182 1122(124) 80-150 696(80) 50-90
51
17 169 1132(118) 90-153 698(83) 48-93
18 149 1138(121) 90-165 712(88) 50-90
19 98 1131(127) 90-143 726(76) 57-90
Total 1350 1089(125) 76-165 683(82) 47-95
Table VIII Mean blood pressure in relation to age and sex
Mean(plusmnSD) Systolic blood pressure
(mmHg)
Mean(plusmnSD) Diastolic blood
pressure (mmHg)
A
ge
Male
n=628
Female
n=722
t p Male
n=62
8
Fema
le
n=72
2
t p
52
10 954(3
9)
923(6
0)
1
02
03
20
619(
32)
586(
46)
1
36
0
01
91
11 985(5
5)
997(9
2)
0
42
0
06
80
648(
39)
617(
57)
1
56
0
01
26
12 999(8
9)
1062(
117)
2
84
0
00
06
653(
29)
660(
52)
-
0
52
0
06
07
13 1012(
73)
1075(
73)
4
03
4
00
00
649(
43)
672(
59)
-
0
03
0
00
44
14 1036(
78)
1098(
78)
3
93
0
00
01
653(
44)
693(
58)
3
90
0
00
01
15 1071(
80)
1105(
87)
2
05
0
00
42
665(
58)
689(
56)
-
2
10
0
00
37
16 1135(
82)
1114(
91)
1
03
0
03
10
697(
51)
695(
61)
0
15
0
08
81
53
17 1152(
87)
1115(
77)
2
04
00
43
698(
59)
698(
58)
0
02
0
09
81
18 1141(
96)
1135(
74)
0
27
0
07
91
704(
62)
721(
63)
1
61
0
02
49
19 1146(
97)
1108(
80)
1
41
0
01
64
733(
63)
714(
43)
1
21
0
02
28
To
tal
1081(
133)
1095(
117)
-
2
05
4
00
40
678(
81)
687(
82)
-
2
07
7
00
38
Statistically significant p values at 005 levels of significance
54
Figure 2 Blood pressure distribution in relation to age and sex
SBP =Systolic blood pressure DBP=Diastolic blood pressure
Blood pressure and stages of adolescence
Table IX displays mean blood pressure according to stages of adolescence Girls had a
higher mean SBP than boys from early adolescence (t=3754 p=0000) to middle
adolescence (t=-3025 p=0003) and this was statistically significant This dominance was
also demonstrated in the DBP and was statistically significant in middle adolescence (t=-
3517 plt0000) Adolescents from private schools had higher mean SBP (t=-222
plt0027) and mean DBP (t=-461 p=0000) than those from public schools and these
differences were statistically significant
Table IX Mean blood pressure according to sex and stages of adolescence
Mean BP
(mmHg)
Age (years)
Male SBP
Female SBP
Male DBP
Female DBP
55
Stages
of
adolesc
ents
(years)
Mean(plusmnSD) systolic blood pressure
(mmHg)
Mean(plusmnSD) diastolic blood pressure
(mmHg)
Male Female t p Male Fema
le
t p
Early
(10-13)
1000(9
6)
1040(1
18)
37
54
00
00
648(
56)
653(
82)
05
99
05
50
Middle
(14-16)
1075(1
29)
1105(1
13)
-
30
25
00
03
670(
81)
694(
77)
-
35
17
00
00
Late
(17-19)
1140(1
28)
1121(1
11)
21
45
00
33
717(
85)
710(
83)
00
70
09
45
1082(1
33)
1092(1
17)
-
20
54
00
40
678(
81)
687(
82)
-
20
77
00
38
Statistically significant p values at 005 level of significance SD=Standard Deviation
Table X shows blood pressure pattern according to stages of adolescence
Prehypertension and hypertension were more prevalent in late adolescence than early and
middle adolescence (χ2=49054 p=0000) and (χ2=10305 p=0006) both of which were
statistically significant
Table X The pattern of normal BP Prehypertension and hypertension according to stages
of adolescence
56
Blood
pressure
pattern
Stages of adolescence
Early
n()
Middle
n()
Late
n()
Total
N()
χ2 p
Normal 290(84
8)
428(72
3)
275(66
1)
993(73
5)
429
79
000
0
prehypertens
ion
43(12
6)
135(22
8)
120(28
8)
298(22
1)
490
54
000
0
Hypertensio
n
9(26) 29(49) 21(51) 59(44) 103
05
000
6
342(10
0)
592(10
0)
416(10
0)
1350(1
00)
350
93
000
0
Statistically significant p value at 005 level of significance
Relationship between blood pressure and the measured anthropometry
There was a positive correlation between SBP and DBP with age and the anthropometric
variables of weight height waist circumference and BMI (Table XI) SBP showed a
stronger correlation with the anthropometries than the DBP and was stronger for weight
(r=051) and height (r=044) The waist circumference though statistically significant
showed the weakest correlation
Table XI Correlation between blood pressure age (yrs) and anthropometry
Parameters
Systolic Blood Pressure Diastolic Blood Pressure
Correlation
coefficient
p Correlation
coefficient
p
57
Age (yrs) 035 lt0000 030 lt0000
Height (m) 044 lt0000 034 lt0000
Weight (Kg) 051 lt0000 038 lt0000
WC (cm) 040 lt0000 029 lt0000
BMI
(Kgm2)
031 lt0000 023 lt0000
Statistically significant p values at 005 level of significance Wt=Weight Ht=Height WC=Waist
circumference BMI=Body Mass Index
Blood pressure distribution and socio-economic classes
Table XII shows mean blood pressure according to socio-economic class of the subjects
Lower social classes had higher mean SBP (t=1650 p=2850) and DBP (t=0193
p=00058) but these were not statistically significant
Table XII Mean Blood pressure in relation to socioeconomic classes
Blood
pressur
e
Socioeconomic classes
Upper (1 amp
2) n=184
Middle (3)
n=516
Lower (4 amp
5)
n=650
f(anova
)
p
Mean
(SD)
10857(126
)
10866(128
)
11040(109
)
1650 285
0
58
SBP
Mean
(DBP)
6820(83) 6791(83) 6957(76) 0193 005
8
SEC= Socioeconomic class SBP=Systolic Blood Pressure DBP=Diastolic Blood Pressure SD=Standard
Deviation
Table XIII shows blood pressure pattern in relation to socioeconomic classes of the
subjects The percentage of students with prehypertension was higher in the upper social
class ((χ2=3067 p=0216) while the percentage of hypertension were higher in the lower
socioeconomic classes (χ2=1037 p=0568) but these differences were not statistically
significant
Table XIII Blood pressure pattern in relation to socioeconomic status
Blood
pressure
pattern
Socioeconomic classes
Upper
(1 amp 2)
n()
Middle
(3)
n()
Lower
(4 amp 5)
n()
Total
N()
χ2 p
Normal 127(69
)
383(74
2)
483(74
3)
993(73
6)
417
6
012
4
Prehypertens
ion
52(28
3)
108(20
9)
138(21
2)
298(22
1)
306
7
021
6
Hypertension 5(27) 25(48) 29(45) 59(44) 103 056
59
7 8
184(10
0)
516(10
0)
650(10
0)
1350(10
0)
573
0
022
0
Prevalence of Hypertension and Prehypertension
Table XIV shows the prevalence of hypertension in the study population The total
number of students with hypertension was 59 giving an overall prevalence of 44
Thirty four students (25) had systolic hypertension sixteen (12) had diastolic
hypertension and nine students (07) had both systolic and diastolic hypertension
Systolic hypertension was more prevalent in the females and was more at the age of 16
years while diastolic hypertension was higher in males and this also occurred at 16 years
Among those with hypertension 27 and 16 subjects had stage 1 and 2 systolic
hypertension respectively With regard to diastolic hypertension 24 and 1 subjects had
stage 1 and 2 hypertension respectively The gender difference in the prevalence of
hypertension is not statistically significant (χ2=0831 p=0362)
The number of students with pre-hypertension was 298 giving an overall prevalence of
221 Of this 131 were males and 167 are females This is illustrated in Table XIV
Prehypertension is more prevalent in females than males and this was statistically
significant (χ2=4349 p=0037)
60
Table XIV Overall Blood pressure pattern and prevalence of hypertension and
prehypertension of 1350 students in Jalingo
Blood pressure
pattern
Males
n=()
Females
n=()
Total
N()
χ2 p
Normal 471(750) 522(723) 993(735) 2619 0106
Prehypertension 131(209) 167(231) 298(221) 4349 0037
Hypertension 26(41) 33(46) 59(44) 0831 0362
628(100) 722(100) 1350(100) 1260 0533
statistically significant p value at 005 level of significance
61
DISCUSSION
The findings of this study showed that the BP of secondary school adolescents in Jalingo
was similar in terms of mean values range and trend of progression with age to that of
other adolescents from Ibadan63 and Kogi60 (Nigeria) Ashanti (Ghana)59 and Lebanon54
The mean value was however lower than the mean BP of adolescents from Zaria
(Nigeria)21 Belgrade ( Serbia)78 and Fortaleza-Cearaacute (Brazil)83 who had higher mean BP
in both sexes and at all ages The lower mean BP in this study compared to that of
adolescents from Zaria21 Belgrade78 and Brazil83 could be due to lower mean
anthropometry of weight height and BMI in adolescents from Jalingo resulting in lower
mean BP The sample sizes of these studies7883 were also different and could have
affected the mean BP of the study population For instance the sample size in the
Brazilian study83 is 151 compared to the study in Lebanon54 with 5710 subjects The use
of the fifth Korotkoff sounds as DBP in this study21 could also have accounted for the
lower mean BP in contrast to a similar study in Zaria21 where the fourth Korotkoff sound
was used as the DBP
A progressive increase in blood pressure with age was found in this study This
was similar to most findings by researchers in Nigeria 215358-606566107 and
worldwide54555961 The peak age of rise in BP in this study was in middle adolescence
between 15-16 years in boys but much earlier in girls for both systolic and diastolic BP
This was similar to the study by Akinkugbe Akinwolere and Kayode56 in Ibadan and
Ejeke Ugwu and Ezeanyika et al60 in Lokoja This age group is usually the period of
onset of puberty The chronologic age is not the main factor responsible for BP increase
62
with age but rather the progressive increase in size of the individual Increase in body
size with growth and maturity of organs associated with the physical and hormonal
changes during puberty potentially lead to increasing BP The simultaneous increase in
weight height and other anthropometric indices alongside BP with age seen in this study
and others is in agreement with that The implication of this increase in blood pressure
with age is that those with prehypertensionhypertension in childhood may continue into
adulthood hence further increasing the high prevalence of hypertension in the adult
population with its attendant morbidity disability and mortality
Overall significant higher mean BP was recorded in girls than boys in this study
This was seen from early to middle adolescence after which it reversed in favour of the
boys Reports on the relationship between BP and sex have been inconsistent Some have
reported higher mean BP in females54-56 others higher in males5883 while yet another
reported no sex differences22 The findings of this study were similar to those of Bugaje
Yakubu and Ogala21 and Ujunwa Ikefuna and Nwokocha100 who reported a consistently
higher mean blood pressure in female adolescents up to 16 years compared to their male
counterparts of similar ages Early female predominance in mean blood pressure was also
reports by Agyemang Redekop and Owusu-Dabo et al59 in Ashanti adolescents in Ghana
and Obika Adedoyin and Olowoyeye22 in Illorin The finding was however in contrast
with the study in Calabar58 where higher mean BP was found in boys than girls at all
ages The reason for the higher mean BP in females than boys could be because of earlier
onset of puberty in girls The differences in blood pressure between boys and girls in this
study could also be accounted for by variation in the anthropometric variables of the
individuals as girls were seen to be heavier and taller up to middle adolescence
This study demonstrated a consistently positive relationship between blood
pressure and the anthropometric variables of weight height body mass index and waist
63
circumference as widely reported in other studies 545558-6165107100 Weight is reported to
correlate positively with blood pressure in several studies53565871 Body mass index
(BMI) also showed a positive relation with BP in this study as reported in other
studies5978-81 This is in-keeping with the findings in Port Hacourt71 Abeokuta83 the
Gambia69 Brazil82 and Belgrade77 children Some of these studies however were made
up of younger and older age groups Even in lean populations BMI is known to correlate
positively with BP Waist circumference was also found in this study to correlate
positively with BP This was similar to reports from other studies79-8183 It was found to
be a better predictor of BP in two Italian study8081 while it was not in another82
Comparing BMI and waist circumference and their effects on BP Arauzo Lopes and
Moriera et al82 in Brazilian children found BMI to be a better predictor of BP than waist
circumference This was similar to the report by Sebanjo and Oshikoya83 in Nigerian
adolescents in Akure Guagnano Ballone and Colagrande et al81 however found waist
circumference to be better than BMI The study81 however involved adults and may not
be applicable in children and adolescents The present study demonstrated BMI and WC
to be significant but found BMI to be a better determinant of BP than waist
circumference BMI and waist circumference measure obesity in an individual Whereas
BMI is a measure of overall obesity WC measures centralabdominal fat accumulation
and thus said to be more predictive of adverse health risk79 Obese individuals may be
prone to such condition as dyslipidaemia insulin resistance and hypertension with
reduction in the quality of life Weight BMI and or waist circumference affects blood
pressure through decreased physical activity increased cardiac output insulin resistance
impaired pulmonary function and other hormonal abnormalities8084 It seems therefore
that BMI is a better predictor of BP in adolescents than waist circumference The reason
64
for this is not obvious but it may be because of the nature of uniform fat distribution in
adolescents associated with growth and hormonal changes at puberty
Blood pressure distribution in relation to the parental socio-economic class in this
study showed that students from low socio-economic classes had higher mean blood
pressure than those from upper socioeconomic classes but this was not statistically
significant A study in Ibadanl56 reported a statistically significant negative relation
between blood pressure and parental socio-economic status It was also similar to the
study58 in Calabar In contrast other studies found the reverse536022 The reasons for the
inverse relationship between BP and socioeconomic includes exposure to chronic
environmental stress with sustained sympathetic nervous system stimulation Others are
poor health seeking behaviours due to low income andor inadequate health knowledge
high low birth weight rate and inadequate healthy diets among others97101 In the same
environment individuals from a high social class are believed to be more educated with
high income61 They have easy access to health education and awareness on hypertension
prevention and control and better accessibility and adherence to medical treatment617374
The former might be responsible for the finding of this study as Jalingo is a semi urban
community Most of its inhabitants are subsistent farmers civil servants and traders with
low income The high number of students in the lower socioeconomic class lays credence
to that
The overall point prevalence of hypertension in this study was 44 while that of
pre-hypertension was 221 This prevalence of hypertension is similar to the prevalence
of 48 by Antia-Obong and Antia-Obong107 but higher than the prevalence rate of 37
reported in Zaria21 and lower than the prevalence of 58 reported in Ibadan56 54 in
Enugu100 and the 72 reported in Kano65 The prevalence of pre-hypertension was lower
than that reported by Ejeke Ugwu and Ezeanyika99 who found a prehypertensive
65
prevalence of 25 among adolescents in Lokoja It is higher than the 173 reported by
Ujunwa Ikefuna and Nwokocha et al100 in Enugu and 12-17 by Redwine and
Daniels96 among US adolescents The differences in the reported prevalence of
hypertension and prehypertension in adolescents could have resulted from the different
criteria applied by the various researchers in defining hypertension For instance whereas
this study used BP greater than 95th percentile as hypertension a study in Kano65 used the
adult hypertensive value of BPgt14090mmHg as hypertension and got a prevalence of
72 The prevalence in that study65 could have been higher if the percentile or the
statistical definition was used as many children with BP 14090mmHg would probably be
at stage 2 hypertension This was demonstrated in the study by Bugaje Yakubu and
Ogala21 who found a prevalence of hypertension in their study to be 06 when the adult
cut off value of gt14090mmHg was used but it increased to 37 when the statistical
definition of BPgt 2 standard deviations was used
The number of times blood pressure is taken could affect the outcome as repeated
measurements over a time interval is known to give lower BP values than if BP is taken
once This study used the average of three blood pressure values taken at one sitting but
Ujunwa Ekefuna and Nwokocha100 took three readings at five minutes interval with two
other readings at a week interval In that study100 the prevalence of prehypertension
dropped from 745 during the first set of readings to 173 after the third week
readings The prevalence of hypertension also dropped from 135 to 54 over the same
period Similar decrease in the prevalence of both prehypertension and hypertension was
reported by Redwine and Daniels96 in US adolescents when blood pressure was taken
over time interval Another factor which might have affected the overall prevalence is the
Korotkoff sound used for diastolic pressure23 The 4th or 5th Korotkoff sounds has been
used by different researchers resulting in different diastolic BP The study21 in Zaria used
66
the 4th Korotkoff sound while most other researchers2265100 used the 5th About 5-
10mmHg difference is said to exist between the 4th and 5th Korotkoff sounds230 In this
study the 5th Korotkoff sound was used thus giving a higher prevalence of hypertension
in the studied population than in those where the 4th sound was used
The implication of the outcome of this study is that 44 of adolescents in Jalingo
are already hypertensive while 221 of them are at risk of developing hypertension as
they are pre-hypertensive Since 856 (255 of 298) of the prehypertensives were in the
middle and late adolescence these individuals are likely to be adults with high blood
pressure Therefore regular screening of this group of individuals who were assumed to
be a healthy population is highly important for early detection of hypertension and
intervention such as life style changes and treatment
67
CONCLUSIONS
The following conclusions can be made from this study
1 The mean and range of blood pressure of adolescents in Jalingo was similar to
those of other adolescents in Nigeria and other parts of the world Blood pressure
increased progressively with age
2 All measured anthropometry of weight height body mass index and waist
circumference correlated positively with BP but weight was the most significant
variable in BP determination
3 Socioeconomic status was not significantly related with blood pressure
4 The point prevalence of hypertension and pre-hypertension was 44 and 221
respectively using a recommended definition
RECOMMENDATIONS
1 In view of the high prevalence of prehypertension in this study it is recommended
that students should have their blood pressure measured at school entry as this will
68
help identify those with abnormal BP for early intervention Thereafter BP check
should be offered at least once a year at the beginning of a new session especially for
those found with abnormal BP at school entry
2 Physical and health education should be revived in all the schools This will lead to
increased physical activity and reduced risk of obesity and its consequences
3 School health programmes should be strengthened in schools where it already exist
and effort made to establish same in schools where it is yet to exist The programme
should include measures to detect early prehypertension and hypertension and other
health related needs of the students
LIMITATIONS
The following limitations were encountered in the course of the study
1 Exclusion and inclusion of students that were based on volunteered information and
physical evaluation This could have led to inclusion andor exclusion of adolescentss
69
with or without background renal diseases which could have affected the result of this
study
2 Home blood pressure measurement especially early morning measurement for those
with high blood pressure to possibly eliminate the effect of stress traffic andor
trekking and other school related stresses which may affect blood pressure during the
day
LINES OF FUTURE RESEARCH
This study was questionnaire based and time bound Consequently students were not
investigated for background diseases co-mordid conditions target organ damage or risk
factors for high blood pressure They were also not followed up In view of this future
research on blood pressure in adolescents should include-
70
1 Investigations such as urinalysis electrolytes urea and creatinine random blood
sugar (RBS) lipid profile and echocardiography as part of blood pressure evaluation
in adolescents
2 A long period of study to allow for follow-up over months or years to identify those
that are truly hypertensive considering the definition of hypertension It will also
reveal the rate of progression from pre-hypertension to hypertension
3 Risk factors evaluation for high blood pressure including genetic predispositions
REFERENCES
1 Blood pressure from Wikipedia the free Error Hyperlink reference not valid
Accessed 24th November 2011
2 Pickering TG Hall JE Appel LJ Falkner BE Graves J Hill MN Jones DW Kurtz T
Sheps SG Roccella EJ Recommendations for blood pressure measurement in humans
and experimental animals Part 1 Blood pressure measurement in humans A
statement for professionals from the subcommittee of professional and public
71
education of the American Heart Association council on high blood pressure research
Hypertension 2005 45 142-61
3 da Silva IRR de Souza MDG de Camargo CAC Blood pressure measurement in
children and adolescents Guidelines of high blood pressure recommendations and
current clinical practice Arq Bras Cardiol 2007 88 434-7
4 Sinaiko AR Hypertension in children N Engl J Med 1996 3351968-73
5 US Preventive Services Task Force Screening for high blood pressure
recommendations and rationale Am J Prev Med 2003 25 159-64
6 Report of the second task force on blood pressure control in children Pediatrics 1987
79 1-25
7 National high blood pressure education programme working group on hypertension
control in children and adolescents update on the 1987 task force report on high blood
pressure in children and adolescents A working group report from the national high
blood pressure education program Pediatrics 1996 98 649-58
8 National high blood pressure education program working group on high blood
pressure in children and adolescents The fourth report on the diagnosis evaluation
and treatment of high blood pressure in children and adolescents Pediatrics 2004
114 255-76
9 Aderele WI Seriki O Hypertension in Nigerian children Arch Dis Child 1974
49313-7
10 Bo S Gambino R Gentile L Pagano G Rosato R Saracco GM Cassader M
Durazzo M Cavallo-Perin P High-normal blood pressure is associated with a cluster
of cardiovascular and metabolic risk factors a population based study J Hypertens
2009 27 102-8
72
11 Bao W Threefoot SA Srinivasan SR Berenson GS Essential hypertension
predicted by tracking of elevated blood pressure from childhood to adulthood The
Bogalusa Heart Study Am J Hypertens 1995 8 657- 65
12 Richard A Rodgers M Hedley AJ Mitchel JRA Changes in blood pressure and
blood lipid during adolescence BMJ 1980 28 1563-6
13 Sundstroumlm J Neovius M Tynelius P Rasmussen F Association of blood pressure in
late adolescence with subsequent mortality cohort study of Swedish male conscripts
BMJ 2011 342 643-8
14 Zimmet P Alberti G Kaufman F Tajima N Silink M Arslanian S Wong S Bennett
P Shaw J Caprio S On behalf of the International Diabetes Federation Task Force on
Epidemiology and Prevention of Diabetes The metabolic syndrome in children and
adolescents the IDF consensus Diabetic Voice 20075229-32
15 Abdulrahman FA Babaoye AA Childhood hypertension in northern Nigeria West
Afr J Med 1978 1 7-11
16 Adediran O Jimoh A Di M Relationship between body mass index and blood
pressure in rural Nigerian dwellers Internet J Nutri Wellness 2009 7 431-4
17 World Health Organization (WHO)UNICEF Adolescence at a glance 2003 p 2
18 The National Population Commission constitution of the Federal Republic of Nigeria
(AP 23 LFN) legal notice on publication issued April 21st 2007
19 Heald FP and Gong EJ Diet Nutrition and adolescents In Shils ME and Ross AC
(eds) Modern Nutrition in Health and Disease 9th ed William and Wilkins
Maryland USA 1999 p 32
20 Okonkon CT The prevalence of Hypertension among civil servants in Calabar Nig
Med J 1979 7422-5
21 Bugaje MA Yakubu AM Ogala WN Prevalence of adolescent hypertension in Zaria
Nig J Paediatr 2005 32 77-82
73
22 Obika LF Adedoyin MA Olowoyeye JO Pattern of paediatric blood pressure in
rural semi urban and urban communities in Ilorin Nigeria Afri J Med Sci 1995 24
371-7
23 Jeremy B A short history of blood pressure measurement section of the history of
medicine Proc Roy Soc Med 1977 70 793-9
24 Lewis O Stephen Hales and the measurement of blood pressure J Hum Hypertens
1994 8 865-71
25 Crile GW Blood Pressure in Surgery An experimental and Clinical Research
Philadelphia Lippincott 1903 p 358
26 Lewis WH The evolution of clinical sphygmomanometer Bull N Y Acad Med 1941
17 871-81
27 Browne WC OrsquoBrien ET Semple PF The sphygmomanometer of Riva Roci 1896-
1996 J Hum Hypertens 1994 610 723-4
28 Segal HN How Korotkoff the Surgeon discovered the auscultatory method of
measuring arterial pressure Ann Intern Med1975 83 561-2
29 Goodman FH and Howell AA Clinical studies in the auscultatory method of
determining blood pressure University of Pennsylvania Bulletin 1911 23 469-75
30 Crenner CW Introduction of the blood pressure cuff into US medical practice
technology and skilled practice Ann Intern Med 1998 128 488-493
31 Ganon WF Circulation In Review of Medical Physiol Lange Medical Publication
New York 22nd edition 2005 p 234-63
32 Beth C Homeostatic Regulation of Blood pressure Available from
URLhttpwwweHowcom Accessed on 1st December 2011
33 Rajinder KG Fahim M Regulation of cardiovascular functions during acute blood
loss Indian J Physiol Pharmacol 2005 49 213ndash9
74
34 Dampney AL Coleman MJ Fonts MAP Hirooka Y Horiuchi J Polson JW Potts
PD Tagawa T Central mechanisms underlying short-term and long-term regulation
of the cardiovascular system Proc Austr Physio Pharmacosociety 2001 32 333-44
35 Koshiya N Guyenet PG Noradrenergic neurons and the carotid sympathetic
chemoreflex Am J Physiol 1994 267 519-26
36 Prakash ES The ultimate goal in neural regulation of cardiovascular function Adv
Phyiol Educ 2008 32 107-8
37 Allen AM Inhibition of the hypothalamic paraventricular nucleus reduces
sympathetic nerve discharge and blood pressure Proc Austr Neuroscience Society
2001 29 44-7
38 Reid IA Interactions between ANG II sympathetic nervous system and
baroreceptor reflexes in regulation of blood pressure Am J Physiol 1992 262 763-
78
39 Brooks VL Osborn JW Hormonal-sympathetic interactions in long-term
regulation of arterial pressure A hypothesis Am J Physiol 1995 268 1343-58
40 Reckelhoff JF Gender Differences in the Regulation of Blood Pressure
Hypertension 2001 37 1199-208
41 Fink GD The systemic circulation as a regulated free-market economy A new
approach for understanding the long-term control of blood pressure Clin Exp
Pharmacol Physiol 2005 32 377ndash83
42 Benard K Sources of error in blood pressure measurement Hospital Physician 2002
12 33-7 Available from URLhttp wwwturnerwhitecom
43 Chyun DA A comparism of intra arterial and auscultatory blood pressure readings
Heart lung 1985 14 223-31
75
44 Nwankwo MU Lorenz JM Gardiner JC A Standard Protocol for Blood Pressure
Measurement in the Newborn Pediatrics 1997 99 1342-9
45 Deakin CD Low JL Accuracy of the advanced trauma life support guidelines for
predicting systolic blood pressure using carotid femoral and radial pulses
observational study BMJ 2000 321 673ndash4
46 OrsquoBrian E Replacing mercury sphygmomanometers require clinician to demand
better automated device BMJ 2000 320 815-6
47 McKay DW Raju MK Campbell NR Assessment of blood pressure measuring
techniques Med Educ 1992 26 208ndash12
48 Baker RH Ende J Confounders of auscultatory blood pressure measurement J Gen
Intern Med 1995 10 223ndash31
49 Neufeld PD Johnson DL Observer error in blood pressure measurement CMAJ
1986 135 633ndash7
50 van Montfrans GA Oscillometric blood pressure measurement progress and
problems Blood Press Monit 2001 6 287ndash90
51 Ware RW Laenger CJ Indirect blood pressure measurement by Doppler ultrasonic
kinetoartriography Proceedings 20th Annual Conference Engineering Medical
Biology 1967 9 27-30
52 Matthew Fox Blood pressure measurement technique Available from URL http
wwwlivestrongcom Last edited 2nd September 2010 Accessed on 30th November
2011
53 Akor F Okolo SN Okolo AA Blood pressure and anthropometric measurements in
healthy Primary School entrants in Jos Nigeria SAJCH 2010 4 42-5
54 Merhi BM Al-Hajj F Al-Tannir M Zaide F El-Rajab M A survey of blood pressure
in Lebanese children and adolescents North Am J Med Sci 2011 3 24-9
76
55 Al-Salloum AA El-Mouzan AH Al-Herbish AS Al-Umar AA Qurashi MM Blood
pressure standard for Saudi children and adolescents Ann Saudi Med 2009 29 173-8
56 Akinkugbe FM Akinwolere AO Kayode CM Blood Pressure Pattern in
Adolescence West Afri J Med 1999 18 196-202
57 Wanzhu T Eckert GJ Saha C and Pratt JH Synchronization of Adolescent Blood
Pressure and Pubertal Somatic Growth J Clin Endo Metab 2009 94
58 Ansa VO Anah MU Odey FA Mbu PN Agbor EI Relationship between parental
socioeconomic status and casual blood pressure in coastal Nigeria Adolescents West
Afri J Med 2010 29146-52
59 Agyemang C Redekop WK Owusu-Dabo E Bruijnzeels MA Blood pressure
patterns in rural semi-urban and urban children in the Ashanti region of Ghana West
Africa BMC Public Health 2005 5114-21
60 Ejeke CCE Ugwu CE Ezeanyika LUS Olayemi AT Blood pressure patterns in
relation to geographic area of residence a cross-sectional study of adolescents in Kogi
state Nigeria BMC Public Health 2008 8 411-5
61 Colhoun HM Hemminway H Poulter WR Socioeconomic status and blood
pressure an overview analysis J Human Hypertension 1998 12 91-110
62 Badaruddoza KR Familial aggregation and heritability for cardiovascular risk factors
a family based study in Punjab India Natural Science 2010 2 732-6
63 Livshits G Gerber LM Familial factors of blood pressure and adiposity co-variation
Hypertension 2001 37 928-35
64 Fermino RC Seabra A Garganta R Antoacutenio J Maia R Genetic factors in familial
aggregation of blood pressure of Portuguese nuclear families Arq Bras Cardiol 2009
92 463-9
77
65 Mijinyawa MS Iliyasu Z Borodo MM Prevalence of hypertension among teenage
students in Kano Nigeria Nig J Med 2008 17 173-7
66 The Wellcome Trust case control consortium Genome-wide association study of
14000 cases of seven common diseases and 3000 shared controls Nature 2007 447
661-78
67 Levy D Destefano AL Larson MG ODonnell CJ Lifton RP Gavras H Evidence for
a gene influencing blood pressure on chromosome 17 genome scan linkage results for
longitudinal blood pressure phenotypes in subjects from the Framingham heart study
Hypertension 2000 36 477- 83
68 Lifton RP Wilson FH Choate KA Geller DS Salt and blood pressure new insight
from human genetic studies Cold Spring Harb Symp Quant Biol 2002 67 445ndash50
69 van der Sande MA Milligan PJ Nyan OA Rowley JT Banya WA Ceesay SM
Dolmans WM Blood pressure patterns and cardiovascular risk factors in rural and
urban Gambian communities J Hum Hypertens 2000 14 489-96
70 Akinkugbe OO Ojo OA Arterial blood pressure in rural and urban population of
Nigeria BMJ 1969 2 22-4
71 Okagua J Anochie IC Akani NA Adolescent blood pressure in Rivers State Nigeria
A rural-urban comparism NJP 20154221-7
72 Urrutia-Rojas X Egbuchunam CU Bae S Menchaca J Bayona M Rivers PA Singh
KP High blood pressure in school children Prevalence and risk factors BMC
Pediatrics 2006 6 32-9
73 Sorof JM Lai D Turner J Poffenbarger T Potman R Overweight ethnicity and the
prevalence of hypertension in school-aged children Pediatrics 2004 113 475-82
78
74 Rosner B Prineas R Daniels SR Blood pressure differences between blacks and
whites in relation to body size among US children and adolescents Am J Epidemiol
2000 151 1007-18
75 Harding S Whitrow M Lenguerrand E Maynard M Teyhan A Cruickshank JK Der
G Ethnic differences in blood pressure in adolescence the determinants of adolescent
social well-being and health study Hypertension 2010 55 1063-9
76 Cruickshank JK Mzayek F Liu L Kieltyka L Sherwin R Webber LS Srinavasan SR
Berenson GS Origins of the ldquoblackwhiterdquo difference in blood pressure roles of birth
77 Vlajinac H Miljus D Adanja B Marinkoic J ipetic S Kocev N Blood pressure levels
in 7 to 14-year-old Belgrade children J Human Hypertension 2003 17 761ndash5
78 Menezes AMB Hallal PC Dumith SC Adolescent blood pressure body mass index
and skin folds sorting out the effects of early weight and length gains J Epid Comm
Health 2011 12 42-8
79 Karelis AD St-Pierre DH Conus F Rabasa-Lhoret R Poehlman EJ Metabolic and
body composition factors in subgroups of obesity what do we know J Clin Endo
Metab 2004 89 2569-75
80 Katzmarzyk PT Srinivasan ER Chen W Malina RM Bouchard C Berenson GS
Body mass index waist circumference and clustering of cardiovascular disease risk
factors in a biracial sample of children and adolescents Pediatrics 2004 114 198-205
81 Guagnano MT Ballone E Colagrande V Della Vecchia R Manigrasso MR Merlitti
D Riccioni G Sensi S Large waist circumference and risk of hypertension Int J
Obesity 2001 25 1360 ndash 4
82 Araujo TA Lopes MVO Moriera RP Cavalcante TF Gurdes NG MartinS dA Silva
V Blood pressure of children and teenagers from a public school in Fortaleza - Cearaacute
Acta paul enferm 200720103-15
79
83 Sebanjo IO Oshikoya KA Obesity and blood pressure levels of adolescents in
Abeokuta Nigeria Cardiovasc J Afr 2011 221-5
84 Messerli FN Obesity and essential hypertension Haemodynamics sodium excretion
and plasma rennin activity Arch Int Med 1981 141 81-5
85 Appel LJ Brands MW Daniels SR Karanja N Elmer PJ Sacks FM Dietary
Approaches to Prevent and Treat Hypertension A Scientific Statement from the
American Heart Association Hypertension 2006 47 296-308
86 Sacks FM Svetkey LP Vollmer WM Appel LJ Bray GA Harsha D Obarzanek E
Conlin PR Miller ER 3rd Simons-Morton DG Karanja N Lin PH for the DASH-
Sodium Collaborative Research Group Effects on blood pressure of reduced dietary
sodium and the Dietary Approaches to Stop Hypertension (DASH) diet DASH-
Sodium Collaborative Research Group N Engl J Med 2001 344 3ndash10
87 Appel LJ Moore TJ Obarzanek E Vollmer WM Svetkey LP Sacks FM Bray GA
Vogt TM Cutler JA Windhauser MM Lin PH Karanja N A clinical trial of the
effects of dietary patterns on blood pressure DASH Collaborative Research Group N
Engl J Med 1997 3361117ndash24
88 Appel LJ Sacks FM Carey VJ Obarzanek E Swain JF Miller ER 3rd Conlin PR
Erlinger TP Rosner BA Laranjo NM Charleston J McCarron P Bishop LM for the
OmniHeart Collaborative Research Group Effects of protein monounsaturated fat and
carbohydrate intake on blood pressure and serum lipids results of the OmniHeart
randomized trial JAMA 2005 294 2455ndash64
89 Karanja NM Obarzanek E Lin PH McCullough ML Phillips KM Swain JF
Champagne CM Hoben KP Descriptive characteristics of the dietary patterns used in
the Dietary Approaches to Stop Hypertension Trial DASH Collaborative Research
Group J Am Diet Assoc 1999 99 19ndash27
80
90 Nwokocha ARC Adolescence and associated problems In Azubuike JC and
Nkanginieme KEO (eds) Paediatrics and Child Health in a Tropical Region African
Educational Services Owerri Nigeria 2nd edition 2007 p 84-99
91 Rogol RT Roemmich JN Clark PA Growth and puberty J Adol Hlth 2002 31 192-
200
92 Tanner JM Marshal WA Variation in the pattern of puberty changes in boys and girls
Arch Dis Child 1970 45 13-23
93 Nwakoro SO Ifoda K Onochie O Olomu JM Anthropometric assessment of
nutritional status and growth of 10-20 years individuals in Benin City metropolis
Nigeria Pakistan J Nutr 2006 5 117-21
94 Shankar RR Eckert GJ Saha C Tu W Pratt JH The change in blood pressure during
pubertal growth J Clin Endo Metab 2005 90 163-7
95 Department of Health and Human Services 2000 CDC Growth Charts for the United
States methods and development Series Report 11 No 246 Available from URL
httpwwwcdcgovGrowthCharts
96 Redwine KM Daniels SR Prehypertension in Adolescents Risk and Progression
Journ Clin Hypertension 2012 14 360ndash4
97 Falkner B Gidding SS Portman R Rosner B Blood pressure variability and
classification of prehypertension and hypertension in adolescence Pediatrics 2008
122238ndash42
98 Redwine KM Acosta AA Poffenbarger T Development of hypertension in
adolescents with pre-hypertension J Pediatr 2012 16098ndash103
99 Ejike ECCC Ugwu CE and Ezeanyika LUS Variations in the prevalence of point
prehypertension in a Nigerian school-going adolescent population living in a semi-
urban and an urban area BMC Pediatr 2010 1013
81
100 Ujunwa FA Ikefuna AN Nwokocha AR Chinawa JM Hypertension and
prehypertension among adolescents in secondary schools in Enugu South East Nigeria
Italian J Pediatr 20133970-5
101 Chobanian AV Bakris GL Black HR Seventh report of the Joint National
Committee on Prevention Detection Evaluation and Treatment of High Blood
Pressure Hypertension2003 421206ndash52
102 Lande MB Systemic Hypertension In Kliegman RM Behrman RE Jenson HG and
Stanton BF (eds) Nelson Textbook of Pediatrics Saunders Elsevier Philadelphia 19th
Edition 2011 pg 1592-8
103 Luma GB Spiotta RT Hypertension in Children and Adolescent Am Fam Physician
2006 73 1558-68
104 Arvind B Rupesh J Vijayakumar M Madhuri K Ali U Evaluation and management
of hypertension Indian Paediatr 2007 44 103-21
105 Flynn JT Neonatal hypertension Diagnosis and management Pediatr Nephrol 2000
14 332-41
106 Steyn K de Wet T Richter L Cameron N Levitt NS Morrel C Cardiovascular
diseases risk factors in 5-year old urban South African children- The Birth to Ten
Study SAMJ 2000 90 7126
107 Antia-Obong OE Antia-obong LE Arterial blood pressure of Nigerian Urban and
Rural school children Nig J Paediatr 1991 18 3-11
108 Nguyen NT Magno CP Lane KT Hinojosa MW Lane JS Association of
hypertension diabetes dyslipidemia and metabolic syndrome with obesity findings
from the National Health and Nutrition Examination Survey 1999 to 2004 J Am Coll
Surg 2008 207 928-34
82
109 Solar MB Gill A Rey J Epidemiology of arterial blood pressure in school children
population Aten Primaria 1992 9 212-4
110 Steyn K de Wet T Richter L Cameron N Levitt NS Morrel C Cardiovascular
diseases risk factors in 5-year old urban South African children- The Birth to Ten
Study SAMJ 2000 90 7126
111 Linkas J The assessment and management of hypertensive emergencies and
urgencies in children Pediatr Emerg Care 2005 21391-6
112 Croix B Feig DI Childhood hypertension is not a silent disease Pediatr Nephrol
2006 21527-32
113 Flynn JT Anderson MH Characteristics of children with primary hypertension seen
at a referral centre Pediatr Nephrol 2007 44 103-21
114 Nakao M Yano E Nomura S Kuboki T Blood pressure lowering effects of
biofeedback treatment in hypertension a meta-analysis of randomized controlled trials
Hypertension 2003 26 37- 46
115 Jalingo Available from URLhttpwwwencyclopedia Britanica Accessed on 3rd
December 2011
116 Araoye MO Research Methodology with Statistics for Health and Social Sciences
Nathadex Publishers Saw-Mill Ilorin Nigeria 2004 pg 115-21
117 Olusanya O Okpere E Ezimokhai M The importance of social class in voluntary
fertility control in a developing country West Afr J Med 1985 4 205-12
118 World Health Organization expert committee Physical status the use and
interpretation of anthropometry WHO technical report series No 894 Geneva WHO
1995 p 424ndash38
119 Guidelines subcommittee WHOISH guideline for management of hypertension J
Hypertens 1999 17 151-83
83
120 Aubay B How to measure waist circumference Available from
URLhttpwwwehowcom Last updated August 10th 2011 and accessed on December
9th 2011
APPENDICES
Appendix 1
PROFORMA ON BLOOD PRESSURE PATTERN IN APPARENTLY HEALTHY
SECONDARY SCHOOL ADOLESCENTS IN JALINGO
PUBLIC SCHOOL [ ]
Serial No
84
PRIVATE SCHOOL [ ]
A BIODATA
1 Age (years) 10[ ] 11[ ] 12[ ] 13[ ] 14[ ] 15[ ] 16[ ] 17[ ] 18[ ] 19[ ]
2 Gender M [ ] F [ ]
3 Class JSS 1-3 [ ] SS1-3 [ ]
B MEDICAL AND SOCIAL HISTORY Yes [1] No [2]
1 Have you ever passed blood in your urine [ ]
2 Have you ever had your face or legs swollen [ ]
3 Are you on any drug for long time (such as pills steroids marijuana codeine
NSAIDs containing drugs tramal and others) [ ]
If yes specifyhelliphelliphellip
C SOCIO-ECONOMIC CLASSIFICATION
Fatherrsquos occupation
Score 1 Professionals top civil servants politicians and top businessmen
2Middle-level civil servants technicians skilled-artisans and well-to-do
traders
3 Unskilled workers and those in general whose income would be at or below
the national minimum wage
Mothers educational level
Score 0 Education up to University level
1 Secondary or tertiary level below the University
2 No formal education or up to primary level only
D ANTHROPOMETRY
i Weight (Kg) ndash 1helliphellip 2helliphelliphellip Averagehelliphelliphelliphellip
ii Height (m) ndash 1helliphellip 2helliphellip Averagehelliphelliphelliphellip
85
iii Body mass index = weightheight (kgm2)
v Waist circumference (cm) ndash 1helliphellip 2helliphelliphellip Averagehelliphelliphelliphellip
iv Blood Pressure (mmHg) - 1helliphellip 2hellip 3helliphellip Averagehelliphelliphelliphellip
Appendix 2
AUTHORIZATION AND CONSENT TO PARTICIPATE IN A RESEARCH
I Dr Peter Teru Yaru of the Department of Paediatrics Ahmadu Bello University
Teaching Hospital (ABUTH) Zaria Irsquom conducting a research on the blood pressure
pattern among secondary school adolescents in Jalingo
The aim of the study is to know the level of blood pressure among their age
groups Those with high blood pressure (or hypertension) will be identified appropriately
advised and referred for further care The study will involve taking their weight height
blood pressure and waist circumference Female assistants shall be responsible for
86
measuring waist circumference of female students Students will also be given a
questionnaire on some of their activities drug use among others all aimed at looking for
factors which can affect their blood pressure Information obtained shall be treated with
utmost confidentiality and for this research work only Please note that participation is
voluntary I will be glad if you give consent for your childward to participate in the
study
Statement by parents Irsquove read and understood this consent form and agreed for my
child to be included in the study
Parents name Researcherrsquos name and sign
Parents phone no if any Date
Parents signthumb print Phone no
87
Appendix 3
SOCIO-ECONOMIC SCORE
The classification of socio-economic scores based on fatherrsquos occupation and motherrsquos
education by Olusanya et al117
A Husband (fatherrsquos occupation)
Score 1 Professionals top civil servants politicians and businessmen
2 Middle-level bureaucrats technicians skilled-artisans and well-to-do traders
3 Unskilled workers and those in general whose income would be at or below
the national minimum wage
B Mothers educational level
Score 0 Education up to University level
1 Secondary or tertiary level below the University
2 No formal education or up to primary level only
The socio-economic class of the childrsquos mother is obtained by adding the scores from A
and B above and graded I-V as appropriate for example
Score (1) from A plus score (0) from B = social class I
Score (2) from A plus score (0) from B = social class II
Score (2) from A plus score (1) from B = social class III
Score (2) from A plus score (2) from B = social class IV
Score (3) from A plus score (0) from B = social class III
Score (3) from A plus score (1) from B = social class IV
Score (3) from A plus score (2) from B= social class V
Page 4
4
TABLE OF CONTENTS Title page i
Declaration ii
Attestation iii
Table of contents iv
Dedication v
Acknowledgement vi
List of abbreviations vii
Definition of terms viii
List of tablesrsquo ix
List of figures x
Summary xi
Introduction 1
Literature review 4
Aims and objectives 22
Materials and methods 23
Results 33
Discussion 47
Conclusions 53
Recommendations 54
Limitations 55
Lines of future research 56
References 57
Appendices 71
5
DEDICATION
This work is dedicated to my dearest wife and lovely children for their patience and
understanding during this period Above all I dedicate it to God Almighty for sustaining me
to this stage and beyond
6
ACKNOWLEDGEMENTS
I first and foremost acknowledge my supervisors in the persons of Professor WN Ogala Dr
HW Idris and Dr AJ Uniga for their untiring guidance and assistance throughout the period of
this work I am also grateful to all the consultants and residents of the Department of
Paediatrics ABUTH for their advice criticism and suggestions
The study would have been unsuccessful without the cooperation of the Taraba State
Post Primary Schools Board The school principals and the students were all wonderful and I
highly appreciate their cooperation during the study
My research assistants were very committed and dedicated and I really appreciate them
I particularly appreciate Dr AO Awolowo for his untiring participation in the study
Similarly I want to acknowledge the nurseMr E Joseph and Miss F Geoffrey the female
youth corper who both assisted with the anthropometric measurements
I acknowledge my primary institution the Federal Medical Centre Jalingo for
sponsoring me for the residency training I appreciate their moral and financial assistance
The management of ABUTH is also highly appreciated for giving me the opportunity of
training in her institution
Finally the support prayers and encouragement of my family kept me going during this
period I specially appreciate my dearest wife Susan and our children for standing by me even
when I was not always available when they needed me I also acknowledge my senior brother
Joseph Teru all my friends and other people who have contributed in one way or the other to
the successful completion of this work I thank them all
7
LIST OF ABBREVIATIONS
ADH Antidiuretic Hormone
ANP Atrial Natriuretic Peptide
BMI Body Mass Index
BP Blood pressure
CDC Centre for Disease Control
CVA Cerebro-vascular accident
DASH Dietary approach to stop hypertension
DBP Diastolic blood pressure
Ht Height
JSS Junior secondary school
Kg Kilogramme
M Meter
mmHg Millimeters of Mercury
NHBPEPWG National High Blood Pressure Education Programme Working Group
NCHS National Centre for Health Statistics
PGS Pubertal Growth Spurt
PHC Primary Health Care
QI Queteletrsquos index
SBP Systolic blood pressure
SSS Senior secondary school
SMR Sexual maturity rating
USA United States of America
WC Waist circumference
WHO World Health Organization
WHR Waist-hip ratio
Wt Weight
8
LIST OF TABLES
Table I Result of pilot study 26
Table II List of schools and number of students selected 28
Table III Age and sex distribution of the study subjects 33
Table IV Overall ean anthropometric measurements of the study subjects 35
Table V Mean anthropometric indices of 628 boys 36
Table VI Mean anthropometric indices of 722 girls 37
Table VII Mean and ranges of blood pressure of 1350 subjects 38
Table VIII Mean blood pressure in relation to age and sex 39
Table IX Mean blood pressureaccording to sex and stages of adolescence 41
Table X The pattern of normal BP prehypertension and hypertension according to stages of
adolescence 41
Table XI Correlation between blood pressure and anthropometry 42
Table XII Mean blood pressure in relation to socioeconomic classes 43
Table XIII Blood pressure pattern in relation to socioeconomic classes 43
Table XIV Overall Blood pressure pattern and prevalence of hypertension 45
9
LIST OF FIGURES
Figure 1 Studentsrsquo distribution according to socioeconomic classes 34
Figure 2 Blood pressure distribution in relation to age and sex 40
10
SUMMARY
A cross sectional study of blood pressure pattern in apparently healthy secondary school
adolescents aged 10-19years in Jalingo Taraba state was carried out over six months period
from January to July 2014 One thousand three hundred and fifty (1350) students
participated comprising 628 (465) boys and 722 (535) girls Variables measured
included blood pressure weight height waist circumference and body mass index was
calculated from the weight and height
Overall the mean anthropometric values and blood pressure increased with age
irrespective of sex The mean weight of the students was 486plusmn109kg with a range of 23-
100kg while the mean height was 16plusmn01m and ranged from 12-19m The mean waist
circumference was 656plusmn89cm and ranged from 22-100cm while the meanbody mass index
(BMI) was 189plusmn31 with a range of 114-420
The overall mean systolic blood pressure was 1089plusmn125mmHg with a range of 76-
165mmHg whilethe mean diastolic blood pressure was683plusmn82mmHg and ranged from 47-
95mmHg The gender related differences in blood pressure showed mean systolic blood
pressure for boys and girls to be 1081plusmn133mmHg and 1095plusmn117mmHg (t=-2054
p=0040) while the mean diastolic blood pressurewas 678plusmn81mmHg and
687plusmn82mmHg(t=-2077 p=0038) respectively Girls generally had a higher mean systolic
blood pressure than boys from early adolescence (t=3754 p=0007) to middle adolescence
(t=-3025 p=0011) but reversed during late adolescence with boys having higher mean
systolic blood pressure (t=2145 p=0033) and these differences were statistically significant
Girls also showed dominance in the diastolic blood pressurein early and middle adolescence
but only statistically significant during middle adolescence (t=-3517 plt0000) Adolescents
from private schools had higher meansystolic blood pressure of 1102plusmn123mmHg than those
11
from public schools with 1084plusmn125mmHg(t=-222 plt0027)and higher mean diastolic
blood pressure of 703plusmn80mmHg than those from public schools with 677plusmn81mmHg(t=-
461 p=0000)
Blood pressure correlated positively with age (r=030-035 plt0000) height (r=034-
044 plt0000) weight (r=038-051 plt0000) body mass index (r=029-040 plt0000) and
waist circumference (r=023-031 plt0000) The socio-economic class associated negatively
with blood pressure withthose from upper socio-economic classeshavinga relatively
lowermean blood pressure than their counterparts from lower socio-economic classes but the
differences were not statistically significant for both systolic (f=1650 p=2850) and diastolic
blood pressure (f=0193 p=0058)
The overall point prevalence of hypertension was 44(59 0f 1350) with gender specific
prevalence for malebeing 41 (26 of 628 boys) and46 (33 of 722 girls) for females The
gender difference was not statistically significant (χ2=0831 p=0362) According to stages of
hypertension 15 (10 of 628)and 11 (7 of 628) males had stages 1 and 2 systolic
hypertension respectively while24 (15 of 628) had stage 1 diastolic hypertension andnone
had stage 2 diastolic hypertension Similarly 24 (17 of 722) and 12 (9 of 722) females
had stages 1 and 2 systolic hypertension respectively while 12 (9 of 722) and only 01 (1
of 722) girls had stages 1 and 2 diastolic hypertension respectively The overall prevalence of
pre-hypertension was 221(298 of 1350) with gender related prevalence of 21 (131 of
628) for males and231 (167 of 722) for femalesThe gender difference was statistically
significant (χ2=4349 p=0037)
In view of the high prevalence of pre-hypertension of 221 (298 of 1350) in this
study it is recommended that blood pressure measurement should be included as part of
medical evaluation at secondary school entry and at least annually thereafter especially for
those found to be at risk of hypertension during school entry
12
INTRODUCTION
Blood pressure (BP) is the pressure exerted by circulating blood volume on the walls of
blood vessels1 It is one of the vital signs measured during routine physical examination2
Blood pressure measurement is done to screen for hypertension and other cardiovascular
risk factors determining risk for various medical procedures identifying patients in
potential or actual clinical deterioration and determining individualrsquos fitness for an
occupation3 Its value as a screening tool in adults has long been documented and is an
established important component of routine paediatric physical examination4
The importance of BP measurement in children and adolescents is based on the fact
that hypertension is now increasingly diagnosed among them5-8 The American Academy
of Paediatrics now recommends routine screening of asymptomatic adolescents and
children during preventive care visits Such screening will identify potentially treatable
and preventable causes of hypertension and initiate early treatment to prevent
complications5
Hypertension is an important health problem all over the world5-9 because it is
usually silent and the presence of symptoms may indicate end organ damage10 It is
known to track well into adulthood thus making BP measurements in youths valuable for
identifying adolescents at risk of essential hypertension in adulthood11 Individuals with
high BP in their childhood are more likely to have high BP in subsequent years12 The
phenomenon of BP tracking into adulthood and the demonstration of the beginnings of
hypertensive target organ damage during childhood together with the increased
prevalence of childhood essential hypertension have raised concern of an impending
epidemic of cardiovascular morbidity and mortality10
The consequences of hypertension in children range from increased morbidity
from its causes complications or its treatment to high mortality13 The most frequently
13
and perhaps severely affected organs are the heart kidneys brain and the eyes leading to
lowered life expectancy and premature death13 In addition hypertension is a component
of the metabolic syndrome associated with similar and perhaps more severe consequences
in affected individuals14 Abdulrahaman and Babaoye15 in a study of hypertension in
Nigerian children observed a mortality rate of 28 within the first year after diagnosis
Similar mortality of 275 was reported by Aderele and Seriki9 Hypertension also places
an excessive financial burden on the population and health system consuming scarce
resources16
Adolescence is the transitional period of development between childhood and
adulthood The World Health Organization (WHO) defines adolescents as individuals
between the ages of 10 and 19 years and they account for 40 of Nigeriarsquos population1718
Adolescence is characterized by rapid biological psychological and cognitive changes
largely dependent on hormonal and environmental influences19 Many of the responses to
these influences include behaviours that have direct implications on health such as harmful
dietary intake alcoholism smoking substance abuse and sedentary lifestyle19 These
coupled with social stresses such as city traffic congestion have negative health impact and
predispose to obesity and increased risk of cardiovascular disease such as hypertension and
metabolic syndromes10 20 It has been shown that if preventive measures are started early in
childhood and adolescence they may lead to significant reduction in the high prevalence of
hypertension and metabolic syndrome currently observed in adults81320
JUSTIFICATION FOR THE STUDY
Hypertension is associated with high morbidity affecting major organs of the body such as
the heart kidneys and the brain1314 and a mortality of up to 275-28915 It is now diagnosed
frequently in adolescents with a reported prevalence of 35-952122 The younger the age of
14
onset of hypertension the greater the reduction in life expectancy if left untreated13 Even
asymptomatic adolescents with mild blood pressure elevations can have target organ
damage10 Studies121420 have shown that early identification and intervention may lead to a
significant reduction in the high prevalence of hypertension and metabolic syndrome
currently observed in adults In view of this routine blood pressure check-ups for children
and adolescents have been advocated during medical evaluations8 Blood pressure is
however not routinely measured in most paediatric clinical practices in Nigeria
Consequently only few children will have their blood pressure measured when they fall sick
or during preventive care visits In addition hospital and clinic BP measurements may be
associated with falsely elevated BP called lsquolsquowhite coat hypertensionrsquorsquo8 BP measurement of
children outside of the hospital setting such as in schools will provide opportunity for
apparently healthy individuals and possibly eliminate white coat hypertension The need for
surveillance for the early identification of adolescents in Jalingo who are at risk of
hypertension and to initiate measures aimed at preventing its consequences is therefore the
justification for this study In addition the study will add to the body of knowledge on
adolescent blood pressure as there has been no previous study on BP from Jalingo and
northeastern Nigeria as a whole This will help inform public health policies regarding blood
pressure control and prevention in Taraba State in particular and in Nigeria in general
15
LITERATURE REVIEW
HISTORICAL PERSPECTIVE
Blood pressure measurement first started in the eighteenth century with the experiment of
Stephen Hales to whom its discovery can be attributed as reported by Jeremy2324
Accurate study of blood pressure as reported by Crile25 began with the introduction of a
manometer by Poiseuille a century later The first truly accurate blood pressure
measurement in man was by the Surgeon Faivre in 1856 when he connected an artery to a
mercury manometer to obtain direct readings24 Non-invasive methods of BP
measurement started with the discovery of the sphygmograph in 1855 by Vierordt as
reported by Crile25 and improvement by Potain in 1889 gave birth to the
sphygmomanometer26 In 1896 Scipione Riva-Rocci developed the method upon which
present-day technique is based27
Segal28 reported that the use of stethoscope for BP measurement was first highlighted
in 1905 by a Russian surgeon Korotkoff who documented hearing a tapping sound using a
stethoscope placed over the brachial artery as the Riva-Rocci cuff was deflated Goodman
and Howell29 recommended the division of the changing sounds into five distinct phases and
physicians subsequently determined blood pressure according to the point of appearance and
muffling or disappearance of the sounds30
DEFINITION AND REGULATION OF BLOOD PRESSURE
Blood pressure is defined as the product of cardiac output and peripheral vascular
resistance131 During each heartbeat BP varies between a maximum (systolic) and a
minimum (diastolic) pressure and is measured in millimeters of mercury (mmHg)1 Blood
16
pressure is regulated by different mechanisms acting either rapidly or slowly to maintain it
within normal range for optimal cellular performance3132
Intrinsic Regulation
Intrinsic factors regulating BP include stroke volume and heart rate which both influence
cardiac output31 Stroke volume depends on the volume of blood that fills the ventricles and
this depends on the preload and afterload33 A higher afterload will decrease stroke volume
causing low cardiac output and low BP and vice versa When cardiac output increases more
volume is derived from the venous pool increasing preload Similarly an increased heart rate
will lead to increased cardiac output and BP3134
Reflex Regulation
The baroreceptors within the aortic arch and carotid sinuses contain sympathetic and
parasympathetic nerve fibres3435 These are sensory nerves which run from the medulla
and they respond to stretch of the tissue in which they lie by increasing or decreasing the
rate of signaling36 and act fast in regulating BP34 Sympathetic stimulation causes
increased heart rate and widespread vasoconstriction to increase BP while
parasympathetic stimulation produces the opposite3537
Hormonal Regulation
Hormones regulating blood pressure include renin-angiotensin-aldosterone and
antidiuretic hormone (ADH) They act slowly by responding to changes in intravascular
volume and osmolality38 Angiotensin II is a potent vasoconstrictor and stimulates the
release of aldosterone from the adrenal gland39 Aldosterone increases sodium absorption
and fluid retention leading to increased BP ADH is a potent vasoconstrictor and plasma
volume regulator and its stimulation results in fluid retention and vasoconstriction39
Other hormones regulating BP include the sex hormones thyroid parathyroid cortisol
and ACTH They act on the rennin-angiotensin-aldosterone system to regulate BP3940
17
Renal Regulation
The kidneys control blood pressure through the retention and excretion of extracellular
fluid35 An increase in renal fluid retention will increase extracellular volume and higher
blood pressure whereas increased renal excretion leads to lower blood pressure41 This is
achieved through the action of ADH aldosterone and atrial natriuretic peptide (ANP)41
METHODS OF MEASURING BLOOD PRESSURE
Blood pressure can be measured by invasive and non-invasive methods
1) Invasive (or direct) method - Blood pressure is most accurately measured invasively
through an arterial line4243 It is the gold standard by which the accuracy of other blood
pressure measuring devices and methods are assessed4344 Chyun43 compared direct and
indirect blood pressure readings in 14 intensive care unit patients and found that the
auscultatory method overestimates the systolic and diastolic BP especially if the VI Kortkoff
sounds is used as an indicator of diastolic BP This can often over estimate reading by as
much as 20 mm Hg43 This study is made up of very small sample size to make general
conclusion on the differences in BP values from the two methods compared Although the
invasive method is the gold standard for true BP measurement it is associated with serious
complications related to arterial catheterization and the procedure itself may be technically
difficult It is mainly used in experimental procedures and in monitoring critically ill patients
in intensive care units42
2) Non invasive (indirect) methods These are simpler and quicker than the invasive
method and are commonly used for routine blood pressure examinations They may
however yield lower accuracy and small systematic differences in numerical results43
These methods include-
18
a) Palpation method - A minimum systolic value can be estimated by palpation Deakin
and Low45 reported that a palpable radial femoral or carotid pulse indicates a minimum
systolic BP of 80 70 and 60 mmHg respectively The study was carried out among adults
and these values could not be applicable in children and neonate whose maximum
systolic BP may be lower than the reported minimum values A more accurate systolic BP
value can be determined by inflating and then deflating sphygmomanometer cuff while
palpating the pulse The systolic BP corresponds to the pressure at which the radial pulse
becomes palpable45 Its disadvantages are that pressure obtained is usually 2-5mmHg less
than those obtained by auscultation and diastolic BP cannot be measured32
b) Auscultation method- Also called the Korotkoff method is the method of choice in
clinical practice142 It involves using a stethoscope and a sphygmomanometer46 The
mercury sphygmomanometer is the gold standard for BP measurement A Riva-Rocci
cuff 27 is placed over the arm and inflated to occlude the brachial artery It is then
gradually deflated until blood flow is re-established accompanied by a tapping sound
which can be detected by the stethoscope held over the artery Five sounds are
traditionally heard and classified into phases30 The first phase corresponds to the systolic
BP while the last or fifth phase corresponds to the diastolic BP30 The fourth phase
alternatively is used to measure the diastolic pressure if a 10 mmHg or greater
differences exist between the initiation of phases fourth and five or if the fifth sound is
heard down to 0 mmHg8 This may occur in cases of high cardiac output or peripheral
vasodilatation children or in pregnancy This method though the method of choice in
clinical practice may however be associated with errors arising from faulty technique and
equipment4748 as well as observer bias49 This method was used for this study because of
its widespread general usage its reliability and accuracy Unlike other methods the
instruments (mercury sphygmomanometer and stethoscope) do not require any
19
calibration and values obtained do not require validation by other methods The standard
World Health OrganizationCenter for Disease Control (WHOCDC) blood pressure
reference percentile tables were generated using the mercury sphygmomanometer hence
the auscultation method is the gold standard for BP evaluation258
The aneroid sphygmomanometer measures BP by mechanical system of metal
bellows that expand as the cuff pressure increases in a series of levers that register the
pressure on a circular scale The hybrid shygmomanometer combines some of the features
of the two and uses an electric transducer to record blood pressure2
c) Oscillometric technique- This uses the oscillometric device Oscillation of pressure in a
sphygmomanometer cuff is recorded during gradual deflation The point of maximum
oscillation corresponds to the mean arterial pressure50 The oscillation begins well above
systolic BP and continues below diastolic BP so that systolic and diastolic BP can only
be estimated indirectly according to some empirically derived algorithm
d) Ultrasound method - This uses an ultrasound transmitter and receiver placed over the
brachial artery under a sphygmomanometer cuff As the cuff is deflated the movement of
the arterial wall and systolic BP cause a Doppler phase shift in the reflected ultrasound
The diastolic BP is recorded as the point of diminished arterial motion51 Its advantage
includes the ability to detect diastolic BP in atrial fibrillation and hypotension where
Korotkoff sound is faint152
FACTORS AFFECTING BLOOD PRESSURE IN ADOLESCENTS
Several inter-related factors affect blood pressure These include-
Age - A progressive BP elevation with age has been observed in several studies2153-55
The rate of rise varies in boys and girls5455 The average systolic increase ranges between
20
166 and 286 mmHgyr for boys and 144 and 263mmHgyr for girls while that of
diastolic BP ranges from 083 and 177mmHgyr for boys and 077 and 148mmHg for
girls2155 Bugaje Yakubu and Ogala21 studied blood pressure pattern among 2035
adolescents in Zaria and found a consistent rise of BP with age The rate of rise was fairly
constant until 11-13 years in boys and 12-14 years in girls when the rise became rapid A
similar study53 also found a BP rise with age among 650 healthy school children in Jos In
a large population studies in Lebanon56 and Saudi Arabia55 BP was similarly reported to
increase consistently with age Rapid growth and biological maturation of organs which
are normal occurrences during adolescence were thought to be responsible rather than the
chronological age56 The results of these studies showed increasing blood pressure with
age despite the fact that one study55 used oscillometric method for their study while the
standard auscultation was used in the other studies Also the studied sample sizes across
these studies varied greatly with sizes of 65053 203521 571054 and 1622655 Despite this
the findings were similar
Gender ndash Results of studies on the effect of gender on BP showed that sex positively
affects blood pressure2153-55 Merhi Al-Hajj and Al-Tannir et al54 studied BP pattern in
5710 Lebanese school children while Al-Salloum El-Mouzan and Al-Herbish et al55
studied BP pattern in 16226 Saudi children and adolescents The authors reported a
higher BP in girls than boys at all ages A study21 of BP pattern in adolescents in Zaria
Nigeria demonstrated an initial higher BP in boys before puberty which reversed with the
onset of puberty up to the age of 14-15yrs when it reversed again to be higher in boys
Akinkugbe Akinwolere and Kayode56 reported no sex differences in adolescent BP in
Ibadan The reported sex difference is said to be likely due to differences in sex hormone
and pattern of growth in boys and girls57 Differences in age range of the study population
may however be responsible for the observed BP variation For instance these studies5455
21
comprised of both adolescents and pre-adolescent age groups combined in one study
while the other two studies2156 were purely adolescents21 Blood pressure is reported to be
equal in both sexes before adolescence after which the gender difference starts to
manifest most likely due to physical and hormonal changes
Socioeconomic Factors - Belonging to either end of the socioeconomic strata is found to
be associated with elevated blood pressure5859 A study in Ibadan56 reported an inverse
relationship between parental socioeconomic status and level of BP in adolescents The
authors suggested that this might be the result of the health behaviours and problems
characteristic of the lower socioeconomic class On the other hand Ejeke Ugwu and
Ezeanyika et al60 in Lokoja and another study53 in Jos both found higher BP in children
from high socioeconomic class Colhoun Hemminway and Poulter61 in a meta-analysis of
BP and socioeconomic status in developed and developing countries found an inverse
relationship of BP with socioeconomic status in developed nations and a direct correlation
in developing countries These different findings may be due to methodological
differences in socio-demographic stratification For instance Akinkugbe and
colleagues59 used fatherrsquos level of education for social classification Parentrsquos educational
level may however not equate well with level of family income The other study60 used an
automated device for their study whose values may require validation using the
recommended auscultation method Difference in environmental stresses may also be
different considering the level of development of the areas where the studies were carried
out
GeneticFamilial Factors - The effect of geneticfamilial factors on BP has been
demonstrated in some studies62-64 Familialgenetic correlations reflected in BP and other
anthropometry generally are higher among genetically close relatives such as brother-
sisters or parent-offspring than among spouses62 Levshit and Gerber63 surveyed 514
22
individuals from 135 nuclear families in Russia while Budaruddoza62 studied 1400
individuals from 380 families in India and found significant genetic influence on BP
Mijinyawa Iliyasu and Borodo65 also reported family history of hypertension as risk
factor for developing high BP in a study on prevalence of hypertension among 1000
teenagers in Kano The authors concluded that this could be due to genetic predisposition
They however did not evaluate further to determine the genetic defects The authors did
not also consider shared environmental factors known to influence blood pressure in
individuals Molecular genetic studies have identified genes as possible regulators of
BP6667 These genes regulate the renin-angiotensin-aldosterone system involved in renal
salt handling69 Mutations that increase sodium reabsorption and salt sensitivity is
associated with higher BP and vice versa68 while shared environmental risk factors may
potentiate the development of such familial conditions which might have been
responsible for outcome of the above studies6364
Environmental Factors ndash Environmental factors greatly influence BP variation in a
population592269 Akinkugbe and Ojo70 reported a consistently higher BP in Nigerian
adolescents than their counterparts of similar ages in black and white American children
The authors are of the view that this could be due to different environmental factors of the
study population Obika Adedoyin and Olowoyeye22 studied BP pattern in 2526
children aged 1-14 years in rural semi-urban and urban communities in Ilorin Nigeria
and demonstrated a hypertension prevalence of 95 in urban compared to 63 in rural
communities This was similar to the study59 in Ghana and Gambia69 The authors592269
argued that the differences were due to socioeconomic status which is higher in the urban
than the rural areas The BP variation could be accounted for by the nature of dietary
intake since the rural communities generally consume more of natural foods with less salt
and lsquojunk foodsrsquo compared to the urban populace This was demonstrated by one study61
23
which reported higher mean BP among urban communities in developing nations due to
changes in their dietary pattern Rural areas are also less exposed to the stress and hassle
of the urban cities It is of interest to note however that urban areas are a mixture of
social classes as a result of migrant workers seeking lsquogreener pasturesrsquo Okagua Anochie
and Akani71 on the other hand reported higher mean BP among rural adolescents than
their urban counter parts in Port Harcourt The authors could not identify the reason(s) for
their finding but concluded that the seemingly protective privilege of rural life may be
fading gradually The differences in the reports could however result from the sample size
composition comprising of preadolescents22 adolescents71 and adults69
Race - Higher BP levels have been reported in African-American and Hispanic school-
age children than their Caucasian counterparts and among African-Americans than the
Hispanics7273 Akinkugbe and Ojo70 demonstrated a consistently high systolic and
diastolic BP in Nigerian children compared with black and white American children of
similar age Exposure to chronic environmental stress low socioeconomic status and high
obesity rate among African American and Hispanic youths could contribute to higher
BP72-74 It can be inferred from the study that race alone may not be responsible for the
observed differences but shared environmental factors and socioeconomic status may be
contributory77 Other studies7475 however found no significant BP differences in relation
to race
Anthropometry and blood pressure (BP) - A positive correlation has been observed
between BP and anthropometry in various studies58-5977 These studies585678 observed a
significant correlation between systolic BP and weight height and body mass index
(BMI) in boys but only with weight in girls Body mass index (BMI) is used as a
measure of overall obesity but it is known to be a poor indicator of actual body fat79
Waist circumference (WC) is an aggregate measurement of the actual amount of total and
24
abdominal fat accumulation80 It is therefore a better predictor of BP and other
cardiovascular diseases8081 Guagnano Ballone and Colagrande et al81 studied the
relationship between BP and BMI WC and waist hip ratio (WHR) in 461 people and
found WC to be the most consistent anthropometry affecting BP It is of interest to note
that the study by Guagnano et al81 was in adults population while the other studies56-59
were in children and adolescents WC was also found to be a better predictor of BP in an
Italian study8081 while it was not in others56-6982 Comparing BMI and waist
circumference and their effects on BP Arauzo Lopes and Moriera et al83 in Brazilian
children found BMI to be a better predictor of BP than waist circumference This was
similar to the study by Sebanjo and Oshikoya82 in Nigerian adolescents in Akure Thus
waist circumference measurements may not be useful in the evaluation of obesity andor
hypertension in children and adolescents This may partly be explained by the uniform fat
distribution due to hormonal effect at puberty in adolescents compared to the
disproportionate fat distribution in adults Possible mechanisms for the positive
relationship between BP and high BMI includes decreased physical activity increased
salt intake impaired pulmonary functions and development of metabolic abnormalities
such as dyslipidaemia and insulin resistance8084
Nutritional factors - Diet has been a primary link between humans and their environment
and substantial evidence supports the concept that multiple dietary factors affect BP85
Well-established dietary modifications that lower BP are reduced salt intake increased
potassium intake increased protein particularly plant protein high vegetable and
polyunsaturated fats85 High sodium intake on the other hand is said to be associated with
elevated blood pressure86 A series of 3 large controlled feeding studies tested the effects
of dietary patterns on BP86-89 Of the 3 diets studied the dietary approach to stop
hypertension (DASH) emphasized fruits vegetables low-fat dairy products whole
25
grains poultry fish nuts potassium magnesium calcium and fibre as the most effective
diet89 Among all participants the DASH diet significantly lowered mean systolic BP by
55 mm Hg and mean diastolic BP by 30 mm Hg each net of changes in the control diet
DEFINITION AND CLASSIFICATION OF ADOLESCENCE
Adolescence is the transitional stage between childhood and adulthood during which many
life patterns are learnt and established90 According to World Health Organization (WHO)
adolescents are individuals between the age range of 10-19 years17 The most significant
feature of adolescence is puberty characterized by an exceptionally rapid rate of biological
growth and development including physical and sexual maturation9091 The pubertal changes
have been described by Tanner and Marshal92 and are grouped into five stages This utilizes
definite criteria for growth and development of secondary sexual characteristics like pubic
hair and breast in females and pubic hair and genitalia in males9092 The timing of these
events and the rate of growth vary due to genetic and environmental factors in different
populations92 Adolescence is divided into early middle and late periods17
Early adolescence (10-13 years) ndash This is a period of rapid growth and development of
secondary sexual characteristics and varies according to sex It corresponds to Tanner stages
1 and 290 The main features of this stage are breast bud development and menarche in girls
while testicular enlargement and seminal emission occurs in boys93
Middle adolescence (14-16 years) ndash In this stage rapid growth decreases and there is more
cognitive development as the adolescents move from concrete thinking to formal operation
and develop greater competence at abstract thinking91 This corresponds to Tanner stages 3
and 4
Late adolescence (17-19 years) ndash Here slowing of physical changes continue which permits
the emergence of a more stable body image Cognition tends to be less self-centered with
26
demonstration of care for others with increasing thought about concepts such as justice
patriotism and history It corresponds to Tanner stage 59092
ADOLESCENCE AND BLOOD PRESSURE
Adolescence is characteristically associated with increasing blood pressure because of the
physical growth and hormonal changes associated with puberty5794 After the age of one year
normal BP increases more during puberty than probably at any other time in an individualrsquos
lifetime95 Wanzhu Eckert and Saha et al57 examined data from a cohort of 182 normotensive
children in Indiana who had blood pressure measurements taken semi-annually for up to 12
yr The authors found that the rate of change in BP and weight peaked at the age of maximum
pubertal growth spurt (PGS) This BP spurt roughly coincides with growth spurt during
puberty94 Surveys of BP patterns from childhood through adolescence shows systolic and
diastolic pressures increase with age and in adolescents the increase in males is more marked
than in females especially the systolic pressure5458229495
CLASSIFICATION OF BLOOD PRESSURE IN ADOLESCENTS
The National High Blood Pressure Education Program Working Group (NHBPEPWG) of the
United States established guidelines for the definition of normal and elevated blood pressures
in children in 19876 These guidelines were revised in 20048 The definition of childhood
hypertension in the guidelines are based upon the normative distribution of blood pressure
(BP) in healthy children rather than clinical outcome data as in adults The guidelines
classified BP as normal prehypertensive or hypertensive Hypertension is graded into stage
one and two8
Normal BP - Blood pressure lt90th percentile for age sex and height Children and
adolescents with normal BP should be followed annually from the age of 3 years5 They
27
should be encouraged to maintain a healthy life style such as good dietary intake physical
activities and adequate rest8
Pre-hypertension - Blood pressure between the 90th and lt 95th or if BP exceeds
12080mmHg (even if lt90th percentile) but lt95th It was previously called high normal
BP This new description was introduced to help identify children at risk for the
development of persistent hypertension for whom targeted prevention programmes would
be most beneficial96 While recommendations for the diagnosis of hypertension in
children require that BP remains elevated on three separate occasions repeated
measurements are not necessary to classify an adolescent as pre-hypertensive11 The
prevalence of childhoodadolescence pre-hypertension in US is reported to be between
12-1796-98 In Nigeria Ejeke Ugwu and Ezeanyika99 in a study of the prevalence of
point prehypertension and hypertension in 843 adolescents in Lokoja reported a
prevalence of point prehypertension of 222 and 250 in semi urban and urban
communities respectively Ujunwa Ikefuna and Nwokocha et al100 reported 175
prehypertension prevalence among adolescents in Enugu Among adults with pre-
hypertension it is reported that as much as 10 per year develop hypertension101 There
is little information on the time course for children and adolescents with prehypertension
developing hypertension A value of between 11-7 per year has been reported in US
adolescents98 There is no known study on rate of progression of prehypertension to
hypertension in Nigerian adolescents The NHBPEP recommended that children with
pre-hypertension should have their BP checked after every six (6) months to monitor for
progression to hypertension They should be encouraged to engage in physical activity
healthy dietary behaviours and weight management if overweight Pharmacologic therapy
is not indicated except if there is strong evidence of renal disease heart failure left
ventricular hypertrophy or diabetes mellitus8
28
Hypertension Hypertension is BP persistently equal to or above the 95th percentile for
age sex and height measured on three or more separate occasions If the blood pressure
measurement obtained is gt 95th percentile the degree of hypertension should be staged
Stage 1 hypertension- BP value between the 95th and the 99th percentile plus 5mmHg It
is recommended that BP should be rechecked in 1ndash2 wks or sooner if the patient is
symptomatic If persistently elevated on 2 additional occasions it should be evaluated or
referred to source of care for pharmacologic treatment within 1 month 8
Stage 2 hypertension- BP value gt99th percentile plus 5mmHg This stage calls for more
prompt evaluation and commencement of pharmacologic therapy102 It is recommended
that the individual be evaluated or referred to source of care within 1wk or immediately if
the patient is symptomatic8
Aetiology of hypertension
Hypertension is classified as primary (essential) when there is no identifiable cause
or secondary if due to an underlying disease31 Factors such as heredity diet stress drugs and
obesity play a role in the development of essential hypertension103104 Causes of secondary
hypertension include umbilical artery catheterization renal diseases coarctation of the aorta
and endocrine disorders105106 Aderele and Sereki6 in their study of hypertension in children
reported hypertension secondary to renal pathology as the commonest cause of elevated BP
in children This study was mainly in preadolescent population in which secondary
hypertension is a common finding On the other hand Antia-Obong and Antia-Obong107
reported no apparent cause in greater than 90 of the studied subjects with elevated BP and
also reported proteinuria of 1 in the same population without any associated elevated blood
pressure The study did not however evaluate the etiology of the proteinuria A study65 of BP
in teenagers in Kano found family history of hypertension a risk factor in the study
population Another study in Enugu100 examined modifiable risk factors associated with
29
hypertension in 2694 adolescents and found only 1 and 06 of the hypertensive subjects
to be overweight and obese respectively The authors also found that smoking and alcohol
consumption were not significant risk for hypertension This may however be due to the
shorter period of consumption of these products by the students as a cumulative effect from
long term consumption is known to be associated with adverse health outcomes
Prevalence of hypertension in adolescents
The prevalence of hypertension in adolescents varies widely due to arbitrary and imprecise
definition by different researchers It was in view of this that the National High Blood
Pressure Education Program Working Group (NHBPEPWG) of the United States established
guidelines for the definition of normal and elevated blood pressures in children and
adolescents for uniformity68 In the USA the prevalence is about 20 in normal weight and
50 in their obese counterparts108 A prevalence rate of 77109 10554 and 223110 has
been reported in Spain Lebanon and South Africa respectively In Kano Nigeria a study65
on the prevalence of hypertension among 1000 teenagers found a prevalence of 72 Similar
study in Enugu100 on the prevalence of hypertension among 2694 secondary school
adolescents reported a hypertension prevalence of 54 It is of interest to note that different
prevalence was reported because of the different methodology used by the authors While the
study in Kano65 applied the adult blood pressure criterion of BP greater than 14090mmHg as
hypertension the study in Enugu100 used blood pressure greater than 95th percentile for age
and sex Also the study in Kano65 took a single set of measurement while the study100 in
Enugu measured blood pressure of the subject three times at weekly intervals Bugaje
Yakubu and Ogala21 on the other hand defined hypertension as blood pressure greater than
two standard deviations from the mean and also took six readings over thirty minutes and got
a prevalence of hypertension of 34 A prevalence rate of 48107 and 9522 in Southern
and Western region of the Nigeria respectively was also reported It is obvious that because
30
of the various defining criteria for hypertension in adolescents the prevalence of adolescent
hypertension remains imprecise
Clinical presentation- Hypertension is usually asymptomatic unless it has been
sustained or is rising rapidly109 Adolescents with essential hypertension are usually
detected during routine evaluation96 Non-specific symptoms such as lethargy headache
dizziness drowsiness visual disturbance and confusion may be present109 These could
also be signs of complications111 Secondary hypertension may show obvious features of
the underlying disease such as growth failure heat intolerance abdominal stria tremors
body swelling and haematuria8102 Croix and Feig112 studied the spectrum of symptoms in
409 children aged 7-18 years newly diagnosed hypertensive in Texas USA and reported
15 common symptoms than in the controls The symptoms were said to resolve after
commencement of antihypertensive medications The authors concluded that hypertensive
children had a variety of non-specific symptoms The three most common symptoms
reported were headache daytime tiredness and difficulty initiating sleep The study
however did not specify if other possible causes of these symptoms were excluded
Complications of hypertension - Hypertension is usually asymptomatic in adolescents
which if left unidentified overtime can cause serious complications109 Organs commonly
affected in the complication of hypertension are the heart kidneys brain and the eyes
leading to lowered life expectancy and premature death13 Left ventricular hypertrophy
(LVH) is the most prominent clinical evidence of end organ damage10 Studies have
shown that LVH can be seen in as many as 41 of patients even in adolescents with
asymptomatic hypertension10103 Adolescents with severe cases of hypertension are also
at increased risk of developing hypertensive encephalopathy seizures cerebrovascular
accidents and congestive heart failure103109 However data documenting such
complications in children and adolescents are generally lacking In a study of
31
hypertension among teenagers in Kano the researchers65 could not find any
complications in all the 1000 teenagers studied
Investigations and treatment- Basic investigations are all that may be required in
adolescents who are obese and with a family history of hypertension stage 1 disease and
normal findings on physical examination113 This is because primary hypertension is
commoner in adolescents Adolescents that are symptomatic or with stage 2 hypertension or
have features of secondary hypertension should be evaluated in more detail
Treatment of hypertension includes non-pharmacological and pharmacological
methods Non-pharmacologic management involves life style modification such as weight
reduction increased physical activities and dietary adjustment114 In a study to evaluate the
effect of diet and salt on treatment and prevention of hypertension Sacks Svetkey and
Vollmer et al86 reported the beneficial effect of both reduced salt intake and appropriate
dietary adjustment in the control of hypertension Similar benefits were reported in other
studies8788 Although both studies had fairly good sample size (n=412) the studies did not
specify if participants were on other substances or activities other than antihypertensive that
might have affected their BP The studies were also in adults and whether it has the same
effects in children and adolescents has not been evaluation However there is no doubt that
the outcome will be similar in adolescents as dietary modifications have been advocated as
non-pharmacologic management in them Non pharmacologic treatment is usually the initial
treatment in essential hypertension and as adjuvant to drug therapy in those with secondary or
complicated hypertension101114 Pharmacologic (drug) treatment includes diuretics beta-
blockers calcium channel blockers angiotensin converting enzyme inhibitors (ACEIs) and
angiotensin receptor blockers (ARB) among others106114 They are used in those with
symptomatic disease and in acute or chronic complications106
32
Prevention of hypertension may be viewed as part of the prevention of cardiovascular
disease102 In adolescents approaches to prevention include reduction in obesity
discouraging cigarette smoking and alcohol intake113 reduction in sodium intake and increase
in physical activity through community and school-based programmes103104 Growth
monitoring BP check during preventive care visit physical activity and urine screening for
proteinuria and haematuria can be used starting from early childhood
33
AIM AND OBJECTIVES
GENERAL AIM
To determine the blood pressure pattern of apparently healthy secondary school adolescents
in Jalingo Taraba State
SPECIFIC OBJECTIVES
To determine
1 Blood pressure pattern in relation to age and sex among adolescents aged 10-19
years
2 The relationship if any between blood pressure and the anthropometric parameters of
weight height BMI and waist circumference
3 The association between blood pressure and parental social-economic status
4 The point prevalence of prehypertension and hypertension in adolescents
34
MATERIALS AND METHODS
Study area
A cross-sectional survey of the blood pressure pattern of apparently healthy secondary
school adolescents aged 10-19 years was conducted in Jalingo over a six month period
from January to June 2014 Jalingo is the capital of Taraba State and lies within the
savannah belt of North Eastern Nigeria It lies between latitude 80 54rsquo north and longitude
110 21rsquo east and at an altitude of 360 meters above sea level115 Jalingo had a population of
118198 people18 The primary inhabitants are the Konas Mumuyes and Fulanis who are
mostly farmers Other indigenous ethnic groups include the Jukun Kuteb WurkumTiv
and host of other tribes The Ibos Hausas Yorubas among others are the non-indigenous
ethnic groups and are mostly civil servants and businessmen Jalingo has a tertiary health
centre the Federal Medical Centre Jalingo and the state specialist hospital It also has 15
private clinicshospital and many primary health care centres There are also tertiary
education institutions including Taraba State University As at 2013 there were 56
secondary schools in Jalingo 24 public and 32 private all of which were mixed schools
except one which is a girlsrsquo only school
Study design
The study was a cross sectional descriptive study of 1350 apparently healthy secondary
school adolescents in Jalingo
Ethical approval
Ethical approval for this study was obtained from the Scientific and Health Ethics Research
Committee of Ahmadu Bello University Teaching Hospital Zaria (Appendix 4) The Taraba
State Ministry of Education also gave the approval and permission to conduct the study in the
35
selected schools Consent was given by the studentsrsquo parents or guardian (Appendix 2) All
students whose parents gave consent voluntarily participated in the study
Sample size determination
The minimum sample size was calculated using the formula116
N=Z2 (pq) E2
Where N = minimum sample size
p = Prevalence of hypertension in adolescents A prevalence of 3421 was used
q = 1- p
E = margin of error tolerated =1
Z = 196 at 95 confidence level
N = 1962 x 0034 x (1-0034) 0012 = 1262
Therefore the minimum sample size was one thousand two hundred and sixty two
Allowance for non-responders of 5 63 extra subjects were added to the calculated
minimum sample size bringing the total to 1325 students To enhance representativeness of
the sample and to compensate for missing information and poorly filled proforma while
maintaining the sample size a total of 1350 was decided upon
Inclusion criteria
1 Students (ages 10-19 years) in the selected secondary schools
2 Students whose parents gave consent to participate in the study
3 Students who gave assent to participate in the study
Exclusion criteria
1 Students who had obvious skeletal deformities of the spine and legs which can affect
the height and ultimately the BMI
36
2 Students with known chronic disease (or history of such disease) like anaemia
chronic renal disease and cardiac disease because they are not apparently healthy and
these conditions could affect their blood pressure
3 Students with present or past history of chronic drug ingestion that can affect blood
pressure such as steriods and contraceptives
4 Students with high blood pressure already on antihypertensive
Pilot study
A pilot study was carried out in one of the schools a week before the commencement of
the study The school was selected by random sampling method using balloting and did
not participate in the main study The pilot study was carried out with the aim of
assessing the competence of the research assistants in the various measurements
following their training to ensure reliability It was also used to test the questionnaire
before its use during the main study and to provide information on the number of students
that can be measured in a day Consequently twenty students had their blood pressure
and anthropometry measured independently by the researcher and the research assistants
and data were compared using Students t-test There were no statistically significant
differences between the measurements The result of the pilot study is highlighted in
Table I It was also found that some parts of the questionnaire were not well understood
by most students and were adjusted appropriately in the main study (Appendix 1) The 20
students had their measurements done over a period of 3-4 hours (between 8am - 12noon)
by the researcher and the research assistants
Table I Result of pilot study
Variables Researcher Research t p
37
assistants
Mean(plusmnSD) SBP
mmHg
106(11) 104(12) 0550 0586
Mean(plusmnSD) DBP
mmHg
617(83) 63(10) 0450 0657
Mean(plusmnSD) Weight
kg
544(82) 527(122) 0520 0608
Mean(plusmnSD) Height m 16(01) 16(01) 0000 1000
Mean(plusmnSD) BMI
kgm2
198(36) 202(33) 0370 0716
Mean(plusmnSD) WC cm 692(72) 682(133) 0300 0769
Sampling method
Students were selected by multistage random sampling technique The list of secondary
schools obtained from the Taraba State Post Primary Schools Board served as the sampling
frame for schools There were 56 secondary schools 24 of which were public and 32 were
private schools a ratio of 113 Ten (10) schools were randomly selected by balloting four
(4) from public schools six (6) from private based on the number and approximately similar
ratio of private to public schools of 115 (46) Ten schools were selected to ensure wider
coverage and even distribution of students so that it could be truly representative of the
community All the ten schools had an overall total of eight thousand one hundred and seven
(8107) students The public schools had a total of five thousand nine hundred and forty
(5940) with nine hundred and eighty nine (989) students participating The private schools
had a total of two thousand one hundred and sixty-seven (2167) students with three hundred
and sixty one (361) participating These number (989 and 361) was calculated based on the
38
relative population of each school and proportionate to number of students in each school
Thereafter the number of students to participate per school was calculated proportionately to
the number of students in each school based on the number given by the school authority
Then the number in each class was also calculated proportionately from JSS1 to SS3 to
ensure fair and equal chance of participation for all age groups The calculation was done
thus n= a b x c
Where n= number of students per selected school
a= total numberpopulation of students in the school
b= total numberpopulation of students in all 10 selected schools (8107)
c= calculated total sample size (1350)
Students in each class from junior secondary school (JSS) 1-3 and senior secondary school
(SS) 1-3 were then randomly selected by balloting The number of selected schools total
number of students in a school and the number of students selected per school is outlined in
Table II
Table II Selected schools and number of students in each of the ten schools in Jalingo
Selected schools Total no of No of students
39
student in the
school (a)
n=8107
selected (n=abxc)
n=1350
Public schools
Govt Science Secondary School 2800 466
Govt Day Secondary School SGari 1200 200
Salisu Dogo Secondary School 1100 183
Govt Secondary School Magami 840 140
Total 5940 989
Private schools
Winners Comprehensive Secondary School 650 108
Hawai Secondary School 562 94
Centre for Quranic Science and Islamic Education 543 90
Good Success Secondary School 155 26
Jetters Academy 140 23
Yagai Academy 117 20
Total 2167 361
The study
The first contact with the students was a familiarization exercise to each of the schools during
which the teachers and students were given a talk by the researcher on blood pressure and the
40
importance of periodic blood pressure measurement They were given the opportunity to ask
questions which were responded to Both the students and their teachers actively participated
in the lectures
On the second day students were selected as described above and those selected
underwent general physical examination in the presence of a chaperon to identify those
who did not fulfilled the inclusion criteria Each selected student was given a proforma
(Appendix 1) in which information on their biodata and medical history were recorded
Other information obtained was parentrsquos medical history and their socioeconomic status
using the format described by Olusanya Okpere and Ezimokhai117 (Appendix 3) The
study was carried out in a relatively quiet and empty classroom to ensure privacy for both
male and female students The procedure for blood pressure measurement was
demonstrated on one of the research assistants and sometimes on one of the teachers by
the researcher to assure the students and allay their anxiety BP and anthropometric values
obtained were recorded in the study proforma An average of 15-20 students per day were
attended to over a period of 3-4 hours (between 8am - 12noon daily) by the researcher
one of the research assistants who is a medical officer a male nurse and a lady Youth
Corper (NYSC)
Blood pressure measurement
This was measured by the researcher and the research assistant (the medical officer) The
standard auscultation method was employed using a mercury sphygmomanometer (Acosson)
and a standard Littman stethoscope according to the guideline of the fourth report on the
diagnosis evaluation and treatment of hypertension in children and adolescents8 Each
students was rest-seated for 5 minutes before BP measurement With the student seated the
right arm rested on a table at the level of the heart an appropriate cuff size which covered
41
two-third (23rd) of the length of the arm was applied round the arm about 2cm above the
antecubital fossa Two cuff sizes were used for this study with dimensions of 10 x 24cm and
13 x 30cm the smaller cuff for the smaller adolescents and vice versa The bladder cuff was
inflated rapidly to 20-30mmHg above the point where the brachial artery was no longer
palpable The bell of the stethoscope was then placed over the brachial artery and the cuff
was deflated slowly at 2-5mmHgsecond while listening to the Korotkoff sounds Phases one
and five of the Korotkoff sounds were recorded as the systolic and diastolic BP
respectively119 Three recordings were taken at intervals of 3-5 minutes and the average was
the final BP in mmHg BP was interpreted based on the standard set by the fourth report on
the diagnosis evaluation and treatment of hypertension in children and adolescents of the
United States8 thus-
Normal BP ndash BP value between the 5th and lt 90th percentile for age sex and height
Prehypertension - BP value between the 90th and the lt95th percentile for age sex and height
or BP of 12080mmHg but less than the 95th percentile
Hypertension ndash BP value ge95th percentile for age sex and height
Students found to have prehypertension were educated and counseled on life style
modifications and the need to have their blood pressure checked in six monthsrsquo time and
annually subsequently Those with hypertension were educated on the implications of the
findings and were referred to the Federal Medical Center Jalingo for evaluation management
and follow-up
Height measurement
Height was measured in centimeters using a locally constructed stadiometer by the research
assistants Each student was measured barefooted standing with the heel back and occiput
42
against the stadiometre The head was held straight looking forward with the lower border of
the eye socket at a horizontal plane with that of the external auditory meatus The movable
part of the stadiometre was adjusted to rest on the vertex and the corresponding value read to
the nearest 01cm
Weight measurement
The weight was measured in kilograms by the researcher and the research assistants using a
bathroom scale (HANSON) Students were weighed in their approved school uniform
without caps head ties or cardigan and with their shoes removed The scale was checked
daily for accuracy using standard calibrated weight before and midway through each session
The weight of the student was measured to the nearest 01 kg
Body mass index (BMI)
This was calculated from the measured weight and height of the subject using the
formula118
BMI= Weight (kg) Height (m2)
Waist circumference measurement
WC was measured in centimeters using a measuring tape by the research assistants The
male assistant measured for boys and the lady Youth Corper measured for girls
Measurement was taken with the student standing completely relax and breathing
normally Clothing was pulled up or down and an inelastic measuring tape was placed
around the waist mid-way between the iliac crest and the lowest rib margin The ends of
the tape were pulled together lightly towards each other and the value read to the nearest
01cm117120
43
Data analysis
Data obtained were analyzed using Epi-Info statistical software package version 7 The
results obtained were presented in figures tables graphs and charts as appropriate Individual
mean BP levels were used as dependent variables and other measured variables as
independent variables The means and standard deviations were used to summarize
quantitative variables such as BP weight height waist circumference and BMI The chi-
squared test was used to test the significance of associations between categorical variables
Studentrsquos t-test was used to compare means of any two normally distributed continuous
variables Pearsonrsquos correlation coefficient and regression analysis were used to examine the
strength of association between BP and the anthropometries Probability level of statistical
significance value was set at lt005
RESULTS
General characteristics
A total of 1350 students were enrolled between January and June 2014 to determine their
blood pressure pattern 628 (465) were males and 722 (535) were females with
malefemale ratio of 111 Students enrolled in the study were drawn from both public and
44
private schools The number of students from public schools was 989 (733) while 361
(267) were from private schools as shown in Table II The mean age of the study subjects
was 153plusmn22 years with a range of 10-19 years The age and sex distribution of the students
is illustrated in Table III
Table III Age and sex distribution of 1350 study subjects in Jalingo
Ag
e
Male
n ()
Female
n ()
Total
N()
10 9(14) 13(18) 22 (16)
11 20(32) 31(43) 51(38)
12 36(57) 52(72) 88(65)
13 96(153) 85(118) 181(134)
14 92(146) 115(158) 207(153)
15 92(146) 111(154) 203(151)
16 66(105) 116(161) 182(135)
17 78(125) 91(126) 169(125)
18 79(126) 70(97) 149(110)
19 60(96) 38(53) 98(73)
To
tal
628(100) 722(100) 1350(100)
45
Socio-economic classes (SEC) ndash Most of the students were from the lower social classes
(4 and 5) with population of 650 (415 and 235) students The upper social classes (1 and
2) had the least population with 184 (62 and122) students The middle social class (3) had
516 students The distribution of the study subjects according to individual
socioeconomic class is shown in Figure I
Figure 1 Socioeconomic class distribution of students in Jalingo
Anthropometry
The anthropometric characteristics of the students are displayed in Tables IV V and VI
All the anthropometric parameters showed increasing values with age (Tables V and VI)
There were significant differences in the anthropometric indices of height (p=0000)
weight (p=0010) and body mass index (p=0000) between boys and girls but not
statistically significant for waist circumference (p=0145) as shown in Table IV
Weight ndash The mean weight of the students was 486plusmn109kg with a range of 23-100kg
(Table IV) Girls were heavier than boys up to middle adolescence after which males
46
were heavier than the females (Table V and VI) and this was statistically significant (t= -
256 p=0010)
Table IV Overall mean anthropometric measurements of the study subjects
Anthropometr
y
Male Female Total
n=628 n=722 N=1350 t p
Wt (kg)
Mean(plusmnSD) 4773(115
)
4926(103
)
4855(plusmn109
)
-
25
6
0007
Range 236-848 227-100 23-100
Ht (m)
Mean(plusmnSD) 159(012) 157(008) 158(plusmn010) 35
5
0000
Range 122-185 126-179 122-185
WC (cm)
Mean(plusmnSD) 6524(91) 6595(86) 6562(plusmn89) -
14
6
0145
Range 225-905 215-100 22-100
47
BMI (kgm2)
Mean(plusmnSD) 1825(27) 1947(33) 1891(plusmn31) -
74
1
0000
Range 117-325 114-42 114-42
Statistically significant p values at 005 level of significance Wt=Weight Ht=Height WC=Waist
Circumference BMI=Body Mass Index SD=Standard Deviation
Height- The mean height of the study population was 158plusmn09m and ranged from 122-
185m (Table IV) Girls were taller than boys at early and middle adolescence but these
reversed from 16 years in favour of the boys (Table V and VI) This differences was
statistically significant (t=448 p=0000)
Waist circumference (WC) - The overall mean waist circumference was 6562plusmn89cm and
a range of 225-100cm Girls had higher WC until late adolescence (18 years) when it
reversed but this was not statistically significant (t=-146 p=0145) This is displayed in
Tables IV V and VI
Body Mass Index (BMI) - Overall mean BMI was 189plusmn31 with a range of 114-42
There was a statistically significant difference between girls and boys (t=-741 p=0000)
Tables IV V and VI illustrate this findings
Table V Mean anthropometric measurements of 628 boys
Age No of
studen
ts
Wt(plusmnSD)
Kg
Ht(plusmnSD)
m
WC(plusmnSD)
cm
BMI(plusmnSD)
Kgm2)
48
10 9 349(50) 143(001
)
613(06) 169(01)
11 20 354(25) 143(002
)
617(13) 170(07)
12 36 363(51) 146(002
)
616(14) 167(06)
13 96 379(51) 150(003
)
602(40) 165(08)
14 92 412(50) 154(003
)
623(32) 169(08)
15 92 471(60) 160(003
)
634(39) 178(08)
16 66 525(52) 164(002
)
672(24) 192(09)
17 78 555(51) 167(002
)
680(31) 197(08)
18 79 576(61) 169(002
)
707(18) 200(08)
19 60 590(57) 170(002
)
716(16) 203(07)
Total 628 477(115 16(01) 652(91) 183(27)
49
)
Wt=Weight Ht=Height WC=Waist Circumference BMI=Body Mass Index SD=Standard Deviation
Table VI Mean anthropometric measurements of 722 girls
Age No of
students
Wt(plusmnSD)
Kg
Ht(plusmnSD)
m
WC(plusmnSD)
cm
BMI(plusmnSD)
Kgm2
10 13 313(34) 139(001) 582(05) 156(02)
11 31 361(53) 144(002) 611(12) 170(05)
12 52 403(64) 149(002) 625(21) 178(09)
13 85 458(66) 154(002) 657(22) 188(12)
14 115 478(74) 157(003) 627(48) 187(10)
15 111 508(65) 159(002) 666(34) 199(13)
16 116 521(60) 159(002) 678(28) 201(11)
17 91 541(62) 161(002) 681(28) 203(11)
18 70 556(63) 161(002) 696(21) 211(11)
19 38 540(48) 158(002) 688(14) 208(06)
Total 722 493(103) 16(010) 651(23) 190(09)
Wt=Weight Ht=Height WC=Waist circumference BMI=Body Mass Index SD=Standard Deviation
Blood pressure (BP) measurements
50
Table VII shows mean blood pressure distribution of the study population for all ages
The highest SBP and DBP were 165mmHg and 95mmHg at 18years and 15 years
respectively Table VIII displays mean BP distribution in relation to age and sex The
tables show that both systolic and diastolic blood pressure increased with age This is also
depicted in Figure 2
Table VII Mean and ranges of blood pressure of 1350 subjects
Systolic Blood Pressure
(mmHg)
Diastolic Blood Pressure
(mmHg)
Age
No of
students
Mean(plusmnSD) Range
Mean(plusmnSD) Range
10 22 936(74) 80-107 600(50) 47-70
11 51 992(106) 76-120 629(71) 47-83
12 88 1036(110) 80-140 657(60) 53-82
13 181 1042(108) 80-143 660(74) 48-88
14 207 1070(115) 83-150 675(76) 47-90
15 203 1090(119) 80-150 678(82) 47-95
16 182 1122(124) 80-150 696(80) 50-90
51
17 169 1132(118) 90-153 698(83) 48-93
18 149 1138(121) 90-165 712(88) 50-90
19 98 1131(127) 90-143 726(76) 57-90
Total 1350 1089(125) 76-165 683(82) 47-95
Table VIII Mean blood pressure in relation to age and sex
Mean(plusmnSD) Systolic blood pressure
(mmHg)
Mean(plusmnSD) Diastolic blood
pressure (mmHg)
A
ge
Male
n=628
Female
n=722
t p Male
n=62
8
Fema
le
n=72
2
t p
52
10 954(3
9)
923(6
0)
1
02
03
20
619(
32)
586(
46)
1
36
0
01
91
11 985(5
5)
997(9
2)
0
42
0
06
80
648(
39)
617(
57)
1
56
0
01
26
12 999(8
9)
1062(
117)
2
84
0
00
06
653(
29)
660(
52)
-
0
52
0
06
07
13 1012(
73)
1075(
73)
4
03
4
00
00
649(
43)
672(
59)
-
0
03
0
00
44
14 1036(
78)
1098(
78)
3
93
0
00
01
653(
44)
693(
58)
3
90
0
00
01
15 1071(
80)
1105(
87)
2
05
0
00
42
665(
58)
689(
56)
-
2
10
0
00
37
16 1135(
82)
1114(
91)
1
03
0
03
10
697(
51)
695(
61)
0
15
0
08
81
53
17 1152(
87)
1115(
77)
2
04
00
43
698(
59)
698(
58)
0
02
0
09
81
18 1141(
96)
1135(
74)
0
27
0
07
91
704(
62)
721(
63)
1
61
0
02
49
19 1146(
97)
1108(
80)
1
41
0
01
64
733(
63)
714(
43)
1
21
0
02
28
To
tal
1081(
133)
1095(
117)
-
2
05
4
00
40
678(
81)
687(
82)
-
2
07
7
00
38
Statistically significant p values at 005 levels of significance
54
Figure 2 Blood pressure distribution in relation to age and sex
SBP =Systolic blood pressure DBP=Diastolic blood pressure
Blood pressure and stages of adolescence
Table IX displays mean blood pressure according to stages of adolescence Girls had a
higher mean SBP than boys from early adolescence (t=3754 p=0000) to middle
adolescence (t=-3025 p=0003) and this was statistically significant This dominance was
also demonstrated in the DBP and was statistically significant in middle adolescence (t=-
3517 plt0000) Adolescents from private schools had higher mean SBP (t=-222
plt0027) and mean DBP (t=-461 p=0000) than those from public schools and these
differences were statistically significant
Table IX Mean blood pressure according to sex and stages of adolescence
Mean BP
(mmHg)
Age (years)
Male SBP
Female SBP
Male DBP
Female DBP
55
Stages
of
adolesc
ents
(years)
Mean(plusmnSD) systolic blood pressure
(mmHg)
Mean(plusmnSD) diastolic blood pressure
(mmHg)
Male Female t p Male Fema
le
t p
Early
(10-13)
1000(9
6)
1040(1
18)
37
54
00
00
648(
56)
653(
82)
05
99
05
50
Middle
(14-16)
1075(1
29)
1105(1
13)
-
30
25
00
03
670(
81)
694(
77)
-
35
17
00
00
Late
(17-19)
1140(1
28)
1121(1
11)
21
45
00
33
717(
85)
710(
83)
00
70
09
45
1082(1
33)
1092(1
17)
-
20
54
00
40
678(
81)
687(
82)
-
20
77
00
38
Statistically significant p values at 005 level of significance SD=Standard Deviation
Table X shows blood pressure pattern according to stages of adolescence
Prehypertension and hypertension were more prevalent in late adolescence than early and
middle adolescence (χ2=49054 p=0000) and (χ2=10305 p=0006) both of which were
statistically significant
Table X The pattern of normal BP Prehypertension and hypertension according to stages
of adolescence
56
Blood
pressure
pattern
Stages of adolescence
Early
n()
Middle
n()
Late
n()
Total
N()
χ2 p
Normal 290(84
8)
428(72
3)
275(66
1)
993(73
5)
429
79
000
0
prehypertens
ion
43(12
6)
135(22
8)
120(28
8)
298(22
1)
490
54
000
0
Hypertensio
n
9(26) 29(49) 21(51) 59(44) 103
05
000
6
342(10
0)
592(10
0)
416(10
0)
1350(1
00)
350
93
000
0
Statistically significant p value at 005 level of significance
Relationship between blood pressure and the measured anthropometry
There was a positive correlation between SBP and DBP with age and the anthropometric
variables of weight height waist circumference and BMI (Table XI) SBP showed a
stronger correlation with the anthropometries than the DBP and was stronger for weight
(r=051) and height (r=044) The waist circumference though statistically significant
showed the weakest correlation
Table XI Correlation between blood pressure age (yrs) and anthropometry
Parameters
Systolic Blood Pressure Diastolic Blood Pressure
Correlation
coefficient
p Correlation
coefficient
p
57
Age (yrs) 035 lt0000 030 lt0000
Height (m) 044 lt0000 034 lt0000
Weight (Kg) 051 lt0000 038 lt0000
WC (cm) 040 lt0000 029 lt0000
BMI
(Kgm2)
031 lt0000 023 lt0000
Statistically significant p values at 005 level of significance Wt=Weight Ht=Height WC=Waist
circumference BMI=Body Mass Index
Blood pressure distribution and socio-economic classes
Table XII shows mean blood pressure according to socio-economic class of the subjects
Lower social classes had higher mean SBP (t=1650 p=2850) and DBP (t=0193
p=00058) but these were not statistically significant
Table XII Mean Blood pressure in relation to socioeconomic classes
Blood
pressur
e
Socioeconomic classes
Upper (1 amp
2) n=184
Middle (3)
n=516
Lower (4 amp
5)
n=650
f(anova
)
p
Mean
(SD)
10857(126
)
10866(128
)
11040(109
)
1650 285
0
58
SBP
Mean
(DBP)
6820(83) 6791(83) 6957(76) 0193 005
8
SEC= Socioeconomic class SBP=Systolic Blood Pressure DBP=Diastolic Blood Pressure SD=Standard
Deviation
Table XIII shows blood pressure pattern in relation to socioeconomic classes of the
subjects The percentage of students with prehypertension was higher in the upper social
class ((χ2=3067 p=0216) while the percentage of hypertension were higher in the lower
socioeconomic classes (χ2=1037 p=0568) but these differences were not statistically
significant
Table XIII Blood pressure pattern in relation to socioeconomic status
Blood
pressure
pattern
Socioeconomic classes
Upper
(1 amp 2)
n()
Middle
(3)
n()
Lower
(4 amp 5)
n()
Total
N()
χ2 p
Normal 127(69
)
383(74
2)
483(74
3)
993(73
6)
417
6
012
4
Prehypertens
ion
52(28
3)
108(20
9)
138(21
2)
298(22
1)
306
7
021
6
Hypertension 5(27) 25(48) 29(45) 59(44) 103 056
59
7 8
184(10
0)
516(10
0)
650(10
0)
1350(10
0)
573
0
022
0
Prevalence of Hypertension and Prehypertension
Table XIV shows the prevalence of hypertension in the study population The total
number of students with hypertension was 59 giving an overall prevalence of 44
Thirty four students (25) had systolic hypertension sixteen (12) had diastolic
hypertension and nine students (07) had both systolic and diastolic hypertension
Systolic hypertension was more prevalent in the females and was more at the age of 16
years while diastolic hypertension was higher in males and this also occurred at 16 years
Among those with hypertension 27 and 16 subjects had stage 1 and 2 systolic
hypertension respectively With regard to diastolic hypertension 24 and 1 subjects had
stage 1 and 2 hypertension respectively The gender difference in the prevalence of
hypertension is not statistically significant (χ2=0831 p=0362)
The number of students with pre-hypertension was 298 giving an overall prevalence of
221 Of this 131 were males and 167 are females This is illustrated in Table XIV
Prehypertension is more prevalent in females than males and this was statistically
significant (χ2=4349 p=0037)
60
Table XIV Overall Blood pressure pattern and prevalence of hypertension and
prehypertension of 1350 students in Jalingo
Blood pressure
pattern
Males
n=()
Females
n=()
Total
N()
χ2 p
Normal 471(750) 522(723) 993(735) 2619 0106
Prehypertension 131(209) 167(231) 298(221) 4349 0037
Hypertension 26(41) 33(46) 59(44) 0831 0362
628(100) 722(100) 1350(100) 1260 0533
statistically significant p value at 005 level of significance
61
DISCUSSION
The findings of this study showed that the BP of secondary school adolescents in Jalingo
was similar in terms of mean values range and trend of progression with age to that of
other adolescents from Ibadan63 and Kogi60 (Nigeria) Ashanti (Ghana)59 and Lebanon54
The mean value was however lower than the mean BP of adolescents from Zaria
(Nigeria)21 Belgrade ( Serbia)78 and Fortaleza-Cearaacute (Brazil)83 who had higher mean BP
in both sexes and at all ages The lower mean BP in this study compared to that of
adolescents from Zaria21 Belgrade78 and Brazil83 could be due to lower mean
anthropometry of weight height and BMI in adolescents from Jalingo resulting in lower
mean BP The sample sizes of these studies7883 were also different and could have
affected the mean BP of the study population For instance the sample size in the
Brazilian study83 is 151 compared to the study in Lebanon54 with 5710 subjects The use
of the fifth Korotkoff sounds as DBP in this study21 could also have accounted for the
lower mean BP in contrast to a similar study in Zaria21 where the fourth Korotkoff sound
was used as the DBP
A progressive increase in blood pressure with age was found in this study This
was similar to most findings by researchers in Nigeria 215358-606566107 and
worldwide54555961 The peak age of rise in BP in this study was in middle adolescence
between 15-16 years in boys but much earlier in girls for both systolic and diastolic BP
This was similar to the study by Akinkugbe Akinwolere and Kayode56 in Ibadan and
Ejeke Ugwu and Ezeanyika et al60 in Lokoja This age group is usually the period of
onset of puberty The chronologic age is not the main factor responsible for BP increase
62
with age but rather the progressive increase in size of the individual Increase in body
size with growth and maturity of organs associated with the physical and hormonal
changes during puberty potentially lead to increasing BP The simultaneous increase in
weight height and other anthropometric indices alongside BP with age seen in this study
and others is in agreement with that The implication of this increase in blood pressure
with age is that those with prehypertensionhypertension in childhood may continue into
adulthood hence further increasing the high prevalence of hypertension in the adult
population with its attendant morbidity disability and mortality
Overall significant higher mean BP was recorded in girls than boys in this study
This was seen from early to middle adolescence after which it reversed in favour of the
boys Reports on the relationship between BP and sex have been inconsistent Some have
reported higher mean BP in females54-56 others higher in males5883 while yet another
reported no sex differences22 The findings of this study were similar to those of Bugaje
Yakubu and Ogala21 and Ujunwa Ikefuna and Nwokocha100 who reported a consistently
higher mean blood pressure in female adolescents up to 16 years compared to their male
counterparts of similar ages Early female predominance in mean blood pressure was also
reports by Agyemang Redekop and Owusu-Dabo et al59 in Ashanti adolescents in Ghana
and Obika Adedoyin and Olowoyeye22 in Illorin The finding was however in contrast
with the study in Calabar58 where higher mean BP was found in boys than girls at all
ages The reason for the higher mean BP in females than boys could be because of earlier
onset of puberty in girls The differences in blood pressure between boys and girls in this
study could also be accounted for by variation in the anthropometric variables of the
individuals as girls were seen to be heavier and taller up to middle adolescence
This study demonstrated a consistently positive relationship between blood
pressure and the anthropometric variables of weight height body mass index and waist
63
circumference as widely reported in other studies 545558-6165107100 Weight is reported to
correlate positively with blood pressure in several studies53565871 Body mass index
(BMI) also showed a positive relation with BP in this study as reported in other
studies5978-81 This is in-keeping with the findings in Port Hacourt71 Abeokuta83 the
Gambia69 Brazil82 and Belgrade77 children Some of these studies however were made
up of younger and older age groups Even in lean populations BMI is known to correlate
positively with BP Waist circumference was also found in this study to correlate
positively with BP This was similar to reports from other studies79-8183 It was found to
be a better predictor of BP in two Italian study8081 while it was not in another82
Comparing BMI and waist circumference and their effects on BP Arauzo Lopes and
Moriera et al82 in Brazilian children found BMI to be a better predictor of BP than waist
circumference This was similar to the report by Sebanjo and Oshikoya83 in Nigerian
adolescents in Akure Guagnano Ballone and Colagrande et al81 however found waist
circumference to be better than BMI The study81 however involved adults and may not
be applicable in children and adolescents The present study demonstrated BMI and WC
to be significant but found BMI to be a better determinant of BP than waist
circumference BMI and waist circumference measure obesity in an individual Whereas
BMI is a measure of overall obesity WC measures centralabdominal fat accumulation
and thus said to be more predictive of adverse health risk79 Obese individuals may be
prone to such condition as dyslipidaemia insulin resistance and hypertension with
reduction in the quality of life Weight BMI and or waist circumference affects blood
pressure through decreased physical activity increased cardiac output insulin resistance
impaired pulmonary function and other hormonal abnormalities8084 It seems therefore
that BMI is a better predictor of BP in adolescents than waist circumference The reason
64
for this is not obvious but it may be because of the nature of uniform fat distribution in
adolescents associated with growth and hormonal changes at puberty
Blood pressure distribution in relation to the parental socio-economic class in this
study showed that students from low socio-economic classes had higher mean blood
pressure than those from upper socioeconomic classes but this was not statistically
significant A study in Ibadanl56 reported a statistically significant negative relation
between blood pressure and parental socio-economic status It was also similar to the
study58 in Calabar In contrast other studies found the reverse536022 The reasons for the
inverse relationship between BP and socioeconomic includes exposure to chronic
environmental stress with sustained sympathetic nervous system stimulation Others are
poor health seeking behaviours due to low income andor inadequate health knowledge
high low birth weight rate and inadequate healthy diets among others97101 In the same
environment individuals from a high social class are believed to be more educated with
high income61 They have easy access to health education and awareness on hypertension
prevention and control and better accessibility and adherence to medical treatment617374
The former might be responsible for the finding of this study as Jalingo is a semi urban
community Most of its inhabitants are subsistent farmers civil servants and traders with
low income The high number of students in the lower socioeconomic class lays credence
to that
The overall point prevalence of hypertension in this study was 44 while that of
pre-hypertension was 221 This prevalence of hypertension is similar to the prevalence
of 48 by Antia-Obong and Antia-Obong107 but higher than the prevalence rate of 37
reported in Zaria21 and lower than the prevalence of 58 reported in Ibadan56 54 in
Enugu100 and the 72 reported in Kano65 The prevalence of pre-hypertension was lower
than that reported by Ejeke Ugwu and Ezeanyika99 who found a prehypertensive
65
prevalence of 25 among adolescents in Lokoja It is higher than the 173 reported by
Ujunwa Ikefuna and Nwokocha et al100 in Enugu and 12-17 by Redwine and
Daniels96 among US adolescents The differences in the reported prevalence of
hypertension and prehypertension in adolescents could have resulted from the different
criteria applied by the various researchers in defining hypertension For instance whereas
this study used BP greater than 95th percentile as hypertension a study in Kano65 used the
adult hypertensive value of BPgt14090mmHg as hypertension and got a prevalence of
72 The prevalence in that study65 could have been higher if the percentile or the
statistical definition was used as many children with BP 14090mmHg would probably be
at stage 2 hypertension This was demonstrated in the study by Bugaje Yakubu and
Ogala21 who found a prevalence of hypertension in their study to be 06 when the adult
cut off value of gt14090mmHg was used but it increased to 37 when the statistical
definition of BPgt 2 standard deviations was used
The number of times blood pressure is taken could affect the outcome as repeated
measurements over a time interval is known to give lower BP values than if BP is taken
once This study used the average of three blood pressure values taken at one sitting but
Ujunwa Ekefuna and Nwokocha100 took three readings at five minutes interval with two
other readings at a week interval In that study100 the prevalence of prehypertension
dropped from 745 during the first set of readings to 173 after the third week
readings The prevalence of hypertension also dropped from 135 to 54 over the same
period Similar decrease in the prevalence of both prehypertension and hypertension was
reported by Redwine and Daniels96 in US adolescents when blood pressure was taken
over time interval Another factor which might have affected the overall prevalence is the
Korotkoff sound used for diastolic pressure23 The 4th or 5th Korotkoff sounds has been
used by different researchers resulting in different diastolic BP The study21 in Zaria used
66
the 4th Korotkoff sound while most other researchers2265100 used the 5th About 5-
10mmHg difference is said to exist between the 4th and 5th Korotkoff sounds230 In this
study the 5th Korotkoff sound was used thus giving a higher prevalence of hypertension
in the studied population than in those where the 4th sound was used
The implication of the outcome of this study is that 44 of adolescents in Jalingo
are already hypertensive while 221 of them are at risk of developing hypertension as
they are pre-hypertensive Since 856 (255 of 298) of the prehypertensives were in the
middle and late adolescence these individuals are likely to be adults with high blood
pressure Therefore regular screening of this group of individuals who were assumed to
be a healthy population is highly important for early detection of hypertension and
intervention such as life style changes and treatment
67
CONCLUSIONS
The following conclusions can be made from this study
1 The mean and range of blood pressure of adolescents in Jalingo was similar to
those of other adolescents in Nigeria and other parts of the world Blood pressure
increased progressively with age
2 All measured anthropometry of weight height body mass index and waist
circumference correlated positively with BP but weight was the most significant
variable in BP determination
3 Socioeconomic status was not significantly related with blood pressure
4 The point prevalence of hypertension and pre-hypertension was 44 and 221
respectively using a recommended definition
RECOMMENDATIONS
1 In view of the high prevalence of prehypertension in this study it is recommended
that students should have their blood pressure measured at school entry as this will
68
help identify those with abnormal BP for early intervention Thereafter BP check
should be offered at least once a year at the beginning of a new session especially for
those found with abnormal BP at school entry
2 Physical and health education should be revived in all the schools This will lead to
increased physical activity and reduced risk of obesity and its consequences
3 School health programmes should be strengthened in schools where it already exist
and effort made to establish same in schools where it is yet to exist The programme
should include measures to detect early prehypertension and hypertension and other
health related needs of the students
LIMITATIONS
The following limitations were encountered in the course of the study
1 Exclusion and inclusion of students that were based on volunteered information and
physical evaluation This could have led to inclusion andor exclusion of adolescentss
69
with or without background renal diseases which could have affected the result of this
study
2 Home blood pressure measurement especially early morning measurement for those
with high blood pressure to possibly eliminate the effect of stress traffic andor
trekking and other school related stresses which may affect blood pressure during the
day
LINES OF FUTURE RESEARCH
This study was questionnaire based and time bound Consequently students were not
investigated for background diseases co-mordid conditions target organ damage or risk
factors for high blood pressure They were also not followed up In view of this future
research on blood pressure in adolescents should include-
70
1 Investigations such as urinalysis electrolytes urea and creatinine random blood
sugar (RBS) lipid profile and echocardiography as part of blood pressure evaluation
in adolescents
2 A long period of study to allow for follow-up over months or years to identify those
that are truly hypertensive considering the definition of hypertension It will also
reveal the rate of progression from pre-hypertension to hypertension
3 Risk factors evaluation for high blood pressure including genetic predispositions
REFERENCES
1 Blood pressure from Wikipedia the free Error Hyperlink reference not valid
Accessed 24th November 2011
2 Pickering TG Hall JE Appel LJ Falkner BE Graves J Hill MN Jones DW Kurtz T
Sheps SG Roccella EJ Recommendations for blood pressure measurement in humans
and experimental animals Part 1 Blood pressure measurement in humans A
statement for professionals from the subcommittee of professional and public
71
education of the American Heart Association council on high blood pressure research
Hypertension 2005 45 142-61
3 da Silva IRR de Souza MDG de Camargo CAC Blood pressure measurement in
children and adolescents Guidelines of high blood pressure recommendations and
current clinical practice Arq Bras Cardiol 2007 88 434-7
4 Sinaiko AR Hypertension in children N Engl J Med 1996 3351968-73
5 US Preventive Services Task Force Screening for high blood pressure
recommendations and rationale Am J Prev Med 2003 25 159-64
6 Report of the second task force on blood pressure control in children Pediatrics 1987
79 1-25
7 National high blood pressure education programme working group on hypertension
control in children and adolescents update on the 1987 task force report on high blood
pressure in children and adolescents A working group report from the national high
blood pressure education program Pediatrics 1996 98 649-58
8 National high blood pressure education program working group on high blood
pressure in children and adolescents The fourth report on the diagnosis evaluation
and treatment of high blood pressure in children and adolescents Pediatrics 2004
114 255-76
9 Aderele WI Seriki O Hypertension in Nigerian children Arch Dis Child 1974
49313-7
10 Bo S Gambino R Gentile L Pagano G Rosato R Saracco GM Cassader M
Durazzo M Cavallo-Perin P High-normal blood pressure is associated with a cluster
of cardiovascular and metabolic risk factors a population based study J Hypertens
2009 27 102-8
72
11 Bao W Threefoot SA Srinivasan SR Berenson GS Essential hypertension
predicted by tracking of elevated blood pressure from childhood to adulthood The
Bogalusa Heart Study Am J Hypertens 1995 8 657- 65
12 Richard A Rodgers M Hedley AJ Mitchel JRA Changes in blood pressure and
blood lipid during adolescence BMJ 1980 28 1563-6
13 Sundstroumlm J Neovius M Tynelius P Rasmussen F Association of blood pressure in
late adolescence with subsequent mortality cohort study of Swedish male conscripts
BMJ 2011 342 643-8
14 Zimmet P Alberti G Kaufman F Tajima N Silink M Arslanian S Wong S Bennett
P Shaw J Caprio S On behalf of the International Diabetes Federation Task Force on
Epidemiology and Prevention of Diabetes The metabolic syndrome in children and
adolescents the IDF consensus Diabetic Voice 20075229-32
15 Abdulrahman FA Babaoye AA Childhood hypertension in northern Nigeria West
Afr J Med 1978 1 7-11
16 Adediran O Jimoh A Di M Relationship between body mass index and blood
pressure in rural Nigerian dwellers Internet J Nutri Wellness 2009 7 431-4
17 World Health Organization (WHO)UNICEF Adolescence at a glance 2003 p 2
18 The National Population Commission constitution of the Federal Republic of Nigeria
(AP 23 LFN) legal notice on publication issued April 21st 2007
19 Heald FP and Gong EJ Diet Nutrition and adolescents In Shils ME and Ross AC
(eds) Modern Nutrition in Health and Disease 9th ed William and Wilkins
Maryland USA 1999 p 32
20 Okonkon CT The prevalence of Hypertension among civil servants in Calabar Nig
Med J 1979 7422-5
21 Bugaje MA Yakubu AM Ogala WN Prevalence of adolescent hypertension in Zaria
Nig J Paediatr 2005 32 77-82
73
22 Obika LF Adedoyin MA Olowoyeye JO Pattern of paediatric blood pressure in
rural semi urban and urban communities in Ilorin Nigeria Afri J Med Sci 1995 24
371-7
23 Jeremy B A short history of blood pressure measurement section of the history of
medicine Proc Roy Soc Med 1977 70 793-9
24 Lewis O Stephen Hales and the measurement of blood pressure J Hum Hypertens
1994 8 865-71
25 Crile GW Blood Pressure in Surgery An experimental and Clinical Research
Philadelphia Lippincott 1903 p 358
26 Lewis WH The evolution of clinical sphygmomanometer Bull N Y Acad Med 1941
17 871-81
27 Browne WC OrsquoBrien ET Semple PF The sphygmomanometer of Riva Roci 1896-
1996 J Hum Hypertens 1994 610 723-4
28 Segal HN How Korotkoff the Surgeon discovered the auscultatory method of
measuring arterial pressure Ann Intern Med1975 83 561-2
29 Goodman FH and Howell AA Clinical studies in the auscultatory method of
determining blood pressure University of Pennsylvania Bulletin 1911 23 469-75
30 Crenner CW Introduction of the blood pressure cuff into US medical practice
technology and skilled practice Ann Intern Med 1998 128 488-493
31 Ganon WF Circulation In Review of Medical Physiol Lange Medical Publication
New York 22nd edition 2005 p 234-63
32 Beth C Homeostatic Regulation of Blood pressure Available from
URLhttpwwweHowcom Accessed on 1st December 2011
33 Rajinder KG Fahim M Regulation of cardiovascular functions during acute blood
loss Indian J Physiol Pharmacol 2005 49 213ndash9
74
34 Dampney AL Coleman MJ Fonts MAP Hirooka Y Horiuchi J Polson JW Potts
PD Tagawa T Central mechanisms underlying short-term and long-term regulation
of the cardiovascular system Proc Austr Physio Pharmacosociety 2001 32 333-44
35 Koshiya N Guyenet PG Noradrenergic neurons and the carotid sympathetic
chemoreflex Am J Physiol 1994 267 519-26
36 Prakash ES The ultimate goal in neural regulation of cardiovascular function Adv
Phyiol Educ 2008 32 107-8
37 Allen AM Inhibition of the hypothalamic paraventricular nucleus reduces
sympathetic nerve discharge and blood pressure Proc Austr Neuroscience Society
2001 29 44-7
38 Reid IA Interactions between ANG II sympathetic nervous system and
baroreceptor reflexes in regulation of blood pressure Am J Physiol 1992 262 763-
78
39 Brooks VL Osborn JW Hormonal-sympathetic interactions in long-term
regulation of arterial pressure A hypothesis Am J Physiol 1995 268 1343-58
40 Reckelhoff JF Gender Differences in the Regulation of Blood Pressure
Hypertension 2001 37 1199-208
41 Fink GD The systemic circulation as a regulated free-market economy A new
approach for understanding the long-term control of blood pressure Clin Exp
Pharmacol Physiol 2005 32 377ndash83
42 Benard K Sources of error in blood pressure measurement Hospital Physician 2002
12 33-7 Available from URLhttp wwwturnerwhitecom
43 Chyun DA A comparism of intra arterial and auscultatory blood pressure readings
Heart lung 1985 14 223-31
75
44 Nwankwo MU Lorenz JM Gardiner JC A Standard Protocol for Blood Pressure
Measurement in the Newborn Pediatrics 1997 99 1342-9
45 Deakin CD Low JL Accuracy of the advanced trauma life support guidelines for
predicting systolic blood pressure using carotid femoral and radial pulses
observational study BMJ 2000 321 673ndash4
46 OrsquoBrian E Replacing mercury sphygmomanometers require clinician to demand
better automated device BMJ 2000 320 815-6
47 McKay DW Raju MK Campbell NR Assessment of blood pressure measuring
techniques Med Educ 1992 26 208ndash12
48 Baker RH Ende J Confounders of auscultatory blood pressure measurement J Gen
Intern Med 1995 10 223ndash31
49 Neufeld PD Johnson DL Observer error in blood pressure measurement CMAJ
1986 135 633ndash7
50 van Montfrans GA Oscillometric blood pressure measurement progress and
problems Blood Press Monit 2001 6 287ndash90
51 Ware RW Laenger CJ Indirect blood pressure measurement by Doppler ultrasonic
kinetoartriography Proceedings 20th Annual Conference Engineering Medical
Biology 1967 9 27-30
52 Matthew Fox Blood pressure measurement technique Available from URL http
wwwlivestrongcom Last edited 2nd September 2010 Accessed on 30th November
2011
53 Akor F Okolo SN Okolo AA Blood pressure and anthropometric measurements in
healthy Primary School entrants in Jos Nigeria SAJCH 2010 4 42-5
54 Merhi BM Al-Hajj F Al-Tannir M Zaide F El-Rajab M A survey of blood pressure
in Lebanese children and adolescents North Am J Med Sci 2011 3 24-9
76
55 Al-Salloum AA El-Mouzan AH Al-Herbish AS Al-Umar AA Qurashi MM Blood
pressure standard for Saudi children and adolescents Ann Saudi Med 2009 29 173-8
56 Akinkugbe FM Akinwolere AO Kayode CM Blood Pressure Pattern in
Adolescence West Afri J Med 1999 18 196-202
57 Wanzhu T Eckert GJ Saha C and Pratt JH Synchronization of Adolescent Blood
Pressure and Pubertal Somatic Growth J Clin Endo Metab 2009 94
58 Ansa VO Anah MU Odey FA Mbu PN Agbor EI Relationship between parental
socioeconomic status and casual blood pressure in coastal Nigeria Adolescents West
Afri J Med 2010 29146-52
59 Agyemang C Redekop WK Owusu-Dabo E Bruijnzeels MA Blood pressure
patterns in rural semi-urban and urban children in the Ashanti region of Ghana West
Africa BMC Public Health 2005 5114-21
60 Ejeke CCE Ugwu CE Ezeanyika LUS Olayemi AT Blood pressure patterns in
relation to geographic area of residence a cross-sectional study of adolescents in Kogi
state Nigeria BMC Public Health 2008 8 411-5
61 Colhoun HM Hemminway H Poulter WR Socioeconomic status and blood
pressure an overview analysis J Human Hypertension 1998 12 91-110
62 Badaruddoza KR Familial aggregation and heritability for cardiovascular risk factors
a family based study in Punjab India Natural Science 2010 2 732-6
63 Livshits G Gerber LM Familial factors of blood pressure and adiposity co-variation
Hypertension 2001 37 928-35
64 Fermino RC Seabra A Garganta R Antoacutenio J Maia R Genetic factors in familial
aggregation of blood pressure of Portuguese nuclear families Arq Bras Cardiol 2009
92 463-9
77
65 Mijinyawa MS Iliyasu Z Borodo MM Prevalence of hypertension among teenage
students in Kano Nigeria Nig J Med 2008 17 173-7
66 The Wellcome Trust case control consortium Genome-wide association study of
14000 cases of seven common diseases and 3000 shared controls Nature 2007 447
661-78
67 Levy D Destefano AL Larson MG ODonnell CJ Lifton RP Gavras H Evidence for
a gene influencing blood pressure on chromosome 17 genome scan linkage results for
longitudinal blood pressure phenotypes in subjects from the Framingham heart study
Hypertension 2000 36 477- 83
68 Lifton RP Wilson FH Choate KA Geller DS Salt and blood pressure new insight
from human genetic studies Cold Spring Harb Symp Quant Biol 2002 67 445ndash50
69 van der Sande MA Milligan PJ Nyan OA Rowley JT Banya WA Ceesay SM
Dolmans WM Blood pressure patterns and cardiovascular risk factors in rural and
urban Gambian communities J Hum Hypertens 2000 14 489-96
70 Akinkugbe OO Ojo OA Arterial blood pressure in rural and urban population of
Nigeria BMJ 1969 2 22-4
71 Okagua J Anochie IC Akani NA Adolescent blood pressure in Rivers State Nigeria
A rural-urban comparism NJP 20154221-7
72 Urrutia-Rojas X Egbuchunam CU Bae S Menchaca J Bayona M Rivers PA Singh
KP High blood pressure in school children Prevalence and risk factors BMC
Pediatrics 2006 6 32-9
73 Sorof JM Lai D Turner J Poffenbarger T Potman R Overweight ethnicity and the
prevalence of hypertension in school-aged children Pediatrics 2004 113 475-82
78
74 Rosner B Prineas R Daniels SR Blood pressure differences between blacks and
whites in relation to body size among US children and adolescents Am J Epidemiol
2000 151 1007-18
75 Harding S Whitrow M Lenguerrand E Maynard M Teyhan A Cruickshank JK Der
G Ethnic differences in blood pressure in adolescence the determinants of adolescent
social well-being and health study Hypertension 2010 55 1063-9
76 Cruickshank JK Mzayek F Liu L Kieltyka L Sherwin R Webber LS Srinavasan SR
Berenson GS Origins of the ldquoblackwhiterdquo difference in blood pressure roles of birth
77 Vlajinac H Miljus D Adanja B Marinkoic J ipetic S Kocev N Blood pressure levels
in 7 to 14-year-old Belgrade children J Human Hypertension 2003 17 761ndash5
78 Menezes AMB Hallal PC Dumith SC Adolescent blood pressure body mass index
and skin folds sorting out the effects of early weight and length gains J Epid Comm
Health 2011 12 42-8
79 Karelis AD St-Pierre DH Conus F Rabasa-Lhoret R Poehlman EJ Metabolic and
body composition factors in subgroups of obesity what do we know J Clin Endo
Metab 2004 89 2569-75
80 Katzmarzyk PT Srinivasan ER Chen W Malina RM Bouchard C Berenson GS
Body mass index waist circumference and clustering of cardiovascular disease risk
factors in a biracial sample of children and adolescents Pediatrics 2004 114 198-205
81 Guagnano MT Ballone E Colagrande V Della Vecchia R Manigrasso MR Merlitti
D Riccioni G Sensi S Large waist circumference and risk of hypertension Int J
Obesity 2001 25 1360 ndash 4
82 Araujo TA Lopes MVO Moriera RP Cavalcante TF Gurdes NG MartinS dA Silva
V Blood pressure of children and teenagers from a public school in Fortaleza - Cearaacute
Acta paul enferm 200720103-15
79
83 Sebanjo IO Oshikoya KA Obesity and blood pressure levels of adolescents in
Abeokuta Nigeria Cardiovasc J Afr 2011 221-5
84 Messerli FN Obesity and essential hypertension Haemodynamics sodium excretion
and plasma rennin activity Arch Int Med 1981 141 81-5
85 Appel LJ Brands MW Daniels SR Karanja N Elmer PJ Sacks FM Dietary
Approaches to Prevent and Treat Hypertension A Scientific Statement from the
American Heart Association Hypertension 2006 47 296-308
86 Sacks FM Svetkey LP Vollmer WM Appel LJ Bray GA Harsha D Obarzanek E
Conlin PR Miller ER 3rd Simons-Morton DG Karanja N Lin PH for the DASH-
Sodium Collaborative Research Group Effects on blood pressure of reduced dietary
sodium and the Dietary Approaches to Stop Hypertension (DASH) diet DASH-
Sodium Collaborative Research Group N Engl J Med 2001 344 3ndash10
87 Appel LJ Moore TJ Obarzanek E Vollmer WM Svetkey LP Sacks FM Bray GA
Vogt TM Cutler JA Windhauser MM Lin PH Karanja N A clinical trial of the
effects of dietary patterns on blood pressure DASH Collaborative Research Group N
Engl J Med 1997 3361117ndash24
88 Appel LJ Sacks FM Carey VJ Obarzanek E Swain JF Miller ER 3rd Conlin PR
Erlinger TP Rosner BA Laranjo NM Charleston J McCarron P Bishop LM for the
OmniHeart Collaborative Research Group Effects of protein monounsaturated fat and
carbohydrate intake on blood pressure and serum lipids results of the OmniHeart
randomized trial JAMA 2005 294 2455ndash64
89 Karanja NM Obarzanek E Lin PH McCullough ML Phillips KM Swain JF
Champagne CM Hoben KP Descriptive characteristics of the dietary patterns used in
the Dietary Approaches to Stop Hypertension Trial DASH Collaborative Research
Group J Am Diet Assoc 1999 99 19ndash27
80
90 Nwokocha ARC Adolescence and associated problems In Azubuike JC and
Nkanginieme KEO (eds) Paediatrics and Child Health in a Tropical Region African
Educational Services Owerri Nigeria 2nd edition 2007 p 84-99
91 Rogol RT Roemmich JN Clark PA Growth and puberty J Adol Hlth 2002 31 192-
200
92 Tanner JM Marshal WA Variation in the pattern of puberty changes in boys and girls
Arch Dis Child 1970 45 13-23
93 Nwakoro SO Ifoda K Onochie O Olomu JM Anthropometric assessment of
nutritional status and growth of 10-20 years individuals in Benin City metropolis
Nigeria Pakistan J Nutr 2006 5 117-21
94 Shankar RR Eckert GJ Saha C Tu W Pratt JH The change in blood pressure during
pubertal growth J Clin Endo Metab 2005 90 163-7
95 Department of Health and Human Services 2000 CDC Growth Charts for the United
States methods and development Series Report 11 No 246 Available from URL
httpwwwcdcgovGrowthCharts
96 Redwine KM Daniels SR Prehypertension in Adolescents Risk and Progression
Journ Clin Hypertension 2012 14 360ndash4
97 Falkner B Gidding SS Portman R Rosner B Blood pressure variability and
classification of prehypertension and hypertension in adolescence Pediatrics 2008
122238ndash42
98 Redwine KM Acosta AA Poffenbarger T Development of hypertension in
adolescents with pre-hypertension J Pediatr 2012 16098ndash103
99 Ejike ECCC Ugwu CE and Ezeanyika LUS Variations in the prevalence of point
prehypertension in a Nigerian school-going adolescent population living in a semi-
urban and an urban area BMC Pediatr 2010 1013
81
100 Ujunwa FA Ikefuna AN Nwokocha AR Chinawa JM Hypertension and
prehypertension among adolescents in secondary schools in Enugu South East Nigeria
Italian J Pediatr 20133970-5
101 Chobanian AV Bakris GL Black HR Seventh report of the Joint National
Committee on Prevention Detection Evaluation and Treatment of High Blood
Pressure Hypertension2003 421206ndash52
102 Lande MB Systemic Hypertension In Kliegman RM Behrman RE Jenson HG and
Stanton BF (eds) Nelson Textbook of Pediatrics Saunders Elsevier Philadelphia 19th
Edition 2011 pg 1592-8
103 Luma GB Spiotta RT Hypertension in Children and Adolescent Am Fam Physician
2006 73 1558-68
104 Arvind B Rupesh J Vijayakumar M Madhuri K Ali U Evaluation and management
of hypertension Indian Paediatr 2007 44 103-21
105 Flynn JT Neonatal hypertension Diagnosis and management Pediatr Nephrol 2000
14 332-41
106 Steyn K de Wet T Richter L Cameron N Levitt NS Morrel C Cardiovascular
diseases risk factors in 5-year old urban South African children- The Birth to Ten
Study SAMJ 2000 90 7126
107 Antia-Obong OE Antia-obong LE Arterial blood pressure of Nigerian Urban and
Rural school children Nig J Paediatr 1991 18 3-11
108 Nguyen NT Magno CP Lane KT Hinojosa MW Lane JS Association of
hypertension diabetes dyslipidemia and metabolic syndrome with obesity findings
from the National Health and Nutrition Examination Survey 1999 to 2004 J Am Coll
Surg 2008 207 928-34
82
109 Solar MB Gill A Rey J Epidemiology of arterial blood pressure in school children
population Aten Primaria 1992 9 212-4
110 Steyn K de Wet T Richter L Cameron N Levitt NS Morrel C Cardiovascular
diseases risk factors in 5-year old urban South African children- The Birth to Ten
Study SAMJ 2000 90 7126
111 Linkas J The assessment and management of hypertensive emergencies and
urgencies in children Pediatr Emerg Care 2005 21391-6
112 Croix B Feig DI Childhood hypertension is not a silent disease Pediatr Nephrol
2006 21527-32
113 Flynn JT Anderson MH Characteristics of children with primary hypertension seen
at a referral centre Pediatr Nephrol 2007 44 103-21
114 Nakao M Yano E Nomura S Kuboki T Blood pressure lowering effects of
biofeedback treatment in hypertension a meta-analysis of randomized controlled trials
Hypertension 2003 26 37- 46
115 Jalingo Available from URLhttpwwwencyclopedia Britanica Accessed on 3rd
December 2011
116 Araoye MO Research Methodology with Statistics for Health and Social Sciences
Nathadex Publishers Saw-Mill Ilorin Nigeria 2004 pg 115-21
117 Olusanya O Okpere E Ezimokhai M The importance of social class in voluntary
fertility control in a developing country West Afr J Med 1985 4 205-12
118 World Health Organization expert committee Physical status the use and
interpretation of anthropometry WHO technical report series No 894 Geneva WHO
1995 p 424ndash38
119 Guidelines subcommittee WHOISH guideline for management of hypertension J
Hypertens 1999 17 151-83
83
120 Aubay B How to measure waist circumference Available from
URLhttpwwwehowcom Last updated August 10th 2011 and accessed on December
9th 2011
APPENDICES
Appendix 1
PROFORMA ON BLOOD PRESSURE PATTERN IN APPARENTLY HEALTHY
SECONDARY SCHOOL ADOLESCENTS IN JALINGO
PUBLIC SCHOOL [ ]
Serial No
84
PRIVATE SCHOOL [ ]
A BIODATA
1 Age (years) 10[ ] 11[ ] 12[ ] 13[ ] 14[ ] 15[ ] 16[ ] 17[ ] 18[ ] 19[ ]
2 Gender M [ ] F [ ]
3 Class JSS 1-3 [ ] SS1-3 [ ]
B MEDICAL AND SOCIAL HISTORY Yes [1] No [2]
1 Have you ever passed blood in your urine [ ]
2 Have you ever had your face or legs swollen [ ]
3 Are you on any drug for long time (such as pills steroids marijuana codeine
NSAIDs containing drugs tramal and others) [ ]
If yes specifyhelliphelliphellip
C SOCIO-ECONOMIC CLASSIFICATION
Fatherrsquos occupation
Score 1 Professionals top civil servants politicians and top businessmen
2Middle-level civil servants technicians skilled-artisans and well-to-do
traders
3 Unskilled workers and those in general whose income would be at or below
the national minimum wage
Mothers educational level
Score 0 Education up to University level
1 Secondary or tertiary level below the University
2 No formal education or up to primary level only
D ANTHROPOMETRY
i Weight (Kg) ndash 1helliphellip 2helliphelliphellip Averagehelliphelliphelliphellip
ii Height (m) ndash 1helliphellip 2helliphellip Averagehelliphelliphelliphellip
85
iii Body mass index = weightheight (kgm2)
v Waist circumference (cm) ndash 1helliphellip 2helliphelliphellip Averagehelliphelliphelliphellip
iv Blood Pressure (mmHg) - 1helliphellip 2hellip 3helliphellip Averagehelliphelliphelliphellip
Appendix 2
AUTHORIZATION AND CONSENT TO PARTICIPATE IN A RESEARCH
I Dr Peter Teru Yaru of the Department of Paediatrics Ahmadu Bello University
Teaching Hospital (ABUTH) Zaria Irsquom conducting a research on the blood pressure
pattern among secondary school adolescents in Jalingo
The aim of the study is to know the level of blood pressure among their age
groups Those with high blood pressure (or hypertension) will be identified appropriately
advised and referred for further care The study will involve taking their weight height
blood pressure and waist circumference Female assistants shall be responsible for
86
measuring waist circumference of female students Students will also be given a
questionnaire on some of their activities drug use among others all aimed at looking for
factors which can affect their blood pressure Information obtained shall be treated with
utmost confidentiality and for this research work only Please note that participation is
voluntary I will be glad if you give consent for your childward to participate in the
study
Statement by parents Irsquove read and understood this consent form and agreed for my
child to be included in the study
Parents name Researcherrsquos name and sign
Parents phone no if any Date
Parents signthumb print Phone no
87
Appendix 3
SOCIO-ECONOMIC SCORE
The classification of socio-economic scores based on fatherrsquos occupation and motherrsquos
education by Olusanya et al117
A Husband (fatherrsquos occupation)
Score 1 Professionals top civil servants politicians and businessmen
2 Middle-level bureaucrats technicians skilled-artisans and well-to-do traders
3 Unskilled workers and those in general whose income would be at or below
the national minimum wage
B Mothers educational level
Score 0 Education up to University level
1 Secondary or tertiary level below the University
2 No formal education or up to primary level only
The socio-economic class of the childrsquos mother is obtained by adding the scores from A
and B above and graded I-V as appropriate for example
Score (1) from A plus score (0) from B = social class I
Score (2) from A plus score (0) from B = social class II
Score (2) from A plus score (1) from B = social class III
Score (2) from A plus score (2) from B = social class IV
Score (3) from A plus score (0) from B = social class III
Score (3) from A plus score (1) from B = social class IV
Score (3) from A plus score (2) from B= social class V
Page 5
5
DEDICATION
This work is dedicated to my dearest wife and lovely children for their patience and
understanding during this period Above all I dedicate it to God Almighty for sustaining me
to this stage and beyond
6
ACKNOWLEDGEMENTS
I first and foremost acknowledge my supervisors in the persons of Professor WN Ogala Dr
HW Idris and Dr AJ Uniga for their untiring guidance and assistance throughout the period of
this work I am also grateful to all the consultants and residents of the Department of
Paediatrics ABUTH for their advice criticism and suggestions
The study would have been unsuccessful without the cooperation of the Taraba State
Post Primary Schools Board The school principals and the students were all wonderful and I
highly appreciate their cooperation during the study
My research assistants were very committed and dedicated and I really appreciate them
I particularly appreciate Dr AO Awolowo for his untiring participation in the study
Similarly I want to acknowledge the nurseMr E Joseph and Miss F Geoffrey the female
youth corper who both assisted with the anthropometric measurements
I acknowledge my primary institution the Federal Medical Centre Jalingo for
sponsoring me for the residency training I appreciate their moral and financial assistance
The management of ABUTH is also highly appreciated for giving me the opportunity of
training in her institution
Finally the support prayers and encouragement of my family kept me going during this
period I specially appreciate my dearest wife Susan and our children for standing by me even
when I was not always available when they needed me I also acknowledge my senior brother
Joseph Teru all my friends and other people who have contributed in one way or the other to
the successful completion of this work I thank them all
7
LIST OF ABBREVIATIONS
ADH Antidiuretic Hormone
ANP Atrial Natriuretic Peptide
BMI Body Mass Index
BP Blood pressure
CDC Centre for Disease Control
CVA Cerebro-vascular accident
DASH Dietary approach to stop hypertension
DBP Diastolic blood pressure
Ht Height
JSS Junior secondary school
Kg Kilogramme
M Meter
mmHg Millimeters of Mercury
NHBPEPWG National High Blood Pressure Education Programme Working Group
NCHS National Centre for Health Statistics
PGS Pubertal Growth Spurt
PHC Primary Health Care
QI Queteletrsquos index
SBP Systolic blood pressure
SSS Senior secondary school
SMR Sexual maturity rating
USA United States of America
WC Waist circumference
WHO World Health Organization
WHR Waist-hip ratio
Wt Weight
8
LIST OF TABLES
Table I Result of pilot study 26
Table II List of schools and number of students selected 28
Table III Age and sex distribution of the study subjects 33
Table IV Overall ean anthropometric measurements of the study subjects 35
Table V Mean anthropometric indices of 628 boys 36
Table VI Mean anthropometric indices of 722 girls 37
Table VII Mean and ranges of blood pressure of 1350 subjects 38
Table VIII Mean blood pressure in relation to age and sex 39
Table IX Mean blood pressureaccording to sex and stages of adolescence 41
Table X The pattern of normal BP prehypertension and hypertension according to stages of
adolescence 41
Table XI Correlation between blood pressure and anthropometry 42
Table XII Mean blood pressure in relation to socioeconomic classes 43
Table XIII Blood pressure pattern in relation to socioeconomic classes 43
Table XIV Overall Blood pressure pattern and prevalence of hypertension 45
9
LIST OF FIGURES
Figure 1 Studentsrsquo distribution according to socioeconomic classes 34
Figure 2 Blood pressure distribution in relation to age and sex 40
10
SUMMARY
A cross sectional study of blood pressure pattern in apparently healthy secondary school
adolescents aged 10-19years in Jalingo Taraba state was carried out over six months period
from January to July 2014 One thousand three hundred and fifty (1350) students
participated comprising 628 (465) boys and 722 (535) girls Variables measured
included blood pressure weight height waist circumference and body mass index was
calculated from the weight and height
Overall the mean anthropometric values and blood pressure increased with age
irrespective of sex The mean weight of the students was 486plusmn109kg with a range of 23-
100kg while the mean height was 16plusmn01m and ranged from 12-19m The mean waist
circumference was 656plusmn89cm and ranged from 22-100cm while the meanbody mass index
(BMI) was 189plusmn31 with a range of 114-420
The overall mean systolic blood pressure was 1089plusmn125mmHg with a range of 76-
165mmHg whilethe mean diastolic blood pressure was683plusmn82mmHg and ranged from 47-
95mmHg The gender related differences in blood pressure showed mean systolic blood
pressure for boys and girls to be 1081plusmn133mmHg and 1095plusmn117mmHg (t=-2054
p=0040) while the mean diastolic blood pressurewas 678plusmn81mmHg and
687plusmn82mmHg(t=-2077 p=0038) respectively Girls generally had a higher mean systolic
blood pressure than boys from early adolescence (t=3754 p=0007) to middle adolescence
(t=-3025 p=0011) but reversed during late adolescence with boys having higher mean
systolic blood pressure (t=2145 p=0033) and these differences were statistically significant
Girls also showed dominance in the diastolic blood pressurein early and middle adolescence
but only statistically significant during middle adolescence (t=-3517 plt0000) Adolescents
from private schools had higher meansystolic blood pressure of 1102plusmn123mmHg than those
11
from public schools with 1084plusmn125mmHg(t=-222 plt0027)and higher mean diastolic
blood pressure of 703plusmn80mmHg than those from public schools with 677plusmn81mmHg(t=-
461 p=0000)
Blood pressure correlated positively with age (r=030-035 plt0000) height (r=034-
044 plt0000) weight (r=038-051 plt0000) body mass index (r=029-040 plt0000) and
waist circumference (r=023-031 plt0000) The socio-economic class associated negatively
with blood pressure withthose from upper socio-economic classeshavinga relatively
lowermean blood pressure than their counterparts from lower socio-economic classes but the
differences were not statistically significant for both systolic (f=1650 p=2850) and diastolic
blood pressure (f=0193 p=0058)
The overall point prevalence of hypertension was 44(59 0f 1350) with gender specific
prevalence for malebeing 41 (26 of 628 boys) and46 (33 of 722 girls) for females The
gender difference was not statistically significant (χ2=0831 p=0362) According to stages of
hypertension 15 (10 of 628)and 11 (7 of 628) males had stages 1 and 2 systolic
hypertension respectively while24 (15 of 628) had stage 1 diastolic hypertension andnone
had stage 2 diastolic hypertension Similarly 24 (17 of 722) and 12 (9 of 722) females
had stages 1 and 2 systolic hypertension respectively while 12 (9 of 722) and only 01 (1
of 722) girls had stages 1 and 2 diastolic hypertension respectively The overall prevalence of
pre-hypertension was 221(298 of 1350) with gender related prevalence of 21 (131 of
628) for males and231 (167 of 722) for femalesThe gender difference was statistically
significant (χ2=4349 p=0037)
In view of the high prevalence of pre-hypertension of 221 (298 of 1350) in this
study it is recommended that blood pressure measurement should be included as part of
medical evaluation at secondary school entry and at least annually thereafter especially for
those found to be at risk of hypertension during school entry
12
INTRODUCTION
Blood pressure (BP) is the pressure exerted by circulating blood volume on the walls of
blood vessels1 It is one of the vital signs measured during routine physical examination2
Blood pressure measurement is done to screen for hypertension and other cardiovascular
risk factors determining risk for various medical procedures identifying patients in
potential or actual clinical deterioration and determining individualrsquos fitness for an
occupation3 Its value as a screening tool in adults has long been documented and is an
established important component of routine paediatric physical examination4
The importance of BP measurement in children and adolescents is based on the fact
that hypertension is now increasingly diagnosed among them5-8 The American Academy
of Paediatrics now recommends routine screening of asymptomatic adolescents and
children during preventive care visits Such screening will identify potentially treatable
and preventable causes of hypertension and initiate early treatment to prevent
complications5
Hypertension is an important health problem all over the world5-9 because it is
usually silent and the presence of symptoms may indicate end organ damage10 It is
known to track well into adulthood thus making BP measurements in youths valuable for
identifying adolescents at risk of essential hypertension in adulthood11 Individuals with
high BP in their childhood are more likely to have high BP in subsequent years12 The
phenomenon of BP tracking into adulthood and the demonstration of the beginnings of
hypertensive target organ damage during childhood together with the increased
prevalence of childhood essential hypertension have raised concern of an impending
epidemic of cardiovascular morbidity and mortality10
The consequences of hypertension in children range from increased morbidity
from its causes complications or its treatment to high mortality13 The most frequently
13
and perhaps severely affected organs are the heart kidneys brain and the eyes leading to
lowered life expectancy and premature death13 In addition hypertension is a component
of the metabolic syndrome associated with similar and perhaps more severe consequences
in affected individuals14 Abdulrahaman and Babaoye15 in a study of hypertension in
Nigerian children observed a mortality rate of 28 within the first year after diagnosis
Similar mortality of 275 was reported by Aderele and Seriki9 Hypertension also places
an excessive financial burden on the population and health system consuming scarce
resources16
Adolescence is the transitional period of development between childhood and
adulthood The World Health Organization (WHO) defines adolescents as individuals
between the ages of 10 and 19 years and they account for 40 of Nigeriarsquos population1718
Adolescence is characterized by rapid biological psychological and cognitive changes
largely dependent on hormonal and environmental influences19 Many of the responses to
these influences include behaviours that have direct implications on health such as harmful
dietary intake alcoholism smoking substance abuse and sedentary lifestyle19 These
coupled with social stresses such as city traffic congestion have negative health impact and
predispose to obesity and increased risk of cardiovascular disease such as hypertension and
metabolic syndromes10 20 It has been shown that if preventive measures are started early in
childhood and adolescence they may lead to significant reduction in the high prevalence of
hypertension and metabolic syndrome currently observed in adults81320
JUSTIFICATION FOR THE STUDY
Hypertension is associated with high morbidity affecting major organs of the body such as
the heart kidneys and the brain1314 and a mortality of up to 275-28915 It is now diagnosed
frequently in adolescents with a reported prevalence of 35-952122 The younger the age of
14
onset of hypertension the greater the reduction in life expectancy if left untreated13 Even
asymptomatic adolescents with mild blood pressure elevations can have target organ
damage10 Studies121420 have shown that early identification and intervention may lead to a
significant reduction in the high prevalence of hypertension and metabolic syndrome
currently observed in adults In view of this routine blood pressure check-ups for children
and adolescents have been advocated during medical evaluations8 Blood pressure is
however not routinely measured in most paediatric clinical practices in Nigeria
Consequently only few children will have their blood pressure measured when they fall sick
or during preventive care visits In addition hospital and clinic BP measurements may be
associated with falsely elevated BP called lsquolsquowhite coat hypertensionrsquorsquo8 BP measurement of
children outside of the hospital setting such as in schools will provide opportunity for
apparently healthy individuals and possibly eliminate white coat hypertension The need for
surveillance for the early identification of adolescents in Jalingo who are at risk of
hypertension and to initiate measures aimed at preventing its consequences is therefore the
justification for this study In addition the study will add to the body of knowledge on
adolescent blood pressure as there has been no previous study on BP from Jalingo and
northeastern Nigeria as a whole This will help inform public health policies regarding blood
pressure control and prevention in Taraba State in particular and in Nigeria in general
15
LITERATURE REVIEW
HISTORICAL PERSPECTIVE
Blood pressure measurement first started in the eighteenth century with the experiment of
Stephen Hales to whom its discovery can be attributed as reported by Jeremy2324
Accurate study of blood pressure as reported by Crile25 began with the introduction of a
manometer by Poiseuille a century later The first truly accurate blood pressure
measurement in man was by the Surgeon Faivre in 1856 when he connected an artery to a
mercury manometer to obtain direct readings24 Non-invasive methods of BP
measurement started with the discovery of the sphygmograph in 1855 by Vierordt as
reported by Crile25 and improvement by Potain in 1889 gave birth to the
sphygmomanometer26 In 1896 Scipione Riva-Rocci developed the method upon which
present-day technique is based27
Segal28 reported that the use of stethoscope for BP measurement was first highlighted
in 1905 by a Russian surgeon Korotkoff who documented hearing a tapping sound using a
stethoscope placed over the brachial artery as the Riva-Rocci cuff was deflated Goodman
and Howell29 recommended the division of the changing sounds into five distinct phases and
physicians subsequently determined blood pressure according to the point of appearance and
muffling or disappearance of the sounds30
DEFINITION AND REGULATION OF BLOOD PRESSURE
Blood pressure is defined as the product of cardiac output and peripheral vascular
resistance131 During each heartbeat BP varies between a maximum (systolic) and a
minimum (diastolic) pressure and is measured in millimeters of mercury (mmHg)1 Blood
16
pressure is regulated by different mechanisms acting either rapidly or slowly to maintain it
within normal range for optimal cellular performance3132
Intrinsic Regulation
Intrinsic factors regulating BP include stroke volume and heart rate which both influence
cardiac output31 Stroke volume depends on the volume of blood that fills the ventricles and
this depends on the preload and afterload33 A higher afterload will decrease stroke volume
causing low cardiac output and low BP and vice versa When cardiac output increases more
volume is derived from the venous pool increasing preload Similarly an increased heart rate
will lead to increased cardiac output and BP3134
Reflex Regulation
The baroreceptors within the aortic arch and carotid sinuses contain sympathetic and
parasympathetic nerve fibres3435 These are sensory nerves which run from the medulla
and they respond to stretch of the tissue in which they lie by increasing or decreasing the
rate of signaling36 and act fast in regulating BP34 Sympathetic stimulation causes
increased heart rate and widespread vasoconstriction to increase BP while
parasympathetic stimulation produces the opposite3537
Hormonal Regulation
Hormones regulating blood pressure include renin-angiotensin-aldosterone and
antidiuretic hormone (ADH) They act slowly by responding to changes in intravascular
volume and osmolality38 Angiotensin II is a potent vasoconstrictor and stimulates the
release of aldosterone from the adrenal gland39 Aldosterone increases sodium absorption
and fluid retention leading to increased BP ADH is a potent vasoconstrictor and plasma
volume regulator and its stimulation results in fluid retention and vasoconstriction39
Other hormones regulating BP include the sex hormones thyroid parathyroid cortisol
and ACTH They act on the rennin-angiotensin-aldosterone system to regulate BP3940
17
Renal Regulation
The kidneys control blood pressure through the retention and excretion of extracellular
fluid35 An increase in renal fluid retention will increase extracellular volume and higher
blood pressure whereas increased renal excretion leads to lower blood pressure41 This is
achieved through the action of ADH aldosterone and atrial natriuretic peptide (ANP)41
METHODS OF MEASURING BLOOD PRESSURE
Blood pressure can be measured by invasive and non-invasive methods
1) Invasive (or direct) method - Blood pressure is most accurately measured invasively
through an arterial line4243 It is the gold standard by which the accuracy of other blood
pressure measuring devices and methods are assessed4344 Chyun43 compared direct and
indirect blood pressure readings in 14 intensive care unit patients and found that the
auscultatory method overestimates the systolic and diastolic BP especially if the VI Kortkoff
sounds is used as an indicator of diastolic BP This can often over estimate reading by as
much as 20 mm Hg43 This study is made up of very small sample size to make general
conclusion on the differences in BP values from the two methods compared Although the
invasive method is the gold standard for true BP measurement it is associated with serious
complications related to arterial catheterization and the procedure itself may be technically
difficult It is mainly used in experimental procedures and in monitoring critically ill patients
in intensive care units42
2) Non invasive (indirect) methods These are simpler and quicker than the invasive
method and are commonly used for routine blood pressure examinations They may
however yield lower accuracy and small systematic differences in numerical results43
These methods include-
18
a) Palpation method - A minimum systolic value can be estimated by palpation Deakin
and Low45 reported that a palpable radial femoral or carotid pulse indicates a minimum
systolic BP of 80 70 and 60 mmHg respectively The study was carried out among adults
and these values could not be applicable in children and neonate whose maximum
systolic BP may be lower than the reported minimum values A more accurate systolic BP
value can be determined by inflating and then deflating sphygmomanometer cuff while
palpating the pulse The systolic BP corresponds to the pressure at which the radial pulse
becomes palpable45 Its disadvantages are that pressure obtained is usually 2-5mmHg less
than those obtained by auscultation and diastolic BP cannot be measured32
b) Auscultation method- Also called the Korotkoff method is the method of choice in
clinical practice142 It involves using a stethoscope and a sphygmomanometer46 The
mercury sphygmomanometer is the gold standard for BP measurement A Riva-Rocci
cuff 27 is placed over the arm and inflated to occlude the brachial artery It is then
gradually deflated until blood flow is re-established accompanied by a tapping sound
which can be detected by the stethoscope held over the artery Five sounds are
traditionally heard and classified into phases30 The first phase corresponds to the systolic
BP while the last or fifth phase corresponds to the diastolic BP30 The fourth phase
alternatively is used to measure the diastolic pressure if a 10 mmHg or greater
differences exist between the initiation of phases fourth and five or if the fifth sound is
heard down to 0 mmHg8 This may occur in cases of high cardiac output or peripheral
vasodilatation children or in pregnancy This method though the method of choice in
clinical practice may however be associated with errors arising from faulty technique and
equipment4748 as well as observer bias49 This method was used for this study because of
its widespread general usage its reliability and accuracy Unlike other methods the
instruments (mercury sphygmomanometer and stethoscope) do not require any
19
calibration and values obtained do not require validation by other methods The standard
World Health OrganizationCenter for Disease Control (WHOCDC) blood pressure
reference percentile tables were generated using the mercury sphygmomanometer hence
the auscultation method is the gold standard for BP evaluation258
The aneroid sphygmomanometer measures BP by mechanical system of metal
bellows that expand as the cuff pressure increases in a series of levers that register the
pressure on a circular scale The hybrid shygmomanometer combines some of the features
of the two and uses an electric transducer to record blood pressure2
c) Oscillometric technique- This uses the oscillometric device Oscillation of pressure in a
sphygmomanometer cuff is recorded during gradual deflation The point of maximum
oscillation corresponds to the mean arterial pressure50 The oscillation begins well above
systolic BP and continues below diastolic BP so that systolic and diastolic BP can only
be estimated indirectly according to some empirically derived algorithm
d) Ultrasound method - This uses an ultrasound transmitter and receiver placed over the
brachial artery under a sphygmomanometer cuff As the cuff is deflated the movement of
the arterial wall and systolic BP cause a Doppler phase shift in the reflected ultrasound
The diastolic BP is recorded as the point of diminished arterial motion51 Its advantage
includes the ability to detect diastolic BP in atrial fibrillation and hypotension where
Korotkoff sound is faint152
FACTORS AFFECTING BLOOD PRESSURE IN ADOLESCENTS
Several inter-related factors affect blood pressure These include-
Age - A progressive BP elevation with age has been observed in several studies2153-55
The rate of rise varies in boys and girls5455 The average systolic increase ranges between
20
166 and 286 mmHgyr for boys and 144 and 263mmHgyr for girls while that of
diastolic BP ranges from 083 and 177mmHgyr for boys and 077 and 148mmHg for
girls2155 Bugaje Yakubu and Ogala21 studied blood pressure pattern among 2035
adolescents in Zaria and found a consistent rise of BP with age The rate of rise was fairly
constant until 11-13 years in boys and 12-14 years in girls when the rise became rapid A
similar study53 also found a BP rise with age among 650 healthy school children in Jos In
a large population studies in Lebanon56 and Saudi Arabia55 BP was similarly reported to
increase consistently with age Rapid growth and biological maturation of organs which
are normal occurrences during adolescence were thought to be responsible rather than the
chronological age56 The results of these studies showed increasing blood pressure with
age despite the fact that one study55 used oscillometric method for their study while the
standard auscultation was used in the other studies Also the studied sample sizes across
these studies varied greatly with sizes of 65053 203521 571054 and 1622655 Despite this
the findings were similar
Gender ndash Results of studies on the effect of gender on BP showed that sex positively
affects blood pressure2153-55 Merhi Al-Hajj and Al-Tannir et al54 studied BP pattern in
5710 Lebanese school children while Al-Salloum El-Mouzan and Al-Herbish et al55
studied BP pattern in 16226 Saudi children and adolescents The authors reported a
higher BP in girls than boys at all ages A study21 of BP pattern in adolescents in Zaria
Nigeria demonstrated an initial higher BP in boys before puberty which reversed with the
onset of puberty up to the age of 14-15yrs when it reversed again to be higher in boys
Akinkugbe Akinwolere and Kayode56 reported no sex differences in adolescent BP in
Ibadan The reported sex difference is said to be likely due to differences in sex hormone
and pattern of growth in boys and girls57 Differences in age range of the study population
may however be responsible for the observed BP variation For instance these studies5455
21
comprised of both adolescents and pre-adolescent age groups combined in one study
while the other two studies2156 were purely adolescents21 Blood pressure is reported to be
equal in both sexes before adolescence after which the gender difference starts to
manifest most likely due to physical and hormonal changes
Socioeconomic Factors - Belonging to either end of the socioeconomic strata is found to
be associated with elevated blood pressure5859 A study in Ibadan56 reported an inverse
relationship between parental socioeconomic status and level of BP in adolescents The
authors suggested that this might be the result of the health behaviours and problems
characteristic of the lower socioeconomic class On the other hand Ejeke Ugwu and
Ezeanyika et al60 in Lokoja and another study53 in Jos both found higher BP in children
from high socioeconomic class Colhoun Hemminway and Poulter61 in a meta-analysis of
BP and socioeconomic status in developed and developing countries found an inverse
relationship of BP with socioeconomic status in developed nations and a direct correlation
in developing countries These different findings may be due to methodological
differences in socio-demographic stratification For instance Akinkugbe and
colleagues59 used fatherrsquos level of education for social classification Parentrsquos educational
level may however not equate well with level of family income The other study60 used an
automated device for their study whose values may require validation using the
recommended auscultation method Difference in environmental stresses may also be
different considering the level of development of the areas where the studies were carried
out
GeneticFamilial Factors - The effect of geneticfamilial factors on BP has been
demonstrated in some studies62-64 Familialgenetic correlations reflected in BP and other
anthropometry generally are higher among genetically close relatives such as brother-
sisters or parent-offspring than among spouses62 Levshit and Gerber63 surveyed 514
22
individuals from 135 nuclear families in Russia while Budaruddoza62 studied 1400
individuals from 380 families in India and found significant genetic influence on BP
Mijinyawa Iliyasu and Borodo65 also reported family history of hypertension as risk
factor for developing high BP in a study on prevalence of hypertension among 1000
teenagers in Kano The authors concluded that this could be due to genetic predisposition
They however did not evaluate further to determine the genetic defects The authors did
not also consider shared environmental factors known to influence blood pressure in
individuals Molecular genetic studies have identified genes as possible regulators of
BP6667 These genes regulate the renin-angiotensin-aldosterone system involved in renal
salt handling69 Mutations that increase sodium reabsorption and salt sensitivity is
associated with higher BP and vice versa68 while shared environmental risk factors may
potentiate the development of such familial conditions which might have been
responsible for outcome of the above studies6364
Environmental Factors ndash Environmental factors greatly influence BP variation in a
population592269 Akinkugbe and Ojo70 reported a consistently higher BP in Nigerian
adolescents than their counterparts of similar ages in black and white American children
The authors are of the view that this could be due to different environmental factors of the
study population Obika Adedoyin and Olowoyeye22 studied BP pattern in 2526
children aged 1-14 years in rural semi-urban and urban communities in Ilorin Nigeria
and demonstrated a hypertension prevalence of 95 in urban compared to 63 in rural
communities This was similar to the study59 in Ghana and Gambia69 The authors592269
argued that the differences were due to socioeconomic status which is higher in the urban
than the rural areas The BP variation could be accounted for by the nature of dietary
intake since the rural communities generally consume more of natural foods with less salt
and lsquojunk foodsrsquo compared to the urban populace This was demonstrated by one study61
23
which reported higher mean BP among urban communities in developing nations due to
changes in their dietary pattern Rural areas are also less exposed to the stress and hassle
of the urban cities It is of interest to note however that urban areas are a mixture of
social classes as a result of migrant workers seeking lsquogreener pasturesrsquo Okagua Anochie
and Akani71 on the other hand reported higher mean BP among rural adolescents than
their urban counter parts in Port Harcourt The authors could not identify the reason(s) for
their finding but concluded that the seemingly protective privilege of rural life may be
fading gradually The differences in the reports could however result from the sample size
composition comprising of preadolescents22 adolescents71 and adults69
Race - Higher BP levels have been reported in African-American and Hispanic school-
age children than their Caucasian counterparts and among African-Americans than the
Hispanics7273 Akinkugbe and Ojo70 demonstrated a consistently high systolic and
diastolic BP in Nigerian children compared with black and white American children of
similar age Exposure to chronic environmental stress low socioeconomic status and high
obesity rate among African American and Hispanic youths could contribute to higher
BP72-74 It can be inferred from the study that race alone may not be responsible for the
observed differences but shared environmental factors and socioeconomic status may be
contributory77 Other studies7475 however found no significant BP differences in relation
to race
Anthropometry and blood pressure (BP) - A positive correlation has been observed
between BP and anthropometry in various studies58-5977 These studies585678 observed a
significant correlation between systolic BP and weight height and body mass index
(BMI) in boys but only with weight in girls Body mass index (BMI) is used as a
measure of overall obesity but it is known to be a poor indicator of actual body fat79
Waist circumference (WC) is an aggregate measurement of the actual amount of total and
24
abdominal fat accumulation80 It is therefore a better predictor of BP and other
cardiovascular diseases8081 Guagnano Ballone and Colagrande et al81 studied the
relationship between BP and BMI WC and waist hip ratio (WHR) in 461 people and
found WC to be the most consistent anthropometry affecting BP It is of interest to note
that the study by Guagnano et al81 was in adults population while the other studies56-59
were in children and adolescents WC was also found to be a better predictor of BP in an
Italian study8081 while it was not in others56-6982 Comparing BMI and waist
circumference and their effects on BP Arauzo Lopes and Moriera et al83 in Brazilian
children found BMI to be a better predictor of BP than waist circumference This was
similar to the study by Sebanjo and Oshikoya82 in Nigerian adolescents in Akure Thus
waist circumference measurements may not be useful in the evaluation of obesity andor
hypertension in children and adolescents This may partly be explained by the uniform fat
distribution due to hormonal effect at puberty in adolescents compared to the
disproportionate fat distribution in adults Possible mechanisms for the positive
relationship between BP and high BMI includes decreased physical activity increased
salt intake impaired pulmonary functions and development of metabolic abnormalities
such as dyslipidaemia and insulin resistance8084
Nutritional factors - Diet has been a primary link between humans and their environment
and substantial evidence supports the concept that multiple dietary factors affect BP85
Well-established dietary modifications that lower BP are reduced salt intake increased
potassium intake increased protein particularly plant protein high vegetable and
polyunsaturated fats85 High sodium intake on the other hand is said to be associated with
elevated blood pressure86 A series of 3 large controlled feeding studies tested the effects
of dietary patterns on BP86-89 Of the 3 diets studied the dietary approach to stop
hypertension (DASH) emphasized fruits vegetables low-fat dairy products whole
25
grains poultry fish nuts potassium magnesium calcium and fibre as the most effective
diet89 Among all participants the DASH diet significantly lowered mean systolic BP by
55 mm Hg and mean diastolic BP by 30 mm Hg each net of changes in the control diet
DEFINITION AND CLASSIFICATION OF ADOLESCENCE
Adolescence is the transitional stage between childhood and adulthood during which many
life patterns are learnt and established90 According to World Health Organization (WHO)
adolescents are individuals between the age range of 10-19 years17 The most significant
feature of adolescence is puberty characterized by an exceptionally rapid rate of biological
growth and development including physical and sexual maturation9091 The pubertal changes
have been described by Tanner and Marshal92 and are grouped into five stages This utilizes
definite criteria for growth and development of secondary sexual characteristics like pubic
hair and breast in females and pubic hair and genitalia in males9092 The timing of these
events and the rate of growth vary due to genetic and environmental factors in different
populations92 Adolescence is divided into early middle and late periods17
Early adolescence (10-13 years) ndash This is a period of rapid growth and development of
secondary sexual characteristics and varies according to sex It corresponds to Tanner stages
1 and 290 The main features of this stage are breast bud development and menarche in girls
while testicular enlargement and seminal emission occurs in boys93
Middle adolescence (14-16 years) ndash In this stage rapid growth decreases and there is more
cognitive development as the adolescents move from concrete thinking to formal operation
and develop greater competence at abstract thinking91 This corresponds to Tanner stages 3
and 4
Late adolescence (17-19 years) ndash Here slowing of physical changes continue which permits
the emergence of a more stable body image Cognition tends to be less self-centered with
26
demonstration of care for others with increasing thought about concepts such as justice
patriotism and history It corresponds to Tanner stage 59092
ADOLESCENCE AND BLOOD PRESSURE
Adolescence is characteristically associated with increasing blood pressure because of the
physical growth and hormonal changes associated with puberty5794 After the age of one year
normal BP increases more during puberty than probably at any other time in an individualrsquos
lifetime95 Wanzhu Eckert and Saha et al57 examined data from a cohort of 182 normotensive
children in Indiana who had blood pressure measurements taken semi-annually for up to 12
yr The authors found that the rate of change in BP and weight peaked at the age of maximum
pubertal growth spurt (PGS) This BP spurt roughly coincides with growth spurt during
puberty94 Surveys of BP patterns from childhood through adolescence shows systolic and
diastolic pressures increase with age and in adolescents the increase in males is more marked
than in females especially the systolic pressure5458229495
CLASSIFICATION OF BLOOD PRESSURE IN ADOLESCENTS
The National High Blood Pressure Education Program Working Group (NHBPEPWG) of the
United States established guidelines for the definition of normal and elevated blood pressures
in children in 19876 These guidelines were revised in 20048 The definition of childhood
hypertension in the guidelines are based upon the normative distribution of blood pressure
(BP) in healthy children rather than clinical outcome data as in adults The guidelines
classified BP as normal prehypertensive or hypertensive Hypertension is graded into stage
one and two8
Normal BP - Blood pressure lt90th percentile for age sex and height Children and
adolescents with normal BP should be followed annually from the age of 3 years5 They
27
should be encouraged to maintain a healthy life style such as good dietary intake physical
activities and adequate rest8
Pre-hypertension - Blood pressure between the 90th and lt 95th or if BP exceeds
12080mmHg (even if lt90th percentile) but lt95th It was previously called high normal
BP This new description was introduced to help identify children at risk for the
development of persistent hypertension for whom targeted prevention programmes would
be most beneficial96 While recommendations for the diagnosis of hypertension in
children require that BP remains elevated on three separate occasions repeated
measurements are not necessary to classify an adolescent as pre-hypertensive11 The
prevalence of childhoodadolescence pre-hypertension in US is reported to be between
12-1796-98 In Nigeria Ejeke Ugwu and Ezeanyika99 in a study of the prevalence of
point prehypertension and hypertension in 843 adolescents in Lokoja reported a
prevalence of point prehypertension of 222 and 250 in semi urban and urban
communities respectively Ujunwa Ikefuna and Nwokocha et al100 reported 175
prehypertension prevalence among adolescents in Enugu Among adults with pre-
hypertension it is reported that as much as 10 per year develop hypertension101 There
is little information on the time course for children and adolescents with prehypertension
developing hypertension A value of between 11-7 per year has been reported in US
adolescents98 There is no known study on rate of progression of prehypertension to
hypertension in Nigerian adolescents The NHBPEP recommended that children with
pre-hypertension should have their BP checked after every six (6) months to monitor for
progression to hypertension They should be encouraged to engage in physical activity
healthy dietary behaviours and weight management if overweight Pharmacologic therapy
is not indicated except if there is strong evidence of renal disease heart failure left
ventricular hypertrophy or diabetes mellitus8
28
Hypertension Hypertension is BP persistently equal to or above the 95th percentile for
age sex and height measured on three or more separate occasions If the blood pressure
measurement obtained is gt 95th percentile the degree of hypertension should be staged
Stage 1 hypertension- BP value between the 95th and the 99th percentile plus 5mmHg It
is recommended that BP should be rechecked in 1ndash2 wks or sooner if the patient is
symptomatic If persistently elevated on 2 additional occasions it should be evaluated or
referred to source of care for pharmacologic treatment within 1 month 8
Stage 2 hypertension- BP value gt99th percentile plus 5mmHg This stage calls for more
prompt evaluation and commencement of pharmacologic therapy102 It is recommended
that the individual be evaluated or referred to source of care within 1wk or immediately if
the patient is symptomatic8
Aetiology of hypertension
Hypertension is classified as primary (essential) when there is no identifiable cause
or secondary if due to an underlying disease31 Factors such as heredity diet stress drugs and
obesity play a role in the development of essential hypertension103104 Causes of secondary
hypertension include umbilical artery catheterization renal diseases coarctation of the aorta
and endocrine disorders105106 Aderele and Sereki6 in their study of hypertension in children
reported hypertension secondary to renal pathology as the commonest cause of elevated BP
in children This study was mainly in preadolescent population in which secondary
hypertension is a common finding On the other hand Antia-Obong and Antia-Obong107
reported no apparent cause in greater than 90 of the studied subjects with elevated BP and
also reported proteinuria of 1 in the same population without any associated elevated blood
pressure The study did not however evaluate the etiology of the proteinuria A study65 of BP
in teenagers in Kano found family history of hypertension a risk factor in the study
population Another study in Enugu100 examined modifiable risk factors associated with
29
hypertension in 2694 adolescents and found only 1 and 06 of the hypertensive subjects
to be overweight and obese respectively The authors also found that smoking and alcohol
consumption were not significant risk for hypertension This may however be due to the
shorter period of consumption of these products by the students as a cumulative effect from
long term consumption is known to be associated with adverse health outcomes
Prevalence of hypertension in adolescents
The prevalence of hypertension in adolescents varies widely due to arbitrary and imprecise
definition by different researchers It was in view of this that the National High Blood
Pressure Education Program Working Group (NHBPEPWG) of the United States established
guidelines for the definition of normal and elevated blood pressures in children and
adolescents for uniformity68 In the USA the prevalence is about 20 in normal weight and
50 in their obese counterparts108 A prevalence rate of 77109 10554 and 223110 has
been reported in Spain Lebanon and South Africa respectively In Kano Nigeria a study65
on the prevalence of hypertension among 1000 teenagers found a prevalence of 72 Similar
study in Enugu100 on the prevalence of hypertension among 2694 secondary school
adolescents reported a hypertension prevalence of 54 It is of interest to note that different
prevalence was reported because of the different methodology used by the authors While the
study in Kano65 applied the adult blood pressure criterion of BP greater than 14090mmHg as
hypertension the study in Enugu100 used blood pressure greater than 95th percentile for age
and sex Also the study in Kano65 took a single set of measurement while the study100 in
Enugu measured blood pressure of the subject three times at weekly intervals Bugaje
Yakubu and Ogala21 on the other hand defined hypertension as blood pressure greater than
two standard deviations from the mean and also took six readings over thirty minutes and got
a prevalence of hypertension of 34 A prevalence rate of 48107 and 9522 in Southern
and Western region of the Nigeria respectively was also reported It is obvious that because
30
of the various defining criteria for hypertension in adolescents the prevalence of adolescent
hypertension remains imprecise
Clinical presentation- Hypertension is usually asymptomatic unless it has been
sustained or is rising rapidly109 Adolescents with essential hypertension are usually
detected during routine evaluation96 Non-specific symptoms such as lethargy headache
dizziness drowsiness visual disturbance and confusion may be present109 These could
also be signs of complications111 Secondary hypertension may show obvious features of
the underlying disease such as growth failure heat intolerance abdominal stria tremors
body swelling and haematuria8102 Croix and Feig112 studied the spectrum of symptoms in
409 children aged 7-18 years newly diagnosed hypertensive in Texas USA and reported
15 common symptoms than in the controls The symptoms were said to resolve after
commencement of antihypertensive medications The authors concluded that hypertensive
children had a variety of non-specific symptoms The three most common symptoms
reported were headache daytime tiredness and difficulty initiating sleep The study
however did not specify if other possible causes of these symptoms were excluded
Complications of hypertension - Hypertension is usually asymptomatic in adolescents
which if left unidentified overtime can cause serious complications109 Organs commonly
affected in the complication of hypertension are the heart kidneys brain and the eyes
leading to lowered life expectancy and premature death13 Left ventricular hypertrophy
(LVH) is the most prominent clinical evidence of end organ damage10 Studies have
shown that LVH can be seen in as many as 41 of patients even in adolescents with
asymptomatic hypertension10103 Adolescents with severe cases of hypertension are also
at increased risk of developing hypertensive encephalopathy seizures cerebrovascular
accidents and congestive heart failure103109 However data documenting such
complications in children and adolescents are generally lacking In a study of
31
hypertension among teenagers in Kano the researchers65 could not find any
complications in all the 1000 teenagers studied
Investigations and treatment- Basic investigations are all that may be required in
adolescents who are obese and with a family history of hypertension stage 1 disease and
normal findings on physical examination113 This is because primary hypertension is
commoner in adolescents Adolescents that are symptomatic or with stage 2 hypertension or
have features of secondary hypertension should be evaluated in more detail
Treatment of hypertension includes non-pharmacological and pharmacological
methods Non-pharmacologic management involves life style modification such as weight
reduction increased physical activities and dietary adjustment114 In a study to evaluate the
effect of diet and salt on treatment and prevention of hypertension Sacks Svetkey and
Vollmer et al86 reported the beneficial effect of both reduced salt intake and appropriate
dietary adjustment in the control of hypertension Similar benefits were reported in other
studies8788 Although both studies had fairly good sample size (n=412) the studies did not
specify if participants were on other substances or activities other than antihypertensive that
might have affected their BP The studies were also in adults and whether it has the same
effects in children and adolescents has not been evaluation However there is no doubt that
the outcome will be similar in adolescents as dietary modifications have been advocated as
non-pharmacologic management in them Non pharmacologic treatment is usually the initial
treatment in essential hypertension and as adjuvant to drug therapy in those with secondary or
complicated hypertension101114 Pharmacologic (drug) treatment includes diuretics beta-
blockers calcium channel blockers angiotensin converting enzyme inhibitors (ACEIs) and
angiotensin receptor blockers (ARB) among others106114 They are used in those with
symptomatic disease and in acute or chronic complications106
32
Prevention of hypertension may be viewed as part of the prevention of cardiovascular
disease102 In adolescents approaches to prevention include reduction in obesity
discouraging cigarette smoking and alcohol intake113 reduction in sodium intake and increase
in physical activity through community and school-based programmes103104 Growth
monitoring BP check during preventive care visit physical activity and urine screening for
proteinuria and haematuria can be used starting from early childhood
33
AIM AND OBJECTIVES
GENERAL AIM
To determine the blood pressure pattern of apparently healthy secondary school adolescents
in Jalingo Taraba State
SPECIFIC OBJECTIVES
To determine
1 Blood pressure pattern in relation to age and sex among adolescents aged 10-19
years
2 The relationship if any between blood pressure and the anthropometric parameters of
weight height BMI and waist circumference
3 The association between blood pressure and parental social-economic status
4 The point prevalence of prehypertension and hypertension in adolescents
34
MATERIALS AND METHODS
Study area
A cross-sectional survey of the blood pressure pattern of apparently healthy secondary
school adolescents aged 10-19 years was conducted in Jalingo over a six month period
from January to June 2014 Jalingo is the capital of Taraba State and lies within the
savannah belt of North Eastern Nigeria It lies between latitude 80 54rsquo north and longitude
110 21rsquo east and at an altitude of 360 meters above sea level115 Jalingo had a population of
118198 people18 The primary inhabitants are the Konas Mumuyes and Fulanis who are
mostly farmers Other indigenous ethnic groups include the Jukun Kuteb WurkumTiv
and host of other tribes The Ibos Hausas Yorubas among others are the non-indigenous
ethnic groups and are mostly civil servants and businessmen Jalingo has a tertiary health
centre the Federal Medical Centre Jalingo and the state specialist hospital It also has 15
private clinicshospital and many primary health care centres There are also tertiary
education institutions including Taraba State University As at 2013 there were 56
secondary schools in Jalingo 24 public and 32 private all of which were mixed schools
except one which is a girlsrsquo only school
Study design
The study was a cross sectional descriptive study of 1350 apparently healthy secondary
school adolescents in Jalingo
Ethical approval
Ethical approval for this study was obtained from the Scientific and Health Ethics Research
Committee of Ahmadu Bello University Teaching Hospital Zaria (Appendix 4) The Taraba
State Ministry of Education also gave the approval and permission to conduct the study in the
35
selected schools Consent was given by the studentsrsquo parents or guardian (Appendix 2) All
students whose parents gave consent voluntarily participated in the study
Sample size determination
The minimum sample size was calculated using the formula116
N=Z2 (pq) E2
Where N = minimum sample size
p = Prevalence of hypertension in adolescents A prevalence of 3421 was used
q = 1- p
E = margin of error tolerated =1
Z = 196 at 95 confidence level
N = 1962 x 0034 x (1-0034) 0012 = 1262
Therefore the minimum sample size was one thousand two hundred and sixty two
Allowance for non-responders of 5 63 extra subjects were added to the calculated
minimum sample size bringing the total to 1325 students To enhance representativeness of
the sample and to compensate for missing information and poorly filled proforma while
maintaining the sample size a total of 1350 was decided upon
Inclusion criteria
1 Students (ages 10-19 years) in the selected secondary schools
2 Students whose parents gave consent to participate in the study
3 Students who gave assent to participate in the study
Exclusion criteria
1 Students who had obvious skeletal deformities of the spine and legs which can affect
the height and ultimately the BMI
36
2 Students with known chronic disease (or history of such disease) like anaemia
chronic renal disease and cardiac disease because they are not apparently healthy and
these conditions could affect their blood pressure
3 Students with present or past history of chronic drug ingestion that can affect blood
pressure such as steriods and contraceptives
4 Students with high blood pressure already on antihypertensive
Pilot study
A pilot study was carried out in one of the schools a week before the commencement of
the study The school was selected by random sampling method using balloting and did
not participate in the main study The pilot study was carried out with the aim of
assessing the competence of the research assistants in the various measurements
following their training to ensure reliability It was also used to test the questionnaire
before its use during the main study and to provide information on the number of students
that can be measured in a day Consequently twenty students had their blood pressure
and anthropometry measured independently by the researcher and the research assistants
and data were compared using Students t-test There were no statistically significant
differences between the measurements The result of the pilot study is highlighted in
Table I It was also found that some parts of the questionnaire were not well understood
by most students and were adjusted appropriately in the main study (Appendix 1) The 20
students had their measurements done over a period of 3-4 hours (between 8am - 12noon)
by the researcher and the research assistants
Table I Result of pilot study
Variables Researcher Research t p
37
assistants
Mean(plusmnSD) SBP
mmHg
106(11) 104(12) 0550 0586
Mean(plusmnSD) DBP
mmHg
617(83) 63(10) 0450 0657
Mean(plusmnSD) Weight
kg
544(82) 527(122) 0520 0608
Mean(plusmnSD) Height m 16(01) 16(01) 0000 1000
Mean(plusmnSD) BMI
kgm2
198(36) 202(33) 0370 0716
Mean(plusmnSD) WC cm 692(72) 682(133) 0300 0769
Sampling method
Students were selected by multistage random sampling technique The list of secondary
schools obtained from the Taraba State Post Primary Schools Board served as the sampling
frame for schools There were 56 secondary schools 24 of which were public and 32 were
private schools a ratio of 113 Ten (10) schools were randomly selected by balloting four
(4) from public schools six (6) from private based on the number and approximately similar
ratio of private to public schools of 115 (46) Ten schools were selected to ensure wider
coverage and even distribution of students so that it could be truly representative of the
community All the ten schools had an overall total of eight thousand one hundred and seven
(8107) students The public schools had a total of five thousand nine hundred and forty
(5940) with nine hundred and eighty nine (989) students participating The private schools
had a total of two thousand one hundred and sixty-seven (2167) students with three hundred
and sixty one (361) participating These number (989 and 361) was calculated based on the
38
relative population of each school and proportionate to number of students in each school
Thereafter the number of students to participate per school was calculated proportionately to
the number of students in each school based on the number given by the school authority
Then the number in each class was also calculated proportionately from JSS1 to SS3 to
ensure fair and equal chance of participation for all age groups The calculation was done
thus n= a b x c
Where n= number of students per selected school
a= total numberpopulation of students in the school
b= total numberpopulation of students in all 10 selected schools (8107)
c= calculated total sample size (1350)
Students in each class from junior secondary school (JSS) 1-3 and senior secondary school
(SS) 1-3 were then randomly selected by balloting The number of selected schools total
number of students in a school and the number of students selected per school is outlined in
Table II
Table II Selected schools and number of students in each of the ten schools in Jalingo
Selected schools Total no of No of students
39
student in the
school (a)
n=8107
selected (n=abxc)
n=1350
Public schools
Govt Science Secondary School 2800 466
Govt Day Secondary School SGari 1200 200
Salisu Dogo Secondary School 1100 183
Govt Secondary School Magami 840 140
Total 5940 989
Private schools
Winners Comprehensive Secondary School 650 108
Hawai Secondary School 562 94
Centre for Quranic Science and Islamic Education 543 90
Good Success Secondary School 155 26
Jetters Academy 140 23
Yagai Academy 117 20
Total 2167 361
The study
The first contact with the students was a familiarization exercise to each of the schools during
which the teachers and students were given a talk by the researcher on blood pressure and the
40
importance of periodic blood pressure measurement They were given the opportunity to ask
questions which were responded to Both the students and their teachers actively participated
in the lectures
On the second day students were selected as described above and those selected
underwent general physical examination in the presence of a chaperon to identify those
who did not fulfilled the inclusion criteria Each selected student was given a proforma
(Appendix 1) in which information on their biodata and medical history were recorded
Other information obtained was parentrsquos medical history and their socioeconomic status
using the format described by Olusanya Okpere and Ezimokhai117 (Appendix 3) The
study was carried out in a relatively quiet and empty classroom to ensure privacy for both
male and female students The procedure for blood pressure measurement was
demonstrated on one of the research assistants and sometimes on one of the teachers by
the researcher to assure the students and allay their anxiety BP and anthropometric values
obtained were recorded in the study proforma An average of 15-20 students per day were
attended to over a period of 3-4 hours (between 8am - 12noon daily) by the researcher
one of the research assistants who is a medical officer a male nurse and a lady Youth
Corper (NYSC)
Blood pressure measurement
This was measured by the researcher and the research assistant (the medical officer) The
standard auscultation method was employed using a mercury sphygmomanometer (Acosson)
and a standard Littman stethoscope according to the guideline of the fourth report on the
diagnosis evaluation and treatment of hypertension in children and adolescents8 Each
students was rest-seated for 5 minutes before BP measurement With the student seated the
right arm rested on a table at the level of the heart an appropriate cuff size which covered
41
two-third (23rd) of the length of the arm was applied round the arm about 2cm above the
antecubital fossa Two cuff sizes were used for this study with dimensions of 10 x 24cm and
13 x 30cm the smaller cuff for the smaller adolescents and vice versa The bladder cuff was
inflated rapidly to 20-30mmHg above the point where the brachial artery was no longer
palpable The bell of the stethoscope was then placed over the brachial artery and the cuff
was deflated slowly at 2-5mmHgsecond while listening to the Korotkoff sounds Phases one
and five of the Korotkoff sounds were recorded as the systolic and diastolic BP
respectively119 Three recordings were taken at intervals of 3-5 minutes and the average was
the final BP in mmHg BP was interpreted based on the standard set by the fourth report on
the diagnosis evaluation and treatment of hypertension in children and adolescents of the
United States8 thus-
Normal BP ndash BP value between the 5th and lt 90th percentile for age sex and height
Prehypertension - BP value between the 90th and the lt95th percentile for age sex and height
or BP of 12080mmHg but less than the 95th percentile
Hypertension ndash BP value ge95th percentile for age sex and height
Students found to have prehypertension were educated and counseled on life style
modifications and the need to have their blood pressure checked in six monthsrsquo time and
annually subsequently Those with hypertension were educated on the implications of the
findings and were referred to the Federal Medical Center Jalingo for evaluation management
and follow-up
Height measurement
Height was measured in centimeters using a locally constructed stadiometer by the research
assistants Each student was measured barefooted standing with the heel back and occiput
42
against the stadiometre The head was held straight looking forward with the lower border of
the eye socket at a horizontal plane with that of the external auditory meatus The movable
part of the stadiometre was adjusted to rest on the vertex and the corresponding value read to
the nearest 01cm
Weight measurement
The weight was measured in kilograms by the researcher and the research assistants using a
bathroom scale (HANSON) Students were weighed in their approved school uniform
without caps head ties or cardigan and with their shoes removed The scale was checked
daily for accuracy using standard calibrated weight before and midway through each session
The weight of the student was measured to the nearest 01 kg
Body mass index (BMI)
This was calculated from the measured weight and height of the subject using the
formula118
BMI= Weight (kg) Height (m2)
Waist circumference measurement
WC was measured in centimeters using a measuring tape by the research assistants The
male assistant measured for boys and the lady Youth Corper measured for girls
Measurement was taken with the student standing completely relax and breathing
normally Clothing was pulled up or down and an inelastic measuring tape was placed
around the waist mid-way between the iliac crest and the lowest rib margin The ends of
the tape were pulled together lightly towards each other and the value read to the nearest
01cm117120
43
Data analysis
Data obtained were analyzed using Epi-Info statistical software package version 7 The
results obtained were presented in figures tables graphs and charts as appropriate Individual
mean BP levels were used as dependent variables and other measured variables as
independent variables The means and standard deviations were used to summarize
quantitative variables such as BP weight height waist circumference and BMI The chi-
squared test was used to test the significance of associations between categorical variables
Studentrsquos t-test was used to compare means of any two normally distributed continuous
variables Pearsonrsquos correlation coefficient and regression analysis were used to examine the
strength of association between BP and the anthropometries Probability level of statistical
significance value was set at lt005
RESULTS
General characteristics
A total of 1350 students were enrolled between January and June 2014 to determine their
blood pressure pattern 628 (465) were males and 722 (535) were females with
malefemale ratio of 111 Students enrolled in the study were drawn from both public and
44
private schools The number of students from public schools was 989 (733) while 361
(267) were from private schools as shown in Table II The mean age of the study subjects
was 153plusmn22 years with a range of 10-19 years The age and sex distribution of the students
is illustrated in Table III
Table III Age and sex distribution of 1350 study subjects in Jalingo
Ag
e
Male
n ()
Female
n ()
Total
N()
10 9(14) 13(18) 22 (16)
11 20(32) 31(43) 51(38)
12 36(57) 52(72) 88(65)
13 96(153) 85(118) 181(134)
14 92(146) 115(158) 207(153)
15 92(146) 111(154) 203(151)
16 66(105) 116(161) 182(135)
17 78(125) 91(126) 169(125)
18 79(126) 70(97) 149(110)
19 60(96) 38(53) 98(73)
To
tal
628(100) 722(100) 1350(100)
45
Socio-economic classes (SEC) ndash Most of the students were from the lower social classes
(4 and 5) with population of 650 (415 and 235) students The upper social classes (1 and
2) had the least population with 184 (62 and122) students The middle social class (3) had
516 students The distribution of the study subjects according to individual
socioeconomic class is shown in Figure I
Figure 1 Socioeconomic class distribution of students in Jalingo
Anthropometry
The anthropometric characteristics of the students are displayed in Tables IV V and VI
All the anthropometric parameters showed increasing values with age (Tables V and VI)
There were significant differences in the anthropometric indices of height (p=0000)
weight (p=0010) and body mass index (p=0000) between boys and girls but not
statistically significant for waist circumference (p=0145) as shown in Table IV
Weight ndash The mean weight of the students was 486plusmn109kg with a range of 23-100kg
(Table IV) Girls were heavier than boys up to middle adolescence after which males
46
were heavier than the females (Table V and VI) and this was statistically significant (t= -
256 p=0010)
Table IV Overall mean anthropometric measurements of the study subjects
Anthropometr
y
Male Female Total
n=628 n=722 N=1350 t p
Wt (kg)
Mean(plusmnSD) 4773(115
)
4926(103
)
4855(plusmn109
)
-
25
6
0007
Range 236-848 227-100 23-100
Ht (m)
Mean(plusmnSD) 159(012) 157(008) 158(plusmn010) 35
5
0000
Range 122-185 126-179 122-185
WC (cm)
Mean(plusmnSD) 6524(91) 6595(86) 6562(plusmn89) -
14
6
0145
Range 225-905 215-100 22-100
47
BMI (kgm2)
Mean(plusmnSD) 1825(27) 1947(33) 1891(plusmn31) -
74
1
0000
Range 117-325 114-42 114-42
Statistically significant p values at 005 level of significance Wt=Weight Ht=Height WC=Waist
Circumference BMI=Body Mass Index SD=Standard Deviation
Height- The mean height of the study population was 158plusmn09m and ranged from 122-
185m (Table IV) Girls were taller than boys at early and middle adolescence but these
reversed from 16 years in favour of the boys (Table V and VI) This differences was
statistically significant (t=448 p=0000)
Waist circumference (WC) - The overall mean waist circumference was 6562plusmn89cm and
a range of 225-100cm Girls had higher WC until late adolescence (18 years) when it
reversed but this was not statistically significant (t=-146 p=0145) This is displayed in
Tables IV V and VI
Body Mass Index (BMI) - Overall mean BMI was 189plusmn31 with a range of 114-42
There was a statistically significant difference between girls and boys (t=-741 p=0000)
Tables IV V and VI illustrate this findings
Table V Mean anthropometric measurements of 628 boys
Age No of
studen
ts
Wt(plusmnSD)
Kg
Ht(plusmnSD)
m
WC(plusmnSD)
cm
BMI(plusmnSD)
Kgm2)
48
10 9 349(50) 143(001
)
613(06) 169(01)
11 20 354(25) 143(002
)
617(13) 170(07)
12 36 363(51) 146(002
)
616(14) 167(06)
13 96 379(51) 150(003
)
602(40) 165(08)
14 92 412(50) 154(003
)
623(32) 169(08)
15 92 471(60) 160(003
)
634(39) 178(08)
16 66 525(52) 164(002
)
672(24) 192(09)
17 78 555(51) 167(002
)
680(31) 197(08)
18 79 576(61) 169(002
)
707(18) 200(08)
19 60 590(57) 170(002
)
716(16) 203(07)
Total 628 477(115 16(01) 652(91) 183(27)
49
)
Wt=Weight Ht=Height WC=Waist Circumference BMI=Body Mass Index SD=Standard Deviation
Table VI Mean anthropometric measurements of 722 girls
Age No of
students
Wt(plusmnSD)
Kg
Ht(plusmnSD)
m
WC(plusmnSD)
cm
BMI(plusmnSD)
Kgm2
10 13 313(34) 139(001) 582(05) 156(02)
11 31 361(53) 144(002) 611(12) 170(05)
12 52 403(64) 149(002) 625(21) 178(09)
13 85 458(66) 154(002) 657(22) 188(12)
14 115 478(74) 157(003) 627(48) 187(10)
15 111 508(65) 159(002) 666(34) 199(13)
16 116 521(60) 159(002) 678(28) 201(11)
17 91 541(62) 161(002) 681(28) 203(11)
18 70 556(63) 161(002) 696(21) 211(11)
19 38 540(48) 158(002) 688(14) 208(06)
Total 722 493(103) 16(010) 651(23) 190(09)
Wt=Weight Ht=Height WC=Waist circumference BMI=Body Mass Index SD=Standard Deviation
Blood pressure (BP) measurements
50
Table VII shows mean blood pressure distribution of the study population for all ages
The highest SBP and DBP were 165mmHg and 95mmHg at 18years and 15 years
respectively Table VIII displays mean BP distribution in relation to age and sex The
tables show that both systolic and diastolic blood pressure increased with age This is also
depicted in Figure 2
Table VII Mean and ranges of blood pressure of 1350 subjects
Systolic Blood Pressure
(mmHg)
Diastolic Blood Pressure
(mmHg)
Age
No of
students
Mean(plusmnSD) Range
Mean(plusmnSD) Range
10 22 936(74) 80-107 600(50) 47-70
11 51 992(106) 76-120 629(71) 47-83
12 88 1036(110) 80-140 657(60) 53-82
13 181 1042(108) 80-143 660(74) 48-88
14 207 1070(115) 83-150 675(76) 47-90
15 203 1090(119) 80-150 678(82) 47-95
16 182 1122(124) 80-150 696(80) 50-90
51
17 169 1132(118) 90-153 698(83) 48-93
18 149 1138(121) 90-165 712(88) 50-90
19 98 1131(127) 90-143 726(76) 57-90
Total 1350 1089(125) 76-165 683(82) 47-95
Table VIII Mean blood pressure in relation to age and sex
Mean(plusmnSD) Systolic blood pressure
(mmHg)
Mean(plusmnSD) Diastolic blood
pressure (mmHg)
A
ge
Male
n=628
Female
n=722
t p Male
n=62
8
Fema
le
n=72
2
t p
52
10 954(3
9)
923(6
0)
1
02
03
20
619(
32)
586(
46)
1
36
0
01
91
11 985(5
5)
997(9
2)
0
42
0
06
80
648(
39)
617(
57)
1
56
0
01
26
12 999(8
9)
1062(
117)
2
84
0
00
06
653(
29)
660(
52)
-
0
52
0
06
07
13 1012(
73)
1075(
73)
4
03
4
00
00
649(
43)
672(
59)
-
0
03
0
00
44
14 1036(
78)
1098(
78)
3
93
0
00
01
653(
44)
693(
58)
3
90
0
00
01
15 1071(
80)
1105(
87)
2
05
0
00
42
665(
58)
689(
56)
-
2
10
0
00
37
16 1135(
82)
1114(
91)
1
03
0
03
10
697(
51)
695(
61)
0
15
0
08
81
53
17 1152(
87)
1115(
77)
2
04
00
43
698(
59)
698(
58)
0
02
0
09
81
18 1141(
96)
1135(
74)
0
27
0
07
91
704(
62)
721(
63)
1
61
0
02
49
19 1146(
97)
1108(
80)
1
41
0
01
64
733(
63)
714(
43)
1
21
0
02
28
To
tal
1081(
133)
1095(
117)
-
2
05
4
00
40
678(
81)
687(
82)
-
2
07
7
00
38
Statistically significant p values at 005 levels of significance
54
Figure 2 Blood pressure distribution in relation to age and sex
SBP =Systolic blood pressure DBP=Diastolic blood pressure
Blood pressure and stages of adolescence
Table IX displays mean blood pressure according to stages of adolescence Girls had a
higher mean SBP than boys from early adolescence (t=3754 p=0000) to middle
adolescence (t=-3025 p=0003) and this was statistically significant This dominance was
also demonstrated in the DBP and was statistically significant in middle adolescence (t=-
3517 plt0000) Adolescents from private schools had higher mean SBP (t=-222
plt0027) and mean DBP (t=-461 p=0000) than those from public schools and these
differences were statistically significant
Table IX Mean blood pressure according to sex and stages of adolescence
Mean BP
(mmHg)
Age (years)
Male SBP
Female SBP
Male DBP
Female DBP
55
Stages
of
adolesc
ents
(years)
Mean(plusmnSD) systolic blood pressure
(mmHg)
Mean(plusmnSD) diastolic blood pressure
(mmHg)
Male Female t p Male Fema
le
t p
Early
(10-13)
1000(9
6)
1040(1
18)
37
54
00
00
648(
56)
653(
82)
05
99
05
50
Middle
(14-16)
1075(1
29)
1105(1
13)
-
30
25
00
03
670(
81)
694(
77)
-
35
17
00
00
Late
(17-19)
1140(1
28)
1121(1
11)
21
45
00
33
717(
85)
710(
83)
00
70
09
45
1082(1
33)
1092(1
17)
-
20
54
00
40
678(
81)
687(
82)
-
20
77
00
38
Statistically significant p values at 005 level of significance SD=Standard Deviation
Table X shows blood pressure pattern according to stages of adolescence
Prehypertension and hypertension were more prevalent in late adolescence than early and
middle adolescence (χ2=49054 p=0000) and (χ2=10305 p=0006) both of which were
statistically significant
Table X The pattern of normal BP Prehypertension and hypertension according to stages
of adolescence
56
Blood
pressure
pattern
Stages of adolescence
Early
n()
Middle
n()
Late
n()
Total
N()
χ2 p
Normal 290(84
8)
428(72
3)
275(66
1)
993(73
5)
429
79
000
0
prehypertens
ion
43(12
6)
135(22
8)
120(28
8)
298(22
1)
490
54
000
0
Hypertensio
n
9(26) 29(49) 21(51) 59(44) 103
05
000
6
342(10
0)
592(10
0)
416(10
0)
1350(1
00)
350
93
000
0
Statistically significant p value at 005 level of significance
Relationship between blood pressure and the measured anthropometry
There was a positive correlation between SBP and DBP with age and the anthropometric
variables of weight height waist circumference and BMI (Table XI) SBP showed a
stronger correlation with the anthropometries than the DBP and was stronger for weight
(r=051) and height (r=044) The waist circumference though statistically significant
showed the weakest correlation
Table XI Correlation between blood pressure age (yrs) and anthropometry
Parameters
Systolic Blood Pressure Diastolic Blood Pressure
Correlation
coefficient
p Correlation
coefficient
p
57
Age (yrs) 035 lt0000 030 lt0000
Height (m) 044 lt0000 034 lt0000
Weight (Kg) 051 lt0000 038 lt0000
WC (cm) 040 lt0000 029 lt0000
BMI
(Kgm2)
031 lt0000 023 lt0000
Statistically significant p values at 005 level of significance Wt=Weight Ht=Height WC=Waist
circumference BMI=Body Mass Index
Blood pressure distribution and socio-economic classes
Table XII shows mean blood pressure according to socio-economic class of the subjects
Lower social classes had higher mean SBP (t=1650 p=2850) and DBP (t=0193
p=00058) but these were not statistically significant
Table XII Mean Blood pressure in relation to socioeconomic classes
Blood
pressur
e
Socioeconomic classes
Upper (1 amp
2) n=184
Middle (3)
n=516
Lower (4 amp
5)
n=650
f(anova
)
p
Mean
(SD)
10857(126
)
10866(128
)
11040(109
)
1650 285
0
58
SBP
Mean
(DBP)
6820(83) 6791(83) 6957(76) 0193 005
8
SEC= Socioeconomic class SBP=Systolic Blood Pressure DBP=Diastolic Blood Pressure SD=Standard
Deviation
Table XIII shows blood pressure pattern in relation to socioeconomic classes of the
subjects The percentage of students with prehypertension was higher in the upper social
class ((χ2=3067 p=0216) while the percentage of hypertension were higher in the lower
socioeconomic classes (χ2=1037 p=0568) but these differences were not statistically
significant
Table XIII Blood pressure pattern in relation to socioeconomic status
Blood
pressure
pattern
Socioeconomic classes
Upper
(1 amp 2)
n()
Middle
(3)
n()
Lower
(4 amp 5)
n()
Total
N()
χ2 p
Normal 127(69
)
383(74
2)
483(74
3)
993(73
6)
417
6
012
4
Prehypertens
ion
52(28
3)
108(20
9)
138(21
2)
298(22
1)
306
7
021
6
Hypertension 5(27) 25(48) 29(45) 59(44) 103 056
59
7 8
184(10
0)
516(10
0)
650(10
0)
1350(10
0)
573
0
022
0
Prevalence of Hypertension and Prehypertension
Table XIV shows the prevalence of hypertension in the study population The total
number of students with hypertension was 59 giving an overall prevalence of 44
Thirty four students (25) had systolic hypertension sixteen (12) had diastolic
hypertension and nine students (07) had both systolic and diastolic hypertension
Systolic hypertension was more prevalent in the females and was more at the age of 16
years while diastolic hypertension was higher in males and this also occurred at 16 years
Among those with hypertension 27 and 16 subjects had stage 1 and 2 systolic
hypertension respectively With regard to diastolic hypertension 24 and 1 subjects had
stage 1 and 2 hypertension respectively The gender difference in the prevalence of
hypertension is not statistically significant (χ2=0831 p=0362)
The number of students with pre-hypertension was 298 giving an overall prevalence of
221 Of this 131 were males and 167 are females This is illustrated in Table XIV
Prehypertension is more prevalent in females than males and this was statistically
significant (χ2=4349 p=0037)
60
Table XIV Overall Blood pressure pattern and prevalence of hypertension and
prehypertension of 1350 students in Jalingo
Blood pressure
pattern
Males
n=()
Females
n=()
Total
N()
χ2 p
Normal 471(750) 522(723) 993(735) 2619 0106
Prehypertension 131(209) 167(231) 298(221) 4349 0037
Hypertension 26(41) 33(46) 59(44) 0831 0362
628(100) 722(100) 1350(100) 1260 0533
statistically significant p value at 005 level of significance
61
DISCUSSION
The findings of this study showed that the BP of secondary school adolescents in Jalingo
was similar in terms of mean values range and trend of progression with age to that of
other adolescents from Ibadan63 and Kogi60 (Nigeria) Ashanti (Ghana)59 and Lebanon54
The mean value was however lower than the mean BP of adolescents from Zaria
(Nigeria)21 Belgrade ( Serbia)78 and Fortaleza-Cearaacute (Brazil)83 who had higher mean BP
in both sexes and at all ages The lower mean BP in this study compared to that of
adolescents from Zaria21 Belgrade78 and Brazil83 could be due to lower mean
anthropometry of weight height and BMI in adolescents from Jalingo resulting in lower
mean BP The sample sizes of these studies7883 were also different and could have
affected the mean BP of the study population For instance the sample size in the
Brazilian study83 is 151 compared to the study in Lebanon54 with 5710 subjects The use
of the fifth Korotkoff sounds as DBP in this study21 could also have accounted for the
lower mean BP in contrast to a similar study in Zaria21 where the fourth Korotkoff sound
was used as the DBP
A progressive increase in blood pressure with age was found in this study This
was similar to most findings by researchers in Nigeria 215358-606566107 and
worldwide54555961 The peak age of rise in BP in this study was in middle adolescence
between 15-16 years in boys but much earlier in girls for both systolic and diastolic BP
This was similar to the study by Akinkugbe Akinwolere and Kayode56 in Ibadan and
Ejeke Ugwu and Ezeanyika et al60 in Lokoja This age group is usually the period of
onset of puberty The chronologic age is not the main factor responsible for BP increase
62
with age but rather the progressive increase in size of the individual Increase in body
size with growth and maturity of organs associated with the physical and hormonal
changes during puberty potentially lead to increasing BP The simultaneous increase in
weight height and other anthropometric indices alongside BP with age seen in this study
and others is in agreement with that The implication of this increase in blood pressure
with age is that those with prehypertensionhypertension in childhood may continue into
adulthood hence further increasing the high prevalence of hypertension in the adult
population with its attendant morbidity disability and mortality
Overall significant higher mean BP was recorded in girls than boys in this study
This was seen from early to middle adolescence after which it reversed in favour of the
boys Reports on the relationship between BP and sex have been inconsistent Some have
reported higher mean BP in females54-56 others higher in males5883 while yet another
reported no sex differences22 The findings of this study were similar to those of Bugaje
Yakubu and Ogala21 and Ujunwa Ikefuna and Nwokocha100 who reported a consistently
higher mean blood pressure in female adolescents up to 16 years compared to their male
counterparts of similar ages Early female predominance in mean blood pressure was also
reports by Agyemang Redekop and Owusu-Dabo et al59 in Ashanti adolescents in Ghana
and Obika Adedoyin and Olowoyeye22 in Illorin The finding was however in contrast
with the study in Calabar58 where higher mean BP was found in boys than girls at all
ages The reason for the higher mean BP in females than boys could be because of earlier
onset of puberty in girls The differences in blood pressure between boys and girls in this
study could also be accounted for by variation in the anthropometric variables of the
individuals as girls were seen to be heavier and taller up to middle adolescence
This study demonstrated a consistently positive relationship between blood
pressure and the anthropometric variables of weight height body mass index and waist
63
circumference as widely reported in other studies 545558-6165107100 Weight is reported to
correlate positively with blood pressure in several studies53565871 Body mass index
(BMI) also showed a positive relation with BP in this study as reported in other
studies5978-81 This is in-keeping with the findings in Port Hacourt71 Abeokuta83 the
Gambia69 Brazil82 and Belgrade77 children Some of these studies however were made
up of younger and older age groups Even in lean populations BMI is known to correlate
positively with BP Waist circumference was also found in this study to correlate
positively with BP This was similar to reports from other studies79-8183 It was found to
be a better predictor of BP in two Italian study8081 while it was not in another82
Comparing BMI and waist circumference and their effects on BP Arauzo Lopes and
Moriera et al82 in Brazilian children found BMI to be a better predictor of BP than waist
circumference This was similar to the report by Sebanjo and Oshikoya83 in Nigerian
adolescents in Akure Guagnano Ballone and Colagrande et al81 however found waist
circumference to be better than BMI The study81 however involved adults and may not
be applicable in children and adolescents The present study demonstrated BMI and WC
to be significant but found BMI to be a better determinant of BP than waist
circumference BMI and waist circumference measure obesity in an individual Whereas
BMI is a measure of overall obesity WC measures centralabdominal fat accumulation
and thus said to be more predictive of adverse health risk79 Obese individuals may be
prone to such condition as dyslipidaemia insulin resistance and hypertension with
reduction in the quality of life Weight BMI and or waist circumference affects blood
pressure through decreased physical activity increased cardiac output insulin resistance
impaired pulmonary function and other hormonal abnormalities8084 It seems therefore
that BMI is a better predictor of BP in adolescents than waist circumference The reason
64
for this is not obvious but it may be because of the nature of uniform fat distribution in
adolescents associated with growth and hormonal changes at puberty
Blood pressure distribution in relation to the parental socio-economic class in this
study showed that students from low socio-economic classes had higher mean blood
pressure than those from upper socioeconomic classes but this was not statistically
significant A study in Ibadanl56 reported a statistically significant negative relation
between blood pressure and parental socio-economic status It was also similar to the
study58 in Calabar In contrast other studies found the reverse536022 The reasons for the
inverse relationship between BP and socioeconomic includes exposure to chronic
environmental stress with sustained sympathetic nervous system stimulation Others are
poor health seeking behaviours due to low income andor inadequate health knowledge
high low birth weight rate and inadequate healthy diets among others97101 In the same
environment individuals from a high social class are believed to be more educated with
high income61 They have easy access to health education and awareness on hypertension
prevention and control and better accessibility and adherence to medical treatment617374
The former might be responsible for the finding of this study as Jalingo is a semi urban
community Most of its inhabitants are subsistent farmers civil servants and traders with
low income The high number of students in the lower socioeconomic class lays credence
to that
The overall point prevalence of hypertension in this study was 44 while that of
pre-hypertension was 221 This prevalence of hypertension is similar to the prevalence
of 48 by Antia-Obong and Antia-Obong107 but higher than the prevalence rate of 37
reported in Zaria21 and lower than the prevalence of 58 reported in Ibadan56 54 in
Enugu100 and the 72 reported in Kano65 The prevalence of pre-hypertension was lower
than that reported by Ejeke Ugwu and Ezeanyika99 who found a prehypertensive
65
prevalence of 25 among adolescents in Lokoja It is higher than the 173 reported by
Ujunwa Ikefuna and Nwokocha et al100 in Enugu and 12-17 by Redwine and
Daniels96 among US adolescents The differences in the reported prevalence of
hypertension and prehypertension in adolescents could have resulted from the different
criteria applied by the various researchers in defining hypertension For instance whereas
this study used BP greater than 95th percentile as hypertension a study in Kano65 used the
adult hypertensive value of BPgt14090mmHg as hypertension and got a prevalence of
72 The prevalence in that study65 could have been higher if the percentile or the
statistical definition was used as many children with BP 14090mmHg would probably be
at stage 2 hypertension This was demonstrated in the study by Bugaje Yakubu and
Ogala21 who found a prevalence of hypertension in their study to be 06 when the adult
cut off value of gt14090mmHg was used but it increased to 37 when the statistical
definition of BPgt 2 standard deviations was used
The number of times blood pressure is taken could affect the outcome as repeated
measurements over a time interval is known to give lower BP values than if BP is taken
once This study used the average of three blood pressure values taken at one sitting but
Ujunwa Ekefuna and Nwokocha100 took three readings at five minutes interval with two
other readings at a week interval In that study100 the prevalence of prehypertension
dropped from 745 during the first set of readings to 173 after the third week
readings The prevalence of hypertension also dropped from 135 to 54 over the same
period Similar decrease in the prevalence of both prehypertension and hypertension was
reported by Redwine and Daniels96 in US adolescents when blood pressure was taken
over time interval Another factor which might have affected the overall prevalence is the
Korotkoff sound used for diastolic pressure23 The 4th or 5th Korotkoff sounds has been
used by different researchers resulting in different diastolic BP The study21 in Zaria used
66
the 4th Korotkoff sound while most other researchers2265100 used the 5th About 5-
10mmHg difference is said to exist between the 4th and 5th Korotkoff sounds230 In this
study the 5th Korotkoff sound was used thus giving a higher prevalence of hypertension
in the studied population than in those where the 4th sound was used
The implication of the outcome of this study is that 44 of adolescents in Jalingo
are already hypertensive while 221 of them are at risk of developing hypertension as
they are pre-hypertensive Since 856 (255 of 298) of the prehypertensives were in the
middle and late adolescence these individuals are likely to be adults with high blood
pressure Therefore regular screening of this group of individuals who were assumed to
be a healthy population is highly important for early detection of hypertension and
intervention such as life style changes and treatment
67
CONCLUSIONS
The following conclusions can be made from this study
1 The mean and range of blood pressure of adolescents in Jalingo was similar to
those of other adolescents in Nigeria and other parts of the world Blood pressure
increased progressively with age
2 All measured anthropometry of weight height body mass index and waist
circumference correlated positively with BP but weight was the most significant
variable in BP determination
3 Socioeconomic status was not significantly related with blood pressure
4 The point prevalence of hypertension and pre-hypertension was 44 and 221
respectively using a recommended definition
RECOMMENDATIONS
1 In view of the high prevalence of prehypertension in this study it is recommended
that students should have their blood pressure measured at school entry as this will
68
help identify those with abnormal BP for early intervention Thereafter BP check
should be offered at least once a year at the beginning of a new session especially for
those found with abnormal BP at school entry
2 Physical and health education should be revived in all the schools This will lead to
increased physical activity and reduced risk of obesity and its consequences
3 School health programmes should be strengthened in schools where it already exist
and effort made to establish same in schools where it is yet to exist The programme
should include measures to detect early prehypertension and hypertension and other
health related needs of the students
LIMITATIONS
The following limitations were encountered in the course of the study
1 Exclusion and inclusion of students that were based on volunteered information and
physical evaluation This could have led to inclusion andor exclusion of adolescentss
69
with or without background renal diseases which could have affected the result of this
study
2 Home blood pressure measurement especially early morning measurement for those
with high blood pressure to possibly eliminate the effect of stress traffic andor
trekking and other school related stresses which may affect blood pressure during the
day
LINES OF FUTURE RESEARCH
This study was questionnaire based and time bound Consequently students were not
investigated for background diseases co-mordid conditions target organ damage or risk
factors for high blood pressure They were also not followed up In view of this future
research on blood pressure in adolescents should include-
70
1 Investigations such as urinalysis electrolytes urea and creatinine random blood
sugar (RBS) lipid profile and echocardiography as part of blood pressure evaluation
in adolescents
2 A long period of study to allow for follow-up over months or years to identify those
that are truly hypertensive considering the definition of hypertension It will also
reveal the rate of progression from pre-hypertension to hypertension
3 Risk factors evaluation for high blood pressure including genetic predispositions
REFERENCES
1 Blood pressure from Wikipedia the free Error Hyperlink reference not valid
Accessed 24th November 2011
2 Pickering TG Hall JE Appel LJ Falkner BE Graves J Hill MN Jones DW Kurtz T
Sheps SG Roccella EJ Recommendations for blood pressure measurement in humans
and experimental animals Part 1 Blood pressure measurement in humans A
statement for professionals from the subcommittee of professional and public
71
education of the American Heart Association council on high blood pressure research
Hypertension 2005 45 142-61
3 da Silva IRR de Souza MDG de Camargo CAC Blood pressure measurement in
children and adolescents Guidelines of high blood pressure recommendations and
current clinical practice Arq Bras Cardiol 2007 88 434-7
4 Sinaiko AR Hypertension in children N Engl J Med 1996 3351968-73
5 US Preventive Services Task Force Screening for high blood pressure
recommendations and rationale Am J Prev Med 2003 25 159-64
6 Report of the second task force on blood pressure control in children Pediatrics 1987
79 1-25
7 National high blood pressure education programme working group on hypertension
control in children and adolescents update on the 1987 task force report on high blood
pressure in children and adolescents A working group report from the national high
blood pressure education program Pediatrics 1996 98 649-58
8 National high blood pressure education program working group on high blood
pressure in children and adolescents The fourth report on the diagnosis evaluation
and treatment of high blood pressure in children and adolescents Pediatrics 2004
114 255-76
9 Aderele WI Seriki O Hypertension in Nigerian children Arch Dis Child 1974
49313-7
10 Bo S Gambino R Gentile L Pagano G Rosato R Saracco GM Cassader M
Durazzo M Cavallo-Perin P High-normal blood pressure is associated with a cluster
of cardiovascular and metabolic risk factors a population based study J Hypertens
2009 27 102-8
72
11 Bao W Threefoot SA Srinivasan SR Berenson GS Essential hypertension
predicted by tracking of elevated blood pressure from childhood to adulthood The
Bogalusa Heart Study Am J Hypertens 1995 8 657- 65
12 Richard A Rodgers M Hedley AJ Mitchel JRA Changes in blood pressure and
blood lipid during adolescence BMJ 1980 28 1563-6
13 Sundstroumlm J Neovius M Tynelius P Rasmussen F Association of blood pressure in
late adolescence with subsequent mortality cohort study of Swedish male conscripts
BMJ 2011 342 643-8
14 Zimmet P Alberti G Kaufman F Tajima N Silink M Arslanian S Wong S Bennett
P Shaw J Caprio S On behalf of the International Diabetes Federation Task Force on
Epidemiology and Prevention of Diabetes The metabolic syndrome in children and
adolescents the IDF consensus Diabetic Voice 20075229-32
15 Abdulrahman FA Babaoye AA Childhood hypertension in northern Nigeria West
Afr J Med 1978 1 7-11
16 Adediran O Jimoh A Di M Relationship between body mass index and blood
pressure in rural Nigerian dwellers Internet J Nutri Wellness 2009 7 431-4
17 World Health Organization (WHO)UNICEF Adolescence at a glance 2003 p 2
18 The National Population Commission constitution of the Federal Republic of Nigeria
(AP 23 LFN) legal notice on publication issued April 21st 2007
19 Heald FP and Gong EJ Diet Nutrition and adolescents In Shils ME and Ross AC
(eds) Modern Nutrition in Health and Disease 9th ed William and Wilkins
Maryland USA 1999 p 32
20 Okonkon CT The prevalence of Hypertension among civil servants in Calabar Nig
Med J 1979 7422-5
21 Bugaje MA Yakubu AM Ogala WN Prevalence of adolescent hypertension in Zaria
Nig J Paediatr 2005 32 77-82
73
22 Obika LF Adedoyin MA Olowoyeye JO Pattern of paediatric blood pressure in
rural semi urban and urban communities in Ilorin Nigeria Afri J Med Sci 1995 24
371-7
23 Jeremy B A short history of blood pressure measurement section of the history of
medicine Proc Roy Soc Med 1977 70 793-9
24 Lewis O Stephen Hales and the measurement of blood pressure J Hum Hypertens
1994 8 865-71
25 Crile GW Blood Pressure in Surgery An experimental and Clinical Research
Philadelphia Lippincott 1903 p 358
26 Lewis WH The evolution of clinical sphygmomanometer Bull N Y Acad Med 1941
17 871-81
27 Browne WC OrsquoBrien ET Semple PF The sphygmomanometer of Riva Roci 1896-
1996 J Hum Hypertens 1994 610 723-4
28 Segal HN How Korotkoff the Surgeon discovered the auscultatory method of
measuring arterial pressure Ann Intern Med1975 83 561-2
29 Goodman FH and Howell AA Clinical studies in the auscultatory method of
determining blood pressure University of Pennsylvania Bulletin 1911 23 469-75
30 Crenner CW Introduction of the blood pressure cuff into US medical practice
technology and skilled practice Ann Intern Med 1998 128 488-493
31 Ganon WF Circulation In Review of Medical Physiol Lange Medical Publication
New York 22nd edition 2005 p 234-63
32 Beth C Homeostatic Regulation of Blood pressure Available from
URLhttpwwweHowcom Accessed on 1st December 2011
33 Rajinder KG Fahim M Regulation of cardiovascular functions during acute blood
loss Indian J Physiol Pharmacol 2005 49 213ndash9
74
34 Dampney AL Coleman MJ Fonts MAP Hirooka Y Horiuchi J Polson JW Potts
PD Tagawa T Central mechanisms underlying short-term and long-term regulation
of the cardiovascular system Proc Austr Physio Pharmacosociety 2001 32 333-44
35 Koshiya N Guyenet PG Noradrenergic neurons and the carotid sympathetic
chemoreflex Am J Physiol 1994 267 519-26
36 Prakash ES The ultimate goal in neural regulation of cardiovascular function Adv
Phyiol Educ 2008 32 107-8
37 Allen AM Inhibition of the hypothalamic paraventricular nucleus reduces
sympathetic nerve discharge and blood pressure Proc Austr Neuroscience Society
2001 29 44-7
38 Reid IA Interactions between ANG II sympathetic nervous system and
baroreceptor reflexes in regulation of blood pressure Am J Physiol 1992 262 763-
78
39 Brooks VL Osborn JW Hormonal-sympathetic interactions in long-term
regulation of arterial pressure A hypothesis Am J Physiol 1995 268 1343-58
40 Reckelhoff JF Gender Differences in the Regulation of Blood Pressure
Hypertension 2001 37 1199-208
41 Fink GD The systemic circulation as a regulated free-market economy A new
approach for understanding the long-term control of blood pressure Clin Exp
Pharmacol Physiol 2005 32 377ndash83
42 Benard K Sources of error in blood pressure measurement Hospital Physician 2002
12 33-7 Available from URLhttp wwwturnerwhitecom
43 Chyun DA A comparism of intra arterial and auscultatory blood pressure readings
Heart lung 1985 14 223-31
75
44 Nwankwo MU Lorenz JM Gardiner JC A Standard Protocol for Blood Pressure
Measurement in the Newborn Pediatrics 1997 99 1342-9
45 Deakin CD Low JL Accuracy of the advanced trauma life support guidelines for
predicting systolic blood pressure using carotid femoral and radial pulses
observational study BMJ 2000 321 673ndash4
46 OrsquoBrian E Replacing mercury sphygmomanometers require clinician to demand
better automated device BMJ 2000 320 815-6
47 McKay DW Raju MK Campbell NR Assessment of blood pressure measuring
techniques Med Educ 1992 26 208ndash12
48 Baker RH Ende J Confounders of auscultatory blood pressure measurement J Gen
Intern Med 1995 10 223ndash31
49 Neufeld PD Johnson DL Observer error in blood pressure measurement CMAJ
1986 135 633ndash7
50 van Montfrans GA Oscillometric blood pressure measurement progress and
problems Blood Press Monit 2001 6 287ndash90
51 Ware RW Laenger CJ Indirect blood pressure measurement by Doppler ultrasonic
kinetoartriography Proceedings 20th Annual Conference Engineering Medical
Biology 1967 9 27-30
52 Matthew Fox Blood pressure measurement technique Available from URL http
wwwlivestrongcom Last edited 2nd September 2010 Accessed on 30th November
2011
53 Akor F Okolo SN Okolo AA Blood pressure and anthropometric measurements in
healthy Primary School entrants in Jos Nigeria SAJCH 2010 4 42-5
54 Merhi BM Al-Hajj F Al-Tannir M Zaide F El-Rajab M A survey of blood pressure
in Lebanese children and adolescents North Am J Med Sci 2011 3 24-9
76
55 Al-Salloum AA El-Mouzan AH Al-Herbish AS Al-Umar AA Qurashi MM Blood
pressure standard for Saudi children and adolescents Ann Saudi Med 2009 29 173-8
56 Akinkugbe FM Akinwolere AO Kayode CM Blood Pressure Pattern in
Adolescence West Afri J Med 1999 18 196-202
57 Wanzhu T Eckert GJ Saha C and Pratt JH Synchronization of Adolescent Blood
Pressure and Pubertal Somatic Growth J Clin Endo Metab 2009 94
58 Ansa VO Anah MU Odey FA Mbu PN Agbor EI Relationship between parental
socioeconomic status and casual blood pressure in coastal Nigeria Adolescents West
Afri J Med 2010 29146-52
59 Agyemang C Redekop WK Owusu-Dabo E Bruijnzeels MA Blood pressure
patterns in rural semi-urban and urban children in the Ashanti region of Ghana West
Africa BMC Public Health 2005 5114-21
60 Ejeke CCE Ugwu CE Ezeanyika LUS Olayemi AT Blood pressure patterns in
relation to geographic area of residence a cross-sectional study of adolescents in Kogi
state Nigeria BMC Public Health 2008 8 411-5
61 Colhoun HM Hemminway H Poulter WR Socioeconomic status and blood
pressure an overview analysis J Human Hypertension 1998 12 91-110
62 Badaruddoza KR Familial aggregation and heritability for cardiovascular risk factors
a family based study in Punjab India Natural Science 2010 2 732-6
63 Livshits G Gerber LM Familial factors of blood pressure and adiposity co-variation
Hypertension 2001 37 928-35
64 Fermino RC Seabra A Garganta R Antoacutenio J Maia R Genetic factors in familial
aggregation of blood pressure of Portuguese nuclear families Arq Bras Cardiol 2009
92 463-9
77
65 Mijinyawa MS Iliyasu Z Borodo MM Prevalence of hypertension among teenage
students in Kano Nigeria Nig J Med 2008 17 173-7
66 The Wellcome Trust case control consortium Genome-wide association study of
14000 cases of seven common diseases and 3000 shared controls Nature 2007 447
661-78
67 Levy D Destefano AL Larson MG ODonnell CJ Lifton RP Gavras H Evidence for
a gene influencing blood pressure on chromosome 17 genome scan linkage results for
longitudinal blood pressure phenotypes in subjects from the Framingham heart study
Hypertension 2000 36 477- 83
68 Lifton RP Wilson FH Choate KA Geller DS Salt and blood pressure new insight
from human genetic studies Cold Spring Harb Symp Quant Biol 2002 67 445ndash50
69 van der Sande MA Milligan PJ Nyan OA Rowley JT Banya WA Ceesay SM
Dolmans WM Blood pressure patterns and cardiovascular risk factors in rural and
urban Gambian communities J Hum Hypertens 2000 14 489-96
70 Akinkugbe OO Ojo OA Arterial blood pressure in rural and urban population of
Nigeria BMJ 1969 2 22-4
71 Okagua J Anochie IC Akani NA Adolescent blood pressure in Rivers State Nigeria
A rural-urban comparism NJP 20154221-7
72 Urrutia-Rojas X Egbuchunam CU Bae S Menchaca J Bayona M Rivers PA Singh
KP High blood pressure in school children Prevalence and risk factors BMC
Pediatrics 2006 6 32-9
73 Sorof JM Lai D Turner J Poffenbarger T Potman R Overweight ethnicity and the
prevalence of hypertension in school-aged children Pediatrics 2004 113 475-82
78
74 Rosner B Prineas R Daniels SR Blood pressure differences between blacks and
whites in relation to body size among US children and adolescents Am J Epidemiol
2000 151 1007-18
75 Harding S Whitrow M Lenguerrand E Maynard M Teyhan A Cruickshank JK Der
G Ethnic differences in blood pressure in adolescence the determinants of adolescent
social well-being and health study Hypertension 2010 55 1063-9
76 Cruickshank JK Mzayek F Liu L Kieltyka L Sherwin R Webber LS Srinavasan SR
Berenson GS Origins of the ldquoblackwhiterdquo difference in blood pressure roles of birth
77 Vlajinac H Miljus D Adanja B Marinkoic J ipetic S Kocev N Blood pressure levels
in 7 to 14-year-old Belgrade children J Human Hypertension 2003 17 761ndash5
78 Menezes AMB Hallal PC Dumith SC Adolescent blood pressure body mass index
and skin folds sorting out the effects of early weight and length gains J Epid Comm
Health 2011 12 42-8
79 Karelis AD St-Pierre DH Conus F Rabasa-Lhoret R Poehlman EJ Metabolic and
body composition factors in subgroups of obesity what do we know J Clin Endo
Metab 2004 89 2569-75
80 Katzmarzyk PT Srinivasan ER Chen W Malina RM Bouchard C Berenson GS
Body mass index waist circumference and clustering of cardiovascular disease risk
factors in a biracial sample of children and adolescents Pediatrics 2004 114 198-205
81 Guagnano MT Ballone E Colagrande V Della Vecchia R Manigrasso MR Merlitti
D Riccioni G Sensi S Large waist circumference and risk of hypertension Int J
Obesity 2001 25 1360 ndash 4
82 Araujo TA Lopes MVO Moriera RP Cavalcante TF Gurdes NG MartinS dA Silva
V Blood pressure of children and teenagers from a public school in Fortaleza - Cearaacute
Acta paul enferm 200720103-15
79
83 Sebanjo IO Oshikoya KA Obesity and blood pressure levels of adolescents in
Abeokuta Nigeria Cardiovasc J Afr 2011 221-5
84 Messerli FN Obesity and essential hypertension Haemodynamics sodium excretion
and plasma rennin activity Arch Int Med 1981 141 81-5
85 Appel LJ Brands MW Daniels SR Karanja N Elmer PJ Sacks FM Dietary
Approaches to Prevent and Treat Hypertension A Scientific Statement from the
American Heart Association Hypertension 2006 47 296-308
86 Sacks FM Svetkey LP Vollmer WM Appel LJ Bray GA Harsha D Obarzanek E
Conlin PR Miller ER 3rd Simons-Morton DG Karanja N Lin PH for the DASH-
Sodium Collaborative Research Group Effects on blood pressure of reduced dietary
sodium and the Dietary Approaches to Stop Hypertension (DASH) diet DASH-
Sodium Collaborative Research Group N Engl J Med 2001 344 3ndash10
87 Appel LJ Moore TJ Obarzanek E Vollmer WM Svetkey LP Sacks FM Bray GA
Vogt TM Cutler JA Windhauser MM Lin PH Karanja N A clinical trial of the
effects of dietary patterns on blood pressure DASH Collaborative Research Group N
Engl J Med 1997 3361117ndash24
88 Appel LJ Sacks FM Carey VJ Obarzanek E Swain JF Miller ER 3rd Conlin PR
Erlinger TP Rosner BA Laranjo NM Charleston J McCarron P Bishop LM for the
OmniHeart Collaborative Research Group Effects of protein monounsaturated fat and
carbohydrate intake on blood pressure and serum lipids results of the OmniHeart
randomized trial JAMA 2005 294 2455ndash64
89 Karanja NM Obarzanek E Lin PH McCullough ML Phillips KM Swain JF
Champagne CM Hoben KP Descriptive characteristics of the dietary patterns used in
the Dietary Approaches to Stop Hypertension Trial DASH Collaborative Research
Group J Am Diet Assoc 1999 99 19ndash27
80
90 Nwokocha ARC Adolescence and associated problems In Azubuike JC and
Nkanginieme KEO (eds) Paediatrics and Child Health in a Tropical Region African
Educational Services Owerri Nigeria 2nd edition 2007 p 84-99
91 Rogol RT Roemmich JN Clark PA Growth and puberty J Adol Hlth 2002 31 192-
200
92 Tanner JM Marshal WA Variation in the pattern of puberty changes in boys and girls
Arch Dis Child 1970 45 13-23
93 Nwakoro SO Ifoda K Onochie O Olomu JM Anthropometric assessment of
nutritional status and growth of 10-20 years individuals in Benin City metropolis
Nigeria Pakistan J Nutr 2006 5 117-21
94 Shankar RR Eckert GJ Saha C Tu W Pratt JH The change in blood pressure during
pubertal growth J Clin Endo Metab 2005 90 163-7
95 Department of Health and Human Services 2000 CDC Growth Charts for the United
States methods and development Series Report 11 No 246 Available from URL
httpwwwcdcgovGrowthCharts
96 Redwine KM Daniels SR Prehypertension in Adolescents Risk and Progression
Journ Clin Hypertension 2012 14 360ndash4
97 Falkner B Gidding SS Portman R Rosner B Blood pressure variability and
classification of prehypertension and hypertension in adolescence Pediatrics 2008
122238ndash42
98 Redwine KM Acosta AA Poffenbarger T Development of hypertension in
adolescents with pre-hypertension J Pediatr 2012 16098ndash103
99 Ejike ECCC Ugwu CE and Ezeanyika LUS Variations in the prevalence of point
prehypertension in a Nigerian school-going adolescent population living in a semi-
urban and an urban area BMC Pediatr 2010 1013
81
100 Ujunwa FA Ikefuna AN Nwokocha AR Chinawa JM Hypertension and
prehypertension among adolescents in secondary schools in Enugu South East Nigeria
Italian J Pediatr 20133970-5
101 Chobanian AV Bakris GL Black HR Seventh report of the Joint National
Committee on Prevention Detection Evaluation and Treatment of High Blood
Pressure Hypertension2003 421206ndash52
102 Lande MB Systemic Hypertension In Kliegman RM Behrman RE Jenson HG and
Stanton BF (eds) Nelson Textbook of Pediatrics Saunders Elsevier Philadelphia 19th
Edition 2011 pg 1592-8
103 Luma GB Spiotta RT Hypertension in Children and Adolescent Am Fam Physician
2006 73 1558-68
104 Arvind B Rupesh J Vijayakumar M Madhuri K Ali U Evaluation and management
of hypertension Indian Paediatr 2007 44 103-21
105 Flynn JT Neonatal hypertension Diagnosis and management Pediatr Nephrol 2000
14 332-41
106 Steyn K de Wet T Richter L Cameron N Levitt NS Morrel C Cardiovascular
diseases risk factors in 5-year old urban South African children- The Birth to Ten
Study SAMJ 2000 90 7126
107 Antia-Obong OE Antia-obong LE Arterial blood pressure of Nigerian Urban and
Rural school children Nig J Paediatr 1991 18 3-11
108 Nguyen NT Magno CP Lane KT Hinojosa MW Lane JS Association of
hypertension diabetes dyslipidemia and metabolic syndrome with obesity findings
from the National Health and Nutrition Examination Survey 1999 to 2004 J Am Coll
Surg 2008 207 928-34
82
109 Solar MB Gill A Rey J Epidemiology of arterial blood pressure in school children
population Aten Primaria 1992 9 212-4
110 Steyn K de Wet T Richter L Cameron N Levitt NS Morrel C Cardiovascular
diseases risk factors in 5-year old urban South African children- The Birth to Ten
Study SAMJ 2000 90 7126
111 Linkas J The assessment and management of hypertensive emergencies and
urgencies in children Pediatr Emerg Care 2005 21391-6
112 Croix B Feig DI Childhood hypertension is not a silent disease Pediatr Nephrol
2006 21527-32
113 Flynn JT Anderson MH Characteristics of children with primary hypertension seen
at a referral centre Pediatr Nephrol 2007 44 103-21
114 Nakao M Yano E Nomura S Kuboki T Blood pressure lowering effects of
biofeedback treatment in hypertension a meta-analysis of randomized controlled trials
Hypertension 2003 26 37- 46
115 Jalingo Available from URLhttpwwwencyclopedia Britanica Accessed on 3rd
December 2011
116 Araoye MO Research Methodology with Statistics for Health and Social Sciences
Nathadex Publishers Saw-Mill Ilorin Nigeria 2004 pg 115-21
117 Olusanya O Okpere E Ezimokhai M The importance of social class in voluntary
fertility control in a developing country West Afr J Med 1985 4 205-12
118 World Health Organization expert committee Physical status the use and
interpretation of anthropometry WHO technical report series No 894 Geneva WHO
1995 p 424ndash38
119 Guidelines subcommittee WHOISH guideline for management of hypertension J
Hypertens 1999 17 151-83
83
120 Aubay B How to measure waist circumference Available from
URLhttpwwwehowcom Last updated August 10th 2011 and accessed on December
9th 2011
APPENDICES
Appendix 1
PROFORMA ON BLOOD PRESSURE PATTERN IN APPARENTLY HEALTHY
SECONDARY SCHOOL ADOLESCENTS IN JALINGO
PUBLIC SCHOOL [ ]
Serial No
84
PRIVATE SCHOOL [ ]
A BIODATA
1 Age (years) 10[ ] 11[ ] 12[ ] 13[ ] 14[ ] 15[ ] 16[ ] 17[ ] 18[ ] 19[ ]
2 Gender M [ ] F [ ]
3 Class JSS 1-3 [ ] SS1-3 [ ]
B MEDICAL AND SOCIAL HISTORY Yes [1] No [2]
1 Have you ever passed blood in your urine [ ]
2 Have you ever had your face or legs swollen [ ]
3 Are you on any drug for long time (such as pills steroids marijuana codeine
NSAIDs containing drugs tramal and others) [ ]
If yes specifyhelliphelliphellip
C SOCIO-ECONOMIC CLASSIFICATION
Fatherrsquos occupation
Score 1 Professionals top civil servants politicians and top businessmen
2Middle-level civil servants technicians skilled-artisans and well-to-do
traders
3 Unskilled workers and those in general whose income would be at or below
the national minimum wage
Mothers educational level
Score 0 Education up to University level
1 Secondary or tertiary level below the University
2 No formal education or up to primary level only
D ANTHROPOMETRY
i Weight (Kg) ndash 1helliphellip 2helliphelliphellip Averagehelliphelliphelliphellip
ii Height (m) ndash 1helliphellip 2helliphellip Averagehelliphelliphelliphellip
85
iii Body mass index = weightheight (kgm2)
v Waist circumference (cm) ndash 1helliphellip 2helliphelliphellip Averagehelliphelliphelliphellip
iv Blood Pressure (mmHg) - 1helliphellip 2hellip 3helliphellip Averagehelliphelliphelliphellip
Appendix 2
AUTHORIZATION AND CONSENT TO PARTICIPATE IN A RESEARCH
I Dr Peter Teru Yaru of the Department of Paediatrics Ahmadu Bello University
Teaching Hospital (ABUTH) Zaria Irsquom conducting a research on the blood pressure
pattern among secondary school adolescents in Jalingo
The aim of the study is to know the level of blood pressure among their age
groups Those with high blood pressure (or hypertension) will be identified appropriately
advised and referred for further care The study will involve taking their weight height
blood pressure and waist circumference Female assistants shall be responsible for
86
measuring waist circumference of female students Students will also be given a
questionnaire on some of their activities drug use among others all aimed at looking for
factors which can affect their blood pressure Information obtained shall be treated with
utmost confidentiality and for this research work only Please note that participation is
voluntary I will be glad if you give consent for your childward to participate in the
study
Statement by parents Irsquove read and understood this consent form and agreed for my
child to be included in the study
Parents name Researcherrsquos name and sign
Parents phone no if any Date
Parents signthumb print Phone no
87
Appendix 3
SOCIO-ECONOMIC SCORE
The classification of socio-economic scores based on fatherrsquos occupation and motherrsquos
education by Olusanya et al117
A Husband (fatherrsquos occupation)
Score 1 Professionals top civil servants politicians and businessmen
2 Middle-level bureaucrats technicians skilled-artisans and well-to-do traders
3 Unskilled workers and those in general whose income would be at or below
the national minimum wage
B Mothers educational level
Score 0 Education up to University level
1 Secondary or tertiary level below the University
2 No formal education or up to primary level only
The socio-economic class of the childrsquos mother is obtained by adding the scores from A
and B above and graded I-V as appropriate for example
Score (1) from A plus score (0) from B = social class I
Score (2) from A plus score (0) from B = social class II
Score (2) from A plus score (1) from B = social class III
Score (2) from A plus score (2) from B = social class IV
Score (3) from A plus score (0) from B = social class III
Score (3) from A plus score (1) from B = social class IV
Score (3) from A plus score (2) from B= social class V
Page 6
6
ACKNOWLEDGEMENTS
I first and foremost acknowledge my supervisors in the persons of Professor WN Ogala Dr
HW Idris and Dr AJ Uniga for their untiring guidance and assistance throughout the period of
this work I am also grateful to all the consultants and residents of the Department of
Paediatrics ABUTH for their advice criticism and suggestions
The study would have been unsuccessful without the cooperation of the Taraba State
Post Primary Schools Board The school principals and the students were all wonderful and I
highly appreciate their cooperation during the study
My research assistants were very committed and dedicated and I really appreciate them
I particularly appreciate Dr AO Awolowo for his untiring participation in the study
Similarly I want to acknowledge the nurseMr E Joseph and Miss F Geoffrey the female
youth corper who both assisted with the anthropometric measurements
I acknowledge my primary institution the Federal Medical Centre Jalingo for
sponsoring me for the residency training I appreciate their moral and financial assistance
The management of ABUTH is also highly appreciated for giving me the opportunity of
training in her institution
Finally the support prayers and encouragement of my family kept me going during this
period I specially appreciate my dearest wife Susan and our children for standing by me even
when I was not always available when they needed me I also acknowledge my senior brother
Joseph Teru all my friends and other people who have contributed in one way or the other to
the successful completion of this work I thank them all
7
LIST OF ABBREVIATIONS
ADH Antidiuretic Hormone
ANP Atrial Natriuretic Peptide
BMI Body Mass Index
BP Blood pressure
CDC Centre for Disease Control
CVA Cerebro-vascular accident
DASH Dietary approach to stop hypertension
DBP Diastolic blood pressure
Ht Height
JSS Junior secondary school
Kg Kilogramme
M Meter
mmHg Millimeters of Mercury
NHBPEPWG National High Blood Pressure Education Programme Working Group
NCHS National Centre for Health Statistics
PGS Pubertal Growth Spurt
PHC Primary Health Care
QI Queteletrsquos index
SBP Systolic blood pressure
SSS Senior secondary school
SMR Sexual maturity rating
USA United States of America
WC Waist circumference
WHO World Health Organization
WHR Waist-hip ratio
Wt Weight
8
LIST OF TABLES
Table I Result of pilot study 26
Table II List of schools and number of students selected 28
Table III Age and sex distribution of the study subjects 33
Table IV Overall ean anthropometric measurements of the study subjects 35
Table V Mean anthropometric indices of 628 boys 36
Table VI Mean anthropometric indices of 722 girls 37
Table VII Mean and ranges of blood pressure of 1350 subjects 38
Table VIII Mean blood pressure in relation to age and sex 39
Table IX Mean blood pressureaccording to sex and stages of adolescence 41
Table X The pattern of normal BP prehypertension and hypertension according to stages of
adolescence 41
Table XI Correlation between blood pressure and anthropometry 42
Table XII Mean blood pressure in relation to socioeconomic classes 43
Table XIII Blood pressure pattern in relation to socioeconomic classes 43
Table XIV Overall Blood pressure pattern and prevalence of hypertension 45
9
LIST OF FIGURES
Figure 1 Studentsrsquo distribution according to socioeconomic classes 34
Figure 2 Blood pressure distribution in relation to age and sex 40
10
SUMMARY
A cross sectional study of blood pressure pattern in apparently healthy secondary school
adolescents aged 10-19years in Jalingo Taraba state was carried out over six months period
from January to July 2014 One thousand three hundred and fifty (1350) students
participated comprising 628 (465) boys and 722 (535) girls Variables measured
included blood pressure weight height waist circumference and body mass index was
calculated from the weight and height
Overall the mean anthropometric values and blood pressure increased with age
irrespective of sex The mean weight of the students was 486plusmn109kg with a range of 23-
100kg while the mean height was 16plusmn01m and ranged from 12-19m The mean waist
circumference was 656plusmn89cm and ranged from 22-100cm while the meanbody mass index
(BMI) was 189plusmn31 with a range of 114-420
The overall mean systolic blood pressure was 1089plusmn125mmHg with a range of 76-
165mmHg whilethe mean diastolic blood pressure was683plusmn82mmHg and ranged from 47-
95mmHg The gender related differences in blood pressure showed mean systolic blood
pressure for boys and girls to be 1081plusmn133mmHg and 1095plusmn117mmHg (t=-2054
p=0040) while the mean diastolic blood pressurewas 678plusmn81mmHg and
687plusmn82mmHg(t=-2077 p=0038) respectively Girls generally had a higher mean systolic
blood pressure than boys from early adolescence (t=3754 p=0007) to middle adolescence
(t=-3025 p=0011) but reversed during late adolescence with boys having higher mean
systolic blood pressure (t=2145 p=0033) and these differences were statistically significant
Girls also showed dominance in the diastolic blood pressurein early and middle adolescence
but only statistically significant during middle adolescence (t=-3517 plt0000) Adolescents
from private schools had higher meansystolic blood pressure of 1102plusmn123mmHg than those
11
from public schools with 1084plusmn125mmHg(t=-222 plt0027)and higher mean diastolic
blood pressure of 703plusmn80mmHg than those from public schools with 677plusmn81mmHg(t=-
461 p=0000)
Blood pressure correlated positively with age (r=030-035 plt0000) height (r=034-
044 plt0000) weight (r=038-051 plt0000) body mass index (r=029-040 plt0000) and
waist circumference (r=023-031 plt0000) The socio-economic class associated negatively
with blood pressure withthose from upper socio-economic classeshavinga relatively
lowermean blood pressure than their counterparts from lower socio-economic classes but the
differences were not statistically significant for both systolic (f=1650 p=2850) and diastolic
blood pressure (f=0193 p=0058)
The overall point prevalence of hypertension was 44(59 0f 1350) with gender specific
prevalence for malebeing 41 (26 of 628 boys) and46 (33 of 722 girls) for females The
gender difference was not statistically significant (χ2=0831 p=0362) According to stages of
hypertension 15 (10 of 628)and 11 (7 of 628) males had stages 1 and 2 systolic
hypertension respectively while24 (15 of 628) had stage 1 diastolic hypertension andnone
had stage 2 diastolic hypertension Similarly 24 (17 of 722) and 12 (9 of 722) females
had stages 1 and 2 systolic hypertension respectively while 12 (9 of 722) and only 01 (1
of 722) girls had stages 1 and 2 diastolic hypertension respectively The overall prevalence of
pre-hypertension was 221(298 of 1350) with gender related prevalence of 21 (131 of
628) for males and231 (167 of 722) for femalesThe gender difference was statistically
significant (χ2=4349 p=0037)
In view of the high prevalence of pre-hypertension of 221 (298 of 1350) in this
study it is recommended that blood pressure measurement should be included as part of
medical evaluation at secondary school entry and at least annually thereafter especially for
those found to be at risk of hypertension during school entry
12
INTRODUCTION
Blood pressure (BP) is the pressure exerted by circulating blood volume on the walls of
blood vessels1 It is one of the vital signs measured during routine physical examination2
Blood pressure measurement is done to screen for hypertension and other cardiovascular
risk factors determining risk for various medical procedures identifying patients in
potential or actual clinical deterioration and determining individualrsquos fitness for an
occupation3 Its value as a screening tool in adults has long been documented and is an
established important component of routine paediatric physical examination4
The importance of BP measurement in children and adolescents is based on the fact
that hypertension is now increasingly diagnosed among them5-8 The American Academy
of Paediatrics now recommends routine screening of asymptomatic adolescents and
children during preventive care visits Such screening will identify potentially treatable
and preventable causes of hypertension and initiate early treatment to prevent
complications5
Hypertension is an important health problem all over the world5-9 because it is
usually silent and the presence of symptoms may indicate end organ damage10 It is
known to track well into adulthood thus making BP measurements in youths valuable for
identifying adolescents at risk of essential hypertension in adulthood11 Individuals with
high BP in their childhood are more likely to have high BP in subsequent years12 The
phenomenon of BP tracking into adulthood and the demonstration of the beginnings of
hypertensive target organ damage during childhood together with the increased
prevalence of childhood essential hypertension have raised concern of an impending
epidemic of cardiovascular morbidity and mortality10
The consequences of hypertension in children range from increased morbidity
from its causes complications or its treatment to high mortality13 The most frequently
13
and perhaps severely affected organs are the heart kidneys brain and the eyes leading to
lowered life expectancy and premature death13 In addition hypertension is a component
of the metabolic syndrome associated with similar and perhaps more severe consequences
in affected individuals14 Abdulrahaman and Babaoye15 in a study of hypertension in
Nigerian children observed a mortality rate of 28 within the first year after diagnosis
Similar mortality of 275 was reported by Aderele and Seriki9 Hypertension also places
an excessive financial burden on the population and health system consuming scarce
resources16
Adolescence is the transitional period of development between childhood and
adulthood The World Health Organization (WHO) defines adolescents as individuals
between the ages of 10 and 19 years and they account for 40 of Nigeriarsquos population1718
Adolescence is characterized by rapid biological psychological and cognitive changes
largely dependent on hormonal and environmental influences19 Many of the responses to
these influences include behaviours that have direct implications on health such as harmful
dietary intake alcoholism smoking substance abuse and sedentary lifestyle19 These
coupled with social stresses such as city traffic congestion have negative health impact and
predispose to obesity and increased risk of cardiovascular disease such as hypertension and
metabolic syndromes10 20 It has been shown that if preventive measures are started early in
childhood and adolescence they may lead to significant reduction in the high prevalence of
hypertension and metabolic syndrome currently observed in adults81320
JUSTIFICATION FOR THE STUDY
Hypertension is associated with high morbidity affecting major organs of the body such as
the heart kidneys and the brain1314 and a mortality of up to 275-28915 It is now diagnosed
frequently in adolescents with a reported prevalence of 35-952122 The younger the age of
14
onset of hypertension the greater the reduction in life expectancy if left untreated13 Even
asymptomatic adolescents with mild blood pressure elevations can have target organ
damage10 Studies121420 have shown that early identification and intervention may lead to a
significant reduction in the high prevalence of hypertension and metabolic syndrome
currently observed in adults In view of this routine blood pressure check-ups for children
and adolescents have been advocated during medical evaluations8 Blood pressure is
however not routinely measured in most paediatric clinical practices in Nigeria
Consequently only few children will have their blood pressure measured when they fall sick
or during preventive care visits In addition hospital and clinic BP measurements may be
associated with falsely elevated BP called lsquolsquowhite coat hypertensionrsquorsquo8 BP measurement of
children outside of the hospital setting such as in schools will provide opportunity for
apparently healthy individuals and possibly eliminate white coat hypertension The need for
surveillance for the early identification of adolescents in Jalingo who are at risk of
hypertension and to initiate measures aimed at preventing its consequences is therefore the
justification for this study In addition the study will add to the body of knowledge on
adolescent blood pressure as there has been no previous study on BP from Jalingo and
northeastern Nigeria as a whole This will help inform public health policies regarding blood
pressure control and prevention in Taraba State in particular and in Nigeria in general
15
LITERATURE REVIEW
HISTORICAL PERSPECTIVE
Blood pressure measurement first started in the eighteenth century with the experiment of
Stephen Hales to whom its discovery can be attributed as reported by Jeremy2324
Accurate study of blood pressure as reported by Crile25 began with the introduction of a
manometer by Poiseuille a century later The first truly accurate blood pressure
measurement in man was by the Surgeon Faivre in 1856 when he connected an artery to a
mercury manometer to obtain direct readings24 Non-invasive methods of BP
measurement started with the discovery of the sphygmograph in 1855 by Vierordt as
reported by Crile25 and improvement by Potain in 1889 gave birth to the
sphygmomanometer26 In 1896 Scipione Riva-Rocci developed the method upon which
present-day technique is based27
Segal28 reported that the use of stethoscope for BP measurement was first highlighted
in 1905 by a Russian surgeon Korotkoff who documented hearing a tapping sound using a
stethoscope placed over the brachial artery as the Riva-Rocci cuff was deflated Goodman
and Howell29 recommended the division of the changing sounds into five distinct phases and
physicians subsequently determined blood pressure according to the point of appearance and
muffling or disappearance of the sounds30
DEFINITION AND REGULATION OF BLOOD PRESSURE
Blood pressure is defined as the product of cardiac output and peripheral vascular
resistance131 During each heartbeat BP varies between a maximum (systolic) and a
minimum (diastolic) pressure and is measured in millimeters of mercury (mmHg)1 Blood
16
pressure is regulated by different mechanisms acting either rapidly or slowly to maintain it
within normal range for optimal cellular performance3132
Intrinsic Regulation
Intrinsic factors regulating BP include stroke volume and heart rate which both influence
cardiac output31 Stroke volume depends on the volume of blood that fills the ventricles and
this depends on the preload and afterload33 A higher afterload will decrease stroke volume
causing low cardiac output and low BP and vice versa When cardiac output increases more
volume is derived from the venous pool increasing preload Similarly an increased heart rate
will lead to increased cardiac output and BP3134
Reflex Regulation
The baroreceptors within the aortic arch and carotid sinuses contain sympathetic and
parasympathetic nerve fibres3435 These are sensory nerves which run from the medulla
and they respond to stretch of the tissue in which they lie by increasing or decreasing the
rate of signaling36 and act fast in regulating BP34 Sympathetic stimulation causes
increased heart rate and widespread vasoconstriction to increase BP while
parasympathetic stimulation produces the opposite3537
Hormonal Regulation
Hormones regulating blood pressure include renin-angiotensin-aldosterone and
antidiuretic hormone (ADH) They act slowly by responding to changes in intravascular
volume and osmolality38 Angiotensin II is a potent vasoconstrictor and stimulates the
release of aldosterone from the adrenal gland39 Aldosterone increases sodium absorption
and fluid retention leading to increased BP ADH is a potent vasoconstrictor and plasma
volume regulator and its stimulation results in fluid retention and vasoconstriction39
Other hormones regulating BP include the sex hormones thyroid parathyroid cortisol
and ACTH They act on the rennin-angiotensin-aldosterone system to regulate BP3940
17
Renal Regulation
The kidneys control blood pressure through the retention and excretion of extracellular
fluid35 An increase in renal fluid retention will increase extracellular volume and higher
blood pressure whereas increased renal excretion leads to lower blood pressure41 This is
achieved through the action of ADH aldosterone and atrial natriuretic peptide (ANP)41
METHODS OF MEASURING BLOOD PRESSURE
Blood pressure can be measured by invasive and non-invasive methods
1) Invasive (or direct) method - Blood pressure is most accurately measured invasively
through an arterial line4243 It is the gold standard by which the accuracy of other blood
pressure measuring devices and methods are assessed4344 Chyun43 compared direct and
indirect blood pressure readings in 14 intensive care unit patients and found that the
auscultatory method overestimates the systolic and diastolic BP especially if the VI Kortkoff
sounds is used as an indicator of diastolic BP This can often over estimate reading by as
much as 20 mm Hg43 This study is made up of very small sample size to make general
conclusion on the differences in BP values from the two methods compared Although the
invasive method is the gold standard for true BP measurement it is associated with serious
complications related to arterial catheterization and the procedure itself may be technically
difficult It is mainly used in experimental procedures and in monitoring critically ill patients
in intensive care units42
2) Non invasive (indirect) methods These are simpler and quicker than the invasive
method and are commonly used for routine blood pressure examinations They may
however yield lower accuracy and small systematic differences in numerical results43
These methods include-
18
a) Palpation method - A minimum systolic value can be estimated by palpation Deakin
and Low45 reported that a palpable radial femoral or carotid pulse indicates a minimum
systolic BP of 80 70 and 60 mmHg respectively The study was carried out among adults
and these values could not be applicable in children and neonate whose maximum
systolic BP may be lower than the reported minimum values A more accurate systolic BP
value can be determined by inflating and then deflating sphygmomanometer cuff while
palpating the pulse The systolic BP corresponds to the pressure at which the radial pulse
becomes palpable45 Its disadvantages are that pressure obtained is usually 2-5mmHg less
than those obtained by auscultation and diastolic BP cannot be measured32
b) Auscultation method- Also called the Korotkoff method is the method of choice in
clinical practice142 It involves using a stethoscope and a sphygmomanometer46 The
mercury sphygmomanometer is the gold standard for BP measurement A Riva-Rocci
cuff 27 is placed over the arm and inflated to occlude the brachial artery It is then
gradually deflated until blood flow is re-established accompanied by a tapping sound
which can be detected by the stethoscope held over the artery Five sounds are
traditionally heard and classified into phases30 The first phase corresponds to the systolic
BP while the last or fifth phase corresponds to the diastolic BP30 The fourth phase
alternatively is used to measure the diastolic pressure if a 10 mmHg or greater
differences exist between the initiation of phases fourth and five or if the fifth sound is
heard down to 0 mmHg8 This may occur in cases of high cardiac output or peripheral
vasodilatation children or in pregnancy This method though the method of choice in
clinical practice may however be associated with errors arising from faulty technique and
equipment4748 as well as observer bias49 This method was used for this study because of
its widespread general usage its reliability and accuracy Unlike other methods the
instruments (mercury sphygmomanometer and stethoscope) do not require any
19
calibration and values obtained do not require validation by other methods The standard
World Health OrganizationCenter for Disease Control (WHOCDC) blood pressure
reference percentile tables were generated using the mercury sphygmomanometer hence
the auscultation method is the gold standard for BP evaluation258
The aneroid sphygmomanometer measures BP by mechanical system of metal
bellows that expand as the cuff pressure increases in a series of levers that register the
pressure on a circular scale The hybrid shygmomanometer combines some of the features
of the two and uses an electric transducer to record blood pressure2
c) Oscillometric technique- This uses the oscillometric device Oscillation of pressure in a
sphygmomanometer cuff is recorded during gradual deflation The point of maximum
oscillation corresponds to the mean arterial pressure50 The oscillation begins well above
systolic BP and continues below diastolic BP so that systolic and diastolic BP can only
be estimated indirectly according to some empirically derived algorithm
d) Ultrasound method - This uses an ultrasound transmitter and receiver placed over the
brachial artery under a sphygmomanometer cuff As the cuff is deflated the movement of
the arterial wall and systolic BP cause a Doppler phase shift in the reflected ultrasound
The diastolic BP is recorded as the point of diminished arterial motion51 Its advantage
includes the ability to detect diastolic BP in atrial fibrillation and hypotension where
Korotkoff sound is faint152
FACTORS AFFECTING BLOOD PRESSURE IN ADOLESCENTS
Several inter-related factors affect blood pressure These include-
Age - A progressive BP elevation with age has been observed in several studies2153-55
The rate of rise varies in boys and girls5455 The average systolic increase ranges between
20
166 and 286 mmHgyr for boys and 144 and 263mmHgyr for girls while that of
diastolic BP ranges from 083 and 177mmHgyr for boys and 077 and 148mmHg for
girls2155 Bugaje Yakubu and Ogala21 studied blood pressure pattern among 2035
adolescents in Zaria and found a consistent rise of BP with age The rate of rise was fairly
constant until 11-13 years in boys and 12-14 years in girls when the rise became rapid A
similar study53 also found a BP rise with age among 650 healthy school children in Jos In
a large population studies in Lebanon56 and Saudi Arabia55 BP was similarly reported to
increase consistently with age Rapid growth and biological maturation of organs which
are normal occurrences during adolescence were thought to be responsible rather than the
chronological age56 The results of these studies showed increasing blood pressure with
age despite the fact that one study55 used oscillometric method for their study while the
standard auscultation was used in the other studies Also the studied sample sizes across
these studies varied greatly with sizes of 65053 203521 571054 and 1622655 Despite this
the findings were similar
Gender ndash Results of studies on the effect of gender on BP showed that sex positively
affects blood pressure2153-55 Merhi Al-Hajj and Al-Tannir et al54 studied BP pattern in
5710 Lebanese school children while Al-Salloum El-Mouzan and Al-Herbish et al55
studied BP pattern in 16226 Saudi children and adolescents The authors reported a
higher BP in girls than boys at all ages A study21 of BP pattern in adolescents in Zaria
Nigeria demonstrated an initial higher BP in boys before puberty which reversed with the
onset of puberty up to the age of 14-15yrs when it reversed again to be higher in boys
Akinkugbe Akinwolere and Kayode56 reported no sex differences in adolescent BP in
Ibadan The reported sex difference is said to be likely due to differences in sex hormone
and pattern of growth in boys and girls57 Differences in age range of the study population
may however be responsible for the observed BP variation For instance these studies5455
21
comprised of both adolescents and pre-adolescent age groups combined in one study
while the other two studies2156 were purely adolescents21 Blood pressure is reported to be
equal in both sexes before adolescence after which the gender difference starts to
manifest most likely due to physical and hormonal changes
Socioeconomic Factors - Belonging to either end of the socioeconomic strata is found to
be associated with elevated blood pressure5859 A study in Ibadan56 reported an inverse
relationship between parental socioeconomic status and level of BP in adolescents The
authors suggested that this might be the result of the health behaviours and problems
characteristic of the lower socioeconomic class On the other hand Ejeke Ugwu and
Ezeanyika et al60 in Lokoja and another study53 in Jos both found higher BP in children
from high socioeconomic class Colhoun Hemminway and Poulter61 in a meta-analysis of
BP and socioeconomic status in developed and developing countries found an inverse
relationship of BP with socioeconomic status in developed nations and a direct correlation
in developing countries These different findings may be due to methodological
differences in socio-demographic stratification For instance Akinkugbe and
colleagues59 used fatherrsquos level of education for social classification Parentrsquos educational
level may however not equate well with level of family income The other study60 used an
automated device for their study whose values may require validation using the
recommended auscultation method Difference in environmental stresses may also be
different considering the level of development of the areas where the studies were carried
out
GeneticFamilial Factors - The effect of geneticfamilial factors on BP has been
demonstrated in some studies62-64 Familialgenetic correlations reflected in BP and other
anthropometry generally are higher among genetically close relatives such as brother-
sisters or parent-offspring than among spouses62 Levshit and Gerber63 surveyed 514
22
individuals from 135 nuclear families in Russia while Budaruddoza62 studied 1400
individuals from 380 families in India and found significant genetic influence on BP
Mijinyawa Iliyasu and Borodo65 also reported family history of hypertension as risk
factor for developing high BP in a study on prevalence of hypertension among 1000
teenagers in Kano The authors concluded that this could be due to genetic predisposition
They however did not evaluate further to determine the genetic defects The authors did
not also consider shared environmental factors known to influence blood pressure in
individuals Molecular genetic studies have identified genes as possible regulators of
BP6667 These genes regulate the renin-angiotensin-aldosterone system involved in renal
salt handling69 Mutations that increase sodium reabsorption and salt sensitivity is
associated with higher BP and vice versa68 while shared environmental risk factors may
potentiate the development of such familial conditions which might have been
responsible for outcome of the above studies6364
Environmental Factors ndash Environmental factors greatly influence BP variation in a
population592269 Akinkugbe and Ojo70 reported a consistently higher BP in Nigerian
adolescents than their counterparts of similar ages in black and white American children
The authors are of the view that this could be due to different environmental factors of the
study population Obika Adedoyin and Olowoyeye22 studied BP pattern in 2526
children aged 1-14 years in rural semi-urban and urban communities in Ilorin Nigeria
and demonstrated a hypertension prevalence of 95 in urban compared to 63 in rural
communities This was similar to the study59 in Ghana and Gambia69 The authors592269
argued that the differences were due to socioeconomic status which is higher in the urban
than the rural areas The BP variation could be accounted for by the nature of dietary
intake since the rural communities generally consume more of natural foods with less salt
and lsquojunk foodsrsquo compared to the urban populace This was demonstrated by one study61
23
which reported higher mean BP among urban communities in developing nations due to
changes in their dietary pattern Rural areas are also less exposed to the stress and hassle
of the urban cities It is of interest to note however that urban areas are a mixture of
social classes as a result of migrant workers seeking lsquogreener pasturesrsquo Okagua Anochie
and Akani71 on the other hand reported higher mean BP among rural adolescents than
their urban counter parts in Port Harcourt The authors could not identify the reason(s) for
their finding but concluded that the seemingly protective privilege of rural life may be
fading gradually The differences in the reports could however result from the sample size
composition comprising of preadolescents22 adolescents71 and adults69
Race - Higher BP levels have been reported in African-American and Hispanic school-
age children than their Caucasian counterparts and among African-Americans than the
Hispanics7273 Akinkugbe and Ojo70 demonstrated a consistently high systolic and
diastolic BP in Nigerian children compared with black and white American children of
similar age Exposure to chronic environmental stress low socioeconomic status and high
obesity rate among African American and Hispanic youths could contribute to higher
BP72-74 It can be inferred from the study that race alone may not be responsible for the
observed differences but shared environmental factors and socioeconomic status may be
contributory77 Other studies7475 however found no significant BP differences in relation
to race
Anthropometry and blood pressure (BP) - A positive correlation has been observed
between BP and anthropometry in various studies58-5977 These studies585678 observed a
significant correlation between systolic BP and weight height and body mass index
(BMI) in boys but only with weight in girls Body mass index (BMI) is used as a
measure of overall obesity but it is known to be a poor indicator of actual body fat79
Waist circumference (WC) is an aggregate measurement of the actual amount of total and
24
abdominal fat accumulation80 It is therefore a better predictor of BP and other
cardiovascular diseases8081 Guagnano Ballone and Colagrande et al81 studied the
relationship between BP and BMI WC and waist hip ratio (WHR) in 461 people and
found WC to be the most consistent anthropometry affecting BP It is of interest to note
that the study by Guagnano et al81 was in adults population while the other studies56-59
were in children and adolescents WC was also found to be a better predictor of BP in an
Italian study8081 while it was not in others56-6982 Comparing BMI and waist
circumference and their effects on BP Arauzo Lopes and Moriera et al83 in Brazilian
children found BMI to be a better predictor of BP than waist circumference This was
similar to the study by Sebanjo and Oshikoya82 in Nigerian adolescents in Akure Thus
waist circumference measurements may not be useful in the evaluation of obesity andor
hypertension in children and adolescents This may partly be explained by the uniform fat
distribution due to hormonal effect at puberty in adolescents compared to the
disproportionate fat distribution in adults Possible mechanisms for the positive
relationship between BP and high BMI includes decreased physical activity increased
salt intake impaired pulmonary functions and development of metabolic abnormalities
such as dyslipidaemia and insulin resistance8084
Nutritional factors - Diet has been a primary link between humans and their environment
and substantial evidence supports the concept that multiple dietary factors affect BP85
Well-established dietary modifications that lower BP are reduced salt intake increased
potassium intake increased protein particularly plant protein high vegetable and
polyunsaturated fats85 High sodium intake on the other hand is said to be associated with
elevated blood pressure86 A series of 3 large controlled feeding studies tested the effects
of dietary patterns on BP86-89 Of the 3 diets studied the dietary approach to stop
hypertension (DASH) emphasized fruits vegetables low-fat dairy products whole
25
grains poultry fish nuts potassium magnesium calcium and fibre as the most effective
diet89 Among all participants the DASH diet significantly lowered mean systolic BP by
55 mm Hg and mean diastolic BP by 30 mm Hg each net of changes in the control diet
DEFINITION AND CLASSIFICATION OF ADOLESCENCE
Adolescence is the transitional stage between childhood and adulthood during which many
life patterns are learnt and established90 According to World Health Organization (WHO)
adolescents are individuals between the age range of 10-19 years17 The most significant
feature of adolescence is puberty characterized by an exceptionally rapid rate of biological
growth and development including physical and sexual maturation9091 The pubertal changes
have been described by Tanner and Marshal92 and are grouped into five stages This utilizes
definite criteria for growth and development of secondary sexual characteristics like pubic
hair and breast in females and pubic hair and genitalia in males9092 The timing of these
events and the rate of growth vary due to genetic and environmental factors in different
populations92 Adolescence is divided into early middle and late periods17
Early adolescence (10-13 years) ndash This is a period of rapid growth and development of
secondary sexual characteristics and varies according to sex It corresponds to Tanner stages
1 and 290 The main features of this stage are breast bud development and menarche in girls
while testicular enlargement and seminal emission occurs in boys93
Middle adolescence (14-16 years) ndash In this stage rapid growth decreases and there is more
cognitive development as the adolescents move from concrete thinking to formal operation
and develop greater competence at abstract thinking91 This corresponds to Tanner stages 3
and 4
Late adolescence (17-19 years) ndash Here slowing of physical changes continue which permits
the emergence of a more stable body image Cognition tends to be less self-centered with
26
demonstration of care for others with increasing thought about concepts such as justice
patriotism and history It corresponds to Tanner stage 59092
ADOLESCENCE AND BLOOD PRESSURE
Adolescence is characteristically associated with increasing blood pressure because of the
physical growth and hormonal changes associated with puberty5794 After the age of one year
normal BP increases more during puberty than probably at any other time in an individualrsquos
lifetime95 Wanzhu Eckert and Saha et al57 examined data from a cohort of 182 normotensive
children in Indiana who had blood pressure measurements taken semi-annually for up to 12
yr The authors found that the rate of change in BP and weight peaked at the age of maximum
pubertal growth spurt (PGS) This BP spurt roughly coincides with growth spurt during
puberty94 Surveys of BP patterns from childhood through adolescence shows systolic and
diastolic pressures increase with age and in adolescents the increase in males is more marked
than in females especially the systolic pressure5458229495
CLASSIFICATION OF BLOOD PRESSURE IN ADOLESCENTS
The National High Blood Pressure Education Program Working Group (NHBPEPWG) of the
United States established guidelines for the definition of normal and elevated blood pressures
in children in 19876 These guidelines were revised in 20048 The definition of childhood
hypertension in the guidelines are based upon the normative distribution of blood pressure
(BP) in healthy children rather than clinical outcome data as in adults The guidelines
classified BP as normal prehypertensive or hypertensive Hypertension is graded into stage
one and two8
Normal BP - Blood pressure lt90th percentile for age sex and height Children and
adolescents with normal BP should be followed annually from the age of 3 years5 They
27
should be encouraged to maintain a healthy life style such as good dietary intake physical
activities and adequate rest8
Pre-hypertension - Blood pressure between the 90th and lt 95th or if BP exceeds
12080mmHg (even if lt90th percentile) but lt95th It was previously called high normal
BP This new description was introduced to help identify children at risk for the
development of persistent hypertension for whom targeted prevention programmes would
be most beneficial96 While recommendations for the diagnosis of hypertension in
children require that BP remains elevated on three separate occasions repeated
measurements are not necessary to classify an adolescent as pre-hypertensive11 The
prevalence of childhoodadolescence pre-hypertension in US is reported to be between
12-1796-98 In Nigeria Ejeke Ugwu and Ezeanyika99 in a study of the prevalence of
point prehypertension and hypertension in 843 adolescents in Lokoja reported a
prevalence of point prehypertension of 222 and 250 in semi urban and urban
communities respectively Ujunwa Ikefuna and Nwokocha et al100 reported 175
prehypertension prevalence among adolescents in Enugu Among adults with pre-
hypertension it is reported that as much as 10 per year develop hypertension101 There
is little information on the time course for children and adolescents with prehypertension
developing hypertension A value of between 11-7 per year has been reported in US
adolescents98 There is no known study on rate of progression of prehypertension to
hypertension in Nigerian adolescents The NHBPEP recommended that children with
pre-hypertension should have their BP checked after every six (6) months to monitor for
progression to hypertension They should be encouraged to engage in physical activity
healthy dietary behaviours and weight management if overweight Pharmacologic therapy
is not indicated except if there is strong evidence of renal disease heart failure left
ventricular hypertrophy or diabetes mellitus8
28
Hypertension Hypertension is BP persistently equal to or above the 95th percentile for
age sex and height measured on three or more separate occasions If the blood pressure
measurement obtained is gt 95th percentile the degree of hypertension should be staged
Stage 1 hypertension- BP value between the 95th and the 99th percentile plus 5mmHg It
is recommended that BP should be rechecked in 1ndash2 wks or sooner if the patient is
symptomatic If persistently elevated on 2 additional occasions it should be evaluated or
referred to source of care for pharmacologic treatment within 1 month 8
Stage 2 hypertension- BP value gt99th percentile plus 5mmHg This stage calls for more
prompt evaluation and commencement of pharmacologic therapy102 It is recommended
that the individual be evaluated or referred to source of care within 1wk or immediately if
the patient is symptomatic8
Aetiology of hypertension
Hypertension is classified as primary (essential) when there is no identifiable cause
or secondary if due to an underlying disease31 Factors such as heredity diet stress drugs and
obesity play a role in the development of essential hypertension103104 Causes of secondary
hypertension include umbilical artery catheterization renal diseases coarctation of the aorta
and endocrine disorders105106 Aderele and Sereki6 in their study of hypertension in children
reported hypertension secondary to renal pathology as the commonest cause of elevated BP
in children This study was mainly in preadolescent population in which secondary
hypertension is a common finding On the other hand Antia-Obong and Antia-Obong107
reported no apparent cause in greater than 90 of the studied subjects with elevated BP and
also reported proteinuria of 1 in the same population without any associated elevated blood
pressure The study did not however evaluate the etiology of the proteinuria A study65 of BP
in teenagers in Kano found family history of hypertension a risk factor in the study
population Another study in Enugu100 examined modifiable risk factors associated with
29
hypertension in 2694 adolescents and found only 1 and 06 of the hypertensive subjects
to be overweight and obese respectively The authors also found that smoking and alcohol
consumption were not significant risk for hypertension This may however be due to the
shorter period of consumption of these products by the students as a cumulative effect from
long term consumption is known to be associated with adverse health outcomes
Prevalence of hypertension in adolescents
The prevalence of hypertension in adolescents varies widely due to arbitrary and imprecise
definition by different researchers It was in view of this that the National High Blood
Pressure Education Program Working Group (NHBPEPWG) of the United States established
guidelines for the definition of normal and elevated blood pressures in children and
adolescents for uniformity68 In the USA the prevalence is about 20 in normal weight and
50 in their obese counterparts108 A prevalence rate of 77109 10554 and 223110 has
been reported in Spain Lebanon and South Africa respectively In Kano Nigeria a study65
on the prevalence of hypertension among 1000 teenagers found a prevalence of 72 Similar
study in Enugu100 on the prevalence of hypertension among 2694 secondary school
adolescents reported a hypertension prevalence of 54 It is of interest to note that different
prevalence was reported because of the different methodology used by the authors While the
study in Kano65 applied the adult blood pressure criterion of BP greater than 14090mmHg as
hypertension the study in Enugu100 used blood pressure greater than 95th percentile for age
and sex Also the study in Kano65 took a single set of measurement while the study100 in
Enugu measured blood pressure of the subject three times at weekly intervals Bugaje
Yakubu and Ogala21 on the other hand defined hypertension as blood pressure greater than
two standard deviations from the mean and also took six readings over thirty minutes and got
a prevalence of hypertension of 34 A prevalence rate of 48107 and 9522 in Southern
and Western region of the Nigeria respectively was also reported It is obvious that because
30
of the various defining criteria for hypertension in adolescents the prevalence of adolescent
hypertension remains imprecise
Clinical presentation- Hypertension is usually asymptomatic unless it has been
sustained or is rising rapidly109 Adolescents with essential hypertension are usually
detected during routine evaluation96 Non-specific symptoms such as lethargy headache
dizziness drowsiness visual disturbance and confusion may be present109 These could
also be signs of complications111 Secondary hypertension may show obvious features of
the underlying disease such as growth failure heat intolerance abdominal stria tremors
body swelling and haematuria8102 Croix and Feig112 studied the spectrum of symptoms in
409 children aged 7-18 years newly diagnosed hypertensive in Texas USA and reported
15 common symptoms than in the controls The symptoms were said to resolve after
commencement of antihypertensive medications The authors concluded that hypertensive
children had a variety of non-specific symptoms The three most common symptoms
reported were headache daytime tiredness and difficulty initiating sleep The study
however did not specify if other possible causes of these symptoms were excluded
Complications of hypertension - Hypertension is usually asymptomatic in adolescents
which if left unidentified overtime can cause serious complications109 Organs commonly
affected in the complication of hypertension are the heart kidneys brain and the eyes
leading to lowered life expectancy and premature death13 Left ventricular hypertrophy
(LVH) is the most prominent clinical evidence of end organ damage10 Studies have
shown that LVH can be seen in as many as 41 of patients even in adolescents with
asymptomatic hypertension10103 Adolescents with severe cases of hypertension are also
at increased risk of developing hypertensive encephalopathy seizures cerebrovascular
accidents and congestive heart failure103109 However data documenting such
complications in children and adolescents are generally lacking In a study of
31
hypertension among teenagers in Kano the researchers65 could not find any
complications in all the 1000 teenagers studied
Investigations and treatment- Basic investigations are all that may be required in
adolescents who are obese and with a family history of hypertension stage 1 disease and
normal findings on physical examination113 This is because primary hypertension is
commoner in adolescents Adolescents that are symptomatic or with stage 2 hypertension or
have features of secondary hypertension should be evaluated in more detail
Treatment of hypertension includes non-pharmacological and pharmacological
methods Non-pharmacologic management involves life style modification such as weight
reduction increased physical activities and dietary adjustment114 In a study to evaluate the
effect of diet and salt on treatment and prevention of hypertension Sacks Svetkey and
Vollmer et al86 reported the beneficial effect of both reduced salt intake and appropriate
dietary adjustment in the control of hypertension Similar benefits were reported in other
studies8788 Although both studies had fairly good sample size (n=412) the studies did not
specify if participants were on other substances or activities other than antihypertensive that
might have affected their BP The studies were also in adults and whether it has the same
effects in children and adolescents has not been evaluation However there is no doubt that
the outcome will be similar in adolescents as dietary modifications have been advocated as
non-pharmacologic management in them Non pharmacologic treatment is usually the initial
treatment in essential hypertension and as adjuvant to drug therapy in those with secondary or
complicated hypertension101114 Pharmacologic (drug) treatment includes diuretics beta-
blockers calcium channel blockers angiotensin converting enzyme inhibitors (ACEIs) and
angiotensin receptor blockers (ARB) among others106114 They are used in those with
symptomatic disease and in acute or chronic complications106
32
Prevention of hypertension may be viewed as part of the prevention of cardiovascular
disease102 In adolescents approaches to prevention include reduction in obesity
discouraging cigarette smoking and alcohol intake113 reduction in sodium intake and increase
in physical activity through community and school-based programmes103104 Growth
monitoring BP check during preventive care visit physical activity and urine screening for
proteinuria and haematuria can be used starting from early childhood
33
AIM AND OBJECTIVES
GENERAL AIM
To determine the blood pressure pattern of apparently healthy secondary school adolescents
in Jalingo Taraba State
SPECIFIC OBJECTIVES
To determine
1 Blood pressure pattern in relation to age and sex among adolescents aged 10-19
years
2 The relationship if any between blood pressure and the anthropometric parameters of
weight height BMI and waist circumference
3 The association between blood pressure and parental social-economic status
4 The point prevalence of prehypertension and hypertension in adolescents
34
MATERIALS AND METHODS
Study area
A cross-sectional survey of the blood pressure pattern of apparently healthy secondary
school adolescents aged 10-19 years was conducted in Jalingo over a six month period
from January to June 2014 Jalingo is the capital of Taraba State and lies within the
savannah belt of North Eastern Nigeria It lies between latitude 80 54rsquo north and longitude
110 21rsquo east and at an altitude of 360 meters above sea level115 Jalingo had a population of
118198 people18 The primary inhabitants are the Konas Mumuyes and Fulanis who are
mostly farmers Other indigenous ethnic groups include the Jukun Kuteb WurkumTiv
and host of other tribes The Ibos Hausas Yorubas among others are the non-indigenous
ethnic groups and are mostly civil servants and businessmen Jalingo has a tertiary health
centre the Federal Medical Centre Jalingo and the state specialist hospital It also has 15
private clinicshospital and many primary health care centres There are also tertiary
education institutions including Taraba State University As at 2013 there were 56
secondary schools in Jalingo 24 public and 32 private all of which were mixed schools
except one which is a girlsrsquo only school
Study design
The study was a cross sectional descriptive study of 1350 apparently healthy secondary
school adolescents in Jalingo
Ethical approval
Ethical approval for this study was obtained from the Scientific and Health Ethics Research
Committee of Ahmadu Bello University Teaching Hospital Zaria (Appendix 4) The Taraba
State Ministry of Education also gave the approval and permission to conduct the study in the
35
selected schools Consent was given by the studentsrsquo parents or guardian (Appendix 2) All
students whose parents gave consent voluntarily participated in the study
Sample size determination
The minimum sample size was calculated using the formula116
N=Z2 (pq) E2
Where N = minimum sample size
p = Prevalence of hypertension in adolescents A prevalence of 3421 was used
q = 1- p
E = margin of error tolerated =1
Z = 196 at 95 confidence level
N = 1962 x 0034 x (1-0034) 0012 = 1262
Therefore the minimum sample size was one thousand two hundred and sixty two
Allowance for non-responders of 5 63 extra subjects were added to the calculated
minimum sample size bringing the total to 1325 students To enhance representativeness of
the sample and to compensate for missing information and poorly filled proforma while
maintaining the sample size a total of 1350 was decided upon
Inclusion criteria
1 Students (ages 10-19 years) in the selected secondary schools
2 Students whose parents gave consent to participate in the study
3 Students who gave assent to participate in the study
Exclusion criteria
1 Students who had obvious skeletal deformities of the spine and legs which can affect
the height and ultimately the BMI
36
2 Students with known chronic disease (or history of such disease) like anaemia
chronic renal disease and cardiac disease because they are not apparently healthy and
these conditions could affect their blood pressure
3 Students with present or past history of chronic drug ingestion that can affect blood
pressure such as steriods and contraceptives
4 Students with high blood pressure already on antihypertensive
Pilot study
A pilot study was carried out in one of the schools a week before the commencement of
the study The school was selected by random sampling method using balloting and did
not participate in the main study The pilot study was carried out with the aim of
assessing the competence of the research assistants in the various measurements
following their training to ensure reliability It was also used to test the questionnaire
before its use during the main study and to provide information on the number of students
that can be measured in a day Consequently twenty students had their blood pressure
and anthropometry measured independently by the researcher and the research assistants
and data were compared using Students t-test There were no statistically significant
differences between the measurements The result of the pilot study is highlighted in
Table I It was also found that some parts of the questionnaire were not well understood
by most students and were adjusted appropriately in the main study (Appendix 1) The 20
students had their measurements done over a period of 3-4 hours (between 8am - 12noon)
by the researcher and the research assistants
Table I Result of pilot study
Variables Researcher Research t p
37
assistants
Mean(plusmnSD) SBP
mmHg
106(11) 104(12) 0550 0586
Mean(plusmnSD) DBP
mmHg
617(83) 63(10) 0450 0657
Mean(plusmnSD) Weight
kg
544(82) 527(122) 0520 0608
Mean(plusmnSD) Height m 16(01) 16(01) 0000 1000
Mean(plusmnSD) BMI
kgm2
198(36) 202(33) 0370 0716
Mean(plusmnSD) WC cm 692(72) 682(133) 0300 0769
Sampling method
Students were selected by multistage random sampling technique The list of secondary
schools obtained from the Taraba State Post Primary Schools Board served as the sampling
frame for schools There were 56 secondary schools 24 of which were public and 32 were
private schools a ratio of 113 Ten (10) schools were randomly selected by balloting four
(4) from public schools six (6) from private based on the number and approximately similar
ratio of private to public schools of 115 (46) Ten schools were selected to ensure wider
coverage and even distribution of students so that it could be truly representative of the
community All the ten schools had an overall total of eight thousand one hundred and seven
(8107) students The public schools had a total of five thousand nine hundred and forty
(5940) with nine hundred and eighty nine (989) students participating The private schools
had a total of two thousand one hundred and sixty-seven (2167) students with three hundred
and sixty one (361) participating These number (989 and 361) was calculated based on the
38
relative population of each school and proportionate to number of students in each school
Thereafter the number of students to participate per school was calculated proportionately to
the number of students in each school based on the number given by the school authority
Then the number in each class was also calculated proportionately from JSS1 to SS3 to
ensure fair and equal chance of participation for all age groups The calculation was done
thus n= a b x c
Where n= number of students per selected school
a= total numberpopulation of students in the school
b= total numberpopulation of students in all 10 selected schools (8107)
c= calculated total sample size (1350)
Students in each class from junior secondary school (JSS) 1-3 and senior secondary school
(SS) 1-3 were then randomly selected by balloting The number of selected schools total
number of students in a school and the number of students selected per school is outlined in
Table II
Table II Selected schools and number of students in each of the ten schools in Jalingo
Selected schools Total no of No of students
39
student in the
school (a)
n=8107
selected (n=abxc)
n=1350
Public schools
Govt Science Secondary School 2800 466
Govt Day Secondary School SGari 1200 200
Salisu Dogo Secondary School 1100 183
Govt Secondary School Magami 840 140
Total 5940 989
Private schools
Winners Comprehensive Secondary School 650 108
Hawai Secondary School 562 94
Centre for Quranic Science and Islamic Education 543 90
Good Success Secondary School 155 26
Jetters Academy 140 23
Yagai Academy 117 20
Total 2167 361
The study
The first contact with the students was a familiarization exercise to each of the schools during
which the teachers and students were given a talk by the researcher on blood pressure and the
40
importance of periodic blood pressure measurement They were given the opportunity to ask
questions which were responded to Both the students and their teachers actively participated
in the lectures
On the second day students were selected as described above and those selected
underwent general physical examination in the presence of a chaperon to identify those
who did not fulfilled the inclusion criteria Each selected student was given a proforma
(Appendix 1) in which information on their biodata and medical history were recorded
Other information obtained was parentrsquos medical history and their socioeconomic status
using the format described by Olusanya Okpere and Ezimokhai117 (Appendix 3) The
study was carried out in a relatively quiet and empty classroom to ensure privacy for both
male and female students The procedure for blood pressure measurement was
demonstrated on one of the research assistants and sometimes on one of the teachers by
the researcher to assure the students and allay their anxiety BP and anthropometric values
obtained were recorded in the study proforma An average of 15-20 students per day were
attended to over a period of 3-4 hours (between 8am - 12noon daily) by the researcher
one of the research assistants who is a medical officer a male nurse and a lady Youth
Corper (NYSC)
Blood pressure measurement
This was measured by the researcher and the research assistant (the medical officer) The
standard auscultation method was employed using a mercury sphygmomanometer (Acosson)
and a standard Littman stethoscope according to the guideline of the fourth report on the
diagnosis evaluation and treatment of hypertension in children and adolescents8 Each
students was rest-seated for 5 minutes before BP measurement With the student seated the
right arm rested on a table at the level of the heart an appropriate cuff size which covered
41
two-third (23rd) of the length of the arm was applied round the arm about 2cm above the
antecubital fossa Two cuff sizes were used for this study with dimensions of 10 x 24cm and
13 x 30cm the smaller cuff for the smaller adolescents and vice versa The bladder cuff was
inflated rapidly to 20-30mmHg above the point where the brachial artery was no longer
palpable The bell of the stethoscope was then placed over the brachial artery and the cuff
was deflated slowly at 2-5mmHgsecond while listening to the Korotkoff sounds Phases one
and five of the Korotkoff sounds were recorded as the systolic and diastolic BP
respectively119 Three recordings were taken at intervals of 3-5 minutes and the average was
the final BP in mmHg BP was interpreted based on the standard set by the fourth report on
the diagnosis evaluation and treatment of hypertension in children and adolescents of the
United States8 thus-
Normal BP ndash BP value between the 5th and lt 90th percentile for age sex and height
Prehypertension - BP value between the 90th and the lt95th percentile for age sex and height
or BP of 12080mmHg but less than the 95th percentile
Hypertension ndash BP value ge95th percentile for age sex and height
Students found to have prehypertension were educated and counseled on life style
modifications and the need to have their blood pressure checked in six monthsrsquo time and
annually subsequently Those with hypertension were educated on the implications of the
findings and were referred to the Federal Medical Center Jalingo for evaluation management
and follow-up
Height measurement
Height was measured in centimeters using a locally constructed stadiometer by the research
assistants Each student was measured barefooted standing with the heel back and occiput
42
against the stadiometre The head was held straight looking forward with the lower border of
the eye socket at a horizontal plane with that of the external auditory meatus The movable
part of the stadiometre was adjusted to rest on the vertex and the corresponding value read to
the nearest 01cm
Weight measurement
The weight was measured in kilograms by the researcher and the research assistants using a
bathroom scale (HANSON) Students were weighed in their approved school uniform
without caps head ties or cardigan and with their shoes removed The scale was checked
daily for accuracy using standard calibrated weight before and midway through each session
The weight of the student was measured to the nearest 01 kg
Body mass index (BMI)
This was calculated from the measured weight and height of the subject using the
formula118
BMI= Weight (kg) Height (m2)
Waist circumference measurement
WC was measured in centimeters using a measuring tape by the research assistants The
male assistant measured for boys and the lady Youth Corper measured for girls
Measurement was taken with the student standing completely relax and breathing
normally Clothing was pulled up or down and an inelastic measuring tape was placed
around the waist mid-way between the iliac crest and the lowest rib margin The ends of
the tape were pulled together lightly towards each other and the value read to the nearest
01cm117120
43
Data analysis
Data obtained were analyzed using Epi-Info statistical software package version 7 The
results obtained were presented in figures tables graphs and charts as appropriate Individual
mean BP levels were used as dependent variables and other measured variables as
independent variables The means and standard deviations were used to summarize
quantitative variables such as BP weight height waist circumference and BMI The chi-
squared test was used to test the significance of associations between categorical variables
Studentrsquos t-test was used to compare means of any two normally distributed continuous
variables Pearsonrsquos correlation coefficient and regression analysis were used to examine the
strength of association between BP and the anthropometries Probability level of statistical
significance value was set at lt005
RESULTS
General characteristics
A total of 1350 students were enrolled between January and June 2014 to determine their
blood pressure pattern 628 (465) were males and 722 (535) were females with
malefemale ratio of 111 Students enrolled in the study were drawn from both public and
44
private schools The number of students from public schools was 989 (733) while 361
(267) were from private schools as shown in Table II The mean age of the study subjects
was 153plusmn22 years with a range of 10-19 years The age and sex distribution of the students
is illustrated in Table III
Table III Age and sex distribution of 1350 study subjects in Jalingo
Ag
e
Male
n ()
Female
n ()
Total
N()
10 9(14) 13(18) 22 (16)
11 20(32) 31(43) 51(38)
12 36(57) 52(72) 88(65)
13 96(153) 85(118) 181(134)
14 92(146) 115(158) 207(153)
15 92(146) 111(154) 203(151)
16 66(105) 116(161) 182(135)
17 78(125) 91(126) 169(125)
18 79(126) 70(97) 149(110)
19 60(96) 38(53) 98(73)
To
tal
628(100) 722(100) 1350(100)
45
Socio-economic classes (SEC) ndash Most of the students were from the lower social classes
(4 and 5) with population of 650 (415 and 235) students The upper social classes (1 and
2) had the least population with 184 (62 and122) students The middle social class (3) had
516 students The distribution of the study subjects according to individual
socioeconomic class is shown in Figure I
Figure 1 Socioeconomic class distribution of students in Jalingo
Anthropometry
The anthropometric characteristics of the students are displayed in Tables IV V and VI
All the anthropometric parameters showed increasing values with age (Tables V and VI)
There were significant differences in the anthropometric indices of height (p=0000)
weight (p=0010) and body mass index (p=0000) between boys and girls but not
statistically significant for waist circumference (p=0145) as shown in Table IV
Weight ndash The mean weight of the students was 486plusmn109kg with a range of 23-100kg
(Table IV) Girls were heavier than boys up to middle adolescence after which males
46
were heavier than the females (Table V and VI) and this was statistically significant (t= -
256 p=0010)
Table IV Overall mean anthropometric measurements of the study subjects
Anthropometr
y
Male Female Total
n=628 n=722 N=1350 t p
Wt (kg)
Mean(plusmnSD) 4773(115
)
4926(103
)
4855(plusmn109
)
-
25
6
0007
Range 236-848 227-100 23-100
Ht (m)
Mean(plusmnSD) 159(012) 157(008) 158(plusmn010) 35
5
0000
Range 122-185 126-179 122-185
WC (cm)
Mean(plusmnSD) 6524(91) 6595(86) 6562(plusmn89) -
14
6
0145
Range 225-905 215-100 22-100
47
BMI (kgm2)
Mean(plusmnSD) 1825(27) 1947(33) 1891(plusmn31) -
74
1
0000
Range 117-325 114-42 114-42
Statistically significant p values at 005 level of significance Wt=Weight Ht=Height WC=Waist
Circumference BMI=Body Mass Index SD=Standard Deviation
Height- The mean height of the study population was 158plusmn09m and ranged from 122-
185m (Table IV) Girls were taller than boys at early and middle adolescence but these
reversed from 16 years in favour of the boys (Table V and VI) This differences was
statistically significant (t=448 p=0000)
Waist circumference (WC) - The overall mean waist circumference was 6562plusmn89cm and
a range of 225-100cm Girls had higher WC until late adolescence (18 years) when it
reversed but this was not statistically significant (t=-146 p=0145) This is displayed in
Tables IV V and VI
Body Mass Index (BMI) - Overall mean BMI was 189plusmn31 with a range of 114-42
There was a statistically significant difference between girls and boys (t=-741 p=0000)
Tables IV V and VI illustrate this findings
Table V Mean anthropometric measurements of 628 boys
Age No of
studen
ts
Wt(plusmnSD)
Kg
Ht(plusmnSD)
m
WC(plusmnSD)
cm
BMI(plusmnSD)
Kgm2)
48
10 9 349(50) 143(001
)
613(06) 169(01)
11 20 354(25) 143(002
)
617(13) 170(07)
12 36 363(51) 146(002
)
616(14) 167(06)
13 96 379(51) 150(003
)
602(40) 165(08)
14 92 412(50) 154(003
)
623(32) 169(08)
15 92 471(60) 160(003
)
634(39) 178(08)
16 66 525(52) 164(002
)
672(24) 192(09)
17 78 555(51) 167(002
)
680(31) 197(08)
18 79 576(61) 169(002
)
707(18) 200(08)
19 60 590(57) 170(002
)
716(16) 203(07)
Total 628 477(115 16(01) 652(91) 183(27)
49
)
Wt=Weight Ht=Height WC=Waist Circumference BMI=Body Mass Index SD=Standard Deviation
Table VI Mean anthropometric measurements of 722 girls
Age No of
students
Wt(plusmnSD)
Kg
Ht(plusmnSD)
m
WC(plusmnSD)
cm
BMI(plusmnSD)
Kgm2
10 13 313(34) 139(001) 582(05) 156(02)
11 31 361(53) 144(002) 611(12) 170(05)
12 52 403(64) 149(002) 625(21) 178(09)
13 85 458(66) 154(002) 657(22) 188(12)
14 115 478(74) 157(003) 627(48) 187(10)
15 111 508(65) 159(002) 666(34) 199(13)
16 116 521(60) 159(002) 678(28) 201(11)
17 91 541(62) 161(002) 681(28) 203(11)
18 70 556(63) 161(002) 696(21) 211(11)
19 38 540(48) 158(002) 688(14) 208(06)
Total 722 493(103) 16(010) 651(23) 190(09)
Wt=Weight Ht=Height WC=Waist circumference BMI=Body Mass Index SD=Standard Deviation
Blood pressure (BP) measurements
50
Table VII shows mean blood pressure distribution of the study population for all ages
The highest SBP and DBP were 165mmHg and 95mmHg at 18years and 15 years
respectively Table VIII displays mean BP distribution in relation to age and sex The
tables show that both systolic and diastolic blood pressure increased with age This is also
depicted in Figure 2
Table VII Mean and ranges of blood pressure of 1350 subjects
Systolic Blood Pressure
(mmHg)
Diastolic Blood Pressure
(mmHg)
Age
No of
students
Mean(plusmnSD) Range
Mean(plusmnSD) Range
10 22 936(74) 80-107 600(50) 47-70
11 51 992(106) 76-120 629(71) 47-83
12 88 1036(110) 80-140 657(60) 53-82
13 181 1042(108) 80-143 660(74) 48-88
14 207 1070(115) 83-150 675(76) 47-90
15 203 1090(119) 80-150 678(82) 47-95
16 182 1122(124) 80-150 696(80) 50-90
51
17 169 1132(118) 90-153 698(83) 48-93
18 149 1138(121) 90-165 712(88) 50-90
19 98 1131(127) 90-143 726(76) 57-90
Total 1350 1089(125) 76-165 683(82) 47-95
Table VIII Mean blood pressure in relation to age and sex
Mean(plusmnSD) Systolic blood pressure
(mmHg)
Mean(plusmnSD) Diastolic blood
pressure (mmHg)
A
ge
Male
n=628
Female
n=722
t p Male
n=62
8
Fema
le
n=72
2
t p
52
10 954(3
9)
923(6
0)
1
02
03
20
619(
32)
586(
46)
1
36
0
01
91
11 985(5
5)
997(9
2)
0
42
0
06
80
648(
39)
617(
57)
1
56
0
01
26
12 999(8
9)
1062(
117)
2
84
0
00
06
653(
29)
660(
52)
-
0
52
0
06
07
13 1012(
73)
1075(
73)
4
03
4
00
00
649(
43)
672(
59)
-
0
03
0
00
44
14 1036(
78)
1098(
78)
3
93
0
00
01
653(
44)
693(
58)
3
90
0
00
01
15 1071(
80)
1105(
87)
2
05
0
00
42
665(
58)
689(
56)
-
2
10
0
00
37
16 1135(
82)
1114(
91)
1
03
0
03
10
697(
51)
695(
61)
0
15
0
08
81
53
17 1152(
87)
1115(
77)
2
04
00
43
698(
59)
698(
58)
0
02
0
09
81
18 1141(
96)
1135(
74)
0
27
0
07
91
704(
62)
721(
63)
1
61
0
02
49
19 1146(
97)
1108(
80)
1
41
0
01
64
733(
63)
714(
43)
1
21
0
02
28
To
tal
1081(
133)
1095(
117)
-
2
05
4
00
40
678(
81)
687(
82)
-
2
07
7
00
38
Statistically significant p values at 005 levels of significance
54
Figure 2 Blood pressure distribution in relation to age and sex
SBP =Systolic blood pressure DBP=Diastolic blood pressure
Blood pressure and stages of adolescence
Table IX displays mean blood pressure according to stages of adolescence Girls had a
higher mean SBP than boys from early adolescence (t=3754 p=0000) to middle
adolescence (t=-3025 p=0003) and this was statistically significant This dominance was
also demonstrated in the DBP and was statistically significant in middle adolescence (t=-
3517 plt0000) Adolescents from private schools had higher mean SBP (t=-222
plt0027) and mean DBP (t=-461 p=0000) than those from public schools and these
differences were statistically significant
Table IX Mean blood pressure according to sex and stages of adolescence
Mean BP
(mmHg)
Age (years)
Male SBP
Female SBP
Male DBP
Female DBP
55
Stages
of
adolesc
ents
(years)
Mean(plusmnSD) systolic blood pressure
(mmHg)
Mean(plusmnSD) diastolic blood pressure
(mmHg)
Male Female t p Male Fema
le
t p
Early
(10-13)
1000(9
6)
1040(1
18)
37
54
00
00
648(
56)
653(
82)
05
99
05
50
Middle
(14-16)
1075(1
29)
1105(1
13)
-
30
25
00
03
670(
81)
694(
77)
-
35
17
00
00
Late
(17-19)
1140(1
28)
1121(1
11)
21
45
00
33
717(
85)
710(
83)
00
70
09
45
1082(1
33)
1092(1
17)
-
20
54
00
40
678(
81)
687(
82)
-
20
77
00
38
Statistically significant p values at 005 level of significance SD=Standard Deviation
Table X shows blood pressure pattern according to stages of adolescence
Prehypertension and hypertension were more prevalent in late adolescence than early and
middle adolescence (χ2=49054 p=0000) and (χ2=10305 p=0006) both of which were
statistically significant
Table X The pattern of normal BP Prehypertension and hypertension according to stages
of adolescence
56
Blood
pressure
pattern
Stages of adolescence
Early
n()
Middle
n()
Late
n()
Total
N()
χ2 p
Normal 290(84
8)
428(72
3)
275(66
1)
993(73
5)
429
79
000
0
prehypertens
ion
43(12
6)
135(22
8)
120(28
8)
298(22
1)
490
54
000
0
Hypertensio
n
9(26) 29(49) 21(51) 59(44) 103
05
000
6
342(10
0)
592(10
0)
416(10
0)
1350(1
00)
350
93
000
0
Statistically significant p value at 005 level of significance
Relationship between blood pressure and the measured anthropometry
There was a positive correlation between SBP and DBP with age and the anthropometric
variables of weight height waist circumference and BMI (Table XI) SBP showed a
stronger correlation with the anthropometries than the DBP and was stronger for weight
(r=051) and height (r=044) The waist circumference though statistically significant
showed the weakest correlation
Table XI Correlation between blood pressure age (yrs) and anthropometry
Parameters
Systolic Blood Pressure Diastolic Blood Pressure
Correlation
coefficient
p Correlation
coefficient
p
57
Age (yrs) 035 lt0000 030 lt0000
Height (m) 044 lt0000 034 lt0000
Weight (Kg) 051 lt0000 038 lt0000
WC (cm) 040 lt0000 029 lt0000
BMI
(Kgm2)
031 lt0000 023 lt0000
Statistically significant p values at 005 level of significance Wt=Weight Ht=Height WC=Waist
circumference BMI=Body Mass Index
Blood pressure distribution and socio-economic classes
Table XII shows mean blood pressure according to socio-economic class of the subjects
Lower social classes had higher mean SBP (t=1650 p=2850) and DBP (t=0193
p=00058) but these were not statistically significant
Table XII Mean Blood pressure in relation to socioeconomic classes
Blood
pressur
e
Socioeconomic classes
Upper (1 amp
2) n=184
Middle (3)
n=516
Lower (4 amp
5)
n=650
f(anova
)
p
Mean
(SD)
10857(126
)
10866(128
)
11040(109
)
1650 285
0
58
SBP
Mean
(DBP)
6820(83) 6791(83) 6957(76) 0193 005
8
SEC= Socioeconomic class SBP=Systolic Blood Pressure DBP=Diastolic Blood Pressure SD=Standard
Deviation
Table XIII shows blood pressure pattern in relation to socioeconomic classes of the
subjects The percentage of students with prehypertension was higher in the upper social
class ((χ2=3067 p=0216) while the percentage of hypertension were higher in the lower
socioeconomic classes (χ2=1037 p=0568) but these differences were not statistically
significant
Table XIII Blood pressure pattern in relation to socioeconomic status
Blood
pressure
pattern
Socioeconomic classes
Upper
(1 amp 2)
n()
Middle
(3)
n()
Lower
(4 amp 5)
n()
Total
N()
χ2 p
Normal 127(69
)
383(74
2)
483(74
3)
993(73
6)
417
6
012
4
Prehypertens
ion
52(28
3)
108(20
9)
138(21
2)
298(22
1)
306
7
021
6
Hypertension 5(27) 25(48) 29(45) 59(44) 103 056
59
7 8
184(10
0)
516(10
0)
650(10
0)
1350(10
0)
573
0
022
0
Prevalence of Hypertension and Prehypertension
Table XIV shows the prevalence of hypertension in the study population The total
number of students with hypertension was 59 giving an overall prevalence of 44
Thirty four students (25) had systolic hypertension sixteen (12) had diastolic
hypertension and nine students (07) had both systolic and diastolic hypertension
Systolic hypertension was more prevalent in the females and was more at the age of 16
years while diastolic hypertension was higher in males and this also occurred at 16 years
Among those with hypertension 27 and 16 subjects had stage 1 and 2 systolic
hypertension respectively With regard to diastolic hypertension 24 and 1 subjects had
stage 1 and 2 hypertension respectively The gender difference in the prevalence of
hypertension is not statistically significant (χ2=0831 p=0362)
The number of students with pre-hypertension was 298 giving an overall prevalence of
221 Of this 131 were males and 167 are females This is illustrated in Table XIV
Prehypertension is more prevalent in females than males and this was statistically
significant (χ2=4349 p=0037)
60
Table XIV Overall Blood pressure pattern and prevalence of hypertension and
prehypertension of 1350 students in Jalingo
Blood pressure
pattern
Males
n=()
Females
n=()
Total
N()
χ2 p
Normal 471(750) 522(723) 993(735) 2619 0106
Prehypertension 131(209) 167(231) 298(221) 4349 0037
Hypertension 26(41) 33(46) 59(44) 0831 0362
628(100) 722(100) 1350(100) 1260 0533
statistically significant p value at 005 level of significance
61
DISCUSSION
The findings of this study showed that the BP of secondary school adolescents in Jalingo
was similar in terms of mean values range and trend of progression with age to that of
other adolescents from Ibadan63 and Kogi60 (Nigeria) Ashanti (Ghana)59 and Lebanon54
The mean value was however lower than the mean BP of adolescents from Zaria
(Nigeria)21 Belgrade ( Serbia)78 and Fortaleza-Cearaacute (Brazil)83 who had higher mean BP
in both sexes and at all ages The lower mean BP in this study compared to that of
adolescents from Zaria21 Belgrade78 and Brazil83 could be due to lower mean
anthropometry of weight height and BMI in adolescents from Jalingo resulting in lower
mean BP The sample sizes of these studies7883 were also different and could have
affected the mean BP of the study population For instance the sample size in the
Brazilian study83 is 151 compared to the study in Lebanon54 with 5710 subjects The use
of the fifth Korotkoff sounds as DBP in this study21 could also have accounted for the
lower mean BP in contrast to a similar study in Zaria21 where the fourth Korotkoff sound
was used as the DBP
A progressive increase in blood pressure with age was found in this study This
was similar to most findings by researchers in Nigeria 215358-606566107 and
worldwide54555961 The peak age of rise in BP in this study was in middle adolescence
between 15-16 years in boys but much earlier in girls for both systolic and diastolic BP
This was similar to the study by Akinkugbe Akinwolere and Kayode56 in Ibadan and
Ejeke Ugwu and Ezeanyika et al60 in Lokoja This age group is usually the period of
onset of puberty The chronologic age is not the main factor responsible for BP increase
62
with age but rather the progressive increase in size of the individual Increase in body
size with growth and maturity of organs associated with the physical and hormonal
changes during puberty potentially lead to increasing BP The simultaneous increase in
weight height and other anthropometric indices alongside BP with age seen in this study
and others is in agreement with that The implication of this increase in blood pressure
with age is that those with prehypertensionhypertension in childhood may continue into
adulthood hence further increasing the high prevalence of hypertension in the adult
population with its attendant morbidity disability and mortality
Overall significant higher mean BP was recorded in girls than boys in this study
This was seen from early to middle adolescence after which it reversed in favour of the
boys Reports on the relationship between BP and sex have been inconsistent Some have
reported higher mean BP in females54-56 others higher in males5883 while yet another
reported no sex differences22 The findings of this study were similar to those of Bugaje
Yakubu and Ogala21 and Ujunwa Ikefuna and Nwokocha100 who reported a consistently
higher mean blood pressure in female adolescents up to 16 years compared to their male
counterparts of similar ages Early female predominance in mean blood pressure was also
reports by Agyemang Redekop and Owusu-Dabo et al59 in Ashanti adolescents in Ghana
and Obika Adedoyin and Olowoyeye22 in Illorin The finding was however in contrast
with the study in Calabar58 where higher mean BP was found in boys than girls at all
ages The reason for the higher mean BP in females than boys could be because of earlier
onset of puberty in girls The differences in blood pressure between boys and girls in this
study could also be accounted for by variation in the anthropometric variables of the
individuals as girls were seen to be heavier and taller up to middle adolescence
This study demonstrated a consistently positive relationship between blood
pressure and the anthropometric variables of weight height body mass index and waist
63
circumference as widely reported in other studies 545558-6165107100 Weight is reported to
correlate positively with blood pressure in several studies53565871 Body mass index
(BMI) also showed a positive relation with BP in this study as reported in other
studies5978-81 This is in-keeping with the findings in Port Hacourt71 Abeokuta83 the
Gambia69 Brazil82 and Belgrade77 children Some of these studies however were made
up of younger and older age groups Even in lean populations BMI is known to correlate
positively with BP Waist circumference was also found in this study to correlate
positively with BP This was similar to reports from other studies79-8183 It was found to
be a better predictor of BP in two Italian study8081 while it was not in another82
Comparing BMI and waist circumference and their effects on BP Arauzo Lopes and
Moriera et al82 in Brazilian children found BMI to be a better predictor of BP than waist
circumference This was similar to the report by Sebanjo and Oshikoya83 in Nigerian
adolescents in Akure Guagnano Ballone and Colagrande et al81 however found waist
circumference to be better than BMI The study81 however involved adults and may not
be applicable in children and adolescents The present study demonstrated BMI and WC
to be significant but found BMI to be a better determinant of BP than waist
circumference BMI and waist circumference measure obesity in an individual Whereas
BMI is a measure of overall obesity WC measures centralabdominal fat accumulation
and thus said to be more predictive of adverse health risk79 Obese individuals may be
prone to such condition as dyslipidaemia insulin resistance and hypertension with
reduction in the quality of life Weight BMI and or waist circumference affects blood
pressure through decreased physical activity increased cardiac output insulin resistance
impaired pulmonary function and other hormonal abnormalities8084 It seems therefore
that BMI is a better predictor of BP in adolescents than waist circumference The reason
64
for this is not obvious but it may be because of the nature of uniform fat distribution in
adolescents associated with growth and hormonal changes at puberty
Blood pressure distribution in relation to the parental socio-economic class in this
study showed that students from low socio-economic classes had higher mean blood
pressure than those from upper socioeconomic classes but this was not statistically
significant A study in Ibadanl56 reported a statistically significant negative relation
between blood pressure and parental socio-economic status It was also similar to the
study58 in Calabar In contrast other studies found the reverse536022 The reasons for the
inverse relationship between BP and socioeconomic includes exposure to chronic
environmental stress with sustained sympathetic nervous system stimulation Others are
poor health seeking behaviours due to low income andor inadequate health knowledge
high low birth weight rate and inadequate healthy diets among others97101 In the same
environment individuals from a high social class are believed to be more educated with
high income61 They have easy access to health education and awareness on hypertension
prevention and control and better accessibility and adherence to medical treatment617374
The former might be responsible for the finding of this study as Jalingo is a semi urban
community Most of its inhabitants are subsistent farmers civil servants and traders with
low income The high number of students in the lower socioeconomic class lays credence
to that
The overall point prevalence of hypertension in this study was 44 while that of
pre-hypertension was 221 This prevalence of hypertension is similar to the prevalence
of 48 by Antia-Obong and Antia-Obong107 but higher than the prevalence rate of 37
reported in Zaria21 and lower than the prevalence of 58 reported in Ibadan56 54 in
Enugu100 and the 72 reported in Kano65 The prevalence of pre-hypertension was lower
than that reported by Ejeke Ugwu and Ezeanyika99 who found a prehypertensive
65
prevalence of 25 among adolescents in Lokoja It is higher than the 173 reported by
Ujunwa Ikefuna and Nwokocha et al100 in Enugu and 12-17 by Redwine and
Daniels96 among US adolescents The differences in the reported prevalence of
hypertension and prehypertension in adolescents could have resulted from the different
criteria applied by the various researchers in defining hypertension For instance whereas
this study used BP greater than 95th percentile as hypertension a study in Kano65 used the
adult hypertensive value of BPgt14090mmHg as hypertension and got a prevalence of
72 The prevalence in that study65 could have been higher if the percentile or the
statistical definition was used as many children with BP 14090mmHg would probably be
at stage 2 hypertension This was demonstrated in the study by Bugaje Yakubu and
Ogala21 who found a prevalence of hypertension in their study to be 06 when the adult
cut off value of gt14090mmHg was used but it increased to 37 when the statistical
definition of BPgt 2 standard deviations was used
The number of times blood pressure is taken could affect the outcome as repeated
measurements over a time interval is known to give lower BP values than if BP is taken
once This study used the average of three blood pressure values taken at one sitting but
Ujunwa Ekefuna and Nwokocha100 took three readings at five minutes interval with two
other readings at a week interval In that study100 the prevalence of prehypertension
dropped from 745 during the first set of readings to 173 after the third week
readings The prevalence of hypertension also dropped from 135 to 54 over the same
period Similar decrease in the prevalence of both prehypertension and hypertension was
reported by Redwine and Daniels96 in US adolescents when blood pressure was taken
over time interval Another factor which might have affected the overall prevalence is the
Korotkoff sound used for diastolic pressure23 The 4th or 5th Korotkoff sounds has been
used by different researchers resulting in different diastolic BP The study21 in Zaria used
66
the 4th Korotkoff sound while most other researchers2265100 used the 5th About 5-
10mmHg difference is said to exist between the 4th and 5th Korotkoff sounds230 In this
study the 5th Korotkoff sound was used thus giving a higher prevalence of hypertension
in the studied population than in those where the 4th sound was used
The implication of the outcome of this study is that 44 of adolescents in Jalingo
are already hypertensive while 221 of them are at risk of developing hypertension as
they are pre-hypertensive Since 856 (255 of 298) of the prehypertensives were in the
middle and late adolescence these individuals are likely to be adults with high blood
pressure Therefore regular screening of this group of individuals who were assumed to
be a healthy population is highly important for early detection of hypertension and
intervention such as life style changes and treatment
67
CONCLUSIONS
The following conclusions can be made from this study
1 The mean and range of blood pressure of adolescents in Jalingo was similar to
those of other adolescents in Nigeria and other parts of the world Blood pressure
increased progressively with age
2 All measured anthropometry of weight height body mass index and waist
circumference correlated positively with BP but weight was the most significant
variable in BP determination
3 Socioeconomic status was not significantly related with blood pressure
4 The point prevalence of hypertension and pre-hypertension was 44 and 221
respectively using a recommended definition
RECOMMENDATIONS
1 In view of the high prevalence of prehypertension in this study it is recommended
that students should have their blood pressure measured at school entry as this will
68
help identify those with abnormal BP for early intervention Thereafter BP check
should be offered at least once a year at the beginning of a new session especially for
those found with abnormal BP at school entry
2 Physical and health education should be revived in all the schools This will lead to
increased physical activity and reduced risk of obesity and its consequences
3 School health programmes should be strengthened in schools where it already exist
and effort made to establish same in schools where it is yet to exist The programme
should include measures to detect early prehypertension and hypertension and other
health related needs of the students
LIMITATIONS
The following limitations were encountered in the course of the study
1 Exclusion and inclusion of students that were based on volunteered information and
physical evaluation This could have led to inclusion andor exclusion of adolescentss
69
with or without background renal diseases which could have affected the result of this
study
2 Home blood pressure measurement especially early morning measurement for those
with high blood pressure to possibly eliminate the effect of stress traffic andor
trekking and other school related stresses which may affect blood pressure during the
day
LINES OF FUTURE RESEARCH
This study was questionnaire based and time bound Consequently students were not
investigated for background diseases co-mordid conditions target organ damage or risk
factors for high blood pressure They were also not followed up In view of this future
research on blood pressure in adolescents should include-
70
1 Investigations such as urinalysis electrolytes urea and creatinine random blood
sugar (RBS) lipid profile and echocardiography as part of blood pressure evaluation
in adolescents
2 A long period of study to allow for follow-up over months or years to identify those
that are truly hypertensive considering the definition of hypertension It will also
reveal the rate of progression from pre-hypertension to hypertension
3 Risk factors evaluation for high blood pressure including genetic predispositions
REFERENCES
1 Blood pressure from Wikipedia the free Error Hyperlink reference not valid
Accessed 24th November 2011
2 Pickering TG Hall JE Appel LJ Falkner BE Graves J Hill MN Jones DW Kurtz T
Sheps SG Roccella EJ Recommendations for blood pressure measurement in humans
and experimental animals Part 1 Blood pressure measurement in humans A
statement for professionals from the subcommittee of professional and public
71
education of the American Heart Association council on high blood pressure research
Hypertension 2005 45 142-61
3 da Silva IRR de Souza MDG de Camargo CAC Blood pressure measurement in
children and adolescents Guidelines of high blood pressure recommendations and
current clinical practice Arq Bras Cardiol 2007 88 434-7
4 Sinaiko AR Hypertension in children N Engl J Med 1996 3351968-73
5 US Preventive Services Task Force Screening for high blood pressure
recommendations and rationale Am J Prev Med 2003 25 159-64
6 Report of the second task force on blood pressure control in children Pediatrics 1987
79 1-25
7 National high blood pressure education programme working group on hypertension
control in children and adolescents update on the 1987 task force report on high blood
pressure in children and adolescents A working group report from the national high
blood pressure education program Pediatrics 1996 98 649-58
8 National high blood pressure education program working group on high blood
pressure in children and adolescents The fourth report on the diagnosis evaluation
and treatment of high blood pressure in children and adolescents Pediatrics 2004
114 255-76
9 Aderele WI Seriki O Hypertension in Nigerian children Arch Dis Child 1974
49313-7
10 Bo S Gambino R Gentile L Pagano G Rosato R Saracco GM Cassader M
Durazzo M Cavallo-Perin P High-normal blood pressure is associated with a cluster
of cardiovascular and metabolic risk factors a population based study J Hypertens
2009 27 102-8
72
11 Bao W Threefoot SA Srinivasan SR Berenson GS Essential hypertension
predicted by tracking of elevated blood pressure from childhood to adulthood The
Bogalusa Heart Study Am J Hypertens 1995 8 657- 65
12 Richard A Rodgers M Hedley AJ Mitchel JRA Changes in blood pressure and
blood lipid during adolescence BMJ 1980 28 1563-6
13 Sundstroumlm J Neovius M Tynelius P Rasmussen F Association of blood pressure in
late adolescence with subsequent mortality cohort study of Swedish male conscripts
BMJ 2011 342 643-8
14 Zimmet P Alberti G Kaufman F Tajima N Silink M Arslanian S Wong S Bennett
P Shaw J Caprio S On behalf of the International Diabetes Federation Task Force on
Epidemiology and Prevention of Diabetes The metabolic syndrome in children and
adolescents the IDF consensus Diabetic Voice 20075229-32
15 Abdulrahman FA Babaoye AA Childhood hypertension in northern Nigeria West
Afr J Med 1978 1 7-11
16 Adediran O Jimoh A Di M Relationship between body mass index and blood
pressure in rural Nigerian dwellers Internet J Nutri Wellness 2009 7 431-4
17 World Health Organization (WHO)UNICEF Adolescence at a glance 2003 p 2
18 The National Population Commission constitution of the Federal Republic of Nigeria
(AP 23 LFN) legal notice on publication issued April 21st 2007
19 Heald FP and Gong EJ Diet Nutrition and adolescents In Shils ME and Ross AC
(eds) Modern Nutrition in Health and Disease 9th ed William and Wilkins
Maryland USA 1999 p 32
20 Okonkon CT The prevalence of Hypertension among civil servants in Calabar Nig
Med J 1979 7422-5
21 Bugaje MA Yakubu AM Ogala WN Prevalence of adolescent hypertension in Zaria
Nig J Paediatr 2005 32 77-82
73
22 Obika LF Adedoyin MA Olowoyeye JO Pattern of paediatric blood pressure in
rural semi urban and urban communities in Ilorin Nigeria Afri J Med Sci 1995 24
371-7
23 Jeremy B A short history of blood pressure measurement section of the history of
medicine Proc Roy Soc Med 1977 70 793-9
24 Lewis O Stephen Hales and the measurement of blood pressure J Hum Hypertens
1994 8 865-71
25 Crile GW Blood Pressure in Surgery An experimental and Clinical Research
Philadelphia Lippincott 1903 p 358
26 Lewis WH The evolution of clinical sphygmomanometer Bull N Y Acad Med 1941
17 871-81
27 Browne WC OrsquoBrien ET Semple PF The sphygmomanometer of Riva Roci 1896-
1996 J Hum Hypertens 1994 610 723-4
28 Segal HN How Korotkoff the Surgeon discovered the auscultatory method of
measuring arterial pressure Ann Intern Med1975 83 561-2
29 Goodman FH and Howell AA Clinical studies in the auscultatory method of
determining blood pressure University of Pennsylvania Bulletin 1911 23 469-75
30 Crenner CW Introduction of the blood pressure cuff into US medical practice
technology and skilled practice Ann Intern Med 1998 128 488-493
31 Ganon WF Circulation In Review of Medical Physiol Lange Medical Publication
New York 22nd edition 2005 p 234-63
32 Beth C Homeostatic Regulation of Blood pressure Available from
URLhttpwwweHowcom Accessed on 1st December 2011
33 Rajinder KG Fahim M Regulation of cardiovascular functions during acute blood
loss Indian J Physiol Pharmacol 2005 49 213ndash9
74
34 Dampney AL Coleman MJ Fonts MAP Hirooka Y Horiuchi J Polson JW Potts
PD Tagawa T Central mechanisms underlying short-term and long-term regulation
of the cardiovascular system Proc Austr Physio Pharmacosociety 2001 32 333-44
35 Koshiya N Guyenet PG Noradrenergic neurons and the carotid sympathetic
chemoreflex Am J Physiol 1994 267 519-26
36 Prakash ES The ultimate goal in neural regulation of cardiovascular function Adv
Phyiol Educ 2008 32 107-8
37 Allen AM Inhibition of the hypothalamic paraventricular nucleus reduces
sympathetic nerve discharge and blood pressure Proc Austr Neuroscience Society
2001 29 44-7
38 Reid IA Interactions between ANG II sympathetic nervous system and
baroreceptor reflexes in regulation of blood pressure Am J Physiol 1992 262 763-
78
39 Brooks VL Osborn JW Hormonal-sympathetic interactions in long-term
regulation of arterial pressure A hypothesis Am J Physiol 1995 268 1343-58
40 Reckelhoff JF Gender Differences in the Regulation of Blood Pressure
Hypertension 2001 37 1199-208
41 Fink GD The systemic circulation as a regulated free-market economy A new
approach for understanding the long-term control of blood pressure Clin Exp
Pharmacol Physiol 2005 32 377ndash83
42 Benard K Sources of error in blood pressure measurement Hospital Physician 2002
12 33-7 Available from URLhttp wwwturnerwhitecom
43 Chyun DA A comparism of intra arterial and auscultatory blood pressure readings
Heart lung 1985 14 223-31
75
44 Nwankwo MU Lorenz JM Gardiner JC A Standard Protocol for Blood Pressure
Measurement in the Newborn Pediatrics 1997 99 1342-9
45 Deakin CD Low JL Accuracy of the advanced trauma life support guidelines for
predicting systolic blood pressure using carotid femoral and radial pulses
observational study BMJ 2000 321 673ndash4
46 OrsquoBrian E Replacing mercury sphygmomanometers require clinician to demand
better automated device BMJ 2000 320 815-6
47 McKay DW Raju MK Campbell NR Assessment of blood pressure measuring
techniques Med Educ 1992 26 208ndash12
48 Baker RH Ende J Confounders of auscultatory blood pressure measurement J Gen
Intern Med 1995 10 223ndash31
49 Neufeld PD Johnson DL Observer error in blood pressure measurement CMAJ
1986 135 633ndash7
50 van Montfrans GA Oscillometric blood pressure measurement progress and
problems Blood Press Monit 2001 6 287ndash90
51 Ware RW Laenger CJ Indirect blood pressure measurement by Doppler ultrasonic
kinetoartriography Proceedings 20th Annual Conference Engineering Medical
Biology 1967 9 27-30
52 Matthew Fox Blood pressure measurement technique Available from URL http
wwwlivestrongcom Last edited 2nd September 2010 Accessed on 30th November
2011
53 Akor F Okolo SN Okolo AA Blood pressure and anthropometric measurements in
healthy Primary School entrants in Jos Nigeria SAJCH 2010 4 42-5
54 Merhi BM Al-Hajj F Al-Tannir M Zaide F El-Rajab M A survey of blood pressure
in Lebanese children and adolescents North Am J Med Sci 2011 3 24-9
76
55 Al-Salloum AA El-Mouzan AH Al-Herbish AS Al-Umar AA Qurashi MM Blood
pressure standard for Saudi children and adolescents Ann Saudi Med 2009 29 173-8
56 Akinkugbe FM Akinwolere AO Kayode CM Blood Pressure Pattern in
Adolescence West Afri J Med 1999 18 196-202
57 Wanzhu T Eckert GJ Saha C and Pratt JH Synchronization of Adolescent Blood
Pressure and Pubertal Somatic Growth J Clin Endo Metab 2009 94
58 Ansa VO Anah MU Odey FA Mbu PN Agbor EI Relationship between parental
socioeconomic status and casual blood pressure in coastal Nigeria Adolescents West
Afri J Med 2010 29146-52
59 Agyemang C Redekop WK Owusu-Dabo E Bruijnzeels MA Blood pressure
patterns in rural semi-urban and urban children in the Ashanti region of Ghana West
Africa BMC Public Health 2005 5114-21
60 Ejeke CCE Ugwu CE Ezeanyika LUS Olayemi AT Blood pressure patterns in
relation to geographic area of residence a cross-sectional study of adolescents in Kogi
state Nigeria BMC Public Health 2008 8 411-5
61 Colhoun HM Hemminway H Poulter WR Socioeconomic status and blood
pressure an overview analysis J Human Hypertension 1998 12 91-110
62 Badaruddoza KR Familial aggregation and heritability for cardiovascular risk factors
a family based study in Punjab India Natural Science 2010 2 732-6
63 Livshits G Gerber LM Familial factors of blood pressure and adiposity co-variation
Hypertension 2001 37 928-35
64 Fermino RC Seabra A Garganta R Antoacutenio J Maia R Genetic factors in familial
aggregation of blood pressure of Portuguese nuclear families Arq Bras Cardiol 2009
92 463-9
77
65 Mijinyawa MS Iliyasu Z Borodo MM Prevalence of hypertension among teenage
students in Kano Nigeria Nig J Med 2008 17 173-7
66 The Wellcome Trust case control consortium Genome-wide association study of
14000 cases of seven common diseases and 3000 shared controls Nature 2007 447
661-78
67 Levy D Destefano AL Larson MG ODonnell CJ Lifton RP Gavras H Evidence for
a gene influencing blood pressure on chromosome 17 genome scan linkage results for
longitudinal blood pressure phenotypes in subjects from the Framingham heart study
Hypertension 2000 36 477- 83
68 Lifton RP Wilson FH Choate KA Geller DS Salt and blood pressure new insight
from human genetic studies Cold Spring Harb Symp Quant Biol 2002 67 445ndash50
69 van der Sande MA Milligan PJ Nyan OA Rowley JT Banya WA Ceesay SM
Dolmans WM Blood pressure patterns and cardiovascular risk factors in rural and
urban Gambian communities J Hum Hypertens 2000 14 489-96
70 Akinkugbe OO Ojo OA Arterial blood pressure in rural and urban population of
Nigeria BMJ 1969 2 22-4
71 Okagua J Anochie IC Akani NA Adolescent blood pressure in Rivers State Nigeria
A rural-urban comparism NJP 20154221-7
72 Urrutia-Rojas X Egbuchunam CU Bae S Menchaca J Bayona M Rivers PA Singh
KP High blood pressure in school children Prevalence and risk factors BMC
Pediatrics 2006 6 32-9
73 Sorof JM Lai D Turner J Poffenbarger T Potman R Overweight ethnicity and the
prevalence of hypertension in school-aged children Pediatrics 2004 113 475-82
78
74 Rosner B Prineas R Daniels SR Blood pressure differences between blacks and
whites in relation to body size among US children and adolescents Am J Epidemiol
2000 151 1007-18
75 Harding S Whitrow M Lenguerrand E Maynard M Teyhan A Cruickshank JK Der
G Ethnic differences in blood pressure in adolescence the determinants of adolescent
social well-being and health study Hypertension 2010 55 1063-9
76 Cruickshank JK Mzayek F Liu L Kieltyka L Sherwin R Webber LS Srinavasan SR
Berenson GS Origins of the ldquoblackwhiterdquo difference in blood pressure roles of birth
77 Vlajinac H Miljus D Adanja B Marinkoic J ipetic S Kocev N Blood pressure levels
in 7 to 14-year-old Belgrade children J Human Hypertension 2003 17 761ndash5
78 Menezes AMB Hallal PC Dumith SC Adolescent blood pressure body mass index
and skin folds sorting out the effects of early weight and length gains J Epid Comm
Health 2011 12 42-8
79 Karelis AD St-Pierre DH Conus F Rabasa-Lhoret R Poehlman EJ Metabolic and
body composition factors in subgroups of obesity what do we know J Clin Endo
Metab 2004 89 2569-75
80 Katzmarzyk PT Srinivasan ER Chen W Malina RM Bouchard C Berenson GS
Body mass index waist circumference and clustering of cardiovascular disease risk
factors in a biracial sample of children and adolescents Pediatrics 2004 114 198-205
81 Guagnano MT Ballone E Colagrande V Della Vecchia R Manigrasso MR Merlitti
D Riccioni G Sensi S Large waist circumference and risk of hypertension Int J
Obesity 2001 25 1360 ndash 4
82 Araujo TA Lopes MVO Moriera RP Cavalcante TF Gurdes NG MartinS dA Silva
V Blood pressure of children and teenagers from a public school in Fortaleza - Cearaacute
Acta paul enferm 200720103-15
79
83 Sebanjo IO Oshikoya KA Obesity and blood pressure levels of adolescents in
Abeokuta Nigeria Cardiovasc J Afr 2011 221-5
84 Messerli FN Obesity and essential hypertension Haemodynamics sodium excretion
and plasma rennin activity Arch Int Med 1981 141 81-5
85 Appel LJ Brands MW Daniels SR Karanja N Elmer PJ Sacks FM Dietary
Approaches to Prevent and Treat Hypertension A Scientific Statement from the
American Heart Association Hypertension 2006 47 296-308
86 Sacks FM Svetkey LP Vollmer WM Appel LJ Bray GA Harsha D Obarzanek E
Conlin PR Miller ER 3rd Simons-Morton DG Karanja N Lin PH for the DASH-
Sodium Collaborative Research Group Effects on blood pressure of reduced dietary
sodium and the Dietary Approaches to Stop Hypertension (DASH) diet DASH-
Sodium Collaborative Research Group N Engl J Med 2001 344 3ndash10
87 Appel LJ Moore TJ Obarzanek E Vollmer WM Svetkey LP Sacks FM Bray GA
Vogt TM Cutler JA Windhauser MM Lin PH Karanja N A clinical trial of the
effects of dietary patterns on blood pressure DASH Collaborative Research Group N
Engl J Med 1997 3361117ndash24
88 Appel LJ Sacks FM Carey VJ Obarzanek E Swain JF Miller ER 3rd Conlin PR
Erlinger TP Rosner BA Laranjo NM Charleston J McCarron P Bishop LM for the
OmniHeart Collaborative Research Group Effects of protein monounsaturated fat and
carbohydrate intake on blood pressure and serum lipids results of the OmniHeart
randomized trial JAMA 2005 294 2455ndash64
89 Karanja NM Obarzanek E Lin PH McCullough ML Phillips KM Swain JF
Champagne CM Hoben KP Descriptive characteristics of the dietary patterns used in
the Dietary Approaches to Stop Hypertension Trial DASH Collaborative Research
Group J Am Diet Assoc 1999 99 19ndash27
80
90 Nwokocha ARC Adolescence and associated problems In Azubuike JC and
Nkanginieme KEO (eds) Paediatrics and Child Health in a Tropical Region African
Educational Services Owerri Nigeria 2nd edition 2007 p 84-99
91 Rogol RT Roemmich JN Clark PA Growth and puberty J Adol Hlth 2002 31 192-
200
92 Tanner JM Marshal WA Variation in the pattern of puberty changes in boys and girls
Arch Dis Child 1970 45 13-23
93 Nwakoro SO Ifoda K Onochie O Olomu JM Anthropometric assessment of
nutritional status and growth of 10-20 years individuals in Benin City metropolis
Nigeria Pakistan J Nutr 2006 5 117-21
94 Shankar RR Eckert GJ Saha C Tu W Pratt JH The change in blood pressure during
pubertal growth J Clin Endo Metab 2005 90 163-7
95 Department of Health and Human Services 2000 CDC Growth Charts for the United
States methods and development Series Report 11 No 246 Available from URL
httpwwwcdcgovGrowthCharts
96 Redwine KM Daniels SR Prehypertension in Adolescents Risk and Progression
Journ Clin Hypertension 2012 14 360ndash4
97 Falkner B Gidding SS Portman R Rosner B Blood pressure variability and
classification of prehypertension and hypertension in adolescence Pediatrics 2008
122238ndash42
98 Redwine KM Acosta AA Poffenbarger T Development of hypertension in
adolescents with pre-hypertension J Pediatr 2012 16098ndash103
99 Ejike ECCC Ugwu CE and Ezeanyika LUS Variations in the prevalence of point
prehypertension in a Nigerian school-going adolescent population living in a semi-
urban and an urban area BMC Pediatr 2010 1013
81
100 Ujunwa FA Ikefuna AN Nwokocha AR Chinawa JM Hypertension and
prehypertension among adolescents in secondary schools in Enugu South East Nigeria
Italian J Pediatr 20133970-5
101 Chobanian AV Bakris GL Black HR Seventh report of the Joint National
Committee on Prevention Detection Evaluation and Treatment of High Blood
Pressure Hypertension2003 421206ndash52
102 Lande MB Systemic Hypertension In Kliegman RM Behrman RE Jenson HG and
Stanton BF (eds) Nelson Textbook of Pediatrics Saunders Elsevier Philadelphia 19th
Edition 2011 pg 1592-8
103 Luma GB Spiotta RT Hypertension in Children and Adolescent Am Fam Physician
2006 73 1558-68
104 Arvind B Rupesh J Vijayakumar M Madhuri K Ali U Evaluation and management
of hypertension Indian Paediatr 2007 44 103-21
105 Flynn JT Neonatal hypertension Diagnosis and management Pediatr Nephrol 2000
14 332-41
106 Steyn K de Wet T Richter L Cameron N Levitt NS Morrel C Cardiovascular
diseases risk factors in 5-year old urban South African children- The Birth to Ten
Study SAMJ 2000 90 7126
107 Antia-Obong OE Antia-obong LE Arterial blood pressure of Nigerian Urban and
Rural school children Nig J Paediatr 1991 18 3-11
108 Nguyen NT Magno CP Lane KT Hinojosa MW Lane JS Association of
hypertension diabetes dyslipidemia and metabolic syndrome with obesity findings
from the National Health and Nutrition Examination Survey 1999 to 2004 J Am Coll
Surg 2008 207 928-34
82
109 Solar MB Gill A Rey J Epidemiology of arterial blood pressure in school children
population Aten Primaria 1992 9 212-4
110 Steyn K de Wet T Richter L Cameron N Levitt NS Morrel C Cardiovascular
diseases risk factors in 5-year old urban South African children- The Birth to Ten
Study SAMJ 2000 90 7126
111 Linkas J The assessment and management of hypertensive emergencies and
urgencies in children Pediatr Emerg Care 2005 21391-6
112 Croix B Feig DI Childhood hypertension is not a silent disease Pediatr Nephrol
2006 21527-32
113 Flynn JT Anderson MH Characteristics of children with primary hypertension seen
at a referral centre Pediatr Nephrol 2007 44 103-21
114 Nakao M Yano E Nomura S Kuboki T Blood pressure lowering effects of
biofeedback treatment in hypertension a meta-analysis of randomized controlled trials
Hypertension 2003 26 37- 46
115 Jalingo Available from URLhttpwwwencyclopedia Britanica Accessed on 3rd
December 2011
116 Araoye MO Research Methodology with Statistics for Health and Social Sciences
Nathadex Publishers Saw-Mill Ilorin Nigeria 2004 pg 115-21
117 Olusanya O Okpere E Ezimokhai M The importance of social class in voluntary
fertility control in a developing country West Afr J Med 1985 4 205-12
118 World Health Organization expert committee Physical status the use and
interpretation of anthropometry WHO technical report series No 894 Geneva WHO
1995 p 424ndash38
119 Guidelines subcommittee WHOISH guideline for management of hypertension J
Hypertens 1999 17 151-83
83
120 Aubay B How to measure waist circumference Available from
URLhttpwwwehowcom Last updated August 10th 2011 and accessed on December
9th 2011
APPENDICES
Appendix 1
PROFORMA ON BLOOD PRESSURE PATTERN IN APPARENTLY HEALTHY
SECONDARY SCHOOL ADOLESCENTS IN JALINGO
PUBLIC SCHOOL [ ]
Serial No
84
PRIVATE SCHOOL [ ]
A BIODATA
1 Age (years) 10[ ] 11[ ] 12[ ] 13[ ] 14[ ] 15[ ] 16[ ] 17[ ] 18[ ] 19[ ]
2 Gender M [ ] F [ ]
3 Class JSS 1-3 [ ] SS1-3 [ ]
B MEDICAL AND SOCIAL HISTORY Yes [1] No [2]
1 Have you ever passed blood in your urine [ ]
2 Have you ever had your face or legs swollen [ ]
3 Are you on any drug for long time (such as pills steroids marijuana codeine
NSAIDs containing drugs tramal and others) [ ]
If yes specifyhelliphelliphellip
C SOCIO-ECONOMIC CLASSIFICATION
Fatherrsquos occupation
Score 1 Professionals top civil servants politicians and top businessmen
2Middle-level civil servants technicians skilled-artisans and well-to-do
traders
3 Unskilled workers and those in general whose income would be at or below
the national minimum wage
Mothers educational level
Score 0 Education up to University level
1 Secondary or tertiary level below the University
2 No formal education or up to primary level only
D ANTHROPOMETRY
i Weight (Kg) ndash 1helliphellip 2helliphelliphellip Averagehelliphelliphelliphellip
ii Height (m) ndash 1helliphellip 2helliphellip Averagehelliphelliphelliphellip
85
iii Body mass index = weightheight (kgm2)
v Waist circumference (cm) ndash 1helliphellip 2helliphelliphellip Averagehelliphelliphelliphellip
iv Blood Pressure (mmHg) - 1helliphellip 2hellip 3helliphellip Averagehelliphelliphelliphellip
Appendix 2
AUTHORIZATION AND CONSENT TO PARTICIPATE IN A RESEARCH
I Dr Peter Teru Yaru of the Department of Paediatrics Ahmadu Bello University
Teaching Hospital (ABUTH) Zaria Irsquom conducting a research on the blood pressure
pattern among secondary school adolescents in Jalingo
The aim of the study is to know the level of blood pressure among their age
groups Those with high blood pressure (or hypertension) will be identified appropriately
advised and referred for further care The study will involve taking their weight height
blood pressure and waist circumference Female assistants shall be responsible for
86
measuring waist circumference of female students Students will also be given a
questionnaire on some of their activities drug use among others all aimed at looking for
factors which can affect their blood pressure Information obtained shall be treated with
utmost confidentiality and for this research work only Please note that participation is
voluntary I will be glad if you give consent for your childward to participate in the
study
Statement by parents Irsquove read and understood this consent form and agreed for my
child to be included in the study
Parents name Researcherrsquos name and sign
Parents phone no if any Date
Parents signthumb print Phone no
87
Appendix 3
SOCIO-ECONOMIC SCORE
The classification of socio-economic scores based on fatherrsquos occupation and motherrsquos
education by Olusanya et al117
A Husband (fatherrsquos occupation)
Score 1 Professionals top civil servants politicians and businessmen
2 Middle-level bureaucrats technicians skilled-artisans and well-to-do traders
3 Unskilled workers and those in general whose income would be at or below
the national minimum wage
B Mothers educational level
Score 0 Education up to University level
1 Secondary or tertiary level below the University
2 No formal education or up to primary level only
The socio-economic class of the childrsquos mother is obtained by adding the scores from A
and B above and graded I-V as appropriate for example
Score (1) from A plus score (0) from B = social class I
Score (2) from A plus score (0) from B = social class II
Score (2) from A plus score (1) from B = social class III
Score (2) from A plus score (2) from B = social class IV
Score (3) from A plus score (0) from B = social class III
Score (3) from A plus score (1) from B = social class IV
Score (3) from A plus score (2) from B= social class V
Page 7
7
LIST OF ABBREVIATIONS
ADH Antidiuretic Hormone
ANP Atrial Natriuretic Peptide
BMI Body Mass Index
BP Blood pressure
CDC Centre for Disease Control
CVA Cerebro-vascular accident
DASH Dietary approach to stop hypertension
DBP Diastolic blood pressure
Ht Height
JSS Junior secondary school
Kg Kilogramme
M Meter
mmHg Millimeters of Mercury
NHBPEPWG National High Blood Pressure Education Programme Working Group
NCHS National Centre for Health Statistics
PGS Pubertal Growth Spurt
PHC Primary Health Care
QI Queteletrsquos index
SBP Systolic blood pressure
SSS Senior secondary school
SMR Sexual maturity rating
USA United States of America
WC Waist circumference
WHO World Health Organization
WHR Waist-hip ratio
Wt Weight
8
LIST OF TABLES
Table I Result of pilot study 26
Table II List of schools and number of students selected 28
Table III Age and sex distribution of the study subjects 33
Table IV Overall ean anthropometric measurements of the study subjects 35
Table V Mean anthropometric indices of 628 boys 36
Table VI Mean anthropometric indices of 722 girls 37
Table VII Mean and ranges of blood pressure of 1350 subjects 38
Table VIII Mean blood pressure in relation to age and sex 39
Table IX Mean blood pressureaccording to sex and stages of adolescence 41
Table X The pattern of normal BP prehypertension and hypertension according to stages of
adolescence 41
Table XI Correlation between blood pressure and anthropometry 42
Table XII Mean blood pressure in relation to socioeconomic classes 43
Table XIII Blood pressure pattern in relation to socioeconomic classes 43
Table XIV Overall Blood pressure pattern and prevalence of hypertension 45
9
LIST OF FIGURES
Figure 1 Studentsrsquo distribution according to socioeconomic classes 34
Figure 2 Blood pressure distribution in relation to age and sex 40
10
SUMMARY
A cross sectional study of blood pressure pattern in apparently healthy secondary school
adolescents aged 10-19years in Jalingo Taraba state was carried out over six months period
from January to July 2014 One thousand three hundred and fifty (1350) students
participated comprising 628 (465) boys and 722 (535) girls Variables measured
included blood pressure weight height waist circumference and body mass index was
calculated from the weight and height
Overall the mean anthropometric values and blood pressure increased with age
irrespective of sex The mean weight of the students was 486plusmn109kg with a range of 23-
100kg while the mean height was 16plusmn01m and ranged from 12-19m The mean waist
circumference was 656plusmn89cm and ranged from 22-100cm while the meanbody mass index
(BMI) was 189plusmn31 with a range of 114-420
The overall mean systolic blood pressure was 1089plusmn125mmHg with a range of 76-
165mmHg whilethe mean diastolic blood pressure was683plusmn82mmHg and ranged from 47-
95mmHg The gender related differences in blood pressure showed mean systolic blood
pressure for boys and girls to be 1081plusmn133mmHg and 1095plusmn117mmHg (t=-2054
p=0040) while the mean diastolic blood pressurewas 678plusmn81mmHg and
687plusmn82mmHg(t=-2077 p=0038) respectively Girls generally had a higher mean systolic
blood pressure than boys from early adolescence (t=3754 p=0007) to middle adolescence
(t=-3025 p=0011) but reversed during late adolescence with boys having higher mean
systolic blood pressure (t=2145 p=0033) and these differences were statistically significant
Girls also showed dominance in the diastolic blood pressurein early and middle adolescence
but only statistically significant during middle adolescence (t=-3517 plt0000) Adolescents
from private schools had higher meansystolic blood pressure of 1102plusmn123mmHg than those
11
from public schools with 1084plusmn125mmHg(t=-222 plt0027)and higher mean diastolic
blood pressure of 703plusmn80mmHg than those from public schools with 677plusmn81mmHg(t=-
461 p=0000)
Blood pressure correlated positively with age (r=030-035 plt0000) height (r=034-
044 plt0000) weight (r=038-051 plt0000) body mass index (r=029-040 plt0000) and
waist circumference (r=023-031 plt0000) The socio-economic class associated negatively
with blood pressure withthose from upper socio-economic classeshavinga relatively
lowermean blood pressure than their counterparts from lower socio-economic classes but the
differences were not statistically significant for both systolic (f=1650 p=2850) and diastolic
blood pressure (f=0193 p=0058)
The overall point prevalence of hypertension was 44(59 0f 1350) with gender specific
prevalence for malebeing 41 (26 of 628 boys) and46 (33 of 722 girls) for females The
gender difference was not statistically significant (χ2=0831 p=0362) According to stages of
hypertension 15 (10 of 628)and 11 (7 of 628) males had stages 1 and 2 systolic
hypertension respectively while24 (15 of 628) had stage 1 diastolic hypertension andnone
had stage 2 diastolic hypertension Similarly 24 (17 of 722) and 12 (9 of 722) females
had stages 1 and 2 systolic hypertension respectively while 12 (9 of 722) and only 01 (1
of 722) girls had stages 1 and 2 diastolic hypertension respectively The overall prevalence of
pre-hypertension was 221(298 of 1350) with gender related prevalence of 21 (131 of
628) for males and231 (167 of 722) for femalesThe gender difference was statistically
significant (χ2=4349 p=0037)
In view of the high prevalence of pre-hypertension of 221 (298 of 1350) in this
study it is recommended that blood pressure measurement should be included as part of
medical evaluation at secondary school entry and at least annually thereafter especially for
those found to be at risk of hypertension during school entry
12
INTRODUCTION
Blood pressure (BP) is the pressure exerted by circulating blood volume on the walls of
blood vessels1 It is one of the vital signs measured during routine physical examination2
Blood pressure measurement is done to screen for hypertension and other cardiovascular
risk factors determining risk for various medical procedures identifying patients in
potential or actual clinical deterioration and determining individualrsquos fitness for an
occupation3 Its value as a screening tool in adults has long been documented and is an
established important component of routine paediatric physical examination4
The importance of BP measurement in children and adolescents is based on the fact
that hypertension is now increasingly diagnosed among them5-8 The American Academy
of Paediatrics now recommends routine screening of asymptomatic adolescents and
children during preventive care visits Such screening will identify potentially treatable
and preventable causes of hypertension and initiate early treatment to prevent
complications5
Hypertension is an important health problem all over the world5-9 because it is
usually silent and the presence of symptoms may indicate end organ damage10 It is
known to track well into adulthood thus making BP measurements in youths valuable for
identifying adolescents at risk of essential hypertension in adulthood11 Individuals with
high BP in their childhood are more likely to have high BP in subsequent years12 The
phenomenon of BP tracking into adulthood and the demonstration of the beginnings of
hypertensive target organ damage during childhood together with the increased
prevalence of childhood essential hypertension have raised concern of an impending
epidemic of cardiovascular morbidity and mortality10
The consequences of hypertension in children range from increased morbidity
from its causes complications or its treatment to high mortality13 The most frequently
13
and perhaps severely affected organs are the heart kidneys brain and the eyes leading to
lowered life expectancy and premature death13 In addition hypertension is a component
of the metabolic syndrome associated with similar and perhaps more severe consequences
in affected individuals14 Abdulrahaman and Babaoye15 in a study of hypertension in
Nigerian children observed a mortality rate of 28 within the first year after diagnosis
Similar mortality of 275 was reported by Aderele and Seriki9 Hypertension also places
an excessive financial burden on the population and health system consuming scarce
resources16
Adolescence is the transitional period of development between childhood and
adulthood The World Health Organization (WHO) defines adolescents as individuals
between the ages of 10 and 19 years and they account for 40 of Nigeriarsquos population1718
Adolescence is characterized by rapid biological psychological and cognitive changes
largely dependent on hormonal and environmental influences19 Many of the responses to
these influences include behaviours that have direct implications on health such as harmful
dietary intake alcoholism smoking substance abuse and sedentary lifestyle19 These
coupled with social stresses such as city traffic congestion have negative health impact and
predispose to obesity and increased risk of cardiovascular disease such as hypertension and
metabolic syndromes10 20 It has been shown that if preventive measures are started early in
childhood and adolescence they may lead to significant reduction in the high prevalence of
hypertension and metabolic syndrome currently observed in adults81320
JUSTIFICATION FOR THE STUDY
Hypertension is associated with high morbidity affecting major organs of the body such as
the heart kidneys and the brain1314 and a mortality of up to 275-28915 It is now diagnosed
frequently in adolescents with a reported prevalence of 35-952122 The younger the age of
14
onset of hypertension the greater the reduction in life expectancy if left untreated13 Even
asymptomatic adolescents with mild blood pressure elevations can have target organ
damage10 Studies121420 have shown that early identification and intervention may lead to a
significant reduction in the high prevalence of hypertension and metabolic syndrome
currently observed in adults In view of this routine blood pressure check-ups for children
and adolescents have been advocated during medical evaluations8 Blood pressure is
however not routinely measured in most paediatric clinical practices in Nigeria
Consequently only few children will have their blood pressure measured when they fall sick
or during preventive care visits In addition hospital and clinic BP measurements may be
associated with falsely elevated BP called lsquolsquowhite coat hypertensionrsquorsquo8 BP measurement of
children outside of the hospital setting such as in schools will provide opportunity for
apparently healthy individuals and possibly eliminate white coat hypertension The need for
surveillance for the early identification of adolescents in Jalingo who are at risk of
hypertension and to initiate measures aimed at preventing its consequences is therefore the
justification for this study In addition the study will add to the body of knowledge on
adolescent blood pressure as there has been no previous study on BP from Jalingo and
northeastern Nigeria as a whole This will help inform public health policies regarding blood
pressure control and prevention in Taraba State in particular and in Nigeria in general
15
LITERATURE REVIEW
HISTORICAL PERSPECTIVE
Blood pressure measurement first started in the eighteenth century with the experiment of
Stephen Hales to whom its discovery can be attributed as reported by Jeremy2324
Accurate study of blood pressure as reported by Crile25 began with the introduction of a
manometer by Poiseuille a century later The first truly accurate blood pressure
measurement in man was by the Surgeon Faivre in 1856 when he connected an artery to a
mercury manometer to obtain direct readings24 Non-invasive methods of BP
measurement started with the discovery of the sphygmograph in 1855 by Vierordt as
reported by Crile25 and improvement by Potain in 1889 gave birth to the
sphygmomanometer26 In 1896 Scipione Riva-Rocci developed the method upon which
present-day technique is based27
Segal28 reported that the use of stethoscope for BP measurement was first highlighted
in 1905 by a Russian surgeon Korotkoff who documented hearing a tapping sound using a
stethoscope placed over the brachial artery as the Riva-Rocci cuff was deflated Goodman
and Howell29 recommended the division of the changing sounds into five distinct phases and
physicians subsequently determined blood pressure according to the point of appearance and
muffling or disappearance of the sounds30
DEFINITION AND REGULATION OF BLOOD PRESSURE
Blood pressure is defined as the product of cardiac output and peripheral vascular
resistance131 During each heartbeat BP varies between a maximum (systolic) and a
minimum (diastolic) pressure and is measured in millimeters of mercury (mmHg)1 Blood
16
pressure is regulated by different mechanisms acting either rapidly or slowly to maintain it
within normal range for optimal cellular performance3132
Intrinsic Regulation
Intrinsic factors regulating BP include stroke volume and heart rate which both influence
cardiac output31 Stroke volume depends on the volume of blood that fills the ventricles and
this depends on the preload and afterload33 A higher afterload will decrease stroke volume
causing low cardiac output and low BP and vice versa When cardiac output increases more
volume is derived from the venous pool increasing preload Similarly an increased heart rate
will lead to increased cardiac output and BP3134
Reflex Regulation
The baroreceptors within the aortic arch and carotid sinuses contain sympathetic and
parasympathetic nerve fibres3435 These are sensory nerves which run from the medulla
and they respond to stretch of the tissue in which they lie by increasing or decreasing the
rate of signaling36 and act fast in regulating BP34 Sympathetic stimulation causes
increased heart rate and widespread vasoconstriction to increase BP while
parasympathetic stimulation produces the opposite3537
Hormonal Regulation
Hormones regulating blood pressure include renin-angiotensin-aldosterone and
antidiuretic hormone (ADH) They act slowly by responding to changes in intravascular
volume and osmolality38 Angiotensin II is a potent vasoconstrictor and stimulates the
release of aldosterone from the adrenal gland39 Aldosterone increases sodium absorption
and fluid retention leading to increased BP ADH is a potent vasoconstrictor and plasma
volume regulator and its stimulation results in fluid retention and vasoconstriction39
Other hormones regulating BP include the sex hormones thyroid parathyroid cortisol
and ACTH They act on the rennin-angiotensin-aldosterone system to regulate BP3940
17
Renal Regulation
The kidneys control blood pressure through the retention and excretion of extracellular
fluid35 An increase in renal fluid retention will increase extracellular volume and higher
blood pressure whereas increased renal excretion leads to lower blood pressure41 This is
achieved through the action of ADH aldosterone and atrial natriuretic peptide (ANP)41
METHODS OF MEASURING BLOOD PRESSURE
Blood pressure can be measured by invasive and non-invasive methods
1) Invasive (or direct) method - Blood pressure is most accurately measured invasively
through an arterial line4243 It is the gold standard by which the accuracy of other blood
pressure measuring devices and methods are assessed4344 Chyun43 compared direct and
indirect blood pressure readings in 14 intensive care unit patients and found that the
auscultatory method overestimates the systolic and diastolic BP especially if the VI Kortkoff
sounds is used as an indicator of diastolic BP This can often over estimate reading by as
much as 20 mm Hg43 This study is made up of very small sample size to make general
conclusion on the differences in BP values from the two methods compared Although the
invasive method is the gold standard for true BP measurement it is associated with serious
complications related to arterial catheterization and the procedure itself may be technically
difficult It is mainly used in experimental procedures and in monitoring critically ill patients
in intensive care units42
2) Non invasive (indirect) methods These are simpler and quicker than the invasive
method and are commonly used for routine blood pressure examinations They may
however yield lower accuracy and small systematic differences in numerical results43
These methods include-
18
a) Palpation method - A minimum systolic value can be estimated by palpation Deakin
and Low45 reported that a palpable radial femoral or carotid pulse indicates a minimum
systolic BP of 80 70 and 60 mmHg respectively The study was carried out among adults
and these values could not be applicable in children and neonate whose maximum
systolic BP may be lower than the reported minimum values A more accurate systolic BP
value can be determined by inflating and then deflating sphygmomanometer cuff while
palpating the pulse The systolic BP corresponds to the pressure at which the radial pulse
becomes palpable45 Its disadvantages are that pressure obtained is usually 2-5mmHg less
than those obtained by auscultation and diastolic BP cannot be measured32
b) Auscultation method- Also called the Korotkoff method is the method of choice in
clinical practice142 It involves using a stethoscope and a sphygmomanometer46 The
mercury sphygmomanometer is the gold standard for BP measurement A Riva-Rocci
cuff 27 is placed over the arm and inflated to occlude the brachial artery It is then
gradually deflated until blood flow is re-established accompanied by a tapping sound
which can be detected by the stethoscope held over the artery Five sounds are
traditionally heard and classified into phases30 The first phase corresponds to the systolic
BP while the last or fifth phase corresponds to the diastolic BP30 The fourth phase
alternatively is used to measure the diastolic pressure if a 10 mmHg or greater
differences exist between the initiation of phases fourth and five or if the fifth sound is
heard down to 0 mmHg8 This may occur in cases of high cardiac output or peripheral
vasodilatation children or in pregnancy This method though the method of choice in
clinical practice may however be associated with errors arising from faulty technique and
equipment4748 as well as observer bias49 This method was used for this study because of
its widespread general usage its reliability and accuracy Unlike other methods the
instruments (mercury sphygmomanometer and stethoscope) do not require any
19
calibration and values obtained do not require validation by other methods The standard
World Health OrganizationCenter for Disease Control (WHOCDC) blood pressure
reference percentile tables were generated using the mercury sphygmomanometer hence
the auscultation method is the gold standard for BP evaluation258
The aneroid sphygmomanometer measures BP by mechanical system of metal
bellows that expand as the cuff pressure increases in a series of levers that register the
pressure on a circular scale The hybrid shygmomanometer combines some of the features
of the two and uses an electric transducer to record blood pressure2
c) Oscillometric technique- This uses the oscillometric device Oscillation of pressure in a
sphygmomanometer cuff is recorded during gradual deflation The point of maximum
oscillation corresponds to the mean arterial pressure50 The oscillation begins well above
systolic BP and continues below diastolic BP so that systolic and diastolic BP can only
be estimated indirectly according to some empirically derived algorithm
d) Ultrasound method - This uses an ultrasound transmitter and receiver placed over the
brachial artery under a sphygmomanometer cuff As the cuff is deflated the movement of
the arterial wall and systolic BP cause a Doppler phase shift in the reflected ultrasound
The diastolic BP is recorded as the point of diminished arterial motion51 Its advantage
includes the ability to detect diastolic BP in atrial fibrillation and hypotension where
Korotkoff sound is faint152
FACTORS AFFECTING BLOOD PRESSURE IN ADOLESCENTS
Several inter-related factors affect blood pressure These include-
Age - A progressive BP elevation with age has been observed in several studies2153-55
The rate of rise varies in boys and girls5455 The average systolic increase ranges between
20
166 and 286 mmHgyr for boys and 144 and 263mmHgyr for girls while that of
diastolic BP ranges from 083 and 177mmHgyr for boys and 077 and 148mmHg for
girls2155 Bugaje Yakubu and Ogala21 studied blood pressure pattern among 2035
adolescents in Zaria and found a consistent rise of BP with age The rate of rise was fairly
constant until 11-13 years in boys and 12-14 years in girls when the rise became rapid A
similar study53 also found a BP rise with age among 650 healthy school children in Jos In
a large population studies in Lebanon56 and Saudi Arabia55 BP was similarly reported to
increase consistently with age Rapid growth and biological maturation of organs which
are normal occurrences during adolescence were thought to be responsible rather than the
chronological age56 The results of these studies showed increasing blood pressure with
age despite the fact that one study55 used oscillometric method for their study while the
standard auscultation was used in the other studies Also the studied sample sizes across
these studies varied greatly with sizes of 65053 203521 571054 and 1622655 Despite this
the findings were similar
Gender ndash Results of studies on the effect of gender on BP showed that sex positively
affects blood pressure2153-55 Merhi Al-Hajj and Al-Tannir et al54 studied BP pattern in
5710 Lebanese school children while Al-Salloum El-Mouzan and Al-Herbish et al55
studied BP pattern in 16226 Saudi children and adolescents The authors reported a
higher BP in girls than boys at all ages A study21 of BP pattern in adolescents in Zaria
Nigeria demonstrated an initial higher BP in boys before puberty which reversed with the
onset of puberty up to the age of 14-15yrs when it reversed again to be higher in boys
Akinkugbe Akinwolere and Kayode56 reported no sex differences in adolescent BP in
Ibadan The reported sex difference is said to be likely due to differences in sex hormone
and pattern of growth in boys and girls57 Differences in age range of the study population
may however be responsible for the observed BP variation For instance these studies5455
21
comprised of both adolescents and pre-adolescent age groups combined in one study
while the other two studies2156 were purely adolescents21 Blood pressure is reported to be
equal in both sexes before adolescence after which the gender difference starts to
manifest most likely due to physical and hormonal changes
Socioeconomic Factors - Belonging to either end of the socioeconomic strata is found to
be associated with elevated blood pressure5859 A study in Ibadan56 reported an inverse
relationship between parental socioeconomic status and level of BP in adolescents The
authors suggested that this might be the result of the health behaviours and problems
characteristic of the lower socioeconomic class On the other hand Ejeke Ugwu and
Ezeanyika et al60 in Lokoja and another study53 in Jos both found higher BP in children
from high socioeconomic class Colhoun Hemminway and Poulter61 in a meta-analysis of
BP and socioeconomic status in developed and developing countries found an inverse
relationship of BP with socioeconomic status in developed nations and a direct correlation
in developing countries These different findings may be due to methodological
differences in socio-demographic stratification For instance Akinkugbe and
colleagues59 used fatherrsquos level of education for social classification Parentrsquos educational
level may however not equate well with level of family income The other study60 used an
automated device for their study whose values may require validation using the
recommended auscultation method Difference in environmental stresses may also be
different considering the level of development of the areas where the studies were carried
out
GeneticFamilial Factors - The effect of geneticfamilial factors on BP has been
demonstrated in some studies62-64 Familialgenetic correlations reflected in BP and other
anthropometry generally are higher among genetically close relatives such as brother-
sisters or parent-offspring than among spouses62 Levshit and Gerber63 surveyed 514
22
individuals from 135 nuclear families in Russia while Budaruddoza62 studied 1400
individuals from 380 families in India and found significant genetic influence on BP
Mijinyawa Iliyasu and Borodo65 also reported family history of hypertension as risk
factor for developing high BP in a study on prevalence of hypertension among 1000
teenagers in Kano The authors concluded that this could be due to genetic predisposition
They however did not evaluate further to determine the genetic defects The authors did
not also consider shared environmental factors known to influence blood pressure in
individuals Molecular genetic studies have identified genes as possible regulators of
BP6667 These genes regulate the renin-angiotensin-aldosterone system involved in renal
salt handling69 Mutations that increase sodium reabsorption and salt sensitivity is
associated with higher BP and vice versa68 while shared environmental risk factors may
potentiate the development of such familial conditions which might have been
responsible for outcome of the above studies6364
Environmental Factors ndash Environmental factors greatly influence BP variation in a
population592269 Akinkugbe and Ojo70 reported a consistently higher BP in Nigerian
adolescents than their counterparts of similar ages in black and white American children
The authors are of the view that this could be due to different environmental factors of the
study population Obika Adedoyin and Olowoyeye22 studied BP pattern in 2526
children aged 1-14 years in rural semi-urban and urban communities in Ilorin Nigeria
and demonstrated a hypertension prevalence of 95 in urban compared to 63 in rural
communities This was similar to the study59 in Ghana and Gambia69 The authors592269
argued that the differences were due to socioeconomic status which is higher in the urban
than the rural areas The BP variation could be accounted for by the nature of dietary
intake since the rural communities generally consume more of natural foods with less salt
and lsquojunk foodsrsquo compared to the urban populace This was demonstrated by one study61
23
which reported higher mean BP among urban communities in developing nations due to
changes in their dietary pattern Rural areas are also less exposed to the stress and hassle
of the urban cities It is of interest to note however that urban areas are a mixture of
social classes as a result of migrant workers seeking lsquogreener pasturesrsquo Okagua Anochie
and Akani71 on the other hand reported higher mean BP among rural adolescents than
their urban counter parts in Port Harcourt The authors could not identify the reason(s) for
their finding but concluded that the seemingly protective privilege of rural life may be
fading gradually The differences in the reports could however result from the sample size
composition comprising of preadolescents22 adolescents71 and adults69
Race - Higher BP levels have been reported in African-American and Hispanic school-
age children than their Caucasian counterparts and among African-Americans than the
Hispanics7273 Akinkugbe and Ojo70 demonstrated a consistently high systolic and
diastolic BP in Nigerian children compared with black and white American children of
similar age Exposure to chronic environmental stress low socioeconomic status and high
obesity rate among African American and Hispanic youths could contribute to higher
BP72-74 It can be inferred from the study that race alone may not be responsible for the
observed differences but shared environmental factors and socioeconomic status may be
contributory77 Other studies7475 however found no significant BP differences in relation
to race
Anthropometry and blood pressure (BP) - A positive correlation has been observed
between BP and anthropometry in various studies58-5977 These studies585678 observed a
significant correlation between systolic BP and weight height and body mass index
(BMI) in boys but only with weight in girls Body mass index (BMI) is used as a
measure of overall obesity but it is known to be a poor indicator of actual body fat79
Waist circumference (WC) is an aggregate measurement of the actual amount of total and
24
abdominal fat accumulation80 It is therefore a better predictor of BP and other
cardiovascular diseases8081 Guagnano Ballone and Colagrande et al81 studied the
relationship between BP and BMI WC and waist hip ratio (WHR) in 461 people and
found WC to be the most consistent anthropometry affecting BP It is of interest to note
that the study by Guagnano et al81 was in adults population while the other studies56-59
were in children and adolescents WC was also found to be a better predictor of BP in an
Italian study8081 while it was not in others56-6982 Comparing BMI and waist
circumference and their effects on BP Arauzo Lopes and Moriera et al83 in Brazilian
children found BMI to be a better predictor of BP than waist circumference This was
similar to the study by Sebanjo and Oshikoya82 in Nigerian adolescents in Akure Thus
waist circumference measurements may not be useful in the evaluation of obesity andor
hypertension in children and adolescents This may partly be explained by the uniform fat
distribution due to hormonal effect at puberty in adolescents compared to the
disproportionate fat distribution in adults Possible mechanisms for the positive
relationship between BP and high BMI includes decreased physical activity increased
salt intake impaired pulmonary functions and development of metabolic abnormalities
such as dyslipidaemia and insulin resistance8084
Nutritional factors - Diet has been a primary link between humans and their environment
and substantial evidence supports the concept that multiple dietary factors affect BP85
Well-established dietary modifications that lower BP are reduced salt intake increased
potassium intake increased protein particularly plant protein high vegetable and
polyunsaturated fats85 High sodium intake on the other hand is said to be associated with
elevated blood pressure86 A series of 3 large controlled feeding studies tested the effects
of dietary patterns on BP86-89 Of the 3 diets studied the dietary approach to stop
hypertension (DASH) emphasized fruits vegetables low-fat dairy products whole
25
grains poultry fish nuts potassium magnesium calcium and fibre as the most effective
diet89 Among all participants the DASH diet significantly lowered mean systolic BP by
55 mm Hg and mean diastolic BP by 30 mm Hg each net of changes in the control diet
DEFINITION AND CLASSIFICATION OF ADOLESCENCE
Adolescence is the transitional stage between childhood and adulthood during which many
life patterns are learnt and established90 According to World Health Organization (WHO)
adolescents are individuals between the age range of 10-19 years17 The most significant
feature of adolescence is puberty characterized by an exceptionally rapid rate of biological
growth and development including physical and sexual maturation9091 The pubertal changes
have been described by Tanner and Marshal92 and are grouped into five stages This utilizes
definite criteria for growth and development of secondary sexual characteristics like pubic
hair and breast in females and pubic hair and genitalia in males9092 The timing of these
events and the rate of growth vary due to genetic and environmental factors in different
populations92 Adolescence is divided into early middle and late periods17
Early adolescence (10-13 years) ndash This is a period of rapid growth and development of
secondary sexual characteristics and varies according to sex It corresponds to Tanner stages
1 and 290 The main features of this stage are breast bud development and menarche in girls
while testicular enlargement and seminal emission occurs in boys93
Middle adolescence (14-16 years) ndash In this stage rapid growth decreases and there is more
cognitive development as the adolescents move from concrete thinking to formal operation
and develop greater competence at abstract thinking91 This corresponds to Tanner stages 3
and 4
Late adolescence (17-19 years) ndash Here slowing of physical changes continue which permits
the emergence of a more stable body image Cognition tends to be less self-centered with
26
demonstration of care for others with increasing thought about concepts such as justice
patriotism and history It corresponds to Tanner stage 59092
ADOLESCENCE AND BLOOD PRESSURE
Adolescence is characteristically associated with increasing blood pressure because of the
physical growth and hormonal changes associated with puberty5794 After the age of one year
normal BP increases more during puberty than probably at any other time in an individualrsquos
lifetime95 Wanzhu Eckert and Saha et al57 examined data from a cohort of 182 normotensive
children in Indiana who had blood pressure measurements taken semi-annually for up to 12
yr The authors found that the rate of change in BP and weight peaked at the age of maximum
pubertal growth spurt (PGS) This BP spurt roughly coincides with growth spurt during
puberty94 Surveys of BP patterns from childhood through adolescence shows systolic and
diastolic pressures increase with age and in adolescents the increase in males is more marked
than in females especially the systolic pressure5458229495
CLASSIFICATION OF BLOOD PRESSURE IN ADOLESCENTS
The National High Blood Pressure Education Program Working Group (NHBPEPWG) of the
United States established guidelines for the definition of normal and elevated blood pressures
in children in 19876 These guidelines were revised in 20048 The definition of childhood
hypertension in the guidelines are based upon the normative distribution of blood pressure
(BP) in healthy children rather than clinical outcome data as in adults The guidelines
classified BP as normal prehypertensive or hypertensive Hypertension is graded into stage
one and two8
Normal BP - Blood pressure lt90th percentile for age sex and height Children and
adolescents with normal BP should be followed annually from the age of 3 years5 They
27
should be encouraged to maintain a healthy life style such as good dietary intake physical
activities and adequate rest8
Pre-hypertension - Blood pressure between the 90th and lt 95th or if BP exceeds
12080mmHg (even if lt90th percentile) but lt95th It was previously called high normal
BP This new description was introduced to help identify children at risk for the
development of persistent hypertension for whom targeted prevention programmes would
be most beneficial96 While recommendations for the diagnosis of hypertension in
children require that BP remains elevated on three separate occasions repeated
measurements are not necessary to classify an adolescent as pre-hypertensive11 The
prevalence of childhoodadolescence pre-hypertension in US is reported to be between
12-1796-98 In Nigeria Ejeke Ugwu and Ezeanyika99 in a study of the prevalence of
point prehypertension and hypertension in 843 adolescents in Lokoja reported a
prevalence of point prehypertension of 222 and 250 in semi urban and urban
communities respectively Ujunwa Ikefuna and Nwokocha et al100 reported 175
prehypertension prevalence among adolescents in Enugu Among adults with pre-
hypertension it is reported that as much as 10 per year develop hypertension101 There
is little information on the time course for children and adolescents with prehypertension
developing hypertension A value of between 11-7 per year has been reported in US
adolescents98 There is no known study on rate of progression of prehypertension to
hypertension in Nigerian adolescents The NHBPEP recommended that children with
pre-hypertension should have their BP checked after every six (6) months to monitor for
progression to hypertension They should be encouraged to engage in physical activity
healthy dietary behaviours and weight management if overweight Pharmacologic therapy
is not indicated except if there is strong evidence of renal disease heart failure left
ventricular hypertrophy or diabetes mellitus8
28
Hypertension Hypertension is BP persistently equal to or above the 95th percentile for
age sex and height measured on three or more separate occasions If the blood pressure
measurement obtained is gt 95th percentile the degree of hypertension should be staged
Stage 1 hypertension- BP value between the 95th and the 99th percentile plus 5mmHg It
is recommended that BP should be rechecked in 1ndash2 wks or sooner if the patient is
symptomatic If persistently elevated on 2 additional occasions it should be evaluated or
referred to source of care for pharmacologic treatment within 1 month 8
Stage 2 hypertension- BP value gt99th percentile plus 5mmHg This stage calls for more
prompt evaluation and commencement of pharmacologic therapy102 It is recommended
that the individual be evaluated or referred to source of care within 1wk or immediately if
the patient is symptomatic8
Aetiology of hypertension
Hypertension is classified as primary (essential) when there is no identifiable cause
or secondary if due to an underlying disease31 Factors such as heredity diet stress drugs and
obesity play a role in the development of essential hypertension103104 Causes of secondary
hypertension include umbilical artery catheterization renal diseases coarctation of the aorta
and endocrine disorders105106 Aderele and Sereki6 in their study of hypertension in children
reported hypertension secondary to renal pathology as the commonest cause of elevated BP
in children This study was mainly in preadolescent population in which secondary
hypertension is a common finding On the other hand Antia-Obong and Antia-Obong107
reported no apparent cause in greater than 90 of the studied subjects with elevated BP and
also reported proteinuria of 1 in the same population without any associated elevated blood
pressure The study did not however evaluate the etiology of the proteinuria A study65 of BP
in teenagers in Kano found family history of hypertension a risk factor in the study
population Another study in Enugu100 examined modifiable risk factors associated with
29
hypertension in 2694 adolescents and found only 1 and 06 of the hypertensive subjects
to be overweight and obese respectively The authors also found that smoking and alcohol
consumption were not significant risk for hypertension This may however be due to the
shorter period of consumption of these products by the students as a cumulative effect from
long term consumption is known to be associated with adverse health outcomes
Prevalence of hypertension in adolescents
The prevalence of hypertension in adolescents varies widely due to arbitrary and imprecise
definition by different researchers It was in view of this that the National High Blood
Pressure Education Program Working Group (NHBPEPWG) of the United States established
guidelines for the definition of normal and elevated blood pressures in children and
adolescents for uniformity68 In the USA the prevalence is about 20 in normal weight and
50 in their obese counterparts108 A prevalence rate of 77109 10554 and 223110 has
been reported in Spain Lebanon and South Africa respectively In Kano Nigeria a study65
on the prevalence of hypertension among 1000 teenagers found a prevalence of 72 Similar
study in Enugu100 on the prevalence of hypertension among 2694 secondary school
adolescents reported a hypertension prevalence of 54 It is of interest to note that different
prevalence was reported because of the different methodology used by the authors While the
study in Kano65 applied the adult blood pressure criterion of BP greater than 14090mmHg as
hypertension the study in Enugu100 used blood pressure greater than 95th percentile for age
and sex Also the study in Kano65 took a single set of measurement while the study100 in
Enugu measured blood pressure of the subject three times at weekly intervals Bugaje
Yakubu and Ogala21 on the other hand defined hypertension as blood pressure greater than
two standard deviations from the mean and also took six readings over thirty minutes and got
a prevalence of hypertension of 34 A prevalence rate of 48107 and 9522 in Southern
and Western region of the Nigeria respectively was also reported It is obvious that because
30
of the various defining criteria for hypertension in adolescents the prevalence of adolescent
hypertension remains imprecise
Clinical presentation- Hypertension is usually asymptomatic unless it has been
sustained or is rising rapidly109 Adolescents with essential hypertension are usually
detected during routine evaluation96 Non-specific symptoms such as lethargy headache
dizziness drowsiness visual disturbance and confusion may be present109 These could
also be signs of complications111 Secondary hypertension may show obvious features of
the underlying disease such as growth failure heat intolerance abdominal stria tremors
body swelling and haematuria8102 Croix and Feig112 studied the spectrum of symptoms in
409 children aged 7-18 years newly diagnosed hypertensive in Texas USA and reported
15 common symptoms than in the controls The symptoms were said to resolve after
commencement of antihypertensive medications The authors concluded that hypertensive
children had a variety of non-specific symptoms The three most common symptoms
reported were headache daytime tiredness and difficulty initiating sleep The study
however did not specify if other possible causes of these symptoms were excluded
Complications of hypertension - Hypertension is usually asymptomatic in adolescents
which if left unidentified overtime can cause serious complications109 Organs commonly
affected in the complication of hypertension are the heart kidneys brain and the eyes
leading to lowered life expectancy and premature death13 Left ventricular hypertrophy
(LVH) is the most prominent clinical evidence of end organ damage10 Studies have
shown that LVH can be seen in as many as 41 of patients even in adolescents with
asymptomatic hypertension10103 Adolescents with severe cases of hypertension are also
at increased risk of developing hypertensive encephalopathy seizures cerebrovascular
accidents and congestive heart failure103109 However data documenting such
complications in children and adolescents are generally lacking In a study of
31
hypertension among teenagers in Kano the researchers65 could not find any
complications in all the 1000 teenagers studied
Investigations and treatment- Basic investigations are all that may be required in
adolescents who are obese and with a family history of hypertension stage 1 disease and
normal findings on physical examination113 This is because primary hypertension is
commoner in adolescents Adolescents that are symptomatic or with stage 2 hypertension or
have features of secondary hypertension should be evaluated in more detail
Treatment of hypertension includes non-pharmacological and pharmacological
methods Non-pharmacologic management involves life style modification such as weight
reduction increased physical activities and dietary adjustment114 In a study to evaluate the
effect of diet and salt on treatment and prevention of hypertension Sacks Svetkey and
Vollmer et al86 reported the beneficial effect of both reduced salt intake and appropriate
dietary adjustment in the control of hypertension Similar benefits were reported in other
studies8788 Although both studies had fairly good sample size (n=412) the studies did not
specify if participants were on other substances or activities other than antihypertensive that
might have affected their BP The studies were also in adults and whether it has the same
effects in children and adolescents has not been evaluation However there is no doubt that
the outcome will be similar in adolescents as dietary modifications have been advocated as
non-pharmacologic management in them Non pharmacologic treatment is usually the initial
treatment in essential hypertension and as adjuvant to drug therapy in those with secondary or
complicated hypertension101114 Pharmacologic (drug) treatment includes diuretics beta-
blockers calcium channel blockers angiotensin converting enzyme inhibitors (ACEIs) and
angiotensin receptor blockers (ARB) among others106114 They are used in those with
symptomatic disease and in acute or chronic complications106
32
Prevention of hypertension may be viewed as part of the prevention of cardiovascular
disease102 In adolescents approaches to prevention include reduction in obesity
discouraging cigarette smoking and alcohol intake113 reduction in sodium intake and increase
in physical activity through community and school-based programmes103104 Growth
monitoring BP check during preventive care visit physical activity and urine screening for
proteinuria and haematuria can be used starting from early childhood
33
AIM AND OBJECTIVES
GENERAL AIM
To determine the blood pressure pattern of apparently healthy secondary school adolescents
in Jalingo Taraba State
SPECIFIC OBJECTIVES
To determine
1 Blood pressure pattern in relation to age and sex among adolescents aged 10-19
years
2 The relationship if any between blood pressure and the anthropometric parameters of
weight height BMI and waist circumference
3 The association between blood pressure and parental social-economic status
4 The point prevalence of prehypertension and hypertension in adolescents
34
MATERIALS AND METHODS
Study area
A cross-sectional survey of the blood pressure pattern of apparently healthy secondary
school adolescents aged 10-19 years was conducted in Jalingo over a six month period
from January to June 2014 Jalingo is the capital of Taraba State and lies within the
savannah belt of North Eastern Nigeria It lies between latitude 80 54rsquo north and longitude
110 21rsquo east and at an altitude of 360 meters above sea level115 Jalingo had a population of
118198 people18 The primary inhabitants are the Konas Mumuyes and Fulanis who are
mostly farmers Other indigenous ethnic groups include the Jukun Kuteb WurkumTiv
and host of other tribes The Ibos Hausas Yorubas among others are the non-indigenous
ethnic groups and are mostly civil servants and businessmen Jalingo has a tertiary health
centre the Federal Medical Centre Jalingo and the state specialist hospital It also has 15
private clinicshospital and many primary health care centres There are also tertiary
education institutions including Taraba State University As at 2013 there were 56
secondary schools in Jalingo 24 public and 32 private all of which were mixed schools
except one which is a girlsrsquo only school
Study design
The study was a cross sectional descriptive study of 1350 apparently healthy secondary
school adolescents in Jalingo
Ethical approval
Ethical approval for this study was obtained from the Scientific and Health Ethics Research
Committee of Ahmadu Bello University Teaching Hospital Zaria (Appendix 4) The Taraba
State Ministry of Education also gave the approval and permission to conduct the study in the
35
selected schools Consent was given by the studentsrsquo parents or guardian (Appendix 2) All
students whose parents gave consent voluntarily participated in the study
Sample size determination
The minimum sample size was calculated using the formula116
N=Z2 (pq) E2
Where N = minimum sample size
p = Prevalence of hypertension in adolescents A prevalence of 3421 was used
q = 1- p
E = margin of error tolerated =1
Z = 196 at 95 confidence level
N = 1962 x 0034 x (1-0034) 0012 = 1262
Therefore the minimum sample size was one thousand two hundred and sixty two
Allowance for non-responders of 5 63 extra subjects were added to the calculated
minimum sample size bringing the total to 1325 students To enhance representativeness of
the sample and to compensate for missing information and poorly filled proforma while
maintaining the sample size a total of 1350 was decided upon
Inclusion criteria
1 Students (ages 10-19 years) in the selected secondary schools
2 Students whose parents gave consent to participate in the study
3 Students who gave assent to participate in the study
Exclusion criteria
1 Students who had obvious skeletal deformities of the spine and legs which can affect
the height and ultimately the BMI
36
2 Students with known chronic disease (or history of such disease) like anaemia
chronic renal disease and cardiac disease because they are not apparently healthy and
these conditions could affect their blood pressure
3 Students with present or past history of chronic drug ingestion that can affect blood
pressure such as steriods and contraceptives
4 Students with high blood pressure already on antihypertensive
Pilot study
A pilot study was carried out in one of the schools a week before the commencement of
the study The school was selected by random sampling method using balloting and did
not participate in the main study The pilot study was carried out with the aim of
assessing the competence of the research assistants in the various measurements
following their training to ensure reliability It was also used to test the questionnaire
before its use during the main study and to provide information on the number of students
that can be measured in a day Consequently twenty students had their blood pressure
and anthropometry measured independently by the researcher and the research assistants
and data were compared using Students t-test There were no statistically significant
differences between the measurements The result of the pilot study is highlighted in
Table I It was also found that some parts of the questionnaire were not well understood
by most students and were adjusted appropriately in the main study (Appendix 1) The 20
students had their measurements done over a period of 3-4 hours (between 8am - 12noon)
by the researcher and the research assistants
Table I Result of pilot study
Variables Researcher Research t p
37
assistants
Mean(plusmnSD) SBP
mmHg
106(11) 104(12) 0550 0586
Mean(plusmnSD) DBP
mmHg
617(83) 63(10) 0450 0657
Mean(plusmnSD) Weight
kg
544(82) 527(122) 0520 0608
Mean(plusmnSD) Height m 16(01) 16(01) 0000 1000
Mean(plusmnSD) BMI
kgm2
198(36) 202(33) 0370 0716
Mean(plusmnSD) WC cm 692(72) 682(133) 0300 0769
Sampling method
Students were selected by multistage random sampling technique The list of secondary
schools obtained from the Taraba State Post Primary Schools Board served as the sampling
frame for schools There were 56 secondary schools 24 of which were public and 32 were
private schools a ratio of 113 Ten (10) schools were randomly selected by balloting four
(4) from public schools six (6) from private based on the number and approximately similar
ratio of private to public schools of 115 (46) Ten schools were selected to ensure wider
coverage and even distribution of students so that it could be truly representative of the
community All the ten schools had an overall total of eight thousand one hundred and seven
(8107) students The public schools had a total of five thousand nine hundred and forty
(5940) with nine hundred and eighty nine (989) students participating The private schools
had a total of two thousand one hundred and sixty-seven (2167) students with three hundred
and sixty one (361) participating These number (989 and 361) was calculated based on the
38
relative population of each school and proportionate to number of students in each school
Thereafter the number of students to participate per school was calculated proportionately to
the number of students in each school based on the number given by the school authority
Then the number in each class was also calculated proportionately from JSS1 to SS3 to
ensure fair and equal chance of participation for all age groups The calculation was done
thus n= a b x c
Where n= number of students per selected school
a= total numberpopulation of students in the school
b= total numberpopulation of students in all 10 selected schools (8107)
c= calculated total sample size (1350)
Students in each class from junior secondary school (JSS) 1-3 and senior secondary school
(SS) 1-3 were then randomly selected by balloting The number of selected schools total
number of students in a school and the number of students selected per school is outlined in
Table II
Table II Selected schools and number of students in each of the ten schools in Jalingo
Selected schools Total no of No of students
39
student in the
school (a)
n=8107
selected (n=abxc)
n=1350
Public schools
Govt Science Secondary School 2800 466
Govt Day Secondary School SGari 1200 200
Salisu Dogo Secondary School 1100 183
Govt Secondary School Magami 840 140
Total 5940 989
Private schools
Winners Comprehensive Secondary School 650 108
Hawai Secondary School 562 94
Centre for Quranic Science and Islamic Education 543 90
Good Success Secondary School 155 26
Jetters Academy 140 23
Yagai Academy 117 20
Total 2167 361
The study
The first contact with the students was a familiarization exercise to each of the schools during
which the teachers and students were given a talk by the researcher on blood pressure and the
40
importance of periodic blood pressure measurement They were given the opportunity to ask
questions which were responded to Both the students and their teachers actively participated
in the lectures
On the second day students were selected as described above and those selected
underwent general physical examination in the presence of a chaperon to identify those
who did not fulfilled the inclusion criteria Each selected student was given a proforma
(Appendix 1) in which information on their biodata and medical history were recorded
Other information obtained was parentrsquos medical history and their socioeconomic status
using the format described by Olusanya Okpere and Ezimokhai117 (Appendix 3) The
study was carried out in a relatively quiet and empty classroom to ensure privacy for both
male and female students The procedure for blood pressure measurement was
demonstrated on one of the research assistants and sometimes on one of the teachers by
the researcher to assure the students and allay their anxiety BP and anthropometric values
obtained were recorded in the study proforma An average of 15-20 students per day were
attended to over a period of 3-4 hours (between 8am - 12noon daily) by the researcher
one of the research assistants who is a medical officer a male nurse and a lady Youth
Corper (NYSC)
Blood pressure measurement
This was measured by the researcher and the research assistant (the medical officer) The
standard auscultation method was employed using a mercury sphygmomanometer (Acosson)
and a standard Littman stethoscope according to the guideline of the fourth report on the
diagnosis evaluation and treatment of hypertension in children and adolescents8 Each
students was rest-seated for 5 minutes before BP measurement With the student seated the
right arm rested on a table at the level of the heart an appropriate cuff size which covered
41
two-third (23rd) of the length of the arm was applied round the arm about 2cm above the
antecubital fossa Two cuff sizes were used for this study with dimensions of 10 x 24cm and
13 x 30cm the smaller cuff for the smaller adolescents and vice versa The bladder cuff was
inflated rapidly to 20-30mmHg above the point where the brachial artery was no longer
palpable The bell of the stethoscope was then placed over the brachial artery and the cuff
was deflated slowly at 2-5mmHgsecond while listening to the Korotkoff sounds Phases one
and five of the Korotkoff sounds were recorded as the systolic and diastolic BP
respectively119 Three recordings were taken at intervals of 3-5 minutes and the average was
the final BP in mmHg BP was interpreted based on the standard set by the fourth report on
the diagnosis evaluation and treatment of hypertension in children and adolescents of the
United States8 thus-
Normal BP ndash BP value between the 5th and lt 90th percentile for age sex and height
Prehypertension - BP value between the 90th and the lt95th percentile for age sex and height
or BP of 12080mmHg but less than the 95th percentile
Hypertension ndash BP value ge95th percentile for age sex and height
Students found to have prehypertension were educated and counseled on life style
modifications and the need to have their blood pressure checked in six monthsrsquo time and
annually subsequently Those with hypertension were educated on the implications of the
findings and were referred to the Federal Medical Center Jalingo for evaluation management
and follow-up
Height measurement
Height was measured in centimeters using a locally constructed stadiometer by the research
assistants Each student was measured barefooted standing with the heel back and occiput
42
against the stadiometre The head was held straight looking forward with the lower border of
the eye socket at a horizontal plane with that of the external auditory meatus The movable
part of the stadiometre was adjusted to rest on the vertex and the corresponding value read to
the nearest 01cm
Weight measurement
The weight was measured in kilograms by the researcher and the research assistants using a
bathroom scale (HANSON) Students were weighed in their approved school uniform
without caps head ties or cardigan and with their shoes removed The scale was checked
daily for accuracy using standard calibrated weight before and midway through each session
The weight of the student was measured to the nearest 01 kg
Body mass index (BMI)
This was calculated from the measured weight and height of the subject using the
formula118
BMI= Weight (kg) Height (m2)
Waist circumference measurement
WC was measured in centimeters using a measuring tape by the research assistants The
male assistant measured for boys and the lady Youth Corper measured for girls
Measurement was taken with the student standing completely relax and breathing
normally Clothing was pulled up or down and an inelastic measuring tape was placed
around the waist mid-way between the iliac crest and the lowest rib margin The ends of
the tape were pulled together lightly towards each other and the value read to the nearest
01cm117120
43
Data analysis
Data obtained were analyzed using Epi-Info statistical software package version 7 The
results obtained were presented in figures tables graphs and charts as appropriate Individual
mean BP levels were used as dependent variables and other measured variables as
independent variables The means and standard deviations were used to summarize
quantitative variables such as BP weight height waist circumference and BMI The chi-
squared test was used to test the significance of associations between categorical variables
Studentrsquos t-test was used to compare means of any two normally distributed continuous
variables Pearsonrsquos correlation coefficient and regression analysis were used to examine the
strength of association between BP and the anthropometries Probability level of statistical
significance value was set at lt005
RESULTS
General characteristics
A total of 1350 students were enrolled between January and June 2014 to determine their
blood pressure pattern 628 (465) were males and 722 (535) were females with
malefemale ratio of 111 Students enrolled in the study were drawn from both public and
44
private schools The number of students from public schools was 989 (733) while 361
(267) were from private schools as shown in Table II The mean age of the study subjects
was 153plusmn22 years with a range of 10-19 years The age and sex distribution of the students
is illustrated in Table III
Table III Age and sex distribution of 1350 study subjects in Jalingo
Ag
e
Male
n ()
Female
n ()
Total
N()
10 9(14) 13(18) 22 (16)
11 20(32) 31(43) 51(38)
12 36(57) 52(72) 88(65)
13 96(153) 85(118) 181(134)
14 92(146) 115(158) 207(153)
15 92(146) 111(154) 203(151)
16 66(105) 116(161) 182(135)
17 78(125) 91(126) 169(125)
18 79(126) 70(97) 149(110)
19 60(96) 38(53) 98(73)
To
tal
628(100) 722(100) 1350(100)
45
Socio-economic classes (SEC) ndash Most of the students were from the lower social classes
(4 and 5) with population of 650 (415 and 235) students The upper social classes (1 and
2) had the least population with 184 (62 and122) students The middle social class (3) had
516 students The distribution of the study subjects according to individual
socioeconomic class is shown in Figure I
Figure 1 Socioeconomic class distribution of students in Jalingo
Anthropometry
The anthropometric characteristics of the students are displayed in Tables IV V and VI
All the anthropometric parameters showed increasing values with age (Tables V and VI)
There were significant differences in the anthropometric indices of height (p=0000)
weight (p=0010) and body mass index (p=0000) between boys and girls but not
statistically significant for waist circumference (p=0145) as shown in Table IV
Weight ndash The mean weight of the students was 486plusmn109kg with a range of 23-100kg
(Table IV) Girls were heavier than boys up to middle adolescence after which males
46
were heavier than the females (Table V and VI) and this was statistically significant (t= -
256 p=0010)
Table IV Overall mean anthropometric measurements of the study subjects
Anthropometr
y
Male Female Total
n=628 n=722 N=1350 t p
Wt (kg)
Mean(plusmnSD) 4773(115
)
4926(103
)
4855(plusmn109
)
-
25
6
0007
Range 236-848 227-100 23-100
Ht (m)
Mean(plusmnSD) 159(012) 157(008) 158(plusmn010) 35
5
0000
Range 122-185 126-179 122-185
WC (cm)
Mean(plusmnSD) 6524(91) 6595(86) 6562(plusmn89) -
14
6
0145
Range 225-905 215-100 22-100
47
BMI (kgm2)
Mean(plusmnSD) 1825(27) 1947(33) 1891(plusmn31) -
74
1
0000
Range 117-325 114-42 114-42
Statistically significant p values at 005 level of significance Wt=Weight Ht=Height WC=Waist
Circumference BMI=Body Mass Index SD=Standard Deviation
Height- The mean height of the study population was 158plusmn09m and ranged from 122-
185m (Table IV) Girls were taller than boys at early and middle adolescence but these
reversed from 16 years in favour of the boys (Table V and VI) This differences was
statistically significant (t=448 p=0000)
Waist circumference (WC) - The overall mean waist circumference was 6562plusmn89cm and
a range of 225-100cm Girls had higher WC until late adolescence (18 years) when it
reversed but this was not statistically significant (t=-146 p=0145) This is displayed in
Tables IV V and VI
Body Mass Index (BMI) - Overall mean BMI was 189plusmn31 with a range of 114-42
There was a statistically significant difference between girls and boys (t=-741 p=0000)
Tables IV V and VI illustrate this findings
Table V Mean anthropometric measurements of 628 boys
Age No of
studen
ts
Wt(plusmnSD)
Kg
Ht(plusmnSD)
m
WC(plusmnSD)
cm
BMI(plusmnSD)
Kgm2)
48
10 9 349(50) 143(001
)
613(06) 169(01)
11 20 354(25) 143(002
)
617(13) 170(07)
12 36 363(51) 146(002
)
616(14) 167(06)
13 96 379(51) 150(003
)
602(40) 165(08)
14 92 412(50) 154(003
)
623(32) 169(08)
15 92 471(60) 160(003
)
634(39) 178(08)
16 66 525(52) 164(002
)
672(24) 192(09)
17 78 555(51) 167(002
)
680(31) 197(08)
18 79 576(61) 169(002
)
707(18) 200(08)
19 60 590(57) 170(002
)
716(16) 203(07)
Total 628 477(115 16(01) 652(91) 183(27)
49
)
Wt=Weight Ht=Height WC=Waist Circumference BMI=Body Mass Index SD=Standard Deviation
Table VI Mean anthropometric measurements of 722 girls
Age No of
students
Wt(plusmnSD)
Kg
Ht(plusmnSD)
m
WC(plusmnSD)
cm
BMI(plusmnSD)
Kgm2
10 13 313(34) 139(001) 582(05) 156(02)
11 31 361(53) 144(002) 611(12) 170(05)
12 52 403(64) 149(002) 625(21) 178(09)
13 85 458(66) 154(002) 657(22) 188(12)
14 115 478(74) 157(003) 627(48) 187(10)
15 111 508(65) 159(002) 666(34) 199(13)
16 116 521(60) 159(002) 678(28) 201(11)
17 91 541(62) 161(002) 681(28) 203(11)
18 70 556(63) 161(002) 696(21) 211(11)
19 38 540(48) 158(002) 688(14) 208(06)
Total 722 493(103) 16(010) 651(23) 190(09)
Wt=Weight Ht=Height WC=Waist circumference BMI=Body Mass Index SD=Standard Deviation
Blood pressure (BP) measurements
50
Table VII shows mean blood pressure distribution of the study population for all ages
The highest SBP and DBP were 165mmHg and 95mmHg at 18years and 15 years
respectively Table VIII displays mean BP distribution in relation to age and sex The
tables show that both systolic and diastolic blood pressure increased with age This is also
depicted in Figure 2
Table VII Mean and ranges of blood pressure of 1350 subjects
Systolic Blood Pressure
(mmHg)
Diastolic Blood Pressure
(mmHg)
Age
No of
students
Mean(plusmnSD) Range
Mean(plusmnSD) Range
10 22 936(74) 80-107 600(50) 47-70
11 51 992(106) 76-120 629(71) 47-83
12 88 1036(110) 80-140 657(60) 53-82
13 181 1042(108) 80-143 660(74) 48-88
14 207 1070(115) 83-150 675(76) 47-90
15 203 1090(119) 80-150 678(82) 47-95
16 182 1122(124) 80-150 696(80) 50-90
51
17 169 1132(118) 90-153 698(83) 48-93
18 149 1138(121) 90-165 712(88) 50-90
19 98 1131(127) 90-143 726(76) 57-90
Total 1350 1089(125) 76-165 683(82) 47-95
Table VIII Mean blood pressure in relation to age and sex
Mean(plusmnSD) Systolic blood pressure
(mmHg)
Mean(plusmnSD) Diastolic blood
pressure (mmHg)
A
ge
Male
n=628
Female
n=722
t p Male
n=62
8
Fema
le
n=72
2
t p
52
10 954(3
9)
923(6
0)
1
02
03
20
619(
32)
586(
46)
1
36
0
01
91
11 985(5
5)
997(9
2)
0
42
0
06
80
648(
39)
617(
57)
1
56
0
01
26
12 999(8
9)
1062(
117)
2
84
0
00
06
653(
29)
660(
52)
-
0
52
0
06
07
13 1012(
73)
1075(
73)
4
03
4
00
00
649(
43)
672(
59)
-
0
03
0
00
44
14 1036(
78)
1098(
78)
3
93
0
00
01
653(
44)
693(
58)
3
90
0
00
01
15 1071(
80)
1105(
87)
2
05
0
00
42
665(
58)
689(
56)
-
2
10
0
00
37
16 1135(
82)
1114(
91)
1
03
0
03
10
697(
51)
695(
61)
0
15
0
08
81
53
17 1152(
87)
1115(
77)
2
04
00
43
698(
59)
698(
58)
0
02
0
09
81
18 1141(
96)
1135(
74)
0
27
0
07
91
704(
62)
721(
63)
1
61
0
02
49
19 1146(
97)
1108(
80)
1
41
0
01
64
733(
63)
714(
43)
1
21
0
02
28
To
tal
1081(
133)
1095(
117)
-
2
05
4
00
40
678(
81)
687(
82)
-
2
07
7
00
38
Statistically significant p values at 005 levels of significance
54
Figure 2 Blood pressure distribution in relation to age and sex
SBP =Systolic blood pressure DBP=Diastolic blood pressure
Blood pressure and stages of adolescence
Table IX displays mean blood pressure according to stages of adolescence Girls had a
higher mean SBP than boys from early adolescence (t=3754 p=0000) to middle
adolescence (t=-3025 p=0003) and this was statistically significant This dominance was
also demonstrated in the DBP and was statistically significant in middle adolescence (t=-
3517 plt0000) Adolescents from private schools had higher mean SBP (t=-222
plt0027) and mean DBP (t=-461 p=0000) than those from public schools and these
differences were statistically significant
Table IX Mean blood pressure according to sex and stages of adolescence
Mean BP
(mmHg)
Age (years)
Male SBP
Female SBP
Male DBP
Female DBP
55
Stages
of
adolesc
ents
(years)
Mean(plusmnSD) systolic blood pressure
(mmHg)
Mean(plusmnSD) diastolic blood pressure
(mmHg)
Male Female t p Male Fema
le
t p
Early
(10-13)
1000(9
6)
1040(1
18)
37
54
00
00
648(
56)
653(
82)
05
99
05
50
Middle
(14-16)
1075(1
29)
1105(1
13)
-
30
25
00
03
670(
81)
694(
77)
-
35
17
00
00
Late
(17-19)
1140(1
28)
1121(1
11)
21
45
00
33
717(
85)
710(
83)
00
70
09
45
1082(1
33)
1092(1
17)
-
20
54
00
40
678(
81)
687(
82)
-
20
77
00
38
Statistically significant p values at 005 level of significance SD=Standard Deviation
Table X shows blood pressure pattern according to stages of adolescence
Prehypertension and hypertension were more prevalent in late adolescence than early and
middle adolescence (χ2=49054 p=0000) and (χ2=10305 p=0006) both of which were
statistically significant
Table X The pattern of normal BP Prehypertension and hypertension according to stages
of adolescence
56
Blood
pressure
pattern
Stages of adolescence
Early
n()
Middle
n()
Late
n()
Total
N()
χ2 p
Normal 290(84
8)
428(72
3)
275(66
1)
993(73
5)
429
79
000
0
prehypertens
ion
43(12
6)
135(22
8)
120(28
8)
298(22
1)
490
54
000
0
Hypertensio
n
9(26) 29(49) 21(51) 59(44) 103
05
000
6
342(10
0)
592(10
0)
416(10
0)
1350(1
00)
350
93
000
0
Statistically significant p value at 005 level of significance
Relationship between blood pressure and the measured anthropometry
There was a positive correlation between SBP and DBP with age and the anthropometric
variables of weight height waist circumference and BMI (Table XI) SBP showed a
stronger correlation with the anthropometries than the DBP and was stronger for weight
(r=051) and height (r=044) The waist circumference though statistically significant
showed the weakest correlation
Table XI Correlation between blood pressure age (yrs) and anthropometry
Parameters
Systolic Blood Pressure Diastolic Blood Pressure
Correlation
coefficient
p Correlation
coefficient
p
57
Age (yrs) 035 lt0000 030 lt0000
Height (m) 044 lt0000 034 lt0000
Weight (Kg) 051 lt0000 038 lt0000
WC (cm) 040 lt0000 029 lt0000
BMI
(Kgm2)
031 lt0000 023 lt0000
Statistically significant p values at 005 level of significance Wt=Weight Ht=Height WC=Waist
circumference BMI=Body Mass Index
Blood pressure distribution and socio-economic classes
Table XII shows mean blood pressure according to socio-economic class of the subjects
Lower social classes had higher mean SBP (t=1650 p=2850) and DBP (t=0193
p=00058) but these were not statistically significant
Table XII Mean Blood pressure in relation to socioeconomic classes
Blood
pressur
e
Socioeconomic classes
Upper (1 amp
2) n=184
Middle (3)
n=516
Lower (4 amp
5)
n=650
f(anova
)
p
Mean
(SD)
10857(126
)
10866(128
)
11040(109
)
1650 285
0
58
SBP
Mean
(DBP)
6820(83) 6791(83) 6957(76) 0193 005
8
SEC= Socioeconomic class SBP=Systolic Blood Pressure DBP=Diastolic Blood Pressure SD=Standard
Deviation
Table XIII shows blood pressure pattern in relation to socioeconomic classes of the
subjects The percentage of students with prehypertension was higher in the upper social
class ((χ2=3067 p=0216) while the percentage of hypertension were higher in the lower
socioeconomic classes (χ2=1037 p=0568) but these differences were not statistically
significant
Table XIII Blood pressure pattern in relation to socioeconomic status
Blood
pressure
pattern
Socioeconomic classes
Upper
(1 amp 2)
n()
Middle
(3)
n()
Lower
(4 amp 5)
n()
Total
N()
χ2 p
Normal 127(69
)
383(74
2)
483(74
3)
993(73
6)
417
6
012
4
Prehypertens
ion
52(28
3)
108(20
9)
138(21
2)
298(22
1)
306
7
021
6
Hypertension 5(27) 25(48) 29(45) 59(44) 103 056
59
7 8
184(10
0)
516(10
0)
650(10
0)
1350(10
0)
573
0
022
0
Prevalence of Hypertension and Prehypertension
Table XIV shows the prevalence of hypertension in the study population The total
number of students with hypertension was 59 giving an overall prevalence of 44
Thirty four students (25) had systolic hypertension sixteen (12) had diastolic
hypertension and nine students (07) had both systolic and diastolic hypertension
Systolic hypertension was more prevalent in the females and was more at the age of 16
years while diastolic hypertension was higher in males and this also occurred at 16 years
Among those with hypertension 27 and 16 subjects had stage 1 and 2 systolic
hypertension respectively With regard to diastolic hypertension 24 and 1 subjects had
stage 1 and 2 hypertension respectively The gender difference in the prevalence of
hypertension is not statistically significant (χ2=0831 p=0362)
The number of students with pre-hypertension was 298 giving an overall prevalence of
221 Of this 131 were males and 167 are females This is illustrated in Table XIV
Prehypertension is more prevalent in females than males and this was statistically
significant (χ2=4349 p=0037)
60
Table XIV Overall Blood pressure pattern and prevalence of hypertension and
prehypertension of 1350 students in Jalingo
Blood pressure
pattern
Males
n=()
Females
n=()
Total
N()
χ2 p
Normal 471(750) 522(723) 993(735) 2619 0106
Prehypertension 131(209) 167(231) 298(221) 4349 0037
Hypertension 26(41) 33(46) 59(44) 0831 0362
628(100) 722(100) 1350(100) 1260 0533
statistically significant p value at 005 level of significance
61
DISCUSSION
The findings of this study showed that the BP of secondary school adolescents in Jalingo
was similar in terms of mean values range and trend of progression with age to that of
other adolescents from Ibadan63 and Kogi60 (Nigeria) Ashanti (Ghana)59 and Lebanon54
The mean value was however lower than the mean BP of adolescents from Zaria
(Nigeria)21 Belgrade ( Serbia)78 and Fortaleza-Cearaacute (Brazil)83 who had higher mean BP
in both sexes and at all ages The lower mean BP in this study compared to that of
adolescents from Zaria21 Belgrade78 and Brazil83 could be due to lower mean
anthropometry of weight height and BMI in adolescents from Jalingo resulting in lower
mean BP The sample sizes of these studies7883 were also different and could have
affected the mean BP of the study population For instance the sample size in the
Brazilian study83 is 151 compared to the study in Lebanon54 with 5710 subjects The use
of the fifth Korotkoff sounds as DBP in this study21 could also have accounted for the
lower mean BP in contrast to a similar study in Zaria21 where the fourth Korotkoff sound
was used as the DBP
A progressive increase in blood pressure with age was found in this study This
was similar to most findings by researchers in Nigeria 215358-606566107 and
worldwide54555961 The peak age of rise in BP in this study was in middle adolescence
between 15-16 years in boys but much earlier in girls for both systolic and diastolic BP
This was similar to the study by Akinkugbe Akinwolere and Kayode56 in Ibadan and
Ejeke Ugwu and Ezeanyika et al60 in Lokoja This age group is usually the period of
onset of puberty The chronologic age is not the main factor responsible for BP increase
62
with age but rather the progressive increase in size of the individual Increase in body
size with growth and maturity of organs associated with the physical and hormonal
changes during puberty potentially lead to increasing BP The simultaneous increase in
weight height and other anthropometric indices alongside BP with age seen in this study
and others is in agreement with that The implication of this increase in blood pressure
with age is that those with prehypertensionhypertension in childhood may continue into
adulthood hence further increasing the high prevalence of hypertension in the adult
population with its attendant morbidity disability and mortality
Overall significant higher mean BP was recorded in girls than boys in this study
This was seen from early to middle adolescence after which it reversed in favour of the
boys Reports on the relationship between BP and sex have been inconsistent Some have
reported higher mean BP in females54-56 others higher in males5883 while yet another
reported no sex differences22 The findings of this study were similar to those of Bugaje
Yakubu and Ogala21 and Ujunwa Ikefuna and Nwokocha100 who reported a consistently
higher mean blood pressure in female adolescents up to 16 years compared to their male
counterparts of similar ages Early female predominance in mean blood pressure was also
reports by Agyemang Redekop and Owusu-Dabo et al59 in Ashanti adolescents in Ghana
and Obika Adedoyin and Olowoyeye22 in Illorin The finding was however in contrast
with the study in Calabar58 where higher mean BP was found in boys than girls at all
ages The reason for the higher mean BP in females than boys could be because of earlier
onset of puberty in girls The differences in blood pressure between boys and girls in this
study could also be accounted for by variation in the anthropometric variables of the
individuals as girls were seen to be heavier and taller up to middle adolescence
This study demonstrated a consistently positive relationship between blood
pressure and the anthropometric variables of weight height body mass index and waist
63
circumference as widely reported in other studies 545558-6165107100 Weight is reported to
correlate positively with blood pressure in several studies53565871 Body mass index
(BMI) also showed a positive relation with BP in this study as reported in other
studies5978-81 This is in-keeping with the findings in Port Hacourt71 Abeokuta83 the
Gambia69 Brazil82 and Belgrade77 children Some of these studies however were made
up of younger and older age groups Even in lean populations BMI is known to correlate
positively with BP Waist circumference was also found in this study to correlate
positively with BP This was similar to reports from other studies79-8183 It was found to
be a better predictor of BP in two Italian study8081 while it was not in another82
Comparing BMI and waist circumference and their effects on BP Arauzo Lopes and
Moriera et al82 in Brazilian children found BMI to be a better predictor of BP than waist
circumference This was similar to the report by Sebanjo and Oshikoya83 in Nigerian
adolescents in Akure Guagnano Ballone and Colagrande et al81 however found waist
circumference to be better than BMI The study81 however involved adults and may not
be applicable in children and adolescents The present study demonstrated BMI and WC
to be significant but found BMI to be a better determinant of BP than waist
circumference BMI and waist circumference measure obesity in an individual Whereas
BMI is a measure of overall obesity WC measures centralabdominal fat accumulation
and thus said to be more predictive of adverse health risk79 Obese individuals may be
prone to such condition as dyslipidaemia insulin resistance and hypertension with
reduction in the quality of life Weight BMI and or waist circumference affects blood
pressure through decreased physical activity increased cardiac output insulin resistance
impaired pulmonary function and other hormonal abnormalities8084 It seems therefore
that BMI is a better predictor of BP in adolescents than waist circumference The reason
64
for this is not obvious but it may be because of the nature of uniform fat distribution in
adolescents associated with growth and hormonal changes at puberty
Blood pressure distribution in relation to the parental socio-economic class in this
study showed that students from low socio-economic classes had higher mean blood
pressure than those from upper socioeconomic classes but this was not statistically
significant A study in Ibadanl56 reported a statistically significant negative relation
between blood pressure and parental socio-economic status It was also similar to the
study58 in Calabar In contrast other studies found the reverse536022 The reasons for the
inverse relationship between BP and socioeconomic includes exposure to chronic
environmental stress with sustained sympathetic nervous system stimulation Others are
poor health seeking behaviours due to low income andor inadequate health knowledge
high low birth weight rate and inadequate healthy diets among others97101 In the same
environment individuals from a high social class are believed to be more educated with
high income61 They have easy access to health education and awareness on hypertension
prevention and control and better accessibility and adherence to medical treatment617374
The former might be responsible for the finding of this study as Jalingo is a semi urban
community Most of its inhabitants are subsistent farmers civil servants and traders with
low income The high number of students in the lower socioeconomic class lays credence
to that
The overall point prevalence of hypertension in this study was 44 while that of
pre-hypertension was 221 This prevalence of hypertension is similar to the prevalence
of 48 by Antia-Obong and Antia-Obong107 but higher than the prevalence rate of 37
reported in Zaria21 and lower than the prevalence of 58 reported in Ibadan56 54 in
Enugu100 and the 72 reported in Kano65 The prevalence of pre-hypertension was lower
than that reported by Ejeke Ugwu and Ezeanyika99 who found a prehypertensive
65
prevalence of 25 among adolescents in Lokoja It is higher than the 173 reported by
Ujunwa Ikefuna and Nwokocha et al100 in Enugu and 12-17 by Redwine and
Daniels96 among US adolescents The differences in the reported prevalence of
hypertension and prehypertension in adolescents could have resulted from the different
criteria applied by the various researchers in defining hypertension For instance whereas
this study used BP greater than 95th percentile as hypertension a study in Kano65 used the
adult hypertensive value of BPgt14090mmHg as hypertension and got a prevalence of
72 The prevalence in that study65 could have been higher if the percentile or the
statistical definition was used as many children with BP 14090mmHg would probably be
at stage 2 hypertension This was demonstrated in the study by Bugaje Yakubu and
Ogala21 who found a prevalence of hypertension in their study to be 06 when the adult
cut off value of gt14090mmHg was used but it increased to 37 when the statistical
definition of BPgt 2 standard deviations was used
The number of times blood pressure is taken could affect the outcome as repeated
measurements over a time interval is known to give lower BP values than if BP is taken
once This study used the average of three blood pressure values taken at one sitting but
Ujunwa Ekefuna and Nwokocha100 took three readings at five minutes interval with two
other readings at a week interval In that study100 the prevalence of prehypertension
dropped from 745 during the first set of readings to 173 after the third week
readings The prevalence of hypertension also dropped from 135 to 54 over the same
period Similar decrease in the prevalence of both prehypertension and hypertension was
reported by Redwine and Daniels96 in US adolescents when blood pressure was taken
over time interval Another factor which might have affected the overall prevalence is the
Korotkoff sound used for diastolic pressure23 The 4th or 5th Korotkoff sounds has been
used by different researchers resulting in different diastolic BP The study21 in Zaria used
66
the 4th Korotkoff sound while most other researchers2265100 used the 5th About 5-
10mmHg difference is said to exist between the 4th and 5th Korotkoff sounds230 In this
study the 5th Korotkoff sound was used thus giving a higher prevalence of hypertension
in the studied population than in those where the 4th sound was used
The implication of the outcome of this study is that 44 of adolescents in Jalingo
are already hypertensive while 221 of them are at risk of developing hypertension as
they are pre-hypertensive Since 856 (255 of 298) of the prehypertensives were in the
middle and late adolescence these individuals are likely to be adults with high blood
pressure Therefore regular screening of this group of individuals who were assumed to
be a healthy population is highly important for early detection of hypertension and
intervention such as life style changes and treatment
67
CONCLUSIONS
The following conclusions can be made from this study
1 The mean and range of blood pressure of adolescents in Jalingo was similar to
those of other adolescents in Nigeria and other parts of the world Blood pressure
increased progressively with age
2 All measured anthropometry of weight height body mass index and waist
circumference correlated positively with BP but weight was the most significant
variable in BP determination
3 Socioeconomic status was not significantly related with blood pressure
4 The point prevalence of hypertension and pre-hypertension was 44 and 221
respectively using a recommended definition
RECOMMENDATIONS
1 In view of the high prevalence of prehypertension in this study it is recommended
that students should have their blood pressure measured at school entry as this will
68
help identify those with abnormal BP for early intervention Thereafter BP check
should be offered at least once a year at the beginning of a new session especially for
those found with abnormal BP at school entry
2 Physical and health education should be revived in all the schools This will lead to
increased physical activity and reduced risk of obesity and its consequences
3 School health programmes should be strengthened in schools where it already exist
and effort made to establish same in schools where it is yet to exist The programme
should include measures to detect early prehypertension and hypertension and other
health related needs of the students
LIMITATIONS
The following limitations were encountered in the course of the study
1 Exclusion and inclusion of students that were based on volunteered information and
physical evaluation This could have led to inclusion andor exclusion of adolescentss
69
with or without background renal diseases which could have affected the result of this
study
2 Home blood pressure measurement especially early morning measurement for those
with high blood pressure to possibly eliminate the effect of stress traffic andor
trekking and other school related stresses which may affect blood pressure during the
day
LINES OF FUTURE RESEARCH
This study was questionnaire based and time bound Consequently students were not
investigated for background diseases co-mordid conditions target organ damage or risk
factors for high blood pressure They were also not followed up In view of this future
research on blood pressure in adolescents should include-
70
1 Investigations such as urinalysis electrolytes urea and creatinine random blood
sugar (RBS) lipid profile and echocardiography as part of blood pressure evaluation
in adolescents
2 A long period of study to allow for follow-up over months or years to identify those
that are truly hypertensive considering the definition of hypertension It will also
reveal the rate of progression from pre-hypertension to hypertension
3 Risk factors evaluation for high blood pressure including genetic predispositions
REFERENCES
1 Blood pressure from Wikipedia the free Error Hyperlink reference not valid
Accessed 24th November 2011
2 Pickering TG Hall JE Appel LJ Falkner BE Graves J Hill MN Jones DW Kurtz T
Sheps SG Roccella EJ Recommendations for blood pressure measurement in humans
and experimental animals Part 1 Blood pressure measurement in humans A
statement for professionals from the subcommittee of professional and public
71
education of the American Heart Association council on high blood pressure research
Hypertension 2005 45 142-61
3 da Silva IRR de Souza MDG de Camargo CAC Blood pressure measurement in
children and adolescents Guidelines of high blood pressure recommendations and
current clinical practice Arq Bras Cardiol 2007 88 434-7
4 Sinaiko AR Hypertension in children N Engl J Med 1996 3351968-73
5 US Preventive Services Task Force Screening for high blood pressure
recommendations and rationale Am J Prev Med 2003 25 159-64
6 Report of the second task force on blood pressure control in children Pediatrics 1987
79 1-25
7 National high blood pressure education programme working group on hypertension
control in children and adolescents update on the 1987 task force report on high blood
pressure in children and adolescents A working group report from the national high
blood pressure education program Pediatrics 1996 98 649-58
8 National high blood pressure education program working group on high blood
pressure in children and adolescents The fourth report on the diagnosis evaluation
and treatment of high blood pressure in children and adolescents Pediatrics 2004
114 255-76
9 Aderele WI Seriki O Hypertension in Nigerian children Arch Dis Child 1974
49313-7
10 Bo S Gambino R Gentile L Pagano G Rosato R Saracco GM Cassader M
Durazzo M Cavallo-Perin P High-normal blood pressure is associated with a cluster
of cardiovascular and metabolic risk factors a population based study J Hypertens
2009 27 102-8
72
11 Bao W Threefoot SA Srinivasan SR Berenson GS Essential hypertension
predicted by tracking of elevated blood pressure from childhood to adulthood The
Bogalusa Heart Study Am J Hypertens 1995 8 657- 65
12 Richard A Rodgers M Hedley AJ Mitchel JRA Changes in blood pressure and
blood lipid during adolescence BMJ 1980 28 1563-6
13 Sundstroumlm J Neovius M Tynelius P Rasmussen F Association of blood pressure in
late adolescence with subsequent mortality cohort study of Swedish male conscripts
BMJ 2011 342 643-8
14 Zimmet P Alberti G Kaufman F Tajima N Silink M Arslanian S Wong S Bennett
P Shaw J Caprio S On behalf of the International Diabetes Federation Task Force on
Epidemiology and Prevention of Diabetes The metabolic syndrome in children and
adolescents the IDF consensus Diabetic Voice 20075229-32
15 Abdulrahman FA Babaoye AA Childhood hypertension in northern Nigeria West
Afr J Med 1978 1 7-11
16 Adediran O Jimoh A Di M Relationship between body mass index and blood
pressure in rural Nigerian dwellers Internet J Nutri Wellness 2009 7 431-4
17 World Health Organization (WHO)UNICEF Adolescence at a glance 2003 p 2
18 The National Population Commission constitution of the Federal Republic of Nigeria
(AP 23 LFN) legal notice on publication issued April 21st 2007
19 Heald FP and Gong EJ Diet Nutrition and adolescents In Shils ME and Ross AC
(eds) Modern Nutrition in Health and Disease 9th ed William and Wilkins
Maryland USA 1999 p 32
20 Okonkon CT The prevalence of Hypertension among civil servants in Calabar Nig
Med J 1979 7422-5
21 Bugaje MA Yakubu AM Ogala WN Prevalence of adolescent hypertension in Zaria
Nig J Paediatr 2005 32 77-82
73
22 Obika LF Adedoyin MA Olowoyeye JO Pattern of paediatric blood pressure in
rural semi urban and urban communities in Ilorin Nigeria Afri J Med Sci 1995 24
371-7
23 Jeremy B A short history of blood pressure measurement section of the history of
medicine Proc Roy Soc Med 1977 70 793-9
24 Lewis O Stephen Hales and the measurement of blood pressure J Hum Hypertens
1994 8 865-71
25 Crile GW Blood Pressure in Surgery An experimental and Clinical Research
Philadelphia Lippincott 1903 p 358
26 Lewis WH The evolution of clinical sphygmomanometer Bull N Y Acad Med 1941
17 871-81
27 Browne WC OrsquoBrien ET Semple PF The sphygmomanometer of Riva Roci 1896-
1996 J Hum Hypertens 1994 610 723-4
28 Segal HN How Korotkoff the Surgeon discovered the auscultatory method of
measuring arterial pressure Ann Intern Med1975 83 561-2
29 Goodman FH and Howell AA Clinical studies in the auscultatory method of
determining blood pressure University of Pennsylvania Bulletin 1911 23 469-75
30 Crenner CW Introduction of the blood pressure cuff into US medical practice
technology and skilled practice Ann Intern Med 1998 128 488-493
31 Ganon WF Circulation In Review of Medical Physiol Lange Medical Publication
New York 22nd edition 2005 p 234-63
32 Beth C Homeostatic Regulation of Blood pressure Available from
URLhttpwwweHowcom Accessed on 1st December 2011
33 Rajinder KG Fahim M Regulation of cardiovascular functions during acute blood
loss Indian J Physiol Pharmacol 2005 49 213ndash9
74
34 Dampney AL Coleman MJ Fonts MAP Hirooka Y Horiuchi J Polson JW Potts
PD Tagawa T Central mechanisms underlying short-term and long-term regulation
of the cardiovascular system Proc Austr Physio Pharmacosociety 2001 32 333-44
35 Koshiya N Guyenet PG Noradrenergic neurons and the carotid sympathetic
chemoreflex Am J Physiol 1994 267 519-26
36 Prakash ES The ultimate goal in neural regulation of cardiovascular function Adv
Phyiol Educ 2008 32 107-8
37 Allen AM Inhibition of the hypothalamic paraventricular nucleus reduces
sympathetic nerve discharge and blood pressure Proc Austr Neuroscience Society
2001 29 44-7
38 Reid IA Interactions between ANG II sympathetic nervous system and
baroreceptor reflexes in regulation of blood pressure Am J Physiol 1992 262 763-
78
39 Brooks VL Osborn JW Hormonal-sympathetic interactions in long-term
regulation of arterial pressure A hypothesis Am J Physiol 1995 268 1343-58
40 Reckelhoff JF Gender Differences in the Regulation of Blood Pressure
Hypertension 2001 37 1199-208
41 Fink GD The systemic circulation as a regulated free-market economy A new
approach for understanding the long-term control of blood pressure Clin Exp
Pharmacol Physiol 2005 32 377ndash83
42 Benard K Sources of error in blood pressure measurement Hospital Physician 2002
12 33-7 Available from URLhttp wwwturnerwhitecom
43 Chyun DA A comparism of intra arterial and auscultatory blood pressure readings
Heart lung 1985 14 223-31
75
44 Nwankwo MU Lorenz JM Gardiner JC A Standard Protocol for Blood Pressure
Measurement in the Newborn Pediatrics 1997 99 1342-9
45 Deakin CD Low JL Accuracy of the advanced trauma life support guidelines for
predicting systolic blood pressure using carotid femoral and radial pulses
observational study BMJ 2000 321 673ndash4
46 OrsquoBrian E Replacing mercury sphygmomanometers require clinician to demand
better automated device BMJ 2000 320 815-6
47 McKay DW Raju MK Campbell NR Assessment of blood pressure measuring
techniques Med Educ 1992 26 208ndash12
48 Baker RH Ende J Confounders of auscultatory blood pressure measurement J Gen
Intern Med 1995 10 223ndash31
49 Neufeld PD Johnson DL Observer error in blood pressure measurement CMAJ
1986 135 633ndash7
50 van Montfrans GA Oscillometric blood pressure measurement progress and
problems Blood Press Monit 2001 6 287ndash90
51 Ware RW Laenger CJ Indirect blood pressure measurement by Doppler ultrasonic
kinetoartriography Proceedings 20th Annual Conference Engineering Medical
Biology 1967 9 27-30
52 Matthew Fox Blood pressure measurement technique Available from URL http
wwwlivestrongcom Last edited 2nd September 2010 Accessed on 30th November
2011
53 Akor F Okolo SN Okolo AA Blood pressure and anthropometric measurements in
healthy Primary School entrants in Jos Nigeria SAJCH 2010 4 42-5
54 Merhi BM Al-Hajj F Al-Tannir M Zaide F El-Rajab M A survey of blood pressure
in Lebanese children and adolescents North Am J Med Sci 2011 3 24-9
76
55 Al-Salloum AA El-Mouzan AH Al-Herbish AS Al-Umar AA Qurashi MM Blood
pressure standard for Saudi children and adolescents Ann Saudi Med 2009 29 173-8
56 Akinkugbe FM Akinwolere AO Kayode CM Blood Pressure Pattern in
Adolescence West Afri J Med 1999 18 196-202
57 Wanzhu T Eckert GJ Saha C and Pratt JH Synchronization of Adolescent Blood
Pressure and Pubertal Somatic Growth J Clin Endo Metab 2009 94
58 Ansa VO Anah MU Odey FA Mbu PN Agbor EI Relationship between parental
socioeconomic status and casual blood pressure in coastal Nigeria Adolescents West
Afri J Med 2010 29146-52
59 Agyemang C Redekop WK Owusu-Dabo E Bruijnzeels MA Blood pressure
patterns in rural semi-urban and urban children in the Ashanti region of Ghana West
Africa BMC Public Health 2005 5114-21
60 Ejeke CCE Ugwu CE Ezeanyika LUS Olayemi AT Blood pressure patterns in
relation to geographic area of residence a cross-sectional study of adolescents in Kogi
state Nigeria BMC Public Health 2008 8 411-5
61 Colhoun HM Hemminway H Poulter WR Socioeconomic status and blood
pressure an overview analysis J Human Hypertension 1998 12 91-110
62 Badaruddoza KR Familial aggregation and heritability for cardiovascular risk factors
a family based study in Punjab India Natural Science 2010 2 732-6
63 Livshits G Gerber LM Familial factors of blood pressure and adiposity co-variation
Hypertension 2001 37 928-35
64 Fermino RC Seabra A Garganta R Antoacutenio J Maia R Genetic factors in familial
aggregation of blood pressure of Portuguese nuclear families Arq Bras Cardiol 2009
92 463-9
77
65 Mijinyawa MS Iliyasu Z Borodo MM Prevalence of hypertension among teenage
students in Kano Nigeria Nig J Med 2008 17 173-7
66 The Wellcome Trust case control consortium Genome-wide association study of
14000 cases of seven common diseases and 3000 shared controls Nature 2007 447
661-78
67 Levy D Destefano AL Larson MG ODonnell CJ Lifton RP Gavras H Evidence for
a gene influencing blood pressure on chromosome 17 genome scan linkage results for
longitudinal blood pressure phenotypes in subjects from the Framingham heart study
Hypertension 2000 36 477- 83
68 Lifton RP Wilson FH Choate KA Geller DS Salt and blood pressure new insight
from human genetic studies Cold Spring Harb Symp Quant Biol 2002 67 445ndash50
69 van der Sande MA Milligan PJ Nyan OA Rowley JT Banya WA Ceesay SM
Dolmans WM Blood pressure patterns and cardiovascular risk factors in rural and
urban Gambian communities J Hum Hypertens 2000 14 489-96
70 Akinkugbe OO Ojo OA Arterial blood pressure in rural and urban population of
Nigeria BMJ 1969 2 22-4
71 Okagua J Anochie IC Akani NA Adolescent blood pressure in Rivers State Nigeria
A rural-urban comparism NJP 20154221-7
72 Urrutia-Rojas X Egbuchunam CU Bae S Menchaca J Bayona M Rivers PA Singh
KP High blood pressure in school children Prevalence and risk factors BMC
Pediatrics 2006 6 32-9
73 Sorof JM Lai D Turner J Poffenbarger T Potman R Overweight ethnicity and the
prevalence of hypertension in school-aged children Pediatrics 2004 113 475-82
78
74 Rosner B Prineas R Daniels SR Blood pressure differences between blacks and
whites in relation to body size among US children and adolescents Am J Epidemiol
2000 151 1007-18
75 Harding S Whitrow M Lenguerrand E Maynard M Teyhan A Cruickshank JK Der
G Ethnic differences in blood pressure in adolescence the determinants of adolescent
social well-being and health study Hypertension 2010 55 1063-9
76 Cruickshank JK Mzayek F Liu L Kieltyka L Sherwin R Webber LS Srinavasan SR
Berenson GS Origins of the ldquoblackwhiterdquo difference in blood pressure roles of birth
77 Vlajinac H Miljus D Adanja B Marinkoic J ipetic S Kocev N Blood pressure levels
in 7 to 14-year-old Belgrade children J Human Hypertension 2003 17 761ndash5
78 Menezes AMB Hallal PC Dumith SC Adolescent blood pressure body mass index
and skin folds sorting out the effects of early weight and length gains J Epid Comm
Health 2011 12 42-8
79 Karelis AD St-Pierre DH Conus F Rabasa-Lhoret R Poehlman EJ Metabolic and
body composition factors in subgroups of obesity what do we know J Clin Endo
Metab 2004 89 2569-75
80 Katzmarzyk PT Srinivasan ER Chen W Malina RM Bouchard C Berenson GS
Body mass index waist circumference and clustering of cardiovascular disease risk
factors in a biracial sample of children and adolescents Pediatrics 2004 114 198-205
81 Guagnano MT Ballone E Colagrande V Della Vecchia R Manigrasso MR Merlitti
D Riccioni G Sensi S Large waist circumference and risk of hypertension Int J
Obesity 2001 25 1360 ndash 4
82 Araujo TA Lopes MVO Moriera RP Cavalcante TF Gurdes NG MartinS dA Silva
V Blood pressure of children and teenagers from a public school in Fortaleza - Cearaacute
Acta paul enferm 200720103-15
79
83 Sebanjo IO Oshikoya KA Obesity and blood pressure levels of adolescents in
Abeokuta Nigeria Cardiovasc J Afr 2011 221-5
84 Messerli FN Obesity and essential hypertension Haemodynamics sodium excretion
and plasma rennin activity Arch Int Med 1981 141 81-5
85 Appel LJ Brands MW Daniels SR Karanja N Elmer PJ Sacks FM Dietary
Approaches to Prevent and Treat Hypertension A Scientific Statement from the
American Heart Association Hypertension 2006 47 296-308
86 Sacks FM Svetkey LP Vollmer WM Appel LJ Bray GA Harsha D Obarzanek E
Conlin PR Miller ER 3rd Simons-Morton DG Karanja N Lin PH for the DASH-
Sodium Collaborative Research Group Effects on blood pressure of reduced dietary
sodium and the Dietary Approaches to Stop Hypertension (DASH) diet DASH-
Sodium Collaborative Research Group N Engl J Med 2001 344 3ndash10
87 Appel LJ Moore TJ Obarzanek E Vollmer WM Svetkey LP Sacks FM Bray GA
Vogt TM Cutler JA Windhauser MM Lin PH Karanja N A clinical trial of the
effects of dietary patterns on blood pressure DASH Collaborative Research Group N
Engl J Med 1997 3361117ndash24
88 Appel LJ Sacks FM Carey VJ Obarzanek E Swain JF Miller ER 3rd Conlin PR
Erlinger TP Rosner BA Laranjo NM Charleston J McCarron P Bishop LM for the
OmniHeart Collaborative Research Group Effects of protein monounsaturated fat and
carbohydrate intake on blood pressure and serum lipids results of the OmniHeart
randomized trial JAMA 2005 294 2455ndash64
89 Karanja NM Obarzanek E Lin PH McCullough ML Phillips KM Swain JF
Champagne CM Hoben KP Descriptive characteristics of the dietary patterns used in
the Dietary Approaches to Stop Hypertension Trial DASH Collaborative Research
Group J Am Diet Assoc 1999 99 19ndash27
80
90 Nwokocha ARC Adolescence and associated problems In Azubuike JC and
Nkanginieme KEO (eds) Paediatrics and Child Health in a Tropical Region African
Educational Services Owerri Nigeria 2nd edition 2007 p 84-99
91 Rogol RT Roemmich JN Clark PA Growth and puberty J Adol Hlth 2002 31 192-
200
92 Tanner JM Marshal WA Variation in the pattern of puberty changes in boys and girls
Arch Dis Child 1970 45 13-23
93 Nwakoro SO Ifoda K Onochie O Olomu JM Anthropometric assessment of
nutritional status and growth of 10-20 years individuals in Benin City metropolis
Nigeria Pakistan J Nutr 2006 5 117-21
94 Shankar RR Eckert GJ Saha C Tu W Pratt JH The change in blood pressure during
pubertal growth J Clin Endo Metab 2005 90 163-7
95 Department of Health and Human Services 2000 CDC Growth Charts for the United
States methods and development Series Report 11 No 246 Available from URL
httpwwwcdcgovGrowthCharts
96 Redwine KM Daniels SR Prehypertension in Adolescents Risk and Progression
Journ Clin Hypertension 2012 14 360ndash4
97 Falkner B Gidding SS Portman R Rosner B Blood pressure variability and
classification of prehypertension and hypertension in adolescence Pediatrics 2008
122238ndash42
98 Redwine KM Acosta AA Poffenbarger T Development of hypertension in
adolescents with pre-hypertension J Pediatr 2012 16098ndash103
99 Ejike ECCC Ugwu CE and Ezeanyika LUS Variations in the prevalence of point
prehypertension in a Nigerian school-going adolescent population living in a semi-
urban and an urban area BMC Pediatr 2010 1013
81
100 Ujunwa FA Ikefuna AN Nwokocha AR Chinawa JM Hypertension and
prehypertension among adolescents in secondary schools in Enugu South East Nigeria
Italian J Pediatr 20133970-5
101 Chobanian AV Bakris GL Black HR Seventh report of the Joint National
Committee on Prevention Detection Evaluation and Treatment of High Blood
Pressure Hypertension2003 421206ndash52
102 Lande MB Systemic Hypertension In Kliegman RM Behrman RE Jenson HG and
Stanton BF (eds) Nelson Textbook of Pediatrics Saunders Elsevier Philadelphia 19th
Edition 2011 pg 1592-8
103 Luma GB Spiotta RT Hypertension in Children and Adolescent Am Fam Physician
2006 73 1558-68
104 Arvind B Rupesh J Vijayakumar M Madhuri K Ali U Evaluation and management
of hypertension Indian Paediatr 2007 44 103-21
105 Flynn JT Neonatal hypertension Diagnosis and management Pediatr Nephrol 2000
14 332-41
106 Steyn K de Wet T Richter L Cameron N Levitt NS Morrel C Cardiovascular
diseases risk factors in 5-year old urban South African children- The Birth to Ten
Study SAMJ 2000 90 7126
107 Antia-Obong OE Antia-obong LE Arterial blood pressure of Nigerian Urban and
Rural school children Nig J Paediatr 1991 18 3-11
108 Nguyen NT Magno CP Lane KT Hinojosa MW Lane JS Association of
hypertension diabetes dyslipidemia and metabolic syndrome with obesity findings
from the National Health and Nutrition Examination Survey 1999 to 2004 J Am Coll
Surg 2008 207 928-34
82
109 Solar MB Gill A Rey J Epidemiology of arterial blood pressure in school children
population Aten Primaria 1992 9 212-4
110 Steyn K de Wet T Richter L Cameron N Levitt NS Morrel C Cardiovascular
diseases risk factors in 5-year old urban South African children- The Birth to Ten
Study SAMJ 2000 90 7126
111 Linkas J The assessment and management of hypertensive emergencies and
urgencies in children Pediatr Emerg Care 2005 21391-6
112 Croix B Feig DI Childhood hypertension is not a silent disease Pediatr Nephrol
2006 21527-32
113 Flynn JT Anderson MH Characteristics of children with primary hypertension seen
at a referral centre Pediatr Nephrol 2007 44 103-21
114 Nakao M Yano E Nomura S Kuboki T Blood pressure lowering effects of
biofeedback treatment in hypertension a meta-analysis of randomized controlled trials
Hypertension 2003 26 37- 46
115 Jalingo Available from URLhttpwwwencyclopedia Britanica Accessed on 3rd
December 2011
116 Araoye MO Research Methodology with Statistics for Health and Social Sciences
Nathadex Publishers Saw-Mill Ilorin Nigeria 2004 pg 115-21
117 Olusanya O Okpere E Ezimokhai M The importance of social class in voluntary
fertility control in a developing country West Afr J Med 1985 4 205-12
118 World Health Organization expert committee Physical status the use and
interpretation of anthropometry WHO technical report series No 894 Geneva WHO
1995 p 424ndash38
119 Guidelines subcommittee WHOISH guideline for management of hypertension J
Hypertens 1999 17 151-83
83
120 Aubay B How to measure waist circumference Available from
URLhttpwwwehowcom Last updated August 10th 2011 and accessed on December
9th 2011
APPENDICES
Appendix 1
PROFORMA ON BLOOD PRESSURE PATTERN IN APPARENTLY HEALTHY
SECONDARY SCHOOL ADOLESCENTS IN JALINGO
PUBLIC SCHOOL [ ]
Serial No
84
PRIVATE SCHOOL [ ]
A BIODATA
1 Age (years) 10[ ] 11[ ] 12[ ] 13[ ] 14[ ] 15[ ] 16[ ] 17[ ] 18[ ] 19[ ]
2 Gender M [ ] F [ ]
3 Class JSS 1-3 [ ] SS1-3 [ ]
B MEDICAL AND SOCIAL HISTORY Yes [1] No [2]
1 Have you ever passed blood in your urine [ ]
2 Have you ever had your face or legs swollen [ ]
3 Are you on any drug for long time (such as pills steroids marijuana codeine
NSAIDs containing drugs tramal and others) [ ]
If yes specifyhelliphelliphellip
C SOCIO-ECONOMIC CLASSIFICATION
Fatherrsquos occupation
Score 1 Professionals top civil servants politicians and top businessmen
2Middle-level civil servants technicians skilled-artisans and well-to-do
traders
3 Unskilled workers and those in general whose income would be at or below
the national minimum wage
Mothers educational level
Score 0 Education up to University level
1 Secondary or tertiary level below the University
2 No formal education or up to primary level only
D ANTHROPOMETRY
i Weight (Kg) ndash 1helliphellip 2helliphelliphellip Averagehelliphelliphelliphellip
ii Height (m) ndash 1helliphellip 2helliphellip Averagehelliphelliphelliphellip
85
iii Body mass index = weightheight (kgm2)
v Waist circumference (cm) ndash 1helliphellip 2helliphelliphellip Averagehelliphelliphelliphellip
iv Blood Pressure (mmHg) - 1helliphellip 2hellip 3helliphellip Averagehelliphelliphelliphellip
Appendix 2
AUTHORIZATION AND CONSENT TO PARTICIPATE IN A RESEARCH
I Dr Peter Teru Yaru of the Department of Paediatrics Ahmadu Bello University
Teaching Hospital (ABUTH) Zaria Irsquom conducting a research on the blood pressure
pattern among secondary school adolescents in Jalingo
The aim of the study is to know the level of blood pressure among their age
groups Those with high blood pressure (or hypertension) will be identified appropriately
advised and referred for further care The study will involve taking their weight height
blood pressure and waist circumference Female assistants shall be responsible for
86
measuring waist circumference of female students Students will also be given a
questionnaire on some of their activities drug use among others all aimed at looking for
factors which can affect their blood pressure Information obtained shall be treated with
utmost confidentiality and for this research work only Please note that participation is
voluntary I will be glad if you give consent for your childward to participate in the
study
Statement by parents Irsquove read and understood this consent form and agreed for my
child to be included in the study
Parents name Researcherrsquos name and sign
Parents phone no if any Date
Parents signthumb print Phone no
87
Appendix 3
SOCIO-ECONOMIC SCORE
The classification of socio-economic scores based on fatherrsquos occupation and motherrsquos
education by Olusanya et al117
A Husband (fatherrsquos occupation)
Score 1 Professionals top civil servants politicians and businessmen
2 Middle-level bureaucrats technicians skilled-artisans and well-to-do traders
3 Unskilled workers and those in general whose income would be at or below
the national minimum wage
B Mothers educational level
Score 0 Education up to University level
1 Secondary or tertiary level below the University
2 No formal education or up to primary level only
The socio-economic class of the childrsquos mother is obtained by adding the scores from A
and B above and graded I-V as appropriate for example
Score (1) from A plus score (0) from B = social class I
Score (2) from A plus score (0) from B = social class II
Score (2) from A plus score (1) from B = social class III
Score (2) from A plus score (2) from B = social class IV
Score (3) from A plus score (0) from B = social class III
Score (3) from A plus score (1) from B = social class IV
Score (3) from A plus score (2) from B= social class V
Page 8
8
LIST OF TABLES
Table I Result of pilot study 26
Table II List of schools and number of students selected 28
Table III Age and sex distribution of the study subjects 33
Table IV Overall ean anthropometric measurements of the study subjects 35
Table V Mean anthropometric indices of 628 boys 36
Table VI Mean anthropometric indices of 722 girls 37
Table VII Mean and ranges of blood pressure of 1350 subjects 38
Table VIII Mean blood pressure in relation to age and sex 39
Table IX Mean blood pressureaccording to sex and stages of adolescence 41
Table X The pattern of normal BP prehypertension and hypertension according to stages of
adolescence 41
Table XI Correlation between blood pressure and anthropometry 42
Table XII Mean blood pressure in relation to socioeconomic classes 43
Table XIII Blood pressure pattern in relation to socioeconomic classes 43
Table XIV Overall Blood pressure pattern and prevalence of hypertension 45
9
LIST OF FIGURES
Figure 1 Studentsrsquo distribution according to socioeconomic classes 34
Figure 2 Blood pressure distribution in relation to age and sex 40
10
SUMMARY
A cross sectional study of blood pressure pattern in apparently healthy secondary school
adolescents aged 10-19years in Jalingo Taraba state was carried out over six months period
from January to July 2014 One thousand three hundred and fifty (1350) students
participated comprising 628 (465) boys and 722 (535) girls Variables measured
included blood pressure weight height waist circumference and body mass index was
calculated from the weight and height
Overall the mean anthropometric values and blood pressure increased with age
irrespective of sex The mean weight of the students was 486plusmn109kg with a range of 23-
100kg while the mean height was 16plusmn01m and ranged from 12-19m The mean waist
circumference was 656plusmn89cm and ranged from 22-100cm while the meanbody mass index
(BMI) was 189plusmn31 with a range of 114-420
The overall mean systolic blood pressure was 1089plusmn125mmHg with a range of 76-
165mmHg whilethe mean diastolic blood pressure was683plusmn82mmHg and ranged from 47-
95mmHg The gender related differences in blood pressure showed mean systolic blood
pressure for boys and girls to be 1081plusmn133mmHg and 1095plusmn117mmHg (t=-2054
p=0040) while the mean diastolic blood pressurewas 678plusmn81mmHg and
687plusmn82mmHg(t=-2077 p=0038) respectively Girls generally had a higher mean systolic
blood pressure than boys from early adolescence (t=3754 p=0007) to middle adolescence
(t=-3025 p=0011) but reversed during late adolescence with boys having higher mean
systolic blood pressure (t=2145 p=0033) and these differences were statistically significant
Girls also showed dominance in the diastolic blood pressurein early and middle adolescence
but only statistically significant during middle adolescence (t=-3517 plt0000) Adolescents
from private schools had higher meansystolic blood pressure of 1102plusmn123mmHg than those
11
from public schools with 1084plusmn125mmHg(t=-222 plt0027)and higher mean diastolic
blood pressure of 703plusmn80mmHg than those from public schools with 677plusmn81mmHg(t=-
461 p=0000)
Blood pressure correlated positively with age (r=030-035 plt0000) height (r=034-
044 plt0000) weight (r=038-051 plt0000) body mass index (r=029-040 plt0000) and
waist circumference (r=023-031 plt0000) The socio-economic class associated negatively
with blood pressure withthose from upper socio-economic classeshavinga relatively
lowermean blood pressure than their counterparts from lower socio-economic classes but the
differences were not statistically significant for both systolic (f=1650 p=2850) and diastolic
blood pressure (f=0193 p=0058)
The overall point prevalence of hypertension was 44(59 0f 1350) with gender specific
prevalence for malebeing 41 (26 of 628 boys) and46 (33 of 722 girls) for females The
gender difference was not statistically significant (χ2=0831 p=0362) According to stages of
hypertension 15 (10 of 628)and 11 (7 of 628) males had stages 1 and 2 systolic
hypertension respectively while24 (15 of 628) had stage 1 diastolic hypertension andnone
had stage 2 diastolic hypertension Similarly 24 (17 of 722) and 12 (9 of 722) females
had stages 1 and 2 systolic hypertension respectively while 12 (9 of 722) and only 01 (1
of 722) girls had stages 1 and 2 diastolic hypertension respectively The overall prevalence of
pre-hypertension was 221(298 of 1350) with gender related prevalence of 21 (131 of
628) for males and231 (167 of 722) for femalesThe gender difference was statistically
significant (χ2=4349 p=0037)
In view of the high prevalence of pre-hypertension of 221 (298 of 1350) in this
study it is recommended that blood pressure measurement should be included as part of
medical evaluation at secondary school entry and at least annually thereafter especially for
those found to be at risk of hypertension during school entry
12
INTRODUCTION
Blood pressure (BP) is the pressure exerted by circulating blood volume on the walls of
blood vessels1 It is one of the vital signs measured during routine physical examination2
Blood pressure measurement is done to screen for hypertension and other cardiovascular
risk factors determining risk for various medical procedures identifying patients in
potential or actual clinical deterioration and determining individualrsquos fitness for an
occupation3 Its value as a screening tool in adults has long been documented and is an
established important component of routine paediatric physical examination4
The importance of BP measurement in children and adolescents is based on the fact
that hypertension is now increasingly diagnosed among them5-8 The American Academy
of Paediatrics now recommends routine screening of asymptomatic adolescents and
children during preventive care visits Such screening will identify potentially treatable
and preventable causes of hypertension and initiate early treatment to prevent
complications5
Hypertension is an important health problem all over the world5-9 because it is
usually silent and the presence of symptoms may indicate end organ damage10 It is
known to track well into adulthood thus making BP measurements in youths valuable for
identifying adolescents at risk of essential hypertension in adulthood11 Individuals with
high BP in their childhood are more likely to have high BP in subsequent years12 The
phenomenon of BP tracking into adulthood and the demonstration of the beginnings of
hypertensive target organ damage during childhood together with the increased
prevalence of childhood essential hypertension have raised concern of an impending
epidemic of cardiovascular morbidity and mortality10
The consequences of hypertension in children range from increased morbidity
from its causes complications or its treatment to high mortality13 The most frequently
13
and perhaps severely affected organs are the heart kidneys brain and the eyes leading to
lowered life expectancy and premature death13 In addition hypertension is a component
of the metabolic syndrome associated with similar and perhaps more severe consequences
in affected individuals14 Abdulrahaman and Babaoye15 in a study of hypertension in
Nigerian children observed a mortality rate of 28 within the first year after diagnosis
Similar mortality of 275 was reported by Aderele and Seriki9 Hypertension also places
an excessive financial burden on the population and health system consuming scarce
resources16
Adolescence is the transitional period of development between childhood and
adulthood The World Health Organization (WHO) defines adolescents as individuals
between the ages of 10 and 19 years and they account for 40 of Nigeriarsquos population1718
Adolescence is characterized by rapid biological psychological and cognitive changes
largely dependent on hormonal and environmental influences19 Many of the responses to
these influences include behaviours that have direct implications on health such as harmful
dietary intake alcoholism smoking substance abuse and sedentary lifestyle19 These
coupled with social stresses such as city traffic congestion have negative health impact and
predispose to obesity and increased risk of cardiovascular disease such as hypertension and
metabolic syndromes10 20 It has been shown that if preventive measures are started early in
childhood and adolescence they may lead to significant reduction in the high prevalence of
hypertension and metabolic syndrome currently observed in adults81320
JUSTIFICATION FOR THE STUDY
Hypertension is associated with high morbidity affecting major organs of the body such as
the heart kidneys and the brain1314 and a mortality of up to 275-28915 It is now diagnosed
frequently in adolescents with a reported prevalence of 35-952122 The younger the age of
14
onset of hypertension the greater the reduction in life expectancy if left untreated13 Even
asymptomatic adolescents with mild blood pressure elevations can have target organ
damage10 Studies121420 have shown that early identification and intervention may lead to a
significant reduction in the high prevalence of hypertension and metabolic syndrome
currently observed in adults In view of this routine blood pressure check-ups for children
and adolescents have been advocated during medical evaluations8 Blood pressure is
however not routinely measured in most paediatric clinical practices in Nigeria
Consequently only few children will have their blood pressure measured when they fall sick
or during preventive care visits In addition hospital and clinic BP measurements may be
associated with falsely elevated BP called lsquolsquowhite coat hypertensionrsquorsquo8 BP measurement of
children outside of the hospital setting such as in schools will provide opportunity for
apparently healthy individuals and possibly eliminate white coat hypertension The need for
surveillance for the early identification of adolescents in Jalingo who are at risk of
hypertension and to initiate measures aimed at preventing its consequences is therefore the
justification for this study In addition the study will add to the body of knowledge on
adolescent blood pressure as there has been no previous study on BP from Jalingo and
northeastern Nigeria as a whole This will help inform public health policies regarding blood
pressure control and prevention in Taraba State in particular and in Nigeria in general
15
LITERATURE REVIEW
HISTORICAL PERSPECTIVE
Blood pressure measurement first started in the eighteenth century with the experiment of
Stephen Hales to whom its discovery can be attributed as reported by Jeremy2324
Accurate study of blood pressure as reported by Crile25 began with the introduction of a
manometer by Poiseuille a century later The first truly accurate blood pressure
measurement in man was by the Surgeon Faivre in 1856 when he connected an artery to a
mercury manometer to obtain direct readings24 Non-invasive methods of BP
measurement started with the discovery of the sphygmograph in 1855 by Vierordt as
reported by Crile25 and improvement by Potain in 1889 gave birth to the
sphygmomanometer26 In 1896 Scipione Riva-Rocci developed the method upon which
present-day technique is based27
Segal28 reported that the use of stethoscope for BP measurement was first highlighted
in 1905 by a Russian surgeon Korotkoff who documented hearing a tapping sound using a
stethoscope placed over the brachial artery as the Riva-Rocci cuff was deflated Goodman
and Howell29 recommended the division of the changing sounds into five distinct phases and
physicians subsequently determined blood pressure according to the point of appearance and
muffling or disappearance of the sounds30
DEFINITION AND REGULATION OF BLOOD PRESSURE
Blood pressure is defined as the product of cardiac output and peripheral vascular
resistance131 During each heartbeat BP varies between a maximum (systolic) and a
minimum (diastolic) pressure and is measured in millimeters of mercury (mmHg)1 Blood
16
pressure is regulated by different mechanisms acting either rapidly or slowly to maintain it
within normal range for optimal cellular performance3132
Intrinsic Regulation
Intrinsic factors regulating BP include stroke volume and heart rate which both influence
cardiac output31 Stroke volume depends on the volume of blood that fills the ventricles and
this depends on the preload and afterload33 A higher afterload will decrease stroke volume
causing low cardiac output and low BP and vice versa When cardiac output increases more
volume is derived from the venous pool increasing preload Similarly an increased heart rate
will lead to increased cardiac output and BP3134
Reflex Regulation
The baroreceptors within the aortic arch and carotid sinuses contain sympathetic and
parasympathetic nerve fibres3435 These are sensory nerves which run from the medulla
and they respond to stretch of the tissue in which they lie by increasing or decreasing the
rate of signaling36 and act fast in regulating BP34 Sympathetic stimulation causes
increased heart rate and widespread vasoconstriction to increase BP while
parasympathetic stimulation produces the opposite3537
Hormonal Regulation
Hormones regulating blood pressure include renin-angiotensin-aldosterone and
antidiuretic hormone (ADH) They act slowly by responding to changes in intravascular
volume and osmolality38 Angiotensin II is a potent vasoconstrictor and stimulates the
release of aldosterone from the adrenal gland39 Aldosterone increases sodium absorption
and fluid retention leading to increased BP ADH is a potent vasoconstrictor and plasma
volume regulator and its stimulation results in fluid retention and vasoconstriction39
Other hormones regulating BP include the sex hormones thyroid parathyroid cortisol
and ACTH They act on the rennin-angiotensin-aldosterone system to regulate BP3940
17
Renal Regulation
The kidneys control blood pressure through the retention and excretion of extracellular
fluid35 An increase in renal fluid retention will increase extracellular volume and higher
blood pressure whereas increased renal excretion leads to lower blood pressure41 This is
achieved through the action of ADH aldosterone and atrial natriuretic peptide (ANP)41
METHODS OF MEASURING BLOOD PRESSURE
Blood pressure can be measured by invasive and non-invasive methods
1) Invasive (or direct) method - Blood pressure is most accurately measured invasively
through an arterial line4243 It is the gold standard by which the accuracy of other blood
pressure measuring devices and methods are assessed4344 Chyun43 compared direct and
indirect blood pressure readings in 14 intensive care unit patients and found that the
auscultatory method overestimates the systolic and diastolic BP especially if the VI Kortkoff
sounds is used as an indicator of diastolic BP This can often over estimate reading by as
much as 20 mm Hg43 This study is made up of very small sample size to make general
conclusion on the differences in BP values from the two methods compared Although the
invasive method is the gold standard for true BP measurement it is associated with serious
complications related to arterial catheterization and the procedure itself may be technically
difficult It is mainly used in experimental procedures and in monitoring critically ill patients
in intensive care units42
2) Non invasive (indirect) methods These are simpler and quicker than the invasive
method and are commonly used for routine blood pressure examinations They may
however yield lower accuracy and small systematic differences in numerical results43
These methods include-
18
a) Palpation method - A minimum systolic value can be estimated by palpation Deakin
and Low45 reported that a palpable radial femoral or carotid pulse indicates a minimum
systolic BP of 80 70 and 60 mmHg respectively The study was carried out among adults
and these values could not be applicable in children and neonate whose maximum
systolic BP may be lower than the reported minimum values A more accurate systolic BP
value can be determined by inflating and then deflating sphygmomanometer cuff while
palpating the pulse The systolic BP corresponds to the pressure at which the radial pulse
becomes palpable45 Its disadvantages are that pressure obtained is usually 2-5mmHg less
than those obtained by auscultation and diastolic BP cannot be measured32
b) Auscultation method- Also called the Korotkoff method is the method of choice in
clinical practice142 It involves using a stethoscope and a sphygmomanometer46 The
mercury sphygmomanometer is the gold standard for BP measurement A Riva-Rocci
cuff 27 is placed over the arm and inflated to occlude the brachial artery It is then
gradually deflated until blood flow is re-established accompanied by a tapping sound
which can be detected by the stethoscope held over the artery Five sounds are
traditionally heard and classified into phases30 The first phase corresponds to the systolic
BP while the last or fifth phase corresponds to the diastolic BP30 The fourth phase
alternatively is used to measure the diastolic pressure if a 10 mmHg or greater
differences exist between the initiation of phases fourth and five or if the fifth sound is
heard down to 0 mmHg8 This may occur in cases of high cardiac output or peripheral
vasodilatation children or in pregnancy This method though the method of choice in
clinical practice may however be associated with errors arising from faulty technique and
equipment4748 as well as observer bias49 This method was used for this study because of
its widespread general usage its reliability and accuracy Unlike other methods the
instruments (mercury sphygmomanometer and stethoscope) do not require any
19
calibration and values obtained do not require validation by other methods The standard
World Health OrganizationCenter for Disease Control (WHOCDC) blood pressure
reference percentile tables were generated using the mercury sphygmomanometer hence
the auscultation method is the gold standard for BP evaluation258
The aneroid sphygmomanometer measures BP by mechanical system of metal
bellows that expand as the cuff pressure increases in a series of levers that register the
pressure on a circular scale The hybrid shygmomanometer combines some of the features
of the two and uses an electric transducer to record blood pressure2
c) Oscillometric technique- This uses the oscillometric device Oscillation of pressure in a
sphygmomanometer cuff is recorded during gradual deflation The point of maximum
oscillation corresponds to the mean arterial pressure50 The oscillation begins well above
systolic BP and continues below diastolic BP so that systolic and diastolic BP can only
be estimated indirectly according to some empirically derived algorithm
d) Ultrasound method - This uses an ultrasound transmitter and receiver placed over the
brachial artery under a sphygmomanometer cuff As the cuff is deflated the movement of
the arterial wall and systolic BP cause a Doppler phase shift in the reflected ultrasound
The diastolic BP is recorded as the point of diminished arterial motion51 Its advantage
includes the ability to detect diastolic BP in atrial fibrillation and hypotension where
Korotkoff sound is faint152
FACTORS AFFECTING BLOOD PRESSURE IN ADOLESCENTS
Several inter-related factors affect blood pressure These include-
Age - A progressive BP elevation with age has been observed in several studies2153-55
The rate of rise varies in boys and girls5455 The average systolic increase ranges between
20
166 and 286 mmHgyr for boys and 144 and 263mmHgyr for girls while that of
diastolic BP ranges from 083 and 177mmHgyr for boys and 077 and 148mmHg for
girls2155 Bugaje Yakubu and Ogala21 studied blood pressure pattern among 2035
adolescents in Zaria and found a consistent rise of BP with age The rate of rise was fairly
constant until 11-13 years in boys and 12-14 years in girls when the rise became rapid A
similar study53 also found a BP rise with age among 650 healthy school children in Jos In
a large population studies in Lebanon56 and Saudi Arabia55 BP was similarly reported to
increase consistently with age Rapid growth and biological maturation of organs which
are normal occurrences during adolescence were thought to be responsible rather than the
chronological age56 The results of these studies showed increasing blood pressure with
age despite the fact that one study55 used oscillometric method for their study while the
standard auscultation was used in the other studies Also the studied sample sizes across
these studies varied greatly with sizes of 65053 203521 571054 and 1622655 Despite this
the findings were similar
Gender ndash Results of studies on the effect of gender on BP showed that sex positively
affects blood pressure2153-55 Merhi Al-Hajj and Al-Tannir et al54 studied BP pattern in
5710 Lebanese school children while Al-Salloum El-Mouzan and Al-Herbish et al55
studied BP pattern in 16226 Saudi children and adolescents The authors reported a
higher BP in girls than boys at all ages A study21 of BP pattern in adolescents in Zaria
Nigeria demonstrated an initial higher BP in boys before puberty which reversed with the
onset of puberty up to the age of 14-15yrs when it reversed again to be higher in boys
Akinkugbe Akinwolere and Kayode56 reported no sex differences in adolescent BP in
Ibadan The reported sex difference is said to be likely due to differences in sex hormone
and pattern of growth in boys and girls57 Differences in age range of the study population
may however be responsible for the observed BP variation For instance these studies5455
21
comprised of both adolescents and pre-adolescent age groups combined in one study
while the other two studies2156 were purely adolescents21 Blood pressure is reported to be
equal in both sexes before adolescence after which the gender difference starts to
manifest most likely due to physical and hormonal changes
Socioeconomic Factors - Belonging to either end of the socioeconomic strata is found to
be associated with elevated blood pressure5859 A study in Ibadan56 reported an inverse
relationship between parental socioeconomic status and level of BP in adolescents The
authors suggested that this might be the result of the health behaviours and problems
characteristic of the lower socioeconomic class On the other hand Ejeke Ugwu and
Ezeanyika et al60 in Lokoja and another study53 in Jos both found higher BP in children
from high socioeconomic class Colhoun Hemminway and Poulter61 in a meta-analysis of
BP and socioeconomic status in developed and developing countries found an inverse
relationship of BP with socioeconomic status in developed nations and a direct correlation
in developing countries These different findings may be due to methodological
differences in socio-demographic stratification For instance Akinkugbe and
colleagues59 used fatherrsquos level of education for social classification Parentrsquos educational
level may however not equate well with level of family income The other study60 used an
automated device for their study whose values may require validation using the
recommended auscultation method Difference in environmental stresses may also be
different considering the level of development of the areas where the studies were carried
out
GeneticFamilial Factors - The effect of geneticfamilial factors on BP has been
demonstrated in some studies62-64 Familialgenetic correlations reflected in BP and other
anthropometry generally are higher among genetically close relatives such as brother-
sisters or parent-offspring than among spouses62 Levshit and Gerber63 surveyed 514
22
individuals from 135 nuclear families in Russia while Budaruddoza62 studied 1400
individuals from 380 families in India and found significant genetic influence on BP
Mijinyawa Iliyasu and Borodo65 also reported family history of hypertension as risk
factor for developing high BP in a study on prevalence of hypertension among 1000
teenagers in Kano The authors concluded that this could be due to genetic predisposition
They however did not evaluate further to determine the genetic defects The authors did
not also consider shared environmental factors known to influence blood pressure in
individuals Molecular genetic studies have identified genes as possible regulators of
BP6667 These genes regulate the renin-angiotensin-aldosterone system involved in renal
salt handling69 Mutations that increase sodium reabsorption and salt sensitivity is
associated with higher BP and vice versa68 while shared environmental risk factors may
potentiate the development of such familial conditions which might have been
responsible for outcome of the above studies6364
Environmental Factors ndash Environmental factors greatly influence BP variation in a
population592269 Akinkugbe and Ojo70 reported a consistently higher BP in Nigerian
adolescents than their counterparts of similar ages in black and white American children
The authors are of the view that this could be due to different environmental factors of the
study population Obika Adedoyin and Olowoyeye22 studied BP pattern in 2526
children aged 1-14 years in rural semi-urban and urban communities in Ilorin Nigeria
and demonstrated a hypertension prevalence of 95 in urban compared to 63 in rural
communities This was similar to the study59 in Ghana and Gambia69 The authors592269
argued that the differences were due to socioeconomic status which is higher in the urban
than the rural areas The BP variation could be accounted for by the nature of dietary
intake since the rural communities generally consume more of natural foods with less salt
and lsquojunk foodsrsquo compared to the urban populace This was demonstrated by one study61
23
which reported higher mean BP among urban communities in developing nations due to
changes in their dietary pattern Rural areas are also less exposed to the stress and hassle
of the urban cities It is of interest to note however that urban areas are a mixture of
social classes as a result of migrant workers seeking lsquogreener pasturesrsquo Okagua Anochie
and Akani71 on the other hand reported higher mean BP among rural adolescents than
their urban counter parts in Port Harcourt The authors could not identify the reason(s) for
their finding but concluded that the seemingly protective privilege of rural life may be
fading gradually The differences in the reports could however result from the sample size
composition comprising of preadolescents22 adolescents71 and adults69
Race - Higher BP levels have been reported in African-American and Hispanic school-
age children than their Caucasian counterparts and among African-Americans than the
Hispanics7273 Akinkugbe and Ojo70 demonstrated a consistently high systolic and
diastolic BP in Nigerian children compared with black and white American children of
similar age Exposure to chronic environmental stress low socioeconomic status and high
obesity rate among African American and Hispanic youths could contribute to higher
BP72-74 It can be inferred from the study that race alone may not be responsible for the
observed differences but shared environmental factors and socioeconomic status may be
contributory77 Other studies7475 however found no significant BP differences in relation
to race
Anthropometry and blood pressure (BP) - A positive correlation has been observed
between BP and anthropometry in various studies58-5977 These studies585678 observed a
significant correlation between systolic BP and weight height and body mass index
(BMI) in boys but only with weight in girls Body mass index (BMI) is used as a
measure of overall obesity but it is known to be a poor indicator of actual body fat79
Waist circumference (WC) is an aggregate measurement of the actual amount of total and
24
abdominal fat accumulation80 It is therefore a better predictor of BP and other
cardiovascular diseases8081 Guagnano Ballone and Colagrande et al81 studied the
relationship between BP and BMI WC and waist hip ratio (WHR) in 461 people and
found WC to be the most consistent anthropometry affecting BP It is of interest to note
that the study by Guagnano et al81 was in adults population while the other studies56-59
were in children and adolescents WC was also found to be a better predictor of BP in an
Italian study8081 while it was not in others56-6982 Comparing BMI and waist
circumference and their effects on BP Arauzo Lopes and Moriera et al83 in Brazilian
children found BMI to be a better predictor of BP than waist circumference This was
similar to the study by Sebanjo and Oshikoya82 in Nigerian adolescents in Akure Thus
waist circumference measurements may not be useful in the evaluation of obesity andor
hypertension in children and adolescents This may partly be explained by the uniform fat
distribution due to hormonal effect at puberty in adolescents compared to the
disproportionate fat distribution in adults Possible mechanisms for the positive
relationship between BP and high BMI includes decreased physical activity increased
salt intake impaired pulmonary functions and development of metabolic abnormalities
such as dyslipidaemia and insulin resistance8084
Nutritional factors - Diet has been a primary link between humans and their environment
and substantial evidence supports the concept that multiple dietary factors affect BP85
Well-established dietary modifications that lower BP are reduced salt intake increased
potassium intake increased protein particularly plant protein high vegetable and
polyunsaturated fats85 High sodium intake on the other hand is said to be associated with
elevated blood pressure86 A series of 3 large controlled feeding studies tested the effects
of dietary patterns on BP86-89 Of the 3 diets studied the dietary approach to stop
hypertension (DASH) emphasized fruits vegetables low-fat dairy products whole
25
grains poultry fish nuts potassium magnesium calcium and fibre as the most effective
diet89 Among all participants the DASH diet significantly lowered mean systolic BP by
55 mm Hg and mean diastolic BP by 30 mm Hg each net of changes in the control diet
DEFINITION AND CLASSIFICATION OF ADOLESCENCE
Adolescence is the transitional stage between childhood and adulthood during which many
life patterns are learnt and established90 According to World Health Organization (WHO)
adolescents are individuals between the age range of 10-19 years17 The most significant
feature of adolescence is puberty characterized by an exceptionally rapid rate of biological
growth and development including physical and sexual maturation9091 The pubertal changes
have been described by Tanner and Marshal92 and are grouped into five stages This utilizes
definite criteria for growth and development of secondary sexual characteristics like pubic
hair and breast in females and pubic hair and genitalia in males9092 The timing of these
events and the rate of growth vary due to genetic and environmental factors in different
populations92 Adolescence is divided into early middle and late periods17
Early adolescence (10-13 years) ndash This is a period of rapid growth and development of
secondary sexual characteristics and varies according to sex It corresponds to Tanner stages
1 and 290 The main features of this stage are breast bud development and menarche in girls
while testicular enlargement and seminal emission occurs in boys93
Middle adolescence (14-16 years) ndash In this stage rapid growth decreases and there is more
cognitive development as the adolescents move from concrete thinking to formal operation
and develop greater competence at abstract thinking91 This corresponds to Tanner stages 3
and 4
Late adolescence (17-19 years) ndash Here slowing of physical changes continue which permits
the emergence of a more stable body image Cognition tends to be less self-centered with
26
demonstration of care for others with increasing thought about concepts such as justice
patriotism and history It corresponds to Tanner stage 59092
ADOLESCENCE AND BLOOD PRESSURE
Adolescence is characteristically associated with increasing blood pressure because of the
physical growth and hormonal changes associated with puberty5794 After the age of one year
normal BP increases more during puberty than probably at any other time in an individualrsquos
lifetime95 Wanzhu Eckert and Saha et al57 examined data from a cohort of 182 normotensive
children in Indiana who had blood pressure measurements taken semi-annually for up to 12
yr The authors found that the rate of change in BP and weight peaked at the age of maximum
pubertal growth spurt (PGS) This BP spurt roughly coincides with growth spurt during
puberty94 Surveys of BP patterns from childhood through adolescence shows systolic and
diastolic pressures increase with age and in adolescents the increase in males is more marked
than in females especially the systolic pressure5458229495
CLASSIFICATION OF BLOOD PRESSURE IN ADOLESCENTS
The National High Blood Pressure Education Program Working Group (NHBPEPWG) of the
United States established guidelines for the definition of normal and elevated blood pressures
in children in 19876 These guidelines were revised in 20048 The definition of childhood
hypertension in the guidelines are based upon the normative distribution of blood pressure
(BP) in healthy children rather than clinical outcome data as in adults The guidelines
classified BP as normal prehypertensive or hypertensive Hypertension is graded into stage
one and two8
Normal BP - Blood pressure lt90th percentile for age sex and height Children and
adolescents with normal BP should be followed annually from the age of 3 years5 They
27
should be encouraged to maintain a healthy life style such as good dietary intake physical
activities and adequate rest8
Pre-hypertension - Blood pressure between the 90th and lt 95th or if BP exceeds
12080mmHg (even if lt90th percentile) but lt95th It was previously called high normal
BP This new description was introduced to help identify children at risk for the
development of persistent hypertension for whom targeted prevention programmes would
be most beneficial96 While recommendations for the diagnosis of hypertension in
children require that BP remains elevated on three separate occasions repeated
measurements are not necessary to classify an adolescent as pre-hypertensive11 The
prevalence of childhoodadolescence pre-hypertension in US is reported to be between
12-1796-98 In Nigeria Ejeke Ugwu and Ezeanyika99 in a study of the prevalence of
point prehypertension and hypertension in 843 adolescents in Lokoja reported a
prevalence of point prehypertension of 222 and 250 in semi urban and urban
communities respectively Ujunwa Ikefuna and Nwokocha et al100 reported 175
prehypertension prevalence among adolescents in Enugu Among adults with pre-
hypertension it is reported that as much as 10 per year develop hypertension101 There
is little information on the time course for children and adolescents with prehypertension
developing hypertension A value of between 11-7 per year has been reported in US
adolescents98 There is no known study on rate of progression of prehypertension to
hypertension in Nigerian adolescents The NHBPEP recommended that children with
pre-hypertension should have their BP checked after every six (6) months to monitor for
progression to hypertension They should be encouraged to engage in physical activity
healthy dietary behaviours and weight management if overweight Pharmacologic therapy
is not indicated except if there is strong evidence of renal disease heart failure left
ventricular hypertrophy or diabetes mellitus8
28
Hypertension Hypertension is BP persistently equal to or above the 95th percentile for
age sex and height measured on three or more separate occasions If the blood pressure
measurement obtained is gt 95th percentile the degree of hypertension should be staged
Stage 1 hypertension- BP value between the 95th and the 99th percentile plus 5mmHg It
is recommended that BP should be rechecked in 1ndash2 wks or sooner if the patient is
symptomatic If persistently elevated on 2 additional occasions it should be evaluated or
referred to source of care for pharmacologic treatment within 1 month 8
Stage 2 hypertension- BP value gt99th percentile plus 5mmHg This stage calls for more
prompt evaluation and commencement of pharmacologic therapy102 It is recommended
that the individual be evaluated or referred to source of care within 1wk or immediately if
the patient is symptomatic8
Aetiology of hypertension
Hypertension is classified as primary (essential) when there is no identifiable cause
or secondary if due to an underlying disease31 Factors such as heredity diet stress drugs and
obesity play a role in the development of essential hypertension103104 Causes of secondary
hypertension include umbilical artery catheterization renal diseases coarctation of the aorta
and endocrine disorders105106 Aderele and Sereki6 in their study of hypertension in children
reported hypertension secondary to renal pathology as the commonest cause of elevated BP
in children This study was mainly in preadolescent population in which secondary
hypertension is a common finding On the other hand Antia-Obong and Antia-Obong107
reported no apparent cause in greater than 90 of the studied subjects with elevated BP and
also reported proteinuria of 1 in the same population without any associated elevated blood
pressure The study did not however evaluate the etiology of the proteinuria A study65 of BP
in teenagers in Kano found family history of hypertension a risk factor in the study
population Another study in Enugu100 examined modifiable risk factors associated with
29
hypertension in 2694 adolescents and found only 1 and 06 of the hypertensive subjects
to be overweight and obese respectively The authors also found that smoking and alcohol
consumption were not significant risk for hypertension This may however be due to the
shorter period of consumption of these products by the students as a cumulative effect from
long term consumption is known to be associated with adverse health outcomes
Prevalence of hypertension in adolescents
The prevalence of hypertension in adolescents varies widely due to arbitrary and imprecise
definition by different researchers It was in view of this that the National High Blood
Pressure Education Program Working Group (NHBPEPWG) of the United States established
guidelines for the definition of normal and elevated blood pressures in children and
adolescents for uniformity68 In the USA the prevalence is about 20 in normal weight and
50 in their obese counterparts108 A prevalence rate of 77109 10554 and 223110 has
been reported in Spain Lebanon and South Africa respectively In Kano Nigeria a study65
on the prevalence of hypertension among 1000 teenagers found a prevalence of 72 Similar
study in Enugu100 on the prevalence of hypertension among 2694 secondary school
adolescents reported a hypertension prevalence of 54 It is of interest to note that different
prevalence was reported because of the different methodology used by the authors While the
study in Kano65 applied the adult blood pressure criterion of BP greater than 14090mmHg as
hypertension the study in Enugu100 used blood pressure greater than 95th percentile for age
and sex Also the study in Kano65 took a single set of measurement while the study100 in
Enugu measured blood pressure of the subject three times at weekly intervals Bugaje
Yakubu and Ogala21 on the other hand defined hypertension as blood pressure greater than
two standard deviations from the mean and also took six readings over thirty minutes and got
a prevalence of hypertension of 34 A prevalence rate of 48107 and 9522 in Southern
and Western region of the Nigeria respectively was also reported It is obvious that because
30
of the various defining criteria for hypertension in adolescents the prevalence of adolescent
hypertension remains imprecise
Clinical presentation- Hypertension is usually asymptomatic unless it has been
sustained or is rising rapidly109 Adolescents with essential hypertension are usually
detected during routine evaluation96 Non-specific symptoms such as lethargy headache
dizziness drowsiness visual disturbance and confusion may be present109 These could
also be signs of complications111 Secondary hypertension may show obvious features of
the underlying disease such as growth failure heat intolerance abdominal stria tremors
body swelling and haematuria8102 Croix and Feig112 studied the spectrum of symptoms in
409 children aged 7-18 years newly diagnosed hypertensive in Texas USA and reported
15 common symptoms than in the controls The symptoms were said to resolve after
commencement of antihypertensive medications The authors concluded that hypertensive
children had a variety of non-specific symptoms The three most common symptoms
reported were headache daytime tiredness and difficulty initiating sleep The study
however did not specify if other possible causes of these symptoms were excluded
Complications of hypertension - Hypertension is usually asymptomatic in adolescents
which if left unidentified overtime can cause serious complications109 Organs commonly
affected in the complication of hypertension are the heart kidneys brain and the eyes
leading to lowered life expectancy and premature death13 Left ventricular hypertrophy
(LVH) is the most prominent clinical evidence of end organ damage10 Studies have
shown that LVH can be seen in as many as 41 of patients even in adolescents with
asymptomatic hypertension10103 Adolescents with severe cases of hypertension are also
at increased risk of developing hypertensive encephalopathy seizures cerebrovascular
accidents and congestive heart failure103109 However data documenting such
complications in children and adolescents are generally lacking In a study of
31
hypertension among teenagers in Kano the researchers65 could not find any
complications in all the 1000 teenagers studied
Investigations and treatment- Basic investigations are all that may be required in
adolescents who are obese and with a family history of hypertension stage 1 disease and
normal findings on physical examination113 This is because primary hypertension is
commoner in adolescents Adolescents that are symptomatic or with stage 2 hypertension or
have features of secondary hypertension should be evaluated in more detail
Treatment of hypertension includes non-pharmacological and pharmacological
methods Non-pharmacologic management involves life style modification such as weight
reduction increased physical activities and dietary adjustment114 In a study to evaluate the
effect of diet and salt on treatment and prevention of hypertension Sacks Svetkey and
Vollmer et al86 reported the beneficial effect of both reduced salt intake and appropriate
dietary adjustment in the control of hypertension Similar benefits were reported in other
studies8788 Although both studies had fairly good sample size (n=412) the studies did not
specify if participants were on other substances or activities other than antihypertensive that
might have affected their BP The studies were also in adults and whether it has the same
effects in children and adolescents has not been evaluation However there is no doubt that
the outcome will be similar in adolescents as dietary modifications have been advocated as
non-pharmacologic management in them Non pharmacologic treatment is usually the initial
treatment in essential hypertension and as adjuvant to drug therapy in those with secondary or
complicated hypertension101114 Pharmacologic (drug) treatment includes diuretics beta-
blockers calcium channel blockers angiotensin converting enzyme inhibitors (ACEIs) and
angiotensin receptor blockers (ARB) among others106114 They are used in those with
symptomatic disease and in acute or chronic complications106
32
Prevention of hypertension may be viewed as part of the prevention of cardiovascular
disease102 In adolescents approaches to prevention include reduction in obesity
discouraging cigarette smoking and alcohol intake113 reduction in sodium intake and increase
in physical activity through community and school-based programmes103104 Growth
monitoring BP check during preventive care visit physical activity and urine screening for
proteinuria and haematuria can be used starting from early childhood
33
AIM AND OBJECTIVES
GENERAL AIM
To determine the blood pressure pattern of apparently healthy secondary school adolescents
in Jalingo Taraba State
SPECIFIC OBJECTIVES
To determine
1 Blood pressure pattern in relation to age and sex among adolescents aged 10-19
years
2 The relationship if any between blood pressure and the anthropometric parameters of
weight height BMI and waist circumference
3 The association between blood pressure and parental social-economic status
4 The point prevalence of prehypertension and hypertension in adolescents
34
MATERIALS AND METHODS
Study area
A cross-sectional survey of the blood pressure pattern of apparently healthy secondary
school adolescents aged 10-19 years was conducted in Jalingo over a six month period
from January to June 2014 Jalingo is the capital of Taraba State and lies within the
savannah belt of North Eastern Nigeria It lies between latitude 80 54rsquo north and longitude
110 21rsquo east and at an altitude of 360 meters above sea level115 Jalingo had a population of
118198 people18 The primary inhabitants are the Konas Mumuyes and Fulanis who are
mostly farmers Other indigenous ethnic groups include the Jukun Kuteb WurkumTiv
and host of other tribes The Ibos Hausas Yorubas among others are the non-indigenous
ethnic groups and are mostly civil servants and businessmen Jalingo has a tertiary health
centre the Federal Medical Centre Jalingo and the state specialist hospital It also has 15
private clinicshospital and many primary health care centres There are also tertiary
education institutions including Taraba State University As at 2013 there were 56
secondary schools in Jalingo 24 public and 32 private all of which were mixed schools
except one which is a girlsrsquo only school
Study design
The study was a cross sectional descriptive study of 1350 apparently healthy secondary
school adolescents in Jalingo
Ethical approval
Ethical approval for this study was obtained from the Scientific and Health Ethics Research
Committee of Ahmadu Bello University Teaching Hospital Zaria (Appendix 4) The Taraba
State Ministry of Education also gave the approval and permission to conduct the study in the
35
selected schools Consent was given by the studentsrsquo parents or guardian (Appendix 2) All
students whose parents gave consent voluntarily participated in the study
Sample size determination
The minimum sample size was calculated using the formula116
N=Z2 (pq) E2
Where N = minimum sample size
p = Prevalence of hypertension in adolescents A prevalence of 3421 was used
q = 1- p
E = margin of error tolerated =1
Z = 196 at 95 confidence level
N = 1962 x 0034 x (1-0034) 0012 = 1262
Therefore the minimum sample size was one thousand two hundred and sixty two
Allowance for non-responders of 5 63 extra subjects were added to the calculated
minimum sample size bringing the total to 1325 students To enhance representativeness of
the sample and to compensate for missing information and poorly filled proforma while
maintaining the sample size a total of 1350 was decided upon
Inclusion criteria
1 Students (ages 10-19 years) in the selected secondary schools
2 Students whose parents gave consent to participate in the study
3 Students who gave assent to participate in the study
Exclusion criteria
1 Students who had obvious skeletal deformities of the spine and legs which can affect
the height and ultimately the BMI
36
2 Students with known chronic disease (or history of such disease) like anaemia
chronic renal disease and cardiac disease because they are not apparently healthy and
these conditions could affect their blood pressure
3 Students with present or past history of chronic drug ingestion that can affect blood
pressure such as steriods and contraceptives
4 Students with high blood pressure already on antihypertensive
Pilot study
A pilot study was carried out in one of the schools a week before the commencement of
the study The school was selected by random sampling method using balloting and did
not participate in the main study The pilot study was carried out with the aim of
assessing the competence of the research assistants in the various measurements
following their training to ensure reliability It was also used to test the questionnaire
before its use during the main study and to provide information on the number of students
that can be measured in a day Consequently twenty students had their blood pressure
and anthropometry measured independently by the researcher and the research assistants
and data were compared using Students t-test There were no statistically significant
differences between the measurements The result of the pilot study is highlighted in
Table I It was also found that some parts of the questionnaire were not well understood
by most students and were adjusted appropriately in the main study (Appendix 1) The 20
students had their measurements done over a period of 3-4 hours (between 8am - 12noon)
by the researcher and the research assistants
Table I Result of pilot study
Variables Researcher Research t p
37
assistants
Mean(plusmnSD) SBP
mmHg
106(11) 104(12) 0550 0586
Mean(plusmnSD) DBP
mmHg
617(83) 63(10) 0450 0657
Mean(plusmnSD) Weight
kg
544(82) 527(122) 0520 0608
Mean(plusmnSD) Height m 16(01) 16(01) 0000 1000
Mean(plusmnSD) BMI
kgm2
198(36) 202(33) 0370 0716
Mean(plusmnSD) WC cm 692(72) 682(133) 0300 0769
Sampling method
Students were selected by multistage random sampling technique The list of secondary
schools obtained from the Taraba State Post Primary Schools Board served as the sampling
frame for schools There were 56 secondary schools 24 of which were public and 32 were
private schools a ratio of 113 Ten (10) schools were randomly selected by balloting four
(4) from public schools six (6) from private based on the number and approximately similar
ratio of private to public schools of 115 (46) Ten schools were selected to ensure wider
coverage and even distribution of students so that it could be truly representative of the
community All the ten schools had an overall total of eight thousand one hundred and seven
(8107) students The public schools had a total of five thousand nine hundred and forty
(5940) with nine hundred and eighty nine (989) students participating The private schools
had a total of two thousand one hundred and sixty-seven (2167) students with three hundred
and sixty one (361) participating These number (989 and 361) was calculated based on the
38
relative population of each school and proportionate to number of students in each school
Thereafter the number of students to participate per school was calculated proportionately to
the number of students in each school based on the number given by the school authority
Then the number in each class was also calculated proportionately from JSS1 to SS3 to
ensure fair and equal chance of participation for all age groups The calculation was done
thus n= a b x c
Where n= number of students per selected school
a= total numberpopulation of students in the school
b= total numberpopulation of students in all 10 selected schools (8107)
c= calculated total sample size (1350)
Students in each class from junior secondary school (JSS) 1-3 and senior secondary school
(SS) 1-3 were then randomly selected by balloting The number of selected schools total
number of students in a school and the number of students selected per school is outlined in
Table II
Table II Selected schools and number of students in each of the ten schools in Jalingo
Selected schools Total no of No of students
39
student in the
school (a)
n=8107
selected (n=abxc)
n=1350
Public schools
Govt Science Secondary School 2800 466
Govt Day Secondary School SGari 1200 200
Salisu Dogo Secondary School 1100 183
Govt Secondary School Magami 840 140
Total 5940 989
Private schools
Winners Comprehensive Secondary School 650 108
Hawai Secondary School 562 94
Centre for Quranic Science and Islamic Education 543 90
Good Success Secondary School 155 26
Jetters Academy 140 23
Yagai Academy 117 20
Total 2167 361
The study
The first contact with the students was a familiarization exercise to each of the schools during
which the teachers and students were given a talk by the researcher on blood pressure and the
40
importance of periodic blood pressure measurement They were given the opportunity to ask
questions which were responded to Both the students and their teachers actively participated
in the lectures
On the second day students were selected as described above and those selected
underwent general physical examination in the presence of a chaperon to identify those
who did not fulfilled the inclusion criteria Each selected student was given a proforma
(Appendix 1) in which information on their biodata and medical history were recorded
Other information obtained was parentrsquos medical history and their socioeconomic status
using the format described by Olusanya Okpere and Ezimokhai117 (Appendix 3) The
study was carried out in a relatively quiet and empty classroom to ensure privacy for both
male and female students The procedure for blood pressure measurement was
demonstrated on one of the research assistants and sometimes on one of the teachers by
the researcher to assure the students and allay their anxiety BP and anthropometric values
obtained were recorded in the study proforma An average of 15-20 students per day were
attended to over a period of 3-4 hours (between 8am - 12noon daily) by the researcher
one of the research assistants who is a medical officer a male nurse and a lady Youth
Corper (NYSC)
Blood pressure measurement
This was measured by the researcher and the research assistant (the medical officer) The
standard auscultation method was employed using a mercury sphygmomanometer (Acosson)
and a standard Littman stethoscope according to the guideline of the fourth report on the
diagnosis evaluation and treatment of hypertension in children and adolescents8 Each
students was rest-seated for 5 minutes before BP measurement With the student seated the
right arm rested on a table at the level of the heart an appropriate cuff size which covered
41
two-third (23rd) of the length of the arm was applied round the arm about 2cm above the
antecubital fossa Two cuff sizes were used for this study with dimensions of 10 x 24cm and
13 x 30cm the smaller cuff for the smaller adolescents and vice versa The bladder cuff was
inflated rapidly to 20-30mmHg above the point where the brachial artery was no longer
palpable The bell of the stethoscope was then placed over the brachial artery and the cuff
was deflated slowly at 2-5mmHgsecond while listening to the Korotkoff sounds Phases one
and five of the Korotkoff sounds were recorded as the systolic and diastolic BP
respectively119 Three recordings were taken at intervals of 3-5 minutes and the average was
the final BP in mmHg BP was interpreted based on the standard set by the fourth report on
the diagnosis evaluation and treatment of hypertension in children and adolescents of the
United States8 thus-
Normal BP ndash BP value between the 5th and lt 90th percentile for age sex and height
Prehypertension - BP value between the 90th and the lt95th percentile for age sex and height
or BP of 12080mmHg but less than the 95th percentile
Hypertension ndash BP value ge95th percentile for age sex and height
Students found to have prehypertension were educated and counseled on life style
modifications and the need to have their blood pressure checked in six monthsrsquo time and
annually subsequently Those with hypertension were educated on the implications of the
findings and were referred to the Federal Medical Center Jalingo for evaluation management
and follow-up
Height measurement
Height was measured in centimeters using a locally constructed stadiometer by the research
assistants Each student was measured barefooted standing with the heel back and occiput
42
against the stadiometre The head was held straight looking forward with the lower border of
the eye socket at a horizontal plane with that of the external auditory meatus The movable
part of the stadiometre was adjusted to rest on the vertex and the corresponding value read to
the nearest 01cm
Weight measurement
The weight was measured in kilograms by the researcher and the research assistants using a
bathroom scale (HANSON) Students were weighed in their approved school uniform
without caps head ties or cardigan and with their shoes removed The scale was checked
daily for accuracy using standard calibrated weight before and midway through each session
The weight of the student was measured to the nearest 01 kg
Body mass index (BMI)
This was calculated from the measured weight and height of the subject using the
formula118
BMI= Weight (kg) Height (m2)
Waist circumference measurement
WC was measured in centimeters using a measuring tape by the research assistants The
male assistant measured for boys and the lady Youth Corper measured for girls
Measurement was taken with the student standing completely relax and breathing
normally Clothing was pulled up or down and an inelastic measuring tape was placed
around the waist mid-way between the iliac crest and the lowest rib margin The ends of
the tape were pulled together lightly towards each other and the value read to the nearest
01cm117120
43
Data analysis
Data obtained were analyzed using Epi-Info statistical software package version 7 The
results obtained were presented in figures tables graphs and charts as appropriate Individual
mean BP levels were used as dependent variables and other measured variables as
independent variables The means and standard deviations were used to summarize
quantitative variables such as BP weight height waist circumference and BMI The chi-
squared test was used to test the significance of associations between categorical variables
Studentrsquos t-test was used to compare means of any two normally distributed continuous
variables Pearsonrsquos correlation coefficient and regression analysis were used to examine the
strength of association between BP and the anthropometries Probability level of statistical
significance value was set at lt005
RESULTS
General characteristics
A total of 1350 students were enrolled between January and June 2014 to determine their
blood pressure pattern 628 (465) were males and 722 (535) were females with
malefemale ratio of 111 Students enrolled in the study were drawn from both public and
44
private schools The number of students from public schools was 989 (733) while 361
(267) were from private schools as shown in Table II The mean age of the study subjects
was 153plusmn22 years with a range of 10-19 years The age and sex distribution of the students
is illustrated in Table III
Table III Age and sex distribution of 1350 study subjects in Jalingo
Ag
e
Male
n ()
Female
n ()
Total
N()
10 9(14) 13(18) 22 (16)
11 20(32) 31(43) 51(38)
12 36(57) 52(72) 88(65)
13 96(153) 85(118) 181(134)
14 92(146) 115(158) 207(153)
15 92(146) 111(154) 203(151)
16 66(105) 116(161) 182(135)
17 78(125) 91(126) 169(125)
18 79(126) 70(97) 149(110)
19 60(96) 38(53) 98(73)
To
tal
628(100) 722(100) 1350(100)
45
Socio-economic classes (SEC) ndash Most of the students were from the lower social classes
(4 and 5) with population of 650 (415 and 235) students The upper social classes (1 and
2) had the least population with 184 (62 and122) students The middle social class (3) had
516 students The distribution of the study subjects according to individual
socioeconomic class is shown in Figure I
Figure 1 Socioeconomic class distribution of students in Jalingo
Anthropometry
The anthropometric characteristics of the students are displayed in Tables IV V and VI
All the anthropometric parameters showed increasing values with age (Tables V and VI)
There were significant differences in the anthropometric indices of height (p=0000)
weight (p=0010) and body mass index (p=0000) between boys and girls but not
statistically significant for waist circumference (p=0145) as shown in Table IV
Weight ndash The mean weight of the students was 486plusmn109kg with a range of 23-100kg
(Table IV) Girls were heavier than boys up to middle adolescence after which males
46
were heavier than the females (Table V and VI) and this was statistically significant (t= -
256 p=0010)
Table IV Overall mean anthropometric measurements of the study subjects
Anthropometr
y
Male Female Total
n=628 n=722 N=1350 t p
Wt (kg)
Mean(plusmnSD) 4773(115
)
4926(103
)
4855(plusmn109
)
-
25
6
0007
Range 236-848 227-100 23-100
Ht (m)
Mean(plusmnSD) 159(012) 157(008) 158(plusmn010) 35
5
0000
Range 122-185 126-179 122-185
WC (cm)
Mean(plusmnSD) 6524(91) 6595(86) 6562(plusmn89) -
14
6
0145
Range 225-905 215-100 22-100
47
BMI (kgm2)
Mean(plusmnSD) 1825(27) 1947(33) 1891(plusmn31) -
74
1
0000
Range 117-325 114-42 114-42
Statistically significant p values at 005 level of significance Wt=Weight Ht=Height WC=Waist
Circumference BMI=Body Mass Index SD=Standard Deviation
Height- The mean height of the study population was 158plusmn09m and ranged from 122-
185m (Table IV) Girls were taller than boys at early and middle adolescence but these
reversed from 16 years in favour of the boys (Table V and VI) This differences was
statistically significant (t=448 p=0000)
Waist circumference (WC) - The overall mean waist circumference was 6562plusmn89cm and
a range of 225-100cm Girls had higher WC until late adolescence (18 years) when it
reversed but this was not statistically significant (t=-146 p=0145) This is displayed in
Tables IV V and VI
Body Mass Index (BMI) - Overall mean BMI was 189plusmn31 with a range of 114-42
There was a statistically significant difference between girls and boys (t=-741 p=0000)
Tables IV V and VI illustrate this findings
Table V Mean anthropometric measurements of 628 boys
Age No of
studen
ts
Wt(plusmnSD)
Kg
Ht(plusmnSD)
m
WC(plusmnSD)
cm
BMI(plusmnSD)
Kgm2)
48
10 9 349(50) 143(001
)
613(06) 169(01)
11 20 354(25) 143(002
)
617(13) 170(07)
12 36 363(51) 146(002
)
616(14) 167(06)
13 96 379(51) 150(003
)
602(40) 165(08)
14 92 412(50) 154(003
)
623(32) 169(08)
15 92 471(60) 160(003
)
634(39) 178(08)
16 66 525(52) 164(002
)
672(24) 192(09)
17 78 555(51) 167(002
)
680(31) 197(08)
18 79 576(61) 169(002
)
707(18) 200(08)
19 60 590(57) 170(002
)
716(16) 203(07)
Total 628 477(115 16(01) 652(91) 183(27)
49
)
Wt=Weight Ht=Height WC=Waist Circumference BMI=Body Mass Index SD=Standard Deviation
Table VI Mean anthropometric measurements of 722 girls
Age No of
students
Wt(plusmnSD)
Kg
Ht(plusmnSD)
m
WC(plusmnSD)
cm
BMI(plusmnSD)
Kgm2
10 13 313(34) 139(001) 582(05) 156(02)
11 31 361(53) 144(002) 611(12) 170(05)
12 52 403(64) 149(002) 625(21) 178(09)
13 85 458(66) 154(002) 657(22) 188(12)
14 115 478(74) 157(003) 627(48) 187(10)
15 111 508(65) 159(002) 666(34) 199(13)
16 116 521(60) 159(002) 678(28) 201(11)
17 91 541(62) 161(002) 681(28) 203(11)
18 70 556(63) 161(002) 696(21) 211(11)
19 38 540(48) 158(002) 688(14) 208(06)
Total 722 493(103) 16(010) 651(23) 190(09)
Wt=Weight Ht=Height WC=Waist circumference BMI=Body Mass Index SD=Standard Deviation
Blood pressure (BP) measurements
50
Table VII shows mean blood pressure distribution of the study population for all ages
The highest SBP and DBP were 165mmHg and 95mmHg at 18years and 15 years
respectively Table VIII displays mean BP distribution in relation to age and sex The
tables show that both systolic and diastolic blood pressure increased with age This is also
depicted in Figure 2
Table VII Mean and ranges of blood pressure of 1350 subjects
Systolic Blood Pressure
(mmHg)
Diastolic Blood Pressure
(mmHg)
Age
No of
students
Mean(plusmnSD) Range
Mean(plusmnSD) Range
10 22 936(74) 80-107 600(50) 47-70
11 51 992(106) 76-120 629(71) 47-83
12 88 1036(110) 80-140 657(60) 53-82
13 181 1042(108) 80-143 660(74) 48-88
14 207 1070(115) 83-150 675(76) 47-90
15 203 1090(119) 80-150 678(82) 47-95
16 182 1122(124) 80-150 696(80) 50-90
51
17 169 1132(118) 90-153 698(83) 48-93
18 149 1138(121) 90-165 712(88) 50-90
19 98 1131(127) 90-143 726(76) 57-90
Total 1350 1089(125) 76-165 683(82) 47-95
Table VIII Mean blood pressure in relation to age and sex
Mean(plusmnSD) Systolic blood pressure
(mmHg)
Mean(plusmnSD) Diastolic blood
pressure (mmHg)
A
ge
Male
n=628
Female
n=722
t p Male
n=62
8
Fema
le
n=72
2
t p
52
10 954(3
9)
923(6
0)
1
02
03
20
619(
32)
586(
46)
1
36
0
01
91
11 985(5
5)
997(9
2)
0
42
0
06
80
648(
39)
617(
57)
1
56
0
01
26
12 999(8
9)
1062(
117)
2
84
0
00
06
653(
29)
660(
52)
-
0
52
0
06
07
13 1012(
73)
1075(
73)
4
03
4
00
00
649(
43)
672(
59)
-
0
03
0
00
44
14 1036(
78)
1098(
78)
3
93
0
00
01
653(
44)
693(
58)
3
90
0
00
01
15 1071(
80)
1105(
87)
2
05
0
00
42
665(
58)
689(
56)
-
2
10
0
00
37
16 1135(
82)
1114(
91)
1
03
0
03
10
697(
51)
695(
61)
0
15
0
08
81
53
17 1152(
87)
1115(
77)
2
04
00
43
698(
59)
698(
58)
0
02
0
09
81
18 1141(
96)
1135(
74)
0
27
0
07
91
704(
62)
721(
63)
1
61
0
02
49
19 1146(
97)
1108(
80)
1
41
0
01
64
733(
63)
714(
43)
1
21
0
02
28
To
tal
1081(
133)
1095(
117)
-
2
05
4
00
40
678(
81)
687(
82)
-
2
07
7
00
38
Statistically significant p values at 005 levels of significance
54
Figure 2 Blood pressure distribution in relation to age and sex
SBP =Systolic blood pressure DBP=Diastolic blood pressure
Blood pressure and stages of adolescence
Table IX displays mean blood pressure according to stages of adolescence Girls had a
higher mean SBP than boys from early adolescence (t=3754 p=0000) to middle
adolescence (t=-3025 p=0003) and this was statistically significant This dominance was
also demonstrated in the DBP and was statistically significant in middle adolescence (t=-
3517 plt0000) Adolescents from private schools had higher mean SBP (t=-222
plt0027) and mean DBP (t=-461 p=0000) than those from public schools and these
differences were statistically significant
Table IX Mean blood pressure according to sex and stages of adolescence
Mean BP
(mmHg)
Age (years)
Male SBP
Female SBP
Male DBP
Female DBP
55
Stages
of
adolesc
ents
(years)
Mean(plusmnSD) systolic blood pressure
(mmHg)
Mean(plusmnSD) diastolic blood pressure
(mmHg)
Male Female t p Male Fema
le
t p
Early
(10-13)
1000(9
6)
1040(1
18)
37
54
00
00
648(
56)
653(
82)
05
99
05
50
Middle
(14-16)
1075(1
29)
1105(1
13)
-
30
25
00
03
670(
81)
694(
77)
-
35
17
00
00
Late
(17-19)
1140(1
28)
1121(1
11)
21
45
00
33
717(
85)
710(
83)
00
70
09
45
1082(1
33)
1092(1
17)
-
20
54
00
40
678(
81)
687(
82)
-
20
77
00
38
Statistically significant p values at 005 level of significance SD=Standard Deviation
Table X shows blood pressure pattern according to stages of adolescence
Prehypertension and hypertension were more prevalent in late adolescence than early and
middle adolescence (χ2=49054 p=0000) and (χ2=10305 p=0006) both of which were
statistically significant
Table X The pattern of normal BP Prehypertension and hypertension according to stages
of adolescence
56
Blood
pressure
pattern
Stages of adolescence
Early
n()
Middle
n()
Late
n()
Total
N()
χ2 p
Normal 290(84
8)
428(72
3)
275(66
1)
993(73
5)
429
79
000
0
prehypertens
ion
43(12
6)
135(22
8)
120(28
8)
298(22
1)
490
54
000
0
Hypertensio
n
9(26) 29(49) 21(51) 59(44) 103
05
000
6
342(10
0)
592(10
0)
416(10
0)
1350(1
00)
350
93
000
0
Statistically significant p value at 005 level of significance
Relationship between blood pressure and the measured anthropometry
There was a positive correlation between SBP and DBP with age and the anthropometric
variables of weight height waist circumference and BMI (Table XI) SBP showed a
stronger correlation with the anthropometries than the DBP and was stronger for weight
(r=051) and height (r=044) The waist circumference though statistically significant
showed the weakest correlation
Table XI Correlation between blood pressure age (yrs) and anthropometry
Parameters
Systolic Blood Pressure Diastolic Blood Pressure
Correlation
coefficient
p Correlation
coefficient
p
57
Age (yrs) 035 lt0000 030 lt0000
Height (m) 044 lt0000 034 lt0000
Weight (Kg) 051 lt0000 038 lt0000
WC (cm) 040 lt0000 029 lt0000
BMI
(Kgm2)
031 lt0000 023 lt0000
Statistically significant p values at 005 level of significance Wt=Weight Ht=Height WC=Waist
circumference BMI=Body Mass Index
Blood pressure distribution and socio-economic classes
Table XII shows mean blood pressure according to socio-economic class of the subjects
Lower social classes had higher mean SBP (t=1650 p=2850) and DBP (t=0193
p=00058) but these were not statistically significant
Table XII Mean Blood pressure in relation to socioeconomic classes
Blood
pressur
e
Socioeconomic classes
Upper (1 amp
2) n=184
Middle (3)
n=516
Lower (4 amp
5)
n=650
f(anova
)
p
Mean
(SD)
10857(126
)
10866(128
)
11040(109
)
1650 285
0
58
SBP
Mean
(DBP)
6820(83) 6791(83) 6957(76) 0193 005
8
SEC= Socioeconomic class SBP=Systolic Blood Pressure DBP=Diastolic Blood Pressure SD=Standard
Deviation
Table XIII shows blood pressure pattern in relation to socioeconomic classes of the
subjects The percentage of students with prehypertension was higher in the upper social
class ((χ2=3067 p=0216) while the percentage of hypertension were higher in the lower
socioeconomic classes (χ2=1037 p=0568) but these differences were not statistically
significant
Table XIII Blood pressure pattern in relation to socioeconomic status
Blood
pressure
pattern
Socioeconomic classes
Upper
(1 amp 2)
n()
Middle
(3)
n()
Lower
(4 amp 5)
n()
Total
N()
χ2 p
Normal 127(69
)
383(74
2)
483(74
3)
993(73
6)
417
6
012
4
Prehypertens
ion
52(28
3)
108(20
9)
138(21
2)
298(22
1)
306
7
021
6
Hypertension 5(27) 25(48) 29(45) 59(44) 103 056
59
7 8
184(10
0)
516(10
0)
650(10
0)
1350(10
0)
573
0
022
0
Prevalence of Hypertension and Prehypertension
Table XIV shows the prevalence of hypertension in the study population The total
number of students with hypertension was 59 giving an overall prevalence of 44
Thirty four students (25) had systolic hypertension sixteen (12) had diastolic
hypertension and nine students (07) had both systolic and diastolic hypertension
Systolic hypertension was more prevalent in the females and was more at the age of 16
years while diastolic hypertension was higher in males and this also occurred at 16 years
Among those with hypertension 27 and 16 subjects had stage 1 and 2 systolic
hypertension respectively With regard to diastolic hypertension 24 and 1 subjects had
stage 1 and 2 hypertension respectively The gender difference in the prevalence of
hypertension is not statistically significant (χ2=0831 p=0362)
The number of students with pre-hypertension was 298 giving an overall prevalence of
221 Of this 131 were males and 167 are females This is illustrated in Table XIV
Prehypertension is more prevalent in females than males and this was statistically
significant (χ2=4349 p=0037)
60
Table XIV Overall Blood pressure pattern and prevalence of hypertension and
prehypertension of 1350 students in Jalingo
Blood pressure
pattern
Males
n=()
Females
n=()
Total
N()
χ2 p
Normal 471(750) 522(723) 993(735) 2619 0106
Prehypertension 131(209) 167(231) 298(221) 4349 0037
Hypertension 26(41) 33(46) 59(44) 0831 0362
628(100) 722(100) 1350(100) 1260 0533
statistically significant p value at 005 level of significance
61
DISCUSSION
The findings of this study showed that the BP of secondary school adolescents in Jalingo
was similar in terms of mean values range and trend of progression with age to that of
other adolescents from Ibadan63 and Kogi60 (Nigeria) Ashanti (Ghana)59 and Lebanon54
The mean value was however lower than the mean BP of adolescents from Zaria
(Nigeria)21 Belgrade ( Serbia)78 and Fortaleza-Cearaacute (Brazil)83 who had higher mean BP
in both sexes and at all ages The lower mean BP in this study compared to that of
adolescents from Zaria21 Belgrade78 and Brazil83 could be due to lower mean
anthropometry of weight height and BMI in adolescents from Jalingo resulting in lower
mean BP The sample sizes of these studies7883 were also different and could have
affected the mean BP of the study population For instance the sample size in the
Brazilian study83 is 151 compared to the study in Lebanon54 with 5710 subjects The use
of the fifth Korotkoff sounds as DBP in this study21 could also have accounted for the
lower mean BP in contrast to a similar study in Zaria21 where the fourth Korotkoff sound
was used as the DBP
A progressive increase in blood pressure with age was found in this study This
was similar to most findings by researchers in Nigeria 215358-606566107 and
worldwide54555961 The peak age of rise in BP in this study was in middle adolescence
between 15-16 years in boys but much earlier in girls for both systolic and diastolic BP
This was similar to the study by Akinkugbe Akinwolere and Kayode56 in Ibadan and
Ejeke Ugwu and Ezeanyika et al60 in Lokoja This age group is usually the period of
onset of puberty The chronologic age is not the main factor responsible for BP increase
62
with age but rather the progressive increase in size of the individual Increase in body
size with growth and maturity of organs associated with the physical and hormonal
changes during puberty potentially lead to increasing BP The simultaneous increase in
weight height and other anthropometric indices alongside BP with age seen in this study
and others is in agreement with that The implication of this increase in blood pressure
with age is that those with prehypertensionhypertension in childhood may continue into
adulthood hence further increasing the high prevalence of hypertension in the adult
population with its attendant morbidity disability and mortality
Overall significant higher mean BP was recorded in girls than boys in this study
This was seen from early to middle adolescence after which it reversed in favour of the
boys Reports on the relationship between BP and sex have been inconsistent Some have
reported higher mean BP in females54-56 others higher in males5883 while yet another
reported no sex differences22 The findings of this study were similar to those of Bugaje
Yakubu and Ogala21 and Ujunwa Ikefuna and Nwokocha100 who reported a consistently
higher mean blood pressure in female adolescents up to 16 years compared to their male
counterparts of similar ages Early female predominance in mean blood pressure was also
reports by Agyemang Redekop and Owusu-Dabo et al59 in Ashanti adolescents in Ghana
and Obika Adedoyin and Olowoyeye22 in Illorin The finding was however in contrast
with the study in Calabar58 where higher mean BP was found in boys than girls at all
ages The reason for the higher mean BP in females than boys could be because of earlier
onset of puberty in girls The differences in blood pressure between boys and girls in this
study could also be accounted for by variation in the anthropometric variables of the
individuals as girls were seen to be heavier and taller up to middle adolescence
This study demonstrated a consistently positive relationship between blood
pressure and the anthropometric variables of weight height body mass index and waist
63
circumference as widely reported in other studies 545558-6165107100 Weight is reported to
correlate positively with blood pressure in several studies53565871 Body mass index
(BMI) also showed a positive relation with BP in this study as reported in other
studies5978-81 This is in-keeping with the findings in Port Hacourt71 Abeokuta83 the
Gambia69 Brazil82 and Belgrade77 children Some of these studies however were made
up of younger and older age groups Even in lean populations BMI is known to correlate
positively with BP Waist circumference was also found in this study to correlate
positively with BP This was similar to reports from other studies79-8183 It was found to
be a better predictor of BP in two Italian study8081 while it was not in another82
Comparing BMI and waist circumference and their effects on BP Arauzo Lopes and
Moriera et al82 in Brazilian children found BMI to be a better predictor of BP than waist
circumference This was similar to the report by Sebanjo and Oshikoya83 in Nigerian
adolescents in Akure Guagnano Ballone and Colagrande et al81 however found waist
circumference to be better than BMI The study81 however involved adults and may not
be applicable in children and adolescents The present study demonstrated BMI and WC
to be significant but found BMI to be a better determinant of BP than waist
circumference BMI and waist circumference measure obesity in an individual Whereas
BMI is a measure of overall obesity WC measures centralabdominal fat accumulation
and thus said to be more predictive of adverse health risk79 Obese individuals may be
prone to such condition as dyslipidaemia insulin resistance and hypertension with
reduction in the quality of life Weight BMI and or waist circumference affects blood
pressure through decreased physical activity increased cardiac output insulin resistance
impaired pulmonary function and other hormonal abnormalities8084 It seems therefore
that BMI is a better predictor of BP in adolescents than waist circumference The reason
64
for this is not obvious but it may be because of the nature of uniform fat distribution in
adolescents associated with growth and hormonal changes at puberty
Blood pressure distribution in relation to the parental socio-economic class in this
study showed that students from low socio-economic classes had higher mean blood
pressure than those from upper socioeconomic classes but this was not statistically
significant A study in Ibadanl56 reported a statistically significant negative relation
between blood pressure and parental socio-economic status It was also similar to the
study58 in Calabar In contrast other studies found the reverse536022 The reasons for the
inverse relationship between BP and socioeconomic includes exposure to chronic
environmental stress with sustained sympathetic nervous system stimulation Others are
poor health seeking behaviours due to low income andor inadequate health knowledge
high low birth weight rate and inadequate healthy diets among others97101 In the same
environment individuals from a high social class are believed to be more educated with
high income61 They have easy access to health education and awareness on hypertension
prevention and control and better accessibility and adherence to medical treatment617374
The former might be responsible for the finding of this study as Jalingo is a semi urban
community Most of its inhabitants are subsistent farmers civil servants and traders with
low income The high number of students in the lower socioeconomic class lays credence
to that
The overall point prevalence of hypertension in this study was 44 while that of
pre-hypertension was 221 This prevalence of hypertension is similar to the prevalence
of 48 by Antia-Obong and Antia-Obong107 but higher than the prevalence rate of 37
reported in Zaria21 and lower than the prevalence of 58 reported in Ibadan56 54 in
Enugu100 and the 72 reported in Kano65 The prevalence of pre-hypertension was lower
than that reported by Ejeke Ugwu and Ezeanyika99 who found a prehypertensive
65
prevalence of 25 among adolescents in Lokoja It is higher than the 173 reported by
Ujunwa Ikefuna and Nwokocha et al100 in Enugu and 12-17 by Redwine and
Daniels96 among US adolescents The differences in the reported prevalence of
hypertension and prehypertension in adolescents could have resulted from the different
criteria applied by the various researchers in defining hypertension For instance whereas
this study used BP greater than 95th percentile as hypertension a study in Kano65 used the
adult hypertensive value of BPgt14090mmHg as hypertension and got a prevalence of
72 The prevalence in that study65 could have been higher if the percentile or the
statistical definition was used as many children with BP 14090mmHg would probably be
at stage 2 hypertension This was demonstrated in the study by Bugaje Yakubu and
Ogala21 who found a prevalence of hypertension in their study to be 06 when the adult
cut off value of gt14090mmHg was used but it increased to 37 when the statistical
definition of BPgt 2 standard deviations was used
The number of times blood pressure is taken could affect the outcome as repeated
measurements over a time interval is known to give lower BP values than if BP is taken
once This study used the average of three blood pressure values taken at one sitting but
Ujunwa Ekefuna and Nwokocha100 took three readings at five minutes interval with two
other readings at a week interval In that study100 the prevalence of prehypertension
dropped from 745 during the first set of readings to 173 after the third week
readings The prevalence of hypertension also dropped from 135 to 54 over the same
period Similar decrease in the prevalence of both prehypertension and hypertension was
reported by Redwine and Daniels96 in US adolescents when blood pressure was taken
over time interval Another factor which might have affected the overall prevalence is the
Korotkoff sound used for diastolic pressure23 The 4th or 5th Korotkoff sounds has been
used by different researchers resulting in different diastolic BP The study21 in Zaria used
66
the 4th Korotkoff sound while most other researchers2265100 used the 5th About 5-
10mmHg difference is said to exist between the 4th and 5th Korotkoff sounds230 In this
study the 5th Korotkoff sound was used thus giving a higher prevalence of hypertension
in the studied population than in those where the 4th sound was used
The implication of the outcome of this study is that 44 of adolescents in Jalingo
are already hypertensive while 221 of them are at risk of developing hypertension as
they are pre-hypertensive Since 856 (255 of 298) of the prehypertensives were in the
middle and late adolescence these individuals are likely to be adults with high blood
pressure Therefore regular screening of this group of individuals who were assumed to
be a healthy population is highly important for early detection of hypertension and
intervention such as life style changes and treatment
67
CONCLUSIONS
The following conclusions can be made from this study
1 The mean and range of blood pressure of adolescents in Jalingo was similar to
those of other adolescents in Nigeria and other parts of the world Blood pressure
increased progressively with age
2 All measured anthropometry of weight height body mass index and waist
circumference correlated positively with BP but weight was the most significant
variable in BP determination
3 Socioeconomic status was not significantly related with blood pressure
4 The point prevalence of hypertension and pre-hypertension was 44 and 221
respectively using a recommended definition
RECOMMENDATIONS
1 In view of the high prevalence of prehypertension in this study it is recommended
that students should have their blood pressure measured at school entry as this will
68
help identify those with abnormal BP for early intervention Thereafter BP check
should be offered at least once a year at the beginning of a new session especially for
those found with abnormal BP at school entry
2 Physical and health education should be revived in all the schools This will lead to
increased physical activity and reduced risk of obesity and its consequences
3 School health programmes should be strengthened in schools where it already exist
and effort made to establish same in schools where it is yet to exist The programme
should include measures to detect early prehypertension and hypertension and other
health related needs of the students
LIMITATIONS
The following limitations were encountered in the course of the study
1 Exclusion and inclusion of students that were based on volunteered information and
physical evaluation This could have led to inclusion andor exclusion of adolescentss
69
with or without background renal diseases which could have affected the result of this
study
2 Home blood pressure measurement especially early morning measurement for those
with high blood pressure to possibly eliminate the effect of stress traffic andor
trekking and other school related stresses which may affect blood pressure during the
day
LINES OF FUTURE RESEARCH
This study was questionnaire based and time bound Consequently students were not
investigated for background diseases co-mordid conditions target organ damage or risk
factors for high blood pressure They were also not followed up In view of this future
research on blood pressure in adolescents should include-
70
1 Investigations such as urinalysis electrolytes urea and creatinine random blood
sugar (RBS) lipid profile and echocardiography as part of blood pressure evaluation
in adolescents
2 A long period of study to allow for follow-up over months or years to identify those
that are truly hypertensive considering the definition of hypertension It will also
reveal the rate of progression from pre-hypertension to hypertension
3 Risk factors evaluation for high blood pressure including genetic predispositions
REFERENCES
1 Blood pressure from Wikipedia the free Error Hyperlink reference not valid
Accessed 24th November 2011
2 Pickering TG Hall JE Appel LJ Falkner BE Graves J Hill MN Jones DW Kurtz T
Sheps SG Roccella EJ Recommendations for blood pressure measurement in humans
and experimental animals Part 1 Blood pressure measurement in humans A
statement for professionals from the subcommittee of professional and public
71
education of the American Heart Association council on high blood pressure research
Hypertension 2005 45 142-61
3 da Silva IRR de Souza MDG de Camargo CAC Blood pressure measurement in
children and adolescents Guidelines of high blood pressure recommendations and
current clinical practice Arq Bras Cardiol 2007 88 434-7
4 Sinaiko AR Hypertension in children N Engl J Med 1996 3351968-73
5 US Preventive Services Task Force Screening for high blood pressure
recommendations and rationale Am J Prev Med 2003 25 159-64
6 Report of the second task force on blood pressure control in children Pediatrics 1987
79 1-25
7 National high blood pressure education programme working group on hypertension
control in children and adolescents update on the 1987 task force report on high blood
pressure in children and adolescents A working group report from the national high
blood pressure education program Pediatrics 1996 98 649-58
8 National high blood pressure education program working group on high blood
pressure in children and adolescents The fourth report on the diagnosis evaluation
and treatment of high blood pressure in children and adolescents Pediatrics 2004
114 255-76
9 Aderele WI Seriki O Hypertension in Nigerian children Arch Dis Child 1974
49313-7
10 Bo S Gambino R Gentile L Pagano G Rosato R Saracco GM Cassader M
Durazzo M Cavallo-Perin P High-normal blood pressure is associated with a cluster
of cardiovascular and metabolic risk factors a population based study J Hypertens
2009 27 102-8
72
11 Bao W Threefoot SA Srinivasan SR Berenson GS Essential hypertension
predicted by tracking of elevated blood pressure from childhood to adulthood The
Bogalusa Heart Study Am J Hypertens 1995 8 657- 65
12 Richard A Rodgers M Hedley AJ Mitchel JRA Changes in blood pressure and
blood lipid during adolescence BMJ 1980 28 1563-6
13 Sundstroumlm J Neovius M Tynelius P Rasmussen F Association of blood pressure in
late adolescence with subsequent mortality cohort study of Swedish male conscripts
BMJ 2011 342 643-8
14 Zimmet P Alberti G Kaufman F Tajima N Silink M Arslanian S Wong S Bennett
P Shaw J Caprio S On behalf of the International Diabetes Federation Task Force on
Epidemiology and Prevention of Diabetes The metabolic syndrome in children and
adolescents the IDF consensus Diabetic Voice 20075229-32
15 Abdulrahman FA Babaoye AA Childhood hypertension in northern Nigeria West
Afr J Med 1978 1 7-11
16 Adediran O Jimoh A Di M Relationship between body mass index and blood
pressure in rural Nigerian dwellers Internet J Nutri Wellness 2009 7 431-4
17 World Health Organization (WHO)UNICEF Adolescence at a glance 2003 p 2
18 The National Population Commission constitution of the Federal Republic of Nigeria
(AP 23 LFN) legal notice on publication issued April 21st 2007
19 Heald FP and Gong EJ Diet Nutrition and adolescents In Shils ME and Ross AC
(eds) Modern Nutrition in Health and Disease 9th ed William and Wilkins
Maryland USA 1999 p 32
20 Okonkon CT The prevalence of Hypertension among civil servants in Calabar Nig
Med J 1979 7422-5
21 Bugaje MA Yakubu AM Ogala WN Prevalence of adolescent hypertension in Zaria
Nig J Paediatr 2005 32 77-82
73
22 Obika LF Adedoyin MA Olowoyeye JO Pattern of paediatric blood pressure in
rural semi urban and urban communities in Ilorin Nigeria Afri J Med Sci 1995 24
371-7
23 Jeremy B A short history of blood pressure measurement section of the history of
medicine Proc Roy Soc Med 1977 70 793-9
24 Lewis O Stephen Hales and the measurement of blood pressure J Hum Hypertens
1994 8 865-71
25 Crile GW Blood Pressure in Surgery An experimental and Clinical Research
Philadelphia Lippincott 1903 p 358
26 Lewis WH The evolution of clinical sphygmomanometer Bull N Y Acad Med 1941
17 871-81
27 Browne WC OrsquoBrien ET Semple PF The sphygmomanometer of Riva Roci 1896-
1996 J Hum Hypertens 1994 610 723-4
28 Segal HN How Korotkoff the Surgeon discovered the auscultatory method of
measuring arterial pressure Ann Intern Med1975 83 561-2
29 Goodman FH and Howell AA Clinical studies in the auscultatory method of
determining blood pressure University of Pennsylvania Bulletin 1911 23 469-75
30 Crenner CW Introduction of the blood pressure cuff into US medical practice
technology and skilled practice Ann Intern Med 1998 128 488-493
31 Ganon WF Circulation In Review of Medical Physiol Lange Medical Publication
New York 22nd edition 2005 p 234-63
32 Beth C Homeostatic Regulation of Blood pressure Available from
URLhttpwwweHowcom Accessed on 1st December 2011
33 Rajinder KG Fahim M Regulation of cardiovascular functions during acute blood
loss Indian J Physiol Pharmacol 2005 49 213ndash9
74
34 Dampney AL Coleman MJ Fonts MAP Hirooka Y Horiuchi J Polson JW Potts
PD Tagawa T Central mechanisms underlying short-term and long-term regulation
of the cardiovascular system Proc Austr Physio Pharmacosociety 2001 32 333-44
35 Koshiya N Guyenet PG Noradrenergic neurons and the carotid sympathetic
chemoreflex Am J Physiol 1994 267 519-26
36 Prakash ES The ultimate goal in neural regulation of cardiovascular function Adv
Phyiol Educ 2008 32 107-8
37 Allen AM Inhibition of the hypothalamic paraventricular nucleus reduces
sympathetic nerve discharge and blood pressure Proc Austr Neuroscience Society
2001 29 44-7
38 Reid IA Interactions between ANG II sympathetic nervous system and
baroreceptor reflexes in regulation of blood pressure Am J Physiol 1992 262 763-
78
39 Brooks VL Osborn JW Hormonal-sympathetic interactions in long-term
regulation of arterial pressure A hypothesis Am J Physiol 1995 268 1343-58
40 Reckelhoff JF Gender Differences in the Regulation of Blood Pressure
Hypertension 2001 37 1199-208
41 Fink GD The systemic circulation as a regulated free-market economy A new
approach for understanding the long-term control of blood pressure Clin Exp
Pharmacol Physiol 2005 32 377ndash83
42 Benard K Sources of error in blood pressure measurement Hospital Physician 2002
12 33-7 Available from URLhttp wwwturnerwhitecom
43 Chyun DA A comparism of intra arterial and auscultatory blood pressure readings
Heart lung 1985 14 223-31
75
44 Nwankwo MU Lorenz JM Gardiner JC A Standard Protocol for Blood Pressure
Measurement in the Newborn Pediatrics 1997 99 1342-9
45 Deakin CD Low JL Accuracy of the advanced trauma life support guidelines for
predicting systolic blood pressure using carotid femoral and radial pulses
observational study BMJ 2000 321 673ndash4
46 OrsquoBrian E Replacing mercury sphygmomanometers require clinician to demand
better automated device BMJ 2000 320 815-6
47 McKay DW Raju MK Campbell NR Assessment of blood pressure measuring
techniques Med Educ 1992 26 208ndash12
48 Baker RH Ende J Confounders of auscultatory blood pressure measurement J Gen
Intern Med 1995 10 223ndash31
49 Neufeld PD Johnson DL Observer error in blood pressure measurement CMAJ
1986 135 633ndash7
50 van Montfrans GA Oscillometric blood pressure measurement progress and
problems Blood Press Monit 2001 6 287ndash90
51 Ware RW Laenger CJ Indirect blood pressure measurement by Doppler ultrasonic
kinetoartriography Proceedings 20th Annual Conference Engineering Medical
Biology 1967 9 27-30
52 Matthew Fox Blood pressure measurement technique Available from URL http
wwwlivestrongcom Last edited 2nd September 2010 Accessed on 30th November
2011
53 Akor F Okolo SN Okolo AA Blood pressure and anthropometric measurements in
healthy Primary School entrants in Jos Nigeria SAJCH 2010 4 42-5
54 Merhi BM Al-Hajj F Al-Tannir M Zaide F El-Rajab M A survey of blood pressure
in Lebanese children and adolescents North Am J Med Sci 2011 3 24-9
76
55 Al-Salloum AA El-Mouzan AH Al-Herbish AS Al-Umar AA Qurashi MM Blood
pressure standard for Saudi children and adolescents Ann Saudi Med 2009 29 173-8
56 Akinkugbe FM Akinwolere AO Kayode CM Blood Pressure Pattern in
Adolescence West Afri J Med 1999 18 196-202
57 Wanzhu T Eckert GJ Saha C and Pratt JH Synchronization of Adolescent Blood
Pressure and Pubertal Somatic Growth J Clin Endo Metab 2009 94
58 Ansa VO Anah MU Odey FA Mbu PN Agbor EI Relationship between parental
socioeconomic status and casual blood pressure in coastal Nigeria Adolescents West
Afri J Med 2010 29146-52
59 Agyemang C Redekop WK Owusu-Dabo E Bruijnzeels MA Blood pressure
patterns in rural semi-urban and urban children in the Ashanti region of Ghana West
Africa BMC Public Health 2005 5114-21
60 Ejeke CCE Ugwu CE Ezeanyika LUS Olayemi AT Blood pressure patterns in
relation to geographic area of residence a cross-sectional study of adolescents in Kogi
state Nigeria BMC Public Health 2008 8 411-5
61 Colhoun HM Hemminway H Poulter WR Socioeconomic status and blood
pressure an overview analysis J Human Hypertension 1998 12 91-110
62 Badaruddoza KR Familial aggregation and heritability for cardiovascular risk factors
a family based study in Punjab India Natural Science 2010 2 732-6
63 Livshits G Gerber LM Familial factors of blood pressure and adiposity co-variation
Hypertension 2001 37 928-35
64 Fermino RC Seabra A Garganta R Antoacutenio J Maia R Genetic factors in familial
aggregation of blood pressure of Portuguese nuclear families Arq Bras Cardiol 2009
92 463-9
77
65 Mijinyawa MS Iliyasu Z Borodo MM Prevalence of hypertension among teenage
students in Kano Nigeria Nig J Med 2008 17 173-7
66 The Wellcome Trust case control consortium Genome-wide association study of
14000 cases of seven common diseases and 3000 shared controls Nature 2007 447
661-78
67 Levy D Destefano AL Larson MG ODonnell CJ Lifton RP Gavras H Evidence for
a gene influencing blood pressure on chromosome 17 genome scan linkage results for
longitudinal blood pressure phenotypes in subjects from the Framingham heart study
Hypertension 2000 36 477- 83
68 Lifton RP Wilson FH Choate KA Geller DS Salt and blood pressure new insight
from human genetic studies Cold Spring Harb Symp Quant Biol 2002 67 445ndash50
69 van der Sande MA Milligan PJ Nyan OA Rowley JT Banya WA Ceesay SM
Dolmans WM Blood pressure patterns and cardiovascular risk factors in rural and
urban Gambian communities J Hum Hypertens 2000 14 489-96
70 Akinkugbe OO Ojo OA Arterial blood pressure in rural and urban population of
Nigeria BMJ 1969 2 22-4
71 Okagua J Anochie IC Akani NA Adolescent blood pressure in Rivers State Nigeria
A rural-urban comparism NJP 20154221-7
72 Urrutia-Rojas X Egbuchunam CU Bae S Menchaca J Bayona M Rivers PA Singh
KP High blood pressure in school children Prevalence and risk factors BMC
Pediatrics 2006 6 32-9
73 Sorof JM Lai D Turner J Poffenbarger T Potman R Overweight ethnicity and the
prevalence of hypertension in school-aged children Pediatrics 2004 113 475-82
78
74 Rosner B Prineas R Daniels SR Blood pressure differences between blacks and
whites in relation to body size among US children and adolescents Am J Epidemiol
2000 151 1007-18
75 Harding S Whitrow M Lenguerrand E Maynard M Teyhan A Cruickshank JK Der
G Ethnic differences in blood pressure in adolescence the determinants of adolescent
social well-being and health study Hypertension 2010 55 1063-9
76 Cruickshank JK Mzayek F Liu L Kieltyka L Sherwin R Webber LS Srinavasan SR
Berenson GS Origins of the ldquoblackwhiterdquo difference in blood pressure roles of birth
77 Vlajinac H Miljus D Adanja B Marinkoic J ipetic S Kocev N Blood pressure levels
in 7 to 14-year-old Belgrade children J Human Hypertension 2003 17 761ndash5
78 Menezes AMB Hallal PC Dumith SC Adolescent blood pressure body mass index
and skin folds sorting out the effects of early weight and length gains J Epid Comm
Health 2011 12 42-8
79 Karelis AD St-Pierre DH Conus F Rabasa-Lhoret R Poehlman EJ Metabolic and
body composition factors in subgroups of obesity what do we know J Clin Endo
Metab 2004 89 2569-75
80 Katzmarzyk PT Srinivasan ER Chen W Malina RM Bouchard C Berenson GS
Body mass index waist circumference and clustering of cardiovascular disease risk
factors in a biracial sample of children and adolescents Pediatrics 2004 114 198-205
81 Guagnano MT Ballone E Colagrande V Della Vecchia R Manigrasso MR Merlitti
D Riccioni G Sensi S Large waist circumference and risk of hypertension Int J
Obesity 2001 25 1360 ndash 4
82 Araujo TA Lopes MVO Moriera RP Cavalcante TF Gurdes NG MartinS dA Silva
V Blood pressure of children and teenagers from a public school in Fortaleza - Cearaacute
Acta paul enferm 200720103-15
79
83 Sebanjo IO Oshikoya KA Obesity and blood pressure levels of adolescents in
Abeokuta Nigeria Cardiovasc J Afr 2011 221-5
84 Messerli FN Obesity and essential hypertension Haemodynamics sodium excretion
and plasma rennin activity Arch Int Med 1981 141 81-5
85 Appel LJ Brands MW Daniels SR Karanja N Elmer PJ Sacks FM Dietary
Approaches to Prevent and Treat Hypertension A Scientific Statement from the
American Heart Association Hypertension 2006 47 296-308
86 Sacks FM Svetkey LP Vollmer WM Appel LJ Bray GA Harsha D Obarzanek E
Conlin PR Miller ER 3rd Simons-Morton DG Karanja N Lin PH for the DASH-
Sodium Collaborative Research Group Effects on blood pressure of reduced dietary
sodium and the Dietary Approaches to Stop Hypertension (DASH) diet DASH-
Sodium Collaborative Research Group N Engl J Med 2001 344 3ndash10
87 Appel LJ Moore TJ Obarzanek E Vollmer WM Svetkey LP Sacks FM Bray GA
Vogt TM Cutler JA Windhauser MM Lin PH Karanja N A clinical trial of the
effects of dietary patterns on blood pressure DASH Collaborative Research Group N
Engl J Med 1997 3361117ndash24
88 Appel LJ Sacks FM Carey VJ Obarzanek E Swain JF Miller ER 3rd Conlin PR
Erlinger TP Rosner BA Laranjo NM Charleston J McCarron P Bishop LM for the
OmniHeart Collaborative Research Group Effects of protein monounsaturated fat and
carbohydrate intake on blood pressure and serum lipids results of the OmniHeart
randomized trial JAMA 2005 294 2455ndash64
89 Karanja NM Obarzanek E Lin PH McCullough ML Phillips KM Swain JF
Champagne CM Hoben KP Descriptive characteristics of the dietary patterns used in
the Dietary Approaches to Stop Hypertension Trial DASH Collaborative Research
Group J Am Diet Assoc 1999 99 19ndash27
80
90 Nwokocha ARC Adolescence and associated problems In Azubuike JC and
Nkanginieme KEO (eds) Paediatrics and Child Health in a Tropical Region African
Educational Services Owerri Nigeria 2nd edition 2007 p 84-99
91 Rogol RT Roemmich JN Clark PA Growth and puberty J Adol Hlth 2002 31 192-
200
92 Tanner JM Marshal WA Variation in the pattern of puberty changes in boys and girls
Arch Dis Child 1970 45 13-23
93 Nwakoro SO Ifoda K Onochie O Olomu JM Anthropometric assessment of
nutritional status and growth of 10-20 years individuals in Benin City metropolis
Nigeria Pakistan J Nutr 2006 5 117-21
94 Shankar RR Eckert GJ Saha C Tu W Pratt JH The change in blood pressure during
pubertal growth J Clin Endo Metab 2005 90 163-7
95 Department of Health and Human Services 2000 CDC Growth Charts for the United
States methods and development Series Report 11 No 246 Available from URL
httpwwwcdcgovGrowthCharts
96 Redwine KM Daniels SR Prehypertension in Adolescents Risk and Progression
Journ Clin Hypertension 2012 14 360ndash4
97 Falkner B Gidding SS Portman R Rosner B Blood pressure variability and
classification of prehypertension and hypertension in adolescence Pediatrics 2008
122238ndash42
98 Redwine KM Acosta AA Poffenbarger T Development of hypertension in
adolescents with pre-hypertension J Pediatr 2012 16098ndash103
99 Ejike ECCC Ugwu CE and Ezeanyika LUS Variations in the prevalence of point
prehypertension in a Nigerian school-going adolescent population living in a semi-
urban and an urban area BMC Pediatr 2010 1013
81
100 Ujunwa FA Ikefuna AN Nwokocha AR Chinawa JM Hypertension and
prehypertension among adolescents in secondary schools in Enugu South East Nigeria
Italian J Pediatr 20133970-5
101 Chobanian AV Bakris GL Black HR Seventh report of the Joint National
Committee on Prevention Detection Evaluation and Treatment of High Blood
Pressure Hypertension2003 421206ndash52
102 Lande MB Systemic Hypertension In Kliegman RM Behrman RE Jenson HG and
Stanton BF (eds) Nelson Textbook of Pediatrics Saunders Elsevier Philadelphia 19th
Edition 2011 pg 1592-8
103 Luma GB Spiotta RT Hypertension in Children and Adolescent Am Fam Physician
2006 73 1558-68
104 Arvind B Rupesh J Vijayakumar M Madhuri K Ali U Evaluation and management
of hypertension Indian Paediatr 2007 44 103-21
105 Flynn JT Neonatal hypertension Diagnosis and management Pediatr Nephrol 2000
14 332-41
106 Steyn K de Wet T Richter L Cameron N Levitt NS Morrel C Cardiovascular
diseases risk factors in 5-year old urban South African children- The Birth to Ten
Study SAMJ 2000 90 7126
107 Antia-Obong OE Antia-obong LE Arterial blood pressure of Nigerian Urban and
Rural school children Nig J Paediatr 1991 18 3-11
108 Nguyen NT Magno CP Lane KT Hinojosa MW Lane JS Association of
hypertension diabetes dyslipidemia and metabolic syndrome with obesity findings
from the National Health and Nutrition Examination Survey 1999 to 2004 J Am Coll
Surg 2008 207 928-34
82
109 Solar MB Gill A Rey J Epidemiology of arterial blood pressure in school children
population Aten Primaria 1992 9 212-4
110 Steyn K de Wet T Richter L Cameron N Levitt NS Morrel C Cardiovascular
diseases risk factors in 5-year old urban South African children- The Birth to Ten
Study SAMJ 2000 90 7126
111 Linkas J The assessment and management of hypertensive emergencies and
urgencies in children Pediatr Emerg Care 2005 21391-6
112 Croix B Feig DI Childhood hypertension is not a silent disease Pediatr Nephrol
2006 21527-32
113 Flynn JT Anderson MH Characteristics of children with primary hypertension seen
at a referral centre Pediatr Nephrol 2007 44 103-21
114 Nakao M Yano E Nomura S Kuboki T Blood pressure lowering effects of
biofeedback treatment in hypertension a meta-analysis of randomized controlled trials
Hypertension 2003 26 37- 46
115 Jalingo Available from URLhttpwwwencyclopedia Britanica Accessed on 3rd
December 2011
116 Araoye MO Research Methodology with Statistics for Health and Social Sciences
Nathadex Publishers Saw-Mill Ilorin Nigeria 2004 pg 115-21
117 Olusanya O Okpere E Ezimokhai M The importance of social class in voluntary
fertility control in a developing country West Afr J Med 1985 4 205-12
118 World Health Organization expert committee Physical status the use and
interpretation of anthropometry WHO technical report series No 894 Geneva WHO
1995 p 424ndash38
119 Guidelines subcommittee WHOISH guideline for management of hypertension J
Hypertens 1999 17 151-83
83
120 Aubay B How to measure waist circumference Available from
URLhttpwwwehowcom Last updated August 10th 2011 and accessed on December
9th 2011
APPENDICES
Appendix 1
PROFORMA ON BLOOD PRESSURE PATTERN IN APPARENTLY HEALTHY
SECONDARY SCHOOL ADOLESCENTS IN JALINGO
PUBLIC SCHOOL [ ]
Serial No
84
PRIVATE SCHOOL [ ]
A BIODATA
1 Age (years) 10[ ] 11[ ] 12[ ] 13[ ] 14[ ] 15[ ] 16[ ] 17[ ] 18[ ] 19[ ]
2 Gender M [ ] F [ ]
3 Class JSS 1-3 [ ] SS1-3 [ ]
B MEDICAL AND SOCIAL HISTORY Yes [1] No [2]
1 Have you ever passed blood in your urine [ ]
2 Have you ever had your face or legs swollen [ ]
3 Are you on any drug for long time (such as pills steroids marijuana codeine
NSAIDs containing drugs tramal and others) [ ]
If yes specifyhelliphelliphellip
C SOCIO-ECONOMIC CLASSIFICATION
Fatherrsquos occupation
Score 1 Professionals top civil servants politicians and top businessmen
2Middle-level civil servants technicians skilled-artisans and well-to-do
traders
3 Unskilled workers and those in general whose income would be at or below
the national minimum wage
Mothers educational level
Score 0 Education up to University level
1 Secondary or tertiary level below the University
2 No formal education or up to primary level only
D ANTHROPOMETRY
i Weight (Kg) ndash 1helliphellip 2helliphelliphellip Averagehelliphelliphelliphellip
ii Height (m) ndash 1helliphellip 2helliphellip Averagehelliphelliphelliphellip
85
iii Body mass index = weightheight (kgm2)
v Waist circumference (cm) ndash 1helliphellip 2helliphelliphellip Averagehelliphelliphelliphellip
iv Blood Pressure (mmHg) - 1helliphellip 2hellip 3helliphellip Averagehelliphelliphelliphellip
Appendix 2
AUTHORIZATION AND CONSENT TO PARTICIPATE IN A RESEARCH
I Dr Peter Teru Yaru of the Department of Paediatrics Ahmadu Bello University
Teaching Hospital (ABUTH) Zaria Irsquom conducting a research on the blood pressure
pattern among secondary school adolescents in Jalingo
The aim of the study is to know the level of blood pressure among their age
groups Those with high blood pressure (or hypertension) will be identified appropriately
advised and referred for further care The study will involve taking their weight height
blood pressure and waist circumference Female assistants shall be responsible for
86
measuring waist circumference of female students Students will also be given a
questionnaire on some of their activities drug use among others all aimed at looking for
factors which can affect their blood pressure Information obtained shall be treated with
utmost confidentiality and for this research work only Please note that participation is
voluntary I will be glad if you give consent for your childward to participate in the
study
Statement by parents Irsquove read and understood this consent form and agreed for my
child to be included in the study
Parents name Researcherrsquos name and sign
Parents phone no if any Date
Parents signthumb print Phone no
87
Appendix 3
SOCIO-ECONOMIC SCORE
The classification of socio-economic scores based on fatherrsquos occupation and motherrsquos
education by Olusanya et al117
A Husband (fatherrsquos occupation)
Score 1 Professionals top civil servants politicians and businessmen
2 Middle-level bureaucrats technicians skilled-artisans and well-to-do traders
3 Unskilled workers and those in general whose income would be at or below
the national minimum wage
B Mothers educational level
Score 0 Education up to University level
1 Secondary or tertiary level below the University
2 No formal education or up to primary level only
The socio-economic class of the childrsquos mother is obtained by adding the scores from A
and B above and graded I-V as appropriate for example
Score (1) from A plus score (0) from B = social class I
Score (2) from A plus score (0) from B = social class II
Score (2) from A plus score (1) from B = social class III
Score (2) from A plus score (2) from B = social class IV
Score (3) from A plus score (0) from B = social class III
Score (3) from A plus score (1) from B = social class IV
Score (3) from A plus score (2) from B= social class V
Page 9
9
LIST OF FIGURES
Figure 1 Studentsrsquo distribution according to socioeconomic classes 34
Figure 2 Blood pressure distribution in relation to age and sex 40
10
SUMMARY
A cross sectional study of blood pressure pattern in apparently healthy secondary school
adolescents aged 10-19years in Jalingo Taraba state was carried out over six months period
from January to July 2014 One thousand three hundred and fifty (1350) students
participated comprising 628 (465) boys and 722 (535) girls Variables measured
included blood pressure weight height waist circumference and body mass index was
calculated from the weight and height
Overall the mean anthropometric values and blood pressure increased with age
irrespective of sex The mean weight of the students was 486plusmn109kg with a range of 23-
100kg while the mean height was 16plusmn01m and ranged from 12-19m The mean waist
circumference was 656plusmn89cm and ranged from 22-100cm while the meanbody mass index
(BMI) was 189plusmn31 with a range of 114-420
The overall mean systolic blood pressure was 1089plusmn125mmHg with a range of 76-
165mmHg whilethe mean diastolic blood pressure was683plusmn82mmHg and ranged from 47-
95mmHg The gender related differences in blood pressure showed mean systolic blood
pressure for boys and girls to be 1081plusmn133mmHg and 1095plusmn117mmHg (t=-2054
p=0040) while the mean diastolic blood pressurewas 678plusmn81mmHg and
687plusmn82mmHg(t=-2077 p=0038) respectively Girls generally had a higher mean systolic
blood pressure than boys from early adolescence (t=3754 p=0007) to middle adolescence
(t=-3025 p=0011) but reversed during late adolescence with boys having higher mean
systolic blood pressure (t=2145 p=0033) and these differences were statistically significant
Girls also showed dominance in the diastolic blood pressurein early and middle adolescence
but only statistically significant during middle adolescence (t=-3517 plt0000) Adolescents
from private schools had higher meansystolic blood pressure of 1102plusmn123mmHg than those
11
from public schools with 1084plusmn125mmHg(t=-222 plt0027)and higher mean diastolic
blood pressure of 703plusmn80mmHg than those from public schools with 677plusmn81mmHg(t=-
461 p=0000)
Blood pressure correlated positively with age (r=030-035 plt0000) height (r=034-
044 plt0000) weight (r=038-051 plt0000) body mass index (r=029-040 plt0000) and
waist circumference (r=023-031 plt0000) The socio-economic class associated negatively
with blood pressure withthose from upper socio-economic classeshavinga relatively
lowermean blood pressure than their counterparts from lower socio-economic classes but the
differences were not statistically significant for both systolic (f=1650 p=2850) and diastolic
blood pressure (f=0193 p=0058)
The overall point prevalence of hypertension was 44(59 0f 1350) with gender specific
prevalence for malebeing 41 (26 of 628 boys) and46 (33 of 722 girls) for females The
gender difference was not statistically significant (χ2=0831 p=0362) According to stages of
hypertension 15 (10 of 628)and 11 (7 of 628) males had stages 1 and 2 systolic
hypertension respectively while24 (15 of 628) had stage 1 diastolic hypertension andnone
had stage 2 diastolic hypertension Similarly 24 (17 of 722) and 12 (9 of 722) females
had stages 1 and 2 systolic hypertension respectively while 12 (9 of 722) and only 01 (1
of 722) girls had stages 1 and 2 diastolic hypertension respectively The overall prevalence of
pre-hypertension was 221(298 of 1350) with gender related prevalence of 21 (131 of
628) for males and231 (167 of 722) for femalesThe gender difference was statistically
significant (χ2=4349 p=0037)
In view of the high prevalence of pre-hypertension of 221 (298 of 1350) in this
study it is recommended that blood pressure measurement should be included as part of
medical evaluation at secondary school entry and at least annually thereafter especially for
those found to be at risk of hypertension during school entry
12
INTRODUCTION
Blood pressure (BP) is the pressure exerted by circulating blood volume on the walls of
blood vessels1 It is one of the vital signs measured during routine physical examination2
Blood pressure measurement is done to screen for hypertension and other cardiovascular
risk factors determining risk for various medical procedures identifying patients in
potential or actual clinical deterioration and determining individualrsquos fitness for an
occupation3 Its value as a screening tool in adults has long been documented and is an
established important component of routine paediatric physical examination4
The importance of BP measurement in children and adolescents is based on the fact
that hypertension is now increasingly diagnosed among them5-8 The American Academy
of Paediatrics now recommends routine screening of asymptomatic adolescents and
children during preventive care visits Such screening will identify potentially treatable
and preventable causes of hypertension and initiate early treatment to prevent
complications5
Hypertension is an important health problem all over the world5-9 because it is
usually silent and the presence of symptoms may indicate end organ damage10 It is
known to track well into adulthood thus making BP measurements in youths valuable for
identifying adolescents at risk of essential hypertension in adulthood11 Individuals with
high BP in their childhood are more likely to have high BP in subsequent years12 The
phenomenon of BP tracking into adulthood and the demonstration of the beginnings of
hypertensive target organ damage during childhood together with the increased
prevalence of childhood essential hypertension have raised concern of an impending
epidemic of cardiovascular morbidity and mortality10
The consequences of hypertension in children range from increased morbidity
from its causes complications or its treatment to high mortality13 The most frequently
13
and perhaps severely affected organs are the heart kidneys brain and the eyes leading to
lowered life expectancy and premature death13 In addition hypertension is a component
of the metabolic syndrome associated with similar and perhaps more severe consequences
in affected individuals14 Abdulrahaman and Babaoye15 in a study of hypertension in
Nigerian children observed a mortality rate of 28 within the first year after diagnosis
Similar mortality of 275 was reported by Aderele and Seriki9 Hypertension also places
an excessive financial burden on the population and health system consuming scarce
resources16
Adolescence is the transitional period of development between childhood and
adulthood The World Health Organization (WHO) defines adolescents as individuals
between the ages of 10 and 19 years and they account for 40 of Nigeriarsquos population1718
Adolescence is characterized by rapid biological psychological and cognitive changes
largely dependent on hormonal and environmental influences19 Many of the responses to
these influences include behaviours that have direct implications on health such as harmful
dietary intake alcoholism smoking substance abuse and sedentary lifestyle19 These
coupled with social stresses such as city traffic congestion have negative health impact and
predispose to obesity and increased risk of cardiovascular disease such as hypertension and
metabolic syndromes10 20 It has been shown that if preventive measures are started early in
childhood and adolescence they may lead to significant reduction in the high prevalence of
hypertension and metabolic syndrome currently observed in adults81320
JUSTIFICATION FOR THE STUDY
Hypertension is associated with high morbidity affecting major organs of the body such as
the heart kidneys and the brain1314 and a mortality of up to 275-28915 It is now diagnosed
frequently in adolescents with a reported prevalence of 35-952122 The younger the age of
14
onset of hypertension the greater the reduction in life expectancy if left untreated13 Even
asymptomatic adolescents with mild blood pressure elevations can have target organ
damage10 Studies121420 have shown that early identification and intervention may lead to a
significant reduction in the high prevalence of hypertension and metabolic syndrome
currently observed in adults In view of this routine blood pressure check-ups for children
and adolescents have been advocated during medical evaluations8 Blood pressure is
however not routinely measured in most paediatric clinical practices in Nigeria
Consequently only few children will have their blood pressure measured when they fall sick
or during preventive care visits In addition hospital and clinic BP measurements may be
associated with falsely elevated BP called lsquolsquowhite coat hypertensionrsquorsquo8 BP measurement of
children outside of the hospital setting such as in schools will provide opportunity for
apparently healthy individuals and possibly eliminate white coat hypertension The need for
surveillance for the early identification of adolescents in Jalingo who are at risk of
hypertension and to initiate measures aimed at preventing its consequences is therefore the
justification for this study In addition the study will add to the body of knowledge on
adolescent blood pressure as there has been no previous study on BP from Jalingo and
northeastern Nigeria as a whole This will help inform public health policies regarding blood
pressure control and prevention in Taraba State in particular and in Nigeria in general
15
LITERATURE REVIEW
HISTORICAL PERSPECTIVE
Blood pressure measurement first started in the eighteenth century with the experiment of
Stephen Hales to whom its discovery can be attributed as reported by Jeremy2324
Accurate study of blood pressure as reported by Crile25 began with the introduction of a
manometer by Poiseuille a century later The first truly accurate blood pressure
measurement in man was by the Surgeon Faivre in 1856 when he connected an artery to a
mercury manometer to obtain direct readings24 Non-invasive methods of BP
measurement started with the discovery of the sphygmograph in 1855 by Vierordt as
reported by Crile25 and improvement by Potain in 1889 gave birth to the
sphygmomanometer26 In 1896 Scipione Riva-Rocci developed the method upon which
present-day technique is based27
Segal28 reported that the use of stethoscope for BP measurement was first highlighted
in 1905 by a Russian surgeon Korotkoff who documented hearing a tapping sound using a
stethoscope placed over the brachial artery as the Riva-Rocci cuff was deflated Goodman
and Howell29 recommended the division of the changing sounds into five distinct phases and
physicians subsequently determined blood pressure according to the point of appearance and
muffling or disappearance of the sounds30
DEFINITION AND REGULATION OF BLOOD PRESSURE
Blood pressure is defined as the product of cardiac output and peripheral vascular
resistance131 During each heartbeat BP varies between a maximum (systolic) and a
minimum (diastolic) pressure and is measured in millimeters of mercury (mmHg)1 Blood
16
pressure is regulated by different mechanisms acting either rapidly or slowly to maintain it
within normal range for optimal cellular performance3132
Intrinsic Regulation
Intrinsic factors regulating BP include stroke volume and heart rate which both influence
cardiac output31 Stroke volume depends on the volume of blood that fills the ventricles and
this depends on the preload and afterload33 A higher afterload will decrease stroke volume
causing low cardiac output and low BP and vice versa When cardiac output increases more
volume is derived from the venous pool increasing preload Similarly an increased heart rate
will lead to increased cardiac output and BP3134
Reflex Regulation
The baroreceptors within the aortic arch and carotid sinuses contain sympathetic and
parasympathetic nerve fibres3435 These are sensory nerves which run from the medulla
and they respond to stretch of the tissue in which they lie by increasing or decreasing the
rate of signaling36 and act fast in regulating BP34 Sympathetic stimulation causes
increased heart rate and widespread vasoconstriction to increase BP while
parasympathetic stimulation produces the opposite3537
Hormonal Regulation
Hormones regulating blood pressure include renin-angiotensin-aldosterone and
antidiuretic hormone (ADH) They act slowly by responding to changes in intravascular
volume and osmolality38 Angiotensin II is a potent vasoconstrictor and stimulates the
release of aldosterone from the adrenal gland39 Aldosterone increases sodium absorption
and fluid retention leading to increased BP ADH is a potent vasoconstrictor and plasma
volume regulator and its stimulation results in fluid retention and vasoconstriction39
Other hormones regulating BP include the sex hormones thyroid parathyroid cortisol
and ACTH They act on the rennin-angiotensin-aldosterone system to regulate BP3940
17
Renal Regulation
The kidneys control blood pressure through the retention and excretion of extracellular
fluid35 An increase in renal fluid retention will increase extracellular volume and higher
blood pressure whereas increased renal excretion leads to lower blood pressure41 This is
achieved through the action of ADH aldosterone and atrial natriuretic peptide (ANP)41
METHODS OF MEASURING BLOOD PRESSURE
Blood pressure can be measured by invasive and non-invasive methods
1) Invasive (or direct) method - Blood pressure is most accurately measured invasively
through an arterial line4243 It is the gold standard by which the accuracy of other blood
pressure measuring devices and methods are assessed4344 Chyun43 compared direct and
indirect blood pressure readings in 14 intensive care unit patients and found that the
auscultatory method overestimates the systolic and diastolic BP especially if the VI Kortkoff
sounds is used as an indicator of diastolic BP This can often over estimate reading by as
much as 20 mm Hg43 This study is made up of very small sample size to make general
conclusion on the differences in BP values from the two methods compared Although the
invasive method is the gold standard for true BP measurement it is associated with serious
complications related to arterial catheterization and the procedure itself may be technically
difficult It is mainly used in experimental procedures and in monitoring critically ill patients
in intensive care units42
2) Non invasive (indirect) methods These are simpler and quicker than the invasive
method and are commonly used for routine blood pressure examinations They may
however yield lower accuracy and small systematic differences in numerical results43
These methods include-
18
a) Palpation method - A minimum systolic value can be estimated by palpation Deakin
and Low45 reported that a palpable radial femoral or carotid pulse indicates a minimum
systolic BP of 80 70 and 60 mmHg respectively The study was carried out among adults
and these values could not be applicable in children and neonate whose maximum
systolic BP may be lower than the reported minimum values A more accurate systolic BP
value can be determined by inflating and then deflating sphygmomanometer cuff while
palpating the pulse The systolic BP corresponds to the pressure at which the radial pulse
becomes palpable45 Its disadvantages are that pressure obtained is usually 2-5mmHg less
than those obtained by auscultation and diastolic BP cannot be measured32
b) Auscultation method- Also called the Korotkoff method is the method of choice in
clinical practice142 It involves using a stethoscope and a sphygmomanometer46 The
mercury sphygmomanometer is the gold standard for BP measurement A Riva-Rocci
cuff 27 is placed over the arm and inflated to occlude the brachial artery It is then
gradually deflated until blood flow is re-established accompanied by a tapping sound
which can be detected by the stethoscope held over the artery Five sounds are
traditionally heard and classified into phases30 The first phase corresponds to the systolic
BP while the last or fifth phase corresponds to the diastolic BP30 The fourth phase
alternatively is used to measure the diastolic pressure if a 10 mmHg or greater
differences exist between the initiation of phases fourth and five or if the fifth sound is
heard down to 0 mmHg8 This may occur in cases of high cardiac output or peripheral
vasodilatation children or in pregnancy This method though the method of choice in
clinical practice may however be associated with errors arising from faulty technique and
equipment4748 as well as observer bias49 This method was used for this study because of
its widespread general usage its reliability and accuracy Unlike other methods the
instruments (mercury sphygmomanometer and stethoscope) do not require any
19
calibration and values obtained do not require validation by other methods The standard
World Health OrganizationCenter for Disease Control (WHOCDC) blood pressure
reference percentile tables were generated using the mercury sphygmomanometer hence
the auscultation method is the gold standard for BP evaluation258
The aneroid sphygmomanometer measures BP by mechanical system of metal
bellows that expand as the cuff pressure increases in a series of levers that register the
pressure on a circular scale The hybrid shygmomanometer combines some of the features
of the two and uses an electric transducer to record blood pressure2
c) Oscillometric technique- This uses the oscillometric device Oscillation of pressure in a
sphygmomanometer cuff is recorded during gradual deflation The point of maximum
oscillation corresponds to the mean arterial pressure50 The oscillation begins well above
systolic BP and continues below diastolic BP so that systolic and diastolic BP can only
be estimated indirectly according to some empirically derived algorithm
d) Ultrasound method - This uses an ultrasound transmitter and receiver placed over the
brachial artery under a sphygmomanometer cuff As the cuff is deflated the movement of
the arterial wall and systolic BP cause a Doppler phase shift in the reflected ultrasound
The diastolic BP is recorded as the point of diminished arterial motion51 Its advantage
includes the ability to detect diastolic BP in atrial fibrillation and hypotension where
Korotkoff sound is faint152
FACTORS AFFECTING BLOOD PRESSURE IN ADOLESCENTS
Several inter-related factors affect blood pressure These include-
Age - A progressive BP elevation with age has been observed in several studies2153-55
The rate of rise varies in boys and girls5455 The average systolic increase ranges between
20
166 and 286 mmHgyr for boys and 144 and 263mmHgyr for girls while that of
diastolic BP ranges from 083 and 177mmHgyr for boys and 077 and 148mmHg for
girls2155 Bugaje Yakubu and Ogala21 studied blood pressure pattern among 2035
adolescents in Zaria and found a consistent rise of BP with age The rate of rise was fairly
constant until 11-13 years in boys and 12-14 years in girls when the rise became rapid A
similar study53 also found a BP rise with age among 650 healthy school children in Jos In
a large population studies in Lebanon56 and Saudi Arabia55 BP was similarly reported to
increase consistently with age Rapid growth and biological maturation of organs which
are normal occurrences during adolescence were thought to be responsible rather than the
chronological age56 The results of these studies showed increasing blood pressure with
age despite the fact that one study55 used oscillometric method for their study while the
standard auscultation was used in the other studies Also the studied sample sizes across
these studies varied greatly with sizes of 65053 203521 571054 and 1622655 Despite this
the findings were similar
Gender ndash Results of studies on the effect of gender on BP showed that sex positively
affects blood pressure2153-55 Merhi Al-Hajj and Al-Tannir et al54 studied BP pattern in
5710 Lebanese school children while Al-Salloum El-Mouzan and Al-Herbish et al55
studied BP pattern in 16226 Saudi children and adolescents The authors reported a
higher BP in girls than boys at all ages A study21 of BP pattern in adolescents in Zaria
Nigeria demonstrated an initial higher BP in boys before puberty which reversed with the
onset of puberty up to the age of 14-15yrs when it reversed again to be higher in boys
Akinkugbe Akinwolere and Kayode56 reported no sex differences in adolescent BP in
Ibadan The reported sex difference is said to be likely due to differences in sex hormone
and pattern of growth in boys and girls57 Differences in age range of the study population
may however be responsible for the observed BP variation For instance these studies5455
21
comprised of both adolescents and pre-adolescent age groups combined in one study
while the other two studies2156 were purely adolescents21 Blood pressure is reported to be
equal in both sexes before adolescence after which the gender difference starts to
manifest most likely due to physical and hormonal changes
Socioeconomic Factors - Belonging to either end of the socioeconomic strata is found to
be associated with elevated blood pressure5859 A study in Ibadan56 reported an inverse
relationship between parental socioeconomic status and level of BP in adolescents The
authors suggested that this might be the result of the health behaviours and problems
characteristic of the lower socioeconomic class On the other hand Ejeke Ugwu and
Ezeanyika et al60 in Lokoja and another study53 in Jos both found higher BP in children
from high socioeconomic class Colhoun Hemminway and Poulter61 in a meta-analysis of
BP and socioeconomic status in developed and developing countries found an inverse
relationship of BP with socioeconomic status in developed nations and a direct correlation
in developing countries These different findings may be due to methodological
differences in socio-demographic stratification For instance Akinkugbe and
colleagues59 used fatherrsquos level of education for social classification Parentrsquos educational
level may however not equate well with level of family income The other study60 used an
automated device for their study whose values may require validation using the
recommended auscultation method Difference in environmental stresses may also be
different considering the level of development of the areas where the studies were carried
out
GeneticFamilial Factors - The effect of geneticfamilial factors on BP has been
demonstrated in some studies62-64 Familialgenetic correlations reflected in BP and other
anthropometry generally are higher among genetically close relatives such as brother-
sisters or parent-offspring than among spouses62 Levshit and Gerber63 surveyed 514
22
individuals from 135 nuclear families in Russia while Budaruddoza62 studied 1400
individuals from 380 families in India and found significant genetic influence on BP
Mijinyawa Iliyasu and Borodo65 also reported family history of hypertension as risk
factor for developing high BP in a study on prevalence of hypertension among 1000
teenagers in Kano The authors concluded that this could be due to genetic predisposition
They however did not evaluate further to determine the genetic defects The authors did
not also consider shared environmental factors known to influence blood pressure in
individuals Molecular genetic studies have identified genes as possible regulators of
BP6667 These genes regulate the renin-angiotensin-aldosterone system involved in renal
salt handling69 Mutations that increase sodium reabsorption and salt sensitivity is
associated with higher BP and vice versa68 while shared environmental risk factors may
potentiate the development of such familial conditions which might have been
responsible for outcome of the above studies6364
Environmental Factors ndash Environmental factors greatly influence BP variation in a
population592269 Akinkugbe and Ojo70 reported a consistently higher BP in Nigerian
adolescents than their counterparts of similar ages in black and white American children
The authors are of the view that this could be due to different environmental factors of the
study population Obika Adedoyin and Olowoyeye22 studied BP pattern in 2526
children aged 1-14 years in rural semi-urban and urban communities in Ilorin Nigeria
and demonstrated a hypertension prevalence of 95 in urban compared to 63 in rural
communities This was similar to the study59 in Ghana and Gambia69 The authors592269
argued that the differences were due to socioeconomic status which is higher in the urban
than the rural areas The BP variation could be accounted for by the nature of dietary
intake since the rural communities generally consume more of natural foods with less salt
and lsquojunk foodsrsquo compared to the urban populace This was demonstrated by one study61
23
which reported higher mean BP among urban communities in developing nations due to
changes in their dietary pattern Rural areas are also less exposed to the stress and hassle
of the urban cities It is of interest to note however that urban areas are a mixture of
social classes as a result of migrant workers seeking lsquogreener pasturesrsquo Okagua Anochie
and Akani71 on the other hand reported higher mean BP among rural adolescents than
their urban counter parts in Port Harcourt The authors could not identify the reason(s) for
their finding but concluded that the seemingly protective privilege of rural life may be
fading gradually The differences in the reports could however result from the sample size
composition comprising of preadolescents22 adolescents71 and adults69
Race - Higher BP levels have been reported in African-American and Hispanic school-
age children than their Caucasian counterparts and among African-Americans than the
Hispanics7273 Akinkugbe and Ojo70 demonstrated a consistently high systolic and
diastolic BP in Nigerian children compared with black and white American children of
similar age Exposure to chronic environmental stress low socioeconomic status and high
obesity rate among African American and Hispanic youths could contribute to higher
BP72-74 It can be inferred from the study that race alone may not be responsible for the
observed differences but shared environmental factors and socioeconomic status may be
contributory77 Other studies7475 however found no significant BP differences in relation
to race
Anthropometry and blood pressure (BP) - A positive correlation has been observed
between BP and anthropometry in various studies58-5977 These studies585678 observed a
significant correlation between systolic BP and weight height and body mass index
(BMI) in boys but only with weight in girls Body mass index (BMI) is used as a
measure of overall obesity but it is known to be a poor indicator of actual body fat79
Waist circumference (WC) is an aggregate measurement of the actual amount of total and
24
abdominal fat accumulation80 It is therefore a better predictor of BP and other
cardiovascular diseases8081 Guagnano Ballone and Colagrande et al81 studied the
relationship between BP and BMI WC and waist hip ratio (WHR) in 461 people and
found WC to be the most consistent anthropometry affecting BP It is of interest to note
that the study by Guagnano et al81 was in adults population while the other studies56-59
were in children and adolescents WC was also found to be a better predictor of BP in an
Italian study8081 while it was not in others56-6982 Comparing BMI and waist
circumference and their effects on BP Arauzo Lopes and Moriera et al83 in Brazilian
children found BMI to be a better predictor of BP than waist circumference This was
similar to the study by Sebanjo and Oshikoya82 in Nigerian adolescents in Akure Thus
waist circumference measurements may not be useful in the evaluation of obesity andor
hypertension in children and adolescents This may partly be explained by the uniform fat
distribution due to hormonal effect at puberty in adolescents compared to the
disproportionate fat distribution in adults Possible mechanisms for the positive
relationship between BP and high BMI includes decreased physical activity increased
salt intake impaired pulmonary functions and development of metabolic abnormalities
such as dyslipidaemia and insulin resistance8084
Nutritional factors - Diet has been a primary link between humans and their environment
and substantial evidence supports the concept that multiple dietary factors affect BP85
Well-established dietary modifications that lower BP are reduced salt intake increased
potassium intake increased protein particularly plant protein high vegetable and
polyunsaturated fats85 High sodium intake on the other hand is said to be associated with
elevated blood pressure86 A series of 3 large controlled feeding studies tested the effects
of dietary patterns on BP86-89 Of the 3 diets studied the dietary approach to stop
hypertension (DASH) emphasized fruits vegetables low-fat dairy products whole
25
grains poultry fish nuts potassium magnesium calcium and fibre as the most effective
diet89 Among all participants the DASH diet significantly lowered mean systolic BP by
55 mm Hg and mean diastolic BP by 30 mm Hg each net of changes in the control diet
DEFINITION AND CLASSIFICATION OF ADOLESCENCE
Adolescence is the transitional stage between childhood and adulthood during which many
life patterns are learnt and established90 According to World Health Organization (WHO)
adolescents are individuals between the age range of 10-19 years17 The most significant
feature of adolescence is puberty characterized by an exceptionally rapid rate of biological
growth and development including physical and sexual maturation9091 The pubertal changes
have been described by Tanner and Marshal92 and are grouped into five stages This utilizes
definite criteria for growth and development of secondary sexual characteristics like pubic
hair and breast in females and pubic hair and genitalia in males9092 The timing of these
events and the rate of growth vary due to genetic and environmental factors in different
populations92 Adolescence is divided into early middle and late periods17
Early adolescence (10-13 years) ndash This is a period of rapid growth and development of
secondary sexual characteristics and varies according to sex It corresponds to Tanner stages
1 and 290 The main features of this stage are breast bud development and menarche in girls
while testicular enlargement and seminal emission occurs in boys93
Middle adolescence (14-16 years) ndash In this stage rapid growth decreases and there is more
cognitive development as the adolescents move from concrete thinking to formal operation
and develop greater competence at abstract thinking91 This corresponds to Tanner stages 3
and 4
Late adolescence (17-19 years) ndash Here slowing of physical changes continue which permits
the emergence of a more stable body image Cognition tends to be less self-centered with
26
demonstration of care for others with increasing thought about concepts such as justice
patriotism and history It corresponds to Tanner stage 59092
ADOLESCENCE AND BLOOD PRESSURE
Adolescence is characteristically associated with increasing blood pressure because of the
physical growth and hormonal changes associated with puberty5794 After the age of one year
normal BP increases more during puberty than probably at any other time in an individualrsquos
lifetime95 Wanzhu Eckert and Saha et al57 examined data from a cohort of 182 normotensive
children in Indiana who had blood pressure measurements taken semi-annually for up to 12
yr The authors found that the rate of change in BP and weight peaked at the age of maximum
pubertal growth spurt (PGS) This BP spurt roughly coincides with growth spurt during
puberty94 Surveys of BP patterns from childhood through adolescence shows systolic and
diastolic pressures increase with age and in adolescents the increase in males is more marked
than in females especially the systolic pressure5458229495
CLASSIFICATION OF BLOOD PRESSURE IN ADOLESCENTS
The National High Blood Pressure Education Program Working Group (NHBPEPWG) of the
United States established guidelines for the definition of normal and elevated blood pressures
in children in 19876 These guidelines were revised in 20048 The definition of childhood
hypertension in the guidelines are based upon the normative distribution of blood pressure
(BP) in healthy children rather than clinical outcome data as in adults The guidelines
classified BP as normal prehypertensive or hypertensive Hypertension is graded into stage
one and two8
Normal BP - Blood pressure lt90th percentile for age sex and height Children and
adolescents with normal BP should be followed annually from the age of 3 years5 They
27
should be encouraged to maintain a healthy life style such as good dietary intake physical
activities and adequate rest8
Pre-hypertension - Blood pressure between the 90th and lt 95th or if BP exceeds
12080mmHg (even if lt90th percentile) but lt95th It was previously called high normal
BP This new description was introduced to help identify children at risk for the
development of persistent hypertension for whom targeted prevention programmes would
be most beneficial96 While recommendations for the diagnosis of hypertension in
children require that BP remains elevated on three separate occasions repeated
measurements are not necessary to classify an adolescent as pre-hypertensive11 The
prevalence of childhoodadolescence pre-hypertension in US is reported to be between
12-1796-98 In Nigeria Ejeke Ugwu and Ezeanyika99 in a study of the prevalence of
point prehypertension and hypertension in 843 adolescents in Lokoja reported a
prevalence of point prehypertension of 222 and 250 in semi urban and urban
communities respectively Ujunwa Ikefuna and Nwokocha et al100 reported 175
prehypertension prevalence among adolescents in Enugu Among adults with pre-
hypertension it is reported that as much as 10 per year develop hypertension101 There
is little information on the time course for children and adolescents with prehypertension
developing hypertension A value of between 11-7 per year has been reported in US
adolescents98 There is no known study on rate of progression of prehypertension to
hypertension in Nigerian adolescents The NHBPEP recommended that children with
pre-hypertension should have their BP checked after every six (6) months to monitor for
progression to hypertension They should be encouraged to engage in physical activity
healthy dietary behaviours and weight management if overweight Pharmacologic therapy
is not indicated except if there is strong evidence of renal disease heart failure left
ventricular hypertrophy or diabetes mellitus8
28
Hypertension Hypertension is BP persistently equal to or above the 95th percentile for
age sex and height measured on three or more separate occasions If the blood pressure
measurement obtained is gt 95th percentile the degree of hypertension should be staged
Stage 1 hypertension- BP value between the 95th and the 99th percentile plus 5mmHg It
is recommended that BP should be rechecked in 1ndash2 wks or sooner if the patient is
symptomatic If persistently elevated on 2 additional occasions it should be evaluated or
referred to source of care for pharmacologic treatment within 1 month 8
Stage 2 hypertension- BP value gt99th percentile plus 5mmHg This stage calls for more
prompt evaluation and commencement of pharmacologic therapy102 It is recommended
that the individual be evaluated or referred to source of care within 1wk or immediately if
the patient is symptomatic8
Aetiology of hypertension
Hypertension is classified as primary (essential) when there is no identifiable cause
or secondary if due to an underlying disease31 Factors such as heredity diet stress drugs and
obesity play a role in the development of essential hypertension103104 Causes of secondary
hypertension include umbilical artery catheterization renal diseases coarctation of the aorta
and endocrine disorders105106 Aderele and Sereki6 in their study of hypertension in children
reported hypertension secondary to renal pathology as the commonest cause of elevated BP
in children This study was mainly in preadolescent population in which secondary
hypertension is a common finding On the other hand Antia-Obong and Antia-Obong107
reported no apparent cause in greater than 90 of the studied subjects with elevated BP and
also reported proteinuria of 1 in the same population without any associated elevated blood
pressure The study did not however evaluate the etiology of the proteinuria A study65 of BP
in teenagers in Kano found family history of hypertension a risk factor in the study
population Another study in Enugu100 examined modifiable risk factors associated with
29
hypertension in 2694 adolescents and found only 1 and 06 of the hypertensive subjects
to be overweight and obese respectively The authors also found that smoking and alcohol
consumption were not significant risk for hypertension This may however be due to the
shorter period of consumption of these products by the students as a cumulative effect from
long term consumption is known to be associated with adverse health outcomes
Prevalence of hypertension in adolescents
The prevalence of hypertension in adolescents varies widely due to arbitrary and imprecise
definition by different researchers It was in view of this that the National High Blood
Pressure Education Program Working Group (NHBPEPWG) of the United States established
guidelines for the definition of normal and elevated blood pressures in children and
adolescents for uniformity68 In the USA the prevalence is about 20 in normal weight and
50 in their obese counterparts108 A prevalence rate of 77109 10554 and 223110 has
been reported in Spain Lebanon and South Africa respectively In Kano Nigeria a study65
on the prevalence of hypertension among 1000 teenagers found a prevalence of 72 Similar
study in Enugu100 on the prevalence of hypertension among 2694 secondary school
adolescents reported a hypertension prevalence of 54 It is of interest to note that different
prevalence was reported because of the different methodology used by the authors While the
study in Kano65 applied the adult blood pressure criterion of BP greater than 14090mmHg as
hypertension the study in Enugu100 used blood pressure greater than 95th percentile for age
and sex Also the study in Kano65 took a single set of measurement while the study100 in
Enugu measured blood pressure of the subject three times at weekly intervals Bugaje
Yakubu and Ogala21 on the other hand defined hypertension as blood pressure greater than
two standard deviations from the mean and also took six readings over thirty minutes and got
a prevalence of hypertension of 34 A prevalence rate of 48107 and 9522 in Southern
and Western region of the Nigeria respectively was also reported It is obvious that because
30
of the various defining criteria for hypertension in adolescents the prevalence of adolescent
hypertension remains imprecise
Clinical presentation- Hypertension is usually asymptomatic unless it has been
sustained or is rising rapidly109 Adolescents with essential hypertension are usually
detected during routine evaluation96 Non-specific symptoms such as lethargy headache
dizziness drowsiness visual disturbance and confusion may be present109 These could
also be signs of complications111 Secondary hypertension may show obvious features of
the underlying disease such as growth failure heat intolerance abdominal stria tremors
body swelling and haematuria8102 Croix and Feig112 studied the spectrum of symptoms in
409 children aged 7-18 years newly diagnosed hypertensive in Texas USA and reported
15 common symptoms than in the controls The symptoms were said to resolve after
commencement of antihypertensive medications The authors concluded that hypertensive
children had a variety of non-specific symptoms The three most common symptoms
reported were headache daytime tiredness and difficulty initiating sleep The study
however did not specify if other possible causes of these symptoms were excluded
Complications of hypertension - Hypertension is usually asymptomatic in adolescents
which if left unidentified overtime can cause serious complications109 Organs commonly
affected in the complication of hypertension are the heart kidneys brain and the eyes
leading to lowered life expectancy and premature death13 Left ventricular hypertrophy
(LVH) is the most prominent clinical evidence of end organ damage10 Studies have
shown that LVH can be seen in as many as 41 of patients even in adolescents with
asymptomatic hypertension10103 Adolescents with severe cases of hypertension are also
at increased risk of developing hypertensive encephalopathy seizures cerebrovascular
accidents and congestive heart failure103109 However data documenting such
complications in children and adolescents are generally lacking In a study of
31
hypertension among teenagers in Kano the researchers65 could not find any
complications in all the 1000 teenagers studied
Investigations and treatment- Basic investigations are all that may be required in
adolescents who are obese and with a family history of hypertension stage 1 disease and
normal findings on physical examination113 This is because primary hypertension is
commoner in adolescents Adolescents that are symptomatic or with stage 2 hypertension or
have features of secondary hypertension should be evaluated in more detail
Treatment of hypertension includes non-pharmacological and pharmacological
methods Non-pharmacologic management involves life style modification such as weight
reduction increased physical activities and dietary adjustment114 In a study to evaluate the
effect of diet and salt on treatment and prevention of hypertension Sacks Svetkey and
Vollmer et al86 reported the beneficial effect of both reduced salt intake and appropriate
dietary adjustment in the control of hypertension Similar benefits were reported in other
studies8788 Although both studies had fairly good sample size (n=412) the studies did not
specify if participants were on other substances or activities other than antihypertensive that
might have affected their BP The studies were also in adults and whether it has the same
effects in children and adolescents has not been evaluation However there is no doubt that
the outcome will be similar in adolescents as dietary modifications have been advocated as
non-pharmacologic management in them Non pharmacologic treatment is usually the initial
treatment in essential hypertension and as adjuvant to drug therapy in those with secondary or
complicated hypertension101114 Pharmacologic (drug) treatment includes diuretics beta-
blockers calcium channel blockers angiotensin converting enzyme inhibitors (ACEIs) and
angiotensin receptor blockers (ARB) among others106114 They are used in those with
symptomatic disease and in acute or chronic complications106
32
Prevention of hypertension may be viewed as part of the prevention of cardiovascular
disease102 In adolescents approaches to prevention include reduction in obesity
discouraging cigarette smoking and alcohol intake113 reduction in sodium intake and increase
in physical activity through community and school-based programmes103104 Growth
monitoring BP check during preventive care visit physical activity and urine screening for
proteinuria and haematuria can be used starting from early childhood
33
AIM AND OBJECTIVES
GENERAL AIM
To determine the blood pressure pattern of apparently healthy secondary school adolescents
in Jalingo Taraba State
SPECIFIC OBJECTIVES
To determine
1 Blood pressure pattern in relation to age and sex among adolescents aged 10-19
years
2 The relationship if any between blood pressure and the anthropometric parameters of
weight height BMI and waist circumference
3 The association between blood pressure and parental social-economic status
4 The point prevalence of prehypertension and hypertension in adolescents
34
MATERIALS AND METHODS
Study area
A cross-sectional survey of the blood pressure pattern of apparently healthy secondary
school adolescents aged 10-19 years was conducted in Jalingo over a six month period
from January to June 2014 Jalingo is the capital of Taraba State and lies within the
savannah belt of North Eastern Nigeria It lies between latitude 80 54rsquo north and longitude
110 21rsquo east and at an altitude of 360 meters above sea level115 Jalingo had a population of
118198 people18 The primary inhabitants are the Konas Mumuyes and Fulanis who are
mostly farmers Other indigenous ethnic groups include the Jukun Kuteb WurkumTiv
and host of other tribes The Ibos Hausas Yorubas among others are the non-indigenous
ethnic groups and are mostly civil servants and businessmen Jalingo has a tertiary health
centre the Federal Medical Centre Jalingo and the state specialist hospital It also has 15
private clinicshospital and many primary health care centres There are also tertiary
education institutions including Taraba State University As at 2013 there were 56
secondary schools in Jalingo 24 public and 32 private all of which were mixed schools
except one which is a girlsrsquo only school
Study design
The study was a cross sectional descriptive study of 1350 apparently healthy secondary
school adolescents in Jalingo
Ethical approval
Ethical approval for this study was obtained from the Scientific and Health Ethics Research
Committee of Ahmadu Bello University Teaching Hospital Zaria (Appendix 4) The Taraba
State Ministry of Education also gave the approval and permission to conduct the study in the
35
selected schools Consent was given by the studentsrsquo parents or guardian (Appendix 2) All
students whose parents gave consent voluntarily participated in the study
Sample size determination
The minimum sample size was calculated using the formula116
N=Z2 (pq) E2
Where N = minimum sample size
p = Prevalence of hypertension in adolescents A prevalence of 3421 was used
q = 1- p
E = margin of error tolerated =1
Z = 196 at 95 confidence level
N = 1962 x 0034 x (1-0034) 0012 = 1262
Therefore the minimum sample size was one thousand two hundred and sixty two
Allowance for non-responders of 5 63 extra subjects were added to the calculated
minimum sample size bringing the total to 1325 students To enhance representativeness of
the sample and to compensate for missing information and poorly filled proforma while
maintaining the sample size a total of 1350 was decided upon
Inclusion criteria
1 Students (ages 10-19 years) in the selected secondary schools
2 Students whose parents gave consent to participate in the study
3 Students who gave assent to participate in the study
Exclusion criteria
1 Students who had obvious skeletal deformities of the spine and legs which can affect
the height and ultimately the BMI
36
2 Students with known chronic disease (or history of such disease) like anaemia
chronic renal disease and cardiac disease because they are not apparently healthy and
these conditions could affect their blood pressure
3 Students with present or past history of chronic drug ingestion that can affect blood
pressure such as steriods and contraceptives
4 Students with high blood pressure already on antihypertensive
Pilot study
A pilot study was carried out in one of the schools a week before the commencement of
the study The school was selected by random sampling method using balloting and did
not participate in the main study The pilot study was carried out with the aim of
assessing the competence of the research assistants in the various measurements
following their training to ensure reliability It was also used to test the questionnaire
before its use during the main study and to provide information on the number of students
that can be measured in a day Consequently twenty students had their blood pressure
and anthropometry measured independently by the researcher and the research assistants
and data were compared using Students t-test There were no statistically significant
differences between the measurements The result of the pilot study is highlighted in
Table I It was also found that some parts of the questionnaire were not well understood
by most students and were adjusted appropriately in the main study (Appendix 1) The 20
students had their measurements done over a period of 3-4 hours (between 8am - 12noon)
by the researcher and the research assistants
Table I Result of pilot study
Variables Researcher Research t p
37
assistants
Mean(plusmnSD) SBP
mmHg
106(11) 104(12) 0550 0586
Mean(plusmnSD) DBP
mmHg
617(83) 63(10) 0450 0657
Mean(plusmnSD) Weight
kg
544(82) 527(122) 0520 0608
Mean(plusmnSD) Height m 16(01) 16(01) 0000 1000
Mean(plusmnSD) BMI
kgm2
198(36) 202(33) 0370 0716
Mean(plusmnSD) WC cm 692(72) 682(133) 0300 0769
Sampling method
Students were selected by multistage random sampling technique The list of secondary
schools obtained from the Taraba State Post Primary Schools Board served as the sampling
frame for schools There were 56 secondary schools 24 of which were public and 32 were
private schools a ratio of 113 Ten (10) schools were randomly selected by balloting four
(4) from public schools six (6) from private based on the number and approximately similar
ratio of private to public schools of 115 (46) Ten schools were selected to ensure wider
coverage and even distribution of students so that it could be truly representative of the
community All the ten schools had an overall total of eight thousand one hundred and seven
(8107) students The public schools had a total of five thousand nine hundred and forty
(5940) with nine hundred and eighty nine (989) students participating The private schools
had a total of two thousand one hundred and sixty-seven (2167) students with three hundred
and sixty one (361) participating These number (989 and 361) was calculated based on the
38
relative population of each school and proportionate to number of students in each school
Thereafter the number of students to participate per school was calculated proportionately to
the number of students in each school based on the number given by the school authority
Then the number in each class was also calculated proportionately from JSS1 to SS3 to
ensure fair and equal chance of participation for all age groups The calculation was done
thus n= a b x c
Where n= number of students per selected school
a= total numberpopulation of students in the school
b= total numberpopulation of students in all 10 selected schools (8107)
c= calculated total sample size (1350)
Students in each class from junior secondary school (JSS) 1-3 and senior secondary school
(SS) 1-3 were then randomly selected by balloting The number of selected schools total
number of students in a school and the number of students selected per school is outlined in
Table II
Table II Selected schools and number of students in each of the ten schools in Jalingo
Selected schools Total no of No of students
39
student in the
school (a)
n=8107
selected (n=abxc)
n=1350
Public schools
Govt Science Secondary School 2800 466
Govt Day Secondary School SGari 1200 200
Salisu Dogo Secondary School 1100 183
Govt Secondary School Magami 840 140
Total 5940 989
Private schools
Winners Comprehensive Secondary School 650 108
Hawai Secondary School 562 94
Centre for Quranic Science and Islamic Education 543 90
Good Success Secondary School 155 26
Jetters Academy 140 23
Yagai Academy 117 20
Total 2167 361
The study
The first contact with the students was a familiarization exercise to each of the schools during
which the teachers and students were given a talk by the researcher on blood pressure and the
40
importance of periodic blood pressure measurement They were given the opportunity to ask
questions which were responded to Both the students and their teachers actively participated
in the lectures
On the second day students were selected as described above and those selected
underwent general physical examination in the presence of a chaperon to identify those
who did not fulfilled the inclusion criteria Each selected student was given a proforma
(Appendix 1) in which information on their biodata and medical history were recorded
Other information obtained was parentrsquos medical history and their socioeconomic status
using the format described by Olusanya Okpere and Ezimokhai117 (Appendix 3) The
study was carried out in a relatively quiet and empty classroom to ensure privacy for both
male and female students The procedure for blood pressure measurement was
demonstrated on one of the research assistants and sometimes on one of the teachers by
the researcher to assure the students and allay their anxiety BP and anthropometric values
obtained were recorded in the study proforma An average of 15-20 students per day were
attended to over a period of 3-4 hours (between 8am - 12noon daily) by the researcher
one of the research assistants who is a medical officer a male nurse and a lady Youth
Corper (NYSC)
Blood pressure measurement
This was measured by the researcher and the research assistant (the medical officer) The
standard auscultation method was employed using a mercury sphygmomanometer (Acosson)
and a standard Littman stethoscope according to the guideline of the fourth report on the
diagnosis evaluation and treatment of hypertension in children and adolescents8 Each
students was rest-seated for 5 minutes before BP measurement With the student seated the
right arm rested on a table at the level of the heart an appropriate cuff size which covered
41
two-third (23rd) of the length of the arm was applied round the arm about 2cm above the
antecubital fossa Two cuff sizes were used for this study with dimensions of 10 x 24cm and
13 x 30cm the smaller cuff for the smaller adolescents and vice versa The bladder cuff was
inflated rapidly to 20-30mmHg above the point where the brachial artery was no longer
palpable The bell of the stethoscope was then placed over the brachial artery and the cuff
was deflated slowly at 2-5mmHgsecond while listening to the Korotkoff sounds Phases one
and five of the Korotkoff sounds were recorded as the systolic and diastolic BP
respectively119 Three recordings were taken at intervals of 3-5 minutes and the average was
the final BP in mmHg BP was interpreted based on the standard set by the fourth report on
the diagnosis evaluation and treatment of hypertension in children and adolescents of the
United States8 thus-
Normal BP ndash BP value between the 5th and lt 90th percentile for age sex and height
Prehypertension - BP value between the 90th and the lt95th percentile for age sex and height
or BP of 12080mmHg but less than the 95th percentile
Hypertension ndash BP value ge95th percentile for age sex and height
Students found to have prehypertension were educated and counseled on life style
modifications and the need to have their blood pressure checked in six monthsrsquo time and
annually subsequently Those with hypertension were educated on the implications of the
findings and were referred to the Federal Medical Center Jalingo for evaluation management
and follow-up
Height measurement
Height was measured in centimeters using a locally constructed stadiometer by the research
assistants Each student was measured barefooted standing with the heel back and occiput
42
against the stadiometre The head was held straight looking forward with the lower border of
the eye socket at a horizontal plane with that of the external auditory meatus The movable
part of the stadiometre was adjusted to rest on the vertex and the corresponding value read to
the nearest 01cm
Weight measurement
The weight was measured in kilograms by the researcher and the research assistants using a
bathroom scale (HANSON) Students were weighed in their approved school uniform
without caps head ties or cardigan and with their shoes removed The scale was checked
daily for accuracy using standard calibrated weight before and midway through each session
The weight of the student was measured to the nearest 01 kg
Body mass index (BMI)
This was calculated from the measured weight and height of the subject using the
formula118
BMI= Weight (kg) Height (m2)
Waist circumference measurement
WC was measured in centimeters using a measuring tape by the research assistants The
male assistant measured for boys and the lady Youth Corper measured for girls
Measurement was taken with the student standing completely relax and breathing
normally Clothing was pulled up or down and an inelastic measuring tape was placed
around the waist mid-way between the iliac crest and the lowest rib margin The ends of
the tape were pulled together lightly towards each other and the value read to the nearest
01cm117120
43
Data analysis
Data obtained were analyzed using Epi-Info statistical software package version 7 The
results obtained were presented in figures tables graphs and charts as appropriate Individual
mean BP levels were used as dependent variables and other measured variables as
independent variables The means and standard deviations were used to summarize
quantitative variables such as BP weight height waist circumference and BMI The chi-
squared test was used to test the significance of associations between categorical variables
Studentrsquos t-test was used to compare means of any two normally distributed continuous
variables Pearsonrsquos correlation coefficient and regression analysis were used to examine the
strength of association between BP and the anthropometries Probability level of statistical
significance value was set at lt005
RESULTS
General characteristics
A total of 1350 students were enrolled between January and June 2014 to determine their
blood pressure pattern 628 (465) were males and 722 (535) were females with
malefemale ratio of 111 Students enrolled in the study were drawn from both public and
44
private schools The number of students from public schools was 989 (733) while 361
(267) were from private schools as shown in Table II The mean age of the study subjects
was 153plusmn22 years with a range of 10-19 years The age and sex distribution of the students
is illustrated in Table III
Table III Age and sex distribution of 1350 study subjects in Jalingo
Ag
e
Male
n ()
Female
n ()
Total
N()
10 9(14) 13(18) 22 (16)
11 20(32) 31(43) 51(38)
12 36(57) 52(72) 88(65)
13 96(153) 85(118) 181(134)
14 92(146) 115(158) 207(153)
15 92(146) 111(154) 203(151)
16 66(105) 116(161) 182(135)
17 78(125) 91(126) 169(125)
18 79(126) 70(97) 149(110)
19 60(96) 38(53) 98(73)
To
tal
628(100) 722(100) 1350(100)
45
Socio-economic classes (SEC) ndash Most of the students were from the lower social classes
(4 and 5) with population of 650 (415 and 235) students The upper social classes (1 and
2) had the least population with 184 (62 and122) students The middle social class (3) had
516 students The distribution of the study subjects according to individual
socioeconomic class is shown in Figure I
Figure 1 Socioeconomic class distribution of students in Jalingo
Anthropometry
The anthropometric characteristics of the students are displayed in Tables IV V and VI
All the anthropometric parameters showed increasing values with age (Tables V and VI)
There were significant differences in the anthropometric indices of height (p=0000)
weight (p=0010) and body mass index (p=0000) between boys and girls but not
statistically significant for waist circumference (p=0145) as shown in Table IV
Weight ndash The mean weight of the students was 486plusmn109kg with a range of 23-100kg
(Table IV) Girls were heavier than boys up to middle adolescence after which males
46
were heavier than the females (Table V and VI) and this was statistically significant (t= -
256 p=0010)
Table IV Overall mean anthropometric measurements of the study subjects
Anthropometr
y
Male Female Total
n=628 n=722 N=1350 t p
Wt (kg)
Mean(plusmnSD) 4773(115
)
4926(103
)
4855(plusmn109
)
-
25
6
0007
Range 236-848 227-100 23-100
Ht (m)
Mean(plusmnSD) 159(012) 157(008) 158(plusmn010) 35
5
0000
Range 122-185 126-179 122-185
WC (cm)
Mean(plusmnSD) 6524(91) 6595(86) 6562(plusmn89) -
14
6
0145
Range 225-905 215-100 22-100
47
BMI (kgm2)
Mean(plusmnSD) 1825(27) 1947(33) 1891(plusmn31) -
74
1
0000
Range 117-325 114-42 114-42
Statistically significant p values at 005 level of significance Wt=Weight Ht=Height WC=Waist
Circumference BMI=Body Mass Index SD=Standard Deviation
Height- The mean height of the study population was 158plusmn09m and ranged from 122-
185m (Table IV) Girls were taller than boys at early and middle adolescence but these
reversed from 16 years in favour of the boys (Table V and VI) This differences was
statistically significant (t=448 p=0000)
Waist circumference (WC) - The overall mean waist circumference was 6562plusmn89cm and
a range of 225-100cm Girls had higher WC until late adolescence (18 years) when it
reversed but this was not statistically significant (t=-146 p=0145) This is displayed in
Tables IV V and VI
Body Mass Index (BMI) - Overall mean BMI was 189plusmn31 with a range of 114-42
There was a statistically significant difference between girls and boys (t=-741 p=0000)
Tables IV V and VI illustrate this findings
Table V Mean anthropometric measurements of 628 boys
Age No of
studen
ts
Wt(plusmnSD)
Kg
Ht(plusmnSD)
m
WC(plusmnSD)
cm
BMI(plusmnSD)
Kgm2)
48
10 9 349(50) 143(001
)
613(06) 169(01)
11 20 354(25) 143(002
)
617(13) 170(07)
12 36 363(51) 146(002
)
616(14) 167(06)
13 96 379(51) 150(003
)
602(40) 165(08)
14 92 412(50) 154(003
)
623(32) 169(08)
15 92 471(60) 160(003
)
634(39) 178(08)
16 66 525(52) 164(002
)
672(24) 192(09)
17 78 555(51) 167(002
)
680(31) 197(08)
18 79 576(61) 169(002
)
707(18) 200(08)
19 60 590(57) 170(002
)
716(16) 203(07)
Total 628 477(115 16(01) 652(91) 183(27)
49
)
Wt=Weight Ht=Height WC=Waist Circumference BMI=Body Mass Index SD=Standard Deviation
Table VI Mean anthropometric measurements of 722 girls
Age No of
students
Wt(plusmnSD)
Kg
Ht(plusmnSD)
m
WC(plusmnSD)
cm
BMI(plusmnSD)
Kgm2
10 13 313(34) 139(001) 582(05) 156(02)
11 31 361(53) 144(002) 611(12) 170(05)
12 52 403(64) 149(002) 625(21) 178(09)
13 85 458(66) 154(002) 657(22) 188(12)
14 115 478(74) 157(003) 627(48) 187(10)
15 111 508(65) 159(002) 666(34) 199(13)
16 116 521(60) 159(002) 678(28) 201(11)
17 91 541(62) 161(002) 681(28) 203(11)
18 70 556(63) 161(002) 696(21) 211(11)
19 38 540(48) 158(002) 688(14) 208(06)
Total 722 493(103) 16(010) 651(23) 190(09)
Wt=Weight Ht=Height WC=Waist circumference BMI=Body Mass Index SD=Standard Deviation
Blood pressure (BP) measurements
50
Table VII shows mean blood pressure distribution of the study population for all ages
The highest SBP and DBP were 165mmHg and 95mmHg at 18years and 15 years
respectively Table VIII displays mean BP distribution in relation to age and sex The
tables show that both systolic and diastolic blood pressure increased with age This is also
depicted in Figure 2
Table VII Mean and ranges of blood pressure of 1350 subjects
Systolic Blood Pressure
(mmHg)
Diastolic Blood Pressure
(mmHg)
Age
No of
students
Mean(plusmnSD) Range
Mean(plusmnSD) Range
10 22 936(74) 80-107 600(50) 47-70
11 51 992(106) 76-120 629(71) 47-83
12 88 1036(110) 80-140 657(60) 53-82
13 181 1042(108) 80-143 660(74) 48-88
14 207 1070(115) 83-150 675(76) 47-90
15 203 1090(119) 80-150 678(82) 47-95
16 182 1122(124) 80-150 696(80) 50-90
51
17 169 1132(118) 90-153 698(83) 48-93
18 149 1138(121) 90-165 712(88) 50-90
19 98 1131(127) 90-143 726(76) 57-90
Total 1350 1089(125) 76-165 683(82) 47-95
Table VIII Mean blood pressure in relation to age and sex
Mean(plusmnSD) Systolic blood pressure
(mmHg)
Mean(plusmnSD) Diastolic blood
pressure (mmHg)
A
ge
Male
n=628
Female
n=722
t p Male
n=62
8
Fema
le
n=72
2
t p
52
10 954(3
9)
923(6
0)
1
02
03
20
619(
32)
586(
46)
1
36
0
01
91
11 985(5
5)
997(9
2)
0
42
0
06
80
648(
39)
617(
57)
1
56
0
01
26
12 999(8
9)
1062(
117)
2
84
0
00
06
653(
29)
660(
52)
-
0
52
0
06
07
13 1012(
73)
1075(
73)
4
03
4
00
00
649(
43)
672(
59)
-
0
03
0
00
44
14 1036(
78)
1098(
78)
3
93
0
00
01
653(
44)
693(
58)
3
90
0
00
01
15 1071(
80)
1105(
87)
2
05
0
00
42
665(
58)
689(
56)
-
2
10
0
00
37
16 1135(
82)
1114(
91)
1
03
0
03
10
697(
51)
695(
61)
0
15
0
08
81
53
17 1152(
87)
1115(
77)
2
04
00
43
698(
59)
698(
58)
0
02
0
09
81
18 1141(
96)
1135(
74)
0
27
0
07
91
704(
62)
721(
63)
1
61
0
02
49
19 1146(
97)
1108(
80)
1
41
0
01
64
733(
63)
714(
43)
1
21
0
02
28
To
tal
1081(
133)
1095(
117)
-
2
05
4
00
40
678(
81)
687(
82)
-
2
07
7
00
38
Statistically significant p values at 005 levels of significance
54
Figure 2 Blood pressure distribution in relation to age and sex
SBP =Systolic blood pressure DBP=Diastolic blood pressure
Blood pressure and stages of adolescence
Table IX displays mean blood pressure according to stages of adolescence Girls had a
higher mean SBP than boys from early adolescence (t=3754 p=0000) to middle
adolescence (t=-3025 p=0003) and this was statistically significant This dominance was
also demonstrated in the DBP and was statistically significant in middle adolescence (t=-
3517 plt0000) Adolescents from private schools had higher mean SBP (t=-222
plt0027) and mean DBP (t=-461 p=0000) than those from public schools and these
differences were statistically significant
Table IX Mean blood pressure according to sex and stages of adolescence
Mean BP
(mmHg)
Age (years)
Male SBP
Female SBP
Male DBP
Female DBP
55
Stages
of
adolesc
ents
(years)
Mean(plusmnSD) systolic blood pressure
(mmHg)
Mean(plusmnSD) diastolic blood pressure
(mmHg)
Male Female t p Male Fema
le
t p
Early
(10-13)
1000(9
6)
1040(1
18)
37
54
00
00
648(
56)
653(
82)
05
99
05
50
Middle
(14-16)
1075(1
29)
1105(1
13)
-
30
25
00
03
670(
81)
694(
77)
-
35
17
00
00
Late
(17-19)
1140(1
28)
1121(1
11)
21
45
00
33
717(
85)
710(
83)
00
70
09
45
1082(1
33)
1092(1
17)
-
20
54
00
40
678(
81)
687(
82)
-
20
77
00
38
Statistically significant p values at 005 level of significance SD=Standard Deviation
Table X shows blood pressure pattern according to stages of adolescence
Prehypertension and hypertension were more prevalent in late adolescence than early and
middle adolescence (χ2=49054 p=0000) and (χ2=10305 p=0006) both of which were
statistically significant
Table X The pattern of normal BP Prehypertension and hypertension according to stages
of adolescence
56
Blood
pressure
pattern
Stages of adolescence
Early
n()
Middle
n()
Late
n()
Total
N()
χ2 p
Normal 290(84
8)
428(72
3)
275(66
1)
993(73
5)
429
79
000
0
prehypertens
ion
43(12
6)
135(22
8)
120(28
8)
298(22
1)
490
54
000
0
Hypertensio
n
9(26) 29(49) 21(51) 59(44) 103
05
000
6
342(10
0)
592(10
0)
416(10
0)
1350(1
00)
350
93
000
0
Statistically significant p value at 005 level of significance
Relationship between blood pressure and the measured anthropometry
There was a positive correlation between SBP and DBP with age and the anthropometric
variables of weight height waist circumference and BMI (Table XI) SBP showed a
stronger correlation with the anthropometries than the DBP and was stronger for weight
(r=051) and height (r=044) The waist circumference though statistically significant
showed the weakest correlation
Table XI Correlation between blood pressure age (yrs) and anthropometry
Parameters
Systolic Blood Pressure Diastolic Blood Pressure
Correlation
coefficient
p Correlation
coefficient
p
57
Age (yrs) 035 lt0000 030 lt0000
Height (m) 044 lt0000 034 lt0000
Weight (Kg) 051 lt0000 038 lt0000
WC (cm) 040 lt0000 029 lt0000
BMI
(Kgm2)
031 lt0000 023 lt0000
Statistically significant p values at 005 level of significance Wt=Weight Ht=Height WC=Waist
circumference BMI=Body Mass Index
Blood pressure distribution and socio-economic classes
Table XII shows mean blood pressure according to socio-economic class of the subjects
Lower social classes had higher mean SBP (t=1650 p=2850) and DBP (t=0193
p=00058) but these were not statistically significant
Table XII Mean Blood pressure in relation to socioeconomic classes
Blood
pressur
e
Socioeconomic classes
Upper (1 amp
2) n=184
Middle (3)
n=516
Lower (4 amp
5)
n=650
f(anova
)
p
Mean
(SD)
10857(126
)
10866(128
)
11040(109
)
1650 285
0
58
SBP
Mean
(DBP)
6820(83) 6791(83) 6957(76) 0193 005
8
SEC= Socioeconomic class SBP=Systolic Blood Pressure DBP=Diastolic Blood Pressure SD=Standard
Deviation
Table XIII shows blood pressure pattern in relation to socioeconomic classes of the
subjects The percentage of students with prehypertension was higher in the upper social
class ((χ2=3067 p=0216) while the percentage of hypertension were higher in the lower
socioeconomic classes (χ2=1037 p=0568) but these differences were not statistically
significant
Table XIII Blood pressure pattern in relation to socioeconomic status
Blood
pressure
pattern
Socioeconomic classes
Upper
(1 amp 2)
n()
Middle
(3)
n()
Lower
(4 amp 5)
n()
Total
N()
χ2 p
Normal 127(69
)
383(74
2)
483(74
3)
993(73
6)
417
6
012
4
Prehypertens
ion
52(28
3)
108(20
9)
138(21
2)
298(22
1)
306
7
021
6
Hypertension 5(27) 25(48) 29(45) 59(44) 103 056
59
7 8
184(10
0)
516(10
0)
650(10
0)
1350(10
0)
573
0
022
0
Prevalence of Hypertension and Prehypertension
Table XIV shows the prevalence of hypertension in the study population The total
number of students with hypertension was 59 giving an overall prevalence of 44
Thirty four students (25) had systolic hypertension sixteen (12) had diastolic
hypertension and nine students (07) had both systolic and diastolic hypertension
Systolic hypertension was more prevalent in the females and was more at the age of 16
years while diastolic hypertension was higher in males and this also occurred at 16 years
Among those with hypertension 27 and 16 subjects had stage 1 and 2 systolic
hypertension respectively With regard to diastolic hypertension 24 and 1 subjects had
stage 1 and 2 hypertension respectively The gender difference in the prevalence of
hypertension is not statistically significant (χ2=0831 p=0362)
The number of students with pre-hypertension was 298 giving an overall prevalence of
221 Of this 131 were males and 167 are females This is illustrated in Table XIV
Prehypertension is more prevalent in females than males and this was statistically
significant (χ2=4349 p=0037)
60
Table XIV Overall Blood pressure pattern and prevalence of hypertension and
prehypertension of 1350 students in Jalingo
Blood pressure
pattern
Males
n=()
Females
n=()
Total
N()
χ2 p
Normal 471(750) 522(723) 993(735) 2619 0106
Prehypertension 131(209) 167(231) 298(221) 4349 0037
Hypertension 26(41) 33(46) 59(44) 0831 0362
628(100) 722(100) 1350(100) 1260 0533
statistically significant p value at 005 level of significance
61
DISCUSSION
The findings of this study showed that the BP of secondary school adolescents in Jalingo
was similar in terms of mean values range and trend of progression with age to that of
other adolescents from Ibadan63 and Kogi60 (Nigeria) Ashanti (Ghana)59 and Lebanon54
The mean value was however lower than the mean BP of adolescents from Zaria
(Nigeria)21 Belgrade ( Serbia)78 and Fortaleza-Cearaacute (Brazil)83 who had higher mean BP
in both sexes and at all ages The lower mean BP in this study compared to that of
adolescents from Zaria21 Belgrade78 and Brazil83 could be due to lower mean
anthropometry of weight height and BMI in adolescents from Jalingo resulting in lower
mean BP The sample sizes of these studies7883 were also different and could have
affected the mean BP of the study population For instance the sample size in the
Brazilian study83 is 151 compared to the study in Lebanon54 with 5710 subjects The use
of the fifth Korotkoff sounds as DBP in this study21 could also have accounted for the
lower mean BP in contrast to a similar study in Zaria21 where the fourth Korotkoff sound
was used as the DBP
A progressive increase in blood pressure with age was found in this study This
was similar to most findings by researchers in Nigeria 215358-606566107 and
worldwide54555961 The peak age of rise in BP in this study was in middle adolescence
between 15-16 years in boys but much earlier in girls for both systolic and diastolic BP
This was similar to the study by Akinkugbe Akinwolere and Kayode56 in Ibadan and
Ejeke Ugwu and Ezeanyika et al60 in Lokoja This age group is usually the period of
onset of puberty The chronologic age is not the main factor responsible for BP increase
62
with age but rather the progressive increase in size of the individual Increase in body
size with growth and maturity of organs associated with the physical and hormonal
changes during puberty potentially lead to increasing BP The simultaneous increase in
weight height and other anthropometric indices alongside BP with age seen in this study
and others is in agreement with that The implication of this increase in blood pressure
with age is that those with prehypertensionhypertension in childhood may continue into
adulthood hence further increasing the high prevalence of hypertension in the adult
population with its attendant morbidity disability and mortality
Overall significant higher mean BP was recorded in girls than boys in this study
This was seen from early to middle adolescence after which it reversed in favour of the
boys Reports on the relationship between BP and sex have been inconsistent Some have
reported higher mean BP in females54-56 others higher in males5883 while yet another
reported no sex differences22 The findings of this study were similar to those of Bugaje
Yakubu and Ogala21 and Ujunwa Ikefuna and Nwokocha100 who reported a consistently
higher mean blood pressure in female adolescents up to 16 years compared to their male
counterparts of similar ages Early female predominance in mean blood pressure was also
reports by Agyemang Redekop and Owusu-Dabo et al59 in Ashanti adolescents in Ghana
and Obika Adedoyin and Olowoyeye22 in Illorin The finding was however in contrast
with the study in Calabar58 where higher mean BP was found in boys than girls at all
ages The reason for the higher mean BP in females than boys could be because of earlier
onset of puberty in girls The differences in blood pressure between boys and girls in this
study could also be accounted for by variation in the anthropometric variables of the
individuals as girls were seen to be heavier and taller up to middle adolescence
This study demonstrated a consistently positive relationship between blood
pressure and the anthropometric variables of weight height body mass index and waist
63
circumference as widely reported in other studies 545558-6165107100 Weight is reported to
correlate positively with blood pressure in several studies53565871 Body mass index
(BMI) also showed a positive relation with BP in this study as reported in other
studies5978-81 This is in-keeping with the findings in Port Hacourt71 Abeokuta83 the
Gambia69 Brazil82 and Belgrade77 children Some of these studies however were made
up of younger and older age groups Even in lean populations BMI is known to correlate
positively with BP Waist circumference was also found in this study to correlate
positively with BP This was similar to reports from other studies79-8183 It was found to
be a better predictor of BP in two Italian study8081 while it was not in another82
Comparing BMI and waist circumference and their effects on BP Arauzo Lopes and
Moriera et al82 in Brazilian children found BMI to be a better predictor of BP than waist
circumference This was similar to the report by Sebanjo and Oshikoya83 in Nigerian
adolescents in Akure Guagnano Ballone and Colagrande et al81 however found waist
circumference to be better than BMI The study81 however involved adults and may not
be applicable in children and adolescents The present study demonstrated BMI and WC
to be significant but found BMI to be a better determinant of BP than waist
circumference BMI and waist circumference measure obesity in an individual Whereas
BMI is a measure of overall obesity WC measures centralabdominal fat accumulation
and thus said to be more predictive of adverse health risk79 Obese individuals may be
prone to such condition as dyslipidaemia insulin resistance and hypertension with
reduction in the quality of life Weight BMI and or waist circumference affects blood
pressure through decreased physical activity increased cardiac output insulin resistance
impaired pulmonary function and other hormonal abnormalities8084 It seems therefore
that BMI is a better predictor of BP in adolescents than waist circumference The reason
64
for this is not obvious but it may be because of the nature of uniform fat distribution in
adolescents associated with growth and hormonal changes at puberty
Blood pressure distribution in relation to the parental socio-economic class in this
study showed that students from low socio-economic classes had higher mean blood
pressure than those from upper socioeconomic classes but this was not statistically
significant A study in Ibadanl56 reported a statistically significant negative relation
between blood pressure and parental socio-economic status It was also similar to the
study58 in Calabar In contrast other studies found the reverse536022 The reasons for the
inverse relationship between BP and socioeconomic includes exposure to chronic
environmental stress with sustained sympathetic nervous system stimulation Others are
poor health seeking behaviours due to low income andor inadequate health knowledge
high low birth weight rate and inadequate healthy diets among others97101 In the same
environment individuals from a high social class are believed to be more educated with
high income61 They have easy access to health education and awareness on hypertension
prevention and control and better accessibility and adherence to medical treatment617374
The former might be responsible for the finding of this study as Jalingo is a semi urban
community Most of its inhabitants are subsistent farmers civil servants and traders with
low income The high number of students in the lower socioeconomic class lays credence
to that
The overall point prevalence of hypertension in this study was 44 while that of
pre-hypertension was 221 This prevalence of hypertension is similar to the prevalence
of 48 by Antia-Obong and Antia-Obong107 but higher than the prevalence rate of 37
reported in Zaria21 and lower than the prevalence of 58 reported in Ibadan56 54 in
Enugu100 and the 72 reported in Kano65 The prevalence of pre-hypertension was lower
than that reported by Ejeke Ugwu and Ezeanyika99 who found a prehypertensive
65
prevalence of 25 among adolescents in Lokoja It is higher than the 173 reported by
Ujunwa Ikefuna and Nwokocha et al100 in Enugu and 12-17 by Redwine and
Daniels96 among US adolescents The differences in the reported prevalence of
hypertension and prehypertension in adolescents could have resulted from the different
criteria applied by the various researchers in defining hypertension For instance whereas
this study used BP greater than 95th percentile as hypertension a study in Kano65 used the
adult hypertensive value of BPgt14090mmHg as hypertension and got a prevalence of
72 The prevalence in that study65 could have been higher if the percentile or the
statistical definition was used as many children with BP 14090mmHg would probably be
at stage 2 hypertension This was demonstrated in the study by Bugaje Yakubu and
Ogala21 who found a prevalence of hypertension in their study to be 06 when the adult
cut off value of gt14090mmHg was used but it increased to 37 when the statistical
definition of BPgt 2 standard deviations was used
The number of times blood pressure is taken could affect the outcome as repeated
measurements over a time interval is known to give lower BP values than if BP is taken
once This study used the average of three blood pressure values taken at one sitting but
Ujunwa Ekefuna and Nwokocha100 took three readings at five minutes interval with two
other readings at a week interval In that study100 the prevalence of prehypertension
dropped from 745 during the first set of readings to 173 after the third week
readings The prevalence of hypertension also dropped from 135 to 54 over the same
period Similar decrease in the prevalence of both prehypertension and hypertension was
reported by Redwine and Daniels96 in US adolescents when blood pressure was taken
over time interval Another factor which might have affected the overall prevalence is the
Korotkoff sound used for diastolic pressure23 The 4th or 5th Korotkoff sounds has been
used by different researchers resulting in different diastolic BP The study21 in Zaria used
66
the 4th Korotkoff sound while most other researchers2265100 used the 5th About 5-
10mmHg difference is said to exist between the 4th and 5th Korotkoff sounds230 In this
study the 5th Korotkoff sound was used thus giving a higher prevalence of hypertension
in the studied population than in those where the 4th sound was used
The implication of the outcome of this study is that 44 of adolescents in Jalingo
are already hypertensive while 221 of them are at risk of developing hypertension as
they are pre-hypertensive Since 856 (255 of 298) of the prehypertensives were in the
middle and late adolescence these individuals are likely to be adults with high blood
pressure Therefore regular screening of this group of individuals who were assumed to
be a healthy population is highly important for early detection of hypertension and
intervention such as life style changes and treatment
67
CONCLUSIONS
The following conclusions can be made from this study
1 The mean and range of blood pressure of adolescents in Jalingo was similar to
those of other adolescents in Nigeria and other parts of the world Blood pressure
increased progressively with age
2 All measured anthropometry of weight height body mass index and waist
circumference correlated positively with BP but weight was the most significant
variable in BP determination
3 Socioeconomic status was not significantly related with blood pressure
4 The point prevalence of hypertension and pre-hypertension was 44 and 221
respectively using a recommended definition
RECOMMENDATIONS
1 In view of the high prevalence of prehypertension in this study it is recommended
that students should have their blood pressure measured at school entry as this will
68
help identify those with abnormal BP for early intervention Thereafter BP check
should be offered at least once a year at the beginning of a new session especially for
those found with abnormal BP at school entry
2 Physical and health education should be revived in all the schools This will lead to
increased physical activity and reduced risk of obesity and its consequences
3 School health programmes should be strengthened in schools where it already exist
and effort made to establish same in schools where it is yet to exist The programme
should include measures to detect early prehypertension and hypertension and other
health related needs of the students
LIMITATIONS
The following limitations were encountered in the course of the study
1 Exclusion and inclusion of students that were based on volunteered information and
physical evaluation This could have led to inclusion andor exclusion of adolescentss
69
with or without background renal diseases which could have affected the result of this
study
2 Home blood pressure measurement especially early morning measurement for those
with high blood pressure to possibly eliminate the effect of stress traffic andor
trekking and other school related stresses which may affect blood pressure during the
day
LINES OF FUTURE RESEARCH
This study was questionnaire based and time bound Consequently students were not
investigated for background diseases co-mordid conditions target organ damage or risk
factors for high blood pressure They were also not followed up In view of this future
research on blood pressure in adolescents should include-
70
1 Investigations such as urinalysis electrolytes urea and creatinine random blood
sugar (RBS) lipid profile and echocardiography as part of blood pressure evaluation
in adolescents
2 A long period of study to allow for follow-up over months or years to identify those
that are truly hypertensive considering the definition of hypertension It will also
reveal the rate of progression from pre-hypertension to hypertension
3 Risk factors evaluation for high blood pressure including genetic predispositions
REFERENCES
1 Blood pressure from Wikipedia the free Error Hyperlink reference not valid
Accessed 24th November 2011
2 Pickering TG Hall JE Appel LJ Falkner BE Graves J Hill MN Jones DW Kurtz T
Sheps SG Roccella EJ Recommendations for blood pressure measurement in humans
and experimental animals Part 1 Blood pressure measurement in humans A
statement for professionals from the subcommittee of professional and public
71
education of the American Heart Association council on high blood pressure research
Hypertension 2005 45 142-61
3 da Silva IRR de Souza MDG de Camargo CAC Blood pressure measurement in
children and adolescents Guidelines of high blood pressure recommendations and
current clinical practice Arq Bras Cardiol 2007 88 434-7
4 Sinaiko AR Hypertension in children N Engl J Med 1996 3351968-73
5 US Preventive Services Task Force Screening for high blood pressure
recommendations and rationale Am J Prev Med 2003 25 159-64
6 Report of the second task force on blood pressure control in children Pediatrics 1987
79 1-25
7 National high blood pressure education programme working group on hypertension
control in children and adolescents update on the 1987 task force report on high blood
pressure in children and adolescents A working group report from the national high
blood pressure education program Pediatrics 1996 98 649-58
8 National high blood pressure education program working group on high blood
pressure in children and adolescents The fourth report on the diagnosis evaluation
and treatment of high blood pressure in children and adolescents Pediatrics 2004
114 255-76
9 Aderele WI Seriki O Hypertension in Nigerian children Arch Dis Child 1974
49313-7
10 Bo S Gambino R Gentile L Pagano G Rosato R Saracco GM Cassader M
Durazzo M Cavallo-Perin P High-normal blood pressure is associated with a cluster
of cardiovascular and metabolic risk factors a population based study J Hypertens
2009 27 102-8
72
11 Bao W Threefoot SA Srinivasan SR Berenson GS Essential hypertension
predicted by tracking of elevated blood pressure from childhood to adulthood The
Bogalusa Heart Study Am J Hypertens 1995 8 657- 65
12 Richard A Rodgers M Hedley AJ Mitchel JRA Changes in blood pressure and
blood lipid during adolescence BMJ 1980 28 1563-6
13 Sundstroumlm J Neovius M Tynelius P Rasmussen F Association of blood pressure in
late adolescence with subsequent mortality cohort study of Swedish male conscripts
BMJ 2011 342 643-8
14 Zimmet P Alberti G Kaufman F Tajima N Silink M Arslanian S Wong S Bennett
P Shaw J Caprio S On behalf of the International Diabetes Federation Task Force on
Epidemiology and Prevention of Diabetes The metabolic syndrome in children and
adolescents the IDF consensus Diabetic Voice 20075229-32
15 Abdulrahman FA Babaoye AA Childhood hypertension in northern Nigeria West
Afr J Med 1978 1 7-11
16 Adediran O Jimoh A Di M Relationship between body mass index and blood
pressure in rural Nigerian dwellers Internet J Nutri Wellness 2009 7 431-4
17 World Health Organization (WHO)UNICEF Adolescence at a glance 2003 p 2
18 The National Population Commission constitution of the Federal Republic of Nigeria
(AP 23 LFN) legal notice on publication issued April 21st 2007
19 Heald FP and Gong EJ Diet Nutrition and adolescents In Shils ME and Ross AC
(eds) Modern Nutrition in Health and Disease 9th ed William and Wilkins
Maryland USA 1999 p 32
20 Okonkon CT The prevalence of Hypertension among civil servants in Calabar Nig
Med J 1979 7422-5
21 Bugaje MA Yakubu AM Ogala WN Prevalence of adolescent hypertension in Zaria
Nig J Paediatr 2005 32 77-82
73
22 Obika LF Adedoyin MA Olowoyeye JO Pattern of paediatric blood pressure in
rural semi urban and urban communities in Ilorin Nigeria Afri J Med Sci 1995 24
371-7
23 Jeremy B A short history of blood pressure measurement section of the history of
medicine Proc Roy Soc Med 1977 70 793-9
24 Lewis O Stephen Hales and the measurement of blood pressure J Hum Hypertens
1994 8 865-71
25 Crile GW Blood Pressure in Surgery An experimental and Clinical Research
Philadelphia Lippincott 1903 p 358
26 Lewis WH The evolution of clinical sphygmomanometer Bull N Y Acad Med 1941
17 871-81
27 Browne WC OrsquoBrien ET Semple PF The sphygmomanometer of Riva Roci 1896-
1996 J Hum Hypertens 1994 610 723-4
28 Segal HN How Korotkoff the Surgeon discovered the auscultatory method of
measuring arterial pressure Ann Intern Med1975 83 561-2
29 Goodman FH and Howell AA Clinical studies in the auscultatory method of
determining blood pressure University of Pennsylvania Bulletin 1911 23 469-75
30 Crenner CW Introduction of the blood pressure cuff into US medical practice
technology and skilled practice Ann Intern Med 1998 128 488-493
31 Ganon WF Circulation In Review of Medical Physiol Lange Medical Publication
New York 22nd edition 2005 p 234-63
32 Beth C Homeostatic Regulation of Blood pressure Available from
URLhttpwwweHowcom Accessed on 1st December 2011
33 Rajinder KG Fahim M Regulation of cardiovascular functions during acute blood
loss Indian J Physiol Pharmacol 2005 49 213ndash9
74
34 Dampney AL Coleman MJ Fonts MAP Hirooka Y Horiuchi J Polson JW Potts
PD Tagawa T Central mechanisms underlying short-term and long-term regulation
of the cardiovascular system Proc Austr Physio Pharmacosociety 2001 32 333-44
35 Koshiya N Guyenet PG Noradrenergic neurons and the carotid sympathetic
chemoreflex Am J Physiol 1994 267 519-26
36 Prakash ES The ultimate goal in neural regulation of cardiovascular function Adv
Phyiol Educ 2008 32 107-8
37 Allen AM Inhibition of the hypothalamic paraventricular nucleus reduces
sympathetic nerve discharge and blood pressure Proc Austr Neuroscience Society
2001 29 44-7
38 Reid IA Interactions between ANG II sympathetic nervous system and
baroreceptor reflexes in regulation of blood pressure Am J Physiol 1992 262 763-
78
39 Brooks VL Osborn JW Hormonal-sympathetic interactions in long-term
regulation of arterial pressure A hypothesis Am J Physiol 1995 268 1343-58
40 Reckelhoff JF Gender Differences in the Regulation of Blood Pressure
Hypertension 2001 37 1199-208
41 Fink GD The systemic circulation as a regulated free-market economy A new
approach for understanding the long-term control of blood pressure Clin Exp
Pharmacol Physiol 2005 32 377ndash83
42 Benard K Sources of error in blood pressure measurement Hospital Physician 2002
12 33-7 Available from URLhttp wwwturnerwhitecom
43 Chyun DA A comparism of intra arterial and auscultatory blood pressure readings
Heart lung 1985 14 223-31
75
44 Nwankwo MU Lorenz JM Gardiner JC A Standard Protocol for Blood Pressure
Measurement in the Newborn Pediatrics 1997 99 1342-9
45 Deakin CD Low JL Accuracy of the advanced trauma life support guidelines for
predicting systolic blood pressure using carotid femoral and radial pulses
observational study BMJ 2000 321 673ndash4
46 OrsquoBrian E Replacing mercury sphygmomanometers require clinician to demand
better automated device BMJ 2000 320 815-6
47 McKay DW Raju MK Campbell NR Assessment of blood pressure measuring
techniques Med Educ 1992 26 208ndash12
48 Baker RH Ende J Confounders of auscultatory blood pressure measurement J Gen
Intern Med 1995 10 223ndash31
49 Neufeld PD Johnson DL Observer error in blood pressure measurement CMAJ
1986 135 633ndash7
50 van Montfrans GA Oscillometric blood pressure measurement progress and
problems Blood Press Monit 2001 6 287ndash90
51 Ware RW Laenger CJ Indirect blood pressure measurement by Doppler ultrasonic
kinetoartriography Proceedings 20th Annual Conference Engineering Medical
Biology 1967 9 27-30
52 Matthew Fox Blood pressure measurement technique Available from URL http
wwwlivestrongcom Last edited 2nd September 2010 Accessed on 30th November
2011
53 Akor F Okolo SN Okolo AA Blood pressure and anthropometric measurements in
healthy Primary School entrants in Jos Nigeria SAJCH 2010 4 42-5
54 Merhi BM Al-Hajj F Al-Tannir M Zaide F El-Rajab M A survey of blood pressure
in Lebanese children and adolescents North Am J Med Sci 2011 3 24-9
76
55 Al-Salloum AA El-Mouzan AH Al-Herbish AS Al-Umar AA Qurashi MM Blood
pressure standard for Saudi children and adolescents Ann Saudi Med 2009 29 173-8
56 Akinkugbe FM Akinwolere AO Kayode CM Blood Pressure Pattern in
Adolescence West Afri J Med 1999 18 196-202
57 Wanzhu T Eckert GJ Saha C and Pratt JH Synchronization of Adolescent Blood
Pressure and Pubertal Somatic Growth J Clin Endo Metab 2009 94
58 Ansa VO Anah MU Odey FA Mbu PN Agbor EI Relationship between parental
socioeconomic status and casual blood pressure in coastal Nigeria Adolescents West
Afri J Med 2010 29146-52
59 Agyemang C Redekop WK Owusu-Dabo E Bruijnzeels MA Blood pressure
patterns in rural semi-urban and urban children in the Ashanti region of Ghana West
Africa BMC Public Health 2005 5114-21
60 Ejeke CCE Ugwu CE Ezeanyika LUS Olayemi AT Blood pressure patterns in
relation to geographic area of residence a cross-sectional study of adolescents in Kogi
state Nigeria BMC Public Health 2008 8 411-5
61 Colhoun HM Hemminway H Poulter WR Socioeconomic status and blood
pressure an overview analysis J Human Hypertension 1998 12 91-110
62 Badaruddoza KR Familial aggregation and heritability for cardiovascular risk factors
a family based study in Punjab India Natural Science 2010 2 732-6
63 Livshits G Gerber LM Familial factors of blood pressure and adiposity co-variation
Hypertension 2001 37 928-35
64 Fermino RC Seabra A Garganta R Antoacutenio J Maia R Genetic factors in familial
aggregation of blood pressure of Portuguese nuclear families Arq Bras Cardiol 2009
92 463-9
77
65 Mijinyawa MS Iliyasu Z Borodo MM Prevalence of hypertension among teenage
students in Kano Nigeria Nig J Med 2008 17 173-7
66 The Wellcome Trust case control consortium Genome-wide association study of
14000 cases of seven common diseases and 3000 shared controls Nature 2007 447
661-78
67 Levy D Destefano AL Larson MG ODonnell CJ Lifton RP Gavras H Evidence for
a gene influencing blood pressure on chromosome 17 genome scan linkage results for
longitudinal blood pressure phenotypes in subjects from the Framingham heart study
Hypertension 2000 36 477- 83
68 Lifton RP Wilson FH Choate KA Geller DS Salt and blood pressure new insight
from human genetic studies Cold Spring Harb Symp Quant Biol 2002 67 445ndash50
69 van der Sande MA Milligan PJ Nyan OA Rowley JT Banya WA Ceesay SM
Dolmans WM Blood pressure patterns and cardiovascular risk factors in rural and
urban Gambian communities J Hum Hypertens 2000 14 489-96
70 Akinkugbe OO Ojo OA Arterial blood pressure in rural and urban population of
Nigeria BMJ 1969 2 22-4
71 Okagua J Anochie IC Akani NA Adolescent blood pressure in Rivers State Nigeria
A rural-urban comparism NJP 20154221-7
72 Urrutia-Rojas X Egbuchunam CU Bae S Menchaca J Bayona M Rivers PA Singh
KP High blood pressure in school children Prevalence and risk factors BMC
Pediatrics 2006 6 32-9
73 Sorof JM Lai D Turner J Poffenbarger T Potman R Overweight ethnicity and the
prevalence of hypertension in school-aged children Pediatrics 2004 113 475-82
78
74 Rosner B Prineas R Daniels SR Blood pressure differences between blacks and
whites in relation to body size among US children and adolescents Am J Epidemiol
2000 151 1007-18
75 Harding S Whitrow M Lenguerrand E Maynard M Teyhan A Cruickshank JK Der
G Ethnic differences in blood pressure in adolescence the determinants of adolescent
social well-being and health study Hypertension 2010 55 1063-9
76 Cruickshank JK Mzayek F Liu L Kieltyka L Sherwin R Webber LS Srinavasan SR
Berenson GS Origins of the ldquoblackwhiterdquo difference in blood pressure roles of birth
77 Vlajinac H Miljus D Adanja B Marinkoic J ipetic S Kocev N Blood pressure levels
in 7 to 14-year-old Belgrade children J Human Hypertension 2003 17 761ndash5
78 Menezes AMB Hallal PC Dumith SC Adolescent blood pressure body mass index
and skin folds sorting out the effects of early weight and length gains J Epid Comm
Health 2011 12 42-8
79 Karelis AD St-Pierre DH Conus F Rabasa-Lhoret R Poehlman EJ Metabolic and
body composition factors in subgroups of obesity what do we know J Clin Endo
Metab 2004 89 2569-75
80 Katzmarzyk PT Srinivasan ER Chen W Malina RM Bouchard C Berenson GS
Body mass index waist circumference and clustering of cardiovascular disease risk
factors in a biracial sample of children and adolescents Pediatrics 2004 114 198-205
81 Guagnano MT Ballone E Colagrande V Della Vecchia R Manigrasso MR Merlitti
D Riccioni G Sensi S Large waist circumference and risk of hypertension Int J
Obesity 2001 25 1360 ndash 4
82 Araujo TA Lopes MVO Moriera RP Cavalcante TF Gurdes NG MartinS dA Silva
V Blood pressure of children and teenagers from a public school in Fortaleza - Cearaacute
Acta paul enferm 200720103-15
79
83 Sebanjo IO Oshikoya KA Obesity and blood pressure levels of adolescents in
Abeokuta Nigeria Cardiovasc J Afr 2011 221-5
84 Messerli FN Obesity and essential hypertension Haemodynamics sodium excretion
and plasma rennin activity Arch Int Med 1981 141 81-5
85 Appel LJ Brands MW Daniels SR Karanja N Elmer PJ Sacks FM Dietary
Approaches to Prevent and Treat Hypertension A Scientific Statement from the
American Heart Association Hypertension 2006 47 296-308
86 Sacks FM Svetkey LP Vollmer WM Appel LJ Bray GA Harsha D Obarzanek E
Conlin PR Miller ER 3rd Simons-Morton DG Karanja N Lin PH for the DASH-
Sodium Collaborative Research Group Effects on blood pressure of reduced dietary
sodium and the Dietary Approaches to Stop Hypertension (DASH) diet DASH-
Sodium Collaborative Research Group N Engl J Med 2001 344 3ndash10
87 Appel LJ Moore TJ Obarzanek E Vollmer WM Svetkey LP Sacks FM Bray GA
Vogt TM Cutler JA Windhauser MM Lin PH Karanja N A clinical trial of the
effects of dietary patterns on blood pressure DASH Collaborative Research Group N
Engl J Med 1997 3361117ndash24
88 Appel LJ Sacks FM Carey VJ Obarzanek E Swain JF Miller ER 3rd Conlin PR
Erlinger TP Rosner BA Laranjo NM Charleston J McCarron P Bishop LM for the
OmniHeart Collaborative Research Group Effects of protein monounsaturated fat and
carbohydrate intake on blood pressure and serum lipids results of the OmniHeart
randomized trial JAMA 2005 294 2455ndash64
89 Karanja NM Obarzanek E Lin PH McCullough ML Phillips KM Swain JF
Champagne CM Hoben KP Descriptive characteristics of the dietary patterns used in
the Dietary Approaches to Stop Hypertension Trial DASH Collaborative Research
Group J Am Diet Assoc 1999 99 19ndash27
80
90 Nwokocha ARC Adolescence and associated problems In Azubuike JC and
Nkanginieme KEO (eds) Paediatrics and Child Health in a Tropical Region African
Educational Services Owerri Nigeria 2nd edition 2007 p 84-99
91 Rogol RT Roemmich JN Clark PA Growth and puberty J Adol Hlth 2002 31 192-
200
92 Tanner JM Marshal WA Variation in the pattern of puberty changes in boys and girls
Arch Dis Child 1970 45 13-23
93 Nwakoro SO Ifoda K Onochie O Olomu JM Anthropometric assessment of
nutritional status and growth of 10-20 years individuals in Benin City metropolis
Nigeria Pakistan J Nutr 2006 5 117-21
94 Shankar RR Eckert GJ Saha C Tu W Pratt JH The change in blood pressure during
pubertal growth J Clin Endo Metab 2005 90 163-7
95 Department of Health and Human Services 2000 CDC Growth Charts for the United
States methods and development Series Report 11 No 246 Available from URL
httpwwwcdcgovGrowthCharts
96 Redwine KM Daniels SR Prehypertension in Adolescents Risk and Progression
Journ Clin Hypertension 2012 14 360ndash4
97 Falkner B Gidding SS Portman R Rosner B Blood pressure variability and
classification of prehypertension and hypertension in adolescence Pediatrics 2008
122238ndash42
98 Redwine KM Acosta AA Poffenbarger T Development of hypertension in
adolescents with pre-hypertension J Pediatr 2012 16098ndash103
99 Ejike ECCC Ugwu CE and Ezeanyika LUS Variations in the prevalence of point
prehypertension in a Nigerian school-going adolescent population living in a semi-
urban and an urban area BMC Pediatr 2010 1013
81
100 Ujunwa FA Ikefuna AN Nwokocha AR Chinawa JM Hypertension and
prehypertension among adolescents in secondary schools in Enugu South East Nigeria
Italian J Pediatr 20133970-5
101 Chobanian AV Bakris GL Black HR Seventh report of the Joint National
Committee on Prevention Detection Evaluation and Treatment of High Blood
Pressure Hypertension2003 421206ndash52
102 Lande MB Systemic Hypertension In Kliegman RM Behrman RE Jenson HG and
Stanton BF (eds) Nelson Textbook of Pediatrics Saunders Elsevier Philadelphia 19th
Edition 2011 pg 1592-8
103 Luma GB Spiotta RT Hypertension in Children and Adolescent Am Fam Physician
2006 73 1558-68
104 Arvind B Rupesh J Vijayakumar M Madhuri K Ali U Evaluation and management
of hypertension Indian Paediatr 2007 44 103-21
105 Flynn JT Neonatal hypertension Diagnosis and management Pediatr Nephrol 2000
14 332-41
106 Steyn K de Wet T Richter L Cameron N Levitt NS Morrel C Cardiovascular
diseases risk factors in 5-year old urban South African children- The Birth to Ten
Study SAMJ 2000 90 7126
107 Antia-Obong OE Antia-obong LE Arterial blood pressure of Nigerian Urban and
Rural school children Nig J Paediatr 1991 18 3-11
108 Nguyen NT Magno CP Lane KT Hinojosa MW Lane JS Association of
hypertension diabetes dyslipidemia and metabolic syndrome with obesity findings
from the National Health and Nutrition Examination Survey 1999 to 2004 J Am Coll
Surg 2008 207 928-34
82
109 Solar MB Gill A Rey J Epidemiology of arterial blood pressure in school children
population Aten Primaria 1992 9 212-4
110 Steyn K de Wet T Richter L Cameron N Levitt NS Morrel C Cardiovascular
diseases risk factors in 5-year old urban South African children- The Birth to Ten
Study SAMJ 2000 90 7126
111 Linkas J The assessment and management of hypertensive emergencies and
urgencies in children Pediatr Emerg Care 2005 21391-6
112 Croix B Feig DI Childhood hypertension is not a silent disease Pediatr Nephrol
2006 21527-32
113 Flynn JT Anderson MH Characteristics of children with primary hypertension seen
at a referral centre Pediatr Nephrol 2007 44 103-21
114 Nakao M Yano E Nomura S Kuboki T Blood pressure lowering effects of
biofeedback treatment in hypertension a meta-analysis of randomized controlled trials
Hypertension 2003 26 37- 46
115 Jalingo Available from URLhttpwwwencyclopedia Britanica Accessed on 3rd
December 2011
116 Araoye MO Research Methodology with Statistics for Health and Social Sciences
Nathadex Publishers Saw-Mill Ilorin Nigeria 2004 pg 115-21
117 Olusanya O Okpere E Ezimokhai M The importance of social class in voluntary
fertility control in a developing country West Afr J Med 1985 4 205-12
118 World Health Organization expert committee Physical status the use and
interpretation of anthropometry WHO technical report series No 894 Geneva WHO
1995 p 424ndash38
119 Guidelines subcommittee WHOISH guideline for management of hypertension J
Hypertens 1999 17 151-83
83
120 Aubay B How to measure waist circumference Available from
URLhttpwwwehowcom Last updated August 10th 2011 and accessed on December
9th 2011
APPENDICES
Appendix 1
PROFORMA ON BLOOD PRESSURE PATTERN IN APPARENTLY HEALTHY
SECONDARY SCHOOL ADOLESCENTS IN JALINGO
PUBLIC SCHOOL [ ]
Serial No
84
PRIVATE SCHOOL [ ]
A BIODATA
1 Age (years) 10[ ] 11[ ] 12[ ] 13[ ] 14[ ] 15[ ] 16[ ] 17[ ] 18[ ] 19[ ]
2 Gender M [ ] F [ ]
3 Class JSS 1-3 [ ] SS1-3 [ ]
B MEDICAL AND SOCIAL HISTORY Yes [1] No [2]
1 Have you ever passed blood in your urine [ ]
2 Have you ever had your face or legs swollen [ ]
3 Are you on any drug for long time (such as pills steroids marijuana codeine
NSAIDs containing drugs tramal and others) [ ]
If yes specifyhelliphelliphellip
C SOCIO-ECONOMIC CLASSIFICATION
Fatherrsquos occupation
Score 1 Professionals top civil servants politicians and top businessmen
2Middle-level civil servants technicians skilled-artisans and well-to-do
traders
3 Unskilled workers and those in general whose income would be at or below
the national minimum wage
Mothers educational level
Score 0 Education up to University level
1 Secondary or tertiary level below the University
2 No formal education or up to primary level only
D ANTHROPOMETRY
i Weight (Kg) ndash 1helliphellip 2helliphelliphellip Averagehelliphelliphelliphellip
ii Height (m) ndash 1helliphellip 2helliphellip Averagehelliphelliphelliphellip
85
iii Body mass index = weightheight (kgm2)
v Waist circumference (cm) ndash 1helliphellip 2helliphelliphellip Averagehelliphelliphelliphellip
iv Blood Pressure (mmHg) - 1helliphellip 2hellip 3helliphellip Averagehelliphelliphelliphellip
Appendix 2
AUTHORIZATION AND CONSENT TO PARTICIPATE IN A RESEARCH
I Dr Peter Teru Yaru of the Department of Paediatrics Ahmadu Bello University
Teaching Hospital (ABUTH) Zaria Irsquom conducting a research on the blood pressure
pattern among secondary school adolescents in Jalingo
The aim of the study is to know the level of blood pressure among their age
groups Those with high blood pressure (or hypertension) will be identified appropriately
advised and referred for further care The study will involve taking their weight height
blood pressure and waist circumference Female assistants shall be responsible for
86
measuring waist circumference of female students Students will also be given a
questionnaire on some of their activities drug use among others all aimed at looking for
factors which can affect their blood pressure Information obtained shall be treated with
utmost confidentiality and for this research work only Please note that participation is
voluntary I will be glad if you give consent for your childward to participate in the
study
Statement by parents Irsquove read and understood this consent form and agreed for my
child to be included in the study
Parents name Researcherrsquos name and sign
Parents phone no if any Date
Parents signthumb print Phone no
87
Appendix 3
SOCIO-ECONOMIC SCORE
The classification of socio-economic scores based on fatherrsquos occupation and motherrsquos
education by Olusanya et al117
A Husband (fatherrsquos occupation)
Score 1 Professionals top civil servants politicians and businessmen
2 Middle-level bureaucrats technicians skilled-artisans and well-to-do traders
3 Unskilled workers and those in general whose income would be at or below
the national minimum wage
B Mothers educational level
Score 0 Education up to University level
1 Secondary or tertiary level below the University
2 No formal education or up to primary level only
The socio-economic class of the childrsquos mother is obtained by adding the scores from A
and B above and graded I-V as appropriate for example
Score (1) from A plus score (0) from B = social class I
Score (2) from A plus score (0) from B = social class II
Score (2) from A plus score (1) from B = social class III
Score (2) from A plus score (2) from B = social class IV
Score (3) from A plus score (0) from B = social class III
Score (3) from A plus score (1) from B = social class IV
Score (3) from A plus score (2) from B= social class V
Page 10
10
SUMMARY
A cross sectional study of blood pressure pattern in apparently healthy secondary school
adolescents aged 10-19years in Jalingo Taraba state was carried out over six months period
from January to July 2014 One thousand three hundred and fifty (1350) students
participated comprising 628 (465) boys and 722 (535) girls Variables measured
included blood pressure weight height waist circumference and body mass index was
calculated from the weight and height
Overall the mean anthropometric values and blood pressure increased with age
irrespective of sex The mean weight of the students was 486plusmn109kg with a range of 23-
100kg while the mean height was 16plusmn01m and ranged from 12-19m The mean waist
circumference was 656plusmn89cm and ranged from 22-100cm while the meanbody mass index
(BMI) was 189plusmn31 with a range of 114-420
The overall mean systolic blood pressure was 1089plusmn125mmHg with a range of 76-
165mmHg whilethe mean diastolic blood pressure was683plusmn82mmHg and ranged from 47-
95mmHg The gender related differences in blood pressure showed mean systolic blood
pressure for boys and girls to be 1081plusmn133mmHg and 1095plusmn117mmHg (t=-2054
p=0040) while the mean diastolic blood pressurewas 678plusmn81mmHg and
687plusmn82mmHg(t=-2077 p=0038) respectively Girls generally had a higher mean systolic
blood pressure than boys from early adolescence (t=3754 p=0007) to middle adolescence
(t=-3025 p=0011) but reversed during late adolescence with boys having higher mean
systolic blood pressure (t=2145 p=0033) and these differences were statistically significant
Girls also showed dominance in the diastolic blood pressurein early and middle adolescence
but only statistically significant during middle adolescence (t=-3517 plt0000) Adolescents
from private schools had higher meansystolic blood pressure of 1102plusmn123mmHg than those
11
from public schools with 1084plusmn125mmHg(t=-222 plt0027)and higher mean diastolic
blood pressure of 703plusmn80mmHg than those from public schools with 677plusmn81mmHg(t=-
461 p=0000)
Blood pressure correlated positively with age (r=030-035 plt0000) height (r=034-
044 plt0000) weight (r=038-051 plt0000) body mass index (r=029-040 plt0000) and
waist circumference (r=023-031 plt0000) The socio-economic class associated negatively
with blood pressure withthose from upper socio-economic classeshavinga relatively
lowermean blood pressure than their counterparts from lower socio-economic classes but the
differences were not statistically significant for both systolic (f=1650 p=2850) and diastolic
blood pressure (f=0193 p=0058)
The overall point prevalence of hypertension was 44(59 0f 1350) with gender specific
prevalence for malebeing 41 (26 of 628 boys) and46 (33 of 722 girls) for females The
gender difference was not statistically significant (χ2=0831 p=0362) According to stages of
hypertension 15 (10 of 628)and 11 (7 of 628) males had stages 1 and 2 systolic
hypertension respectively while24 (15 of 628) had stage 1 diastolic hypertension andnone
had stage 2 diastolic hypertension Similarly 24 (17 of 722) and 12 (9 of 722) females
had stages 1 and 2 systolic hypertension respectively while 12 (9 of 722) and only 01 (1
of 722) girls had stages 1 and 2 diastolic hypertension respectively The overall prevalence of
pre-hypertension was 221(298 of 1350) with gender related prevalence of 21 (131 of
628) for males and231 (167 of 722) for femalesThe gender difference was statistically
significant (χ2=4349 p=0037)
In view of the high prevalence of pre-hypertension of 221 (298 of 1350) in this
study it is recommended that blood pressure measurement should be included as part of
medical evaluation at secondary school entry and at least annually thereafter especially for
those found to be at risk of hypertension during school entry
12
INTRODUCTION
Blood pressure (BP) is the pressure exerted by circulating blood volume on the walls of
blood vessels1 It is one of the vital signs measured during routine physical examination2
Blood pressure measurement is done to screen for hypertension and other cardiovascular
risk factors determining risk for various medical procedures identifying patients in
potential or actual clinical deterioration and determining individualrsquos fitness for an
occupation3 Its value as a screening tool in adults has long been documented and is an
established important component of routine paediatric physical examination4
The importance of BP measurement in children and adolescents is based on the fact
that hypertension is now increasingly diagnosed among them5-8 The American Academy
of Paediatrics now recommends routine screening of asymptomatic adolescents and
children during preventive care visits Such screening will identify potentially treatable
and preventable causes of hypertension and initiate early treatment to prevent
complications5
Hypertension is an important health problem all over the world5-9 because it is
usually silent and the presence of symptoms may indicate end organ damage10 It is
known to track well into adulthood thus making BP measurements in youths valuable for
identifying adolescents at risk of essential hypertension in adulthood11 Individuals with
high BP in their childhood are more likely to have high BP in subsequent years12 The
phenomenon of BP tracking into adulthood and the demonstration of the beginnings of
hypertensive target organ damage during childhood together with the increased
prevalence of childhood essential hypertension have raised concern of an impending
epidemic of cardiovascular morbidity and mortality10
The consequences of hypertension in children range from increased morbidity
from its causes complications or its treatment to high mortality13 The most frequently
13
and perhaps severely affected organs are the heart kidneys brain and the eyes leading to
lowered life expectancy and premature death13 In addition hypertension is a component
of the metabolic syndrome associated with similar and perhaps more severe consequences
in affected individuals14 Abdulrahaman and Babaoye15 in a study of hypertension in
Nigerian children observed a mortality rate of 28 within the first year after diagnosis
Similar mortality of 275 was reported by Aderele and Seriki9 Hypertension also places
an excessive financial burden on the population and health system consuming scarce
resources16
Adolescence is the transitional period of development between childhood and
adulthood The World Health Organization (WHO) defines adolescents as individuals
between the ages of 10 and 19 years and they account for 40 of Nigeriarsquos population1718
Adolescence is characterized by rapid biological psychological and cognitive changes
largely dependent on hormonal and environmental influences19 Many of the responses to
these influences include behaviours that have direct implications on health such as harmful
dietary intake alcoholism smoking substance abuse and sedentary lifestyle19 These
coupled with social stresses such as city traffic congestion have negative health impact and
predispose to obesity and increased risk of cardiovascular disease such as hypertension and
metabolic syndromes10 20 It has been shown that if preventive measures are started early in
childhood and adolescence they may lead to significant reduction in the high prevalence of
hypertension and metabolic syndrome currently observed in adults81320
JUSTIFICATION FOR THE STUDY
Hypertension is associated with high morbidity affecting major organs of the body such as
the heart kidneys and the brain1314 and a mortality of up to 275-28915 It is now diagnosed
frequently in adolescents with a reported prevalence of 35-952122 The younger the age of
14
onset of hypertension the greater the reduction in life expectancy if left untreated13 Even
asymptomatic adolescents with mild blood pressure elevations can have target organ
damage10 Studies121420 have shown that early identification and intervention may lead to a
significant reduction in the high prevalence of hypertension and metabolic syndrome
currently observed in adults In view of this routine blood pressure check-ups for children
and adolescents have been advocated during medical evaluations8 Blood pressure is
however not routinely measured in most paediatric clinical practices in Nigeria
Consequently only few children will have their blood pressure measured when they fall sick
or during preventive care visits In addition hospital and clinic BP measurements may be
associated with falsely elevated BP called lsquolsquowhite coat hypertensionrsquorsquo8 BP measurement of
children outside of the hospital setting such as in schools will provide opportunity for
apparently healthy individuals and possibly eliminate white coat hypertension The need for
surveillance for the early identification of adolescents in Jalingo who are at risk of
hypertension and to initiate measures aimed at preventing its consequences is therefore the
justification for this study In addition the study will add to the body of knowledge on
adolescent blood pressure as there has been no previous study on BP from Jalingo and
northeastern Nigeria as a whole This will help inform public health policies regarding blood
pressure control and prevention in Taraba State in particular and in Nigeria in general
15
LITERATURE REVIEW
HISTORICAL PERSPECTIVE
Blood pressure measurement first started in the eighteenth century with the experiment of
Stephen Hales to whom its discovery can be attributed as reported by Jeremy2324
Accurate study of blood pressure as reported by Crile25 began with the introduction of a
manometer by Poiseuille a century later The first truly accurate blood pressure
measurement in man was by the Surgeon Faivre in 1856 when he connected an artery to a
mercury manometer to obtain direct readings24 Non-invasive methods of BP
measurement started with the discovery of the sphygmograph in 1855 by Vierordt as
reported by Crile25 and improvement by Potain in 1889 gave birth to the
sphygmomanometer26 In 1896 Scipione Riva-Rocci developed the method upon which
present-day technique is based27
Segal28 reported that the use of stethoscope for BP measurement was first highlighted
in 1905 by a Russian surgeon Korotkoff who documented hearing a tapping sound using a
stethoscope placed over the brachial artery as the Riva-Rocci cuff was deflated Goodman
and Howell29 recommended the division of the changing sounds into five distinct phases and
physicians subsequently determined blood pressure according to the point of appearance and
muffling or disappearance of the sounds30
DEFINITION AND REGULATION OF BLOOD PRESSURE
Blood pressure is defined as the product of cardiac output and peripheral vascular
resistance131 During each heartbeat BP varies between a maximum (systolic) and a
minimum (diastolic) pressure and is measured in millimeters of mercury (mmHg)1 Blood
16
pressure is regulated by different mechanisms acting either rapidly or slowly to maintain it
within normal range for optimal cellular performance3132
Intrinsic Regulation
Intrinsic factors regulating BP include stroke volume and heart rate which both influence
cardiac output31 Stroke volume depends on the volume of blood that fills the ventricles and
this depends on the preload and afterload33 A higher afterload will decrease stroke volume
causing low cardiac output and low BP and vice versa When cardiac output increases more
volume is derived from the venous pool increasing preload Similarly an increased heart rate
will lead to increased cardiac output and BP3134
Reflex Regulation
The baroreceptors within the aortic arch and carotid sinuses contain sympathetic and
parasympathetic nerve fibres3435 These are sensory nerves which run from the medulla
and they respond to stretch of the tissue in which they lie by increasing or decreasing the
rate of signaling36 and act fast in regulating BP34 Sympathetic stimulation causes
increased heart rate and widespread vasoconstriction to increase BP while
parasympathetic stimulation produces the opposite3537
Hormonal Regulation
Hormones regulating blood pressure include renin-angiotensin-aldosterone and
antidiuretic hormone (ADH) They act slowly by responding to changes in intravascular
volume and osmolality38 Angiotensin II is a potent vasoconstrictor and stimulates the
release of aldosterone from the adrenal gland39 Aldosterone increases sodium absorption
and fluid retention leading to increased BP ADH is a potent vasoconstrictor and plasma
volume regulator and its stimulation results in fluid retention and vasoconstriction39
Other hormones regulating BP include the sex hormones thyroid parathyroid cortisol
and ACTH They act on the rennin-angiotensin-aldosterone system to regulate BP3940
17
Renal Regulation
The kidneys control blood pressure through the retention and excretion of extracellular
fluid35 An increase in renal fluid retention will increase extracellular volume and higher
blood pressure whereas increased renal excretion leads to lower blood pressure41 This is
achieved through the action of ADH aldosterone and atrial natriuretic peptide (ANP)41
METHODS OF MEASURING BLOOD PRESSURE
Blood pressure can be measured by invasive and non-invasive methods
1) Invasive (or direct) method - Blood pressure is most accurately measured invasively
through an arterial line4243 It is the gold standard by which the accuracy of other blood
pressure measuring devices and methods are assessed4344 Chyun43 compared direct and
indirect blood pressure readings in 14 intensive care unit patients and found that the
auscultatory method overestimates the systolic and diastolic BP especially if the VI Kortkoff
sounds is used as an indicator of diastolic BP This can often over estimate reading by as
much as 20 mm Hg43 This study is made up of very small sample size to make general
conclusion on the differences in BP values from the two methods compared Although the
invasive method is the gold standard for true BP measurement it is associated with serious
complications related to arterial catheterization and the procedure itself may be technically
difficult It is mainly used in experimental procedures and in monitoring critically ill patients
in intensive care units42
2) Non invasive (indirect) methods These are simpler and quicker than the invasive
method and are commonly used for routine blood pressure examinations They may
however yield lower accuracy and small systematic differences in numerical results43
These methods include-
18
a) Palpation method - A minimum systolic value can be estimated by palpation Deakin
and Low45 reported that a palpable radial femoral or carotid pulse indicates a minimum
systolic BP of 80 70 and 60 mmHg respectively The study was carried out among adults
and these values could not be applicable in children and neonate whose maximum
systolic BP may be lower than the reported minimum values A more accurate systolic BP
value can be determined by inflating and then deflating sphygmomanometer cuff while
palpating the pulse The systolic BP corresponds to the pressure at which the radial pulse
becomes palpable45 Its disadvantages are that pressure obtained is usually 2-5mmHg less
than those obtained by auscultation and diastolic BP cannot be measured32
b) Auscultation method- Also called the Korotkoff method is the method of choice in
clinical practice142 It involves using a stethoscope and a sphygmomanometer46 The
mercury sphygmomanometer is the gold standard for BP measurement A Riva-Rocci
cuff 27 is placed over the arm and inflated to occlude the brachial artery It is then
gradually deflated until blood flow is re-established accompanied by a tapping sound
which can be detected by the stethoscope held over the artery Five sounds are
traditionally heard and classified into phases30 The first phase corresponds to the systolic
BP while the last or fifth phase corresponds to the diastolic BP30 The fourth phase
alternatively is used to measure the diastolic pressure if a 10 mmHg or greater
differences exist between the initiation of phases fourth and five or if the fifth sound is
heard down to 0 mmHg8 This may occur in cases of high cardiac output or peripheral
vasodilatation children or in pregnancy This method though the method of choice in
clinical practice may however be associated with errors arising from faulty technique and
equipment4748 as well as observer bias49 This method was used for this study because of
its widespread general usage its reliability and accuracy Unlike other methods the
instruments (mercury sphygmomanometer and stethoscope) do not require any
19
calibration and values obtained do not require validation by other methods The standard
World Health OrganizationCenter for Disease Control (WHOCDC) blood pressure
reference percentile tables were generated using the mercury sphygmomanometer hence
the auscultation method is the gold standard for BP evaluation258
The aneroid sphygmomanometer measures BP by mechanical system of metal
bellows that expand as the cuff pressure increases in a series of levers that register the
pressure on a circular scale The hybrid shygmomanometer combines some of the features
of the two and uses an electric transducer to record blood pressure2
c) Oscillometric technique- This uses the oscillometric device Oscillation of pressure in a
sphygmomanometer cuff is recorded during gradual deflation The point of maximum
oscillation corresponds to the mean arterial pressure50 The oscillation begins well above
systolic BP and continues below diastolic BP so that systolic and diastolic BP can only
be estimated indirectly according to some empirically derived algorithm
d) Ultrasound method - This uses an ultrasound transmitter and receiver placed over the
brachial artery under a sphygmomanometer cuff As the cuff is deflated the movement of
the arterial wall and systolic BP cause a Doppler phase shift in the reflected ultrasound
The diastolic BP is recorded as the point of diminished arterial motion51 Its advantage
includes the ability to detect diastolic BP in atrial fibrillation and hypotension where
Korotkoff sound is faint152
FACTORS AFFECTING BLOOD PRESSURE IN ADOLESCENTS
Several inter-related factors affect blood pressure These include-
Age - A progressive BP elevation with age has been observed in several studies2153-55
The rate of rise varies in boys and girls5455 The average systolic increase ranges between
20
166 and 286 mmHgyr for boys and 144 and 263mmHgyr for girls while that of
diastolic BP ranges from 083 and 177mmHgyr for boys and 077 and 148mmHg for
girls2155 Bugaje Yakubu and Ogala21 studied blood pressure pattern among 2035
adolescents in Zaria and found a consistent rise of BP with age The rate of rise was fairly
constant until 11-13 years in boys and 12-14 years in girls when the rise became rapid A
similar study53 also found a BP rise with age among 650 healthy school children in Jos In
a large population studies in Lebanon56 and Saudi Arabia55 BP was similarly reported to
increase consistently with age Rapid growth and biological maturation of organs which
are normal occurrences during adolescence were thought to be responsible rather than the
chronological age56 The results of these studies showed increasing blood pressure with
age despite the fact that one study55 used oscillometric method for their study while the
standard auscultation was used in the other studies Also the studied sample sizes across
these studies varied greatly with sizes of 65053 203521 571054 and 1622655 Despite this
the findings were similar
Gender ndash Results of studies on the effect of gender on BP showed that sex positively
affects blood pressure2153-55 Merhi Al-Hajj and Al-Tannir et al54 studied BP pattern in
5710 Lebanese school children while Al-Salloum El-Mouzan and Al-Herbish et al55
studied BP pattern in 16226 Saudi children and adolescents The authors reported a
higher BP in girls than boys at all ages A study21 of BP pattern in adolescents in Zaria
Nigeria demonstrated an initial higher BP in boys before puberty which reversed with the
onset of puberty up to the age of 14-15yrs when it reversed again to be higher in boys
Akinkugbe Akinwolere and Kayode56 reported no sex differences in adolescent BP in
Ibadan The reported sex difference is said to be likely due to differences in sex hormone
and pattern of growth in boys and girls57 Differences in age range of the study population
may however be responsible for the observed BP variation For instance these studies5455
21
comprised of both adolescents and pre-adolescent age groups combined in one study
while the other two studies2156 were purely adolescents21 Blood pressure is reported to be
equal in both sexes before adolescence after which the gender difference starts to
manifest most likely due to physical and hormonal changes
Socioeconomic Factors - Belonging to either end of the socioeconomic strata is found to
be associated with elevated blood pressure5859 A study in Ibadan56 reported an inverse
relationship between parental socioeconomic status and level of BP in adolescents The
authors suggested that this might be the result of the health behaviours and problems
characteristic of the lower socioeconomic class On the other hand Ejeke Ugwu and
Ezeanyika et al60 in Lokoja and another study53 in Jos both found higher BP in children
from high socioeconomic class Colhoun Hemminway and Poulter61 in a meta-analysis of
BP and socioeconomic status in developed and developing countries found an inverse
relationship of BP with socioeconomic status in developed nations and a direct correlation
in developing countries These different findings may be due to methodological
differences in socio-demographic stratification For instance Akinkugbe and
colleagues59 used fatherrsquos level of education for social classification Parentrsquos educational
level may however not equate well with level of family income The other study60 used an
automated device for their study whose values may require validation using the
recommended auscultation method Difference in environmental stresses may also be
different considering the level of development of the areas where the studies were carried
out
GeneticFamilial Factors - The effect of geneticfamilial factors on BP has been
demonstrated in some studies62-64 Familialgenetic correlations reflected in BP and other
anthropometry generally are higher among genetically close relatives such as brother-
sisters or parent-offspring than among spouses62 Levshit and Gerber63 surveyed 514
22
individuals from 135 nuclear families in Russia while Budaruddoza62 studied 1400
individuals from 380 families in India and found significant genetic influence on BP
Mijinyawa Iliyasu and Borodo65 also reported family history of hypertension as risk
factor for developing high BP in a study on prevalence of hypertension among 1000
teenagers in Kano The authors concluded that this could be due to genetic predisposition
They however did not evaluate further to determine the genetic defects The authors did
not also consider shared environmental factors known to influence blood pressure in
individuals Molecular genetic studies have identified genes as possible regulators of
BP6667 These genes regulate the renin-angiotensin-aldosterone system involved in renal
salt handling69 Mutations that increase sodium reabsorption and salt sensitivity is
associated with higher BP and vice versa68 while shared environmental risk factors may
potentiate the development of such familial conditions which might have been
responsible for outcome of the above studies6364
Environmental Factors ndash Environmental factors greatly influence BP variation in a
population592269 Akinkugbe and Ojo70 reported a consistently higher BP in Nigerian
adolescents than their counterparts of similar ages in black and white American children
The authors are of the view that this could be due to different environmental factors of the
study population Obika Adedoyin and Olowoyeye22 studied BP pattern in 2526
children aged 1-14 years in rural semi-urban and urban communities in Ilorin Nigeria
and demonstrated a hypertension prevalence of 95 in urban compared to 63 in rural
communities This was similar to the study59 in Ghana and Gambia69 The authors592269
argued that the differences were due to socioeconomic status which is higher in the urban
than the rural areas The BP variation could be accounted for by the nature of dietary
intake since the rural communities generally consume more of natural foods with less salt
and lsquojunk foodsrsquo compared to the urban populace This was demonstrated by one study61
23
which reported higher mean BP among urban communities in developing nations due to
changes in their dietary pattern Rural areas are also less exposed to the stress and hassle
of the urban cities It is of interest to note however that urban areas are a mixture of
social classes as a result of migrant workers seeking lsquogreener pasturesrsquo Okagua Anochie
and Akani71 on the other hand reported higher mean BP among rural adolescents than
their urban counter parts in Port Harcourt The authors could not identify the reason(s) for
their finding but concluded that the seemingly protective privilege of rural life may be
fading gradually The differences in the reports could however result from the sample size
composition comprising of preadolescents22 adolescents71 and adults69
Race - Higher BP levels have been reported in African-American and Hispanic school-
age children than their Caucasian counterparts and among African-Americans than the
Hispanics7273 Akinkugbe and Ojo70 demonstrated a consistently high systolic and
diastolic BP in Nigerian children compared with black and white American children of
similar age Exposure to chronic environmental stress low socioeconomic status and high
obesity rate among African American and Hispanic youths could contribute to higher
BP72-74 It can be inferred from the study that race alone may not be responsible for the
observed differences but shared environmental factors and socioeconomic status may be
contributory77 Other studies7475 however found no significant BP differences in relation
to race
Anthropometry and blood pressure (BP) - A positive correlation has been observed
between BP and anthropometry in various studies58-5977 These studies585678 observed a
significant correlation between systolic BP and weight height and body mass index
(BMI) in boys but only with weight in girls Body mass index (BMI) is used as a
measure of overall obesity but it is known to be a poor indicator of actual body fat79
Waist circumference (WC) is an aggregate measurement of the actual amount of total and
24
abdominal fat accumulation80 It is therefore a better predictor of BP and other
cardiovascular diseases8081 Guagnano Ballone and Colagrande et al81 studied the
relationship between BP and BMI WC and waist hip ratio (WHR) in 461 people and
found WC to be the most consistent anthropometry affecting BP It is of interest to note
that the study by Guagnano et al81 was in adults population while the other studies56-59
were in children and adolescents WC was also found to be a better predictor of BP in an
Italian study8081 while it was not in others56-6982 Comparing BMI and waist
circumference and their effects on BP Arauzo Lopes and Moriera et al83 in Brazilian
children found BMI to be a better predictor of BP than waist circumference This was
similar to the study by Sebanjo and Oshikoya82 in Nigerian adolescents in Akure Thus
waist circumference measurements may not be useful in the evaluation of obesity andor
hypertension in children and adolescents This may partly be explained by the uniform fat
distribution due to hormonal effect at puberty in adolescents compared to the
disproportionate fat distribution in adults Possible mechanisms for the positive
relationship between BP and high BMI includes decreased physical activity increased
salt intake impaired pulmonary functions and development of metabolic abnormalities
such as dyslipidaemia and insulin resistance8084
Nutritional factors - Diet has been a primary link between humans and their environment
and substantial evidence supports the concept that multiple dietary factors affect BP85
Well-established dietary modifications that lower BP are reduced salt intake increased
potassium intake increased protein particularly plant protein high vegetable and
polyunsaturated fats85 High sodium intake on the other hand is said to be associated with
elevated blood pressure86 A series of 3 large controlled feeding studies tested the effects
of dietary patterns on BP86-89 Of the 3 diets studied the dietary approach to stop
hypertension (DASH) emphasized fruits vegetables low-fat dairy products whole
25
grains poultry fish nuts potassium magnesium calcium and fibre as the most effective
diet89 Among all participants the DASH diet significantly lowered mean systolic BP by
55 mm Hg and mean diastolic BP by 30 mm Hg each net of changes in the control diet
DEFINITION AND CLASSIFICATION OF ADOLESCENCE
Adolescence is the transitional stage between childhood and adulthood during which many
life patterns are learnt and established90 According to World Health Organization (WHO)
adolescents are individuals between the age range of 10-19 years17 The most significant
feature of adolescence is puberty characterized by an exceptionally rapid rate of biological
growth and development including physical and sexual maturation9091 The pubertal changes
have been described by Tanner and Marshal92 and are grouped into five stages This utilizes
definite criteria for growth and development of secondary sexual characteristics like pubic
hair and breast in females and pubic hair and genitalia in males9092 The timing of these
events and the rate of growth vary due to genetic and environmental factors in different
populations92 Adolescence is divided into early middle and late periods17
Early adolescence (10-13 years) ndash This is a period of rapid growth and development of
secondary sexual characteristics and varies according to sex It corresponds to Tanner stages
1 and 290 The main features of this stage are breast bud development and menarche in girls
while testicular enlargement and seminal emission occurs in boys93
Middle adolescence (14-16 years) ndash In this stage rapid growth decreases and there is more
cognitive development as the adolescents move from concrete thinking to formal operation
and develop greater competence at abstract thinking91 This corresponds to Tanner stages 3
and 4
Late adolescence (17-19 years) ndash Here slowing of physical changes continue which permits
the emergence of a more stable body image Cognition tends to be less self-centered with
26
demonstration of care for others with increasing thought about concepts such as justice
patriotism and history It corresponds to Tanner stage 59092
ADOLESCENCE AND BLOOD PRESSURE
Adolescence is characteristically associated with increasing blood pressure because of the
physical growth and hormonal changes associated with puberty5794 After the age of one year
normal BP increases more during puberty than probably at any other time in an individualrsquos
lifetime95 Wanzhu Eckert and Saha et al57 examined data from a cohort of 182 normotensive
children in Indiana who had blood pressure measurements taken semi-annually for up to 12
yr The authors found that the rate of change in BP and weight peaked at the age of maximum
pubertal growth spurt (PGS) This BP spurt roughly coincides with growth spurt during
puberty94 Surveys of BP patterns from childhood through adolescence shows systolic and
diastolic pressures increase with age and in adolescents the increase in males is more marked
than in females especially the systolic pressure5458229495
CLASSIFICATION OF BLOOD PRESSURE IN ADOLESCENTS
The National High Blood Pressure Education Program Working Group (NHBPEPWG) of the
United States established guidelines for the definition of normal and elevated blood pressures
in children in 19876 These guidelines were revised in 20048 The definition of childhood
hypertension in the guidelines are based upon the normative distribution of blood pressure
(BP) in healthy children rather than clinical outcome data as in adults The guidelines
classified BP as normal prehypertensive or hypertensive Hypertension is graded into stage
one and two8
Normal BP - Blood pressure lt90th percentile for age sex and height Children and
adolescents with normal BP should be followed annually from the age of 3 years5 They
27
should be encouraged to maintain a healthy life style such as good dietary intake physical
activities and adequate rest8
Pre-hypertension - Blood pressure between the 90th and lt 95th or if BP exceeds
12080mmHg (even if lt90th percentile) but lt95th It was previously called high normal
BP This new description was introduced to help identify children at risk for the
development of persistent hypertension for whom targeted prevention programmes would
be most beneficial96 While recommendations for the diagnosis of hypertension in
children require that BP remains elevated on three separate occasions repeated
measurements are not necessary to classify an adolescent as pre-hypertensive11 The
prevalence of childhoodadolescence pre-hypertension in US is reported to be between
12-1796-98 In Nigeria Ejeke Ugwu and Ezeanyika99 in a study of the prevalence of
point prehypertension and hypertension in 843 adolescents in Lokoja reported a
prevalence of point prehypertension of 222 and 250 in semi urban and urban
communities respectively Ujunwa Ikefuna and Nwokocha et al100 reported 175
prehypertension prevalence among adolescents in Enugu Among adults with pre-
hypertension it is reported that as much as 10 per year develop hypertension101 There
is little information on the time course for children and adolescents with prehypertension
developing hypertension A value of between 11-7 per year has been reported in US
adolescents98 There is no known study on rate of progression of prehypertension to
hypertension in Nigerian adolescents The NHBPEP recommended that children with
pre-hypertension should have their BP checked after every six (6) months to monitor for
progression to hypertension They should be encouraged to engage in physical activity
healthy dietary behaviours and weight management if overweight Pharmacologic therapy
is not indicated except if there is strong evidence of renal disease heart failure left
ventricular hypertrophy or diabetes mellitus8
28
Hypertension Hypertension is BP persistently equal to or above the 95th percentile for
age sex and height measured on three or more separate occasions If the blood pressure
measurement obtained is gt 95th percentile the degree of hypertension should be staged
Stage 1 hypertension- BP value between the 95th and the 99th percentile plus 5mmHg It
is recommended that BP should be rechecked in 1ndash2 wks or sooner if the patient is
symptomatic If persistently elevated on 2 additional occasions it should be evaluated or
referred to source of care for pharmacologic treatment within 1 month 8
Stage 2 hypertension- BP value gt99th percentile plus 5mmHg This stage calls for more
prompt evaluation and commencement of pharmacologic therapy102 It is recommended
that the individual be evaluated or referred to source of care within 1wk or immediately if
the patient is symptomatic8
Aetiology of hypertension
Hypertension is classified as primary (essential) when there is no identifiable cause
or secondary if due to an underlying disease31 Factors such as heredity diet stress drugs and
obesity play a role in the development of essential hypertension103104 Causes of secondary
hypertension include umbilical artery catheterization renal diseases coarctation of the aorta
and endocrine disorders105106 Aderele and Sereki6 in their study of hypertension in children
reported hypertension secondary to renal pathology as the commonest cause of elevated BP
in children This study was mainly in preadolescent population in which secondary
hypertension is a common finding On the other hand Antia-Obong and Antia-Obong107
reported no apparent cause in greater than 90 of the studied subjects with elevated BP and
also reported proteinuria of 1 in the same population without any associated elevated blood
pressure The study did not however evaluate the etiology of the proteinuria A study65 of BP
in teenagers in Kano found family history of hypertension a risk factor in the study
population Another study in Enugu100 examined modifiable risk factors associated with
29
hypertension in 2694 adolescents and found only 1 and 06 of the hypertensive subjects
to be overweight and obese respectively The authors also found that smoking and alcohol
consumption were not significant risk for hypertension This may however be due to the
shorter period of consumption of these products by the students as a cumulative effect from
long term consumption is known to be associated with adverse health outcomes
Prevalence of hypertension in adolescents
The prevalence of hypertension in adolescents varies widely due to arbitrary and imprecise
definition by different researchers It was in view of this that the National High Blood
Pressure Education Program Working Group (NHBPEPWG) of the United States established
guidelines for the definition of normal and elevated blood pressures in children and
adolescents for uniformity68 In the USA the prevalence is about 20 in normal weight and
50 in their obese counterparts108 A prevalence rate of 77109 10554 and 223110 has
been reported in Spain Lebanon and South Africa respectively In Kano Nigeria a study65
on the prevalence of hypertension among 1000 teenagers found a prevalence of 72 Similar
study in Enugu100 on the prevalence of hypertension among 2694 secondary school
adolescents reported a hypertension prevalence of 54 It is of interest to note that different
prevalence was reported because of the different methodology used by the authors While the
study in Kano65 applied the adult blood pressure criterion of BP greater than 14090mmHg as
hypertension the study in Enugu100 used blood pressure greater than 95th percentile for age
and sex Also the study in Kano65 took a single set of measurement while the study100 in
Enugu measured blood pressure of the subject three times at weekly intervals Bugaje
Yakubu and Ogala21 on the other hand defined hypertension as blood pressure greater than
two standard deviations from the mean and also took six readings over thirty minutes and got
a prevalence of hypertension of 34 A prevalence rate of 48107 and 9522 in Southern
and Western region of the Nigeria respectively was also reported It is obvious that because
30
of the various defining criteria for hypertension in adolescents the prevalence of adolescent
hypertension remains imprecise
Clinical presentation- Hypertension is usually asymptomatic unless it has been
sustained or is rising rapidly109 Adolescents with essential hypertension are usually
detected during routine evaluation96 Non-specific symptoms such as lethargy headache
dizziness drowsiness visual disturbance and confusion may be present109 These could
also be signs of complications111 Secondary hypertension may show obvious features of
the underlying disease such as growth failure heat intolerance abdominal stria tremors
body swelling and haematuria8102 Croix and Feig112 studied the spectrum of symptoms in
409 children aged 7-18 years newly diagnosed hypertensive in Texas USA and reported
15 common symptoms than in the controls The symptoms were said to resolve after
commencement of antihypertensive medications The authors concluded that hypertensive
children had a variety of non-specific symptoms The three most common symptoms
reported were headache daytime tiredness and difficulty initiating sleep The study
however did not specify if other possible causes of these symptoms were excluded
Complications of hypertension - Hypertension is usually asymptomatic in adolescents
which if left unidentified overtime can cause serious complications109 Organs commonly
affected in the complication of hypertension are the heart kidneys brain and the eyes
leading to lowered life expectancy and premature death13 Left ventricular hypertrophy
(LVH) is the most prominent clinical evidence of end organ damage10 Studies have
shown that LVH can be seen in as many as 41 of patients even in adolescents with
asymptomatic hypertension10103 Adolescents with severe cases of hypertension are also
at increased risk of developing hypertensive encephalopathy seizures cerebrovascular
accidents and congestive heart failure103109 However data documenting such
complications in children and adolescents are generally lacking In a study of
31
hypertension among teenagers in Kano the researchers65 could not find any
complications in all the 1000 teenagers studied
Investigations and treatment- Basic investigations are all that may be required in
adolescents who are obese and with a family history of hypertension stage 1 disease and
normal findings on physical examination113 This is because primary hypertension is
commoner in adolescents Adolescents that are symptomatic or with stage 2 hypertension or
have features of secondary hypertension should be evaluated in more detail
Treatment of hypertension includes non-pharmacological and pharmacological
methods Non-pharmacologic management involves life style modification such as weight
reduction increased physical activities and dietary adjustment114 In a study to evaluate the
effect of diet and salt on treatment and prevention of hypertension Sacks Svetkey and
Vollmer et al86 reported the beneficial effect of both reduced salt intake and appropriate
dietary adjustment in the control of hypertension Similar benefits were reported in other
studies8788 Although both studies had fairly good sample size (n=412) the studies did not
specify if participants were on other substances or activities other than antihypertensive that
might have affected their BP The studies were also in adults and whether it has the same
effects in children and adolescents has not been evaluation However there is no doubt that
the outcome will be similar in adolescents as dietary modifications have been advocated as
non-pharmacologic management in them Non pharmacologic treatment is usually the initial
treatment in essential hypertension and as adjuvant to drug therapy in those with secondary or
complicated hypertension101114 Pharmacologic (drug) treatment includes diuretics beta-
blockers calcium channel blockers angiotensin converting enzyme inhibitors (ACEIs) and
angiotensin receptor blockers (ARB) among others106114 They are used in those with
symptomatic disease and in acute or chronic complications106
32
Prevention of hypertension may be viewed as part of the prevention of cardiovascular
disease102 In adolescents approaches to prevention include reduction in obesity
discouraging cigarette smoking and alcohol intake113 reduction in sodium intake and increase
in physical activity through community and school-based programmes103104 Growth
monitoring BP check during preventive care visit physical activity and urine screening for
proteinuria and haematuria can be used starting from early childhood
33
AIM AND OBJECTIVES
GENERAL AIM
To determine the blood pressure pattern of apparently healthy secondary school adolescents
in Jalingo Taraba State
SPECIFIC OBJECTIVES
To determine
1 Blood pressure pattern in relation to age and sex among adolescents aged 10-19
years
2 The relationship if any between blood pressure and the anthropometric parameters of
weight height BMI and waist circumference
3 The association between blood pressure and parental social-economic status
4 The point prevalence of prehypertension and hypertension in adolescents
34
MATERIALS AND METHODS
Study area
A cross-sectional survey of the blood pressure pattern of apparently healthy secondary
school adolescents aged 10-19 years was conducted in Jalingo over a six month period
from January to June 2014 Jalingo is the capital of Taraba State and lies within the
savannah belt of North Eastern Nigeria It lies between latitude 80 54rsquo north and longitude
110 21rsquo east and at an altitude of 360 meters above sea level115 Jalingo had a population of
118198 people18 The primary inhabitants are the Konas Mumuyes and Fulanis who are
mostly farmers Other indigenous ethnic groups include the Jukun Kuteb WurkumTiv
and host of other tribes The Ibos Hausas Yorubas among others are the non-indigenous
ethnic groups and are mostly civil servants and businessmen Jalingo has a tertiary health
centre the Federal Medical Centre Jalingo and the state specialist hospital It also has 15
private clinicshospital and many primary health care centres There are also tertiary
education institutions including Taraba State University As at 2013 there were 56
secondary schools in Jalingo 24 public and 32 private all of which were mixed schools
except one which is a girlsrsquo only school
Study design
The study was a cross sectional descriptive study of 1350 apparently healthy secondary
school adolescents in Jalingo
Ethical approval
Ethical approval for this study was obtained from the Scientific and Health Ethics Research
Committee of Ahmadu Bello University Teaching Hospital Zaria (Appendix 4) The Taraba
State Ministry of Education also gave the approval and permission to conduct the study in the
35
selected schools Consent was given by the studentsrsquo parents or guardian (Appendix 2) All
students whose parents gave consent voluntarily participated in the study
Sample size determination
The minimum sample size was calculated using the formula116
N=Z2 (pq) E2
Where N = minimum sample size
p = Prevalence of hypertension in adolescents A prevalence of 3421 was used
q = 1- p
E = margin of error tolerated =1
Z = 196 at 95 confidence level
N = 1962 x 0034 x (1-0034) 0012 = 1262
Therefore the minimum sample size was one thousand two hundred and sixty two
Allowance for non-responders of 5 63 extra subjects were added to the calculated
minimum sample size bringing the total to 1325 students To enhance representativeness of
the sample and to compensate for missing information and poorly filled proforma while
maintaining the sample size a total of 1350 was decided upon
Inclusion criteria
1 Students (ages 10-19 years) in the selected secondary schools
2 Students whose parents gave consent to participate in the study
3 Students who gave assent to participate in the study
Exclusion criteria
1 Students who had obvious skeletal deformities of the spine and legs which can affect
the height and ultimately the BMI
36
2 Students with known chronic disease (or history of such disease) like anaemia
chronic renal disease and cardiac disease because they are not apparently healthy and
these conditions could affect their blood pressure
3 Students with present or past history of chronic drug ingestion that can affect blood
pressure such as steriods and contraceptives
4 Students with high blood pressure already on antihypertensive
Pilot study
A pilot study was carried out in one of the schools a week before the commencement of
the study The school was selected by random sampling method using balloting and did
not participate in the main study The pilot study was carried out with the aim of
assessing the competence of the research assistants in the various measurements
following their training to ensure reliability It was also used to test the questionnaire
before its use during the main study and to provide information on the number of students
that can be measured in a day Consequently twenty students had their blood pressure
and anthropometry measured independently by the researcher and the research assistants
and data were compared using Students t-test There were no statistically significant
differences between the measurements The result of the pilot study is highlighted in
Table I It was also found that some parts of the questionnaire were not well understood
by most students and were adjusted appropriately in the main study (Appendix 1) The 20
students had their measurements done over a period of 3-4 hours (between 8am - 12noon)
by the researcher and the research assistants
Table I Result of pilot study
Variables Researcher Research t p
37
assistants
Mean(plusmnSD) SBP
mmHg
106(11) 104(12) 0550 0586
Mean(plusmnSD) DBP
mmHg
617(83) 63(10) 0450 0657
Mean(plusmnSD) Weight
kg
544(82) 527(122) 0520 0608
Mean(plusmnSD) Height m 16(01) 16(01) 0000 1000
Mean(plusmnSD) BMI
kgm2
198(36) 202(33) 0370 0716
Mean(plusmnSD) WC cm 692(72) 682(133) 0300 0769
Sampling method
Students were selected by multistage random sampling technique The list of secondary
schools obtained from the Taraba State Post Primary Schools Board served as the sampling
frame for schools There were 56 secondary schools 24 of which were public and 32 were
private schools a ratio of 113 Ten (10) schools were randomly selected by balloting four
(4) from public schools six (6) from private based on the number and approximately similar
ratio of private to public schools of 115 (46) Ten schools were selected to ensure wider
coverage and even distribution of students so that it could be truly representative of the
community All the ten schools had an overall total of eight thousand one hundred and seven
(8107) students The public schools had a total of five thousand nine hundred and forty
(5940) with nine hundred and eighty nine (989) students participating The private schools
had a total of two thousand one hundred and sixty-seven (2167) students with three hundred
and sixty one (361) participating These number (989 and 361) was calculated based on the
38
relative population of each school and proportionate to number of students in each school
Thereafter the number of students to participate per school was calculated proportionately to
the number of students in each school based on the number given by the school authority
Then the number in each class was also calculated proportionately from JSS1 to SS3 to
ensure fair and equal chance of participation for all age groups The calculation was done
thus n= a b x c
Where n= number of students per selected school
a= total numberpopulation of students in the school
b= total numberpopulation of students in all 10 selected schools (8107)
c= calculated total sample size (1350)
Students in each class from junior secondary school (JSS) 1-3 and senior secondary school
(SS) 1-3 were then randomly selected by balloting The number of selected schools total
number of students in a school and the number of students selected per school is outlined in
Table II
Table II Selected schools and number of students in each of the ten schools in Jalingo
Selected schools Total no of No of students
39
student in the
school (a)
n=8107
selected (n=abxc)
n=1350
Public schools
Govt Science Secondary School 2800 466
Govt Day Secondary School SGari 1200 200
Salisu Dogo Secondary School 1100 183
Govt Secondary School Magami 840 140
Total 5940 989
Private schools
Winners Comprehensive Secondary School 650 108
Hawai Secondary School 562 94
Centre for Quranic Science and Islamic Education 543 90
Good Success Secondary School 155 26
Jetters Academy 140 23
Yagai Academy 117 20
Total 2167 361
The study
The first contact with the students was a familiarization exercise to each of the schools during
which the teachers and students were given a talk by the researcher on blood pressure and the
40
importance of periodic blood pressure measurement They were given the opportunity to ask
questions which were responded to Both the students and their teachers actively participated
in the lectures
On the second day students were selected as described above and those selected
underwent general physical examination in the presence of a chaperon to identify those
who did not fulfilled the inclusion criteria Each selected student was given a proforma
(Appendix 1) in which information on their biodata and medical history were recorded
Other information obtained was parentrsquos medical history and their socioeconomic status
using the format described by Olusanya Okpere and Ezimokhai117 (Appendix 3) The
study was carried out in a relatively quiet and empty classroom to ensure privacy for both
male and female students The procedure for blood pressure measurement was
demonstrated on one of the research assistants and sometimes on one of the teachers by
the researcher to assure the students and allay their anxiety BP and anthropometric values
obtained were recorded in the study proforma An average of 15-20 students per day were
attended to over a period of 3-4 hours (between 8am - 12noon daily) by the researcher
one of the research assistants who is a medical officer a male nurse and a lady Youth
Corper (NYSC)
Blood pressure measurement
This was measured by the researcher and the research assistant (the medical officer) The
standard auscultation method was employed using a mercury sphygmomanometer (Acosson)
and a standard Littman stethoscope according to the guideline of the fourth report on the
diagnosis evaluation and treatment of hypertension in children and adolescents8 Each
students was rest-seated for 5 minutes before BP measurement With the student seated the
right arm rested on a table at the level of the heart an appropriate cuff size which covered
41
two-third (23rd) of the length of the arm was applied round the arm about 2cm above the
antecubital fossa Two cuff sizes were used for this study with dimensions of 10 x 24cm and
13 x 30cm the smaller cuff for the smaller adolescents and vice versa The bladder cuff was
inflated rapidly to 20-30mmHg above the point where the brachial artery was no longer
palpable The bell of the stethoscope was then placed over the brachial artery and the cuff
was deflated slowly at 2-5mmHgsecond while listening to the Korotkoff sounds Phases one
and five of the Korotkoff sounds were recorded as the systolic and diastolic BP
respectively119 Three recordings were taken at intervals of 3-5 minutes and the average was
the final BP in mmHg BP was interpreted based on the standard set by the fourth report on
the diagnosis evaluation and treatment of hypertension in children and adolescents of the
United States8 thus-
Normal BP ndash BP value between the 5th and lt 90th percentile for age sex and height
Prehypertension - BP value between the 90th and the lt95th percentile for age sex and height
or BP of 12080mmHg but less than the 95th percentile
Hypertension ndash BP value ge95th percentile for age sex and height
Students found to have prehypertension were educated and counseled on life style
modifications and the need to have their blood pressure checked in six monthsrsquo time and
annually subsequently Those with hypertension were educated on the implications of the
findings and were referred to the Federal Medical Center Jalingo for evaluation management
and follow-up
Height measurement
Height was measured in centimeters using a locally constructed stadiometer by the research
assistants Each student was measured barefooted standing with the heel back and occiput
42
against the stadiometre The head was held straight looking forward with the lower border of
the eye socket at a horizontal plane with that of the external auditory meatus The movable
part of the stadiometre was adjusted to rest on the vertex and the corresponding value read to
the nearest 01cm
Weight measurement
The weight was measured in kilograms by the researcher and the research assistants using a
bathroom scale (HANSON) Students were weighed in their approved school uniform
without caps head ties or cardigan and with their shoes removed The scale was checked
daily for accuracy using standard calibrated weight before and midway through each session
The weight of the student was measured to the nearest 01 kg
Body mass index (BMI)
This was calculated from the measured weight and height of the subject using the
formula118
BMI= Weight (kg) Height (m2)
Waist circumference measurement
WC was measured in centimeters using a measuring tape by the research assistants The
male assistant measured for boys and the lady Youth Corper measured for girls
Measurement was taken with the student standing completely relax and breathing
normally Clothing was pulled up or down and an inelastic measuring tape was placed
around the waist mid-way between the iliac crest and the lowest rib margin The ends of
the tape were pulled together lightly towards each other and the value read to the nearest
01cm117120
43
Data analysis
Data obtained were analyzed using Epi-Info statistical software package version 7 The
results obtained were presented in figures tables graphs and charts as appropriate Individual
mean BP levels were used as dependent variables and other measured variables as
independent variables The means and standard deviations were used to summarize
quantitative variables such as BP weight height waist circumference and BMI The chi-
squared test was used to test the significance of associations between categorical variables
Studentrsquos t-test was used to compare means of any two normally distributed continuous
variables Pearsonrsquos correlation coefficient and regression analysis were used to examine the
strength of association between BP and the anthropometries Probability level of statistical
significance value was set at lt005
RESULTS
General characteristics
A total of 1350 students were enrolled between January and June 2014 to determine their
blood pressure pattern 628 (465) were males and 722 (535) were females with
malefemale ratio of 111 Students enrolled in the study were drawn from both public and
44
private schools The number of students from public schools was 989 (733) while 361
(267) were from private schools as shown in Table II The mean age of the study subjects
was 153plusmn22 years with a range of 10-19 years The age and sex distribution of the students
is illustrated in Table III
Table III Age and sex distribution of 1350 study subjects in Jalingo
Ag
e
Male
n ()
Female
n ()
Total
N()
10 9(14) 13(18) 22 (16)
11 20(32) 31(43) 51(38)
12 36(57) 52(72) 88(65)
13 96(153) 85(118) 181(134)
14 92(146) 115(158) 207(153)
15 92(146) 111(154) 203(151)
16 66(105) 116(161) 182(135)
17 78(125) 91(126) 169(125)
18 79(126) 70(97) 149(110)
19 60(96) 38(53) 98(73)
To
tal
628(100) 722(100) 1350(100)
45
Socio-economic classes (SEC) ndash Most of the students were from the lower social classes
(4 and 5) with population of 650 (415 and 235) students The upper social classes (1 and
2) had the least population with 184 (62 and122) students The middle social class (3) had
516 students The distribution of the study subjects according to individual
socioeconomic class is shown in Figure I
Figure 1 Socioeconomic class distribution of students in Jalingo
Anthropometry
The anthropometric characteristics of the students are displayed in Tables IV V and VI
All the anthropometric parameters showed increasing values with age (Tables V and VI)
There were significant differences in the anthropometric indices of height (p=0000)
weight (p=0010) and body mass index (p=0000) between boys and girls but not
statistically significant for waist circumference (p=0145) as shown in Table IV
Weight ndash The mean weight of the students was 486plusmn109kg with a range of 23-100kg
(Table IV) Girls were heavier than boys up to middle adolescence after which males
46
were heavier than the females (Table V and VI) and this was statistically significant (t= -
256 p=0010)
Table IV Overall mean anthropometric measurements of the study subjects
Anthropometr
y
Male Female Total
n=628 n=722 N=1350 t p
Wt (kg)
Mean(plusmnSD) 4773(115
)
4926(103
)
4855(plusmn109
)
-
25
6
0007
Range 236-848 227-100 23-100
Ht (m)
Mean(plusmnSD) 159(012) 157(008) 158(plusmn010) 35
5
0000
Range 122-185 126-179 122-185
WC (cm)
Mean(plusmnSD) 6524(91) 6595(86) 6562(plusmn89) -
14
6
0145
Range 225-905 215-100 22-100
47
BMI (kgm2)
Mean(plusmnSD) 1825(27) 1947(33) 1891(plusmn31) -
74
1
0000
Range 117-325 114-42 114-42
Statistically significant p values at 005 level of significance Wt=Weight Ht=Height WC=Waist
Circumference BMI=Body Mass Index SD=Standard Deviation
Height- The mean height of the study population was 158plusmn09m and ranged from 122-
185m (Table IV) Girls were taller than boys at early and middle adolescence but these
reversed from 16 years in favour of the boys (Table V and VI) This differences was
statistically significant (t=448 p=0000)
Waist circumference (WC) - The overall mean waist circumference was 6562plusmn89cm and
a range of 225-100cm Girls had higher WC until late adolescence (18 years) when it
reversed but this was not statistically significant (t=-146 p=0145) This is displayed in
Tables IV V and VI
Body Mass Index (BMI) - Overall mean BMI was 189plusmn31 with a range of 114-42
There was a statistically significant difference between girls and boys (t=-741 p=0000)
Tables IV V and VI illustrate this findings
Table V Mean anthropometric measurements of 628 boys
Age No of
studen
ts
Wt(plusmnSD)
Kg
Ht(plusmnSD)
m
WC(plusmnSD)
cm
BMI(plusmnSD)
Kgm2)
48
10 9 349(50) 143(001
)
613(06) 169(01)
11 20 354(25) 143(002
)
617(13) 170(07)
12 36 363(51) 146(002
)
616(14) 167(06)
13 96 379(51) 150(003
)
602(40) 165(08)
14 92 412(50) 154(003
)
623(32) 169(08)
15 92 471(60) 160(003
)
634(39) 178(08)
16 66 525(52) 164(002
)
672(24) 192(09)
17 78 555(51) 167(002
)
680(31) 197(08)
18 79 576(61) 169(002
)
707(18) 200(08)
19 60 590(57) 170(002
)
716(16) 203(07)
Total 628 477(115 16(01) 652(91) 183(27)
49
)
Wt=Weight Ht=Height WC=Waist Circumference BMI=Body Mass Index SD=Standard Deviation
Table VI Mean anthropometric measurements of 722 girls
Age No of
students
Wt(plusmnSD)
Kg
Ht(plusmnSD)
m
WC(plusmnSD)
cm
BMI(plusmnSD)
Kgm2
10 13 313(34) 139(001) 582(05) 156(02)
11 31 361(53) 144(002) 611(12) 170(05)
12 52 403(64) 149(002) 625(21) 178(09)
13 85 458(66) 154(002) 657(22) 188(12)
14 115 478(74) 157(003) 627(48) 187(10)
15 111 508(65) 159(002) 666(34) 199(13)
16 116 521(60) 159(002) 678(28) 201(11)
17 91 541(62) 161(002) 681(28) 203(11)
18 70 556(63) 161(002) 696(21) 211(11)
19 38 540(48) 158(002) 688(14) 208(06)
Total 722 493(103) 16(010) 651(23) 190(09)
Wt=Weight Ht=Height WC=Waist circumference BMI=Body Mass Index SD=Standard Deviation
Blood pressure (BP) measurements
50
Table VII shows mean blood pressure distribution of the study population for all ages
The highest SBP and DBP were 165mmHg and 95mmHg at 18years and 15 years
respectively Table VIII displays mean BP distribution in relation to age and sex The
tables show that both systolic and diastolic blood pressure increased with age This is also
depicted in Figure 2
Table VII Mean and ranges of blood pressure of 1350 subjects
Systolic Blood Pressure
(mmHg)
Diastolic Blood Pressure
(mmHg)
Age
No of
students
Mean(plusmnSD) Range
Mean(plusmnSD) Range
10 22 936(74) 80-107 600(50) 47-70
11 51 992(106) 76-120 629(71) 47-83
12 88 1036(110) 80-140 657(60) 53-82
13 181 1042(108) 80-143 660(74) 48-88
14 207 1070(115) 83-150 675(76) 47-90
15 203 1090(119) 80-150 678(82) 47-95
16 182 1122(124) 80-150 696(80) 50-90
51
17 169 1132(118) 90-153 698(83) 48-93
18 149 1138(121) 90-165 712(88) 50-90
19 98 1131(127) 90-143 726(76) 57-90
Total 1350 1089(125) 76-165 683(82) 47-95
Table VIII Mean blood pressure in relation to age and sex
Mean(plusmnSD) Systolic blood pressure
(mmHg)
Mean(plusmnSD) Diastolic blood
pressure (mmHg)
A
ge
Male
n=628
Female
n=722
t p Male
n=62
8
Fema
le
n=72
2
t p
52
10 954(3
9)
923(6
0)
1
02
03
20
619(
32)
586(
46)
1
36
0
01
91
11 985(5
5)
997(9
2)
0
42
0
06
80
648(
39)
617(
57)
1
56
0
01
26
12 999(8
9)
1062(
117)
2
84
0
00
06
653(
29)
660(
52)
-
0
52
0
06
07
13 1012(
73)
1075(
73)
4
03
4
00
00
649(
43)
672(
59)
-
0
03
0
00
44
14 1036(
78)
1098(
78)
3
93
0
00
01
653(
44)
693(
58)
3
90
0
00
01
15 1071(
80)
1105(
87)
2
05
0
00
42
665(
58)
689(
56)
-
2
10
0
00
37
16 1135(
82)
1114(
91)
1
03
0
03
10
697(
51)
695(
61)
0
15
0
08
81
53
17 1152(
87)
1115(
77)
2
04
00
43
698(
59)
698(
58)
0
02
0
09
81
18 1141(
96)
1135(
74)
0
27
0
07
91
704(
62)
721(
63)
1
61
0
02
49
19 1146(
97)
1108(
80)
1
41
0
01
64
733(
63)
714(
43)
1
21
0
02
28
To
tal
1081(
133)
1095(
117)
-
2
05
4
00
40
678(
81)
687(
82)
-
2
07
7
00
38
Statistically significant p values at 005 levels of significance
54
Figure 2 Blood pressure distribution in relation to age and sex
SBP =Systolic blood pressure DBP=Diastolic blood pressure
Blood pressure and stages of adolescence
Table IX displays mean blood pressure according to stages of adolescence Girls had a
higher mean SBP than boys from early adolescence (t=3754 p=0000) to middle
adolescence (t=-3025 p=0003) and this was statistically significant This dominance was
also demonstrated in the DBP and was statistically significant in middle adolescence (t=-
3517 plt0000) Adolescents from private schools had higher mean SBP (t=-222
plt0027) and mean DBP (t=-461 p=0000) than those from public schools and these
differences were statistically significant
Table IX Mean blood pressure according to sex and stages of adolescence
Mean BP
(mmHg)
Age (years)
Male SBP
Female SBP
Male DBP
Female DBP
55
Stages
of
adolesc
ents
(years)
Mean(plusmnSD) systolic blood pressure
(mmHg)
Mean(plusmnSD) diastolic blood pressure
(mmHg)
Male Female t p Male Fema
le
t p
Early
(10-13)
1000(9
6)
1040(1
18)
37
54
00
00
648(
56)
653(
82)
05
99
05
50
Middle
(14-16)
1075(1
29)
1105(1
13)
-
30
25
00
03
670(
81)
694(
77)
-
35
17
00
00
Late
(17-19)
1140(1
28)
1121(1
11)
21
45
00
33
717(
85)
710(
83)
00
70
09
45
1082(1
33)
1092(1
17)
-
20
54
00
40
678(
81)
687(
82)
-
20
77
00
38
Statistically significant p values at 005 level of significance SD=Standard Deviation
Table X shows blood pressure pattern according to stages of adolescence
Prehypertension and hypertension were more prevalent in late adolescence than early and
middle adolescence (χ2=49054 p=0000) and (χ2=10305 p=0006) both of which were
statistically significant
Table X The pattern of normal BP Prehypertension and hypertension according to stages
of adolescence
56
Blood
pressure
pattern
Stages of adolescence
Early
n()
Middle
n()
Late
n()
Total
N()
χ2 p
Normal 290(84
8)
428(72
3)
275(66
1)
993(73
5)
429
79
000
0
prehypertens
ion
43(12
6)
135(22
8)
120(28
8)
298(22
1)
490
54
000
0
Hypertensio
n
9(26) 29(49) 21(51) 59(44) 103
05
000
6
342(10
0)
592(10
0)
416(10
0)
1350(1
00)
350
93
000
0
Statistically significant p value at 005 level of significance
Relationship between blood pressure and the measured anthropometry
There was a positive correlation between SBP and DBP with age and the anthropometric
variables of weight height waist circumference and BMI (Table XI) SBP showed a
stronger correlation with the anthropometries than the DBP and was stronger for weight
(r=051) and height (r=044) The waist circumference though statistically significant
showed the weakest correlation
Table XI Correlation between blood pressure age (yrs) and anthropometry
Parameters
Systolic Blood Pressure Diastolic Blood Pressure
Correlation
coefficient
p Correlation
coefficient
p
57
Age (yrs) 035 lt0000 030 lt0000
Height (m) 044 lt0000 034 lt0000
Weight (Kg) 051 lt0000 038 lt0000
WC (cm) 040 lt0000 029 lt0000
BMI
(Kgm2)
031 lt0000 023 lt0000
Statistically significant p values at 005 level of significance Wt=Weight Ht=Height WC=Waist
circumference BMI=Body Mass Index
Blood pressure distribution and socio-economic classes
Table XII shows mean blood pressure according to socio-economic class of the subjects
Lower social classes had higher mean SBP (t=1650 p=2850) and DBP (t=0193
p=00058) but these were not statistically significant
Table XII Mean Blood pressure in relation to socioeconomic classes
Blood
pressur
e
Socioeconomic classes
Upper (1 amp
2) n=184
Middle (3)
n=516
Lower (4 amp
5)
n=650
f(anova
)
p
Mean
(SD)
10857(126
)
10866(128
)
11040(109
)
1650 285
0
58
SBP
Mean
(DBP)
6820(83) 6791(83) 6957(76) 0193 005
8
SEC= Socioeconomic class SBP=Systolic Blood Pressure DBP=Diastolic Blood Pressure SD=Standard
Deviation
Table XIII shows blood pressure pattern in relation to socioeconomic classes of the
subjects The percentage of students with prehypertension was higher in the upper social
class ((χ2=3067 p=0216) while the percentage of hypertension were higher in the lower
socioeconomic classes (χ2=1037 p=0568) but these differences were not statistically
significant
Table XIII Blood pressure pattern in relation to socioeconomic status
Blood
pressure
pattern
Socioeconomic classes
Upper
(1 amp 2)
n()
Middle
(3)
n()
Lower
(4 amp 5)
n()
Total
N()
χ2 p
Normal 127(69
)
383(74
2)
483(74
3)
993(73
6)
417
6
012
4
Prehypertens
ion
52(28
3)
108(20
9)
138(21
2)
298(22
1)
306
7
021
6
Hypertension 5(27) 25(48) 29(45) 59(44) 103 056
59
7 8
184(10
0)
516(10
0)
650(10
0)
1350(10
0)
573
0
022
0
Prevalence of Hypertension and Prehypertension
Table XIV shows the prevalence of hypertension in the study population The total
number of students with hypertension was 59 giving an overall prevalence of 44
Thirty four students (25) had systolic hypertension sixteen (12) had diastolic
hypertension and nine students (07) had both systolic and diastolic hypertension
Systolic hypertension was more prevalent in the females and was more at the age of 16
years while diastolic hypertension was higher in males and this also occurred at 16 years
Among those with hypertension 27 and 16 subjects had stage 1 and 2 systolic
hypertension respectively With regard to diastolic hypertension 24 and 1 subjects had
stage 1 and 2 hypertension respectively The gender difference in the prevalence of
hypertension is not statistically significant (χ2=0831 p=0362)
The number of students with pre-hypertension was 298 giving an overall prevalence of
221 Of this 131 were males and 167 are females This is illustrated in Table XIV
Prehypertension is more prevalent in females than males and this was statistically
significant (χ2=4349 p=0037)
60
Table XIV Overall Blood pressure pattern and prevalence of hypertension and
prehypertension of 1350 students in Jalingo
Blood pressure
pattern
Males
n=()
Females
n=()
Total
N()
χ2 p
Normal 471(750) 522(723) 993(735) 2619 0106
Prehypertension 131(209) 167(231) 298(221) 4349 0037
Hypertension 26(41) 33(46) 59(44) 0831 0362
628(100) 722(100) 1350(100) 1260 0533
statistically significant p value at 005 level of significance
61
DISCUSSION
The findings of this study showed that the BP of secondary school adolescents in Jalingo
was similar in terms of mean values range and trend of progression with age to that of
other adolescents from Ibadan63 and Kogi60 (Nigeria) Ashanti (Ghana)59 and Lebanon54
The mean value was however lower than the mean BP of adolescents from Zaria
(Nigeria)21 Belgrade ( Serbia)78 and Fortaleza-Cearaacute (Brazil)83 who had higher mean BP
in both sexes and at all ages The lower mean BP in this study compared to that of
adolescents from Zaria21 Belgrade78 and Brazil83 could be due to lower mean
anthropometry of weight height and BMI in adolescents from Jalingo resulting in lower
mean BP The sample sizes of these studies7883 were also different and could have
affected the mean BP of the study population For instance the sample size in the
Brazilian study83 is 151 compared to the study in Lebanon54 with 5710 subjects The use
of the fifth Korotkoff sounds as DBP in this study21 could also have accounted for the
lower mean BP in contrast to a similar study in Zaria21 where the fourth Korotkoff sound
was used as the DBP
A progressive increase in blood pressure with age was found in this study This
was similar to most findings by researchers in Nigeria 215358-606566107 and
worldwide54555961 The peak age of rise in BP in this study was in middle adolescence
between 15-16 years in boys but much earlier in girls for both systolic and diastolic BP
This was similar to the study by Akinkugbe Akinwolere and Kayode56 in Ibadan and
Ejeke Ugwu and Ezeanyika et al60 in Lokoja This age group is usually the period of
onset of puberty The chronologic age is not the main factor responsible for BP increase
62
with age but rather the progressive increase in size of the individual Increase in body
size with growth and maturity of organs associated with the physical and hormonal
changes during puberty potentially lead to increasing BP The simultaneous increase in
weight height and other anthropometric indices alongside BP with age seen in this study
and others is in agreement with that The implication of this increase in blood pressure
with age is that those with prehypertensionhypertension in childhood may continue into
adulthood hence further increasing the high prevalence of hypertension in the adult
population with its attendant morbidity disability and mortality
Overall significant higher mean BP was recorded in girls than boys in this study
This was seen from early to middle adolescence after which it reversed in favour of the
boys Reports on the relationship between BP and sex have been inconsistent Some have
reported higher mean BP in females54-56 others higher in males5883 while yet another
reported no sex differences22 The findings of this study were similar to those of Bugaje
Yakubu and Ogala21 and Ujunwa Ikefuna and Nwokocha100 who reported a consistently
higher mean blood pressure in female adolescents up to 16 years compared to their male
counterparts of similar ages Early female predominance in mean blood pressure was also
reports by Agyemang Redekop and Owusu-Dabo et al59 in Ashanti adolescents in Ghana
and Obika Adedoyin and Olowoyeye22 in Illorin The finding was however in contrast
with the study in Calabar58 where higher mean BP was found in boys than girls at all
ages The reason for the higher mean BP in females than boys could be because of earlier
onset of puberty in girls The differences in blood pressure between boys and girls in this
study could also be accounted for by variation in the anthropometric variables of the
individuals as girls were seen to be heavier and taller up to middle adolescence
This study demonstrated a consistently positive relationship between blood
pressure and the anthropometric variables of weight height body mass index and waist
63
circumference as widely reported in other studies 545558-6165107100 Weight is reported to
correlate positively with blood pressure in several studies53565871 Body mass index
(BMI) also showed a positive relation with BP in this study as reported in other
studies5978-81 This is in-keeping with the findings in Port Hacourt71 Abeokuta83 the
Gambia69 Brazil82 and Belgrade77 children Some of these studies however were made
up of younger and older age groups Even in lean populations BMI is known to correlate
positively with BP Waist circumference was also found in this study to correlate
positively with BP This was similar to reports from other studies79-8183 It was found to
be a better predictor of BP in two Italian study8081 while it was not in another82
Comparing BMI and waist circumference and their effects on BP Arauzo Lopes and
Moriera et al82 in Brazilian children found BMI to be a better predictor of BP than waist
circumference This was similar to the report by Sebanjo and Oshikoya83 in Nigerian
adolescents in Akure Guagnano Ballone and Colagrande et al81 however found waist
circumference to be better than BMI The study81 however involved adults and may not
be applicable in children and adolescents The present study demonstrated BMI and WC
to be significant but found BMI to be a better determinant of BP than waist
circumference BMI and waist circumference measure obesity in an individual Whereas
BMI is a measure of overall obesity WC measures centralabdominal fat accumulation
and thus said to be more predictive of adverse health risk79 Obese individuals may be
prone to such condition as dyslipidaemia insulin resistance and hypertension with
reduction in the quality of life Weight BMI and or waist circumference affects blood
pressure through decreased physical activity increased cardiac output insulin resistance
impaired pulmonary function and other hormonal abnormalities8084 It seems therefore
that BMI is a better predictor of BP in adolescents than waist circumference The reason
64
for this is not obvious but it may be because of the nature of uniform fat distribution in
adolescents associated with growth and hormonal changes at puberty
Blood pressure distribution in relation to the parental socio-economic class in this
study showed that students from low socio-economic classes had higher mean blood
pressure than those from upper socioeconomic classes but this was not statistically
significant A study in Ibadanl56 reported a statistically significant negative relation
between blood pressure and parental socio-economic status It was also similar to the
study58 in Calabar In contrast other studies found the reverse536022 The reasons for the
inverse relationship between BP and socioeconomic includes exposure to chronic
environmental stress with sustained sympathetic nervous system stimulation Others are
poor health seeking behaviours due to low income andor inadequate health knowledge
high low birth weight rate and inadequate healthy diets among others97101 In the same
environment individuals from a high social class are believed to be more educated with
high income61 They have easy access to health education and awareness on hypertension
prevention and control and better accessibility and adherence to medical treatment617374
The former might be responsible for the finding of this study as Jalingo is a semi urban
community Most of its inhabitants are subsistent farmers civil servants and traders with
low income The high number of students in the lower socioeconomic class lays credence
to that
The overall point prevalence of hypertension in this study was 44 while that of
pre-hypertension was 221 This prevalence of hypertension is similar to the prevalence
of 48 by Antia-Obong and Antia-Obong107 but higher than the prevalence rate of 37
reported in Zaria21 and lower than the prevalence of 58 reported in Ibadan56 54 in
Enugu100 and the 72 reported in Kano65 The prevalence of pre-hypertension was lower
than that reported by Ejeke Ugwu and Ezeanyika99 who found a prehypertensive
65
prevalence of 25 among adolescents in Lokoja It is higher than the 173 reported by
Ujunwa Ikefuna and Nwokocha et al100 in Enugu and 12-17 by Redwine and
Daniels96 among US adolescents The differences in the reported prevalence of
hypertension and prehypertension in adolescents could have resulted from the different
criteria applied by the various researchers in defining hypertension For instance whereas
this study used BP greater than 95th percentile as hypertension a study in Kano65 used the
adult hypertensive value of BPgt14090mmHg as hypertension and got a prevalence of
72 The prevalence in that study65 could have been higher if the percentile or the
statistical definition was used as many children with BP 14090mmHg would probably be
at stage 2 hypertension This was demonstrated in the study by Bugaje Yakubu and
Ogala21 who found a prevalence of hypertension in their study to be 06 when the adult
cut off value of gt14090mmHg was used but it increased to 37 when the statistical
definition of BPgt 2 standard deviations was used
The number of times blood pressure is taken could affect the outcome as repeated
measurements over a time interval is known to give lower BP values than if BP is taken
once This study used the average of three blood pressure values taken at one sitting but
Ujunwa Ekefuna and Nwokocha100 took three readings at five minutes interval with two
other readings at a week interval In that study100 the prevalence of prehypertension
dropped from 745 during the first set of readings to 173 after the third week
readings The prevalence of hypertension also dropped from 135 to 54 over the same
period Similar decrease in the prevalence of both prehypertension and hypertension was
reported by Redwine and Daniels96 in US adolescents when blood pressure was taken
over time interval Another factor which might have affected the overall prevalence is the
Korotkoff sound used for diastolic pressure23 The 4th or 5th Korotkoff sounds has been
used by different researchers resulting in different diastolic BP The study21 in Zaria used
66
the 4th Korotkoff sound while most other researchers2265100 used the 5th About 5-
10mmHg difference is said to exist between the 4th and 5th Korotkoff sounds230 In this
study the 5th Korotkoff sound was used thus giving a higher prevalence of hypertension
in the studied population than in those where the 4th sound was used
The implication of the outcome of this study is that 44 of adolescents in Jalingo
are already hypertensive while 221 of them are at risk of developing hypertension as
they are pre-hypertensive Since 856 (255 of 298) of the prehypertensives were in the
middle and late adolescence these individuals are likely to be adults with high blood
pressure Therefore regular screening of this group of individuals who were assumed to
be a healthy population is highly important for early detection of hypertension and
intervention such as life style changes and treatment
67
CONCLUSIONS
The following conclusions can be made from this study
1 The mean and range of blood pressure of adolescents in Jalingo was similar to
those of other adolescents in Nigeria and other parts of the world Blood pressure
increased progressively with age
2 All measured anthropometry of weight height body mass index and waist
circumference correlated positively with BP but weight was the most significant
variable in BP determination
3 Socioeconomic status was not significantly related with blood pressure
4 The point prevalence of hypertension and pre-hypertension was 44 and 221
respectively using a recommended definition
RECOMMENDATIONS
1 In view of the high prevalence of prehypertension in this study it is recommended
that students should have their blood pressure measured at school entry as this will
68
help identify those with abnormal BP for early intervention Thereafter BP check
should be offered at least once a year at the beginning of a new session especially for
those found with abnormal BP at school entry
2 Physical and health education should be revived in all the schools This will lead to
increased physical activity and reduced risk of obesity and its consequences
3 School health programmes should be strengthened in schools where it already exist
and effort made to establish same in schools where it is yet to exist The programme
should include measures to detect early prehypertension and hypertension and other
health related needs of the students
LIMITATIONS
The following limitations were encountered in the course of the study
1 Exclusion and inclusion of students that were based on volunteered information and
physical evaluation This could have led to inclusion andor exclusion of adolescentss
69
with or without background renal diseases which could have affected the result of this
study
2 Home blood pressure measurement especially early morning measurement for those
with high blood pressure to possibly eliminate the effect of stress traffic andor
trekking and other school related stresses which may affect blood pressure during the
day
LINES OF FUTURE RESEARCH
This study was questionnaire based and time bound Consequently students were not
investigated for background diseases co-mordid conditions target organ damage or risk
factors for high blood pressure They were also not followed up In view of this future
research on blood pressure in adolescents should include-
70
1 Investigations such as urinalysis electrolytes urea and creatinine random blood
sugar (RBS) lipid profile and echocardiography as part of blood pressure evaluation
in adolescents
2 A long period of study to allow for follow-up over months or years to identify those
that are truly hypertensive considering the definition of hypertension It will also
reveal the rate of progression from pre-hypertension to hypertension
3 Risk factors evaluation for high blood pressure including genetic predispositions
REFERENCES
1 Blood pressure from Wikipedia the free Error Hyperlink reference not valid
Accessed 24th November 2011
2 Pickering TG Hall JE Appel LJ Falkner BE Graves J Hill MN Jones DW Kurtz T
Sheps SG Roccella EJ Recommendations for blood pressure measurement in humans
and experimental animals Part 1 Blood pressure measurement in humans A
statement for professionals from the subcommittee of professional and public
71
education of the American Heart Association council on high blood pressure research
Hypertension 2005 45 142-61
3 da Silva IRR de Souza MDG de Camargo CAC Blood pressure measurement in
children and adolescents Guidelines of high blood pressure recommendations and
current clinical practice Arq Bras Cardiol 2007 88 434-7
4 Sinaiko AR Hypertension in children N Engl J Med 1996 3351968-73
5 US Preventive Services Task Force Screening for high blood pressure
recommendations and rationale Am J Prev Med 2003 25 159-64
6 Report of the second task force on blood pressure control in children Pediatrics 1987
79 1-25
7 National high blood pressure education programme working group on hypertension
control in children and adolescents update on the 1987 task force report on high blood
pressure in children and adolescents A working group report from the national high
blood pressure education program Pediatrics 1996 98 649-58
8 National high blood pressure education program working group on high blood
pressure in children and adolescents The fourth report on the diagnosis evaluation
and treatment of high blood pressure in children and adolescents Pediatrics 2004
114 255-76
9 Aderele WI Seriki O Hypertension in Nigerian children Arch Dis Child 1974
49313-7
10 Bo S Gambino R Gentile L Pagano G Rosato R Saracco GM Cassader M
Durazzo M Cavallo-Perin P High-normal blood pressure is associated with a cluster
of cardiovascular and metabolic risk factors a population based study J Hypertens
2009 27 102-8
72
11 Bao W Threefoot SA Srinivasan SR Berenson GS Essential hypertension
predicted by tracking of elevated blood pressure from childhood to adulthood The
Bogalusa Heart Study Am J Hypertens 1995 8 657- 65
12 Richard A Rodgers M Hedley AJ Mitchel JRA Changes in blood pressure and
blood lipid during adolescence BMJ 1980 28 1563-6
13 Sundstroumlm J Neovius M Tynelius P Rasmussen F Association of blood pressure in
late adolescence with subsequent mortality cohort study of Swedish male conscripts
BMJ 2011 342 643-8
14 Zimmet P Alberti G Kaufman F Tajima N Silink M Arslanian S Wong S Bennett
P Shaw J Caprio S On behalf of the International Diabetes Federation Task Force on
Epidemiology and Prevention of Diabetes The metabolic syndrome in children and
adolescents the IDF consensus Diabetic Voice 20075229-32
15 Abdulrahman FA Babaoye AA Childhood hypertension in northern Nigeria West
Afr J Med 1978 1 7-11
16 Adediran O Jimoh A Di M Relationship between body mass index and blood
pressure in rural Nigerian dwellers Internet J Nutri Wellness 2009 7 431-4
17 World Health Organization (WHO)UNICEF Adolescence at a glance 2003 p 2
18 The National Population Commission constitution of the Federal Republic of Nigeria
(AP 23 LFN) legal notice on publication issued April 21st 2007
19 Heald FP and Gong EJ Diet Nutrition and adolescents In Shils ME and Ross AC
(eds) Modern Nutrition in Health and Disease 9th ed William and Wilkins
Maryland USA 1999 p 32
20 Okonkon CT The prevalence of Hypertension among civil servants in Calabar Nig
Med J 1979 7422-5
21 Bugaje MA Yakubu AM Ogala WN Prevalence of adolescent hypertension in Zaria
Nig J Paediatr 2005 32 77-82
73
22 Obika LF Adedoyin MA Olowoyeye JO Pattern of paediatric blood pressure in
rural semi urban and urban communities in Ilorin Nigeria Afri J Med Sci 1995 24
371-7
23 Jeremy B A short history of blood pressure measurement section of the history of
medicine Proc Roy Soc Med 1977 70 793-9
24 Lewis O Stephen Hales and the measurement of blood pressure J Hum Hypertens
1994 8 865-71
25 Crile GW Blood Pressure in Surgery An experimental and Clinical Research
Philadelphia Lippincott 1903 p 358
26 Lewis WH The evolution of clinical sphygmomanometer Bull N Y Acad Med 1941
17 871-81
27 Browne WC OrsquoBrien ET Semple PF The sphygmomanometer of Riva Roci 1896-
1996 J Hum Hypertens 1994 610 723-4
28 Segal HN How Korotkoff the Surgeon discovered the auscultatory method of
measuring arterial pressure Ann Intern Med1975 83 561-2
29 Goodman FH and Howell AA Clinical studies in the auscultatory method of
determining blood pressure University of Pennsylvania Bulletin 1911 23 469-75
30 Crenner CW Introduction of the blood pressure cuff into US medical practice
technology and skilled practice Ann Intern Med 1998 128 488-493
31 Ganon WF Circulation In Review of Medical Physiol Lange Medical Publication
New York 22nd edition 2005 p 234-63
32 Beth C Homeostatic Regulation of Blood pressure Available from
URLhttpwwweHowcom Accessed on 1st December 2011
33 Rajinder KG Fahim M Regulation of cardiovascular functions during acute blood
loss Indian J Physiol Pharmacol 2005 49 213ndash9
74
34 Dampney AL Coleman MJ Fonts MAP Hirooka Y Horiuchi J Polson JW Potts
PD Tagawa T Central mechanisms underlying short-term and long-term regulation
of the cardiovascular system Proc Austr Physio Pharmacosociety 2001 32 333-44
35 Koshiya N Guyenet PG Noradrenergic neurons and the carotid sympathetic
chemoreflex Am J Physiol 1994 267 519-26
36 Prakash ES The ultimate goal in neural regulation of cardiovascular function Adv
Phyiol Educ 2008 32 107-8
37 Allen AM Inhibition of the hypothalamic paraventricular nucleus reduces
sympathetic nerve discharge and blood pressure Proc Austr Neuroscience Society
2001 29 44-7
38 Reid IA Interactions between ANG II sympathetic nervous system and
baroreceptor reflexes in regulation of blood pressure Am J Physiol 1992 262 763-
78
39 Brooks VL Osborn JW Hormonal-sympathetic interactions in long-term
regulation of arterial pressure A hypothesis Am J Physiol 1995 268 1343-58
40 Reckelhoff JF Gender Differences in the Regulation of Blood Pressure
Hypertension 2001 37 1199-208
41 Fink GD The systemic circulation as a regulated free-market economy A new
approach for understanding the long-term control of blood pressure Clin Exp
Pharmacol Physiol 2005 32 377ndash83
42 Benard K Sources of error in blood pressure measurement Hospital Physician 2002
12 33-7 Available from URLhttp wwwturnerwhitecom
43 Chyun DA A comparism of intra arterial and auscultatory blood pressure readings
Heart lung 1985 14 223-31
75
44 Nwankwo MU Lorenz JM Gardiner JC A Standard Protocol for Blood Pressure
Measurement in the Newborn Pediatrics 1997 99 1342-9
45 Deakin CD Low JL Accuracy of the advanced trauma life support guidelines for
predicting systolic blood pressure using carotid femoral and radial pulses
observational study BMJ 2000 321 673ndash4
46 OrsquoBrian E Replacing mercury sphygmomanometers require clinician to demand
better automated device BMJ 2000 320 815-6
47 McKay DW Raju MK Campbell NR Assessment of blood pressure measuring
techniques Med Educ 1992 26 208ndash12
48 Baker RH Ende J Confounders of auscultatory blood pressure measurement J Gen
Intern Med 1995 10 223ndash31
49 Neufeld PD Johnson DL Observer error in blood pressure measurement CMAJ
1986 135 633ndash7
50 van Montfrans GA Oscillometric blood pressure measurement progress and
problems Blood Press Monit 2001 6 287ndash90
51 Ware RW Laenger CJ Indirect blood pressure measurement by Doppler ultrasonic
kinetoartriography Proceedings 20th Annual Conference Engineering Medical
Biology 1967 9 27-30
52 Matthew Fox Blood pressure measurement technique Available from URL http
wwwlivestrongcom Last edited 2nd September 2010 Accessed on 30th November
2011
53 Akor F Okolo SN Okolo AA Blood pressure and anthropometric measurements in
healthy Primary School entrants in Jos Nigeria SAJCH 2010 4 42-5
54 Merhi BM Al-Hajj F Al-Tannir M Zaide F El-Rajab M A survey of blood pressure
in Lebanese children and adolescents North Am J Med Sci 2011 3 24-9
76
55 Al-Salloum AA El-Mouzan AH Al-Herbish AS Al-Umar AA Qurashi MM Blood
pressure standard for Saudi children and adolescents Ann Saudi Med 2009 29 173-8
56 Akinkugbe FM Akinwolere AO Kayode CM Blood Pressure Pattern in
Adolescence West Afri J Med 1999 18 196-202
57 Wanzhu T Eckert GJ Saha C and Pratt JH Synchronization of Adolescent Blood
Pressure and Pubertal Somatic Growth J Clin Endo Metab 2009 94
58 Ansa VO Anah MU Odey FA Mbu PN Agbor EI Relationship between parental
socioeconomic status and casual blood pressure in coastal Nigeria Adolescents West
Afri J Med 2010 29146-52
59 Agyemang C Redekop WK Owusu-Dabo E Bruijnzeels MA Blood pressure
patterns in rural semi-urban and urban children in the Ashanti region of Ghana West
Africa BMC Public Health 2005 5114-21
60 Ejeke CCE Ugwu CE Ezeanyika LUS Olayemi AT Blood pressure patterns in
relation to geographic area of residence a cross-sectional study of adolescents in Kogi
state Nigeria BMC Public Health 2008 8 411-5
61 Colhoun HM Hemminway H Poulter WR Socioeconomic status and blood
pressure an overview analysis J Human Hypertension 1998 12 91-110
62 Badaruddoza KR Familial aggregation and heritability for cardiovascular risk factors
a family based study in Punjab India Natural Science 2010 2 732-6
63 Livshits G Gerber LM Familial factors of blood pressure and adiposity co-variation
Hypertension 2001 37 928-35
64 Fermino RC Seabra A Garganta R Antoacutenio J Maia R Genetic factors in familial
aggregation of blood pressure of Portuguese nuclear families Arq Bras Cardiol 2009
92 463-9
77
65 Mijinyawa MS Iliyasu Z Borodo MM Prevalence of hypertension among teenage
students in Kano Nigeria Nig J Med 2008 17 173-7
66 The Wellcome Trust case control consortium Genome-wide association study of
14000 cases of seven common diseases and 3000 shared controls Nature 2007 447
661-78
67 Levy D Destefano AL Larson MG ODonnell CJ Lifton RP Gavras H Evidence for
a gene influencing blood pressure on chromosome 17 genome scan linkage results for
longitudinal blood pressure phenotypes in subjects from the Framingham heart study
Hypertension 2000 36 477- 83
68 Lifton RP Wilson FH Choate KA Geller DS Salt and blood pressure new insight
from human genetic studies Cold Spring Harb Symp Quant Biol 2002 67 445ndash50
69 van der Sande MA Milligan PJ Nyan OA Rowley JT Banya WA Ceesay SM
Dolmans WM Blood pressure patterns and cardiovascular risk factors in rural and
urban Gambian communities J Hum Hypertens 2000 14 489-96
70 Akinkugbe OO Ojo OA Arterial blood pressure in rural and urban population of
Nigeria BMJ 1969 2 22-4
71 Okagua J Anochie IC Akani NA Adolescent blood pressure in Rivers State Nigeria
A rural-urban comparism NJP 20154221-7
72 Urrutia-Rojas X Egbuchunam CU Bae S Menchaca J Bayona M Rivers PA Singh
KP High blood pressure in school children Prevalence and risk factors BMC
Pediatrics 2006 6 32-9
73 Sorof JM Lai D Turner J Poffenbarger T Potman R Overweight ethnicity and the
prevalence of hypertension in school-aged children Pediatrics 2004 113 475-82
78
74 Rosner B Prineas R Daniels SR Blood pressure differences between blacks and
whites in relation to body size among US children and adolescents Am J Epidemiol
2000 151 1007-18
75 Harding S Whitrow M Lenguerrand E Maynard M Teyhan A Cruickshank JK Der
G Ethnic differences in blood pressure in adolescence the determinants of adolescent
social well-being and health study Hypertension 2010 55 1063-9
76 Cruickshank JK Mzayek F Liu L Kieltyka L Sherwin R Webber LS Srinavasan SR
Berenson GS Origins of the ldquoblackwhiterdquo difference in blood pressure roles of birth
77 Vlajinac H Miljus D Adanja B Marinkoic J ipetic S Kocev N Blood pressure levels
in 7 to 14-year-old Belgrade children J Human Hypertension 2003 17 761ndash5
78 Menezes AMB Hallal PC Dumith SC Adolescent blood pressure body mass index
and skin folds sorting out the effects of early weight and length gains J Epid Comm
Health 2011 12 42-8
79 Karelis AD St-Pierre DH Conus F Rabasa-Lhoret R Poehlman EJ Metabolic and
body composition factors in subgroups of obesity what do we know J Clin Endo
Metab 2004 89 2569-75
80 Katzmarzyk PT Srinivasan ER Chen W Malina RM Bouchard C Berenson GS
Body mass index waist circumference and clustering of cardiovascular disease risk
factors in a biracial sample of children and adolescents Pediatrics 2004 114 198-205
81 Guagnano MT Ballone E Colagrande V Della Vecchia R Manigrasso MR Merlitti
D Riccioni G Sensi S Large waist circumference and risk of hypertension Int J
Obesity 2001 25 1360 ndash 4
82 Araujo TA Lopes MVO Moriera RP Cavalcante TF Gurdes NG MartinS dA Silva
V Blood pressure of children and teenagers from a public school in Fortaleza - Cearaacute
Acta paul enferm 200720103-15
79
83 Sebanjo IO Oshikoya KA Obesity and blood pressure levels of adolescents in
Abeokuta Nigeria Cardiovasc J Afr 2011 221-5
84 Messerli FN Obesity and essential hypertension Haemodynamics sodium excretion
and plasma rennin activity Arch Int Med 1981 141 81-5
85 Appel LJ Brands MW Daniels SR Karanja N Elmer PJ Sacks FM Dietary
Approaches to Prevent and Treat Hypertension A Scientific Statement from the
American Heart Association Hypertension 2006 47 296-308
86 Sacks FM Svetkey LP Vollmer WM Appel LJ Bray GA Harsha D Obarzanek E
Conlin PR Miller ER 3rd Simons-Morton DG Karanja N Lin PH for the DASH-
Sodium Collaborative Research Group Effects on blood pressure of reduced dietary
sodium and the Dietary Approaches to Stop Hypertension (DASH) diet DASH-
Sodium Collaborative Research Group N Engl J Med 2001 344 3ndash10
87 Appel LJ Moore TJ Obarzanek E Vollmer WM Svetkey LP Sacks FM Bray GA
Vogt TM Cutler JA Windhauser MM Lin PH Karanja N A clinical trial of the
effects of dietary patterns on blood pressure DASH Collaborative Research Group N
Engl J Med 1997 3361117ndash24
88 Appel LJ Sacks FM Carey VJ Obarzanek E Swain JF Miller ER 3rd Conlin PR
Erlinger TP Rosner BA Laranjo NM Charleston J McCarron P Bishop LM for the
OmniHeart Collaborative Research Group Effects of protein monounsaturated fat and
carbohydrate intake on blood pressure and serum lipids results of the OmniHeart
randomized trial JAMA 2005 294 2455ndash64
89 Karanja NM Obarzanek E Lin PH McCullough ML Phillips KM Swain JF
Champagne CM Hoben KP Descriptive characteristics of the dietary patterns used in
the Dietary Approaches to Stop Hypertension Trial DASH Collaborative Research
Group J Am Diet Assoc 1999 99 19ndash27
80
90 Nwokocha ARC Adolescence and associated problems In Azubuike JC and
Nkanginieme KEO (eds) Paediatrics and Child Health in a Tropical Region African
Educational Services Owerri Nigeria 2nd edition 2007 p 84-99
91 Rogol RT Roemmich JN Clark PA Growth and puberty J Adol Hlth 2002 31 192-
200
92 Tanner JM Marshal WA Variation in the pattern of puberty changes in boys and girls
Arch Dis Child 1970 45 13-23
93 Nwakoro SO Ifoda K Onochie O Olomu JM Anthropometric assessment of
nutritional status and growth of 10-20 years individuals in Benin City metropolis
Nigeria Pakistan J Nutr 2006 5 117-21
94 Shankar RR Eckert GJ Saha C Tu W Pratt JH The change in blood pressure during
pubertal growth J Clin Endo Metab 2005 90 163-7
95 Department of Health and Human Services 2000 CDC Growth Charts for the United
States methods and development Series Report 11 No 246 Available from URL
httpwwwcdcgovGrowthCharts
96 Redwine KM Daniels SR Prehypertension in Adolescents Risk and Progression
Journ Clin Hypertension 2012 14 360ndash4
97 Falkner B Gidding SS Portman R Rosner B Blood pressure variability and
classification of prehypertension and hypertension in adolescence Pediatrics 2008
122238ndash42
98 Redwine KM Acosta AA Poffenbarger T Development of hypertension in
adolescents with pre-hypertension J Pediatr 2012 16098ndash103
99 Ejike ECCC Ugwu CE and Ezeanyika LUS Variations in the prevalence of point
prehypertension in a Nigerian school-going adolescent population living in a semi-
urban and an urban area BMC Pediatr 2010 1013
81
100 Ujunwa FA Ikefuna AN Nwokocha AR Chinawa JM Hypertension and
prehypertension among adolescents in secondary schools in Enugu South East Nigeria
Italian J Pediatr 20133970-5
101 Chobanian AV Bakris GL Black HR Seventh report of the Joint National
Committee on Prevention Detection Evaluation and Treatment of High Blood
Pressure Hypertension2003 421206ndash52
102 Lande MB Systemic Hypertension In Kliegman RM Behrman RE Jenson HG and
Stanton BF (eds) Nelson Textbook of Pediatrics Saunders Elsevier Philadelphia 19th
Edition 2011 pg 1592-8
103 Luma GB Spiotta RT Hypertension in Children and Adolescent Am Fam Physician
2006 73 1558-68
104 Arvind B Rupesh J Vijayakumar M Madhuri K Ali U Evaluation and management
of hypertension Indian Paediatr 2007 44 103-21
105 Flynn JT Neonatal hypertension Diagnosis and management Pediatr Nephrol 2000
14 332-41
106 Steyn K de Wet T Richter L Cameron N Levitt NS Morrel C Cardiovascular
diseases risk factors in 5-year old urban South African children- The Birth to Ten
Study SAMJ 2000 90 7126
107 Antia-Obong OE Antia-obong LE Arterial blood pressure of Nigerian Urban and
Rural school children Nig J Paediatr 1991 18 3-11
108 Nguyen NT Magno CP Lane KT Hinojosa MW Lane JS Association of
hypertension diabetes dyslipidemia and metabolic syndrome with obesity findings
from the National Health and Nutrition Examination Survey 1999 to 2004 J Am Coll
Surg 2008 207 928-34
82
109 Solar MB Gill A Rey J Epidemiology of arterial blood pressure in school children
population Aten Primaria 1992 9 212-4
110 Steyn K de Wet T Richter L Cameron N Levitt NS Morrel C Cardiovascular
diseases risk factors in 5-year old urban South African children- The Birth to Ten
Study SAMJ 2000 90 7126
111 Linkas J The assessment and management of hypertensive emergencies and
urgencies in children Pediatr Emerg Care 2005 21391-6
112 Croix B Feig DI Childhood hypertension is not a silent disease Pediatr Nephrol
2006 21527-32
113 Flynn JT Anderson MH Characteristics of children with primary hypertension seen
at a referral centre Pediatr Nephrol 2007 44 103-21
114 Nakao M Yano E Nomura S Kuboki T Blood pressure lowering effects of
biofeedback treatment in hypertension a meta-analysis of randomized controlled trials
Hypertension 2003 26 37- 46
115 Jalingo Available from URLhttpwwwencyclopedia Britanica Accessed on 3rd
December 2011
116 Araoye MO Research Methodology with Statistics for Health and Social Sciences
Nathadex Publishers Saw-Mill Ilorin Nigeria 2004 pg 115-21
117 Olusanya O Okpere E Ezimokhai M The importance of social class in voluntary
fertility control in a developing country West Afr J Med 1985 4 205-12
118 World Health Organization expert committee Physical status the use and
interpretation of anthropometry WHO technical report series No 894 Geneva WHO
1995 p 424ndash38
119 Guidelines subcommittee WHOISH guideline for management of hypertension J
Hypertens 1999 17 151-83
83
120 Aubay B How to measure waist circumference Available from
URLhttpwwwehowcom Last updated August 10th 2011 and accessed on December
9th 2011
APPENDICES
Appendix 1
PROFORMA ON BLOOD PRESSURE PATTERN IN APPARENTLY HEALTHY
SECONDARY SCHOOL ADOLESCENTS IN JALINGO
PUBLIC SCHOOL [ ]
Serial No
84
PRIVATE SCHOOL [ ]
A BIODATA
1 Age (years) 10[ ] 11[ ] 12[ ] 13[ ] 14[ ] 15[ ] 16[ ] 17[ ] 18[ ] 19[ ]
2 Gender M [ ] F [ ]
3 Class JSS 1-3 [ ] SS1-3 [ ]
B MEDICAL AND SOCIAL HISTORY Yes [1] No [2]
1 Have you ever passed blood in your urine [ ]
2 Have you ever had your face or legs swollen [ ]
3 Are you on any drug for long time (such as pills steroids marijuana codeine
NSAIDs containing drugs tramal and others) [ ]
If yes specifyhelliphelliphellip
C SOCIO-ECONOMIC CLASSIFICATION
Fatherrsquos occupation
Score 1 Professionals top civil servants politicians and top businessmen
2Middle-level civil servants technicians skilled-artisans and well-to-do
traders
3 Unskilled workers and those in general whose income would be at or below
the national minimum wage
Mothers educational level
Score 0 Education up to University level
1 Secondary or tertiary level below the University
2 No formal education or up to primary level only
D ANTHROPOMETRY
i Weight (Kg) ndash 1helliphellip 2helliphelliphellip Averagehelliphelliphelliphellip
ii Height (m) ndash 1helliphellip 2helliphellip Averagehelliphelliphelliphellip
85
iii Body mass index = weightheight (kgm2)
v Waist circumference (cm) ndash 1helliphellip 2helliphelliphellip Averagehelliphelliphelliphellip
iv Blood Pressure (mmHg) - 1helliphellip 2hellip 3helliphellip Averagehelliphelliphelliphellip
Appendix 2
AUTHORIZATION AND CONSENT TO PARTICIPATE IN A RESEARCH
I Dr Peter Teru Yaru of the Department of Paediatrics Ahmadu Bello University
Teaching Hospital (ABUTH) Zaria Irsquom conducting a research on the blood pressure
pattern among secondary school adolescents in Jalingo
The aim of the study is to know the level of blood pressure among their age
groups Those with high blood pressure (or hypertension) will be identified appropriately
advised and referred for further care The study will involve taking their weight height
blood pressure and waist circumference Female assistants shall be responsible for
86
measuring waist circumference of female students Students will also be given a
questionnaire on some of their activities drug use among others all aimed at looking for
factors which can affect their blood pressure Information obtained shall be treated with
utmost confidentiality and for this research work only Please note that participation is
voluntary I will be glad if you give consent for your childward to participate in the
study
Statement by parents Irsquove read and understood this consent form and agreed for my
child to be included in the study
Parents name Researcherrsquos name and sign
Parents phone no if any Date
Parents signthumb print Phone no
87
Appendix 3
SOCIO-ECONOMIC SCORE
The classification of socio-economic scores based on fatherrsquos occupation and motherrsquos
education by Olusanya et al117
A Husband (fatherrsquos occupation)
Score 1 Professionals top civil servants politicians and businessmen
2 Middle-level bureaucrats technicians skilled-artisans and well-to-do traders
3 Unskilled workers and those in general whose income would be at or below
the national minimum wage
B Mothers educational level
Score 0 Education up to University level
1 Secondary or tertiary level below the University
2 No formal education or up to primary level only
The socio-economic class of the childrsquos mother is obtained by adding the scores from A
and B above and graded I-V as appropriate for example
Score (1) from A plus score (0) from B = social class I
Score (2) from A plus score (0) from B = social class II
Score (2) from A plus score (1) from B = social class III
Score (2) from A plus score (2) from B = social class IV
Score (3) from A plus score (0) from B = social class III
Score (3) from A plus score (1) from B = social class IV
Score (3) from A plus score (2) from B= social class V
Page 11
11
from public schools with 1084plusmn125mmHg(t=-222 plt0027)and higher mean diastolic
blood pressure of 703plusmn80mmHg than those from public schools with 677plusmn81mmHg(t=-
461 p=0000)
Blood pressure correlated positively with age (r=030-035 plt0000) height (r=034-
044 plt0000) weight (r=038-051 plt0000) body mass index (r=029-040 plt0000) and
waist circumference (r=023-031 plt0000) The socio-economic class associated negatively
with blood pressure withthose from upper socio-economic classeshavinga relatively
lowermean blood pressure than their counterparts from lower socio-economic classes but the
differences were not statistically significant for both systolic (f=1650 p=2850) and diastolic
blood pressure (f=0193 p=0058)
The overall point prevalence of hypertension was 44(59 0f 1350) with gender specific
prevalence for malebeing 41 (26 of 628 boys) and46 (33 of 722 girls) for females The
gender difference was not statistically significant (χ2=0831 p=0362) According to stages of
hypertension 15 (10 of 628)and 11 (7 of 628) males had stages 1 and 2 systolic
hypertension respectively while24 (15 of 628) had stage 1 diastolic hypertension andnone
had stage 2 diastolic hypertension Similarly 24 (17 of 722) and 12 (9 of 722) females
had stages 1 and 2 systolic hypertension respectively while 12 (9 of 722) and only 01 (1
of 722) girls had stages 1 and 2 diastolic hypertension respectively The overall prevalence of
pre-hypertension was 221(298 of 1350) with gender related prevalence of 21 (131 of
628) for males and231 (167 of 722) for femalesThe gender difference was statistically
significant (χ2=4349 p=0037)
In view of the high prevalence of pre-hypertension of 221 (298 of 1350) in this
study it is recommended that blood pressure measurement should be included as part of
medical evaluation at secondary school entry and at least annually thereafter especially for
those found to be at risk of hypertension during school entry
12
INTRODUCTION
Blood pressure (BP) is the pressure exerted by circulating blood volume on the walls of
blood vessels1 It is one of the vital signs measured during routine physical examination2
Blood pressure measurement is done to screen for hypertension and other cardiovascular
risk factors determining risk for various medical procedures identifying patients in
potential or actual clinical deterioration and determining individualrsquos fitness for an
occupation3 Its value as a screening tool in adults has long been documented and is an
established important component of routine paediatric physical examination4
The importance of BP measurement in children and adolescents is based on the fact
that hypertension is now increasingly diagnosed among them5-8 The American Academy
of Paediatrics now recommends routine screening of asymptomatic adolescents and
children during preventive care visits Such screening will identify potentially treatable
and preventable causes of hypertension and initiate early treatment to prevent
complications5
Hypertension is an important health problem all over the world5-9 because it is
usually silent and the presence of symptoms may indicate end organ damage10 It is
known to track well into adulthood thus making BP measurements in youths valuable for
identifying adolescents at risk of essential hypertension in adulthood11 Individuals with
high BP in their childhood are more likely to have high BP in subsequent years12 The
phenomenon of BP tracking into adulthood and the demonstration of the beginnings of
hypertensive target organ damage during childhood together with the increased
prevalence of childhood essential hypertension have raised concern of an impending
epidemic of cardiovascular morbidity and mortality10
The consequences of hypertension in children range from increased morbidity
from its causes complications or its treatment to high mortality13 The most frequently
13
and perhaps severely affected organs are the heart kidneys brain and the eyes leading to
lowered life expectancy and premature death13 In addition hypertension is a component
of the metabolic syndrome associated with similar and perhaps more severe consequences
in affected individuals14 Abdulrahaman and Babaoye15 in a study of hypertension in
Nigerian children observed a mortality rate of 28 within the first year after diagnosis
Similar mortality of 275 was reported by Aderele and Seriki9 Hypertension also places
an excessive financial burden on the population and health system consuming scarce
resources16
Adolescence is the transitional period of development between childhood and
adulthood The World Health Organization (WHO) defines adolescents as individuals
between the ages of 10 and 19 years and they account for 40 of Nigeriarsquos population1718
Adolescence is characterized by rapid biological psychological and cognitive changes
largely dependent on hormonal and environmental influences19 Many of the responses to
these influences include behaviours that have direct implications on health such as harmful
dietary intake alcoholism smoking substance abuse and sedentary lifestyle19 These
coupled with social stresses such as city traffic congestion have negative health impact and
predispose to obesity and increased risk of cardiovascular disease such as hypertension and
metabolic syndromes10 20 It has been shown that if preventive measures are started early in
childhood and adolescence they may lead to significant reduction in the high prevalence of
hypertension and metabolic syndrome currently observed in adults81320
JUSTIFICATION FOR THE STUDY
Hypertension is associated with high morbidity affecting major organs of the body such as
the heart kidneys and the brain1314 and a mortality of up to 275-28915 It is now diagnosed
frequently in adolescents with a reported prevalence of 35-952122 The younger the age of
14
onset of hypertension the greater the reduction in life expectancy if left untreated13 Even
asymptomatic adolescents with mild blood pressure elevations can have target organ
damage10 Studies121420 have shown that early identification and intervention may lead to a
significant reduction in the high prevalence of hypertension and metabolic syndrome
currently observed in adults In view of this routine blood pressure check-ups for children
and adolescents have been advocated during medical evaluations8 Blood pressure is
however not routinely measured in most paediatric clinical practices in Nigeria
Consequently only few children will have their blood pressure measured when they fall sick
or during preventive care visits In addition hospital and clinic BP measurements may be
associated with falsely elevated BP called lsquolsquowhite coat hypertensionrsquorsquo8 BP measurement of
children outside of the hospital setting such as in schools will provide opportunity for
apparently healthy individuals and possibly eliminate white coat hypertension The need for
surveillance for the early identification of adolescents in Jalingo who are at risk of
hypertension and to initiate measures aimed at preventing its consequences is therefore the
justification for this study In addition the study will add to the body of knowledge on
adolescent blood pressure as there has been no previous study on BP from Jalingo and
northeastern Nigeria as a whole This will help inform public health policies regarding blood
pressure control and prevention in Taraba State in particular and in Nigeria in general
15
LITERATURE REVIEW
HISTORICAL PERSPECTIVE
Blood pressure measurement first started in the eighteenth century with the experiment of
Stephen Hales to whom its discovery can be attributed as reported by Jeremy2324
Accurate study of blood pressure as reported by Crile25 began with the introduction of a
manometer by Poiseuille a century later The first truly accurate blood pressure
measurement in man was by the Surgeon Faivre in 1856 when he connected an artery to a
mercury manometer to obtain direct readings24 Non-invasive methods of BP
measurement started with the discovery of the sphygmograph in 1855 by Vierordt as
reported by Crile25 and improvement by Potain in 1889 gave birth to the
sphygmomanometer26 In 1896 Scipione Riva-Rocci developed the method upon which
present-day technique is based27
Segal28 reported that the use of stethoscope for BP measurement was first highlighted
in 1905 by a Russian surgeon Korotkoff who documented hearing a tapping sound using a
stethoscope placed over the brachial artery as the Riva-Rocci cuff was deflated Goodman
and Howell29 recommended the division of the changing sounds into five distinct phases and
physicians subsequently determined blood pressure according to the point of appearance and
muffling or disappearance of the sounds30
DEFINITION AND REGULATION OF BLOOD PRESSURE
Blood pressure is defined as the product of cardiac output and peripheral vascular
resistance131 During each heartbeat BP varies between a maximum (systolic) and a
minimum (diastolic) pressure and is measured in millimeters of mercury (mmHg)1 Blood
16
pressure is regulated by different mechanisms acting either rapidly or slowly to maintain it
within normal range for optimal cellular performance3132
Intrinsic Regulation
Intrinsic factors regulating BP include stroke volume and heart rate which both influence
cardiac output31 Stroke volume depends on the volume of blood that fills the ventricles and
this depends on the preload and afterload33 A higher afterload will decrease stroke volume
causing low cardiac output and low BP and vice versa When cardiac output increases more
volume is derived from the venous pool increasing preload Similarly an increased heart rate
will lead to increased cardiac output and BP3134
Reflex Regulation
The baroreceptors within the aortic arch and carotid sinuses contain sympathetic and
parasympathetic nerve fibres3435 These are sensory nerves which run from the medulla
and they respond to stretch of the tissue in which they lie by increasing or decreasing the
rate of signaling36 and act fast in regulating BP34 Sympathetic stimulation causes
increased heart rate and widespread vasoconstriction to increase BP while
parasympathetic stimulation produces the opposite3537
Hormonal Regulation
Hormones regulating blood pressure include renin-angiotensin-aldosterone and
antidiuretic hormone (ADH) They act slowly by responding to changes in intravascular
volume and osmolality38 Angiotensin II is a potent vasoconstrictor and stimulates the
release of aldosterone from the adrenal gland39 Aldosterone increases sodium absorption
and fluid retention leading to increased BP ADH is a potent vasoconstrictor and plasma
volume regulator and its stimulation results in fluid retention and vasoconstriction39
Other hormones regulating BP include the sex hormones thyroid parathyroid cortisol
and ACTH They act on the rennin-angiotensin-aldosterone system to regulate BP3940
17
Renal Regulation
The kidneys control blood pressure through the retention and excretion of extracellular
fluid35 An increase in renal fluid retention will increase extracellular volume and higher
blood pressure whereas increased renal excretion leads to lower blood pressure41 This is
achieved through the action of ADH aldosterone and atrial natriuretic peptide (ANP)41
METHODS OF MEASURING BLOOD PRESSURE
Blood pressure can be measured by invasive and non-invasive methods
1) Invasive (or direct) method - Blood pressure is most accurately measured invasively
through an arterial line4243 It is the gold standard by which the accuracy of other blood
pressure measuring devices and methods are assessed4344 Chyun43 compared direct and
indirect blood pressure readings in 14 intensive care unit patients and found that the
auscultatory method overestimates the systolic and diastolic BP especially if the VI Kortkoff
sounds is used as an indicator of diastolic BP This can often over estimate reading by as
much as 20 mm Hg43 This study is made up of very small sample size to make general
conclusion on the differences in BP values from the two methods compared Although the
invasive method is the gold standard for true BP measurement it is associated with serious
complications related to arterial catheterization and the procedure itself may be technically
difficult It is mainly used in experimental procedures and in monitoring critically ill patients
in intensive care units42
2) Non invasive (indirect) methods These are simpler and quicker than the invasive
method and are commonly used for routine blood pressure examinations They may
however yield lower accuracy and small systematic differences in numerical results43
These methods include-
18
a) Palpation method - A minimum systolic value can be estimated by palpation Deakin
and Low45 reported that a palpable radial femoral or carotid pulse indicates a minimum
systolic BP of 80 70 and 60 mmHg respectively The study was carried out among adults
and these values could not be applicable in children and neonate whose maximum
systolic BP may be lower than the reported minimum values A more accurate systolic BP
value can be determined by inflating and then deflating sphygmomanometer cuff while
palpating the pulse The systolic BP corresponds to the pressure at which the radial pulse
becomes palpable45 Its disadvantages are that pressure obtained is usually 2-5mmHg less
than those obtained by auscultation and diastolic BP cannot be measured32
b) Auscultation method- Also called the Korotkoff method is the method of choice in
clinical practice142 It involves using a stethoscope and a sphygmomanometer46 The
mercury sphygmomanometer is the gold standard for BP measurement A Riva-Rocci
cuff 27 is placed over the arm and inflated to occlude the brachial artery It is then
gradually deflated until blood flow is re-established accompanied by a tapping sound
which can be detected by the stethoscope held over the artery Five sounds are
traditionally heard and classified into phases30 The first phase corresponds to the systolic
BP while the last or fifth phase corresponds to the diastolic BP30 The fourth phase
alternatively is used to measure the diastolic pressure if a 10 mmHg or greater
differences exist between the initiation of phases fourth and five or if the fifth sound is
heard down to 0 mmHg8 This may occur in cases of high cardiac output or peripheral
vasodilatation children or in pregnancy This method though the method of choice in
clinical practice may however be associated with errors arising from faulty technique and
equipment4748 as well as observer bias49 This method was used for this study because of
its widespread general usage its reliability and accuracy Unlike other methods the
instruments (mercury sphygmomanometer and stethoscope) do not require any
19
calibration and values obtained do not require validation by other methods The standard
World Health OrganizationCenter for Disease Control (WHOCDC) blood pressure
reference percentile tables were generated using the mercury sphygmomanometer hence
the auscultation method is the gold standard for BP evaluation258
The aneroid sphygmomanometer measures BP by mechanical system of metal
bellows that expand as the cuff pressure increases in a series of levers that register the
pressure on a circular scale The hybrid shygmomanometer combines some of the features
of the two and uses an electric transducer to record blood pressure2
c) Oscillometric technique- This uses the oscillometric device Oscillation of pressure in a
sphygmomanometer cuff is recorded during gradual deflation The point of maximum
oscillation corresponds to the mean arterial pressure50 The oscillation begins well above
systolic BP and continues below diastolic BP so that systolic and diastolic BP can only
be estimated indirectly according to some empirically derived algorithm
d) Ultrasound method - This uses an ultrasound transmitter and receiver placed over the
brachial artery under a sphygmomanometer cuff As the cuff is deflated the movement of
the arterial wall and systolic BP cause a Doppler phase shift in the reflected ultrasound
The diastolic BP is recorded as the point of diminished arterial motion51 Its advantage
includes the ability to detect diastolic BP in atrial fibrillation and hypotension where
Korotkoff sound is faint152
FACTORS AFFECTING BLOOD PRESSURE IN ADOLESCENTS
Several inter-related factors affect blood pressure These include-
Age - A progressive BP elevation with age has been observed in several studies2153-55
The rate of rise varies in boys and girls5455 The average systolic increase ranges between
20
166 and 286 mmHgyr for boys and 144 and 263mmHgyr for girls while that of
diastolic BP ranges from 083 and 177mmHgyr for boys and 077 and 148mmHg for
girls2155 Bugaje Yakubu and Ogala21 studied blood pressure pattern among 2035
adolescents in Zaria and found a consistent rise of BP with age The rate of rise was fairly
constant until 11-13 years in boys and 12-14 years in girls when the rise became rapid A
similar study53 also found a BP rise with age among 650 healthy school children in Jos In
a large population studies in Lebanon56 and Saudi Arabia55 BP was similarly reported to
increase consistently with age Rapid growth and biological maturation of organs which
are normal occurrences during adolescence were thought to be responsible rather than the
chronological age56 The results of these studies showed increasing blood pressure with
age despite the fact that one study55 used oscillometric method for their study while the
standard auscultation was used in the other studies Also the studied sample sizes across
these studies varied greatly with sizes of 65053 203521 571054 and 1622655 Despite this
the findings were similar
Gender ndash Results of studies on the effect of gender on BP showed that sex positively
affects blood pressure2153-55 Merhi Al-Hajj and Al-Tannir et al54 studied BP pattern in
5710 Lebanese school children while Al-Salloum El-Mouzan and Al-Herbish et al55
studied BP pattern in 16226 Saudi children and adolescents The authors reported a
higher BP in girls than boys at all ages A study21 of BP pattern in adolescents in Zaria
Nigeria demonstrated an initial higher BP in boys before puberty which reversed with the
onset of puberty up to the age of 14-15yrs when it reversed again to be higher in boys
Akinkugbe Akinwolere and Kayode56 reported no sex differences in adolescent BP in
Ibadan The reported sex difference is said to be likely due to differences in sex hormone
and pattern of growth in boys and girls57 Differences in age range of the study population
may however be responsible for the observed BP variation For instance these studies5455
21
comprised of both adolescents and pre-adolescent age groups combined in one study
while the other two studies2156 were purely adolescents21 Blood pressure is reported to be
equal in both sexes before adolescence after which the gender difference starts to
manifest most likely due to physical and hormonal changes
Socioeconomic Factors - Belonging to either end of the socioeconomic strata is found to
be associated with elevated blood pressure5859 A study in Ibadan56 reported an inverse
relationship between parental socioeconomic status and level of BP in adolescents The
authors suggested that this might be the result of the health behaviours and problems
characteristic of the lower socioeconomic class On the other hand Ejeke Ugwu and
Ezeanyika et al60 in Lokoja and another study53 in Jos both found higher BP in children
from high socioeconomic class Colhoun Hemminway and Poulter61 in a meta-analysis of
BP and socioeconomic status in developed and developing countries found an inverse
relationship of BP with socioeconomic status in developed nations and a direct correlation
in developing countries These different findings may be due to methodological
differences in socio-demographic stratification For instance Akinkugbe and
colleagues59 used fatherrsquos level of education for social classification Parentrsquos educational
level may however not equate well with level of family income The other study60 used an
automated device for their study whose values may require validation using the
recommended auscultation method Difference in environmental stresses may also be
different considering the level of development of the areas where the studies were carried
out
GeneticFamilial Factors - The effect of geneticfamilial factors on BP has been
demonstrated in some studies62-64 Familialgenetic correlations reflected in BP and other
anthropometry generally are higher among genetically close relatives such as brother-
sisters or parent-offspring than among spouses62 Levshit and Gerber63 surveyed 514
22
individuals from 135 nuclear families in Russia while Budaruddoza62 studied 1400
individuals from 380 families in India and found significant genetic influence on BP
Mijinyawa Iliyasu and Borodo65 also reported family history of hypertension as risk
factor for developing high BP in a study on prevalence of hypertension among 1000
teenagers in Kano The authors concluded that this could be due to genetic predisposition
They however did not evaluate further to determine the genetic defects The authors did
not also consider shared environmental factors known to influence blood pressure in
individuals Molecular genetic studies have identified genes as possible regulators of
BP6667 These genes regulate the renin-angiotensin-aldosterone system involved in renal
salt handling69 Mutations that increase sodium reabsorption and salt sensitivity is
associated with higher BP and vice versa68 while shared environmental risk factors may
potentiate the development of such familial conditions which might have been
responsible for outcome of the above studies6364
Environmental Factors ndash Environmental factors greatly influence BP variation in a
population592269 Akinkugbe and Ojo70 reported a consistently higher BP in Nigerian
adolescents than their counterparts of similar ages in black and white American children
The authors are of the view that this could be due to different environmental factors of the
study population Obika Adedoyin and Olowoyeye22 studied BP pattern in 2526
children aged 1-14 years in rural semi-urban and urban communities in Ilorin Nigeria
and demonstrated a hypertension prevalence of 95 in urban compared to 63 in rural
communities This was similar to the study59 in Ghana and Gambia69 The authors592269
argued that the differences were due to socioeconomic status which is higher in the urban
than the rural areas The BP variation could be accounted for by the nature of dietary
intake since the rural communities generally consume more of natural foods with less salt
and lsquojunk foodsrsquo compared to the urban populace This was demonstrated by one study61
23
which reported higher mean BP among urban communities in developing nations due to
changes in their dietary pattern Rural areas are also less exposed to the stress and hassle
of the urban cities It is of interest to note however that urban areas are a mixture of
social classes as a result of migrant workers seeking lsquogreener pasturesrsquo Okagua Anochie
and Akani71 on the other hand reported higher mean BP among rural adolescents than
their urban counter parts in Port Harcourt The authors could not identify the reason(s) for
their finding but concluded that the seemingly protective privilege of rural life may be
fading gradually The differences in the reports could however result from the sample size
composition comprising of preadolescents22 adolescents71 and adults69
Race - Higher BP levels have been reported in African-American and Hispanic school-
age children than their Caucasian counterparts and among African-Americans than the
Hispanics7273 Akinkugbe and Ojo70 demonstrated a consistently high systolic and
diastolic BP in Nigerian children compared with black and white American children of
similar age Exposure to chronic environmental stress low socioeconomic status and high
obesity rate among African American and Hispanic youths could contribute to higher
BP72-74 It can be inferred from the study that race alone may not be responsible for the
observed differences but shared environmental factors and socioeconomic status may be
contributory77 Other studies7475 however found no significant BP differences in relation
to race
Anthropometry and blood pressure (BP) - A positive correlation has been observed
between BP and anthropometry in various studies58-5977 These studies585678 observed a
significant correlation between systolic BP and weight height and body mass index
(BMI) in boys but only with weight in girls Body mass index (BMI) is used as a
measure of overall obesity but it is known to be a poor indicator of actual body fat79
Waist circumference (WC) is an aggregate measurement of the actual amount of total and
24
abdominal fat accumulation80 It is therefore a better predictor of BP and other
cardiovascular diseases8081 Guagnano Ballone and Colagrande et al81 studied the
relationship between BP and BMI WC and waist hip ratio (WHR) in 461 people and
found WC to be the most consistent anthropometry affecting BP It is of interest to note
that the study by Guagnano et al81 was in adults population while the other studies56-59
were in children and adolescents WC was also found to be a better predictor of BP in an
Italian study8081 while it was not in others56-6982 Comparing BMI and waist
circumference and their effects on BP Arauzo Lopes and Moriera et al83 in Brazilian
children found BMI to be a better predictor of BP than waist circumference This was
similar to the study by Sebanjo and Oshikoya82 in Nigerian adolescents in Akure Thus
waist circumference measurements may not be useful in the evaluation of obesity andor
hypertension in children and adolescents This may partly be explained by the uniform fat
distribution due to hormonal effect at puberty in adolescents compared to the
disproportionate fat distribution in adults Possible mechanisms for the positive
relationship between BP and high BMI includes decreased physical activity increased
salt intake impaired pulmonary functions and development of metabolic abnormalities
such as dyslipidaemia and insulin resistance8084
Nutritional factors - Diet has been a primary link between humans and their environment
and substantial evidence supports the concept that multiple dietary factors affect BP85
Well-established dietary modifications that lower BP are reduced salt intake increased
potassium intake increased protein particularly plant protein high vegetable and
polyunsaturated fats85 High sodium intake on the other hand is said to be associated with
elevated blood pressure86 A series of 3 large controlled feeding studies tested the effects
of dietary patterns on BP86-89 Of the 3 diets studied the dietary approach to stop
hypertension (DASH) emphasized fruits vegetables low-fat dairy products whole
25
grains poultry fish nuts potassium magnesium calcium and fibre as the most effective
diet89 Among all participants the DASH diet significantly lowered mean systolic BP by
55 mm Hg and mean diastolic BP by 30 mm Hg each net of changes in the control diet
DEFINITION AND CLASSIFICATION OF ADOLESCENCE
Adolescence is the transitional stage between childhood and adulthood during which many
life patterns are learnt and established90 According to World Health Organization (WHO)
adolescents are individuals between the age range of 10-19 years17 The most significant
feature of adolescence is puberty characterized by an exceptionally rapid rate of biological
growth and development including physical and sexual maturation9091 The pubertal changes
have been described by Tanner and Marshal92 and are grouped into five stages This utilizes
definite criteria for growth and development of secondary sexual characteristics like pubic
hair and breast in females and pubic hair and genitalia in males9092 The timing of these
events and the rate of growth vary due to genetic and environmental factors in different
populations92 Adolescence is divided into early middle and late periods17
Early adolescence (10-13 years) ndash This is a period of rapid growth and development of
secondary sexual characteristics and varies according to sex It corresponds to Tanner stages
1 and 290 The main features of this stage are breast bud development and menarche in girls
while testicular enlargement and seminal emission occurs in boys93
Middle adolescence (14-16 years) ndash In this stage rapid growth decreases and there is more
cognitive development as the adolescents move from concrete thinking to formal operation
and develop greater competence at abstract thinking91 This corresponds to Tanner stages 3
and 4
Late adolescence (17-19 years) ndash Here slowing of physical changes continue which permits
the emergence of a more stable body image Cognition tends to be less self-centered with
26
demonstration of care for others with increasing thought about concepts such as justice
patriotism and history It corresponds to Tanner stage 59092
ADOLESCENCE AND BLOOD PRESSURE
Adolescence is characteristically associated with increasing blood pressure because of the
physical growth and hormonal changes associated with puberty5794 After the age of one year
normal BP increases more during puberty than probably at any other time in an individualrsquos
lifetime95 Wanzhu Eckert and Saha et al57 examined data from a cohort of 182 normotensive
children in Indiana who had blood pressure measurements taken semi-annually for up to 12
yr The authors found that the rate of change in BP and weight peaked at the age of maximum
pubertal growth spurt (PGS) This BP spurt roughly coincides with growth spurt during
puberty94 Surveys of BP patterns from childhood through adolescence shows systolic and
diastolic pressures increase with age and in adolescents the increase in males is more marked
than in females especially the systolic pressure5458229495
CLASSIFICATION OF BLOOD PRESSURE IN ADOLESCENTS
The National High Blood Pressure Education Program Working Group (NHBPEPWG) of the
United States established guidelines for the definition of normal and elevated blood pressures
in children in 19876 These guidelines were revised in 20048 The definition of childhood
hypertension in the guidelines are based upon the normative distribution of blood pressure
(BP) in healthy children rather than clinical outcome data as in adults The guidelines
classified BP as normal prehypertensive or hypertensive Hypertension is graded into stage
one and two8
Normal BP - Blood pressure lt90th percentile for age sex and height Children and
adolescents with normal BP should be followed annually from the age of 3 years5 They
27
should be encouraged to maintain a healthy life style such as good dietary intake physical
activities and adequate rest8
Pre-hypertension - Blood pressure between the 90th and lt 95th or if BP exceeds
12080mmHg (even if lt90th percentile) but lt95th It was previously called high normal
BP This new description was introduced to help identify children at risk for the
development of persistent hypertension for whom targeted prevention programmes would
be most beneficial96 While recommendations for the diagnosis of hypertension in
children require that BP remains elevated on three separate occasions repeated
measurements are not necessary to classify an adolescent as pre-hypertensive11 The
prevalence of childhoodadolescence pre-hypertension in US is reported to be between
12-1796-98 In Nigeria Ejeke Ugwu and Ezeanyika99 in a study of the prevalence of
point prehypertension and hypertension in 843 adolescents in Lokoja reported a
prevalence of point prehypertension of 222 and 250 in semi urban and urban
communities respectively Ujunwa Ikefuna and Nwokocha et al100 reported 175
prehypertension prevalence among adolescents in Enugu Among adults with pre-
hypertension it is reported that as much as 10 per year develop hypertension101 There
is little information on the time course for children and adolescents with prehypertension
developing hypertension A value of between 11-7 per year has been reported in US
adolescents98 There is no known study on rate of progression of prehypertension to
hypertension in Nigerian adolescents The NHBPEP recommended that children with
pre-hypertension should have their BP checked after every six (6) months to monitor for
progression to hypertension They should be encouraged to engage in physical activity
healthy dietary behaviours and weight management if overweight Pharmacologic therapy
is not indicated except if there is strong evidence of renal disease heart failure left
ventricular hypertrophy or diabetes mellitus8
28
Hypertension Hypertension is BP persistently equal to or above the 95th percentile for
age sex and height measured on three or more separate occasions If the blood pressure
measurement obtained is gt 95th percentile the degree of hypertension should be staged
Stage 1 hypertension- BP value between the 95th and the 99th percentile plus 5mmHg It
is recommended that BP should be rechecked in 1ndash2 wks or sooner if the patient is
symptomatic If persistently elevated on 2 additional occasions it should be evaluated or
referred to source of care for pharmacologic treatment within 1 month 8
Stage 2 hypertension- BP value gt99th percentile plus 5mmHg This stage calls for more
prompt evaluation and commencement of pharmacologic therapy102 It is recommended
that the individual be evaluated or referred to source of care within 1wk or immediately if
the patient is symptomatic8
Aetiology of hypertension
Hypertension is classified as primary (essential) when there is no identifiable cause
or secondary if due to an underlying disease31 Factors such as heredity diet stress drugs and
obesity play a role in the development of essential hypertension103104 Causes of secondary
hypertension include umbilical artery catheterization renal diseases coarctation of the aorta
and endocrine disorders105106 Aderele and Sereki6 in their study of hypertension in children
reported hypertension secondary to renal pathology as the commonest cause of elevated BP
in children This study was mainly in preadolescent population in which secondary
hypertension is a common finding On the other hand Antia-Obong and Antia-Obong107
reported no apparent cause in greater than 90 of the studied subjects with elevated BP and
also reported proteinuria of 1 in the same population without any associated elevated blood
pressure The study did not however evaluate the etiology of the proteinuria A study65 of BP
in teenagers in Kano found family history of hypertension a risk factor in the study
population Another study in Enugu100 examined modifiable risk factors associated with
29
hypertension in 2694 adolescents and found only 1 and 06 of the hypertensive subjects
to be overweight and obese respectively The authors also found that smoking and alcohol
consumption were not significant risk for hypertension This may however be due to the
shorter period of consumption of these products by the students as a cumulative effect from
long term consumption is known to be associated with adverse health outcomes
Prevalence of hypertension in adolescents
The prevalence of hypertension in adolescents varies widely due to arbitrary and imprecise
definition by different researchers It was in view of this that the National High Blood
Pressure Education Program Working Group (NHBPEPWG) of the United States established
guidelines for the definition of normal and elevated blood pressures in children and
adolescents for uniformity68 In the USA the prevalence is about 20 in normal weight and
50 in their obese counterparts108 A prevalence rate of 77109 10554 and 223110 has
been reported in Spain Lebanon and South Africa respectively In Kano Nigeria a study65
on the prevalence of hypertension among 1000 teenagers found a prevalence of 72 Similar
study in Enugu100 on the prevalence of hypertension among 2694 secondary school
adolescents reported a hypertension prevalence of 54 It is of interest to note that different
prevalence was reported because of the different methodology used by the authors While the
study in Kano65 applied the adult blood pressure criterion of BP greater than 14090mmHg as
hypertension the study in Enugu100 used blood pressure greater than 95th percentile for age
and sex Also the study in Kano65 took a single set of measurement while the study100 in
Enugu measured blood pressure of the subject three times at weekly intervals Bugaje
Yakubu and Ogala21 on the other hand defined hypertension as blood pressure greater than
two standard deviations from the mean and also took six readings over thirty minutes and got
a prevalence of hypertension of 34 A prevalence rate of 48107 and 9522 in Southern
and Western region of the Nigeria respectively was also reported It is obvious that because
30
of the various defining criteria for hypertension in adolescents the prevalence of adolescent
hypertension remains imprecise
Clinical presentation- Hypertension is usually asymptomatic unless it has been
sustained or is rising rapidly109 Adolescents with essential hypertension are usually
detected during routine evaluation96 Non-specific symptoms such as lethargy headache
dizziness drowsiness visual disturbance and confusion may be present109 These could
also be signs of complications111 Secondary hypertension may show obvious features of
the underlying disease such as growth failure heat intolerance abdominal stria tremors
body swelling and haematuria8102 Croix and Feig112 studied the spectrum of symptoms in
409 children aged 7-18 years newly diagnosed hypertensive in Texas USA and reported
15 common symptoms than in the controls The symptoms were said to resolve after
commencement of antihypertensive medications The authors concluded that hypertensive
children had a variety of non-specific symptoms The three most common symptoms
reported were headache daytime tiredness and difficulty initiating sleep The study
however did not specify if other possible causes of these symptoms were excluded
Complications of hypertension - Hypertension is usually asymptomatic in adolescents
which if left unidentified overtime can cause serious complications109 Organs commonly
affected in the complication of hypertension are the heart kidneys brain and the eyes
leading to lowered life expectancy and premature death13 Left ventricular hypertrophy
(LVH) is the most prominent clinical evidence of end organ damage10 Studies have
shown that LVH can be seen in as many as 41 of patients even in adolescents with
asymptomatic hypertension10103 Adolescents with severe cases of hypertension are also
at increased risk of developing hypertensive encephalopathy seizures cerebrovascular
accidents and congestive heart failure103109 However data documenting such
complications in children and adolescents are generally lacking In a study of
31
hypertension among teenagers in Kano the researchers65 could not find any
complications in all the 1000 teenagers studied
Investigations and treatment- Basic investigations are all that may be required in
adolescents who are obese and with a family history of hypertension stage 1 disease and
normal findings on physical examination113 This is because primary hypertension is
commoner in adolescents Adolescents that are symptomatic or with stage 2 hypertension or
have features of secondary hypertension should be evaluated in more detail
Treatment of hypertension includes non-pharmacological and pharmacological
methods Non-pharmacologic management involves life style modification such as weight
reduction increased physical activities and dietary adjustment114 In a study to evaluate the
effect of diet and salt on treatment and prevention of hypertension Sacks Svetkey and
Vollmer et al86 reported the beneficial effect of both reduced salt intake and appropriate
dietary adjustment in the control of hypertension Similar benefits were reported in other
studies8788 Although both studies had fairly good sample size (n=412) the studies did not
specify if participants were on other substances or activities other than antihypertensive that
might have affected their BP The studies were also in adults and whether it has the same
effects in children and adolescents has not been evaluation However there is no doubt that
the outcome will be similar in adolescents as dietary modifications have been advocated as
non-pharmacologic management in them Non pharmacologic treatment is usually the initial
treatment in essential hypertension and as adjuvant to drug therapy in those with secondary or
complicated hypertension101114 Pharmacologic (drug) treatment includes diuretics beta-
blockers calcium channel blockers angiotensin converting enzyme inhibitors (ACEIs) and
angiotensin receptor blockers (ARB) among others106114 They are used in those with
symptomatic disease and in acute or chronic complications106
32
Prevention of hypertension may be viewed as part of the prevention of cardiovascular
disease102 In adolescents approaches to prevention include reduction in obesity
discouraging cigarette smoking and alcohol intake113 reduction in sodium intake and increase
in physical activity through community and school-based programmes103104 Growth
monitoring BP check during preventive care visit physical activity and urine screening for
proteinuria and haematuria can be used starting from early childhood
33
AIM AND OBJECTIVES
GENERAL AIM
To determine the blood pressure pattern of apparently healthy secondary school adolescents
in Jalingo Taraba State
SPECIFIC OBJECTIVES
To determine
1 Blood pressure pattern in relation to age and sex among adolescents aged 10-19
years
2 The relationship if any between blood pressure and the anthropometric parameters of
weight height BMI and waist circumference
3 The association between blood pressure and parental social-economic status
4 The point prevalence of prehypertension and hypertension in adolescents
34
MATERIALS AND METHODS
Study area
A cross-sectional survey of the blood pressure pattern of apparently healthy secondary
school adolescents aged 10-19 years was conducted in Jalingo over a six month period
from January to June 2014 Jalingo is the capital of Taraba State and lies within the
savannah belt of North Eastern Nigeria It lies between latitude 80 54rsquo north and longitude
110 21rsquo east and at an altitude of 360 meters above sea level115 Jalingo had a population of
118198 people18 The primary inhabitants are the Konas Mumuyes and Fulanis who are
mostly farmers Other indigenous ethnic groups include the Jukun Kuteb WurkumTiv
and host of other tribes The Ibos Hausas Yorubas among others are the non-indigenous
ethnic groups and are mostly civil servants and businessmen Jalingo has a tertiary health
centre the Federal Medical Centre Jalingo and the state specialist hospital It also has 15
private clinicshospital and many primary health care centres There are also tertiary
education institutions including Taraba State University As at 2013 there were 56
secondary schools in Jalingo 24 public and 32 private all of which were mixed schools
except one which is a girlsrsquo only school
Study design
The study was a cross sectional descriptive study of 1350 apparently healthy secondary
school adolescents in Jalingo
Ethical approval
Ethical approval for this study was obtained from the Scientific and Health Ethics Research
Committee of Ahmadu Bello University Teaching Hospital Zaria (Appendix 4) The Taraba
State Ministry of Education also gave the approval and permission to conduct the study in the
35
selected schools Consent was given by the studentsrsquo parents or guardian (Appendix 2) All
students whose parents gave consent voluntarily participated in the study
Sample size determination
The minimum sample size was calculated using the formula116
N=Z2 (pq) E2
Where N = minimum sample size
p = Prevalence of hypertension in adolescents A prevalence of 3421 was used
q = 1- p
E = margin of error tolerated =1
Z = 196 at 95 confidence level
N = 1962 x 0034 x (1-0034) 0012 = 1262
Therefore the minimum sample size was one thousand two hundred and sixty two
Allowance for non-responders of 5 63 extra subjects were added to the calculated
minimum sample size bringing the total to 1325 students To enhance representativeness of
the sample and to compensate for missing information and poorly filled proforma while
maintaining the sample size a total of 1350 was decided upon
Inclusion criteria
1 Students (ages 10-19 years) in the selected secondary schools
2 Students whose parents gave consent to participate in the study
3 Students who gave assent to participate in the study
Exclusion criteria
1 Students who had obvious skeletal deformities of the spine and legs which can affect
the height and ultimately the BMI
36
2 Students with known chronic disease (or history of such disease) like anaemia
chronic renal disease and cardiac disease because they are not apparently healthy and
these conditions could affect their blood pressure
3 Students with present or past history of chronic drug ingestion that can affect blood
pressure such as steriods and contraceptives
4 Students with high blood pressure already on antihypertensive
Pilot study
A pilot study was carried out in one of the schools a week before the commencement of
the study The school was selected by random sampling method using balloting and did
not participate in the main study The pilot study was carried out with the aim of
assessing the competence of the research assistants in the various measurements
following their training to ensure reliability It was also used to test the questionnaire
before its use during the main study and to provide information on the number of students
that can be measured in a day Consequently twenty students had their blood pressure
and anthropometry measured independently by the researcher and the research assistants
and data were compared using Students t-test There were no statistically significant
differences between the measurements The result of the pilot study is highlighted in
Table I It was also found that some parts of the questionnaire were not well understood
by most students and were adjusted appropriately in the main study (Appendix 1) The 20
students had their measurements done over a period of 3-4 hours (between 8am - 12noon)
by the researcher and the research assistants
Table I Result of pilot study
Variables Researcher Research t p
37
assistants
Mean(plusmnSD) SBP
mmHg
106(11) 104(12) 0550 0586
Mean(plusmnSD) DBP
mmHg
617(83) 63(10) 0450 0657
Mean(plusmnSD) Weight
kg
544(82) 527(122) 0520 0608
Mean(plusmnSD) Height m 16(01) 16(01) 0000 1000
Mean(plusmnSD) BMI
kgm2
198(36) 202(33) 0370 0716
Mean(plusmnSD) WC cm 692(72) 682(133) 0300 0769
Sampling method
Students were selected by multistage random sampling technique The list of secondary
schools obtained from the Taraba State Post Primary Schools Board served as the sampling
frame for schools There were 56 secondary schools 24 of which were public and 32 were
private schools a ratio of 113 Ten (10) schools were randomly selected by balloting four
(4) from public schools six (6) from private based on the number and approximately similar
ratio of private to public schools of 115 (46) Ten schools were selected to ensure wider
coverage and even distribution of students so that it could be truly representative of the
community All the ten schools had an overall total of eight thousand one hundred and seven
(8107) students The public schools had a total of five thousand nine hundred and forty
(5940) with nine hundred and eighty nine (989) students participating The private schools
had a total of two thousand one hundred and sixty-seven (2167) students with three hundred
and sixty one (361) participating These number (989 and 361) was calculated based on the
38
relative population of each school and proportionate to number of students in each school
Thereafter the number of students to participate per school was calculated proportionately to
the number of students in each school based on the number given by the school authority
Then the number in each class was also calculated proportionately from JSS1 to SS3 to
ensure fair and equal chance of participation for all age groups The calculation was done
thus n= a b x c
Where n= number of students per selected school
a= total numberpopulation of students in the school
b= total numberpopulation of students in all 10 selected schools (8107)
c= calculated total sample size (1350)
Students in each class from junior secondary school (JSS) 1-3 and senior secondary school
(SS) 1-3 were then randomly selected by balloting The number of selected schools total
number of students in a school and the number of students selected per school is outlined in
Table II
Table II Selected schools and number of students in each of the ten schools in Jalingo
Selected schools Total no of No of students
39
student in the
school (a)
n=8107
selected (n=abxc)
n=1350
Public schools
Govt Science Secondary School 2800 466
Govt Day Secondary School SGari 1200 200
Salisu Dogo Secondary School 1100 183
Govt Secondary School Magami 840 140
Total 5940 989
Private schools
Winners Comprehensive Secondary School 650 108
Hawai Secondary School 562 94
Centre for Quranic Science and Islamic Education 543 90
Good Success Secondary School 155 26
Jetters Academy 140 23
Yagai Academy 117 20
Total 2167 361
The study
The first contact with the students was a familiarization exercise to each of the schools during
which the teachers and students were given a talk by the researcher on blood pressure and the
40
importance of periodic blood pressure measurement They were given the opportunity to ask
questions which were responded to Both the students and their teachers actively participated
in the lectures
On the second day students were selected as described above and those selected
underwent general physical examination in the presence of a chaperon to identify those
who did not fulfilled the inclusion criteria Each selected student was given a proforma
(Appendix 1) in which information on their biodata and medical history were recorded
Other information obtained was parentrsquos medical history and their socioeconomic status
using the format described by Olusanya Okpere and Ezimokhai117 (Appendix 3) The
study was carried out in a relatively quiet and empty classroom to ensure privacy for both
male and female students The procedure for blood pressure measurement was
demonstrated on one of the research assistants and sometimes on one of the teachers by
the researcher to assure the students and allay their anxiety BP and anthropometric values
obtained were recorded in the study proforma An average of 15-20 students per day were
attended to over a period of 3-4 hours (between 8am - 12noon daily) by the researcher
one of the research assistants who is a medical officer a male nurse and a lady Youth
Corper (NYSC)
Blood pressure measurement
This was measured by the researcher and the research assistant (the medical officer) The
standard auscultation method was employed using a mercury sphygmomanometer (Acosson)
and a standard Littman stethoscope according to the guideline of the fourth report on the
diagnosis evaluation and treatment of hypertension in children and adolescents8 Each
students was rest-seated for 5 minutes before BP measurement With the student seated the
right arm rested on a table at the level of the heart an appropriate cuff size which covered
41
two-third (23rd) of the length of the arm was applied round the arm about 2cm above the
antecubital fossa Two cuff sizes were used for this study with dimensions of 10 x 24cm and
13 x 30cm the smaller cuff for the smaller adolescents and vice versa The bladder cuff was
inflated rapidly to 20-30mmHg above the point where the brachial artery was no longer
palpable The bell of the stethoscope was then placed over the brachial artery and the cuff
was deflated slowly at 2-5mmHgsecond while listening to the Korotkoff sounds Phases one
and five of the Korotkoff sounds were recorded as the systolic and diastolic BP
respectively119 Three recordings were taken at intervals of 3-5 minutes and the average was
the final BP in mmHg BP was interpreted based on the standard set by the fourth report on
the diagnosis evaluation and treatment of hypertension in children and adolescents of the
United States8 thus-
Normal BP ndash BP value between the 5th and lt 90th percentile for age sex and height
Prehypertension - BP value between the 90th and the lt95th percentile for age sex and height
or BP of 12080mmHg but less than the 95th percentile
Hypertension ndash BP value ge95th percentile for age sex and height
Students found to have prehypertension were educated and counseled on life style
modifications and the need to have their blood pressure checked in six monthsrsquo time and
annually subsequently Those with hypertension were educated on the implications of the
findings and were referred to the Federal Medical Center Jalingo for evaluation management
and follow-up
Height measurement
Height was measured in centimeters using a locally constructed stadiometer by the research
assistants Each student was measured barefooted standing with the heel back and occiput
42
against the stadiometre The head was held straight looking forward with the lower border of
the eye socket at a horizontal plane with that of the external auditory meatus The movable
part of the stadiometre was adjusted to rest on the vertex and the corresponding value read to
the nearest 01cm
Weight measurement
The weight was measured in kilograms by the researcher and the research assistants using a
bathroom scale (HANSON) Students were weighed in their approved school uniform
without caps head ties or cardigan and with their shoes removed The scale was checked
daily for accuracy using standard calibrated weight before and midway through each session
The weight of the student was measured to the nearest 01 kg
Body mass index (BMI)
This was calculated from the measured weight and height of the subject using the
formula118
BMI= Weight (kg) Height (m2)
Waist circumference measurement
WC was measured in centimeters using a measuring tape by the research assistants The
male assistant measured for boys and the lady Youth Corper measured for girls
Measurement was taken with the student standing completely relax and breathing
normally Clothing was pulled up or down and an inelastic measuring tape was placed
around the waist mid-way between the iliac crest and the lowest rib margin The ends of
the tape were pulled together lightly towards each other and the value read to the nearest
01cm117120
43
Data analysis
Data obtained were analyzed using Epi-Info statistical software package version 7 The
results obtained were presented in figures tables graphs and charts as appropriate Individual
mean BP levels were used as dependent variables and other measured variables as
independent variables The means and standard deviations were used to summarize
quantitative variables such as BP weight height waist circumference and BMI The chi-
squared test was used to test the significance of associations between categorical variables
Studentrsquos t-test was used to compare means of any two normally distributed continuous
variables Pearsonrsquos correlation coefficient and regression analysis were used to examine the
strength of association between BP and the anthropometries Probability level of statistical
significance value was set at lt005
RESULTS
General characteristics
A total of 1350 students were enrolled between January and June 2014 to determine their
blood pressure pattern 628 (465) were males and 722 (535) were females with
malefemale ratio of 111 Students enrolled in the study were drawn from both public and
44
private schools The number of students from public schools was 989 (733) while 361
(267) were from private schools as shown in Table II The mean age of the study subjects
was 153plusmn22 years with a range of 10-19 years The age and sex distribution of the students
is illustrated in Table III
Table III Age and sex distribution of 1350 study subjects in Jalingo
Ag
e
Male
n ()
Female
n ()
Total
N()
10 9(14) 13(18) 22 (16)
11 20(32) 31(43) 51(38)
12 36(57) 52(72) 88(65)
13 96(153) 85(118) 181(134)
14 92(146) 115(158) 207(153)
15 92(146) 111(154) 203(151)
16 66(105) 116(161) 182(135)
17 78(125) 91(126) 169(125)
18 79(126) 70(97) 149(110)
19 60(96) 38(53) 98(73)
To
tal
628(100) 722(100) 1350(100)
45
Socio-economic classes (SEC) ndash Most of the students were from the lower social classes
(4 and 5) with population of 650 (415 and 235) students The upper social classes (1 and
2) had the least population with 184 (62 and122) students The middle social class (3) had
516 students The distribution of the study subjects according to individual
socioeconomic class is shown in Figure I
Figure 1 Socioeconomic class distribution of students in Jalingo
Anthropometry
The anthropometric characteristics of the students are displayed in Tables IV V and VI
All the anthropometric parameters showed increasing values with age (Tables V and VI)
There were significant differences in the anthropometric indices of height (p=0000)
weight (p=0010) and body mass index (p=0000) between boys and girls but not
statistically significant for waist circumference (p=0145) as shown in Table IV
Weight ndash The mean weight of the students was 486plusmn109kg with a range of 23-100kg
(Table IV) Girls were heavier than boys up to middle adolescence after which males
46
were heavier than the females (Table V and VI) and this was statistically significant (t= -
256 p=0010)
Table IV Overall mean anthropometric measurements of the study subjects
Anthropometr
y
Male Female Total
n=628 n=722 N=1350 t p
Wt (kg)
Mean(plusmnSD) 4773(115
)
4926(103
)
4855(plusmn109
)
-
25
6
0007
Range 236-848 227-100 23-100
Ht (m)
Mean(plusmnSD) 159(012) 157(008) 158(plusmn010) 35
5
0000
Range 122-185 126-179 122-185
WC (cm)
Mean(plusmnSD) 6524(91) 6595(86) 6562(plusmn89) -
14
6
0145
Range 225-905 215-100 22-100
47
BMI (kgm2)
Mean(plusmnSD) 1825(27) 1947(33) 1891(plusmn31) -
74
1
0000
Range 117-325 114-42 114-42
Statistically significant p values at 005 level of significance Wt=Weight Ht=Height WC=Waist
Circumference BMI=Body Mass Index SD=Standard Deviation
Height- The mean height of the study population was 158plusmn09m and ranged from 122-
185m (Table IV) Girls were taller than boys at early and middle adolescence but these
reversed from 16 years in favour of the boys (Table V and VI) This differences was
statistically significant (t=448 p=0000)
Waist circumference (WC) - The overall mean waist circumference was 6562plusmn89cm and
a range of 225-100cm Girls had higher WC until late adolescence (18 years) when it
reversed but this was not statistically significant (t=-146 p=0145) This is displayed in
Tables IV V and VI
Body Mass Index (BMI) - Overall mean BMI was 189plusmn31 with a range of 114-42
There was a statistically significant difference between girls and boys (t=-741 p=0000)
Tables IV V and VI illustrate this findings
Table V Mean anthropometric measurements of 628 boys
Age No of
studen
ts
Wt(plusmnSD)
Kg
Ht(plusmnSD)
m
WC(plusmnSD)
cm
BMI(plusmnSD)
Kgm2)
48
10 9 349(50) 143(001
)
613(06) 169(01)
11 20 354(25) 143(002
)
617(13) 170(07)
12 36 363(51) 146(002
)
616(14) 167(06)
13 96 379(51) 150(003
)
602(40) 165(08)
14 92 412(50) 154(003
)
623(32) 169(08)
15 92 471(60) 160(003
)
634(39) 178(08)
16 66 525(52) 164(002
)
672(24) 192(09)
17 78 555(51) 167(002
)
680(31) 197(08)
18 79 576(61) 169(002
)
707(18) 200(08)
19 60 590(57) 170(002
)
716(16) 203(07)
Total 628 477(115 16(01) 652(91) 183(27)
49
)
Wt=Weight Ht=Height WC=Waist Circumference BMI=Body Mass Index SD=Standard Deviation
Table VI Mean anthropometric measurements of 722 girls
Age No of
students
Wt(plusmnSD)
Kg
Ht(plusmnSD)
m
WC(plusmnSD)
cm
BMI(plusmnSD)
Kgm2
10 13 313(34) 139(001) 582(05) 156(02)
11 31 361(53) 144(002) 611(12) 170(05)
12 52 403(64) 149(002) 625(21) 178(09)
13 85 458(66) 154(002) 657(22) 188(12)
14 115 478(74) 157(003) 627(48) 187(10)
15 111 508(65) 159(002) 666(34) 199(13)
16 116 521(60) 159(002) 678(28) 201(11)
17 91 541(62) 161(002) 681(28) 203(11)
18 70 556(63) 161(002) 696(21) 211(11)
19 38 540(48) 158(002) 688(14) 208(06)
Total 722 493(103) 16(010) 651(23) 190(09)
Wt=Weight Ht=Height WC=Waist circumference BMI=Body Mass Index SD=Standard Deviation
Blood pressure (BP) measurements
50
Table VII shows mean blood pressure distribution of the study population for all ages
The highest SBP and DBP were 165mmHg and 95mmHg at 18years and 15 years
respectively Table VIII displays mean BP distribution in relation to age and sex The
tables show that both systolic and diastolic blood pressure increased with age This is also
depicted in Figure 2
Table VII Mean and ranges of blood pressure of 1350 subjects
Systolic Blood Pressure
(mmHg)
Diastolic Blood Pressure
(mmHg)
Age
No of
students
Mean(plusmnSD) Range
Mean(plusmnSD) Range
10 22 936(74) 80-107 600(50) 47-70
11 51 992(106) 76-120 629(71) 47-83
12 88 1036(110) 80-140 657(60) 53-82
13 181 1042(108) 80-143 660(74) 48-88
14 207 1070(115) 83-150 675(76) 47-90
15 203 1090(119) 80-150 678(82) 47-95
16 182 1122(124) 80-150 696(80) 50-90
51
17 169 1132(118) 90-153 698(83) 48-93
18 149 1138(121) 90-165 712(88) 50-90
19 98 1131(127) 90-143 726(76) 57-90
Total 1350 1089(125) 76-165 683(82) 47-95
Table VIII Mean blood pressure in relation to age and sex
Mean(plusmnSD) Systolic blood pressure
(mmHg)
Mean(plusmnSD) Diastolic blood
pressure (mmHg)
A
ge
Male
n=628
Female
n=722
t p Male
n=62
8
Fema
le
n=72
2
t p
52
10 954(3
9)
923(6
0)
1
02
03
20
619(
32)
586(
46)
1
36
0
01
91
11 985(5
5)
997(9
2)
0
42
0
06
80
648(
39)
617(
57)
1
56
0
01
26
12 999(8
9)
1062(
117)
2
84
0
00
06
653(
29)
660(
52)
-
0
52
0
06
07
13 1012(
73)
1075(
73)
4
03
4
00
00
649(
43)
672(
59)
-
0
03
0
00
44
14 1036(
78)
1098(
78)
3
93
0
00
01
653(
44)
693(
58)
3
90
0
00
01
15 1071(
80)
1105(
87)
2
05
0
00
42
665(
58)
689(
56)
-
2
10
0
00
37
16 1135(
82)
1114(
91)
1
03
0
03
10
697(
51)
695(
61)
0
15
0
08
81
53
17 1152(
87)
1115(
77)
2
04
00
43
698(
59)
698(
58)
0
02
0
09
81
18 1141(
96)
1135(
74)
0
27
0
07
91
704(
62)
721(
63)
1
61
0
02
49
19 1146(
97)
1108(
80)
1
41
0
01
64
733(
63)
714(
43)
1
21
0
02
28
To
tal
1081(
133)
1095(
117)
-
2
05
4
00
40
678(
81)
687(
82)
-
2
07
7
00
38
Statistically significant p values at 005 levels of significance
54
Figure 2 Blood pressure distribution in relation to age and sex
SBP =Systolic blood pressure DBP=Diastolic blood pressure
Blood pressure and stages of adolescence
Table IX displays mean blood pressure according to stages of adolescence Girls had a
higher mean SBP than boys from early adolescence (t=3754 p=0000) to middle
adolescence (t=-3025 p=0003) and this was statistically significant This dominance was
also demonstrated in the DBP and was statistically significant in middle adolescence (t=-
3517 plt0000) Adolescents from private schools had higher mean SBP (t=-222
plt0027) and mean DBP (t=-461 p=0000) than those from public schools and these
differences were statistically significant
Table IX Mean blood pressure according to sex and stages of adolescence
Mean BP
(mmHg)
Age (years)
Male SBP
Female SBP
Male DBP
Female DBP
55
Stages
of
adolesc
ents
(years)
Mean(plusmnSD) systolic blood pressure
(mmHg)
Mean(plusmnSD) diastolic blood pressure
(mmHg)
Male Female t p Male Fema
le
t p
Early
(10-13)
1000(9
6)
1040(1
18)
37
54
00
00
648(
56)
653(
82)
05
99
05
50
Middle
(14-16)
1075(1
29)
1105(1
13)
-
30
25
00
03
670(
81)
694(
77)
-
35
17
00
00
Late
(17-19)
1140(1
28)
1121(1
11)
21
45
00
33
717(
85)
710(
83)
00
70
09
45
1082(1
33)
1092(1
17)
-
20
54
00
40
678(
81)
687(
82)
-
20
77
00
38
Statistically significant p values at 005 level of significance SD=Standard Deviation
Table X shows blood pressure pattern according to stages of adolescence
Prehypertension and hypertension were more prevalent in late adolescence than early and
middle adolescence (χ2=49054 p=0000) and (χ2=10305 p=0006) both of which were
statistically significant
Table X The pattern of normal BP Prehypertension and hypertension according to stages
of adolescence
56
Blood
pressure
pattern
Stages of adolescence
Early
n()
Middle
n()
Late
n()
Total
N()
χ2 p
Normal 290(84
8)
428(72
3)
275(66
1)
993(73
5)
429
79
000
0
prehypertens
ion
43(12
6)
135(22
8)
120(28
8)
298(22
1)
490
54
000
0
Hypertensio
n
9(26) 29(49) 21(51) 59(44) 103
05
000
6
342(10
0)
592(10
0)
416(10
0)
1350(1
00)
350
93
000
0
Statistically significant p value at 005 level of significance
Relationship between blood pressure and the measured anthropometry
There was a positive correlation between SBP and DBP with age and the anthropometric
variables of weight height waist circumference and BMI (Table XI) SBP showed a
stronger correlation with the anthropometries than the DBP and was stronger for weight
(r=051) and height (r=044) The waist circumference though statistically significant
showed the weakest correlation
Table XI Correlation between blood pressure age (yrs) and anthropometry
Parameters
Systolic Blood Pressure Diastolic Blood Pressure
Correlation
coefficient
p Correlation
coefficient
p
57
Age (yrs) 035 lt0000 030 lt0000
Height (m) 044 lt0000 034 lt0000
Weight (Kg) 051 lt0000 038 lt0000
WC (cm) 040 lt0000 029 lt0000
BMI
(Kgm2)
031 lt0000 023 lt0000
Statistically significant p values at 005 level of significance Wt=Weight Ht=Height WC=Waist
circumference BMI=Body Mass Index
Blood pressure distribution and socio-economic classes
Table XII shows mean blood pressure according to socio-economic class of the subjects
Lower social classes had higher mean SBP (t=1650 p=2850) and DBP (t=0193
p=00058) but these were not statistically significant
Table XII Mean Blood pressure in relation to socioeconomic classes
Blood
pressur
e
Socioeconomic classes
Upper (1 amp
2) n=184
Middle (3)
n=516
Lower (4 amp
5)
n=650
f(anova
)
p
Mean
(SD)
10857(126
)
10866(128
)
11040(109
)
1650 285
0
58
SBP
Mean
(DBP)
6820(83) 6791(83) 6957(76) 0193 005
8
SEC= Socioeconomic class SBP=Systolic Blood Pressure DBP=Diastolic Blood Pressure SD=Standard
Deviation
Table XIII shows blood pressure pattern in relation to socioeconomic classes of the
subjects The percentage of students with prehypertension was higher in the upper social
class ((χ2=3067 p=0216) while the percentage of hypertension were higher in the lower
socioeconomic classes (χ2=1037 p=0568) but these differences were not statistically
significant
Table XIII Blood pressure pattern in relation to socioeconomic status
Blood
pressure
pattern
Socioeconomic classes
Upper
(1 amp 2)
n()
Middle
(3)
n()
Lower
(4 amp 5)
n()
Total
N()
χ2 p
Normal 127(69
)
383(74
2)
483(74
3)
993(73
6)
417
6
012
4
Prehypertens
ion
52(28
3)
108(20
9)
138(21
2)
298(22
1)
306
7
021
6
Hypertension 5(27) 25(48) 29(45) 59(44) 103 056
59
7 8
184(10
0)
516(10
0)
650(10
0)
1350(10
0)
573
0
022
0
Prevalence of Hypertension and Prehypertension
Table XIV shows the prevalence of hypertension in the study population The total
number of students with hypertension was 59 giving an overall prevalence of 44
Thirty four students (25) had systolic hypertension sixteen (12) had diastolic
hypertension and nine students (07) had both systolic and diastolic hypertension
Systolic hypertension was more prevalent in the females and was more at the age of 16
years while diastolic hypertension was higher in males and this also occurred at 16 years
Among those with hypertension 27 and 16 subjects had stage 1 and 2 systolic
hypertension respectively With regard to diastolic hypertension 24 and 1 subjects had
stage 1 and 2 hypertension respectively The gender difference in the prevalence of
hypertension is not statistically significant (χ2=0831 p=0362)
The number of students with pre-hypertension was 298 giving an overall prevalence of
221 Of this 131 were males and 167 are females This is illustrated in Table XIV
Prehypertension is more prevalent in females than males and this was statistically
significant (χ2=4349 p=0037)
60
Table XIV Overall Blood pressure pattern and prevalence of hypertension and
prehypertension of 1350 students in Jalingo
Blood pressure
pattern
Males
n=()
Females
n=()
Total
N()
χ2 p
Normal 471(750) 522(723) 993(735) 2619 0106
Prehypertension 131(209) 167(231) 298(221) 4349 0037
Hypertension 26(41) 33(46) 59(44) 0831 0362
628(100) 722(100) 1350(100) 1260 0533
statistically significant p value at 005 level of significance
61
DISCUSSION
The findings of this study showed that the BP of secondary school adolescents in Jalingo
was similar in terms of mean values range and trend of progression with age to that of
other adolescents from Ibadan63 and Kogi60 (Nigeria) Ashanti (Ghana)59 and Lebanon54
The mean value was however lower than the mean BP of adolescents from Zaria
(Nigeria)21 Belgrade ( Serbia)78 and Fortaleza-Cearaacute (Brazil)83 who had higher mean BP
in both sexes and at all ages The lower mean BP in this study compared to that of
adolescents from Zaria21 Belgrade78 and Brazil83 could be due to lower mean
anthropometry of weight height and BMI in adolescents from Jalingo resulting in lower
mean BP The sample sizes of these studies7883 were also different and could have
affected the mean BP of the study population For instance the sample size in the
Brazilian study83 is 151 compared to the study in Lebanon54 with 5710 subjects The use
of the fifth Korotkoff sounds as DBP in this study21 could also have accounted for the
lower mean BP in contrast to a similar study in Zaria21 where the fourth Korotkoff sound
was used as the DBP
A progressive increase in blood pressure with age was found in this study This
was similar to most findings by researchers in Nigeria 215358-606566107 and
worldwide54555961 The peak age of rise in BP in this study was in middle adolescence
between 15-16 years in boys but much earlier in girls for both systolic and diastolic BP
This was similar to the study by Akinkugbe Akinwolere and Kayode56 in Ibadan and
Ejeke Ugwu and Ezeanyika et al60 in Lokoja This age group is usually the period of
onset of puberty The chronologic age is not the main factor responsible for BP increase
62
with age but rather the progressive increase in size of the individual Increase in body
size with growth and maturity of organs associated with the physical and hormonal
changes during puberty potentially lead to increasing BP The simultaneous increase in
weight height and other anthropometric indices alongside BP with age seen in this study
and others is in agreement with that The implication of this increase in blood pressure
with age is that those with prehypertensionhypertension in childhood may continue into
adulthood hence further increasing the high prevalence of hypertension in the adult
population with its attendant morbidity disability and mortality
Overall significant higher mean BP was recorded in girls than boys in this study
This was seen from early to middle adolescence after which it reversed in favour of the
boys Reports on the relationship between BP and sex have been inconsistent Some have
reported higher mean BP in females54-56 others higher in males5883 while yet another
reported no sex differences22 The findings of this study were similar to those of Bugaje
Yakubu and Ogala21 and Ujunwa Ikefuna and Nwokocha100 who reported a consistently
higher mean blood pressure in female adolescents up to 16 years compared to their male
counterparts of similar ages Early female predominance in mean blood pressure was also
reports by Agyemang Redekop and Owusu-Dabo et al59 in Ashanti adolescents in Ghana
and Obika Adedoyin and Olowoyeye22 in Illorin The finding was however in contrast
with the study in Calabar58 where higher mean BP was found in boys than girls at all
ages The reason for the higher mean BP in females than boys could be because of earlier
onset of puberty in girls The differences in blood pressure between boys and girls in this
study could also be accounted for by variation in the anthropometric variables of the
individuals as girls were seen to be heavier and taller up to middle adolescence
This study demonstrated a consistently positive relationship between blood
pressure and the anthropometric variables of weight height body mass index and waist
63
circumference as widely reported in other studies 545558-6165107100 Weight is reported to
correlate positively with blood pressure in several studies53565871 Body mass index
(BMI) also showed a positive relation with BP in this study as reported in other
studies5978-81 This is in-keeping with the findings in Port Hacourt71 Abeokuta83 the
Gambia69 Brazil82 and Belgrade77 children Some of these studies however were made
up of younger and older age groups Even in lean populations BMI is known to correlate
positively with BP Waist circumference was also found in this study to correlate
positively with BP This was similar to reports from other studies79-8183 It was found to
be a better predictor of BP in two Italian study8081 while it was not in another82
Comparing BMI and waist circumference and their effects on BP Arauzo Lopes and
Moriera et al82 in Brazilian children found BMI to be a better predictor of BP than waist
circumference This was similar to the report by Sebanjo and Oshikoya83 in Nigerian
adolescents in Akure Guagnano Ballone and Colagrande et al81 however found waist
circumference to be better than BMI The study81 however involved adults and may not
be applicable in children and adolescents The present study demonstrated BMI and WC
to be significant but found BMI to be a better determinant of BP than waist
circumference BMI and waist circumference measure obesity in an individual Whereas
BMI is a measure of overall obesity WC measures centralabdominal fat accumulation
and thus said to be more predictive of adverse health risk79 Obese individuals may be
prone to such condition as dyslipidaemia insulin resistance and hypertension with
reduction in the quality of life Weight BMI and or waist circumference affects blood
pressure through decreased physical activity increased cardiac output insulin resistance
impaired pulmonary function and other hormonal abnormalities8084 It seems therefore
that BMI is a better predictor of BP in adolescents than waist circumference The reason
64
for this is not obvious but it may be because of the nature of uniform fat distribution in
adolescents associated with growth and hormonal changes at puberty
Blood pressure distribution in relation to the parental socio-economic class in this
study showed that students from low socio-economic classes had higher mean blood
pressure than those from upper socioeconomic classes but this was not statistically
significant A study in Ibadanl56 reported a statistically significant negative relation
between blood pressure and parental socio-economic status It was also similar to the
study58 in Calabar In contrast other studies found the reverse536022 The reasons for the
inverse relationship between BP and socioeconomic includes exposure to chronic
environmental stress with sustained sympathetic nervous system stimulation Others are
poor health seeking behaviours due to low income andor inadequate health knowledge
high low birth weight rate and inadequate healthy diets among others97101 In the same
environment individuals from a high social class are believed to be more educated with
high income61 They have easy access to health education and awareness on hypertension
prevention and control and better accessibility and adherence to medical treatment617374
The former might be responsible for the finding of this study as Jalingo is a semi urban
community Most of its inhabitants are subsistent farmers civil servants and traders with
low income The high number of students in the lower socioeconomic class lays credence
to that
The overall point prevalence of hypertension in this study was 44 while that of
pre-hypertension was 221 This prevalence of hypertension is similar to the prevalence
of 48 by Antia-Obong and Antia-Obong107 but higher than the prevalence rate of 37
reported in Zaria21 and lower than the prevalence of 58 reported in Ibadan56 54 in
Enugu100 and the 72 reported in Kano65 The prevalence of pre-hypertension was lower
than that reported by Ejeke Ugwu and Ezeanyika99 who found a prehypertensive
65
prevalence of 25 among adolescents in Lokoja It is higher than the 173 reported by
Ujunwa Ikefuna and Nwokocha et al100 in Enugu and 12-17 by Redwine and
Daniels96 among US adolescents The differences in the reported prevalence of
hypertension and prehypertension in adolescents could have resulted from the different
criteria applied by the various researchers in defining hypertension For instance whereas
this study used BP greater than 95th percentile as hypertension a study in Kano65 used the
adult hypertensive value of BPgt14090mmHg as hypertension and got a prevalence of
72 The prevalence in that study65 could have been higher if the percentile or the
statistical definition was used as many children with BP 14090mmHg would probably be
at stage 2 hypertension This was demonstrated in the study by Bugaje Yakubu and
Ogala21 who found a prevalence of hypertension in their study to be 06 when the adult
cut off value of gt14090mmHg was used but it increased to 37 when the statistical
definition of BPgt 2 standard deviations was used
The number of times blood pressure is taken could affect the outcome as repeated
measurements over a time interval is known to give lower BP values than if BP is taken
once This study used the average of three blood pressure values taken at one sitting but
Ujunwa Ekefuna and Nwokocha100 took three readings at five minutes interval with two
other readings at a week interval In that study100 the prevalence of prehypertension
dropped from 745 during the first set of readings to 173 after the third week
readings The prevalence of hypertension also dropped from 135 to 54 over the same
period Similar decrease in the prevalence of both prehypertension and hypertension was
reported by Redwine and Daniels96 in US adolescents when blood pressure was taken
over time interval Another factor which might have affected the overall prevalence is the
Korotkoff sound used for diastolic pressure23 The 4th or 5th Korotkoff sounds has been
used by different researchers resulting in different diastolic BP The study21 in Zaria used
66
the 4th Korotkoff sound while most other researchers2265100 used the 5th About 5-
10mmHg difference is said to exist between the 4th and 5th Korotkoff sounds230 In this
study the 5th Korotkoff sound was used thus giving a higher prevalence of hypertension
in the studied population than in those where the 4th sound was used
The implication of the outcome of this study is that 44 of adolescents in Jalingo
are already hypertensive while 221 of them are at risk of developing hypertension as
they are pre-hypertensive Since 856 (255 of 298) of the prehypertensives were in the
middle and late adolescence these individuals are likely to be adults with high blood
pressure Therefore regular screening of this group of individuals who were assumed to
be a healthy population is highly important for early detection of hypertension and
intervention such as life style changes and treatment
67
CONCLUSIONS
The following conclusions can be made from this study
1 The mean and range of blood pressure of adolescents in Jalingo was similar to
those of other adolescents in Nigeria and other parts of the world Blood pressure
increased progressively with age
2 All measured anthropometry of weight height body mass index and waist
circumference correlated positively with BP but weight was the most significant
variable in BP determination
3 Socioeconomic status was not significantly related with blood pressure
4 The point prevalence of hypertension and pre-hypertension was 44 and 221
respectively using a recommended definition
RECOMMENDATIONS
1 In view of the high prevalence of prehypertension in this study it is recommended
that students should have their blood pressure measured at school entry as this will
68
help identify those with abnormal BP for early intervention Thereafter BP check
should be offered at least once a year at the beginning of a new session especially for
those found with abnormal BP at school entry
2 Physical and health education should be revived in all the schools This will lead to
increased physical activity and reduced risk of obesity and its consequences
3 School health programmes should be strengthened in schools where it already exist
and effort made to establish same in schools where it is yet to exist The programme
should include measures to detect early prehypertension and hypertension and other
health related needs of the students
LIMITATIONS
The following limitations were encountered in the course of the study
1 Exclusion and inclusion of students that were based on volunteered information and
physical evaluation This could have led to inclusion andor exclusion of adolescentss
69
with or without background renal diseases which could have affected the result of this
study
2 Home blood pressure measurement especially early morning measurement for those
with high blood pressure to possibly eliminate the effect of stress traffic andor
trekking and other school related stresses which may affect blood pressure during the
day
LINES OF FUTURE RESEARCH
This study was questionnaire based and time bound Consequently students were not
investigated for background diseases co-mordid conditions target organ damage or risk
factors for high blood pressure They were also not followed up In view of this future
research on blood pressure in adolescents should include-
70
1 Investigations such as urinalysis electrolytes urea and creatinine random blood
sugar (RBS) lipid profile and echocardiography as part of blood pressure evaluation
in adolescents
2 A long period of study to allow for follow-up over months or years to identify those
that are truly hypertensive considering the definition of hypertension It will also
reveal the rate of progression from pre-hypertension to hypertension
3 Risk factors evaluation for high blood pressure including genetic predispositions
REFERENCES
1 Blood pressure from Wikipedia the free Error Hyperlink reference not valid
Accessed 24th November 2011
2 Pickering TG Hall JE Appel LJ Falkner BE Graves J Hill MN Jones DW Kurtz T
Sheps SG Roccella EJ Recommendations for blood pressure measurement in humans
and experimental animals Part 1 Blood pressure measurement in humans A
statement for professionals from the subcommittee of professional and public
71
education of the American Heart Association council on high blood pressure research
Hypertension 2005 45 142-61
3 da Silva IRR de Souza MDG de Camargo CAC Blood pressure measurement in
children and adolescents Guidelines of high blood pressure recommendations and
current clinical practice Arq Bras Cardiol 2007 88 434-7
4 Sinaiko AR Hypertension in children N Engl J Med 1996 3351968-73
5 US Preventive Services Task Force Screening for high blood pressure
recommendations and rationale Am J Prev Med 2003 25 159-64
6 Report of the second task force on blood pressure control in children Pediatrics 1987
79 1-25
7 National high blood pressure education programme working group on hypertension
control in children and adolescents update on the 1987 task force report on high blood
pressure in children and adolescents A working group report from the national high
blood pressure education program Pediatrics 1996 98 649-58
8 National high blood pressure education program working group on high blood
pressure in children and adolescents The fourth report on the diagnosis evaluation
and treatment of high blood pressure in children and adolescents Pediatrics 2004
114 255-76
9 Aderele WI Seriki O Hypertension in Nigerian children Arch Dis Child 1974
49313-7
10 Bo S Gambino R Gentile L Pagano G Rosato R Saracco GM Cassader M
Durazzo M Cavallo-Perin P High-normal blood pressure is associated with a cluster
of cardiovascular and metabolic risk factors a population based study J Hypertens
2009 27 102-8
72
11 Bao W Threefoot SA Srinivasan SR Berenson GS Essential hypertension
predicted by tracking of elevated blood pressure from childhood to adulthood The
Bogalusa Heart Study Am J Hypertens 1995 8 657- 65
12 Richard A Rodgers M Hedley AJ Mitchel JRA Changes in blood pressure and
blood lipid during adolescence BMJ 1980 28 1563-6
13 Sundstroumlm J Neovius M Tynelius P Rasmussen F Association of blood pressure in
late adolescence with subsequent mortality cohort study of Swedish male conscripts
BMJ 2011 342 643-8
14 Zimmet P Alberti G Kaufman F Tajima N Silink M Arslanian S Wong S Bennett
P Shaw J Caprio S On behalf of the International Diabetes Federation Task Force on
Epidemiology and Prevention of Diabetes The metabolic syndrome in children and
adolescents the IDF consensus Diabetic Voice 20075229-32
15 Abdulrahman FA Babaoye AA Childhood hypertension in northern Nigeria West
Afr J Med 1978 1 7-11
16 Adediran O Jimoh A Di M Relationship between body mass index and blood
pressure in rural Nigerian dwellers Internet J Nutri Wellness 2009 7 431-4
17 World Health Organization (WHO)UNICEF Adolescence at a glance 2003 p 2
18 The National Population Commission constitution of the Federal Republic of Nigeria
(AP 23 LFN) legal notice on publication issued April 21st 2007
19 Heald FP and Gong EJ Diet Nutrition and adolescents In Shils ME and Ross AC
(eds) Modern Nutrition in Health and Disease 9th ed William and Wilkins
Maryland USA 1999 p 32
20 Okonkon CT The prevalence of Hypertension among civil servants in Calabar Nig
Med J 1979 7422-5
21 Bugaje MA Yakubu AM Ogala WN Prevalence of adolescent hypertension in Zaria
Nig J Paediatr 2005 32 77-82
73
22 Obika LF Adedoyin MA Olowoyeye JO Pattern of paediatric blood pressure in
rural semi urban and urban communities in Ilorin Nigeria Afri J Med Sci 1995 24
371-7
23 Jeremy B A short history of blood pressure measurement section of the history of
medicine Proc Roy Soc Med 1977 70 793-9
24 Lewis O Stephen Hales and the measurement of blood pressure J Hum Hypertens
1994 8 865-71
25 Crile GW Blood Pressure in Surgery An experimental and Clinical Research
Philadelphia Lippincott 1903 p 358
26 Lewis WH The evolution of clinical sphygmomanometer Bull N Y Acad Med 1941
17 871-81
27 Browne WC OrsquoBrien ET Semple PF The sphygmomanometer of Riva Roci 1896-
1996 J Hum Hypertens 1994 610 723-4
28 Segal HN How Korotkoff the Surgeon discovered the auscultatory method of
measuring arterial pressure Ann Intern Med1975 83 561-2
29 Goodman FH and Howell AA Clinical studies in the auscultatory method of
determining blood pressure University of Pennsylvania Bulletin 1911 23 469-75
30 Crenner CW Introduction of the blood pressure cuff into US medical practice
technology and skilled practice Ann Intern Med 1998 128 488-493
31 Ganon WF Circulation In Review of Medical Physiol Lange Medical Publication
New York 22nd edition 2005 p 234-63
32 Beth C Homeostatic Regulation of Blood pressure Available from
URLhttpwwweHowcom Accessed on 1st December 2011
33 Rajinder KG Fahim M Regulation of cardiovascular functions during acute blood
loss Indian J Physiol Pharmacol 2005 49 213ndash9
74
34 Dampney AL Coleman MJ Fonts MAP Hirooka Y Horiuchi J Polson JW Potts
PD Tagawa T Central mechanisms underlying short-term and long-term regulation
of the cardiovascular system Proc Austr Physio Pharmacosociety 2001 32 333-44
35 Koshiya N Guyenet PG Noradrenergic neurons and the carotid sympathetic
chemoreflex Am J Physiol 1994 267 519-26
36 Prakash ES The ultimate goal in neural regulation of cardiovascular function Adv
Phyiol Educ 2008 32 107-8
37 Allen AM Inhibition of the hypothalamic paraventricular nucleus reduces
sympathetic nerve discharge and blood pressure Proc Austr Neuroscience Society
2001 29 44-7
38 Reid IA Interactions between ANG II sympathetic nervous system and
baroreceptor reflexes in regulation of blood pressure Am J Physiol 1992 262 763-
78
39 Brooks VL Osborn JW Hormonal-sympathetic interactions in long-term
regulation of arterial pressure A hypothesis Am J Physiol 1995 268 1343-58
40 Reckelhoff JF Gender Differences in the Regulation of Blood Pressure
Hypertension 2001 37 1199-208
41 Fink GD The systemic circulation as a regulated free-market economy A new
approach for understanding the long-term control of blood pressure Clin Exp
Pharmacol Physiol 2005 32 377ndash83
42 Benard K Sources of error in blood pressure measurement Hospital Physician 2002
12 33-7 Available from URLhttp wwwturnerwhitecom
43 Chyun DA A comparism of intra arterial and auscultatory blood pressure readings
Heart lung 1985 14 223-31
75
44 Nwankwo MU Lorenz JM Gardiner JC A Standard Protocol for Blood Pressure
Measurement in the Newborn Pediatrics 1997 99 1342-9
45 Deakin CD Low JL Accuracy of the advanced trauma life support guidelines for
predicting systolic blood pressure using carotid femoral and radial pulses
observational study BMJ 2000 321 673ndash4
46 OrsquoBrian E Replacing mercury sphygmomanometers require clinician to demand
better automated device BMJ 2000 320 815-6
47 McKay DW Raju MK Campbell NR Assessment of blood pressure measuring
techniques Med Educ 1992 26 208ndash12
48 Baker RH Ende J Confounders of auscultatory blood pressure measurement J Gen
Intern Med 1995 10 223ndash31
49 Neufeld PD Johnson DL Observer error in blood pressure measurement CMAJ
1986 135 633ndash7
50 van Montfrans GA Oscillometric blood pressure measurement progress and
problems Blood Press Monit 2001 6 287ndash90
51 Ware RW Laenger CJ Indirect blood pressure measurement by Doppler ultrasonic
kinetoartriography Proceedings 20th Annual Conference Engineering Medical
Biology 1967 9 27-30
52 Matthew Fox Blood pressure measurement technique Available from URL http
wwwlivestrongcom Last edited 2nd September 2010 Accessed on 30th November
2011
53 Akor F Okolo SN Okolo AA Blood pressure and anthropometric measurements in
healthy Primary School entrants in Jos Nigeria SAJCH 2010 4 42-5
54 Merhi BM Al-Hajj F Al-Tannir M Zaide F El-Rajab M A survey of blood pressure
in Lebanese children and adolescents North Am J Med Sci 2011 3 24-9
76
55 Al-Salloum AA El-Mouzan AH Al-Herbish AS Al-Umar AA Qurashi MM Blood
pressure standard for Saudi children and adolescents Ann Saudi Med 2009 29 173-8
56 Akinkugbe FM Akinwolere AO Kayode CM Blood Pressure Pattern in
Adolescence West Afri J Med 1999 18 196-202
57 Wanzhu T Eckert GJ Saha C and Pratt JH Synchronization of Adolescent Blood
Pressure and Pubertal Somatic Growth J Clin Endo Metab 2009 94
58 Ansa VO Anah MU Odey FA Mbu PN Agbor EI Relationship between parental
socioeconomic status and casual blood pressure in coastal Nigeria Adolescents West
Afri J Med 2010 29146-52
59 Agyemang C Redekop WK Owusu-Dabo E Bruijnzeels MA Blood pressure
patterns in rural semi-urban and urban children in the Ashanti region of Ghana West
Africa BMC Public Health 2005 5114-21
60 Ejeke CCE Ugwu CE Ezeanyika LUS Olayemi AT Blood pressure patterns in
relation to geographic area of residence a cross-sectional study of adolescents in Kogi
state Nigeria BMC Public Health 2008 8 411-5
61 Colhoun HM Hemminway H Poulter WR Socioeconomic status and blood
pressure an overview analysis J Human Hypertension 1998 12 91-110
62 Badaruddoza KR Familial aggregation and heritability for cardiovascular risk factors
a family based study in Punjab India Natural Science 2010 2 732-6
63 Livshits G Gerber LM Familial factors of blood pressure and adiposity co-variation
Hypertension 2001 37 928-35
64 Fermino RC Seabra A Garganta R Antoacutenio J Maia R Genetic factors in familial
aggregation of blood pressure of Portuguese nuclear families Arq Bras Cardiol 2009
92 463-9
77
65 Mijinyawa MS Iliyasu Z Borodo MM Prevalence of hypertension among teenage
students in Kano Nigeria Nig J Med 2008 17 173-7
66 The Wellcome Trust case control consortium Genome-wide association study of
14000 cases of seven common diseases and 3000 shared controls Nature 2007 447
661-78
67 Levy D Destefano AL Larson MG ODonnell CJ Lifton RP Gavras H Evidence for
a gene influencing blood pressure on chromosome 17 genome scan linkage results for
longitudinal blood pressure phenotypes in subjects from the Framingham heart study
Hypertension 2000 36 477- 83
68 Lifton RP Wilson FH Choate KA Geller DS Salt and blood pressure new insight
from human genetic studies Cold Spring Harb Symp Quant Biol 2002 67 445ndash50
69 van der Sande MA Milligan PJ Nyan OA Rowley JT Banya WA Ceesay SM
Dolmans WM Blood pressure patterns and cardiovascular risk factors in rural and
urban Gambian communities J Hum Hypertens 2000 14 489-96
70 Akinkugbe OO Ojo OA Arterial blood pressure in rural and urban population of
Nigeria BMJ 1969 2 22-4
71 Okagua J Anochie IC Akani NA Adolescent blood pressure in Rivers State Nigeria
A rural-urban comparism NJP 20154221-7
72 Urrutia-Rojas X Egbuchunam CU Bae S Menchaca J Bayona M Rivers PA Singh
KP High blood pressure in school children Prevalence and risk factors BMC
Pediatrics 2006 6 32-9
73 Sorof JM Lai D Turner J Poffenbarger T Potman R Overweight ethnicity and the
prevalence of hypertension in school-aged children Pediatrics 2004 113 475-82
78
74 Rosner B Prineas R Daniels SR Blood pressure differences between blacks and
whites in relation to body size among US children and adolescents Am J Epidemiol
2000 151 1007-18
75 Harding S Whitrow M Lenguerrand E Maynard M Teyhan A Cruickshank JK Der
G Ethnic differences in blood pressure in adolescence the determinants of adolescent
social well-being and health study Hypertension 2010 55 1063-9
76 Cruickshank JK Mzayek F Liu L Kieltyka L Sherwin R Webber LS Srinavasan SR
Berenson GS Origins of the ldquoblackwhiterdquo difference in blood pressure roles of birth
77 Vlajinac H Miljus D Adanja B Marinkoic J ipetic S Kocev N Blood pressure levels
in 7 to 14-year-old Belgrade children J Human Hypertension 2003 17 761ndash5
78 Menezes AMB Hallal PC Dumith SC Adolescent blood pressure body mass index
and skin folds sorting out the effects of early weight and length gains J Epid Comm
Health 2011 12 42-8
79 Karelis AD St-Pierre DH Conus F Rabasa-Lhoret R Poehlman EJ Metabolic and
body composition factors in subgroups of obesity what do we know J Clin Endo
Metab 2004 89 2569-75
80 Katzmarzyk PT Srinivasan ER Chen W Malina RM Bouchard C Berenson GS
Body mass index waist circumference and clustering of cardiovascular disease risk
factors in a biracial sample of children and adolescents Pediatrics 2004 114 198-205
81 Guagnano MT Ballone E Colagrande V Della Vecchia R Manigrasso MR Merlitti
D Riccioni G Sensi S Large waist circumference and risk of hypertension Int J
Obesity 2001 25 1360 ndash 4
82 Araujo TA Lopes MVO Moriera RP Cavalcante TF Gurdes NG MartinS dA Silva
V Blood pressure of children and teenagers from a public school in Fortaleza - Cearaacute
Acta paul enferm 200720103-15
79
83 Sebanjo IO Oshikoya KA Obesity and blood pressure levels of adolescents in
Abeokuta Nigeria Cardiovasc J Afr 2011 221-5
84 Messerli FN Obesity and essential hypertension Haemodynamics sodium excretion
and plasma rennin activity Arch Int Med 1981 141 81-5
85 Appel LJ Brands MW Daniels SR Karanja N Elmer PJ Sacks FM Dietary
Approaches to Prevent and Treat Hypertension A Scientific Statement from the
American Heart Association Hypertension 2006 47 296-308
86 Sacks FM Svetkey LP Vollmer WM Appel LJ Bray GA Harsha D Obarzanek E
Conlin PR Miller ER 3rd Simons-Morton DG Karanja N Lin PH for the DASH-
Sodium Collaborative Research Group Effects on blood pressure of reduced dietary
sodium and the Dietary Approaches to Stop Hypertension (DASH) diet DASH-
Sodium Collaborative Research Group N Engl J Med 2001 344 3ndash10
87 Appel LJ Moore TJ Obarzanek E Vollmer WM Svetkey LP Sacks FM Bray GA
Vogt TM Cutler JA Windhauser MM Lin PH Karanja N A clinical trial of the
effects of dietary patterns on blood pressure DASH Collaborative Research Group N
Engl J Med 1997 3361117ndash24
88 Appel LJ Sacks FM Carey VJ Obarzanek E Swain JF Miller ER 3rd Conlin PR
Erlinger TP Rosner BA Laranjo NM Charleston J McCarron P Bishop LM for the
OmniHeart Collaborative Research Group Effects of protein monounsaturated fat and
carbohydrate intake on blood pressure and serum lipids results of the OmniHeart
randomized trial JAMA 2005 294 2455ndash64
89 Karanja NM Obarzanek E Lin PH McCullough ML Phillips KM Swain JF
Champagne CM Hoben KP Descriptive characteristics of the dietary patterns used in
the Dietary Approaches to Stop Hypertension Trial DASH Collaborative Research
Group J Am Diet Assoc 1999 99 19ndash27
80
90 Nwokocha ARC Adolescence and associated problems In Azubuike JC and
Nkanginieme KEO (eds) Paediatrics and Child Health in a Tropical Region African
Educational Services Owerri Nigeria 2nd edition 2007 p 84-99
91 Rogol RT Roemmich JN Clark PA Growth and puberty J Adol Hlth 2002 31 192-
200
92 Tanner JM Marshal WA Variation in the pattern of puberty changes in boys and girls
Arch Dis Child 1970 45 13-23
93 Nwakoro SO Ifoda K Onochie O Olomu JM Anthropometric assessment of
nutritional status and growth of 10-20 years individuals in Benin City metropolis
Nigeria Pakistan J Nutr 2006 5 117-21
94 Shankar RR Eckert GJ Saha C Tu W Pratt JH The change in blood pressure during
pubertal growth J Clin Endo Metab 2005 90 163-7
95 Department of Health and Human Services 2000 CDC Growth Charts for the United
States methods and development Series Report 11 No 246 Available from URL
httpwwwcdcgovGrowthCharts
96 Redwine KM Daniels SR Prehypertension in Adolescents Risk and Progression
Journ Clin Hypertension 2012 14 360ndash4
97 Falkner B Gidding SS Portman R Rosner B Blood pressure variability and
classification of prehypertension and hypertension in adolescence Pediatrics 2008
122238ndash42
98 Redwine KM Acosta AA Poffenbarger T Development of hypertension in
adolescents with pre-hypertension J Pediatr 2012 16098ndash103
99 Ejike ECCC Ugwu CE and Ezeanyika LUS Variations in the prevalence of point
prehypertension in a Nigerian school-going adolescent population living in a semi-
urban and an urban area BMC Pediatr 2010 1013
81
100 Ujunwa FA Ikefuna AN Nwokocha AR Chinawa JM Hypertension and
prehypertension among adolescents in secondary schools in Enugu South East Nigeria
Italian J Pediatr 20133970-5
101 Chobanian AV Bakris GL Black HR Seventh report of the Joint National
Committee on Prevention Detection Evaluation and Treatment of High Blood
Pressure Hypertension2003 421206ndash52
102 Lande MB Systemic Hypertension In Kliegman RM Behrman RE Jenson HG and
Stanton BF (eds) Nelson Textbook of Pediatrics Saunders Elsevier Philadelphia 19th
Edition 2011 pg 1592-8
103 Luma GB Spiotta RT Hypertension in Children and Adolescent Am Fam Physician
2006 73 1558-68
104 Arvind B Rupesh J Vijayakumar M Madhuri K Ali U Evaluation and management
of hypertension Indian Paediatr 2007 44 103-21
105 Flynn JT Neonatal hypertension Diagnosis and management Pediatr Nephrol 2000
14 332-41
106 Steyn K de Wet T Richter L Cameron N Levitt NS Morrel C Cardiovascular
diseases risk factors in 5-year old urban South African children- The Birth to Ten
Study SAMJ 2000 90 7126
107 Antia-Obong OE Antia-obong LE Arterial blood pressure of Nigerian Urban and
Rural school children Nig J Paediatr 1991 18 3-11
108 Nguyen NT Magno CP Lane KT Hinojosa MW Lane JS Association of
hypertension diabetes dyslipidemia and metabolic syndrome with obesity findings
from the National Health and Nutrition Examination Survey 1999 to 2004 J Am Coll
Surg 2008 207 928-34
82
109 Solar MB Gill A Rey J Epidemiology of arterial blood pressure in school children
population Aten Primaria 1992 9 212-4
110 Steyn K de Wet T Richter L Cameron N Levitt NS Morrel C Cardiovascular
diseases risk factors in 5-year old urban South African children- The Birth to Ten
Study SAMJ 2000 90 7126
111 Linkas J The assessment and management of hypertensive emergencies and
urgencies in children Pediatr Emerg Care 2005 21391-6
112 Croix B Feig DI Childhood hypertension is not a silent disease Pediatr Nephrol
2006 21527-32
113 Flynn JT Anderson MH Characteristics of children with primary hypertension seen
at a referral centre Pediatr Nephrol 2007 44 103-21
114 Nakao M Yano E Nomura S Kuboki T Blood pressure lowering effects of
biofeedback treatment in hypertension a meta-analysis of randomized controlled trials
Hypertension 2003 26 37- 46
115 Jalingo Available from URLhttpwwwencyclopedia Britanica Accessed on 3rd
December 2011
116 Araoye MO Research Methodology with Statistics for Health and Social Sciences
Nathadex Publishers Saw-Mill Ilorin Nigeria 2004 pg 115-21
117 Olusanya O Okpere E Ezimokhai M The importance of social class in voluntary
fertility control in a developing country West Afr J Med 1985 4 205-12
118 World Health Organization expert committee Physical status the use and
interpretation of anthropometry WHO technical report series No 894 Geneva WHO
1995 p 424ndash38
119 Guidelines subcommittee WHOISH guideline for management of hypertension J
Hypertens 1999 17 151-83
83
120 Aubay B How to measure waist circumference Available from
URLhttpwwwehowcom Last updated August 10th 2011 and accessed on December
9th 2011
APPENDICES
Appendix 1
PROFORMA ON BLOOD PRESSURE PATTERN IN APPARENTLY HEALTHY
SECONDARY SCHOOL ADOLESCENTS IN JALINGO
PUBLIC SCHOOL [ ]
Serial No
84
PRIVATE SCHOOL [ ]
A BIODATA
1 Age (years) 10[ ] 11[ ] 12[ ] 13[ ] 14[ ] 15[ ] 16[ ] 17[ ] 18[ ] 19[ ]
2 Gender M [ ] F [ ]
3 Class JSS 1-3 [ ] SS1-3 [ ]
B MEDICAL AND SOCIAL HISTORY Yes [1] No [2]
1 Have you ever passed blood in your urine [ ]
2 Have you ever had your face or legs swollen [ ]
3 Are you on any drug for long time (such as pills steroids marijuana codeine
NSAIDs containing drugs tramal and others) [ ]
If yes specifyhelliphelliphellip
C SOCIO-ECONOMIC CLASSIFICATION
Fatherrsquos occupation
Score 1 Professionals top civil servants politicians and top businessmen
2Middle-level civil servants technicians skilled-artisans and well-to-do
traders
3 Unskilled workers and those in general whose income would be at or below
the national minimum wage
Mothers educational level
Score 0 Education up to University level
1 Secondary or tertiary level below the University
2 No formal education or up to primary level only
D ANTHROPOMETRY
i Weight (Kg) ndash 1helliphellip 2helliphelliphellip Averagehelliphelliphelliphellip
ii Height (m) ndash 1helliphellip 2helliphellip Averagehelliphelliphelliphellip
85
iii Body mass index = weightheight (kgm2)
v Waist circumference (cm) ndash 1helliphellip 2helliphelliphellip Averagehelliphelliphelliphellip
iv Blood Pressure (mmHg) - 1helliphellip 2hellip 3helliphellip Averagehelliphelliphelliphellip
Appendix 2
AUTHORIZATION AND CONSENT TO PARTICIPATE IN A RESEARCH
I Dr Peter Teru Yaru of the Department of Paediatrics Ahmadu Bello University
Teaching Hospital (ABUTH) Zaria Irsquom conducting a research on the blood pressure
pattern among secondary school adolescents in Jalingo
The aim of the study is to know the level of blood pressure among their age
groups Those with high blood pressure (or hypertension) will be identified appropriately
advised and referred for further care The study will involve taking their weight height
blood pressure and waist circumference Female assistants shall be responsible for
86
measuring waist circumference of female students Students will also be given a
questionnaire on some of their activities drug use among others all aimed at looking for
factors which can affect their blood pressure Information obtained shall be treated with
utmost confidentiality and for this research work only Please note that participation is
voluntary I will be glad if you give consent for your childward to participate in the
study
Statement by parents Irsquove read and understood this consent form and agreed for my
child to be included in the study
Parents name Researcherrsquos name and sign
Parents phone no if any Date
Parents signthumb print Phone no
87
Appendix 3
SOCIO-ECONOMIC SCORE
The classification of socio-economic scores based on fatherrsquos occupation and motherrsquos
education by Olusanya et al117
A Husband (fatherrsquos occupation)
Score 1 Professionals top civil servants politicians and businessmen
2 Middle-level bureaucrats technicians skilled-artisans and well-to-do traders
3 Unskilled workers and those in general whose income would be at or below
the national minimum wage
B Mothers educational level
Score 0 Education up to University level
1 Secondary or tertiary level below the University
2 No formal education or up to primary level only
The socio-economic class of the childrsquos mother is obtained by adding the scores from A
and B above and graded I-V as appropriate for example
Score (1) from A plus score (0) from B = social class I
Score (2) from A plus score (0) from B = social class II
Score (2) from A plus score (1) from B = social class III
Score (2) from A plus score (2) from B = social class IV
Score (3) from A plus score (0) from B = social class III
Score (3) from A plus score (1) from B = social class IV
Score (3) from A plus score (2) from B= social class V
Page 12
12
INTRODUCTION
Blood pressure (BP) is the pressure exerted by circulating blood volume on the walls of
blood vessels1 It is one of the vital signs measured during routine physical examination2
Blood pressure measurement is done to screen for hypertension and other cardiovascular
risk factors determining risk for various medical procedures identifying patients in
potential or actual clinical deterioration and determining individualrsquos fitness for an
occupation3 Its value as a screening tool in adults has long been documented and is an
established important component of routine paediatric physical examination4
The importance of BP measurement in children and adolescents is based on the fact
that hypertension is now increasingly diagnosed among them5-8 The American Academy
of Paediatrics now recommends routine screening of asymptomatic adolescents and
children during preventive care visits Such screening will identify potentially treatable
and preventable causes of hypertension and initiate early treatment to prevent
complications5
Hypertension is an important health problem all over the world5-9 because it is
usually silent and the presence of symptoms may indicate end organ damage10 It is
known to track well into adulthood thus making BP measurements in youths valuable for
identifying adolescents at risk of essential hypertension in adulthood11 Individuals with
high BP in their childhood are more likely to have high BP in subsequent years12 The
phenomenon of BP tracking into adulthood and the demonstration of the beginnings of
hypertensive target organ damage during childhood together with the increased
prevalence of childhood essential hypertension have raised concern of an impending
epidemic of cardiovascular morbidity and mortality10
The consequences of hypertension in children range from increased morbidity
from its causes complications or its treatment to high mortality13 The most frequently
13
and perhaps severely affected organs are the heart kidneys brain and the eyes leading to
lowered life expectancy and premature death13 In addition hypertension is a component
of the metabolic syndrome associated with similar and perhaps more severe consequences
in affected individuals14 Abdulrahaman and Babaoye15 in a study of hypertension in
Nigerian children observed a mortality rate of 28 within the first year after diagnosis
Similar mortality of 275 was reported by Aderele and Seriki9 Hypertension also places
an excessive financial burden on the population and health system consuming scarce
resources16
Adolescence is the transitional period of development between childhood and
adulthood The World Health Organization (WHO) defines adolescents as individuals
between the ages of 10 and 19 years and they account for 40 of Nigeriarsquos population1718
Adolescence is characterized by rapid biological psychological and cognitive changes
largely dependent on hormonal and environmental influences19 Many of the responses to
these influences include behaviours that have direct implications on health such as harmful
dietary intake alcoholism smoking substance abuse and sedentary lifestyle19 These
coupled with social stresses such as city traffic congestion have negative health impact and
predispose to obesity and increased risk of cardiovascular disease such as hypertension and
metabolic syndromes10 20 It has been shown that if preventive measures are started early in
childhood and adolescence they may lead to significant reduction in the high prevalence of
hypertension and metabolic syndrome currently observed in adults81320
JUSTIFICATION FOR THE STUDY
Hypertension is associated with high morbidity affecting major organs of the body such as
the heart kidneys and the brain1314 and a mortality of up to 275-28915 It is now diagnosed
frequently in adolescents with a reported prevalence of 35-952122 The younger the age of
14
onset of hypertension the greater the reduction in life expectancy if left untreated13 Even
asymptomatic adolescents with mild blood pressure elevations can have target organ
damage10 Studies121420 have shown that early identification and intervention may lead to a
significant reduction in the high prevalence of hypertension and metabolic syndrome
currently observed in adults In view of this routine blood pressure check-ups for children
and adolescents have been advocated during medical evaluations8 Blood pressure is
however not routinely measured in most paediatric clinical practices in Nigeria
Consequently only few children will have their blood pressure measured when they fall sick
or during preventive care visits In addition hospital and clinic BP measurements may be
associated with falsely elevated BP called lsquolsquowhite coat hypertensionrsquorsquo8 BP measurement of
children outside of the hospital setting such as in schools will provide opportunity for
apparently healthy individuals and possibly eliminate white coat hypertension The need for
surveillance for the early identification of adolescents in Jalingo who are at risk of
hypertension and to initiate measures aimed at preventing its consequences is therefore the
justification for this study In addition the study will add to the body of knowledge on
adolescent blood pressure as there has been no previous study on BP from Jalingo and
northeastern Nigeria as a whole This will help inform public health policies regarding blood
pressure control and prevention in Taraba State in particular and in Nigeria in general
15
LITERATURE REVIEW
HISTORICAL PERSPECTIVE
Blood pressure measurement first started in the eighteenth century with the experiment of
Stephen Hales to whom its discovery can be attributed as reported by Jeremy2324
Accurate study of blood pressure as reported by Crile25 began with the introduction of a
manometer by Poiseuille a century later The first truly accurate blood pressure
measurement in man was by the Surgeon Faivre in 1856 when he connected an artery to a
mercury manometer to obtain direct readings24 Non-invasive methods of BP
measurement started with the discovery of the sphygmograph in 1855 by Vierordt as
reported by Crile25 and improvement by Potain in 1889 gave birth to the
sphygmomanometer26 In 1896 Scipione Riva-Rocci developed the method upon which
present-day technique is based27
Segal28 reported that the use of stethoscope for BP measurement was first highlighted
in 1905 by a Russian surgeon Korotkoff who documented hearing a tapping sound using a
stethoscope placed over the brachial artery as the Riva-Rocci cuff was deflated Goodman
and Howell29 recommended the division of the changing sounds into five distinct phases and
physicians subsequently determined blood pressure according to the point of appearance and
muffling or disappearance of the sounds30
DEFINITION AND REGULATION OF BLOOD PRESSURE
Blood pressure is defined as the product of cardiac output and peripheral vascular
resistance131 During each heartbeat BP varies between a maximum (systolic) and a
minimum (diastolic) pressure and is measured in millimeters of mercury (mmHg)1 Blood
16
pressure is regulated by different mechanisms acting either rapidly or slowly to maintain it
within normal range for optimal cellular performance3132
Intrinsic Regulation
Intrinsic factors regulating BP include stroke volume and heart rate which both influence
cardiac output31 Stroke volume depends on the volume of blood that fills the ventricles and
this depends on the preload and afterload33 A higher afterload will decrease stroke volume
causing low cardiac output and low BP and vice versa When cardiac output increases more
volume is derived from the venous pool increasing preload Similarly an increased heart rate
will lead to increased cardiac output and BP3134
Reflex Regulation
The baroreceptors within the aortic arch and carotid sinuses contain sympathetic and
parasympathetic nerve fibres3435 These are sensory nerves which run from the medulla
and they respond to stretch of the tissue in which they lie by increasing or decreasing the
rate of signaling36 and act fast in regulating BP34 Sympathetic stimulation causes
increased heart rate and widespread vasoconstriction to increase BP while
parasympathetic stimulation produces the opposite3537
Hormonal Regulation
Hormones regulating blood pressure include renin-angiotensin-aldosterone and
antidiuretic hormone (ADH) They act slowly by responding to changes in intravascular
volume and osmolality38 Angiotensin II is a potent vasoconstrictor and stimulates the
release of aldosterone from the adrenal gland39 Aldosterone increases sodium absorption
and fluid retention leading to increased BP ADH is a potent vasoconstrictor and plasma
volume regulator and its stimulation results in fluid retention and vasoconstriction39
Other hormones regulating BP include the sex hormones thyroid parathyroid cortisol
and ACTH They act on the rennin-angiotensin-aldosterone system to regulate BP3940
17
Renal Regulation
The kidneys control blood pressure through the retention and excretion of extracellular
fluid35 An increase in renal fluid retention will increase extracellular volume and higher
blood pressure whereas increased renal excretion leads to lower blood pressure41 This is
achieved through the action of ADH aldosterone and atrial natriuretic peptide (ANP)41
METHODS OF MEASURING BLOOD PRESSURE
Blood pressure can be measured by invasive and non-invasive methods
1) Invasive (or direct) method - Blood pressure is most accurately measured invasively
through an arterial line4243 It is the gold standard by which the accuracy of other blood
pressure measuring devices and methods are assessed4344 Chyun43 compared direct and
indirect blood pressure readings in 14 intensive care unit patients and found that the
auscultatory method overestimates the systolic and diastolic BP especially if the VI Kortkoff
sounds is used as an indicator of diastolic BP This can often over estimate reading by as
much as 20 mm Hg43 This study is made up of very small sample size to make general
conclusion on the differences in BP values from the two methods compared Although the
invasive method is the gold standard for true BP measurement it is associated with serious
complications related to arterial catheterization and the procedure itself may be technically
difficult It is mainly used in experimental procedures and in monitoring critically ill patients
in intensive care units42
2) Non invasive (indirect) methods These are simpler and quicker than the invasive
method and are commonly used for routine blood pressure examinations They may
however yield lower accuracy and small systematic differences in numerical results43
These methods include-
18
a) Palpation method - A minimum systolic value can be estimated by palpation Deakin
and Low45 reported that a palpable radial femoral or carotid pulse indicates a minimum
systolic BP of 80 70 and 60 mmHg respectively The study was carried out among adults
and these values could not be applicable in children and neonate whose maximum
systolic BP may be lower than the reported minimum values A more accurate systolic BP
value can be determined by inflating and then deflating sphygmomanometer cuff while
palpating the pulse The systolic BP corresponds to the pressure at which the radial pulse
becomes palpable45 Its disadvantages are that pressure obtained is usually 2-5mmHg less
than those obtained by auscultation and diastolic BP cannot be measured32
b) Auscultation method- Also called the Korotkoff method is the method of choice in
clinical practice142 It involves using a stethoscope and a sphygmomanometer46 The
mercury sphygmomanometer is the gold standard for BP measurement A Riva-Rocci
cuff 27 is placed over the arm and inflated to occlude the brachial artery It is then
gradually deflated until blood flow is re-established accompanied by a tapping sound
which can be detected by the stethoscope held over the artery Five sounds are
traditionally heard and classified into phases30 The first phase corresponds to the systolic
BP while the last or fifth phase corresponds to the diastolic BP30 The fourth phase
alternatively is used to measure the diastolic pressure if a 10 mmHg or greater
differences exist between the initiation of phases fourth and five or if the fifth sound is
heard down to 0 mmHg8 This may occur in cases of high cardiac output or peripheral
vasodilatation children or in pregnancy This method though the method of choice in
clinical practice may however be associated with errors arising from faulty technique and
equipment4748 as well as observer bias49 This method was used for this study because of
its widespread general usage its reliability and accuracy Unlike other methods the
instruments (mercury sphygmomanometer and stethoscope) do not require any
19
calibration and values obtained do not require validation by other methods The standard
World Health OrganizationCenter for Disease Control (WHOCDC) blood pressure
reference percentile tables were generated using the mercury sphygmomanometer hence
the auscultation method is the gold standard for BP evaluation258
The aneroid sphygmomanometer measures BP by mechanical system of metal
bellows that expand as the cuff pressure increases in a series of levers that register the
pressure on a circular scale The hybrid shygmomanometer combines some of the features
of the two and uses an electric transducer to record blood pressure2
c) Oscillometric technique- This uses the oscillometric device Oscillation of pressure in a
sphygmomanometer cuff is recorded during gradual deflation The point of maximum
oscillation corresponds to the mean arterial pressure50 The oscillation begins well above
systolic BP and continues below diastolic BP so that systolic and diastolic BP can only
be estimated indirectly according to some empirically derived algorithm
d) Ultrasound method - This uses an ultrasound transmitter and receiver placed over the
brachial artery under a sphygmomanometer cuff As the cuff is deflated the movement of
the arterial wall and systolic BP cause a Doppler phase shift in the reflected ultrasound
The diastolic BP is recorded as the point of diminished arterial motion51 Its advantage
includes the ability to detect diastolic BP in atrial fibrillation and hypotension where
Korotkoff sound is faint152
FACTORS AFFECTING BLOOD PRESSURE IN ADOLESCENTS
Several inter-related factors affect blood pressure These include-
Age - A progressive BP elevation with age has been observed in several studies2153-55
The rate of rise varies in boys and girls5455 The average systolic increase ranges between
20
166 and 286 mmHgyr for boys and 144 and 263mmHgyr for girls while that of
diastolic BP ranges from 083 and 177mmHgyr for boys and 077 and 148mmHg for
girls2155 Bugaje Yakubu and Ogala21 studied blood pressure pattern among 2035
adolescents in Zaria and found a consistent rise of BP with age The rate of rise was fairly
constant until 11-13 years in boys and 12-14 years in girls when the rise became rapid A
similar study53 also found a BP rise with age among 650 healthy school children in Jos In
a large population studies in Lebanon56 and Saudi Arabia55 BP was similarly reported to
increase consistently with age Rapid growth and biological maturation of organs which
are normal occurrences during adolescence were thought to be responsible rather than the
chronological age56 The results of these studies showed increasing blood pressure with
age despite the fact that one study55 used oscillometric method for their study while the
standard auscultation was used in the other studies Also the studied sample sizes across
these studies varied greatly with sizes of 65053 203521 571054 and 1622655 Despite this
the findings were similar
Gender ndash Results of studies on the effect of gender on BP showed that sex positively
affects blood pressure2153-55 Merhi Al-Hajj and Al-Tannir et al54 studied BP pattern in
5710 Lebanese school children while Al-Salloum El-Mouzan and Al-Herbish et al55
studied BP pattern in 16226 Saudi children and adolescents The authors reported a
higher BP in girls than boys at all ages A study21 of BP pattern in adolescents in Zaria
Nigeria demonstrated an initial higher BP in boys before puberty which reversed with the
onset of puberty up to the age of 14-15yrs when it reversed again to be higher in boys
Akinkugbe Akinwolere and Kayode56 reported no sex differences in adolescent BP in
Ibadan The reported sex difference is said to be likely due to differences in sex hormone
and pattern of growth in boys and girls57 Differences in age range of the study population
may however be responsible for the observed BP variation For instance these studies5455
21
comprised of both adolescents and pre-adolescent age groups combined in one study
while the other two studies2156 were purely adolescents21 Blood pressure is reported to be
equal in both sexes before adolescence after which the gender difference starts to
manifest most likely due to physical and hormonal changes
Socioeconomic Factors - Belonging to either end of the socioeconomic strata is found to
be associated with elevated blood pressure5859 A study in Ibadan56 reported an inverse
relationship between parental socioeconomic status and level of BP in adolescents The
authors suggested that this might be the result of the health behaviours and problems
characteristic of the lower socioeconomic class On the other hand Ejeke Ugwu and
Ezeanyika et al60 in Lokoja and another study53 in Jos both found higher BP in children
from high socioeconomic class Colhoun Hemminway and Poulter61 in a meta-analysis of
BP and socioeconomic status in developed and developing countries found an inverse
relationship of BP with socioeconomic status in developed nations and a direct correlation
in developing countries These different findings may be due to methodological
differences in socio-demographic stratification For instance Akinkugbe and
colleagues59 used fatherrsquos level of education for social classification Parentrsquos educational
level may however not equate well with level of family income The other study60 used an
automated device for their study whose values may require validation using the
recommended auscultation method Difference in environmental stresses may also be
different considering the level of development of the areas where the studies were carried
out
GeneticFamilial Factors - The effect of geneticfamilial factors on BP has been
demonstrated in some studies62-64 Familialgenetic correlations reflected in BP and other
anthropometry generally are higher among genetically close relatives such as brother-
sisters or parent-offspring than among spouses62 Levshit and Gerber63 surveyed 514
22
individuals from 135 nuclear families in Russia while Budaruddoza62 studied 1400
individuals from 380 families in India and found significant genetic influence on BP
Mijinyawa Iliyasu and Borodo65 also reported family history of hypertension as risk
factor for developing high BP in a study on prevalence of hypertension among 1000
teenagers in Kano The authors concluded that this could be due to genetic predisposition
They however did not evaluate further to determine the genetic defects The authors did
not also consider shared environmental factors known to influence blood pressure in
individuals Molecular genetic studies have identified genes as possible regulators of
BP6667 These genes regulate the renin-angiotensin-aldosterone system involved in renal
salt handling69 Mutations that increase sodium reabsorption and salt sensitivity is
associated with higher BP and vice versa68 while shared environmental risk factors may
potentiate the development of such familial conditions which might have been
responsible for outcome of the above studies6364
Environmental Factors ndash Environmental factors greatly influence BP variation in a
population592269 Akinkugbe and Ojo70 reported a consistently higher BP in Nigerian
adolescents than their counterparts of similar ages in black and white American children
The authors are of the view that this could be due to different environmental factors of the
study population Obika Adedoyin and Olowoyeye22 studied BP pattern in 2526
children aged 1-14 years in rural semi-urban and urban communities in Ilorin Nigeria
and demonstrated a hypertension prevalence of 95 in urban compared to 63 in rural
communities This was similar to the study59 in Ghana and Gambia69 The authors592269
argued that the differences were due to socioeconomic status which is higher in the urban
than the rural areas The BP variation could be accounted for by the nature of dietary
intake since the rural communities generally consume more of natural foods with less salt
and lsquojunk foodsrsquo compared to the urban populace This was demonstrated by one study61
23
which reported higher mean BP among urban communities in developing nations due to
changes in their dietary pattern Rural areas are also less exposed to the stress and hassle
of the urban cities It is of interest to note however that urban areas are a mixture of
social classes as a result of migrant workers seeking lsquogreener pasturesrsquo Okagua Anochie
and Akani71 on the other hand reported higher mean BP among rural adolescents than
their urban counter parts in Port Harcourt The authors could not identify the reason(s) for
their finding but concluded that the seemingly protective privilege of rural life may be
fading gradually The differences in the reports could however result from the sample size
composition comprising of preadolescents22 adolescents71 and adults69
Race - Higher BP levels have been reported in African-American and Hispanic school-
age children than their Caucasian counterparts and among African-Americans than the
Hispanics7273 Akinkugbe and Ojo70 demonstrated a consistently high systolic and
diastolic BP in Nigerian children compared with black and white American children of
similar age Exposure to chronic environmental stress low socioeconomic status and high
obesity rate among African American and Hispanic youths could contribute to higher
BP72-74 It can be inferred from the study that race alone may not be responsible for the
observed differences but shared environmental factors and socioeconomic status may be
contributory77 Other studies7475 however found no significant BP differences in relation
to race
Anthropometry and blood pressure (BP) - A positive correlation has been observed
between BP and anthropometry in various studies58-5977 These studies585678 observed a
significant correlation between systolic BP and weight height and body mass index
(BMI) in boys but only with weight in girls Body mass index (BMI) is used as a
measure of overall obesity but it is known to be a poor indicator of actual body fat79
Waist circumference (WC) is an aggregate measurement of the actual amount of total and
24
abdominal fat accumulation80 It is therefore a better predictor of BP and other
cardiovascular diseases8081 Guagnano Ballone and Colagrande et al81 studied the
relationship between BP and BMI WC and waist hip ratio (WHR) in 461 people and
found WC to be the most consistent anthropometry affecting BP It is of interest to note
that the study by Guagnano et al81 was in adults population while the other studies56-59
were in children and adolescents WC was also found to be a better predictor of BP in an
Italian study8081 while it was not in others56-6982 Comparing BMI and waist
circumference and their effects on BP Arauzo Lopes and Moriera et al83 in Brazilian
children found BMI to be a better predictor of BP than waist circumference This was
similar to the study by Sebanjo and Oshikoya82 in Nigerian adolescents in Akure Thus
waist circumference measurements may not be useful in the evaluation of obesity andor
hypertension in children and adolescents This may partly be explained by the uniform fat
distribution due to hormonal effect at puberty in adolescents compared to the
disproportionate fat distribution in adults Possible mechanisms for the positive
relationship between BP and high BMI includes decreased physical activity increased
salt intake impaired pulmonary functions and development of metabolic abnormalities
such as dyslipidaemia and insulin resistance8084
Nutritional factors - Diet has been a primary link between humans and their environment
and substantial evidence supports the concept that multiple dietary factors affect BP85
Well-established dietary modifications that lower BP are reduced salt intake increased
potassium intake increased protein particularly plant protein high vegetable and
polyunsaturated fats85 High sodium intake on the other hand is said to be associated with
elevated blood pressure86 A series of 3 large controlled feeding studies tested the effects
of dietary patterns on BP86-89 Of the 3 diets studied the dietary approach to stop
hypertension (DASH) emphasized fruits vegetables low-fat dairy products whole
25
grains poultry fish nuts potassium magnesium calcium and fibre as the most effective
diet89 Among all participants the DASH diet significantly lowered mean systolic BP by
55 mm Hg and mean diastolic BP by 30 mm Hg each net of changes in the control diet
DEFINITION AND CLASSIFICATION OF ADOLESCENCE
Adolescence is the transitional stage between childhood and adulthood during which many
life patterns are learnt and established90 According to World Health Organization (WHO)
adolescents are individuals between the age range of 10-19 years17 The most significant
feature of adolescence is puberty characterized by an exceptionally rapid rate of biological
growth and development including physical and sexual maturation9091 The pubertal changes
have been described by Tanner and Marshal92 and are grouped into five stages This utilizes
definite criteria for growth and development of secondary sexual characteristics like pubic
hair and breast in females and pubic hair and genitalia in males9092 The timing of these
events and the rate of growth vary due to genetic and environmental factors in different
populations92 Adolescence is divided into early middle and late periods17
Early adolescence (10-13 years) ndash This is a period of rapid growth and development of
secondary sexual characteristics and varies according to sex It corresponds to Tanner stages
1 and 290 The main features of this stage are breast bud development and menarche in girls
while testicular enlargement and seminal emission occurs in boys93
Middle adolescence (14-16 years) ndash In this stage rapid growth decreases and there is more
cognitive development as the adolescents move from concrete thinking to formal operation
and develop greater competence at abstract thinking91 This corresponds to Tanner stages 3
and 4
Late adolescence (17-19 years) ndash Here slowing of physical changes continue which permits
the emergence of a more stable body image Cognition tends to be less self-centered with
26
demonstration of care for others with increasing thought about concepts such as justice
patriotism and history It corresponds to Tanner stage 59092
ADOLESCENCE AND BLOOD PRESSURE
Adolescence is characteristically associated with increasing blood pressure because of the
physical growth and hormonal changes associated with puberty5794 After the age of one year
normal BP increases more during puberty than probably at any other time in an individualrsquos
lifetime95 Wanzhu Eckert and Saha et al57 examined data from a cohort of 182 normotensive
children in Indiana who had blood pressure measurements taken semi-annually for up to 12
yr The authors found that the rate of change in BP and weight peaked at the age of maximum
pubertal growth spurt (PGS) This BP spurt roughly coincides with growth spurt during
puberty94 Surveys of BP patterns from childhood through adolescence shows systolic and
diastolic pressures increase with age and in adolescents the increase in males is more marked
than in females especially the systolic pressure5458229495
CLASSIFICATION OF BLOOD PRESSURE IN ADOLESCENTS
The National High Blood Pressure Education Program Working Group (NHBPEPWG) of the
United States established guidelines for the definition of normal and elevated blood pressures
in children in 19876 These guidelines were revised in 20048 The definition of childhood
hypertension in the guidelines are based upon the normative distribution of blood pressure
(BP) in healthy children rather than clinical outcome data as in adults The guidelines
classified BP as normal prehypertensive or hypertensive Hypertension is graded into stage
one and two8
Normal BP - Blood pressure lt90th percentile for age sex and height Children and
adolescents with normal BP should be followed annually from the age of 3 years5 They
27
should be encouraged to maintain a healthy life style such as good dietary intake physical
activities and adequate rest8
Pre-hypertension - Blood pressure between the 90th and lt 95th or if BP exceeds
12080mmHg (even if lt90th percentile) but lt95th It was previously called high normal
BP This new description was introduced to help identify children at risk for the
development of persistent hypertension for whom targeted prevention programmes would
be most beneficial96 While recommendations for the diagnosis of hypertension in
children require that BP remains elevated on three separate occasions repeated
measurements are not necessary to classify an adolescent as pre-hypertensive11 The
prevalence of childhoodadolescence pre-hypertension in US is reported to be between
12-1796-98 In Nigeria Ejeke Ugwu and Ezeanyika99 in a study of the prevalence of
point prehypertension and hypertension in 843 adolescents in Lokoja reported a
prevalence of point prehypertension of 222 and 250 in semi urban and urban
communities respectively Ujunwa Ikefuna and Nwokocha et al100 reported 175
prehypertension prevalence among adolescents in Enugu Among adults with pre-
hypertension it is reported that as much as 10 per year develop hypertension101 There
is little information on the time course for children and adolescents with prehypertension
developing hypertension A value of between 11-7 per year has been reported in US
adolescents98 There is no known study on rate of progression of prehypertension to
hypertension in Nigerian adolescents The NHBPEP recommended that children with
pre-hypertension should have their BP checked after every six (6) months to monitor for
progression to hypertension They should be encouraged to engage in physical activity
healthy dietary behaviours and weight management if overweight Pharmacologic therapy
is not indicated except if there is strong evidence of renal disease heart failure left
ventricular hypertrophy or diabetes mellitus8
28
Hypertension Hypertension is BP persistently equal to or above the 95th percentile for
age sex and height measured on three or more separate occasions If the blood pressure
measurement obtained is gt 95th percentile the degree of hypertension should be staged
Stage 1 hypertension- BP value between the 95th and the 99th percentile plus 5mmHg It
is recommended that BP should be rechecked in 1ndash2 wks or sooner if the patient is
symptomatic If persistently elevated on 2 additional occasions it should be evaluated or
referred to source of care for pharmacologic treatment within 1 month 8
Stage 2 hypertension- BP value gt99th percentile plus 5mmHg This stage calls for more
prompt evaluation and commencement of pharmacologic therapy102 It is recommended
that the individual be evaluated or referred to source of care within 1wk or immediately if
the patient is symptomatic8
Aetiology of hypertension
Hypertension is classified as primary (essential) when there is no identifiable cause
or secondary if due to an underlying disease31 Factors such as heredity diet stress drugs and
obesity play a role in the development of essential hypertension103104 Causes of secondary
hypertension include umbilical artery catheterization renal diseases coarctation of the aorta
and endocrine disorders105106 Aderele and Sereki6 in their study of hypertension in children
reported hypertension secondary to renal pathology as the commonest cause of elevated BP
in children This study was mainly in preadolescent population in which secondary
hypertension is a common finding On the other hand Antia-Obong and Antia-Obong107
reported no apparent cause in greater than 90 of the studied subjects with elevated BP and
also reported proteinuria of 1 in the same population without any associated elevated blood
pressure The study did not however evaluate the etiology of the proteinuria A study65 of BP
in teenagers in Kano found family history of hypertension a risk factor in the study
population Another study in Enugu100 examined modifiable risk factors associated with
29
hypertension in 2694 adolescents and found only 1 and 06 of the hypertensive subjects
to be overweight and obese respectively The authors also found that smoking and alcohol
consumption were not significant risk for hypertension This may however be due to the
shorter period of consumption of these products by the students as a cumulative effect from
long term consumption is known to be associated with adverse health outcomes
Prevalence of hypertension in adolescents
The prevalence of hypertension in adolescents varies widely due to arbitrary and imprecise
definition by different researchers It was in view of this that the National High Blood
Pressure Education Program Working Group (NHBPEPWG) of the United States established
guidelines for the definition of normal and elevated blood pressures in children and
adolescents for uniformity68 In the USA the prevalence is about 20 in normal weight and
50 in their obese counterparts108 A prevalence rate of 77109 10554 and 223110 has
been reported in Spain Lebanon and South Africa respectively In Kano Nigeria a study65
on the prevalence of hypertension among 1000 teenagers found a prevalence of 72 Similar
study in Enugu100 on the prevalence of hypertension among 2694 secondary school
adolescents reported a hypertension prevalence of 54 It is of interest to note that different
prevalence was reported because of the different methodology used by the authors While the
study in Kano65 applied the adult blood pressure criterion of BP greater than 14090mmHg as
hypertension the study in Enugu100 used blood pressure greater than 95th percentile for age
and sex Also the study in Kano65 took a single set of measurement while the study100 in
Enugu measured blood pressure of the subject three times at weekly intervals Bugaje
Yakubu and Ogala21 on the other hand defined hypertension as blood pressure greater than
two standard deviations from the mean and also took six readings over thirty minutes and got
a prevalence of hypertension of 34 A prevalence rate of 48107 and 9522 in Southern
and Western region of the Nigeria respectively was also reported It is obvious that because
30
of the various defining criteria for hypertension in adolescents the prevalence of adolescent
hypertension remains imprecise
Clinical presentation- Hypertension is usually asymptomatic unless it has been
sustained or is rising rapidly109 Adolescents with essential hypertension are usually
detected during routine evaluation96 Non-specific symptoms such as lethargy headache
dizziness drowsiness visual disturbance and confusion may be present109 These could
also be signs of complications111 Secondary hypertension may show obvious features of
the underlying disease such as growth failure heat intolerance abdominal stria tremors
body swelling and haematuria8102 Croix and Feig112 studied the spectrum of symptoms in
409 children aged 7-18 years newly diagnosed hypertensive in Texas USA and reported
15 common symptoms than in the controls The symptoms were said to resolve after
commencement of antihypertensive medications The authors concluded that hypertensive
children had a variety of non-specific symptoms The three most common symptoms
reported were headache daytime tiredness and difficulty initiating sleep The study
however did not specify if other possible causes of these symptoms were excluded
Complications of hypertension - Hypertension is usually asymptomatic in adolescents
which if left unidentified overtime can cause serious complications109 Organs commonly
affected in the complication of hypertension are the heart kidneys brain and the eyes
leading to lowered life expectancy and premature death13 Left ventricular hypertrophy
(LVH) is the most prominent clinical evidence of end organ damage10 Studies have
shown that LVH can be seen in as many as 41 of patients even in adolescents with
asymptomatic hypertension10103 Adolescents with severe cases of hypertension are also
at increased risk of developing hypertensive encephalopathy seizures cerebrovascular
accidents and congestive heart failure103109 However data documenting such
complications in children and adolescents are generally lacking In a study of
31
hypertension among teenagers in Kano the researchers65 could not find any
complications in all the 1000 teenagers studied
Investigations and treatment- Basic investigations are all that may be required in
adolescents who are obese and with a family history of hypertension stage 1 disease and
normal findings on physical examination113 This is because primary hypertension is
commoner in adolescents Adolescents that are symptomatic or with stage 2 hypertension or
have features of secondary hypertension should be evaluated in more detail
Treatment of hypertension includes non-pharmacological and pharmacological
methods Non-pharmacologic management involves life style modification such as weight
reduction increased physical activities and dietary adjustment114 In a study to evaluate the
effect of diet and salt on treatment and prevention of hypertension Sacks Svetkey and
Vollmer et al86 reported the beneficial effect of both reduced salt intake and appropriate
dietary adjustment in the control of hypertension Similar benefits were reported in other
studies8788 Although both studies had fairly good sample size (n=412) the studies did not
specify if participants were on other substances or activities other than antihypertensive that
might have affected their BP The studies were also in adults and whether it has the same
effects in children and adolescents has not been evaluation However there is no doubt that
the outcome will be similar in adolescents as dietary modifications have been advocated as
non-pharmacologic management in them Non pharmacologic treatment is usually the initial
treatment in essential hypertension and as adjuvant to drug therapy in those with secondary or
complicated hypertension101114 Pharmacologic (drug) treatment includes diuretics beta-
blockers calcium channel blockers angiotensin converting enzyme inhibitors (ACEIs) and
angiotensin receptor blockers (ARB) among others106114 They are used in those with
symptomatic disease and in acute or chronic complications106
32
Prevention of hypertension may be viewed as part of the prevention of cardiovascular
disease102 In adolescents approaches to prevention include reduction in obesity
discouraging cigarette smoking and alcohol intake113 reduction in sodium intake and increase
in physical activity through community and school-based programmes103104 Growth
monitoring BP check during preventive care visit physical activity and urine screening for
proteinuria and haematuria can be used starting from early childhood
33
AIM AND OBJECTIVES
GENERAL AIM
To determine the blood pressure pattern of apparently healthy secondary school adolescents
in Jalingo Taraba State
SPECIFIC OBJECTIVES
To determine
1 Blood pressure pattern in relation to age and sex among adolescents aged 10-19
years
2 The relationship if any between blood pressure and the anthropometric parameters of
weight height BMI and waist circumference
3 The association between blood pressure and parental social-economic status
4 The point prevalence of prehypertension and hypertension in adolescents
34
MATERIALS AND METHODS
Study area
A cross-sectional survey of the blood pressure pattern of apparently healthy secondary
school adolescents aged 10-19 years was conducted in Jalingo over a six month period
from January to June 2014 Jalingo is the capital of Taraba State and lies within the
savannah belt of North Eastern Nigeria It lies between latitude 80 54rsquo north and longitude
110 21rsquo east and at an altitude of 360 meters above sea level115 Jalingo had a population of
118198 people18 The primary inhabitants are the Konas Mumuyes and Fulanis who are
mostly farmers Other indigenous ethnic groups include the Jukun Kuteb WurkumTiv
and host of other tribes The Ibos Hausas Yorubas among others are the non-indigenous
ethnic groups and are mostly civil servants and businessmen Jalingo has a tertiary health
centre the Federal Medical Centre Jalingo and the state specialist hospital It also has 15
private clinicshospital and many primary health care centres There are also tertiary
education institutions including Taraba State University As at 2013 there were 56
secondary schools in Jalingo 24 public and 32 private all of which were mixed schools
except one which is a girlsrsquo only school
Study design
The study was a cross sectional descriptive study of 1350 apparently healthy secondary
school adolescents in Jalingo
Ethical approval
Ethical approval for this study was obtained from the Scientific and Health Ethics Research
Committee of Ahmadu Bello University Teaching Hospital Zaria (Appendix 4) The Taraba
State Ministry of Education also gave the approval and permission to conduct the study in the
35
selected schools Consent was given by the studentsrsquo parents or guardian (Appendix 2) All
students whose parents gave consent voluntarily participated in the study
Sample size determination
The minimum sample size was calculated using the formula116
N=Z2 (pq) E2
Where N = minimum sample size
p = Prevalence of hypertension in adolescents A prevalence of 3421 was used
q = 1- p
E = margin of error tolerated =1
Z = 196 at 95 confidence level
N = 1962 x 0034 x (1-0034) 0012 = 1262
Therefore the minimum sample size was one thousand two hundred and sixty two
Allowance for non-responders of 5 63 extra subjects were added to the calculated
minimum sample size bringing the total to 1325 students To enhance representativeness of
the sample and to compensate for missing information and poorly filled proforma while
maintaining the sample size a total of 1350 was decided upon
Inclusion criteria
1 Students (ages 10-19 years) in the selected secondary schools
2 Students whose parents gave consent to participate in the study
3 Students who gave assent to participate in the study
Exclusion criteria
1 Students who had obvious skeletal deformities of the spine and legs which can affect
the height and ultimately the BMI
36
2 Students with known chronic disease (or history of such disease) like anaemia
chronic renal disease and cardiac disease because they are not apparently healthy and
these conditions could affect their blood pressure
3 Students with present or past history of chronic drug ingestion that can affect blood
pressure such as steriods and contraceptives
4 Students with high blood pressure already on antihypertensive
Pilot study
A pilot study was carried out in one of the schools a week before the commencement of
the study The school was selected by random sampling method using balloting and did
not participate in the main study The pilot study was carried out with the aim of
assessing the competence of the research assistants in the various measurements
following their training to ensure reliability It was also used to test the questionnaire
before its use during the main study and to provide information on the number of students
that can be measured in a day Consequently twenty students had their blood pressure
and anthropometry measured independently by the researcher and the research assistants
and data were compared using Students t-test There were no statistically significant
differences between the measurements The result of the pilot study is highlighted in
Table I It was also found that some parts of the questionnaire were not well understood
by most students and were adjusted appropriately in the main study (Appendix 1) The 20
students had their measurements done over a period of 3-4 hours (between 8am - 12noon)
by the researcher and the research assistants
Table I Result of pilot study
Variables Researcher Research t p
37
assistants
Mean(plusmnSD) SBP
mmHg
106(11) 104(12) 0550 0586
Mean(plusmnSD) DBP
mmHg
617(83) 63(10) 0450 0657
Mean(plusmnSD) Weight
kg
544(82) 527(122) 0520 0608
Mean(plusmnSD) Height m 16(01) 16(01) 0000 1000
Mean(plusmnSD) BMI
kgm2
198(36) 202(33) 0370 0716
Mean(plusmnSD) WC cm 692(72) 682(133) 0300 0769
Sampling method
Students were selected by multistage random sampling technique The list of secondary
schools obtained from the Taraba State Post Primary Schools Board served as the sampling
frame for schools There were 56 secondary schools 24 of which were public and 32 were
private schools a ratio of 113 Ten (10) schools were randomly selected by balloting four
(4) from public schools six (6) from private based on the number and approximately similar
ratio of private to public schools of 115 (46) Ten schools were selected to ensure wider
coverage and even distribution of students so that it could be truly representative of the
community All the ten schools had an overall total of eight thousand one hundred and seven
(8107) students The public schools had a total of five thousand nine hundred and forty
(5940) with nine hundred and eighty nine (989) students participating The private schools
had a total of two thousand one hundred and sixty-seven (2167) students with three hundred
and sixty one (361) participating These number (989 and 361) was calculated based on the
38
relative population of each school and proportionate to number of students in each school
Thereafter the number of students to participate per school was calculated proportionately to
the number of students in each school based on the number given by the school authority
Then the number in each class was also calculated proportionately from JSS1 to SS3 to
ensure fair and equal chance of participation for all age groups The calculation was done
thus n= a b x c
Where n= number of students per selected school
a= total numberpopulation of students in the school
b= total numberpopulation of students in all 10 selected schools (8107)
c= calculated total sample size (1350)
Students in each class from junior secondary school (JSS) 1-3 and senior secondary school
(SS) 1-3 were then randomly selected by balloting The number of selected schools total
number of students in a school and the number of students selected per school is outlined in
Table II
Table II Selected schools and number of students in each of the ten schools in Jalingo
Selected schools Total no of No of students
39
student in the
school (a)
n=8107
selected (n=abxc)
n=1350
Public schools
Govt Science Secondary School 2800 466
Govt Day Secondary School SGari 1200 200
Salisu Dogo Secondary School 1100 183
Govt Secondary School Magami 840 140
Total 5940 989
Private schools
Winners Comprehensive Secondary School 650 108
Hawai Secondary School 562 94
Centre for Quranic Science and Islamic Education 543 90
Good Success Secondary School 155 26
Jetters Academy 140 23
Yagai Academy 117 20
Total 2167 361
The study
The first contact with the students was a familiarization exercise to each of the schools during
which the teachers and students were given a talk by the researcher on blood pressure and the
40
importance of periodic blood pressure measurement They were given the opportunity to ask
questions which were responded to Both the students and their teachers actively participated
in the lectures
On the second day students were selected as described above and those selected
underwent general physical examination in the presence of a chaperon to identify those
who did not fulfilled the inclusion criteria Each selected student was given a proforma
(Appendix 1) in which information on their biodata and medical history were recorded
Other information obtained was parentrsquos medical history and their socioeconomic status
using the format described by Olusanya Okpere and Ezimokhai117 (Appendix 3) The
study was carried out in a relatively quiet and empty classroom to ensure privacy for both
male and female students The procedure for blood pressure measurement was
demonstrated on one of the research assistants and sometimes on one of the teachers by
the researcher to assure the students and allay their anxiety BP and anthropometric values
obtained were recorded in the study proforma An average of 15-20 students per day were
attended to over a period of 3-4 hours (between 8am - 12noon daily) by the researcher
one of the research assistants who is a medical officer a male nurse and a lady Youth
Corper (NYSC)
Blood pressure measurement
This was measured by the researcher and the research assistant (the medical officer) The
standard auscultation method was employed using a mercury sphygmomanometer (Acosson)
and a standard Littman stethoscope according to the guideline of the fourth report on the
diagnosis evaluation and treatment of hypertension in children and adolescents8 Each
students was rest-seated for 5 minutes before BP measurement With the student seated the
right arm rested on a table at the level of the heart an appropriate cuff size which covered
41
two-third (23rd) of the length of the arm was applied round the arm about 2cm above the
antecubital fossa Two cuff sizes were used for this study with dimensions of 10 x 24cm and
13 x 30cm the smaller cuff for the smaller adolescents and vice versa The bladder cuff was
inflated rapidly to 20-30mmHg above the point where the brachial artery was no longer
palpable The bell of the stethoscope was then placed over the brachial artery and the cuff
was deflated slowly at 2-5mmHgsecond while listening to the Korotkoff sounds Phases one
and five of the Korotkoff sounds were recorded as the systolic and diastolic BP
respectively119 Three recordings were taken at intervals of 3-5 minutes and the average was
the final BP in mmHg BP was interpreted based on the standard set by the fourth report on
the diagnosis evaluation and treatment of hypertension in children and adolescents of the
United States8 thus-
Normal BP ndash BP value between the 5th and lt 90th percentile for age sex and height
Prehypertension - BP value between the 90th and the lt95th percentile for age sex and height
or BP of 12080mmHg but less than the 95th percentile
Hypertension ndash BP value ge95th percentile for age sex and height
Students found to have prehypertension were educated and counseled on life style
modifications and the need to have their blood pressure checked in six monthsrsquo time and
annually subsequently Those with hypertension were educated on the implications of the
findings and were referred to the Federal Medical Center Jalingo for evaluation management
and follow-up
Height measurement
Height was measured in centimeters using a locally constructed stadiometer by the research
assistants Each student was measured barefooted standing with the heel back and occiput
42
against the stadiometre The head was held straight looking forward with the lower border of
the eye socket at a horizontal plane with that of the external auditory meatus The movable
part of the stadiometre was adjusted to rest on the vertex and the corresponding value read to
the nearest 01cm
Weight measurement
The weight was measured in kilograms by the researcher and the research assistants using a
bathroom scale (HANSON) Students were weighed in their approved school uniform
without caps head ties or cardigan and with their shoes removed The scale was checked
daily for accuracy using standard calibrated weight before and midway through each session
The weight of the student was measured to the nearest 01 kg
Body mass index (BMI)
This was calculated from the measured weight and height of the subject using the
formula118
BMI= Weight (kg) Height (m2)
Waist circumference measurement
WC was measured in centimeters using a measuring tape by the research assistants The
male assistant measured for boys and the lady Youth Corper measured for girls
Measurement was taken with the student standing completely relax and breathing
normally Clothing was pulled up or down and an inelastic measuring tape was placed
around the waist mid-way between the iliac crest and the lowest rib margin The ends of
the tape were pulled together lightly towards each other and the value read to the nearest
01cm117120
43
Data analysis
Data obtained were analyzed using Epi-Info statistical software package version 7 The
results obtained were presented in figures tables graphs and charts as appropriate Individual
mean BP levels were used as dependent variables and other measured variables as
independent variables The means and standard deviations were used to summarize
quantitative variables such as BP weight height waist circumference and BMI The chi-
squared test was used to test the significance of associations between categorical variables
Studentrsquos t-test was used to compare means of any two normally distributed continuous
variables Pearsonrsquos correlation coefficient and regression analysis were used to examine the
strength of association between BP and the anthropometries Probability level of statistical
significance value was set at lt005
RESULTS
General characteristics
A total of 1350 students were enrolled between January and June 2014 to determine their
blood pressure pattern 628 (465) were males and 722 (535) were females with
malefemale ratio of 111 Students enrolled in the study were drawn from both public and
44
private schools The number of students from public schools was 989 (733) while 361
(267) were from private schools as shown in Table II The mean age of the study subjects
was 153plusmn22 years with a range of 10-19 years The age and sex distribution of the students
is illustrated in Table III
Table III Age and sex distribution of 1350 study subjects in Jalingo
Ag
e
Male
n ()
Female
n ()
Total
N()
10 9(14) 13(18) 22 (16)
11 20(32) 31(43) 51(38)
12 36(57) 52(72) 88(65)
13 96(153) 85(118) 181(134)
14 92(146) 115(158) 207(153)
15 92(146) 111(154) 203(151)
16 66(105) 116(161) 182(135)
17 78(125) 91(126) 169(125)
18 79(126) 70(97) 149(110)
19 60(96) 38(53) 98(73)
To
tal
628(100) 722(100) 1350(100)
45
Socio-economic classes (SEC) ndash Most of the students were from the lower social classes
(4 and 5) with population of 650 (415 and 235) students The upper social classes (1 and
2) had the least population with 184 (62 and122) students The middle social class (3) had
516 students The distribution of the study subjects according to individual
socioeconomic class is shown in Figure I
Figure 1 Socioeconomic class distribution of students in Jalingo
Anthropometry
The anthropometric characteristics of the students are displayed in Tables IV V and VI
All the anthropometric parameters showed increasing values with age (Tables V and VI)
There were significant differences in the anthropometric indices of height (p=0000)
weight (p=0010) and body mass index (p=0000) between boys and girls but not
statistically significant for waist circumference (p=0145) as shown in Table IV
Weight ndash The mean weight of the students was 486plusmn109kg with a range of 23-100kg
(Table IV) Girls were heavier than boys up to middle adolescence after which males
46
were heavier than the females (Table V and VI) and this was statistically significant (t= -
256 p=0010)
Table IV Overall mean anthropometric measurements of the study subjects
Anthropometr
y
Male Female Total
n=628 n=722 N=1350 t p
Wt (kg)
Mean(plusmnSD) 4773(115
)
4926(103
)
4855(plusmn109
)
-
25
6
0007
Range 236-848 227-100 23-100
Ht (m)
Mean(plusmnSD) 159(012) 157(008) 158(plusmn010) 35
5
0000
Range 122-185 126-179 122-185
WC (cm)
Mean(plusmnSD) 6524(91) 6595(86) 6562(plusmn89) -
14
6
0145
Range 225-905 215-100 22-100
47
BMI (kgm2)
Mean(plusmnSD) 1825(27) 1947(33) 1891(plusmn31) -
74
1
0000
Range 117-325 114-42 114-42
Statistically significant p values at 005 level of significance Wt=Weight Ht=Height WC=Waist
Circumference BMI=Body Mass Index SD=Standard Deviation
Height- The mean height of the study population was 158plusmn09m and ranged from 122-
185m (Table IV) Girls were taller than boys at early and middle adolescence but these
reversed from 16 years in favour of the boys (Table V and VI) This differences was
statistically significant (t=448 p=0000)
Waist circumference (WC) - The overall mean waist circumference was 6562plusmn89cm and
a range of 225-100cm Girls had higher WC until late adolescence (18 years) when it
reversed but this was not statistically significant (t=-146 p=0145) This is displayed in
Tables IV V and VI
Body Mass Index (BMI) - Overall mean BMI was 189plusmn31 with a range of 114-42
There was a statistically significant difference between girls and boys (t=-741 p=0000)
Tables IV V and VI illustrate this findings
Table V Mean anthropometric measurements of 628 boys
Age No of
studen
ts
Wt(plusmnSD)
Kg
Ht(plusmnSD)
m
WC(plusmnSD)
cm
BMI(plusmnSD)
Kgm2)
48
10 9 349(50) 143(001
)
613(06) 169(01)
11 20 354(25) 143(002
)
617(13) 170(07)
12 36 363(51) 146(002
)
616(14) 167(06)
13 96 379(51) 150(003
)
602(40) 165(08)
14 92 412(50) 154(003
)
623(32) 169(08)
15 92 471(60) 160(003
)
634(39) 178(08)
16 66 525(52) 164(002
)
672(24) 192(09)
17 78 555(51) 167(002
)
680(31) 197(08)
18 79 576(61) 169(002
)
707(18) 200(08)
19 60 590(57) 170(002
)
716(16) 203(07)
Total 628 477(115 16(01) 652(91) 183(27)
49
)
Wt=Weight Ht=Height WC=Waist Circumference BMI=Body Mass Index SD=Standard Deviation
Table VI Mean anthropometric measurements of 722 girls
Age No of
students
Wt(plusmnSD)
Kg
Ht(plusmnSD)
m
WC(plusmnSD)
cm
BMI(plusmnSD)
Kgm2
10 13 313(34) 139(001) 582(05) 156(02)
11 31 361(53) 144(002) 611(12) 170(05)
12 52 403(64) 149(002) 625(21) 178(09)
13 85 458(66) 154(002) 657(22) 188(12)
14 115 478(74) 157(003) 627(48) 187(10)
15 111 508(65) 159(002) 666(34) 199(13)
16 116 521(60) 159(002) 678(28) 201(11)
17 91 541(62) 161(002) 681(28) 203(11)
18 70 556(63) 161(002) 696(21) 211(11)
19 38 540(48) 158(002) 688(14) 208(06)
Total 722 493(103) 16(010) 651(23) 190(09)
Wt=Weight Ht=Height WC=Waist circumference BMI=Body Mass Index SD=Standard Deviation
Blood pressure (BP) measurements
50
Table VII shows mean blood pressure distribution of the study population for all ages
The highest SBP and DBP were 165mmHg and 95mmHg at 18years and 15 years
respectively Table VIII displays mean BP distribution in relation to age and sex The
tables show that both systolic and diastolic blood pressure increased with age This is also
depicted in Figure 2
Table VII Mean and ranges of blood pressure of 1350 subjects
Systolic Blood Pressure
(mmHg)
Diastolic Blood Pressure
(mmHg)
Age
No of
students
Mean(plusmnSD) Range
Mean(plusmnSD) Range
10 22 936(74) 80-107 600(50) 47-70
11 51 992(106) 76-120 629(71) 47-83
12 88 1036(110) 80-140 657(60) 53-82
13 181 1042(108) 80-143 660(74) 48-88
14 207 1070(115) 83-150 675(76) 47-90
15 203 1090(119) 80-150 678(82) 47-95
16 182 1122(124) 80-150 696(80) 50-90
51
17 169 1132(118) 90-153 698(83) 48-93
18 149 1138(121) 90-165 712(88) 50-90
19 98 1131(127) 90-143 726(76) 57-90
Total 1350 1089(125) 76-165 683(82) 47-95
Table VIII Mean blood pressure in relation to age and sex
Mean(plusmnSD) Systolic blood pressure
(mmHg)
Mean(plusmnSD) Diastolic blood
pressure (mmHg)
A
ge
Male
n=628
Female
n=722
t p Male
n=62
8
Fema
le
n=72
2
t p
52
10 954(3
9)
923(6
0)
1
02
03
20
619(
32)
586(
46)
1
36
0
01
91
11 985(5
5)
997(9
2)
0
42
0
06
80
648(
39)
617(
57)
1
56
0
01
26
12 999(8
9)
1062(
117)
2
84
0
00
06
653(
29)
660(
52)
-
0
52
0
06
07
13 1012(
73)
1075(
73)
4
03
4
00
00
649(
43)
672(
59)
-
0
03
0
00
44
14 1036(
78)
1098(
78)
3
93
0
00
01
653(
44)
693(
58)
3
90
0
00
01
15 1071(
80)
1105(
87)
2
05
0
00
42
665(
58)
689(
56)
-
2
10
0
00
37
16 1135(
82)
1114(
91)
1
03
0
03
10
697(
51)
695(
61)
0
15
0
08
81
53
17 1152(
87)
1115(
77)
2
04
00
43
698(
59)
698(
58)
0
02
0
09
81
18 1141(
96)
1135(
74)
0
27
0
07
91
704(
62)
721(
63)
1
61
0
02
49
19 1146(
97)
1108(
80)
1
41
0
01
64
733(
63)
714(
43)
1
21
0
02
28
To
tal
1081(
133)
1095(
117)
-
2
05
4
00
40
678(
81)
687(
82)
-
2
07
7
00
38
Statistically significant p values at 005 levels of significance
54
Figure 2 Blood pressure distribution in relation to age and sex
SBP =Systolic blood pressure DBP=Diastolic blood pressure
Blood pressure and stages of adolescence
Table IX displays mean blood pressure according to stages of adolescence Girls had a
higher mean SBP than boys from early adolescence (t=3754 p=0000) to middle
adolescence (t=-3025 p=0003) and this was statistically significant This dominance was
also demonstrated in the DBP and was statistically significant in middle adolescence (t=-
3517 plt0000) Adolescents from private schools had higher mean SBP (t=-222
plt0027) and mean DBP (t=-461 p=0000) than those from public schools and these
differences were statistically significant
Table IX Mean blood pressure according to sex and stages of adolescence
Mean BP
(mmHg)
Age (years)
Male SBP
Female SBP
Male DBP
Female DBP
55
Stages
of
adolesc
ents
(years)
Mean(plusmnSD) systolic blood pressure
(mmHg)
Mean(plusmnSD) diastolic blood pressure
(mmHg)
Male Female t p Male Fema
le
t p
Early
(10-13)
1000(9
6)
1040(1
18)
37
54
00
00
648(
56)
653(
82)
05
99
05
50
Middle
(14-16)
1075(1
29)
1105(1
13)
-
30
25
00
03
670(
81)
694(
77)
-
35
17
00
00
Late
(17-19)
1140(1
28)
1121(1
11)
21
45
00
33
717(
85)
710(
83)
00
70
09
45
1082(1
33)
1092(1
17)
-
20
54
00
40
678(
81)
687(
82)
-
20
77
00
38
Statistically significant p values at 005 level of significance SD=Standard Deviation
Table X shows blood pressure pattern according to stages of adolescence
Prehypertension and hypertension were more prevalent in late adolescence than early and
middle adolescence (χ2=49054 p=0000) and (χ2=10305 p=0006) both of which were
statistically significant
Table X The pattern of normal BP Prehypertension and hypertension according to stages
of adolescence
56
Blood
pressure
pattern
Stages of adolescence
Early
n()
Middle
n()
Late
n()
Total
N()
χ2 p
Normal 290(84
8)
428(72
3)
275(66
1)
993(73
5)
429
79
000
0
prehypertens
ion
43(12
6)
135(22
8)
120(28
8)
298(22
1)
490
54
000
0
Hypertensio
n
9(26) 29(49) 21(51) 59(44) 103
05
000
6
342(10
0)
592(10
0)
416(10
0)
1350(1
00)
350
93
000
0
Statistically significant p value at 005 level of significance
Relationship between blood pressure and the measured anthropometry
There was a positive correlation between SBP and DBP with age and the anthropometric
variables of weight height waist circumference and BMI (Table XI) SBP showed a
stronger correlation with the anthropometries than the DBP and was stronger for weight
(r=051) and height (r=044) The waist circumference though statistically significant
showed the weakest correlation
Table XI Correlation between blood pressure age (yrs) and anthropometry
Parameters
Systolic Blood Pressure Diastolic Blood Pressure
Correlation
coefficient
p Correlation
coefficient
p
57
Age (yrs) 035 lt0000 030 lt0000
Height (m) 044 lt0000 034 lt0000
Weight (Kg) 051 lt0000 038 lt0000
WC (cm) 040 lt0000 029 lt0000
BMI
(Kgm2)
031 lt0000 023 lt0000
Statistically significant p values at 005 level of significance Wt=Weight Ht=Height WC=Waist
circumference BMI=Body Mass Index
Blood pressure distribution and socio-economic classes
Table XII shows mean blood pressure according to socio-economic class of the subjects
Lower social classes had higher mean SBP (t=1650 p=2850) and DBP (t=0193
p=00058) but these were not statistically significant
Table XII Mean Blood pressure in relation to socioeconomic classes
Blood
pressur
e
Socioeconomic classes
Upper (1 amp
2) n=184
Middle (3)
n=516
Lower (4 amp
5)
n=650
f(anova
)
p
Mean
(SD)
10857(126
)
10866(128
)
11040(109
)
1650 285
0
58
SBP
Mean
(DBP)
6820(83) 6791(83) 6957(76) 0193 005
8
SEC= Socioeconomic class SBP=Systolic Blood Pressure DBP=Diastolic Blood Pressure SD=Standard
Deviation
Table XIII shows blood pressure pattern in relation to socioeconomic classes of the
subjects The percentage of students with prehypertension was higher in the upper social
class ((χ2=3067 p=0216) while the percentage of hypertension were higher in the lower
socioeconomic classes (χ2=1037 p=0568) but these differences were not statistically
significant
Table XIII Blood pressure pattern in relation to socioeconomic status
Blood
pressure
pattern
Socioeconomic classes
Upper
(1 amp 2)
n()
Middle
(3)
n()
Lower
(4 amp 5)
n()
Total
N()
χ2 p
Normal 127(69
)
383(74
2)
483(74
3)
993(73
6)
417
6
012
4
Prehypertens
ion
52(28
3)
108(20
9)
138(21
2)
298(22
1)
306
7
021
6
Hypertension 5(27) 25(48) 29(45) 59(44) 103 056
59
7 8
184(10
0)
516(10
0)
650(10
0)
1350(10
0)
573
0
022
0
Prevalence of Hypertension and Prehypertension
Table XIV shows the prevalence of hypertension in the study population The total
number of students with hypertension was 59 giving an overall prevalence of 44
Thirty four students (25) had systolic hypertension sixteen (12) had diastolic
hypertension and nine students (07) had both systolic and diastolic hypertension
Systolic hypertension was more prevalent in the females and was more at the age of 16
years while diastolic hypertension was higher in males and this also occurred at 16 years
Among those with hypertension 27 and 16 subjects had stage 1 and 2 systolic
hypertension respectively With regard to diastolic hypertension 24 and 1 subjects had
stage 1 and 2 hypertension respectively The gender difference in the prevalence of
hypertension is not statistically significant (χ2=0831 p=0362)
The number of students with pre-hypertension was 298 giving an overall prevalence of
221 Of this 131 were males and 167 are females This is illustrated in Table XIV
Prehypertension is more prevalent in females than males and this was statistically
significant (χ2=4349 p=0037)
60
Table XIV Overall Blood pressure pattern and prevalence of hypertension and
prehypertension of 1350 students in Jalingo
Blood pressure
pattern
Males
n=()
Females
n=()
Total
N()
χ2 p
Normal 471(750) 522(723) 993(735) 2619 0106
Prehypertension 131(209) 167(231) 298(221) 4349 0037
Hypertension 26(41) 33(46) 59(44) 0831 0362
628(100) 722(100) 1350(100) 1260 0533
statistically significant p value at 005 level of significance
61
DISCUSSION
The findings of this study showed that the BP of secondary school adolescents in Jalingo
was similar in terms of mean values range and trend of progression with age to that of
other adolescents from Ibadan63 and Kogi60 (Nigeria) Ashanti (Ghana)59 and Lebanon54
The mean value was however lower than the mean BP of adolescents from Zaria
(Nigeria)21 Belgrade ( Serbia)78 and Fortaleza-Cearaacute (Brazil)83 who had higher mean BP
in both sexes and at all ages The lower mean BP in this study compared to that of
adolescents from Zaria21 Belgrade78 and Brazil83 could be due to lower mean
anthropometry of weight height and BMI in adolescents from Jalingo resulting in lower
mean BP The sample sizes of these studies7883 were also different and could have
affected the mean BP of the study population For instance the sample size in the
Brazilian study83 is 151 compared to the study in Lebanon54 with 5710 subjects The use
of the fifth Korotkoff sounds as DBP in this study21 could also have accounted for the
lower mean BP in contrast to a similar study in Zaria21 where the fourth Korotkoff sound
was used as the DBP
A progressive increase in blood pressure with age was found in this study This
was similar to most findings by researchers in Nigeria 215358-606566107 and
worldwide54555961 The peak age of rise in BP in this study was in middle adolescence
between 15-16 years in boys but much earlier in girls for both systolic and diastolic BP
This was similar to the study by Akinkugbe Akinwolere and Kayode56 in Ibadan and
Ejeke Ugwu and Ezeanyika et al60 in Lokoja This age group is usually the period of
onset of puberty The chronologic age is not the main factor responsible for BP increase
62
with age but rather the progressive increase in size of the individual Increase in body
size with growth and maturity of organs associated with the physical and hormonal
changes during puberty potentially lead to increasing BP The simultaneous increase in
weight height and other anthropometric indices alongside BP with age seen in this study
and others is in agreement with that The implication of this increase in blood pressure
with age is that those with prehypertensionhypertension in childhood may continue into
adulthood hence further increasing the high prevalence of hypertension in the adult
population with its attendant morbidity disability and mortality
Overall significant higher mean BP was recorded in girls than boys in this study
This was seen from early to middle adolescence after which it reversed in favour of the
boys Reports on the relationship between BP and sex have been inconsistent Some have
reported higher mean BP in females54-56 others higher in males5883 while yet another
reported no sex differences22 The findings of this study were similar to those of Bugaje
Yakubu and Ogala21 and Ujunwa Ikefuna and Nwokocha100 who reported a consistently
higher mean blood pressure in female adolescents up to 16 years compared to their male
counterparts of similar ages Early female predominance in mean blood pressure was also
reports by Agyemang Redekop and Owusu-Dabo et al59 in Ashanti adolescents in Ghana
and Obika Adedoyin and Olowoyeye22 in Illorin The finding was however in contrast
with the study in Calabar58 where higher mean BP was found in boys than girls at all
ages The reason for the higher mean BP in females than boys could be because of earlier
onset of puberty in girls The differences in blood pressure between boys and girls in this
study could also be accounted for by variation in the anthropometric variables of the
individuals as girls were seen to be heavier and taller up to middle adolescence
This study demonstrated a consistently positive relationship between blood
pressure and the anthropometric variables of weight height body mass index and waist
63
circumference as widely reported in other studies 545558-6165107100 Weight is reported to
correlate positively with blood pressure in several studies53565871 Body mass index
(BMI) also showed a positive relation with BP in this study as reported in other
studies5978-81 This is in-keeping with the findings in Port Hacourt71 Abeokuta83 the
Gambia69 Brazil82 and Belgrade77 children Some of these studies however were made
up of younger and older age groups Even in lean populations BMI is known to correlate
positively with BP Waist circumference was also found in this study to correlate
positively with BP This was similar to reports from other studies79-8183 It was found to
be a better predictor of BP in two Italian study8081 while it was not in another82
Comparing BMI and waist circumference and their effects on BP Arauzo Lopes and
Moriera et al82 in Brazilian children found BMI to be a better predictor of BP than waist
circumference This was similar to the report by Sebanjo and Oshikoya83 in Nigerian
adolescents in Akure Guagnano Ballone and Colagrande et al81 however found waist
circumference to be better than BMI The study81 however involved adults and may not
be applicable in children and adolescents The present study demonstrated BMI and WC
to be significant but found BMI to be a better determinant of BP than waist
circumference BMI and waist circumference measure obesity in an individual Whereas
BMI is a measure of overall obesity WC measures centralabdominal fat accumulation
and thus said to be more predictive of adverse health risk79 Obese individuals may be
prone to such condition as dyslipidaemia insulin resistance and hypertension with
reduction in the quality of life Weight BMI and or waist circumference affects blood
pressure through decreased physical activity increased cardiac output insulin resistance
impaired pulmonary function and other hormonal abnormalities8084 It seems therefore
that BMI is a better predictor of BP in adolescents than waist circumference The reason
64
for this is not obvious but it may be because of the nature of uniform fat distribution in
adolescents associated with growth and hormonal changes at puberty
Blood pressure distribution in relation to the parental socio-economic class in this
study showed that students from low socio-economic classes had higher mean blood
pressure than those from upper socioeconomic classes but this was not statistically
significant A study in Ibadanl56 reported a statistically significant negative relation
between blood pressure and parental socio-economic status It was also similar to the
study58 in Calabar In contrast other studies found the reverse536022 The reasons for the
inverse relationship between BP and socioeconomic includes exposure to chronic
environmental stress with sustained sympathetic nervous system stimulation Others are
poor health seeking behaviours due to low income andor inadequate health knowledge
high low birth weight rate and inadequate healthy diets among others97101 In the same
environment individuals from a high social class are believed to be more educated with
high income61 They have easy access to health education and awareness on hypertension
prevention and control and better accessibility and adherence to medical treatment617374
The former might be responsible for the finding of this study as Jalingo is a semi urban
community Most of its inhabitants are subsistent farmers civil servants and traders with
low income The high number of students in the lower socioeconomic class lays credence
to that
The overall point prevalence of hypertension in this study was 44 while that of
pre-hypertension was 221 This prevalence of hypertension is similar to the prevalence
of 48 by Antia-Obong and Antia-Obong107 but higher than the prevalence rate of 37
reported in Zaria21 and lower than the prevalence of 58 reported in Ibadan56 54 in
Enugu100 and the 72 reported in Kano65 The prevalence of pre-hypertension was lower
than that reported by Ejeke Ugwu and Ezeanyika99 who found a prehypertensive
65
prevalence of 25 among adolescents in Lokoja It is higher than the 173 reported by
Ujunwa Ikefuna and Nwokocha et al100 in Enugu and 12-17 by Redwine and
Daniels96 among US adolescents The differences in the reported prevalence of
hypertension and prehypertension in adolescents could have resulted from the different
criteria applied by the various researchers in defining hypertension For instance whereas
this study used BP greater than 95th percentile as hypertension a study in Kano65 used the
adult hypertensive value of BPgt14090mmHg as hypertension and got a prevalence of
72 The prevalence in that study65 could have been higher if the percentile or the
statistical definition was used as many children with BP 14090mmHg would probably be
at stage 2 hypertension This was demonstrated in the study by Bugaje Yakubu and
Ogala21 who found a prevalence of hypertension in their study to be 06 when the adult
cut off value of gt14090mmHg was used but it increased to 37 when the statistical
definition of BPgt 2 standard deviations was used
The number of times blood pressure is taken could affect the outcome as repeated
measurements over a time interval is known to give lower BP values than if BP is taken
once This study used the average of three blood pressure values taken at one sitting but
Ujunwa Ekefuna and Nwokocha100 took three readings at five minutes interval with two
other readings at a week interval In that study100 the prevalence of prehypertension
dropped from 745 during the first set of readings to 173 after the third week
readings The prevalence of hypertension also dropped from 135 to 54 over the same
period Similar decrease in the prevalence of both prehypertension and hypertension was
reported by Redwine and Daniels96 in US adolescents when blood pressure was taken
over time interval Another factor which might have affected the overall prevalence is the
Korotkoff sound used for diastolic pressure23 The 4th or 5th Korotkoff sounds has been
used by different researchers resulting in different diastolic BP The study21 in Zaria used
66
the 4th Korotkoff sound while most other researchers2265100 used the 5th About 5-
10mmHg difference is said to exist between the 4th and 5th Korotkoff sounds230 In this
study the 5th Korotkoff sound was used thus giving a higher prevalence of hypertension
in the studied population than in those where the 4th sound was used
The implication of the outcome of this study is that 44 of adolescents in Jalingo
are already hypertensive while 221 of them are at risk of developing hypertension as
they are pre-hypertensive Since 856 (255 of 298) of the prehypertensives were in the
middle and late adolescence these individuals are likely to be adults with high blood
pressure Therefore regular screening of this group of individuals who were assumed to
be a healthy population is highly important for early detection of hypertension and
intervention such as life style changes and treatment
67
CONCLUSIONS
The following conclusions can be made from this study
1 The mean and range of blood pressure of adolescents in Jalingo was similar to
those of other adolescents in Nigeria and other parts of the world Blood pressure
increased progressively with age
2 All measured anthropometry of weight height body mass index and waist
circumference correlated positively with BP but weight was the most significant
variable in BP determination
3 Socioeconomic status was not significantly related with blood pressure
4 The point prevalence of hypertension and pre-hypertension was 44 and 221
respectively using a recommended definition
RECOMMENDATIONS
1 In view of the high prevalence of prehypertension in this study it is recommended
that students should have their blood pressure measured at school entry as this will
68
help identify those with abnormal BP for early intervention Thereafter BP check
should be offered at least once a year at the beginning of a new session especially for
those found with abnormal BP at school entry
2 Physical and health education should be revived in all the schools This will lead to
increased physical activity and reduced risk of obesity and its consequences
3 School health programmes should be strengthened in schools where it already exist
and effort made to establish same in schools where it is yet to exist The programme
should include measures to detect early prehypertension and hypertension and other
health related needs of the students
LIMITATIONS
The following limitations were encountered in the course of the study
1 Exclusion and inclusion of students that were based on volunteered information and
physical evaluation This could have led to inclusion andor exclusion of adolescentss
69
with or without background renal diseases which could have affected the result of this
study
2 Home blood pressure measurement especially early morning measurement for those
with high blood pressure to possibly eliminate the effect of stress traffic andor
trekking and other school related stresses which may affect blood pressure during the
day
LINES OF FUTURE RESEARCH
This study was questionnaire based and time bound Consequently students were not
investigated for background diseases co-mordid conditions target organ damage or risk
factors for high blood pressure They were also not followed up In view of this future
research on blood pressure in adolescents should include-
70
1 Investigations such as urinalysis electrolytes urea and creatinine random blood
sugar (RBS) lipid profile and echocardiography as part of blood pressure evaluation
in adolescents
2 A long period of study to allow for follow-up over months or years to identify those
that are truly hypertensive considering the definition of hypertension It will also
reveal the rate of progression from pre-hypertension to hypertension
3 Risk factors evaluation for high blood pressure including genetic predispositions
REFERENCES
1 Blood pressure from Wikipedia the free Error Hyperlink reference not valid
Accessed 24th November 2011
2 Pickering TG Hall JE Appel LJ Falkner BE Graves J Hill MN Jones DW Kurtz T
Sheps SG Roccella EJ Recommendations for blood pressure measurement in humans
and experimental animals Part 1 Blood pressure measurement in humans A
statement for professionals from the subcommittee of professional and public
71
education of the American Heart Association council on high blood pressure research
Hypertension 2005 45 142-61
3 da Silva IRR de Souza MDG de Camargo CAC Blood pressure measurement in
children and adolescents Guidelines of high blood pressure recommendations and
current clinical practice Arq Bras Cardiol 2007 88 434-7
4 Sinaiko AR Hypertension in children N Engl J Med 1996 3351968-73
5 US Preventive Services Task Force Screening for high blood pressure
recommendations and rationale Am J Prev Med 2003 25 159-64
6 Report of the second task force on blood pressure control in children Pediatrics 1987
79 1-25
7 National high blood pressure education programme working group on hypertension
control in children and adolescents update on the 1987 task force report on high blood
pressure in children and adolescents A working group report from the national high
blood pressure education program Pediatrics 1996 98 649-58
8 National high blood pressure education program working group on high blood
pressure in children and adolescents The fourth report on the diagnosis evaluation
and treatment of high blood pressure in children and adolescents Pediatrics 2004
114 255-76
9 Aderele WI Seriki O Hypertension in Nigerian children Arch Dis Child 1974
49313-7
10 Bo S Gambino R Gentile L Pagano G Rosato R Saracco GM Cassader M
Durazzo M Cavallo-Perin P High-normal blood pressure is associated with a cluster
of cardiovascular and metabolic risk factors a population based study J Hypertens
2009 27 102-8
72
11 Bao W Threefoot SA Srinivasan SR Berenson GS Essential hypertension
predicted by tracking of elevated blood pressure from childhood to adulthood The
Bogalusa Heart Study Am J Hypertens 1995 8 657- 65
12 Richard A Rodgers M Hedley AJ Mitchel JRA Changes in blood pressure and
blood lipid during adolescence BMJ 1980 28 1563-6
13 Sundstroumlm J Neovius M Tynelius P Rasmussen F Association of blood pressure in
late adolescence with subsequent mortality cohort study of Swedish male conscripts
BMJ 2011 342 643-8
14 Zimmet P Alberti G Kaufman F Tajima N Silink M Arslanian S Wong S Bennett
P Shaw J Caprio S On behalf of the International Diabetes Federation Task Force on
Epidemiology and Prevention of Diabetes The metabolic syndrome in children and
adolescents the IDF consensus Diabetic Voice 20075229-32
15 Abdulrahman FA Babaoye AA Childhood hypertension in northern Nigeria West
Afr J Med 1978 1 7-11
16 Adediran O Jimoh A Di M Relationship between body mass index and blood
pressure in rural Nigerian dwellers Internet J Nutri Wellness 2009 7 431-4
17 World Health Organization (WHO)UNICEF Adolescence at a glance 2003 p 2
18 The National Population Commission constitution of the Federal Republic of Nigeria
(AP 23 LFN) legal notice on publication issued April 21st 2007
19 Heald FP and Gong EJ Diet Nutrition and adolescents In Shils ME and Ross AC
(eds) Modern Nutrition in Health and Disease 9th ed William and Wilkins
Maryland USA 1999 p 32
20 Okonkon CT The prevalence of Hypertension among civil servants in Calabar Nig
Med J 1979 7422-5
21 Bugaje MA Yakubu AM Ogala WN Prevalence of adolescent hypertension in Zaria
Nig J Paediatr 2005 32 77-82
73
22 Obika LF Adedoyin MA Olowoyeye JO Pattern of paediatric blood pressure in
rural semi urban and urban communities in Ilorin Nigeria Afri J Med Sci 1995 24
371-7
23 Jeremy B A short history of blood pressure measurement section of the history of
medicine Proc Roy Soc Med 1977 70 793-9
24 Lewis O Stephen Hales and the measurement of blood pressure J Hum Hypertens
1994 8 865-71
25 Crile GW Blood Pressure in Surgery An experimental and Clinical Research
Philadelphia Lippincott 1903 p 358
26 Lewis WH The evolution of clinical sphygmomanometer Bull N Y Acad Med 1941
17 871-81
27 Browne WC OrsquoBrien ET Semple PF The sphygmomanometer of Riva Roci 1896-
1996 J Hum Hypertens 1994 610 723-4
28 Segal HN How Korotkoff the Surgeon discovered the auscultatory method of
measuring arterial pressure Ann Intern Med1975 83 561-2
29 Goodman FH and Howell AA Clinical studies in the auscultatory method of
determining blood pressure University of Pennsylvania Bulletin 1911 23 469-75
30 Crenner CW Introduction of the blood pressure cuff into US medical practice
technology and skilled practice Ann Intern Med 1998 128 488-493
31 Ganon WF Circulation In Review of Medical Physiol Lange Medical Publication
New York 22nd edition 2005 p 234-63
32 Beth C Homeostatic Regulation of Blood pressure Available from
URLhttpwwweHowcom Accessed on 1st December 2011
33 Rajinder KG Fahim M Regulation of cardiovascular functions during acute blood
loss Indian J Physiol Pharmacol 2005 49 213ndash9
74
34 Dampney AL Coleman MJ Fonts MAP Hirooka Y Horiuchi J Polson JW Potts
PD Tagawa T Central mechanisms underlying short-term and long-term regulation
of the cardiovascular system Proc Austr Physio Pharmacosociety 2001 32 333-44
35 Koshiya N Guyenet PG Noradrenergic neurons and the carotid sympathetic
chemoreflex Am J Physiol 1994 267 519-26
36 Prakash ES The ultimate goal in neural regulation of cardiovascular function Adv
Phyiol Educ 2008 32 107-8
37 Allen AM Inhibition of the hypothalamic paraventricular nucleus reduces
sympathetic nerve discharge and blood pressure Proc Austr Neuroscience Society
2001 29 44-7
38 Reid IA Interactions between ANG II sympathetic nervous system and
baroreceptor reflexes in regulation of blood pressure Am J Physiol 1992 262 763-
78
39 Brooks VL Osborn JW Hormonal-sympathetic interactions in long-term
regulation of arterial pressure A hypothesis Am J Physiol 1995 268 1343-58
40 Reckelhoff JF Gender Differences in the Regulation of Blood Pressure
Hypertension 2001 37 1199-208
41 Fink GD The systemic circulation as a regulated free-market economy A new
approach for understanding the long-term control of blood pressure Clin Exp
Pharmacol Physiol 2005 32 377ndash83
42 Benard K Sources of error in blood pressure measurement Hospital Physician 2002
12 33-7 Available from URLhttp wwwturnerwhitecom
43 Chyun DA A comparism of intra arterial and auscultatory blood pressure readings
Heart lung 1985 14 223-31
75
44 Nwankwo MU Lorenz JM Gardiner JC A Standard Protocol for Blood Pressure
Measurement in the Newborn Pediatrics 1997 99 1342-9
45 Deakin CD Low JL Accuracy of the advanced trauma life support guidelines for
predicting systolic blood pressure using carotid femoral and radial pulses
observational study BMJ 2000 321 673ndash4
46 OrsquoBrian E Replacing mercury sphygmomanometers require clinician to demand
better automated device BMJ 2000 320 815-6
47 McKay DW Raju MK Campbell NR Assessment of blood pressure measuring
techniques Med Educ 1992 26 208ndash12
48 Baker RH Ende J Confounders of auscultatory blood pressure measurement J Gen
Intern Med 1995 10 223ndash31
49 Neufeld PD Johnson DL Observer error in blood pressure measurement CMAJ
1986 135 633ndash7
50 van Montfrans GA Oscillometric blood pressure measurement progress and
problems Blood Press Monit 2001 6 287ndash90
51 Ware RW Laenger CJ Indirect blood pressure measurement by Doppler ultrasonic
kinetoartriography Proceedings 20th Annual Conference Engineering Medical
Biology 1967 9 27-30
52 Matthew Fox Blood pressure measurement technique Available from URL http
wwwlivestrongcom Last edited 2nd September 2010 Accessed on 30th November
2011
53 Akor F Okolo SN Okolo AA Blood pressure and anthropometric measurements in
healthy Primary School entrants in Jos Nigeria SAJCH 2010 4 42-5
54 Merhi BM Al-Hajj F Al-Tannir M Zaide F El-Rajab M A survey of blood pressure
in Lebanese children and adolescents North Am J Med Sci 2011 3 24-9
76
55 Al-Salloum AA El-Mouzan AH Al-Herbish AS Al-Umar AA Qurashi MM Blood
pressure standard for Saudi children and adolescents Ann Saudi Med 2009 29 173-8
56 Akinkugbe FM Akinwolere AO Kayode CM Blood Pressure Pattern in
Adolescence West Afri J Med 1999 18 196-202
57 Wanzhu T Eckert GJ Saha C and Pratt JH Synchronization of Adolescent Blood
Pressure and Pubertal Somatic Growth J Clin Endo Metab 2009 94
58 Ansa VO Anah MU Odey FA Mbu PN Agbor EI Relationship between parental
socioeconomic status and casual blood pressure in coastal Nigeria Adolescents West
Afri J Med 2010 29146-52
59 Agyemang C Redekop WK Owusu-Dabo E Bruijnzeels MA Blood pressure
patterns in rural semi-urban and urban children in the Ashanti region of Ghana West
Africa BMC Public Health 2005 5114-21
60 Ejeke CCE Ugwu CE Ezeanyika LUS Olayemi AT Blood pressure patterns in
relation to geographic area of residence a cross-sectional study of adolescents in Kogi
state Nigeria BMC Public Health 2008 8 411-5
61 Colhoun HM Hemminway H Poulter WR Socioeconomic status and blood
pressure an overview analysis J Human Hypertension 1998 12 91-110
62 Badaruddoza KR Familial aggregation and heritability for cardiovascular risk factors
a family based study in Punjab India Natural Science 2010 2 732-6
63 Livshits G Gerber LM Familial factors of blood pressure and adiposity co-variation
Hypertension 2001 37 928-35
64 Fermino RC Seabra A Garganta R Antoacutenio J Maia R Genetic factors in familial
aggregation of blood pressure of Portuguese nuclear families Arq Bras Cardiol 2009
92 463-9
77
65 Mijinyawa MS Iliyasu Z Borodo MM Prevalence of hypertension among teenage
students in Kano Nigeria Nig J Med 2008 17 173-7
66 The Wellcome Trust case control consortium Genome-wide association study of
14000 cases of seven common diseases and 3000 shared controls Nature 2007 447
661-78
67 Levy D Destefano AL Larson MG ODonnell CJ Lifton RP Gavras H Evidence for
a gene influencing blood pressure on chromosome 17 genome scan linkage results for
longitudinal blood pressure phenotypes in subjects from the Framingham heart study
Hypertension 2000 36 477- 83
68 Lifton RP Wilson FH Choate KA Geller DS Salt and blood pressure new insight
from human genetic studies Cold Spring Harb Symp Quant Biol 2002 67 445ndash50
69 van der Sande MA Milligan PJ Nyan OA Rowley JT Banya WA Ceesay SM
Dolmans WM Blood pressure patterns and cardiovascular risk factors in rural and
urban Gambian communities J Hum Hypertens 2000 14 489-96
70 Akinkugbe OO Ojo OA Arterial blood pressure in rural and urban population of
Nigeria BMJ 1969 2 22-4
71 Okagua J Anochie IC Akani NA Adolescent blood pressure in Rivers State Nigeria
A rural-urban comparism NJP 20154221-7
72 Urrutia-Rojas X Egbuchunam CU Bae S Menchaca J Bayona M Rivers PA Singh
KP High blood pressure in school children Prevalence and risk factors BMC
Pediatrics 2006 6 32-9
73 Sorof JM Lai D Turner J Poffenbarger T Potman R Overweight ethnicity and the
prevalence of hypertension in school-aged children Pediatrics 2004 113 475-82
78
74 Rosner B Prineas R Daniels SR Blood pressure differences between blacks and
whites in relation to body size among US children and adolescents Am J Epidemiol
2000 151 1007-18
75 Harding S Whitrow M Lenguerrand E Maynard M Teyhan A Cruickshank JK Der
G Ethnic differences in blood pressure in adolescence the determinants of adolescent
social well-being and health study Hypertension 2010 55 1063-9
76 Cruickshank JK Mzayek F Liu L Kieltyka L Sherwin R Webber LS Srinavasan SR
Berenson GS Origins of the ldquoblackwhiterdquo difference in blood pressure roles of birth
77 Vlajinac H Miljus D Adanja B Marinkoic J ipetic S Kocev N Blood pressure levels
in 7 to 14-year-old Belgrade children J Human Hypertension 2003 17 761ndash5
78 Menezes AMB Hallal PC Dumith SC Adolescent blood pressure body mass index
and skin folds sorting out the effects of early weight and length gains J Epid Comm
Health 2011 12 42-8
79 Karelis AD St-Pierre DH Conus F Rabasa-Lhoret R Poehlman EJ Metabolic and
body composition factors in subgroups of obesity what do we know J Clin Endo
Metab 2004 89 2569-75
80 Katzmarzyk PT Srinivasan ER Chen W Malina RM Bouchard C Berenson GS
Body mass index waist circumference and clustering of cardiovascular disease risk
factors in a biracial sample of children and adolescents Pediatrics 2004 114 198-205
81 Guagnano MT Ballone E Colagrande V Della Vecchia R Manigrasso MR Merlitti
D Riccioni G Sensi S Large waist circumference and risk of hypertension Int J
Obesity 2001 25 1360 ndash 4
82 Araujo TA Lopes MVO Moriera RP Cavalcante TF Gurdes NG MartinS dA Silva
V Blood pressure of children and teenagers from a public school in Fortaleza - Cearaacute
Acta paul enferm 200720103-15
79
83 Sebanjo IO Oshikoya KA Obesity and blood pressure levels of adolescents in
Abeokuta Nigeria Cardiovasc J Afr 2011 221-5
84 Messerli FN Obesity and essential hypertension Haemodynamics sodium excretion
and plasma rennin activity Arch Int Med 1981 141 81-5
85 Appel LJ Brands MW Daniels SR Karanja N Elmer PJ Sacks FM Dietary
Approaches to Prevent and Treat Hypertension A Scientific Statement from the
American Heart Association Hypertension 2006 47 296-308
86 Sacks FM Svetkey LP Vollmer WM Appel LJ Bray GA Harsha D Obarzanek E
Conlin PR Miller ER 3rd Simons-Morton DG Karanja N Lin PH for the DASH-
Sodium Collaborative Research Group Effects on blood pressure of reduced dietary
sodium and the Dietary Approaches to Stop Hypertension (DASH) diet DASH-
Sodium Collaborative Research Group N Engl J Med 2001 344 3ndash10
87 Appel LJ Moore TJ Obarzanek E Vollmer WM Svetkey LP Sacks FM Bray GA
Vogt TM Cutler JA Windhauser MM Lin PH Karanja N A clinical trial of the
effects of dietary patterns on blood pressure DASH Collaborative Research Group N
Engl J Med 1997 3361117ndash24
88 Appel LJ Sacks FM Carey VJ Obarzanek E Swain JF Miller ER 3rd Conlin PR
Erlinger TP Rosner BA Laranjo NM Charleston J McCarron P Bishop LM for the
OmniHeart Collaborative Research Group Effects of protein monounsaturated fat and
carbohydrate intake on blood pressure and serum lipids results of the OmniHeart
randomized trial JAMA 2005 294 2455ndash64
89 Karanja NM Obarzanek E Lin PH McCullough ML Phillips KM Swain JF
Champagne CM Hoben KP Descriptive characteristics of the dietary patterns used in
the Dietary Approaches to Stop Hypertension Trial DASH Collaborative Research
Group J Am Diet Assoc 1999 99 19ndash27
80
90 Nwokocha ARC Adolescence and associated problems In Azubuike JC and
Nkanginieme KEO (eds) Paediatrics and Child Health in a Tropical Region African
Educational Services Owerri Nigeria 2nd edition 2007 p 84-99
91 Rogol RT Roemmich JN Clark PA Growth and puberty J Adol Hlth 2002 31 192-
200
92 Tanner JM Marshal WA Variation in the pattern of puberty changes in boys and girls
Arch Dis Child 1970 45 13-23
93 Nwakoro SO Ifoda K Onochie O Olomu JM Anthropometric assessment of
nutritional status and growth of 10-20 years individuals in Benin City metropolis
Nigeria Pakistan J Nutr 2006 5 117-21
94 Shankar RR Eckert GJ Saha C Tu W Pratt JH The change in blood pressure during
pubertal growth J Clin Endo Metab 2005 90 163-7
95 Department of Health and Human Services 2000 CDC Growth Charts for the United
States methods and development Series Report 11 No 246 Available from URL
httpwwwcdcgovGrowthCharts
96 Redwine KM Daniels SR Prehypertension in Adolescents Risk and Progression
Journ Clin Hypertension 2012 14 360ndash4
97 Falkner B Gidding SS Portman R Rosner B Blood pressure variability and
classification of prehypertension and hypertension in adolescence Pediatrics 2008
122238ndash42
98 Redwine KM Acosta AA Poffenbarger T Development of hypertension in
adolescents with pre-hypertension J Pediatr 2012 16098ndash103
99 Ejike ECCC Ugwu CE and Ezeanyika LUS Variations in the prevalence of point
prehypertension in a Nigerian school-going adolescent population living in a semi-
urban and an urban area BMC Pediatr 2010 1013
81
100 Ujunwa FA Ikefuna AN Nwokocha AR Chinawa JM Hypertension and
prehypertension among adolescents in secondary schools in Enugu South East Nigeria
Italian J Pediatr 20133970-5
101 Chobanian AV Bakris GL Black HR Seventh report of the Joint National
Committee on Prevention Detection Evaluation and Treatment of High Blood
Pressure Hypertension2003 421206ndash52
102 Lande MB Systemic Hypertension In Kliegman RM Behrman RE Jenson HG and
Stanton BF (eds) Nelson Textbook of Pediatrics Saunders Elsevier Philadelphia 19th
Edition 2011 pg 1592-8
103 Luma GB Spiotta RT Hypertension in Children and Adolescent Am Fam Physician
2006 73 1558-68
104 Arvind B Rupesh J Vijayakumar M Madhuri K Ali U Evaluation and management
of hypertension Indian Paediatr 2007 44 103-21
105 Flynn JT Neonatal hypertension Diagnosis and management Pediatr Nephrol 2000
14 332-41
106 Steyn K de Wet T Richter L Cameron N Levitt NS Morrel C Cardiovascular
diseases risk factors in 5-year old urban South African children- The Birth to Ten
Study SAMJ 2000 90 7126
107 Antia-Obong OE Antia-obong LE Arterial blood pressure of Nigerian Urban and
Rural school children Nig J Paediatr 1991 18 3-11
108 Nguyen NT Magno CP Lane KT Hinojosa MW Lane JS Association of
hypertension diabetes dyslipidemia and metabolic syndrome with obesity findings
from the National Health and Nutrition Examination Survey 1999 to 2004 J Am Coll
Surg 2008 207 928-34
82
109 Solar MB Gill A Rey J Epidemiology of arterial blood pressure in school children
population Aten Primaria 1992 9 212-4
110 Steyn K de Wet T Richter L Cameron N Levitt NS Morrel C Cardiovascular
diseases risk factors in 5-year old urban South African children- The Birth to Ten
Study SAMJ 2000 90 7126
111 Linkas J The assessment and management of hypertensive emergencies and
urgencies in children Pediatr Emerg Care 2005 21391-6
112 Croix B Feig DI Childhood hypertension is not a silent disease Pediatr Nephrol
2006 21527-32
113 Flynn JT Anderson MH Characteristics of children with primary hypertension seen
at a referral centre Pediatr Nephrol 2007 44 103-21
114 Nakao M Yano E Nomura S Kuboki T Blood pressure lowering effects of
biofeedback treatment in hypertension a meta-analysis of randomized controlled trials
Hypertension 2003 26 37- 46
115 Jalingo Available from URLhttpwwwencyclopedia Britanica Accessed on 3rd
December 2011
116 Araoye MO Research Methodology with Statistics for Health and Social Sciences
Nathadex Publishers Saw-Mill Ilorin Nigeria 2004 pg 115-21
117 Olusanya O Okpere E Ezimokhai M The importance of social class in voluntary
fertility control in a developing country West Afr J Med 1985 4 205-12
118 World Health Organization expert committee Physical status the use and
interpretation of anthropometry WHO technical report series No 894 Geneva WHO
1995 p 424ndash38
119 Guidelines subcommittee WHOISH guideline for management of hypertension J
Hypertens 1999 17 151-83
83
120 Aubay B How to measure waist circumference Available from
URLhttpwwwehowcom Last updated August 10th 2011 and accessed on December
9th 2011
APPENDICES
Appendix 1
PROFORMA ON BLOOD PRESSURE PATTERN IN APPARENTLY HEALTHY
SECONDARY SCHOOL ADOLESCENTS IN JALINGO
PUBLIC SCHOOL [ ]
Serial No
84
PRIVATE SCHOOL [ ]
A BIODATA
1 Age (years) 10[ ] 11[ ] 12[ ] 13[ ] 14[ ] 15[ ] 16[ ] 17[ ] 18[ ] 19[ ]
2 Gender M [ ] F [ ]
3 Class JSS 1-3 [ ] SS1-3 [ ]
B MEDICAL AND SOCIAL HISTORY Yes [1] No [2]
1 Have you ever passed blood in your urine [ ]
2 Have you ever had your face or legs swollen [ ]
3 Are you on any drug for long time (such as pills steroids marijuana codeine
NSAIDs containing drugs tramal and others) [ ]
If yes specifyhelliphelliphellip
C SOCIO-ECONOMIC CLASSIFICATION
Fatherrsquos occupation
Score 1 Professionals top civil servants politicians and top businessmen
2Middle-level civil servants technicians skilled-artisans and well-to-do
traders
3 Unskilled workers and those in general whose income would be at or below
the national minimum wage
Mothers educational level
Score 0 Education up to University level
1 Secondary or tertiary level below the University
2 No formal education or up to primary level only
D ANTHROPOMETRY
i Weight (Kg) ndash 1helliphellip 2helliphelliphellip Averagehelliphelliphelliphellip
ii Height (m) ndash 1helliphellip 2helliphellip Averagehelliphelliphelliphellip
85
iii Body mass index = weightheight (kgm2)
v Waist circumference (cm) ndash 1helliphellip 2helliphelliphellip Averagehelliphelliphelliphellip
iv Blood Pressure (mmHg) - 1helliphellip 2hellip 3helliphellip Averagehelliphelliphelliphellip
Appendix 2
AUTHORIZATION AND CONSENT TO PARTICIPATE IN A RESEARCH
I Dr Peter Teru Yaru of the Department of Paediatrics Ahmadu Bello University
Teaching Hospital (ABUTH) Zaria Irsquom conducting a research on the blood pressure
pattern among secondary school adolescents in Jalingo
The aim of the study is to know the level of blood pressure among their age
groups Those with high blood pressure (or hypertension) will be identified appropriately
advised and referred for further care The study will involve taking their weight height
blood pressure and waist circumference Female assistants shall be responsible for
86
measuring waist circumference of female students Students will also be given a
questionnaire on some of their activities drug use among others all aimed at looking for
factors which can affect their blood pressure Information obtained shall be treated with
utmost confidentiality and for this research work only Please note that participation is
voluntary I will be glad if you give consent for your childward to participate in the
study
Statement by parents Irsquove read and understood this consent form and agreed for my
child to be included in the study
Parents name Researcherrsquos name and sign
Parents phone no if any Date
Parents signthumb print Phone no
87
Appendix 3
SOCIO-ECONOMIC SCORE
The classification of socio-economic scores based on fatherrsquos occupation and motherrsquos
education by Olusanya et al117
A Husband (fatherrsquos occupation)
Score 1 Professionals top civil servants politicians and businessmen
2 Middle-level bureaucrats technicians skilled-artisans and well-to-do traders
3 Unskilled workers and those in general whose income would be at or below
the national minimum wage
B Mothers educational level
Score 0 Education up to University level
1 Secondary or tertiary level below the University
2 No formal education or up to primary level only
The socio-economic class of the childrsquos mother is obtained by adding the scores from A
and B above and graded I-V as appropriate for example
Score (1) from A plus score (0) from B = social class I
Score (2) from A plus score (0) from B = social class II
Score (2) from A plus score (1) from B = social class III
Score (2) from A plus score (2) from B = social class IV
Score (3) from A plus score (0) from B = social class III
Score (3) from A plus score (1) from B = social class IV
Score (3) from A plus score (2) from B= social class V
Page 13
13
and perhaps severely affected organs are the heart kidneys brain and the eyes leading to
lowered life expectancy and premature death13 In addition hypertension is a component
of the metabolic syndrome associated with similar and perhaps more severe consequences
in affected individuals14 Abdulrahaman and Babaoye15 in a study of hypertension in
Nigerian children observed a mortality rate of 28 within the first year after diagnosis
Similar mortality of 275 was reported by Aderele and Seriki9 Hypertension also places
an excessive financial burden on the population and health system consuming scarce
resources16
Adolescence is the transitional period of development between childhood and
adulthood The World Health Organization (WHO) defines adolescents as individuals
between the ages of 10 and 19 years and they account for 40 of Nigeriarsquos population1718
Adolescence is characterized by rapid biological psychological and cognitive changes
largely dependent on hormonal and environmental influences19 Many of the responses to
these influences include behaviours that have direct implications on health such as harmful
dietary intake alcoholism smoking substance abuse and sedentary lifestyle19 These
coupled with social stresses such as city traffic congestion have negative health impact and
predispose to obesity and increased risk of cardiovascular disease such as hypertension and
metabolic syndromes10 20 It has been shown that if preventive measures are started early in
childhood and adolescence they may lead to significant reduction in the high prevalence of
hypertension and metabolic syndrome currently observed in adults81320
JUSTIFICATION FOR THE STUDY
Hypertension is associated with high morbidity affecting major organs of the body such as
the heart kidneys and the brain1314 and a mortality of up to 275-28915 It is now diagnosed
frequently in adolescents with a reported prevalence of 35-952122 The younger the age of
14
onset of hypertension the greater the reduction in life expectancy if left untreated13 Even
asymptomatic adolescents with mild blood pressure elevations can have target organ
damage10 Studies121420 have shown that early identification and intervention may lead to a
significant reduction in the high prevalence of hypertension and metabolic syndrome
currently observed in adults In view of this routine blood pressure check-ups for children
and adolescents have been advocated during medical evaluations8 Blood pressure is
however not routinely measured in most paediatric clinical practices in Nigeria
Consequently only few children will have their blood pressure measured when they fall sick
or during preventive care visits In addition hospital and clinic BP measurements may be
associated with falsely elevated BP called lsquolsquowhite coat hypertensionrsquorsquo8 BP measurement of
children outside of the hospital setting such as in schools will provide opportunity for
apparently healthy individuals and possibly eliminate white coat hypertension The need for
surveillance for the early identification of adolescents in Jalingo who are at risk of
hypertension and to initiate measures aimed at preventing its consequences is therefore the
justification for this study In addition the study will add to the body of knowledge on
adolescent blood pressure as there has been no previous study on BP from Jalingo and
northeastern Nigeria as a whole This will help inform public health policies regarding blood
pressure control and prevention in Taraba State in particular and in Nigeria in general
15
LITERATURE REVIEW
HISTORICAL PERSPECTIVE
Blood pressure measurement first started in the eighteenth century with the experiment of
Stephen Hales to whom its discovery can be attributed as reported by Jeremy2324
Accurate study of blood pressure as reported by Crile25 began with the introduction of a
manometer by Poiseuille a century later The first truly accurate blood pressure
measurement in man was by the Surgeon Faivre in 1856 when he connected an artery to a
mercury manometer to obtain direct readings24 Non-invasive methods of BP
measurement started with the discovery of the sphygmograph in 1855 by Vierordt as
reported by Crile25 and improvement by Potain in 1889 gave birth to the
sphygmomanometer26 In 1896 Scipione Riva-Rocci developed the method upon which
present-day technique is based27
Segal28 reported that the use of stethoscope for BP measurement was first highlighted
in 1905 by a Russian surgeon Korotkoff who documented hearing a tapping sound using a
stethoscope placed over the brachial artery as the Riva-Rocci cuff was deflated Goodman
and Howell29 recommended the division of the changing sounds into five distinct phases and
physicians subsequently determined blood pressure according to the point of appearance and
muffling or disappearance of the sounds30
DEFINITION AND REGULATION OF BLOOD PRESSURE
Blood pressure is defined as the product of cardiac output and peripheral vascular
resistance131 During each heartbeat BP varies between a maximum (systolic) and a
minimum (diastolic) pressure and is measured in millimeters of mercury (mmHg)1 Blood
16
pressure is regulated by different mechanisms acting either rapidly or slowly to maintain it
within normal range for optimal cellular performance3132
Intrinsic Regulation
Intrinsic factors regulating BP include stroke volume and heart rate which both influence
cardiac output31 Stroke volume depends on the volume of blood that fills the ventricles and
this depends on the preload and afterload33 A higher afterload will decrease stroke volume
causing low cardiac output and low BP and vice versa When cardiac output increases more
volume is derived from the venous pool increasing preload Similarly an increased heart rate
will lead to increased cardiac output and BP3134
Reflex Regulation
The baroreceptors within the aortic arch and carotid sinuses contain sympathetic and
parasympathetic nerve fibres3435 These are sensory nerves which run from the medulla
and they respond to stretch of the tissue in which they lie by increasing or decreasing the
rate of signaling36 and act fast in regulating BP34 Sympathetic stimulation causes
increased heart rate and widespread vasoconstriction to increase BP while
parasympathetic stimulation produces the opposite3537
Hormonal Regulation
Hormones regulating blood pressure include renin-angiotensin-aldosterone and
antidiuretic hormone (ADH) They act slowly by responding to changes in intravascular
volume and osmolality38 Angiotensin II is a potent vasoconstrictor and stimulates the
release of aldosterone from the adrenal gland39 Aldosterone increases sodium absorption
and fluid retention leading to increased BP ADH is a potent vasoconstrictor and plasma
volume regulator and its stimulation results in fluid retention and vasoconstriction39
Other hormones regulating BP include the sex hormones thyroid parathyroid cortisol
and ACTH They act on the rennin-angiotensin-aldosterone system to regulate BP3940
17
Renal Regulation
The kidneys control blood pressure through the retention and excretion of extracellular
fluid35 An increase in renal fluid retention will increase extracellular volume and higher
blood pressure whereas increased renal excretion leads to lower blood pressure41 This is
achieved through the action of ADH aldosterone and atrial natriuretic peptide (ANP)41
METHODS OF MEASURING BLOOD PRESSURE
Blood pressure can be measured by invasive and non-invasive methods
1) Invasive (or direct) method - Blood pressure is most accurately measured invasively
through an arterial line4243 It is the gold standard by which the accuracy of other blood
pressure measuring devices and methods are assessed4344 Chyun43 compared direct and
indirect blood pressure readings in 14 intensive care unit patients and found that the
auscultatory method overestimates the systolic and diastolic BP especially if the VI Kortkoff
sounds is used as an indicator of diastolic BP This can often over estimate reading by as
much as 20 mm Hg43 This study is made up of very small sample size to make general
conclusion on the differences in BP values from the two methods compared Although the
invasive method is the gold standard for true BP measurement it is associated with serious
complications related to arterial catheterization and the procedure itself may be technically
difficult It is mainly used in experimental procedures and in monitoring critically ill patients
in intensive care units42
2) Non invasive (indirect) methods These are simpler and quicker than the invasive
method and are commonly used for routine blood pressure examinations They may
however yield lower accuracy and small systematic differences in numerical results43
These methods include-
18
a) Palpation method - A minimum systolic value can be estimated by palpation Deakin
and Low45 reported that a palpable radial femoral or carotid pulse indicates a minimum
systolic BP of 80 70 and 60 mmHg respectively The study was carried out among adults
and these values could not be applicable in children and neonate whose maximum
systolic BP may be lower than the reported minimum values A more accurate systolic BP
value can be determined by inflating and then deflating sphygmomanometer cuff while
palpating the pulse The systolic BP corresponds to the pressure at which the radial pulse
becomes palpable45 Its disadvantages are that pressure obtained is usually 2-5mmHg less
than those obtained by auscultation and diastolic BP cannot be measured32
b) Auscultation method- Also called the Korotkoff method is the method of choice in
clinical practice142 It involves using a stethoscope and a sphygmomanometer46 The
mercury sphygmomanometer is the gold standard for BP measurement A Riva-Rocci
cuff 27 is placed over the arm and inflated to occlude the brachial artery It is then
gradually deflated until blood flow is re-established accompanied by a tapping sound
which can be detected by the stethoscope held over the artery Five sounds are
traditionally heard and classified into phases30 The first phase corresponds to the systolic
BP while the last or fifth phase corresponds to the diastolic BP30 The fourth phase
alternatively is used to measure the diastolic pressure if a 10 mmHg or greater
differences exist between the initiation of phases fourth and five or if the fifth sound is
heard down to 0 mmHg8 This may occur in cases of high cardiac output or peripheral
vasodilatation children or in pregnancy This method though the method of choice in
clinical practice may however be associated with errors arising from faulty technique and
equipment4748 as well as observer bias49 This method was used for this study because of
its widespread general usage its reliability and accuracy Unlike other methods the
instruments (mercury sphygmomanometer and stethoscope) do not require any
19
calibration and values obtained do not require validation by other methods The standard
World Health OrganizationCenter for Disease Control (WHOCDC) blood pressure
reference percentile tables were generated using the mercury sphygmomanometer hence
the auscultation method is the gold standard for BP evaluation258
The aneroid sphygmomanometer measures BP by mechanical system of metal
bellows that expand as the cuff pressure increases in a series of levers that register the
pressure on a circular scale The hybrid shygmomanometer combines some of the features
of the two and uses an electric transducer to record blood pressure2
c) Oscillometric technique- This uses the oscillometric device Oscillation of pressure in a
sphygmomanometer cuff is recorded during gradual deflation The point of maximum
oscillation corresponds to the mean arterial pressure50 The oscillation begins well above
systolic BP and continues below diastolic BP so that systolic and diastolic BP can only
be estimated indirectly according to some empirically derived algorithm
d) Ultrasound method - This uses an ultrasound transmitter and receiver placed over the
brachial artery under a sphygmomanometer cuff As the cuff is deflated the movement of
the arterial wall and systolic BP cause a Doppler phase shift in the reflected ultrasound
The diastolic BP is recorded as the point of diminished arterial motion51 Its advantage
includes the ability to detect diastolic BP in atrial fibrillation and hypotension where
Korotkoff sound is faint152
FACTORS AFFECTING BLOOD PRESSURE IN ADOLESCENTS
Several inter-related factors affect blood pressure These include-
Age - A progressive BP elevation with age has been observed in several studies2153-55
The rate of rise varies in boys and girls5455 The average systolic increase ranges between
20
166 and 286 mmHgyr for boys and 144 and 263mmHgyr for girls while that of
diastolic BP ranges from 083 and 177mmHgyr for boys and 077 and 148mmHg for
girls2155 Bugaje Yakubu and Ogala21 studied blood pressure pattern among 2035
adolescents in Zaria and found a consistent rise of BP with age The rate of rise was fairly
constant until 11-13 years in boys and 12-14 years in girls when the rise became rapid A
similar study53 also found a BP rise with age among 650 healthy school children in Jos In
a large population studies in Lebanon56 and Saudi Arabia55 BP was similarly reported to
increase consistently with age Rapid growth and biological maturation of organs which
are normal occurrences during adolescence were thought to be responsible rather than the
chronological age56 The results of these studies showed increasing blood pressure with
age despite the fact that one study55 used oscillometric method for their study while the
standard auscultation was used in the other studies Also the studied sample sizes across
these studies varied greatly with sizes of 65053 203521 571054 and 1622655 Despite this
the findings were similar
Gender ndash Results of studies on the effect of gender on BP showed that sex positively
affects blood pressure2153-55 Merhi Al-Hajj and Al-Tannir et al54 studied BP pattern in
5710 Lebanese school children while Al-Salloum El-Mouzan and Al-Herbish et al55
studied BP pattern in 16226 Saudi children and adolescents The authors reported a
higher BP in girls than boys at all ages A study21 of BP pattern in adolescents in Zaria
Nigeria demonstrated an initial higher BP in boys before puberty which reversed with the
onset of puberty up to the age of 14-15yrs when it reversed again to be higher in boys
Akinkugbe Akinwolere and Kayode56 reported no sex differences in adolescent BP in
Ibadan The reported sex difference is said to be likely due to differences in sex hormone
and pattern of growth in boys and girls57 Differences in age range of the study population
may however be responsible for the observed BP variation For instance these studies5455
21
comprised of both adolescents and pre-adolescent age groups combined in one study
while the other two studies2156 were purely adolescents21 Blood pressure is reported to be
equal in both sexes before adolescence after which the gender difference starts to
manifest most likely due to physical and hormonal changes
Socioeconomic Factors - Belonging to either end of the socioeconomic strata is found to
be associated with elevated blood pressure5859 A study in Ibadan56 reported an inverse
relationship between parental socioeconomic status and level of BP in adolescents The
authors suggested that this might be the result of the health behaviours and problems
characteristic of the lower socioeconomic class On the other hand Ejeke Ugwu and
Ezeanyika et al60 in Lokoja and another study53 in Jos both found higher BP in children
from high socioeconomic class Colhoun Hemminway and Poulter61 in a meta-analysis of
BP and socioeconomic status in developed and developing countries found an inverse
relationship of BP with socioeconomic status in developed nations and a direct correlation
in developing countries These different findings may be due to methodological
differences in socio-demographic stratification For instance Akinkugbe and
colleagues59 used fatherrsquos level of education for social classification Parentrsquos educational
level may however not equate well with level of family income The other study60 used an
automated device for their study whose values may require validation using the
recommended auscultation method Difference in environmental stresses may also be
different considering the level of development of the areas where the studies were carried
out
GeneticFamilial Factors - The effect of geneticfamilial factors on BP has been
demonstrated in some studies62-64 Familialgenetic correlations reflected in BP and other
anthropometry generally are higher among genetically close relatives such as brother-
sisters or parent-offspring than among spouses62 Levshit and Gerber63 surveyed 514
22
individuals from 135 nuclear families in Russia while Budaruddoza62 studied 1400
individuals from 380 families in India and found significant genetic influence on BP
Mijinyawa Iliyasu and Borodo65 also reported family history of hypertension as risk
factor for developing high BP in a study on prevalence of hypertension among 1000
teenagers in Kano The authors concluded that this could be due to genetic predisposition
They however did not evaluate further to determine the genetic defects The authors did
not also consider shared environmental factors known to influence blood pressure in
individuals Molecular genetic studies have identified genes as possible regulators of
BP6667 These genes regulate the renin-angiotensin-aldosterone system involved in renal
salt handling69 Mutations that increase sodium reabsorption and salt sensitivity is
associated with higher BP and vice versa68 while shared environmental risk factors may
potentiate the development of such familial conditions which might have been
responsible for outcome of the above studies6364
Environmental Factors ndash Environmental factors greatly influence BP variation in a
population592269 Akinkugbe and Ojo70 reported a consistently higher BP in Nigerian
adolescents than their counterparts of similar ages in black and white American children
The authors are of the view that this could be due to different environmental factors of the
study population Obika Adedoyin and Olowoyeye22 studied BP pattern in 2526
children aged 1-14 years in rural semi-urban and urban communities in Ilorin Nigeria
and demonstrated a hypertension prevalence of 95 in urban compared to 63 in rural
communities This was similar to the study59 in Ghana and Gambia69 The authors592269
argued that the differences were due to socioeconomic status which is higher in the urban
than the rural areas The BP variation could be accounted for by the nature of dietary
intake since the rural communities generally consume more of natural foods with less salt
and lsquojunk foodsrsquo compared to the urban populace This was demonstrated by one study61
23
which reported higher mean BP among urban communities in developing nations due to
changes in their dietary pattern Rural areas are also less exposed to the stress and hassle
of the urban cities It is of interest to note however that urban areas are a mixture of
social classes as a result of migrant workers seeking lsquogreener pasturesrsquo Okagua Anochie
and Akani71 on the other hand reported higher mean BP among rural adolescents than
their urban counter parts in Port Harcourt The authors could not identify the reason(s) for
their finding but concluded that the seemingly protective privilege of rural life may be
fading gradually The differences in the reports could however result from the sample size
composition comprising of preadolescents22 adolescents71 and adults69
Race - Higher BP levels have been reported in African-American and Hispanic school-
age children than their Caucasian counterparts and among African-Americans than the
Hispanics7273 Akinkugbe and Ojo70 demonstrated a consistently high systolic and
diastolic BP in Nigerian children compared with black and white American children of
similar age Exposure to chronic environmental stress low socioeconomic status and high
obesity rate among African American and Hispanic youths could contribute to higher
BP72-74 It can be inferred from the study that race alone may not be responsible for the
observed differences but shared environmental factors and socioeconomic status may be
contributory77 Other studies7475 however found no significant BP differences in relation
to race
Anthropometry and blood pressure (BP) - A positive correlation has been observed
between BP and anthropometry in various studies58-5977 These studies585678 observed a
significant correlation between systolic BP and weight height and body mass index
(BMI) in boys but only with weight in girls Body mass index (BMI) is used as a
measure of overall obesity but it is known to be a poor indicator of actual body fat79
Waist circumference (WC) is an aggregate measurement of the actual amount of total and
24
abdominal fat accumulation80 It is therefore a better predictor of BP and other
cardiovascular diseases8081 Guagnano Ballone and Colagrande et al81 studied the
relationship between BP and BMI WC and waist hip ratio (WHR) in 461 people and
found WC to be the most consistent anthropometry affecting BP It is of interest to note
that the study by Guagnano et al81 was in adults population while the other studies56-59
were in children and adolescents WC was also found to be a better predictor of BP in an
Italian study8081 while it was not in others56-6982 Comparing BMI and waist
circumference and their effects on BP Arauzo Lopes and Moriera et al83 in Brazilian
children found BMI to be a better predictor of BP than waist circumference This was
similar to the study by Sebanjo and Oshikoya82 in Nigerian adolescents in Akure Thus
waist circumference measurements may not be useful in the evaluation of obesity andor
hypertension in children and adolescents This may partly be explained by the uniform fat
distribution due to hormonal effect at puberty in adolescents compared to the
disproportionate fat distribution in adults Possible mechanisms for the positive
relationship between BP and high BMI includes decreased physical activity increased
salt intake impaired pulmonary functions and development of metabolic abnormalities
such as dyslipidaemia and insulin resistance8084
Nutritional factors - Diet has been a primary link between humans and their environment
and substantial evidence supports the concept that multiple dietary factors affect BP85
Well-established dietary modifications that lower BP are reduced salt intake increased
potassium intake increased protein particularly plant protein high vegetable and
polyunsaturated fats85 High sodium intake on the other hand is said to be associated with
elevated blood pressure86 A series of 3 large controlled feeding studies tested the effects
of dietary patterns on BP86-89 Of the 3 diets studied the dietary approach to stop
hypertension (DASH) emphasized fruits vegetables low-fat dairy products whole
25
grains poultry fish nuts potassium magnesium calcium and fibre as the most effective
diet89 Among all participants the DASH diet significantly lowered mean systolic BP by
55 mm Hg and mean diastolic BP by 30 mm Hg each net of changes in the control diet
DEFINITION AND CLASSIFICATION OF ADOLESCENCE
Adolescence is the transitional stage between childhood and adulthood during which many
life patterns are learnt and established90 According to World Health Organization (WHO)
adolescents are individuals between the age range of 10-19 years17 The most significant
feature of adolescence is puberty characterized by an exceptionally rapid rate of biological
growth and development including physical and sexual maturation9091 The pubertal changes
have been described by Tanner and Marshal92 and are grouped into five stages This utilizes
definite criteria for growth and development of secondary sexual characteristics like pubic
hair and breast in females and pubic hair and genitalia in males9092 The timing of these
events and the rate of growth vary due to genetic and environmental factors in different
populations92 Adolescence is divided into early middle and late periods17
Early adolescence (10-13 years) ndash This is a period of rapid growth and development of
secondary sexual characteristics and varies according to sex It corresponds to Tanner stages
1 and 290 The main features of this stage are breast bud development and menarche in girls
while testicular enlargement and seminal emission occurs in boys93
Middle adolescence (14-16 years) ndash In this stage rapid growth decreases and there is more
cognitive development as the adolescents move from concrete thinking to formal operation
and develop greater competence at abstract thinking91 This corresponds to Tanner stages 3
and 4
Late adolescence (17-19 years) ndash Here slowing of physical changes continue which permits
the emergence of a more stable body image Cognition tends to be less self-centered with
26
demonstration of care for others with increasing thought about concepts such as justice
patriotism and history It corresponds to Tanner stage 59092
ADOLESCENCE AND BLOOD PRESSURE
Adolescence is characteristically associated with increasing blood pressure because of the
physical growth and hormonal changes associated with puberty5794 After the age of one year
normal BP increases more during puberty than probably at any other time in an individualrsquos
lifetime95 Wanzhu Eckert and Saha et al57 examined data from a cohort of 182 normotensive
children in Indiana who had blood pressure measurements taken semi-annually for up to 12
yr The authors found that the rate of change in BP and weight peaked at the age of maximum
pubertal growth spurt (PGS) This BP spurt roughly coincides with growth spurt during
puberty94 Surveys of BP patterns from childhood through adolescence shows systolic and
diastolic pressures increase with age and in adolescents the increase in males is more marked
than in females especially the systolic pressure5458229495
CLASSIFICATION OF BLOOD PRESSURE IN ADOLESCENTS
The National High Blood Pressure Education Program Working Group (NHBPEPWG) of the
United States established guidelines for the definition of normal and elevated blood pressures
in children in 19876 These guidelines were revised in 20048 The definition of childhood
hypertension in the guidelines are based upon the normative distribution of blood pressure
(BP) in healthy children rather than clinical outcome data as in adults The guidelines
classified BP as normal prehypertensive or hypertensive Hypertension is graded into stage
one and two8
Normal BP - Blood pressure lt90th percentile for age sex and height Children and
adolescents with normal BP should be followed annually from the age of 3 years5 They
27
should be encouraged to maintain a healthy life style such as good dietary intake physical
activities and adequate rest8
Pre-hypertension - Blood pressure between the 90th and lt 95th or if BP exceeds
12080mmHg (even if lt90th percentile) but lt95th It was previously called high normal
BP This new description was introduced to help identify children at risk for the
development of persistent hypertension for whom targeted prevention programmes would
be most beneficial96 While recommendations for the diagnosis of hypertension in
children require that BP remains elevated on three separate occasions repeated
measurements are not necessary to classify an adolescent as pre-hypertensive11 The
prevalence of childhoodadolescence pre-hypertension in US is reported to be between
12-1796-98 In Nigeria Ejeke Ugwu and Ezeanyika99 in a study of the prevalence of
point prehypertension and hypertension in 843 adolescents in Lokoja reported a
prevalence of point prehypertension of 222 and 250 in semi urban and urban
communities respectively Ujunwa Ikefuna and Nwokocha et al100 reported 175
prehypertension prevalence among adolescents in Enugu Among adults with pre-
hypertension it is reported that as much as 10 per year develop hypertension101 There
is little information on the time course for children and adolescents with prehypertension
developing hypertension A value of between 11-7 per year has been reported in US
adolescents98 There is no known study on rate of progression of prehypertension to
hypertension in Nigerian adolescents The NHBPEP recommended that children with
pre-hypertension should have their BP checked after every six (6) months to monitor for
progression to hypertension They should be encouraged to engage in physical activity
healthy dietary behaviours and weight management if overweight Pharmacologic therapy
is not indicated except if there is strong evidence of renal disease heart failure left
ventricular hypertrophy or diabetes mellitus8
28
Hypertension Hypertension is BP persistently equal to or above the 95th percentile for
age sex and height measured on three or more separate occasions If the blood pressure
measurement obtained is gt 95th percentile the degree of hypertension should be staged
Stage 1 hypertension- BP value between the 95th and the 99th percentile plus 5mmHg It
is recommended that BP should be rechecked in 1ndash2 wks or sooner if the patient is
symptomatic If persistently elevated on 2 additional occasions it should be evaluated or
referred to source of care for pharmacologic treatment within 1 month 8
Stage 2 hypertension- BP value gt99th percentile plus 5mmHg This stage calls for more
prompt evaluation and commencement of pharmacologic therapy102 It is recommended
that the individual be evaluated or referred to source of care within 1wk or immediately if
the patient is symptomatic8
Aetiology of hypertension
Hypertension is classified as primary (essential) when there is no identifiable cause
or secondary if due to an underlying disease31 Factors such as heredity diet stress drugs and
obesity play a role in the development of essential hypertension103104 Causes of secondary
hypertension include umbilical artery catheterization renal diseases coarctation of the aorta
and endocrine disorders105106 Aderele and Sereki6 in their study of hypertension in children
reported hypertension secondary to renal pathology as the commonest cause of elevated BP
in children This study was mainly in preadolescent population in which secondary
hypertension is a common finding On the other hand Antia-Obong and Antia-Obong107
reported no apparent cause in greater than 90 of the studied subjects with elevated BP and
also reported proteinuria of 1 in the same population without any associated elevated blood
pressure The study did not however evaluate the etiology of the proteinuria A study65 of BP
in teenagers in Kano found family history of hypertension a risk factor in the study
population Another study in Enugu100 examined modifiable risk factors associated with
29
hypertension in 2694 adolescents and found only 1 and 06 of the hypertensive subjects
to be overweight and obese respectively The authors also found that smoking and alcohol
consumption were not significant risk for hypertension This may however be due to the
shorter period of consumption of these products by the students as a cumulative effect from
long term consumption is known to be associated with adverse health outcomes
Prevalence of hypertension in adolescents
The prevalence of hypertension in adolescents varies widely due to arbitrary and imprecise
definition by different researchers It was in view of this that the National High Blood
Pressure Education Program Working Group (NHBPEPWG) of the United States established
guidelines for the definition of normal and elevated blood pressures in children and
adolescents for uniformity68 In the USA the prevalence is about 20 in normal weight and
50 in their obese counterparts108 A prevalence rate of 77109 10554 and 223110 has
been reported in Spain Lebanon and South Africa respectively In Kano Nigeria a study65
on the prevalence of hypertension among 1000 teenagers found a prevalence of 72 Similar
study in Enugu100 on the prevalence of hypertension among 2694 secondary school
adolescents reported a hypertension prevalence of 54 It is of interest to note that different
prevalence was reported because of the different methodology used by the authors While the
study in Kano65 applied the adult blood pressure criterion of BP greater than 14090mmHg as
hypertension the study in Enugu100 used blood pressure greater than 95th percentile for age
and sex Also the study in Kano65 took a single set of measurement while the study100 in
Enugu measured blood pressure of the subject three times at weekly intervals Bugaje
Yakubu and Ogala21 on the other hand defined hypertension as blood pressure greater than
two standard deviations from the mean and also took six readings over thirty minutes and got
a prevalence of hypertension of 34 A prevalence rate of 48107 and 9522 in Southern
and Western region of the Nigeria respectively was also reported It is obvious that because
30
of the various defining criteria for hypertension in adolescents the prevalence of adolescent
hypertension remains imprecise
Clinical presentation- Hypertension is usually asymptomatic unless it has been
sustained or is rising rapidly109 Adolescents with essential hypertension are usually
detected during routine evaluation96 Non-specific symptoms such as lethargy headache
dizziness drowsiness visual disturbance and confusion may be present109 These could
also be signs of complications111 Secondary hypertension may show obvious features of
the underlying disease such as growth failure heat intolerance abdominal stria tremors
body swelling and haematuria8102 Croix and Feig112 studied the spectrum of symptoms in
409 children aged 7-18 years newly diagnosed hypertensive in Texas USA and reported
15 common symptoms than in the controls The symptoms were said to resolve after
commencement of antihypertensive medications The authors concluded that hypertensive
children had a variety of non-specific symptoms The three most common symptoms
reported were headache daytime tiredness and difficulty initiating sleep The study
however did not specify if other possible causes of these symptoms were excluded
Complications of hypertension - Hypertension is usually asymptomatic in adolescents
which if left unidentified overtime can cause serious complications109 Organs commonly
affected in the complication of hypertension are the heart kidneys brain and the eyes
leading to lowered life expectancy and premature death13 Left ventricular hypertrophy
(LVH) is the most prominent clinical evidence of end organ damage10 Studies have
shown that LVH can be seen in as many as 41 of patients even in adolescents with
asymptomatic hypertension10103 Adolescents with severe cases of hypertension are also
at increased risk of developing hypertensive encephalopathy seizures cerebrovascular
accidents and congestive heart failure103109 However data documenting such
complications in children and adolescents are generally lacking In a study of
31
hypertension among teenagers in Kano the researchers65 could not find any
complications in all the 1000 teenagers studied
Investigations and treatment- Basic investigations are all that may be required in
adolescents who are obese and with a family history of hypertension stage 1 disease and
normal findings on physical examination113 This is because primary hypertension is
commoner in adolescents Adolescents that are symptomatic or with stage 2 hypertension or
have features of secondary hypertension should be evaluated in more detail
Treatment of hypertension includes non-pharmacological and pharmacological
methods Non-pharmacologic management involves life style modification such as weight
reduction increased physical activities and dietary adjustment114 In a study to evaluate the
effect of diet and salt on treatment and prevention of hypertension Sacks Svetkey and
Vollmer et al86 reported the beneficial effect of both reduced salt intake and appropriate
dietary adjustment in the control of hypertension Similar benefits were reported in other
studies8788 Although both studies had fairly good sample size (n=412) the studies did not
specify if participants were on other substances or activities other than antihypertensive that
might have affected their BP The studies were also in adults and whether it has the same
effects in children and adolescents has not been evaluation However there is no doubt that
the outcome will be similar in adolescents as dietary modifications have been advocated as
non-pharmacologic management in them Non pharmacologic treatment is usually the initial
treatment in essential hypertension and as adjuvant to drug therapy in those with secondary or
complicated hypertension101114 Pharmacologic (drug) treatment includes diuretics beta-
blockers calcium channel blockers angiotensin converting enzyme inhibitors (ACEIs) and
angiotensin receptor blockers (ARB) among others106114 They are used in those with
symptomatic disease and in acute or chronic complications106
32
Prevention of hypertension may be viewed as part of the prevention of cardiovascular
disease102 In adolescents approaches to prevention include reduction in obesity
discouraging cigarette smoking and alcohol intake113 reduction in sodium intake and increase
in physical activity through community and school-based programmes103104 Growth
monitoring BP check during preventive care visit physical activity and urine screening for
proteinuria and haematuria can be used starting from early childhood
33
AIM AND OBJECTIVES
GENERAL AIM
To determine the blood pressure pattern of apparently healthy secondary school adolescents
in Jalingo Taraba State
SPECIFIC OBJECTIVES
To determine
1 Blood pressure pattern in relation to age and sex among adolescents aged 10-19
years
2 The relationship if any between blood pressure and the anthropometric parameters of
weight height BMI and waist circumference
3 The association between blood pressure and parental social-economic status
4 The point prevalence of prehypertension and hypertension in adolescents
34
MATERIALS AND METHODS
Study area
A cross-sectional survey of the blood pressure pattern of apparently healthy secondary
school adolescents aged 10-19 years was conducted in Jalingo over a six month period
from January to June 2014 Jalingo is the capital of Taraba State and lies within the
savannah belt of North Eastern Nigeria It lies between latitude 80 54rsquo north and longitude
110 21rsquo east and at an altitude of 360 meters above sea level115 Jalingo had a population of
118198 people18 The primary inhabitants are the Konas Mumuyes and Fulanis who are
mostly farmers Other indigenous ethnic groups include the Jukun Kuteb WurkumTiv
and host of other tribes The Ibos Hausas Yorubas among others are the non-indigenous
ethnic groups and are mostly civil servants and businessmen Jalingo has a tertiary health
centre the Federal Medical Centre Jalingo and the state specialist hospital It also has 15
private clinicshospital and many primary health care centres There are also tertiary
education institutions including Taraba State University As at 2013 there were 56
secondary schools in Jalingo 24 public and 32 private all of which were mixed schools
except one which is a girlsrsquo only school
Study design
The study was a cross sectional descriptive study of 1350 apparently healthy secondary
school adolescents in Jalingo
Ethical approval
Ethical approval for this study was obtained from the Scientific and Health Ethics Research
Committee of Ahmadu Bello University Teaching Hospital Zaria (Appendix 4) The Taraba
State Ministry of Education also gave the approval and permission to conduct the study in the
35
selected schools Consent was given by the studentsrsquo parents or guardian (Appendix 2) All
students whose parents gave consent voluntarily participated in the study
Sample size determination
The minimum sample size was calculated using the formula116
N=Z2 (pq) E2
Where N = minimum sample size
p = Prevalence of hypertension in adolescents A prevalence of 3421 was used
q = 1- p
E = margin of error tolerated =1
Z = 196 at 95 confidence level
N = 1962 x 0034 x (1-0034) 0012 = 1262
Therefore the minimum sample size was one thousand two hundred and sixty two
Allowance for non-responders of 5 63 extra subjects were added to the calculated
minimum sample size bringing the total to 1325 students To enhance representativeness of
the sample and to compensate for missing information and poorly filled proforma while
maintaining the sample size a total of 1350 was decided upon
Inclusion criteria
1 Students (ages 10-19 years) in the selected secondary schools
2 Students whose parents gave consent to participate in the study
3 Students who gave assent to participate in the study
Exclusion criteria
1 Students who had obvious skeletal deformities of the spine and legs which can affect
the height and ultimately the BMI
36
2 Students with known chronic disease (or history of such disease) like anaemia
chronic renal disease and cardiac disease because they are not apparently healthy and
these conditions could affect their blood pressure
3 Students with present or past history of chronic drug ingestion that can affect blood
pressure such as steriods and contraceptives
4 Students with high blood pressure already on antihypertensive
Pilot study
A pilot study was carried out in one of the schools a week before the commencement of
the study The school was selected by random sampling method using balloting and did
not participate in the main study The pilot study was carried out with the aim of
assessing the competence of the research assistants in the various measurements
following their training to ensure reliability It was also used to test the questionnaire
before its use during the main study and to provide information on the number of students
that can be measured in a day Consequently twenty students had their blood pressure
and anthropometry measured independently by the researcher and the research assistants
and data were compared using Students t-test There were no statistically significant
differences between the measurements The result of the pilot study is highlighted in
Table I It was also found that some parts of the questionnaire were not well understood
by most students and were adjusted appropriately in the main study (Appendix 1) The 20
students had their measurements done over a period of 3-4 hours (between 8am - 12noon)
by the researcher and the research assistants
Table I Result of pilot study
Variables Researcher Research t p
37
assistants
Mean(plusmnSD) SBP
mmHg
106(11) 104(12) 0550 0586
Mean(plusmnSD) DBP
mmHg
617(83) 63(10) 0450 0657
Mean(plusmnSD) Weight
kg
544(82) 527(122) 0520 0608
Mean(plusmnSD) Height m 16(01) 16(01) 0000 1000
Mean(plusmnSD) BMI
kgm2
198(36) 202(33) 0370 0716
Mean(plusmnSD) WC cm 692(72) 682(133) 0300 0769
Sampling method
Students were selected by multistage random sampling technique The list of secondary
schools obtained from the Taraba State Post Primary Schools Board served as the sampling
frame for schools There were 56 secondary schools 24 of which were public and 32 were
private schools a ratio of 113 Ten (10) schools were randomly selected by balloting four
(4) from public schools six (6) from private based on the number and approximately similar
ratio of private to public schools of 115 (46) Ten schools were selected to ensure wider
coverage and even distribution of students so that it could be truly representative of the
community All the ten schools had an overall total of eight thousand one hundred and seven
(8107) students The public schools had a total of five thousand nine hundred and forty
(5940) with nine hundred and eighty nine (989) students participating The private schools
had a total of two thousand one hundred and sixty-seven (2167) students with three hundred
and sixty one (361) participating These number (989 and 361) was calculated based on the
38
relative population of each school and proportionate to number of students in each school
Thereafter the number of students to participate per school was calculated proportionately to
the number of students in each school based on the number given by the school authority
Then the number in each class was also calculated proportionately from JSS1 to SS3 to
ensure fair and equal chance of participation for all age groups The calculation was done
thus n= a b x c
Where n= number of students per selected school
a= total numberpopulation of students in the school
b= total numberpopulation of students in all 10 selected schools (8107)
c= calculated total sample size (1350)
Students in each class from junior secondary school (JSS) 1-3 and senior secondary school
(SS) 1-3 were then randomly selected by balloting The number of selected schools total
number of students in a school and the number of students selected per school is outlined in
Table II
Table II Selected schools and number of students in each of the ten schools in Jalingo
Selected schools Total no of No of students
39
student in the
school (a)
n=8107
selected (n=abxc)
n=1350
Public schools
Govt Science Secondary School 2800 466
Govt Day Secondary School SGari 1200 200
Salisu Dogo Secondary School 1100 183
Govt Secondary School Magami 840 140
Total 5940 989
Private schools
Winners Comprehensive Secondary School 650 108
Hawai Secondary School 562 94
Centre for Quranic Science and Islamic Education 543 90
Good Success Secondary School 155 26
Jetters Academy 140 23
Yagai Academy 117 20
Total 2167 361
The study
The first contact with the students was a familiarization exercise to each of the schools during
which the teachers and students were given a talk by the researcher on blood pressure and the
40
importance of periodic blood pressure measurement They were given the opportunity to ask
questions which were responded to Both the students and their teachers actively participated
in the lectures
On the second day students were selected as described above and those selected
underwent general physical examination in the presence of a chaperon to identify those
who did not fulfilled the inclusion criteria Each selected student was given a proforma
(Appendix 1) in which information on their biodata and medical history were recorded
Other information obtained was parentrsquos medical history and their socioeconomic status
using the format described by Olusanya Okpere and Ezimokhai117 (Appendix 3) The
study was carried out in a relatively quiet and empty classroom to ensure privacy for both
male and female students The procedure for blood pressure measurement was
demonstrated on one of the research assistants and sometimes on one of the teachers by
the researcher to assure the students and allay their anxiety BP and anthropometric values
obtained were recorded in the study proforma An average of 15-20 students per day were
attended to over a period of 3-4 hours (between 8am - 12noon daily) by the researcher
one of the research assistants who is a medical officer a male nurse and a lady Youth
Corper (NYSC)
Blood pressure measurement
This was measured by the researcher and the research assistant (the medical officer) The
standard auscultation method was employed using a mercury sphygmomanometer (Acosson)
and a standard Littman stethoscope according to the guideline of the fourth report on the
diagnosis evaluation and treatment of hypertension in children and adolescents8 Each
students was rest-seated for 5 minutes before BP measurement With the student seated the
right arm rested on a table at the level of the heart an appropriate cuff size which covered
41
two-third (23rd) of the length of the arm was applied round the arm about 2cm above the
antecubital fossa Two cuff sizes were used for this study with dimensions of 10 x 24cm and
13 x 30cm the smaller cuff for the smaller adolescents and vice versa The bladder cuff was
inflated rapidly to 20-30mmHg above the point where the brachial artery was no longer
palpable The bell of the stethoscope was then placed over the brachial artery and the cuff
was deflated slowly at 2-5mmHgsecond while listening to the Korotkoff sounds Phases one
and five of the Korotkoff sounds were recorded as the systolic and diastolic BP
respectively119 Three recordings were taken at intervals of 3-5 minutes and the average was
the final BP in mmHg BP was interpreted based on the standard set by the fourth report on
the diagnosis evaluation and treatment of hypertension in children and adolescents of the
United States8 thus-
Normal BP ndash BP value between the 5th and lt 90th percentile for age sex and height
Prehypertension - BP value between the 90th and the lt95th percentile for age sex and height
or BP of 12080mmHg but less than the 95th percentile
Hypertension ndash BP value ge95th percentile for age sex and height
Students found to have prehypertension were educated and counseled on life style
modifications and the need to have their blood pressure checked in six monthsrsquo time and
annually subsequently Those with hypertension were educated on the implications of the
findings and were referred to the Federal Medical Center Jalingo for evaluation management
and follow-up
Height measurement
Height was measured in centimeters using a locally constructed stadiometer by the research
assistants Each student was measured barefooted standing with the heel back and occiput
42
against the stadiometre The head was held straight looking forward with the lower border of
the eye socket at a horizontal plane with that of the external auditory meatus The movable
part of the stadiometre was adjusted to rest on the vertex and the corresponding value read to
the nearest 01cm
Weight measurement
The weight was measured in kilograms by the researcher and the research assistants using a
bathroom scale (HANSON) Students were weighed in their approved school uniform
without caps head ties or cardigan and with their shoes removed The scale was checked
daily for accuracy using standard calibrated weight before and midway through each session
The weight of the student was measured to the nearest 01 kg
Body mass index (BMI)
This was calculated from the measured weight and height of the subject using the
formula118
BMI= Weight (kg) Height (m2)
Waist circumference measurement
WC was measured in centimeters using a measuring tape by the research assistants The
male assistant measured for boys and the lady Youth Corper measured for girls
Measurement was taken with the student standing completely relax and breathing
normally Clothing was pulled up or down and an inelastic measuring tape was placed
around the waist mid-way between the iliac crest and the lowest rib margin The ends of
the tape were pulled together lightly towards each other and the value read to the nearest
01cm117120
43
Data analysis
Data obtained were analyzed using Epi-Info statistical software package version 7 The
results obtained were presented in figures tables graphs and charts as appropriate Individual
mean BP levels were used as dependent variables and other measured variables as
independent variables The means and standard deviations were used to summarize
quantitative variables such as BP weight height waist circumference and BMI The chi-
squared test was used to test the significance of associations between categorical variables
Studentrsquos t-test was used to compare means of any two normally distributed continuous
variables Pearsonrsquos correlation coefficient and regression analysis were used to examine the
strength of association between BP and the anthropometries Probability level of statistical
significance value was set at lt005
RESULTS
General characteristics
A total of 1350 students were enrolled between January and June 2014 to determine their
blood pressure pattern 628 (465) were males and 722 (535) were females with
malefemale ratio of 111 Students enrolled in the study were drawn from both public and
44
private schools The number of students from public schools was 989 (733) while 361
(267) were from private schools as shown in Table II The mean age of the study subjects
was 153plusmn22 years with a range of 10-19 years The age and sex distribution of the students
is illustrated in Table III
Table III Age and sex distribution of 1350 study subjects in Jalingo
Ag
e
Male
n ()
Female
n ()
Total
N()
10 9(14) 13(18) 22 (16)
11 20(32) 31(43) 51(38)
12 36(57) 52(72) 88(65)
13 96(153) 85(118) 181(134)
14 92(146) 115(158) 207(153)
15 92(146) 111(154) 203(151)
16 66(105) 116(161) 182(135)
17 78(125) 91(126) 169(125)
18 79(126) 70(97) 149(110)
19 60(96) 38(53) 98(73)
To
tal
628(100) 722(100) 1350(100)
45
Socio-economic classes (SEC) ndash Most of the students were from the lower social classes
(4 and 5) with population of 650 (415 and 235) students The upper social classes (1 and
2) had the least population with 184 (62 and122) students The middle social class (3) had
516 students The distribution of the study subjects according to individual
socioeconomic class is shown in Figure I
Figure 1 Socioeconomic class distribution of students in Jalingo
Anthropometry
The anthropometric characteristics of the students are displayed in Tables IV V and VI
All the anthropometric parameters showed increasing values with age (Tables V and VI)
There were significant differences in the anthropometric indices of height (p=0000)
weight (p=0010) and body mass index (p=0000) between boys and girls but not
statistically significant for waist circumference (p=0145) as shown in Table IV
Weight ndash The mean weight of the students was 486plusmn109kg with a range of 23-100kg
(Table IV) Girls were heavier than boys up to middle adolescence after which males
46
were heavier than the females (Table V and VI) and this was statistically significant (t= -
256 p=0010)
Table IV Overall mean anthropometric measurements of the study subjects
Anthropometr
y
Male Female Total
n=628 n=722 N=1350 t p
Wt (kg)
Mean(plusmnSD) 4773(115
)
4926(103
)
4855(plusmn109
)
-
25
6
0007
Range 236-848 227-100 23-100
Ht (m)
Mean(plusmnSD) 159(012) 157(008) 158(plusmn010) 35
5
0000
Range 122-185 126-179 122-185
WC (cm)
Mean(plusmnSD) 6524(91) 6595(86) 6562(plusmn89) -
14
6
0145
Range 225-905 215-100 22-100
47
BMI (kgm2)
Mean(plusmnSD) 1825(27) 1947(33) 1891(plusmn31) -
74
1
0000
Range 117-325 114-42 114-42
Statistically significant p values at 005 level of significance Wt=Weight Ht=Height WC=Waist
Circumference BMI=Body Mass Index SD=Standard Deviation
Height- The mean height of the study population was 158plusmn09m and ranged from 122-
185m (Table IV) Girls were taller than boys at early and middle adolescence but these
reversed from 16 years in favour of the boys (Table V and VI) This differences was
statistically significant (t=448 p=0000)
Waist circumference (WC) - The overall mean waist circumference was 6562plusmn89cm and
a range of 225-100cm Girls had higher WC until late adolescence (18 years) when it
reversed but this was not statistically significant (t=-146 p=0145) This is displayed in
Tables IV V and VI
Body Mass Index (BMI) - Overall mean BMI was 189plusmn31 with a range of 114-42
There was a statistically significant difference between girls and boys (t=-741 p=0000)
Tables IV V and VI illustrate this findings
Table V Mean anthropometric measurements of 628 boys
Age No of
studen
ts
Wt(plusmnSD)
Kg
Ht(plusmnSD)
m
WC(plusmnSD)
cm
BMI(plusmnSD)
Kgm2)
48
10 9 349(50) 143(001
)
613(06) 169(01)
11 20 354(25) 143(002
)
617(13) 170(07)
12 36 363(51) 146(002
)
616(14) 167(06)
13 96 379(51) 150(003
)
602(40) 165(08)
14 92 412(50) 154(003
)
623(32) 169(08)
15 92 471(60) 160(003
)
634(39) 178(08)
16 66 525(52) 164(002
)
672(24) 192(09)
17 78 555(51) 167(002
)
680(31) 197(08)
18 79 576(61) 169(002
)
707(18) 200(08)
19 60 590(57) 170(002
)
716(16) 203(07)
Total 628 477(115 16(01) 652(91) 183(27)
49
)
Wt=Weight Ht=Height WC=Waist Circumference BMI=Body Mass Index SD=Standard Deviation
Table VI Mean anthropometric measurements of 722 girls
Age No of
students
Wt(plusmnSD)
Kg
Ht(plusmnSD)
m
WC(plusmnSD)
cm
BMI(plusmnSD)
Kgm2
10 13 313(34) 139(001) 582(05) 156(02)
11 31 361(53) 144(002) 611(12) 170(05)
12 52 403(64) 149(002) 625(21) 178(09)
13 85 458(66) 154(002) 657(22) 188(12)
14 115 478(74) 157(003) 627(48) 187(10)
15 111 508(65) 159(002) 666(34) 199(13)
16 116 521(60) 159(002) 678(28) 201(11)
17 91 541(62) 161(002) 681(28) 203(11)
18 70 556(63) 161(002) 696(21) 211(11)
19 38 540(48) 158(002) 688(14) 208(06)
Total 722 493(103) 16(010) 651(23) 190(09)
Wt=Weight Ht=Height WC=Waist circumference BMI=Body Mass Index SD=Standard Deviation
Blood pressure (BP) measurements
50
Table VII shows mean blood pressure distribution of the study population for all ages
The highest SBP and DBP were 165mmHg and 95mmHg at 18years and 15 years
respectively Table VIII displays mean BP distribution in relation to age and sex The
tables show that both systolic and diastolic blood pressure increased with age This is also
depicted in Figure 2
Table VII Mean and ranges of blood pressure of 1350 subjects
Systolic Blood Pressure
(mmHg)
Diastolic Blood Pressure
(mmHg)
Age
No of
students
Mean(plusmnSD) Range
Mean(plusmnSD) Range
10 22 936(74) 80-107 600(50) 47-70
11 51 992(106) 76-120 629(71) 47-83
12 88 1036(110) 80-140 657(60) 53-82
13 181 1042(108) 80-143 660(74) 48-88
14 207 1070(115) 83-150 675(76) 47-90
15 203 1090(119) 80-150 678(82) 47-95
16 182 1122(124) 80-150 696(80) 50-90
51
17 169 1132(118) 90-153 698(83) 48-93
18 149 1138(121) 90-165 712(88) 50-90
19 98 1131(127) 90-143 726(76) 57-90
Total 1350 1089(125) 76-165 683(82) 47-95
Table VIII Mean blood pressure in relation to age and sex
Mean(plusmnSD) Systolic blood pressure
(mmHg)
Mean(plusmnSD) Diastolic blood
pressure (mmHg)
A
ge
Male
n=628
Female
n=722
t p Male
n=62
8
Fema
le
n=72
2
t p
52
10 954(3
9)
923(6
0)
1
02
03
20
619(
32)
586(
46)
1
36
0
01
91
11 985(5
5)
997(9
2)
0
42
0
06
80
648(
39)
617(
57)
1
56
0
01
26
12 999(8
9)
1062(
117)
2
84
0
00
06
653(
29)
660(
52)
-
0
52
0
06
07
13 1012(
73)
1075(
73)
4
03
4
00
00
649(
43)
672(
59)
-
0
03
0
00
44
14 1036(
78)
1098(
78)
3
93
0
00
01
653(
44)
693(
58)
3
90
0
00
01
15 1071(
80)
1105(
87)
2
05
0
00
42
665(
58)
689(
56)
-
2
10
0
00
37
16 1135(
82)
1114(
91)
1
03
0
03
10
697(
51)
695(
61)
0
15
0
08
81
53
17 1152(
87)
1115(
77)
2
04
00
43
698(
59)
698(
58)
0
02
0
09
81
18 1141(
96)
1135(
74)
0
27
0
07
91
704(
62)
721(
63)
1
61
0
02
49
19 1146(
97)
1108(
80)
1
41
0
01
64
733(
63)
714(
43)
1
21
0
02
28
To
tal
1081(
133)
1095(
117)
-
2
05
4
00
40
678(
81)
687(
82)
-
2
07
7
00
38
Statistically significant p values at 005 levels of significance
54
Figure 2 Blood pressure distribution in relation to age and sex
SBP =Systolic blood pressure DBP=Diastolic blood pressure
Blood pressure and stages of adolescence
Table IX displays mean blood pressure according to stages of adolescence Girls had a
higher mean SBP than boys from early adolescence (t=3754 p=0000) to middle
adolescence (t=-3025 p=0003) and this was statistically significant This dominance was
also demonstrated in the DBP and was statistically significant in middle adolescence (t=-
3517 plt0000) Adolescents from private schools had higher mean SBP (t=-222
plt0027) and mean DBP (t=-461 p=0000) than those from public schools and these
differences were statistically significant
Table IX Mean blood pressure according to sex and stages of adolescence
Mean BP
(mmHg)
Age (years)
Male SBP
Female SBP
Male DBP
Female DBP
55
Stages
of
adolesc
ents
(years)
Mean(plusmnSD) systolic blood pressure
(mmHg)
Mean(plusmnSD) diastolic blood pressure
(mmHg)
Male Female t p Male Fema
le
t p
Early
(10-13)
1000(9
6)
1040(1
18)
37
54
00
00
648(
56)
653(
82)
05
99
05
50
Middle
(14-16)
1075(1
29)
1105(1
13)
-
30
25
00
03
670(
81)
694(
77)
-
35
17
00
00
Late
(17-19)
1140(1
28)
1121(1
11)
21
45
00
33
717(
85)
710(
83)
00
70
09
45
1082(1
33)
1092(1
17)
-
20
54
00
40
678(
81)
687(
82)
-
20
77
00
38
Statistically significant p values at 005 level of significance SD=Standard Deviation
Table X shows blood pressure pattern according to stages of adolescence
Prehypertension and hypertension were more prevalent in late adolescence than early and
middle adolescence (χ2=49054 p=0000) and (χ2=10305 p=0006) both of which were
statistically significant
Table X The pattern of normal BP Prehypertension and hypertension according to stages
of adolescence
56
Blood
pressure
pattern
Stages of adolescence
Early
n()
Middle
n()
Late
n()
Total
N()
χ2 p
Normal 290(84
8)
428(72
3)
275(66
1)
993(73
5)
429
79
000
0
prehypertens
ion
43(12
6)
135(22
8)
120(28
8)
298(22
1)
490
54
000
0
Hypertensio
n
9(26) 29(49) 21(51) 59(44) 103
05
000
6
342(10
0)
592(10
0)
416(10
0)
1350(1
00)
350
93
000
0
Statistically significant p value at 005 level of significance
Relationship between blood pressure and the measured anthropometry
There was a positive correlation between SBP and DBP with age and the anthropometric
variables of weight height waist circumference and BMI (Table XI) SBP showed a
stronger correlation with the anthropometries than the DBP and was stronger for weight
(r=051) and height (r=044) The waist circumference though statistically significant
showed the weakest correlation
Table XI Correlation between blood pressure age (yrs) and anthropometry
Parameters
Systolic Blood Pressure Diastolic Blood Pressure
Correlation
coefficient
p Correlation
coefficient
p
57
Age (yrs) 035 lt0000 030 lt0000
Height (m) 044 lt0000 034 lt0000
Weight (Kg) 051 lt0000 038 lt0000
WC (cm) 040 lt0000 029 lt0000
BMI
(Kgm2)
031 lt0000 023 lt0000
Statistically significant p values at 005 level of significance Wt=Weight Ht=Height WC=Waist
circumference BMI=Body Mass Index
Blood pressure distribution and socio-economic classes
Table XII shows mean blood pressure according to socio-economic class of the subjects
Lower social classes had higher mean SBP (t=1650 p=2850) and DBP (t=0193
p=00058) but these were not statistically significant
Table XII Mean Blood pressure in relation to socioeconomic classes
Blood
pressur
e
Socioeconomic classes
Upper (1 amp
2) n=184
Middle (3)
n=516
Lower (4 amp
5)
n=650
f(anova
)
p
Mean
(SD)
10857(126
)
10866(128
)
11040(109
)
1650 285
0
58
SBP
Mean
(DBP)
6820(83) 6791(83) 6957(76) 0193 005
8
SEC= Socioeconomic class SBP=Systolic Blood Pressure DBP=Diastolic Blood Pressure SD=Standard
Deviation
Table XIII shows blood pressure pattern in relation to socioeconomic classes of the
subjects The percentage of students with prehypertension was higher in the upper social
class ((χ2=3067 p=0216) while the percentage of hypertension were higher in the lower
socioeconomic classes (χ2=1037 p=0568) but these differences were not statistically
significant
Table XIII Blood pressure pattern in relation to socioeconomic status
Blood
pressure
pattern
Socioeconomic classes
Upper
(1 amp 2)
n()
Middle
(3)
n()
Lower
(4 amp 5)
n()
Total
N()
χ2 p
Normal 127(69
)
383(74
2)
483(74
3)
993(73
6)
417
6
012
4
Prehypertens
ion
52(28
3)
108(20
9)
138(21
2)
298(22
1)
306
7
021
6
Hypertension 5(27) 25(48) 29(45) 59(44) 103 056
59
7 8
184(10
0)
516(10
0)
650(10
0)
1350(10
0)
573
0
022
0
Prevalence of Hypertension and Prehypertension
Table XIV shows the prevalence of hypertension in the study population The total
number of students with hypertension was 59 giving an overall prevalence of 44
Thirty four students (25) had systolic hypertension sixteen (12) had diastolic
hypertension and nine students (07) had both systolic and diastolic hypertension
Systolic hypertension was more prevalent in the females and was more at the age of 16
years while diastolic hypertension was higher in males and this also occurred at 16 years
Among those with hypertension 27 and 16 subjects had stage 1 and 2 systolic
hypertension respectively With regard to diastolic hypertension 24 and 1 subjects had
stage 1 and 2 hypertension respectively The gender difference in the prevalence of
hypertension is not statistically significant (χ2=0831 p=0362)
The number of students with pre-hypertension was 298 giving an overall prevalence of
221 Of this 131 were males and 167 are females This is illustrated in Table XIV
Prehypertension is more prevalent in females than males and this was statistically
significant (χ2=4349 p=0037)
60
Table XIV Overall Blood pressure pattern and prevalence of hypertension and
prehypertension of 1350 students in Jalingo
Blood pressure
pattern
Males
n=()
Females
n=()
Total
N()
χ2 p
Normal 471(750) 522(723) 993(735) 2619 0106
Prehypertension 131(209) 167(231) 298(221) 4349 0037
Hypertension 26(41) 33(46) 59(44) 0831 0362
628(100) 722(100) 1350(100) 1260 0533
statistically significant p value at 005 level of significance
61
DISCUSSION
The findings of this study showed that the BP of secondary school adolescents in Jalingo
was similar in terms of mean values range and trend of progression with age to that of
other adolescents from Ibadan63 and Kogi60 (Nigeria) Ashanti (Ghana)59 and Lebanon54
The mean value was however lower than the mean BP of adolescents from Zaria
(Nigeria)21 Belgrade ( Serbia)78 and Fortaleza-Cearaacute (Brazil)83 who had higher mean BP
in both sexes and at all ages The lower mean BP in this study compared to that of
adolescents from Zaria21 Belgrade78 and Brazil83 could be due to lower mean
anthropometry of weight height and BMI in adolescents from Jalingo resulting in lower
mean BP The sample sizes of these studies7883 were also different and could have
affected the mean BP of the study population For instance the sample size in the
Brazilian study83 is 151 compared to the study in Lebanon54 with 5710 subjects The use
of the fifth Korotkoff sounds as DBP in this study21 could also have accounted for the
lower mean BP in contrast to a similar study in Zaria21 where the fourth Korotkoff sound
was used as the DBP
A progressive increase in blood pressure with age was found in this study This
was similar to most findings by researchers in Nigeria 215358-606566107 and
worldwide54555961 The peak age of rise in BP in this study was in middle adolescence
between 15-16 years in boys but much earlier in girls for both systolic and diastolic BP
This was similar to the study by Akinkugbe Akinwolere and Kayode56 in Ibadan and
Ejeke Ugwu and Ezeanyika et al60 in Lokoja This age group is usually the period of
onset of puberty The chronologic age is not the main factor responsible for BP increase
62
with age but rather the progressive increase in size of the individual Increase in body
size with growth and maturity of organs associated with the physical and hormonal
changes during puberty potentially lead to increasing BP The simultaneous increase in
weight height and other anthropometric indices alongside BP with age seen in this study
and others is in agreement with that The implication of this increase in blood pressure
with age is that those with prehypertensionhypertension in childhood may continue into
adulthood hence further increasing the high prevalence of hypertension in the adult
population with its attendant morbidity disability and mortality
Overall significant higher mean BP was recorded in girls than boys in this study
This was seen from early to middle adolescence after which it reversed in favour of the
boys Reports on the relationship between BP and sex have been inconsistent Some have
reported higher mean BP in females54-56 others higher in males5883 while yet another
reported no sex differences22 The findings of this study were similar to those of Bugaje
Yakubu and Ogala21 and Ujunwa Ikefuna and Nwokocha100 who reported a consistently
higher mean blood pressure in female adolescents up to 16 years compared to their male
counterparts of similar ages Early female predominance in mean blood pressure was also
reports by Agyemang Redekop and Owusu-Dabo et al59 in Ashanti adolescents in Ghana
and Obika Adedoyin and Olowoyeye22 in Illorin The finding was however in contrast
with the study in Calabar58 where higher mean BP was found in boys than girls at all
ages The reason for the higher mean BP in females than boys could be because of earlier
onset of puberty in girls The differences in blood pressure between boys and girls in this
study could also be accounted for by variation in the anthropometric variables of the
individuals as girls were seen to be heavier and taller up to middle adolescence
This study demonstrated a consistently positive relationship between blood
pressure and the anthropometric variables of weight height body mass index and waist
63
circumference as widely reported in other studies 545558-6165107100 Weight is reported to
correlate positively with blood pressure in several studies53565871 Body mass index
(BMI) also showed a positive relation with BP in this study as reported in other
studies5978-81 This is in-keeping with the findings in Port Hacourt71 Abeokuta83 the
Gambia69 Brazil82 and Belgrade77 children Some of these studies however were made
up of younger and older age groups Even in lean populations BMI is known to correlate
positively with BP Waist circumference was also found in this study to correlate
positively with BP This was similar to reports from other studies79-8183 It was found to
be a better predictor of BP in two Italian study8081 while it was not in another82
Comparing BMI and waist circumference and their effects on BP Arauzo Lopes and
Moriera et al82 in Brazilian children found BMI to be a better predictor of BP than waist
circumference This was similar to the report by Sebanjo and Oshikoya83 in Nigerian
adolescents in Akure Guagnano Ballone and Colagrande et al81 however found waist
circumference to be better than BMI The study81 however involved adults and may not
be applicable in children and adolescents The present study demonstrated BMI and WC
to be significant but found BMI to be a better determinant of BP than waist
circumference BMI and waist circumference measure obesity in an individual Whereas
BMI is a measure of overall obesity WC measures centralabdominal fat accumulation
and thus said to be more predictive of adverse health risk79 Obese individuals may be
prone to such condition as dyslipidaemia insulin resistance and hypertension with
reduction in the quality of life Weight BMI and or waist circumference affects blood
pressure through decreased physical activity increased cardiac output insulin resistance
impaired pulmonary function and other hormonal abnormalities8084 It seems therefore
that BMI is a better predictor of BP in adolescents than waist circumference The reason
64
for this is not obvious but it may be because of the nature of uniform fat distribution in
adolescents associated with growth and hormonal changes at puberty
Blood pressure distribution in relation to the parental socio-economic class in this
study showed that students from low socio-economic classes had higher mean blood
pressure than those from upper socioeconomic classes but this was not statistically
significant A study in Ibadanl56 reported a statistically significant negative relation
between blood pressure and parental socio-economic status It was also similar to the
study58 in Calabar In contrast other studies found the reverse536022 The reasons for the
inverse relationship between BP and socioeconomic includes exposure to chronic
environmental stress with sustained sympathetic nervous system stimulation Others are
poor health seeking behaviours due to low income andor inadequate health knowledge
high low birth weight rate and inadequate healthy diets among others97101 In the same
environment individuals from a high social class are believed to be more educated with
high income61 They have easy access to health education and awareness on hypertension
prevention and control and better accessibility and adherence to medical treatment617374
The former might be responsible for the finding of this study as Jalingo is a semi urban
community Most of its inhabitants are subsistent farmers civil servants and traders with
low income The high number of students in the lower socioeconomic class lays credence
to that
The overall point prevalence of hypertension in this study was 44 while that of
pre-hypertension was 221 This prevalence of hypertension is similar to the prevalence
of 48 by Antia-Obong and Antia-Obong107 but higher than the prevalence rate of 37
reported in Zaria21 and lower than the prevalence of 58 reported in Ibadan56 54 in
Enugu100 and the 72 reported in Kano65 The prevalence of pre-hypertension was lower
than that reported by Ejeke Ugwu and Ezeanyika99 who found a prehypertensive
65
prevalence of 25 among adolescents in Lokoja It is higher than the 173 reported by
Ujunwa Ikefuna and Nwokocha et al100 in Enugu and 12-17 by Redwine and
Daniels96 among US adolescents The differences in the reported prevalence of
hypertension and prehypertension in adolescents could have resulted from the different
criteria applied by the various researchers in defining hypertension For instance whereas
this study used BP greater than 95th percentile as hypertension a study in Kano65 used the
adult hypertensive value of BPgt14090mmHg as hypertension and got a prevalence of
72 The prevalence in that study65 could have been higher if the percentile or the
statistical definition was used as many children with BP 14090mmHg would probably be
at stage 2 hypertension This was demonstrated in the study by Bugaje Yakubu and
Ogala21 who found a prevalence of hypertension in their study to be 06 when the adult
cut off value of gt14090mmHg was used but it increased to 37 when the statistical
definition of BPgt 2 standard deviations was used
The number of times blood pressure is taken could affect the outcome as repeated
measurements over a time interval is known to give lower BP values than if BP is taken
once This study used the average of three blood pressure values taken at one sitting but
Ujunwa Ekefuna and Nwokocha100 took three readings at five minutes interval with two
other readings at a week interval In that study100 the prevalence of prehypertension
dropped from 745 during the first set of readings to 173 after the third week
readings The prevalence of hypertension also dropped from 135 to 54 over the same
period Similar decrease in the prevalence of both prehypertension and hypertension was
reported by Redwine and Daniels96 in US adolescents when blood pressure was taken
over time interval Another factor which might have affected the overall prevalence is the
Korotkoff sound used for diastolic pressure23 The 4th or 5th Korotkoff sounds has been
used by different researchers resulting in different diastolic BP The study21 in Zaria used
66
the 4th Korotkoff sound while most other researchers2265100 used the 5th About 5-
10mmHg difference is said to exist between the 4th and 5th Korotkoff sounds230 In this
study the 5th Korotkoff sound was used thus giving a higher prevalence of hypertension
in the studied population than in those where the 4th sound was used
The implication of the outcome of this study is that 44 of adolescents in Jalingo
are already hypertensive while 221 of them are at risk of developing hypertension as
they are pre-hypertensive Since 856 (255 of 298) of the prehypertensives were in the
middle and late adolescence these individuals are likely to be adults with high blood
pressure Therefore regular screening of this group of individuals who were assumed to
be a healthy population is highly important for early detection of hypertension and
intervention such as life style changes and treatment
67
CONCLUSIONS
The following conclusions can be made from this study
1 The mean and range of blood pressure of adolescents in Jalingo was similar to
those of other adolescents in Nigeria and other parts of the world Blood pressure
increased progressively with age
2 All measured anthropometry of weight height body mass index and waist
circumference correlated positively with BP but weight was the most significant
variable in BP determination
3 Socioeconomic status was not significantly related with blood pressure
4 The point prevalence of hypertension and pre-hypertension was 44 and 221
respectively using a recommended definition
RECOMMENDATIONS
1 In view of the high prevalence of prehypertension in this study it is recommended
that students should have their blood pressure measured at school entry as this will
68
help identify those with abnormal BP for early intervention Thereafter BP check
should be offered at least once a year at the beginning of a new session especially for
those found with abnormal BP at school entry
2 Physical and health education should be revived in all the schools This will lead to
increased physical activity and reduced risk of obesity and its consequences
3 School health programmes should be strengthened in schools where it already exist
and effort made to establish same in schools where it is yet to exist The programme
should include measures to detect early prehypertension and hypertension and other
health related needs of the students
LIMITATIONS
The following limitations were encountered in the course of the study
1 Exclusion and inclusion of students that were based on volunteered information and
physical evaluation This could have led to inclusion andor exclusion of adolescentss
69
with or without background renal diseases which could have affected the result of this
study
2 Home blood pressure measurement especially early morning measurement for those
with high blood pressure to possibly eliminate the effect of stress traffic andor
trekking and other school related stresses which may affect blood pressure during the
day
LINES OF FUTURE RESEARCH
This study was questionnaire based and time bound Consequently students were not
investigated for background diseases co-mordid conditions target organ damage or risk
factors for high blood pressure They were also not followed up In view of this future
research on blood pressure in adolescents should include-
70
1 Investigations such as urinalysis electrolytes urea and creatinine random blood
sugar (RBS) lipid profile and echocardiography as part of blood pressure evaluation
in adolescents
2 A long period of study to allow for follow-up over months or years to identify those
that are truly hypertensive considering the definition of hypertension It will also
reveal the rate of progression from pre-hypertension to hypertension
3 Risk factors evaluation for high blood pressure including genetic predispositions
REFERENCES
1 Blood pressure from Wikipedia the free Error Hyperlink reference not valid
Accessed 24th November 2011
2 Pickering TG Hall JE Appel LJ Falkner BE Graves J Hill MN Jones DW Kurtz T
Sheps SG Roccella EJ Recommendations for blood pressure measurement in humans
and experimental animals Part 1 Blood pressure measurement in humans A
statement for professionals from the subcommittee of professional and public
71
education of the American Heart Association council on high blood pressure research
Hypertension 2005 45 142-61
3 da Silva IRR de Souza MDG de Camargo CAC Blood pressure measurement in
children and adolescents Guidelines of high blood pressure recommendations and
current clinical practice Arq Bras Cardiol 2007 88 434-7
4 Sinaiko AR Hypertension in children N Engl J Med 1996 3351968-73
5 US Preventive Services Task Force Screening for high blood pressure
recommendations and rationale Am J Prev Med 2003 25 159-64
6 Report of the second task force on blood pressure control in children Pediatrics 1987
79 1-25
7 National high blood pressure education programme working group on hypertension
control in children and adolescents update on the 1987 task force report on high blood
pressure in children and adolescents A working group report from the national high
blood pressure education program Pediatrics 1996 98 649-58
8 National high blood pressure education program working group on high blood
pressure in children and adolescents The fourth report on the diagnosis evaluation
and treatment of high blood pressure in children and adolescents Pediatrics 2004
114 255-76
9 Aderele WI Seriki O Hypertension in Nigerian children Arch Dis Child 1974
49313-7
10 Bo S Gambino R Gentile L Pagano G Rosato R Saracco GM Cassader M
Durazzo M Cavallo-Perin P High-normal blood pressure is associated with a cluster
of cardiovascular and metabolic risk factors a population based study J Hypertens
2009 27 102-8
72
11 Bao W Threefoot SA Srinivasan SR Berenson GS Essential hypertension
predicted by tracking of elevated blood pressure from childhood to adulthood The
Bogalusa Heart Study Am J Hypertens 1995 8 657- 65
12 Richard A Rodgers M Hedley AJ Mitchel JRA Changes in blood pressure and
blood lipid during adolescence BMJ 1980 28 1563-6
13 Sundstroumlm J Neovius M Tynelius P Rasmussen F Association of blood pressure in
late adolescence with subsequent mortality cohort study of Swedish male conscripts
BMJ 2011 342 643-8
14 Zimmet P Alberti G Kaufman F Tajima N Silink M Arslanian S Wong S Bennett
P Shaw J Caprio S On behalf of the International Diabetes Federation Task Force on
Epidemiology and Prevention of Diabetes The metabolic syndrome in children and
adolescents the IDF consensus Diabetic Voice 20075229-32
15 Abdulrahman FA Babaoye AA Childhood hypertension in northern Nigeria West
Afr J Med 1978 1 7-11
16 Adediran O Jimoh A Di M Relationship between body mass index and blood
pressure in rural Nigerian dwellers Internet J Nutri Wellness 2009 7 431-4
17 World Health Organization (WHO)UNICEF Adolescence at a glance 2003 p 2
18 The National Population Commission constitution of the Federal Republic of Nigeria
(AP 23 LFN) legal notice on publication issued April 21st 2007
19 Heald FP and Gong EJ Diet Nutrition and adolescents In Shils ME and Ross AC
(eds) Modern Nutrition in Health and Disease 9th ed William and Wilkins
Maryland USA 1999 p 32
20 Okonkon CT The prevalence of Hypertension among civil servants in Calabar Nig
Med J 1979 7422-5
21 Bugaje MA Yakubu AM Ogala WN Prevalence of adolescent hypertension in Zaria
Nig J Paediatr 2005 32 77-82
73
22 Obika LF Adedoyin MA Olowoyeye JO Pattern of paediatric blood pressure in
rural semi urban and urban communities in Ilorin Nigeria Afri J Med Sci 1995 24
371-7
23 Jeremy B A short history of blood pressure measurement section of the history of
medicine Proc Roy Soc Med 1977 70 793-9
24 Lewis O Stephen Hales and the measurement of blood pressure J Hum Hypertens
1994 8 865-71
25 Crile GW Blood Pressure in Surgery An experimental and Clinical Research
Philadelphia Lippincott 1903 p 358
26 Lewis WH The evolution of clinical sphygmomanometer Bull N Y Acad Med 1941
17 871-81
27 Browne WC OrsquoBrien ET Semple PF The sphygmomanometer of Riva Roci 1896-
1996 J Hum Hypertens 1994 610 723-4
28 Segal HN How Korotkoff the Surgeon discovered the auscultatory method of
measuring arterial pressure Ann Intern Med1975 83 561-2
29 Goodman FH and Howell AA Clinical studies in the auscultatory method of
determining blood pressure University of Pennsylvania Bulletin 1911 23 469-75
30 Crenner CW Introduction of the blood pressure cuff into US medical practice
technology and skilled practice Ann Intern Med 1998 128 488-493
31 Ganon WF Circulation In Review of Medical Physiol Lange Medical Publication
New York 22nd edition 2005 p 234-63
32 Beth C Homeostatic Regulation of Blood pressure Available from
URLhttpwwweHowcom Accessed on 1st December 2011
33 Rajinder KG Fahim M Regulation of cardiovascular functions during acute blood
loss Indian J Physiol Pharmacol 2005 49 213ndash9
74
34 Dampney AL Coleman MJ Fonts MAP Hirooka Y Horiuchi J Polson JW Potts
PD Tagawa T Central mechanisms underlying short-term and long-term regulation
of the cardiovascular system Proc Austr Physio Pharmacosociety 2001 32 333-44
35 Koshiya N Guyenet PG Noradrenergic neurons and the carotid sympathetic
chemoreflex Am J Physiol 1994 267 519-26
36 Prakash ES The ultimate goal in neural regulation of cardiovascular function Adv
Phyiol Educ 2008 32 107-8
37 Allen AM Inhibition of the hypothalamic paraventricular nucleus reduces
sympathetic nerve discharge and blood pressure Proc Austr Neuroscience Society
2001 29 44-7
38 Reid IA Interactions between ANG II sympathetic nervous system and
baroreceptor reflexes in regulation of blood pressure Am J Physiol 1992 262 763-
78
39 Brooks VL Osborn JW Hormonal-sympathetic interactions in long-term
regulation of arterial pressure A hypothesis Am J Physiol 1995 268 1343-58
40 Reckelhoff JF Gender Differences in the Regulation of Blood Pressure
Hypertension 2001 37 1199-208
41 Fink GD The systemic circulation as a regulated free-market economy A new
approach for understanding the long-term control of blood pressure Clin Exp
Pharmacol Physiol 2005 32 377ndash83
42 Benard K Sources of error in blood pressure measurement Hospital Physician 2002
12 33-7 Available from URLhttp wwwturnerwhitecom
43 Chyun DA A comparism of intra arterial and auscultatory blood pressure readings
Heart lung 1985 14 223-31
75
44 Nwankwo MU Lorenz JM Gardiner JC A Standard Protocol for Blood Pressure
Measurement in the Newborn Pediatrics 1997 99 1342-9
45 Deakin CD Low JL Accuracy of the advanced trauma life support guidelines for
predicting systolic blood pressure using carotid femoral and radial pulses
observational study BMJ 2000 321 673ndash4
46 OrsquoBrian E Replacing mercury sphygmomanometers require clinician to demand
better automated device BMJ 2000 320 815-6
47 McKay DW Raju MK Campbell NR Assessment of blood pressure measuring
techniques Med Educ 1992 26 208ndash12
48 Baker RH Ende J Confounders of auscultatory blood pressure measurement J Gen
Intern Med 1995 10 223ndash31
49 Neufeld PD Johnson DL Observer error in blood pressure measurement CMAJ
1986 135 633ndash7
50 van Montfrans GA Oscillometric blood pressure measurement progress and
problems Blood Press Monit 2001 6 287ndash90
51 Ware RW Laenger CJ Indirect blood pressure measurement by Doppler ultrasonic
kinetoartriography Proceedings 20th Annual Conference Engineering Medical
Biology 1967 9 27-30
52 Matthew Fox Blood pressure measurement technique Available from URL http
wwwlivestrongcom Last edited 2nd September 2010 Accessed on 30th November
2011
53 Akor F Okolo SN Okolo AA Blood pressure and anthropometric measurements in
healthy Primary School entrants in Jos Nigeria SAJCH 2010 4 42-5
54 Merhi BM Al-Hajj F Al-Tannir M Zaide F El-Rajab M A survey of blood pressure
in Lebanese children and adolescents North Am J Med Sci 2011 3 24-9
76
55 Al-Salloum AA El-Mouzan AH Al-Herbish AS Al-Umar AA Qurashi MM Blood
pressure standard for Saudi children and adolescents Ann Saudi Med 2009 29 173-8
56 Akinkugbe FM Akinwolere AO Kayode CM Blood Pressure Pattern in
Adolescence West Afri J Med 1999 18 196-202
57 Wanzhu T Eckert GJ Saha C and Pratt JH Synchronization of Adolescent Blood
Pressure and Pubertal Somatic Growth J Clin Endo Metab 2009 94
58 Ansa VO Anah MU Odey FA Mbu PN Agbor EI Relationship between parental
socioeconomic status and casual blood pressure in coastal Nigeria Adolescents West
Afri J Med 2010 29146-52
59 Agyemang C Redekop WK Owusu-Dabo E Bruijnzeels MA Blood pressure
patterns in rural semi-urban and urban children in the Ashanti region of Ghana West
Africa BMC Public Health 2005 5114-21
60 Ejeke CCE Ugwu CE Ezeanyika LUS Olayemi AT Blood pressure patterns in
relation to geographic area of residence a cross-sectional study of adolescents in Kogi
state Nigeria BMC Public Health 2008 8 411-5
61 Colhoun HM Hemminway H Poulter WR Socioeconomic status and blood
pressure an overview analysis J Human Hypertension 1998 12 91-110
62 Badaruddoza KR Familial aggregation and heritability for cardiovascular risk factors
a family based study in Punjab India Natural Science 2010 2 732-6
63 Livshits G Gerber LM Familial factors of blood pressure and adiposity co-variation
Hypertension 2001 37 928-35
64 Fermino RC Seabra A Garganta R Antoacutenio J Maia R Genetic factors in familial
aggregation of blood pressure of Portuguese nuclear families Arq Bras Cardiol 2009
92 463-9
77
65 Mijinyawa MS Iliyasu Z Borodo MM Prevalence of hypertension among teenage
students in Kano Nigeria Nig J Med 2008 17 173-7
66 The Wellcome Trust case control consortium Genome-wide association study of
14000 cases of seven common diseases and 3000 shared controls Nature 2007 447
661-78
67 Levy D Destefano AL Larson MG ODonnell CJ Lifton RP Gavras H Evidence for
a gene influencing blood pressure on chromosome 17 genome scan linkage results for
longitudinal blood pressure phenotypes in subjects from the Framingham heart study
Hypertension 2000 36 477- 83
68 Lifton RP Wilson FH Choate KA Geller DS Salt and blood pressure new insight
from human genetic studies Cold Spring Harb Symp Quant Biol 2002 67 445ndash50
69 van der Sande MA Milligan PJ Nyan OA Rowley JT Banya WA Ceesay SM
Dolmans WM Blood pressure patterns and cardiovascular risk factors in rural and
urban Gambian communities J Hum Hypertens 2000 14 489-96
70 Akinkugbe OO Ojo OA Arterial blood pressure in rural and urban population of
Nigeria BMJ 1969 2 22-4
71 Okagua J Anochie IC Akani NA Adolescent blood pressure in Rivers State Nigeria
A rural-urban comparism NJP 20154221-7
72 Urrutia-Rojas X Egbuchunam CU Bae S Menchaca J Bayona M Rivers PA Singh
KP High blood pressure in school children Prevalence and risk factors BMC
Pediatrics 2006 6 32-9
73 Sorof JM Lai D Turner J Poffenbarger T Potman R Overweight ethnicity and the
prevalence of hypertension in school-aged children Pediatrics 2004 113 475-82
78
74 Rosner B Prineas R Daniels SR Blood pressure differences between blacks and
whites in relation to body size among US children and adolescents Am J Epidemiol
2000 151 1007-18
75 Harding S Whitrow M Lenguerrand E Maynard M Teyhan A Cruickshank JK Der
G Ethnic differences in blood pressure in adolescence the determinants of adolescent
social well-being and health study Hypertension 2010 55 1063-9
76 Cruickshank JK Mzayek F Liu L Kieltyka L Sherwin R Webber LS Srinavasan SR
Berenson GS Origins of the ldquoblackwhiterdquo difference in blood pressure roles of birth
77 Vlajinac H Miljus D Adanja B Marinkoic J ipetic S Kocev N Blood pressure levels
in 7 to 14-year-old Belgrade children J Human Hypertension 2003 17 761ndash5
78 Menezes AMB Hallal PC Dumith SC Adolescent blood pressure body mass index
and skin folds sorting out the effects of early weight and length gains J Epid Comm
Health 2011 12 42-8
79 Karelis AD St-Pierre DH Conus F Rabasa-Lhoret R Poehlman EJ Metabolic and
body composition factors in subgroups of obesity what do we know J Clin Endo
Metab 2004 89 2569-75
80 Katzmarzyk PT Srinivasan ER Chen W Malina RM Bouchard C Berenson GS
Body mass index waist circumference and clustering of cardiovascular disease risk
factors in a biracial sample of children and adolescents Pediatrics 2004 114 198-205
81 Guagnano MT Ballone E Colagrande V Della Vecchia R Manigrasso MR Merlitti
D Riccioni G Sensi S Large waist circumference and risk of hypertension Int J
Obesity 2001 25 1360 ndash 4
82 Araujo TA Lopes MVO Moriera RP Cavalcante TF Gurdes NG MartinS dA Silva
V Blood pressure of children and teenagers from a public school in Fortaleza - Cearaacute
Acta paul enferm 200720103-15
79
83 Sebanjo IO Oshikoya KA Obesity and blood pressure levels of adolescents in
Abeokuta Nigeria Cardiovasc J Afr 2011 221-5
84 Messerli FN Obesity and essential hypertension Haemodynamics sodium excretion
and plasma rennin activity Arch Int Med 1981 141 81-5
85 Appel LJ Brands MW Daniels SR Karanja N Elmer PJ Sacks FM Dietary
Approaches to Prevent and Treat Hypertension A Scientific Statement from the
American Heart Association Hypertension 2006 47 296-308
86 Sacks FM Svetkey LP Vollmer WM Appel LJ Bray GA Harsha D Obarzanek E
Conlin PR Miller ER 3rd Simons-Morton DG Karanja N Lin PH for the DASH-
Sodium Collaborative Research Group Effects on blood pressure of reduced dietary
sodium and the Dietary Approaches to Stop Hypertension (DASH) diet DASH-
Sodium Collaborative Research Group N Engl J Med 2001 344 3ndash10
87 Appel LJ Moore TJ Obarzanek E Vollmer WM Svetkey LP Sacks FM Bray GA
Vogt TM Cutler JA Windhauser MM Lin PH Karanja N A clinical trial of the
effects of dietary patterns on blood pressure DASH Collaborative Research Group N
Engl J Med 1997 3361117ndash24
88 Appel LJ Sacks FM Carey VJ Obarzanek E Swain JF Miller ER 3rd Conlin PR
Erlinger TP Rosner BA Laranjo NM Charleston J McCarron P Bishop LM for the
OmniHeart Collaborative Research Group Effects of protein monounsaturated fat and
carbohydrate intake on blood pressure and serum lipids results of the OmniHeart
randomized trial JAMA 2005 294 2455ndash64
89 Karanja NM Obarzanek E Lin PH McCullough ML Phillips KM Swain JF
Champagne CM Hoben KP Descriptive characteristics of the dietary patterns used in
the Dietary Approaches to Stop Hypertension Trial DASH Collaborative Research
Group J Am Diet Assoc 1999 99 19ndash27
80
90 Nwokocha ARC Adolescence and associated problems In Azubuike JC and
Nkanginieme KEO (eds) Paediatrics and Child Health in a Tropical Region African
Educational Services Owerri Nigeria 2nd edition 2007 p 84-99
91 Rogol RT Roemmich JN Clark PA Growth and puberty J Adol Hlth 2002 31 192-
200
92 Tanner JM Marshal WA Variation in the pattern of puberty changes in boys and girls
Arch Dis Child 1970 45 13-23
93 Nwakoro SO Ifoda K Onochie O Olomu JM Anthropometric assessment of
nutritional status and growth of 10-20 years individuals in Benin City metropolis
Nigeria Pakistan J Nutr 2006 5 117-21
94 Shankar RR Eckert GJ Saha C Tu W Pratt JH The change in blood pressure during
pubertal growth J Clin Endo Metab 2005 90 163-7
95 Department of Health and Human Services 2000 CDC Growth Charts for the United
States methods and development Series Report 11 No 246 Available from URL
httpwwwcdcgovGrowthCharts
96 Redwine KM Daniels SR Prehypertension in Adolescents Risk and Progression
Journ Clin Hypertension 2012 14 360ndash4
97 Falkner B Gidding SS Portman R Rosner B Blood pressure variability and
classification of prehypertension and hypertension in adolescence Pediatrics 2008
122238ndash42
98 Redwine KM Acosta AA Poffenbarger T Development of hypertension in
adolescents with pre-hypertension J Pediatr 2012 16098ndash103
99 Ejike ECCC Ugwu CE and Ezeanyika LUS Variations in the prevalence of point
prehypertension in a Nigerian school-going adolescent population living in a semi-
urban and an urban area BMC Pediatr 2010 1013
81
100 Ujunwa FA Ikefuna AN Nwokocha AR Chinawa JM Hypertension and
prehypertension among adolescents in secondary schools in Enugu South East Nigeria
Italian J Pediatr 20133970-5
101 Chobanian AV Bakris GL Black HR Seventh report of the Joint National
Committee on Prevention Detection Evaluation and Treatment of High Blood
Pressure Hypertension2003 421206ndash52
102 Lande MB Systemic Hypertension In Kliegman RM Behrman RE Jenson HG and
Stanton BF (eds) Nelson Textbook of Pediatrics Saunders Elsevier Philadelphia 19th
Edition 2011 pg 1592-8
103 Luma GB Spiotta RT Hypertension in Children and Adolescent Am Fam Physician
2006 73 1558-68
104 Arvind B Rupesh J Vijayakumar M Madhuri K Ali U Evaluation and management
of hypertension Indian Paediatr 2007 44 103-21
105 Flynn JT Neonatal hypertension Diagnosis and management Pediatr Nephrol 2000
14 332-41
106 Steyn K de Wet T Richter L Cameron N Levitt NS Morrel C Cardiovascular
diseases risk factors in 5-year old urban South African children- The Birth to Ten
Study SAMJ 2000 90 7126
107 Antia-Obong OE Antia-obong LE Arterial blood pressure of Nigerian Urban and
Rural school children Nig J Paediatr 1991 18 3-11
108 Nguyen NT Magno CP Lane KT Hinojosa MW Lane JS Association of
hypertension diabetes dyslipidemia and metabolic syndrome with obesity findings
from the National Health and Nutrition Examination Survey 1999 to 2004 J Am Coll
Surg 2008 207 928-34
82
109 Solar MB Gill A Rey J Epidemiology of arterial blood pressure in school children
population Aten Primaria 1992 9 212-4
110 Steyn K de Wet T Richter L Cameron N Levitt NS Morrel C Cardiovascular
diseases risk factors in 5-year old urban South African children- The Birth to Ten
Study SAMJ 2000 90 7126
111 Linkas J The assessment and management of hypertensive emergencies and
urgencies in children Pediatr Emerg Care 2005 21391-6
112 Croix B Feig DI Childhood hypertension is not a silent disease Pediatr Nephrol
2006 21527-32
113 Flynn JT Anderson MH Characteristics of children with primary hypertension seen
at a referral centre Pediatr Nephrol 2007 44 103-21
114 Nakao M Yano E Nomura S Kuboki T Blood pressure lowering effects of
biofeedback treatment in hypertension a meta-analysis of randomized controlled trials
Hypertension 2003 26 37- 46
115 Jalingo Available from URLhttpwwwencyclopedia Britanica Accessed on 3rd
December 2011
116 Araoye MO Research Methodology with Statistics for Health and Social Sciences
Nathadex Publishers Saw-Mill Ilorin Nigeria 2004 pg 115-21
117 Olusanya O Okpere E Ezimokhai M The importance of social class in voluntary
fertility control in a developing country West Afr J Med 1985 4 205-12
118 World Health Organization expert committee Physical status the use and
interpretation of anthropometry WHO technical report series No 894 Geneva WHO
1995 p 424ndash38
119 Guidelines subcommittee WHOISH guideline for management of hypertension J
Hypertens 1999 17 151-83
83
120 Aubay B How to measure waist circumference Available from
URLhttpwwwehowcom Last updated August 10th 2011 and accessed on December
9th 2011
APPENDICES
Appendix 1
PROFORMA ON BLOOD PRESSURE PATTERN IN APPARENTLY HEALTHY
SECONDARY SCHOOL ADOLESCENTS IN JALINGO
PUBLIC SCHOOL [ ]
Serial No
84
PRIVATE SCHOOL [ ]
A BIODATA
1 Age (years) 10[ ] 11[ ] 12[ ] 13[ ] 14[ ] 15[ ] 16[ ] 17[ ] 18[ ] 19[ ]
2 Gender M [ ] F [ ]
3 Class JSS 1-3 [ ] SS1-3 [ ]
B MEDICAL AND SOCIAL HISTORY Yes [1] No [2]
1 Have you ever passed blood in your urine [ ]
2 Have you ever had your face or legs swollen [ ]
3 Are you on any drug for long time (such as pills steroids marijuana codeine
NSAIDs containing drugs tramal and others) [ ]
If yes specifyhelliphelliphellip
C SOCIO-ECONOMIC CLASSIFICATION
Fatherrsquos occupation
Score 1 Professionals top civil servants politicians and top businessmen
2Middle-level civil servants technicians skilled-artisans and well-to-do
traders
3 Unskilled workers and those in general whose income would be at or below
the national minimum wage
Mothers educational level
Score 0 Education up to University level
1 Secondary or tertiary level below the University
2 No formal education or up to primary level only
D ANTHROPOMETRY
i Weight (Kg) ndash 1helliphellip 2helliphelliphellip Averagehelliphelliphelliphellip
ii Height (m) ndash 1helliphellip 2helliphellip Averagehelliphelliphelliphellip
85
iii Body mass index = weightheight (kgm2)
v Waist circumference (cm) ndash 1helliphellip 2helliphelliphellip Averagehelliphelliphelliphellip
iv Blood Pressure (mmHg) - 1helliphellip 2hellip 3helliphellip Averagehelliphelliphelliphellip
Appendix 2
AUTHORIZATION AND CONSENT TO PARTICIPATE IN A RESEARCH
I Dr Peter Teru Yaru of the Department of Paediatrics Ahmadu Bello University
Teaching Hospital (ABUTH) Zaria Irsquom conducting a research on the blood pressure
pattern among secondary school adolescents in Jalingo
The aim of the study is to know the level of blood pressure among their age
groups Those with high blood pressure (or hypertension) will be identified appropriately
advised and referred for further care The study will involve taking their weight height
blood pressure and waist circumference Female assistants shall be responsible for
86
measuring waist circumference of female students Students will also be given a
questionnaire on some of their activities drug use among others all aimed at looking for
factors which can affect their blood pressure Information obtained shall be treated with
utmost confidentiality and for this research work only Please note that participation is
voluntary I will be glad if you give consent for your childward to participate in the
study
Statement by parents Irsquove read and understood this consent form and agreed for my
child to be included in the study
Parents name Researcherrsquos name and sign
Parents phone no if any Date
Parents signthumb print Phone no
87
Appendix 3
SOCIO-ECONOMIC SCORE
The classification of socio-economic scores based on fatherrsquos occupation and motherrsquos
education by Olusanya et al117
A Husband (fatherrsquos occupation)
Score 1 Professionals top civil servants politicians and businessmen
2 Middle-level bureaucrats technicians skilled-artisans and well-to-do traders
3 Unskilled workers and those in general whose income would be at or below
the national minimum wage
B Mothers educational level
Score 0 Education up to University level
1 Secondary or tertiary level below the University
2 No formal education or up to primary level only
The socio-economic class of the childrsquos mother is obtained by adding the scores from A
and B above and graded I-V as appropriate for example
Score (1) from A plus score (0) from B = social class I
Score (2) from A plus score (0) from B = social class II
Score (2) from A plus score (1) from B = social class III
Score (2) from A plus score (2) from B = social class IV
Score (3) from A plus score (0) from B = social class III
Score (3) from A plus score (1) from B = social class IV
Score (3) from A plus score (2) from B= social class V
Page 14
14
onset of hypertension the greater the reduction in life expectancy if left untreated13 Even
asymptomatic adolescents with mild blood pressure elevations can have target organ
damage10 Studies121420 have shown that early identification and intervention may lead to a
significant reduction in the high prevalence of hypertension and metabolic syndrome
currently observed in adults In view of this routine blood pressure check-ups for children
and adolescents have been advocated during medical evaluations8 Blood pressure is
however not routinely measured in most paediatric clinical practices in Nigeria
Consequently only few children will have their blood pressure measured when they fall sick
or during preventive care visits In addition hospital and clinic BP measurements may be
associated with falsely elevated BP called lsquolsquowhite coat hypertensionrsquorsquo8 BP measurement of
children outside of the hospital setting such as in schools will provide opportunity for
apparently healthy individuals and possibly eliminate white coat hypertension The need for
surveillance for the early identification of adolescents in Jalingo who are at risk of
hypertension and to initiate measures aimed at preventing its consequences is therefore the
justification for this study In addition the study will add to the body of knowledge on
adolescent blood pressure as there has been no previous study on BP from Jalingo and
northeastern Nigeria as a whole This will help inform public health policies regarding blood
pressure control and prevention in Taraba State in particular and in Nigeria in general
15
LITERATURE REVIEW
HISTORICAL PERSPECTIVE
Blood pressure measurement first started in the eighteenth century with the experiment of
Stephen Hales to whom its discovery can be attributed as reported by Jeremy2324
Accurate study of blood pressure as reported by Crile25 began with the introduction of a
manometer by Poiseuille a century later The first truly accurate blood pressure
measurement in man was by the Surgeon Faivre in 1856 when he connected an artery to a
mercury manometer to obtain direct readings24 Non-invasive methods of BP
measurement started with the discovery of the sphygmograph in 1855 by Vierordt as
reported by Crile25 and improvement by Potain in 1889 gave birth to the
sphygmomanometer26 In 1896 Scipione Riva-Rocci developed the method upon which
present-day technique is based27
Segal28 reported that the use of stethoscope for BP measurement was first highlighted
in 1905 by a Russian surgeon Korotkoff who documented hearing a tapping sound using a
stethoscope placed over the brachial artery as the Riva-Rocci cuff was deflated Goodman
and Howell29 recommended the division of the changing sounds into five distinct phases and
physicians subsequently determined blood pressure according to the point of appearance and
muffling or disappearance of the sounds30
DEFINITION AND REGULATION OF BLOOD PRESSURE
Blood pressure is defined as the product of cardiac output and peripheral vascular
resistance131 During each heartbeat BP varies between a maximum (systolic) and a
minimum (diastolic) pressure and is measured in millimeters of mercury (mmHg)1 Blood
16
pressure is regulated by different mechanisms acting either rapidly or slowly to maintain it
within normal range for optimal cellular performance3132
Intrinsic Regulation
Intrinsic factors regulating BP include stroke volume and heart rate which both influence
cardiac output31 Stroke volume depends on the volume of blood that fills the ventricles and
this depends on the preload and afterload33 A higher afterload will decrease stroke volume
causing low cardiac output and low BP and vice versa When cardiac output increases more
volume is derived from the venous pool increasing preload Similarly an increased heart rate
will lead to increased cardiac output and BP3134
Reflex Regulation
The baroreceptors within the aortic arch and carotid sinuses contain sympathetic and
parasympathetic nerve fibres3435 These are sensory nerves which run from the medulla
and they respond to stretch of the tissue in which they lie by increasing or decreasing the
rate of signaling36 and act fast in regulating BP34 Sympathetic stimulation causes
increased heart rate and widespread vasoconstriction to increase BP while
parasympathetic stimulation produces the opposite3537
Hormonal Regulation
Hormones regulating blood pressure include renin-angiotensin-aldosterone and
antidiuretic hormone (ADH) They act slowly by responding to changes in intravascular
volume and osmolality38 Angiotensin II is a potent vasoconstrictor and stimulates the
release of aldosterone from the adrenal gland39 Aldosterone increases sodium absorption
and fluid retention leading to increased BP ADH is a potent vasoconstrictor and plasma
volume regulator and its stimulation results in fluid retention and vasoconstriction39
Other hormones regulating BP include the sex hormones thyroid parathyroid cortisol
and ACTH They act on the rennin-angiotensin-aldosterone system to regulate BP3940
17
Renal Regulation
The kidneys control blood pressure through the retention and excretion of extracellular
fluid35 An increase in renal fluid retention will increase extracellular volume and higher
blood pressure whereas increased renal excretion leads to lower blood pressure41 This is
achieved through the action of ADH aldosterone and atrial natriuretic peptide (ANP)41
METHODS OF MEASURING BLOOD PRESSURE
Blood pressure can be measured by invasive and non-invasive methods
1) Invasive (or direct) method - Blood pressure is most accurately measured invasively
through an arterial line4243 It is the gold standard by which the accuracy of other blood
pressure measuring devices and methods are assessed4344 Chyun43 compared direct and
indirect blood pressure readings in 14 intensive care unit patients and found that the
auscultatory method overestimates the systolic and diastolic BP especially if the VI Kortkoff
sounds is used as an indicator of diastolic BP This can often over estimate reading by as
much as 20 mm Hg43 This study is made up of very small sample size to make general
conclusion on the differences in BP values from the two methods compared Although the
invasive method is the gold standard for true BP measurement it is associated with serious
complications related to arterial catheterization and the procedure itself may be technically
difficult It is mainly used in experimental procedures and in monitoring critically ill patients
in intensive care units42
2) Non invasive (indirect) methods These are simpler and quicker than the invasive
method and are commonly used for routine blood pressure examinations They may
however yield lower accuracy and small systematic differences in numerical results43
These methods include-
18
a) Palpation method - A minimum systolic value can be estimated by palpation Deakin
and Low45 reported that a palpable radial femoral or carotid pulse indicates a minimum
systolic BP of 80 70 and 60 mmHg respectively The study was carried out among adults
and these values could not be applicable in children and neonate whose maximum
systolic BP may be lower than the reported minimum values A more accurate systolic BP
value can be determined by inflating and then deflating sphygmomanometer cuff while
palpating the pulse The systolic BP corresponds to the pressure at which the radial pulse
becomes palpable45 Its disadvantages are that pressure obtained is usually 2-5mmHg less
than those obtained by auscultation and diastolic BP cannot be measured32
b) Auscultation method- Also called the Korotkoff method is the method of choice in
clinical practice142 It involves using a stethoscope and a sphygmomanometer46 The
mercury sphygmomanometer is the gold standard for BP measurement A Riva-Rocci
cuff 27 is placed over the arm and inflated to occlude the brachial artery It is then
gradually deflated until blood flow is re-established accompanied by a tapping sound
which can be detected by the stethoscope held over the artery Five sounds are
traditionally heard and classified into phases30 The first phase corresponds to the systolic
BP while the last or fifth phase corresponds to the diastolic BP30 The fourth phase
alternatively is used to measure the diastolic pressure if a 10 mmHg or greater
differences exist between the initiation of phases fourth and five or if the fifth sound is
heard down to 0 mmHg8 This may occur in cases of high cardiac output or peripheral
vasodilatation children or in pregnancy This method though the method of choice in
clinical practice may however be associated with errors arising from faulty technique and
equipment4748 as well as observer bias49 This method was used for this study because of
its widespread general usage its reliability and accuracy Unlike other methods the
instruments (mercury sphygmomanometer and stethoscope) do not require any
19
calibration and values obtained do not require validation by other methods The standard
World Health OrganizationCenter for Disease Control (WHOCDC) blood pressure
reference percentile tables were generated using the mercury sphygmomanometer hence
the auscultation method is the gold standard for BP evaluation258
The aneroid sphygmomanometer measures BP by mechanical system of metal
bellows that expand as the cuff pressure increases in a series of levers that register the
pressure on a circular scale The hybrid shygmomanometer combines some of the features
of the two and uses an electric transducer to record blood pressure2
c) Oscillometric technique- This uses the oscillometric device Oscillation of pressure in a
sphygmomanometer cuff is recorded during gradual deflation The point of maximum
oscillation corresponds to the mean arterial pressure50 The oscillation begins well above
systolic BP and continues below diastolic BP so that systolic and diastolic BP can only
be estimated indirectly according to some empirically derived algorithm
d) Ultrasound method - This uses an ultrasound transmitter and receiver placed over the
brachial artery under a sphygmomanometer cuff As the cuff is deflated the movement of
the arterial wall and systolic BP cause a Doppler phase shift in the reflected ultrasound
The diastolic BP is recorded as the point of diminished arterial motion51 Its advantage
includes the ability to detect diastolic BP in atrial fibrillation and hypotension where
Korotkoff sound is faint152
FACTORS AFFECTING BLOOD PRESSURE IN ADOLESCENTS
Several inter-related factors affect blood pressure These include-
Age - A progressive BP elevation with age has been observed in several studies2153-55
The rate of rise varies in boys and girls5455 The average systolic increase ranges between
20
166 and 286 mmHgyr for boys and 144 and 263mmHgyr for girls while that of
diastolic BP ranges from 083 and 177mmHgyr for boys and 077 and 148mmHg for
girls2155 Bugaje Yakubu and Ogala21 studied blood pressure pattern among 2035
adolescents in Zaria and found a consistent rise of BP with age The rate of rise was fairly
constant until 11-13 years in boys and 12-14 years in girls when the rise became rapid A
similar study53 also found a BP rise with age among 650 healthy school children in Jos In
a large population studies in Lebanon56 and Saudi Arabia55 BP was similarly reported to
increase consistently with age Rapid growth and biological maturation of organs which
are normal occurrences during adolescence were thought to be responsible rather than the
chronological age56 The results of these studies showed increasing blood pressure with
age despite the fact that one study55 used oscillometric method for their study while the
standard auscultation was used in the other studies Also the studied sample sizes across
these studies varied greatly with sizes of 65053 203521 571054 and 1622655 Despite this
the findings were similar
Gender ndash Results of studies on the effect of gender on BP showed that sex positively
affects blood pressure2153-55 Merhi Al-Hajj and Al-Tannir et al54 studied BP pattern in
5710 Lebanese school children while Al-Salloum El-Mouzan and Al-Herbish et al55
studied BP pattern in 16226 Saudi children and adolescents The authors reported a
higher BP in girls than boys at all ages A study21 of BP pattern in adolescents in Zaria
Nigeria demonstrated an initial higher BP in boys before puberty which reversed with the
onset of puberty up to the age of 14-15yrs when it reversed again to be higher in boys
Akinkugbe Akinwolere and Kayode56 reported no sex differences in adolescent BP in
Ibadan The reported sex difference is said to be likely due to differences in sex hormone
and pattern of growth in boys and girls57 Differences in age range of the study population
may however be responsible for the observed BP variation For instance these studies5455
21
comprised of both adolescents and pre-adolescent age groups combined in one study
while the other two studies2156 were purely adolescents21 Blood pressure is reported to be
equal in both sexes before adolescence after which the gender difference starts to
manifest most likely due to physical and hormonal changes
Socioeconomic Factors - Belonging to either end of the socioeconomic strata is found to
be associated with elevated blood pressure5859 A study in Ibadan56 reported an inverse
relationship between parental socioeconomic status and level of BP in adolescents The
authors suggested that this might be the result of the health behaviours and problems
characteristic of the lower socioeconomic class On the other hand Ejeke Ugwu and
Ezeanyika et al60 in Lokoja and another study53 in Jos both found higher BP in children
from high socioeconomic class Colhoun Hemminway and Poulter61 in a meta-analysis of
BP and socioeconomic status in developed and developing countries found an inverse
relationship of BP with socioeconomic status in developed nations and a direct correlation
in developing countries These different findings may be due to methodological
differences in socio-demographic stratification For instance Akinkugbe and
colleagues59 used fatherrsquos level of education for social classification Parentrsquos educational
level may however not equate well with level of family income The other study60 used an
automated device for their study whose values may require validation using the
recommended auscultation method Difference in environmental stresses may also be
different considering the level of development of the areas where the studies were carried
out
GeneticFamilial Factors - The effect of geneticfamilial factors on BP has been
demonstrated in some studies62-64 Familialgenetic correlations reflected in BP and other
anthropometry generally are higher among genetically close relatives such as brother-
sisters or parent-offspring than among spouses62 Levshit and Gerber63 surveyed 514
22
individuals from 135 nuclear families in Russia while Budaruddoza62 studied 1400
individuals from 380 families in India and found significant genetic influence on BP
Mijinyawa Iliyasu and Borodo65 also reported family history of hypertension as risk
factor for developing high BP in a study on prevalence of hypertension among 1000
teenagers in Kano The authors concluded that this could be due to genetic predisposition
They however did not evaluate further to determine the genetic defects The authors did
not also consider shared environmental factors known to influence blood pressure in
individuals Molecular genetic studies have identified genes as possible regulators of
BP6667 These genes regulate the renin-angiotensin-aldosterone system involved in renal
salt handling69 Mutations that increase sodium reabsorption and salt sensitivity is
associated with higher BP and vice versa68 while shared environmental risk factors may
potentiate the development of such familial conditions which might have been
responsible for outcome of the above studies6364
Environmental Factors ndash Environmental factors greatly influence BP variation in a
population592269 Akinkugbe and Ojo70 reported a consistently higher BP in Nigerian
adolescents than their counterparts of similar ages in black and white American children
The authors are of the view that this could be due to different environmental factors of the
study population Obika Adedoyin and Olowoyeye22 studied BP pattern in 2526
children aged 1-14 years in rural semi-urban and urban communities in Ilorin Nigeria
and demonstrated a hypertension prevalence of 95 in urban compared to 63 in rural
communities This was similar to the study59 in Ghana and Gambia69 The authors592269
argued that the differences were due to socioeconomic status which is higher in the urban
than the rural areas The BP variation could be accounted for by the nature of dietary
intake since the rural communities generally consume more of natural foods with less salt
and lsquojunk foodsrsquo compared to the urban populace This was demonstrated by one study61
23
which reported higher mean BP among urban communities in developing nations due to
changes in their dietary pattern Rural areas are also less exposed to the stress and hassle
of the urban cities It is of interest to note however that urban areas are a mixture of
social classes as a result of migrant workers seeking lsquogreener pasturesrsquo Okagua Anochie
and Akani71 on the other hand reported higher mean BP among rural adolescents than
their urban counter parts in Port Harcourt The authors could not identify the reason(s) for
their finding but concluded that the seemingly protective privilege of rural life may be
fading gradually The differences in the reports could however result from the sample size
composition comprising of preadolescents22 adolescents71 and adults69
Race - Higher BP levels have been reported in African-American and Hispanic school-
age children than their Caucasian counterparts and among African-Americans than the
Hispanics7273 Akinkugbe and Ojo70 demonstrated a consistently high systolic and
diastolic BP in Nigerian children compared with black and white American children of
similar age Exposure to chronic environmental stress low socioeconomic status and high
obesity rate among African American and Hispanic youths could contribute to higher
BP72-74 It can be inferred from the study that race alone may not be responsible for the
observed differences but shared environmental factors and socioeconomic status may be
contributory77 Other studies7475 however found no significant BP differences in relation
to race
Anthropometry and blood pressure (BP) - A positive correlation has been observed
between BP and anthropometry in various studies58-5977 These studies585678 observed a
significant correlation between systolic BP and weight height and body mass index
(BMI) in boys but only with weight in girls Body mass index (BMI) is used as a
measure of overall obesity but it is known to be a poor indicator of actual body fat79
Waist circumference (WC) is an aggregate measurement of the actual amount of total and
24
abdominal fat accumulation80 It is therefore a better predictor of BP and other
cardiovascular diseases8081 Guagnano Ballone and Colagrande et al81 studied the
relationship between BP and BMI WC and waist hip ratio (WHR) in 461 people and
found WC to be the most consistent anthropometry affecting BP It is of interest to note
that the study by Guagnano et al81 was in adults population while the other studies56-59
were in children and adolescents WC was also found to be a better predictor of BP in an
Italian study8081 while it was not in others56-6982 Comparing BMI and waist
circumference and their effects on BP Arauzo Lopes and Moriera et al83 in Brazilian
children found BMI to be a better predictor of BP than waist circumference This was
similar to the study by Sebanjo and Oshikoya82 in Nigerian adolescents in Akure Thus
waist circumference measurements may not be useful in the evaluation of obesity andor
hypertension in children and adolescents This may partly be explained by the uniform fat
distribution due to hormonal effect at puberty in adolescents compared to the
disproportionate fat distribution in adults Possible mechanisms for the positive
relationship between BP and high BMI includes decreased physical activity increased
salt intake impaired pulmonary functions and development of metabolic abnormalities
such as dyslipidaemia and insulin resistance8084
Nutritional factors - Diet has been a primary link between humans and their environment
and substantial evidence supports the concept that multiple dietary factors affect BP85
Well-established dietary modifications that lower BP are reduced salt intake increased
potassium intake increased protein particularly plant protein high vegetable and
polyunsaturated fats85 High sodium intake on the other hand is said to be associated with
elevated blood pressure86 A series of 3 large controlled feeding studies tested the effects
of dietary patterns on BP86-89 Of the 3 diets studied the dietary approach to stop
hypertension (DASH) emphasized fruits vegetables low-fat dairy products whole
25
grains poultry fish nuts potassium magnesium calcium and fibre as the most effective
diet89 Among all participants the DASH diet significantly lowered mean systolic BP by
55 mm Hg and mean diastolic BP by 30 mm Hg each net of changes in the control diet
DEFINITION AND CLASSIFICATION OF ADOLESCENCE
Adolescence is the transitional stage between childhood and adulthood during which many
life patterns are learnt and established90 According to World Health Organization (WHO)
adolescents are individuals between the age range of 10-19 years17 The most significant
feature of adolescence is puberty characterized by an exceptionally rapid rate of biological
growth and development including physical and sexual maturation9091 The pubertal changes
have been described by Tanner and Marshal92 and are grouped into five stages This utilizes
definite criteria for growth and development of secondary sexual characteristics like pubic
hair and breast in females and pubic hair and genitalia in males9092 The timing of these
events and the rate of growth vary due to genetic and environmental factors in different
populations92 Adolescence is divided into early middle and late periods17
Early adolescence (10-13 years) ndash This is a period of rapid growth and development of
secondary sexual characteristics and varies according to sex It corresponds to Tanner stages
1 and 290 The main features of this stage are breast bud development and menarche in girls
while testicular enlargement and seminal emission occurs in boys93
Middle adolescence (14-16 years) ndash In this stage rapid growth decreases and there is more
cognitive development as the adolescents move from concrete thinking to formal operation
and develop greater competence at abstract thinking91 This corresponds to Tanner stages 3
and 4
Late adolescence (17-19 years) ndash Here slowing of physical changes continue which permits
the emergence of a more stable body image Cognition tends to be less self-centered with
26
demonstration of care for others with increasing thought about concepts such as justice
patriotism and history It corresponds to Tanner stage 59092
ADOLESCENCE AND BLOOD PRESSURE
Adolescence is characteristically associated with increasing blood pressure because of the
physical growth and hormonal changes associated with puberty5794 After the age of one year
normal BP increases more during puberty than probably at any other time in an individualrsquos
lifetime95 Wanzhu Eckert and Saha et al57 examined data from a cohort of 182 normotensive
children in Indiana who had blood pressure measurements taken semi-annually for up to 12
yr The authors found that the rate of change in BP and weight peaked at the age of maximum
pubertal growth spurt (PGS) This BP spurt roughly coincides with growth spurt during
puberty94 Surveys of BP patterns from childhood through adolescence shows systolic and
diastolic pressures increase with age and in adolescents the increase in males is more marked
than in females especially the systolic pressure5458229495
CLASSIFICATION OF BLOOD PRESSURE IN ADOLESCENTS
The National High Blood Pressure Education Program Working Group (NHBPEPWG) of the
United States established guidelines for the definition of normal and elevated blood pressures
in children in 19876 These guidelines were revised in 20048 The definition of childhood
hypertension in the guidelines are based upon the normative distribution of blood pressure
(BP) in healthy children rather than clinical outcome data as in adults The guidelines
classified BP as normal prehypertensive or hypertensive Hypertension is graded into stage
one and two8
Normal BP - Blood pressure lt90th percentile for age sex and height Children and
adolescents with normal BP should be followed annually from the age of 3 years5 They
27
should be encouraged to maintain a healthy life style such as good dietary intake physical
activities and adequate rest8
Pre-hypertension - Blood pressure between the 90th and lt 95th or if BP exceeds
12080mmHg (even if lt90th percentile) but lt95th It was previously called high normal
BP This new description was introduced to help identify children at risk for the
development of persistent hypertension for whom targeted prevention programmes would
be most beneficial96 While recommendations for the diagnosis of hypertension in
children require that BP remains elevated on three separate occasions repeated
measurements are not necessary to classify an adolescent as pre-hypertensive11 The
prevalence of childhoodadolescence pre-hypertension in US is reported to be between
12-1796-98 In Nigeria Ejeke Ugwu and Ezeanyika99 in a study of the prevalence of
point prehypertension and hypertension in 843 adolescents in Lokoja reported a
prevalence of point prehypertension of 222 and 250 in semi urban and urban
communities respectively Ujunwa Ikefuna and Nwokocha et al100 reported 175
prehypertension prevalence among adolescents in Enugu Among adults with pre-
hypertension it is reported that as much as 10 per year develop hypertension101 There
is little information on the time course for children and adolescents with prehypertension
developing hypertension A value of between 11-7 per year has been reported in US
adolescents98 There is no known study on rate of progression of prehypertension to
hypertension in Nigerian adolescents The NHBPEP recommended that children with
pre-hypertension should have their BP checked after every six (6) months to monitor for
progression to hypertension They should be encouraged to engage in physical activity
healthy dietary behaviours and weight management if overweight Pharmacologic therapy
is not indicated except if there is strong evidence of renal disease heart failure left
ventricular hypertrophy or diabetes mellitus8
28
Hypertension Hypertension is BP persistently equal to or above the 95th percentile for
age sex and height measured on three or more separate occasions If the blood pressure
measurement obtained is gt 95th percentile the degree of hypertension should be staged
Stage 1 hypertension- BP value between the 95th and the 99th percentile plus 5mmHg It
is recommended that BP should be rechecked in 1ndash2 wks or sooner if the patient is
symptomatic If persistently elevated on 2 additional occasions it should be evaluated or
referred to source of care for pharmacologic treatment within 1 month 8
Stage 2 hypertension- BP value gt99th percentile plus 5mmHg This stage calls for more
prompt evaluation and commencement of pharmacologic therapy102 It is recommended
that the individual be evaluated or referred to source of care within 1wk or immediately if
the patient is symptomatic8
Aetiology of hypertension
Hypertension is classified as primary (essential) when there is no identifiable cause
or secondary if due to an underlying disease31 Factors such as heredity diet stress drugs and
obesity play a role in the development of essential hypertension103104 Causes of secondary
hypertension include umbilical artery catheterization renal diseases coarctation of the aorta
and endocrine disorders105106 Aderele and Sereki6 in their study of hypertension in children
reported hypertension secondary to renal pathology as the commonest cause of elevated BP
in children This study was mainly in preadolescent population in which secondary
hypertension is a common finding On the other hand Antia-Obong and Antia-Obong107
reported no apparent cause in greater than 90 of the studied subjects with elevated BP and
also reported proteinuria of 1 in the same population without any associated elevated blood
pressure The study did not however evaluate the etiology of the proteinuria A study65 of BP
in teenagers in Kano found family history of hypertension a risk factor in the study
population Another study in Enugu100 examined modifiable risk factors associated with
29
hypertension in 2694 adolescents and found only 1 and 06 of the hypertensive subjects
to be overweight and obese respectively The authors also found that smoking and alcohol
consumption were not significant risk for hypertension This may however be due to the
shorter period of consumption of these products by the students as a cumulative effect from
long term consumption is known to be associated with adverse health outcomes
Prevalence of hypertension in adolescents
The prevalence of hypertension in adolescents varies widely due to arbitrary and imprecise
definition by different researchers It was in view of this that the National High Blood
Pressure Education Program Working Group (NHBPEPWG) of the United States established
guidelines for the definition of normal and elevated blood pressures in children and
adolescents for uniformity68 In the USA the prevalence is about 20 in normal weight and
50 in their obese counterparts108 A prevalence rate of 77109 10554 and 223110 has
been reported in Spain Lebanon and South Africa respectively In Kano Nigeria a study65
on the prevalence of hypertension among 1000 teenagers found a prevalence of 72 Similar
study in Enugu100 on the prevalence of hypertension among 2694 secondary school
adolescents reported a hypertension prevalence of 54 It is of interest to note that different
prevalence was reported because of the different methodology used by the authors While the
study in Kano65 applied the adult blood pressure criterion of BP greater than 14090mmHg as
hypertension the study in Enugu100 used blood pressure greater than 95th percentile for age
and sex Also the study in Kano65 took a single set of measurement while the study100 in
Enugu measured blood pressure of the subject three times at weekly intervals Bugaje
Yakubu and Ogala21 on the other hand defined hypertension as blood pressure greater than
two standard deviations from the mean and also took six readings over thirty minutes and got
a prevalence of hypertension of 34 A prevalence rate of 48107 and 9522 in Southern
and Western region of the Nigeria respectively was also reported It is obvious that because
30
of the various defining criteria for hypertension in adolescents the prevalence of adolescent
hypertension remains imprecise
Clinical presentation- Hypertension is usually asymptomatic unless it has been
sustained or is rising rapidly109 Adolescents with essential hypertension are usually
detected during routine evaluation96 Non-specific symptoms such as lethargy headache
dizziness drowsiness visual disturbance and confusion may be present109 These could
also be signs of complications111 Secondary hypertension may show obvious features of
the underlying disease such as growth failure heat intolerance abdominal stria tremors
body swelling and haematuria8102 Croix and Feig112 studied the spectrum of symptoms in
409 children aged 7-18 years newly diagnosed hypertensive in Texas USA and reported
15 common symptoms than in the controls The symptoms were said to resolve after
commencement of antihypertensive medications The authors concluded that hypertensive
children had a variety of non-specific symptoms The three most common symptoms
reported were headache daytime tiredness and difficulty initiating sleep The study
however did not specify if other possible causes of these symptoms were excluded
Complications of hypertension - Hypertension is usually asymptomatic in adolescents
which if left unidentified overtime can cause serious complications109 Organs commonly
affected in the complication of hypertension are the heart kidneys brain and the eyes
leading to lowered life expectancy and premature death13 Left ventricular hypertrophy
(LVH) is the most prominent clinical evidence of end organ damage10 Studies have
shown that LVH can be seen in as many as 41 of patients even in adolescents with
asymptomatic hypertension10103 Adolescents with severe cases of hypertension are also
at increased risk of developing hypertensive encephalopathy seizures cerebrovascular
accidents and congestive heart failure103109 However data documenting such
complications in children and adolescents are generally lacking In a study of
31
hypertension among teenagers in Kano the researchers65 could not find any
complications in all the 1000 teenagers studied
Investigations and treatment- Basic investigations are all that may be required in
adolescents who are obese and with a family history of hypertension stage 1 disease and
normal findings on physical examination113 This is because primary hypertension is
commoner in adolescents Adolescents that are symptomatic or with stage 2 hypertension or
have features of secondary hypertension should be evaluated in more detail
Treatment of hypertension includes non-pharmacological and pharmacological
methods Non-pharmacologic management involves life style modification such as weight
reduction increased physical activities and dietary adjustment114 In a study to evaluate the
effect of diet and salt on treatment and prevention of hypertension Sacks Svetkey and
Vollmer et al86 reported the beneficial effect of both reduced salt intake and appropriate
dietary adjustment in the control of hypertension Similar benefits were reported in other
studies8788 Although both studies had fairly good sample size (n=412) the studies did not
specify if participants were on other substances or activities other than antihypertensive that
might have affected their BP The studies were also in adults and whether it has the same
effects in children and adolescents has not been evaluation However there is no doubt that
the outcome will be similar in adolescents as dietary modifications have been advocated as
non-pharmacologic management in them Non pharmacologic treatment is usually the initial
treatment in essential hypertension and as adjuvant to drug therapy in those with secondary or
complicated hypertension101114 Pharmacologic (drug) treatment includes diuretics beta-
blockers calcium channel blockers angiotensin converting enzyme inhibitors (ACEIs) and
angiotensin receptor blockers (ARB) among others106114 They are used in those with
symptomatic disease and in acute or chronic complications106
32
Prevention of hypertension may be viewed as part of the prevention of cardiovascular
disease102 In adolescents approaches to prevention include reduction in obesity
discouraging cigarette smoking and alcohol intake113 reduction in sodium intake and increase
in physical activity through community and school-based programmes103104 Growth
monitoring BP check during preventive care visit physical activity and urine screening for
proteinuria and haematuria can be used starting from early childhood
33
AIM AND OBJECTIVES
GENERAL AIM
To determine the blood pressure pattern of apparently healthy secondary school adolescents
in Jalingo Taraba State
SPECIFIC OBJECTIVES
To determine
1 Blood pressure pattern in relation to age and sex among adolescents aged 10-19
years
2 The relationship if any between blood pressure and the anthropometric parameters of
weight height BMI and waist circumference
3 The association between blood pressure and parental social-economic status
4 The point prevalence of prehypertension and hypertension in adolescents
34
MATERIALS AND METHODS
Study area
A cross-sectional survey of the blood pressure pattern of apparently healthy secondary
school adolescents aged 10-19 years was conducted in Jalingo over a six month period
from January to June 2014 Jalingo is the capital of Taraba State and lies within the
savannah belt of North Eastern Nigeria It lies between latitude 80 54rsquo north and longitude
110 21rsquo east and at an altitude of 360 meters above sea level115 Jalingo had a population of
118198 people18 The primary inhabitants are the Konas Mumuyes and Fulanis who are
mostly farmers Other indigenous ethnic groups include the Jukun Kuteb WurkumTiv
and host of other tribes The Ibos Hausas Yorubas among others are the non-indigenous
ethnic groups and are mostly civil servants and businessmen Jalingo has a tertiary health
centre the Federal Medical Centre Jalingo and the state specialist hospital It also has 15
private clinicshospital and many primary health care centres There are also tertiary
education institutions including Taraba State University As at 2013 there were 56
secondary schools in Jalingo 24 public and 32 private all of which were mixed schools
except one which is a girlsrsquo only school
Study design
The study was a cross sectional descriptive study of 1350 apparently healthy secondary
school adolescents in Jalingo
Ethical approval
Ethical approval for this study was obtained from the Scientific and Health Ethics Research
Committee of Ahmadu Bello University Teaching Hospital Zaria (Appendix 4) The Taraba
State Ministry of Education also gave the approval and permission to conduct the study in the
35
selected schools Consent was given by the studentsrsquo parents or guardian (Appendix 2) All
students whose parents gave consent voluntarily participated in the study
Sample size determination
The minimum sample size was calculated using the formula116
N=Z2 (pq) E2
Where N = minimum sample size
p = Prevalence of hypertension in adolescents A prevalence of 3421 was used
q = 1- p
E = margin of error tolerated =1
Z = 196 at 95 confidence level
N = 1962 x 0034 x (1-0034) 0012 = 1262
Therefore the minimum sample size was one thousand two hundred and sixty two
Allowance for non-responders of 5 63 extra subjects were added to the calculated
minimum sample size bringing the total to 1325 students To enhance representativeness of
the sample and to compensate for missing information and poorly filled proforma while
maintaining the sample size a total of 1350 was decided upon
Inclusion criteria
1 Students (ages 10-19 years) in the selected secondary schools
2 Students whose parents gave consent to participate in the study
3 Students who gave assent to participate in the study
Exclusion criteria
1 Students who had obvious skeletal deformities of the spine and legs which can affect
the height and ultimately the BMI
36
2 Students with known chronic disease (or history of such disease) like anaemia
chronic renal disease and cardiac disease because they are not apparently healthy and
these conditions could affect their blood pressure
3 Students with present or past history of chronic drug ingestion that can affect blood
pressure such as steriods and contraceptives
4 Students with high blood pressure already on antihypertensive
Pilot study
A pilot study was carried out in one of the schools a week before the commencement of
the study The school was selected by random sampling method using balloting and did
not participate in the main study The pilot study was carried out with the aim of
assessing the competence of the research assistants in the various measurements
following their training to ensure reliability It was also used to test the questionnaire
before its use during the main study and to provide information on the number of students
that can be measured in a day Consequently twenty students had their blood pressure
and anthropometry measured independently by the researcher and the research assistants
and data were compared using Students t-test There were no statistically significant
differences between the measurements The result of the pilot study is highlighted in
Table I It was also found that some parts of the questionnaire were not well understood
by most students and were adjusted appropriately in the main study (Appendix 1) The 20
students had their measurements done over a period of 3-4 hours (between 8am - 12noon)
by the researcher and the research assistants
Table I Result of pilot study
Variables Researcher Research t p
37
assistants
Mean(plusmnSD) SBP
mmHg
106(11) 104(12) 0550 0586
Mean(plusmnSD) DBP
mmHg
617(83) 63(10) 0450 0657
Mean(plusmnSD) Weight
kg
544(82) 527(122) 0520 0608
Mean(plusmnSD) Height m 16(01) 16(01) 0000 1000
Mean(plusmnSD) BMI
kgm2
198(36) 202(33) 0370 0716
Mean(plusmnSD) WC cm 692(72) 682(133) 0300 0769
Sampling method
Students were selected by multistage random sampling technique The list of secondary
schools obtained from the Taraba State Post Primary Schools Board served as the sampling
frame for schools There were 56 secondary schools 24 of which were public and 32 were
private schools a ratio of 113 Ten (10) schools were randomly selected by balloting four
(4) from public schools six (6) from private based on the number and approximately similar
ratio of private to public schools of 115 (46) Ten schools were selected to ensure wider
coverage and even distribution of students so that it could be truly representative of the
community All the ten schools had an overall total of eight thousand one hundred and seven
(8107) students The public schools had a total of five thousand nine hundred and forty
(5940) with nine hundred and eighty nine (989) students participating The private schools
had a total of two thousand one hundred and sixty-seven (2167) students with three hundred
and sixty one (361) participating These number (989 and 361) was calculated based on the
38
relative population of each school and proportionate to number of students in each school
Thereafter the number of students to participate per school was calculated proportionately to
the number of students in each school based on the number given by the school authority
Then the number in each class was also calculated proportionately from JSS1 to SS3 to
ensure fair and equal chance of participation for all age groups The calculation was done
thus n= a b x c
Where n= number of students per selected school
a= total numberpopulation of students in the school
b= total numberpopulation of students in all 10 selected schools (8107)
c= calculated total sample size (1350)
Students in each class from junior secondary school (JSS) 1-3 and senior secondary school
(SS) 1-3 were then randomly selected by balloting The number of selected schools total
number of students in a school and the number of students selected per school is outlined in
Table II
Table II Selected schools and number of students in each of the ten schools in Jalingo
Selected schools Total no of No of students
39
student in the
school (a)
n=8107
selected (n=abxc)
n=1350
Public schools
Govt Science Secondary School 2800 466
Govt Day Secondary School SGari 1200 200
Salisu Dogo Secondary School 1100 183
Govt Secondary School Magami 840 140
Total 5940 989
Private schools
Winners Comprehensive Secondary School 650 108
Hawai Secondary School 562 94
Centre for Quranic Science and Islamic Education 543 90
Good Success Secondary School 155 26
Jetters Academy 140 23
Yagai Academy 117 20
Total 2167 361
The study
The first contact with the students was a familiarization exercise to each of the schools during
which the teachers and students were given a talk by the researcher on blood pressure and the
40
importance of periodic blood pressure measurement They were given the opportunity to ask
questions which were responded to Both the students and their teachers actively participated
in the lectures
On the second day students were selected as described above and those selected
underwent general physical examination in the presence of a chaperon to identify those
who did not fulfilled the inclusion criteria Each selected student was given a proforma
(Appendix 1) in which information on their biodata and medical history were recorded
Other information obtained was parentrsquos medical history and their socioeconomic status
using the format described by Olusanya Okpere and Ezimokhai117 (Appendix 3) The
study was carried out in a relatively quiet and empty classroom to ensure privacy for both
male and female students The procedure for blood pressure measurement was
demonstrated on one of the research assistants and sometimes on one of the teachers by
the researcher to assure the students and allay their anxiety BP and anthropometric values
obtained were recorded in the study proforma An average of 15-20 students per day were
attended to over a period of 3-4 hours (between 8am - 12noon daily) by the researcher
one of the research assistants who is a medical officer a male nurse and a lady Youth
Corper (NYSC)
Blood pressure measurement
This was measured by the researcher and the research assistant (the medical officer) The
standard auscultation method was employed using a mercury sphygmomanometer (Acosson)
and a standard Littman stethoscope according to the guideline of the fourth report on the
diagnosis evaluation and treatment of hypertension in children and adolescents8 Each
students was rest-seated for 5 minutes before BP measurement With the student seated the
right arm rested on a table at the level of the heart an appropriate cuff size which covered
41
two-third (23rd) of the length of the arm was applied round the arm about 2cm above the
antecubital fossa Two cuff sizes were used for this study with dimensions of 10 x 24cm and
13 x 30cm the smaller cuff for the smaller adolescents and vice versa The bladder cuff was
inflated rapidly to 20-30mmHg above the point where the brachial artery was no longer
palpable The bell of the stethoscope was then placed over the brachial artery and the cuff
was deflated slowly at 2-5mmHgsecond while listening to the Korotkoff sounds Phases one
and five of the Korotkoff sounds were recorded as the systolic and diastolic BP
respectively119 Three recordings were taken at intervals of 3-5 minutes and the average was
the final BP in mmHg BP was interpreted based on the standard set by the fourth report on
the diagnosis evaluation and treatment of hypertension in children and adolescents of the
United States8 thus-
Normal BP ndash BP value between the 5th and lt 90th percentile for age sex and height
Prehypertension - BP value between the 90th and the lt95th percentile for age sex and height
or BP of 12080mmHg but less than the 95th percentile
Hypertension ndash BP value ge95th percentile for age sex and height
Students found to have prehypertension were educated and counseled on life style
modifications and the need to have their blood pressure checked in six monthsrsquo time and
annually subsequently Those with hypertension were educated on the implications of the
findings and were referred to the Federal Medical Center Jalingo for evaluation management
and follow-up
Height measurement
Height was measured in centimeters using a locally constructed stadiometer by the research
assistants Each student was measured barefooted standing with the heel back and occiput
42
against the stadiometre The head was held straight looking forward with the lower border of
the eye socket at a horizontal plane with that of the external auditory meatus The movable
part of the stadiometre was adjusted to rest on the vertex and the corresponding value read to
the nearest 01cm
Weight measurement
The weight was measured in kilograms by the researcher and the research assistants using a
bathroom scale (HANSON) Students were weighed in their approved school uniform
without caps head ties or cardigan and with their shoes removed The scale was checked
daily for accuracy using standard calibrated weight before and midway through each session
The weight of the student was measured to the nearest 01 kg
Body mass index (BMI)
This was calculated from the measured weight and height of the subject using the
formula118
BMI= Weight (kg) Height (m2)
Waist circumference measurement
WC was measured in centimeters using a measuring tape by the research assistants The
male assistant measured for boys and the lady Youth Corper measured for girls
Measurement was taken with the student standing completely relax and breathing
normally Clothing was pulled up or down and an inelastic measuring tape was placed
around the waist mid-way between the iliac crest and the lowest rib margin The ends of
the tape were pulled together lightly towards each other and the value read to the nearest
01cm117120
43
Data analysis
Data obtained were analyzed using Epi-Info statistical software package version 7 The
results obtained were presented in figures tables graphs and charts as appropriate Individual
mean BP levels were used as dependent variables and other measured variables as
independent variables The means and standard deviations were used to summarize
quantitative variables such as BP weight height waist circumference and BMI The chi-
squared test was used to test the significance of associations between categorical variables
Studentrsquos t-test was used to compare means of any two normally distributed continuous
variables Pearsonrsquos correlation coefficient and regression analysis were used to examine the
strength of association between BP and the anthropometries Probability level of statistical
significance value was set at lt005
RESULTS
General characteristics
A total of 1350 students were enrolled between January and June 2014 to determine their
blood pressure pattern 628 (465) were males and 722 (535) were females with
malefemale ratio of 111 Students enrolled in the study were drawn from both public and
44
private schools The number of students from public schools was 989 (733) while 361
(267) were from private schools as shown in Table II The mean age of the study subjects
was 153plusmn22 years with a range of 10-19 years The age and sex distribution of the students
is illustrated in Table III
Table III Age and sex distribution of 1350 study subjects in Jalingo
Ag
e
Male
n ()
Female
n ()
Total
N()
10 9(14) 13(18) 22 (16)
11 20(32) 31(43) 51(38)
12 36(57) 52(72) 88(65)
13 96(153) 85(118) 181(134)
14 92(146) 115(158) 207(153)
15 92(146) 111(154) 203(151)
16 66(105) 116(161) 182(135)
17 78(125) 91(126) 169(125)
18 79(126) 70(97) 149(110)
19 60(96) 38(53) 98(73)
To
tal
628(100) 722(100) 1350(100)
45
Socio-economic classes (SEC) ndash Most of the students were from the lower social classes
(4 and 5) with population of 650 (415 and 235) students The upper social classes (1 and
2) had the least population with 184 (62 and122) students The middle social class (3) had
516 students The distribution of the study subjects according to individual
socioeconomic class is shown in Figure I
Figure 1 Socioeconomic class distribution of students in Jalingo
Anthropometry
The anthropometric characteristics of the students are displayed in Tables IV V and VI
All the anthropometric parameters showed increasing values with age (Tables V and VI)
There were significant differences in the anthropometric indices of height (p=0000)
weight (p=0010) and body mass index (p=0000) between boys and girls but not
statistically significant for waist circumference (p=0145) as shown in Table IV
Weight ndash The mean weight of the students was 486plusmn109kg with a range of 23-100kg
(Table IV) Girls were heavier than boys up to middle adolescence after which males
46
were heavier than the females (Table V and VI) and this was statistically significant (t= -
256 p=0010)
Table IV Overall mean anthropometric measurements of the study subjects
Anthropometr
y
Male Female Total
n=628 n=722 N=1350 t p
Wt (kg)
Mean(plusmnSD) 4773(115
)
4926(103
)
4855(plusmn109
)
-
25
6
0007
Range 236-848 227-100 23-100
Ht (m)
Mean(plusmnSD) 159(012) 157(008) 158(plusmn010) 35
5
0000
Range 122-185 126-179 122-185
WC (cm)
Mean(plusmnSD) 6524(91) 6595(86) 6562(plusmn89) -
14
6
0145
Range 225-905 215-100 22-100
47
BMI (kgm2)
Mean(plusmnSD) 1825(27) 1947(33) 1891(plusmn31) -
74
1
0000
Range 117-325 114-42 114-42
Statistically significant p values at 005 level of significance Wt=Weight Ht=Height WC=Waist
Circumference BMI=Body Mass Index SD=Standard Deviation
Height- The mean height of the study population was 158plusmn09m and ranged from 122-
185m (Table IV) Girls were taller than boys at early and middle adolescence but these
reversed from 16 years in favour of the boys (Table V and VI) This differences was
statistically significant (t=448 p=0000)
Waist circumference (WC) - The overall mean waist circumference was 6562plusmn89cm and
a range of 225-100cm Girls had higher WC until late adolescence (18 years) when it
reversed but this was not statistically significant (t=-146 p=0145) This is displayed in
Tables IV V and VI
Body Mass Index (BMI) - Overall mean BMI was 189plusmn31 with a range of 114-42
There was a statistically significant difference between girls and boys (t=-741 p=0000)
Tables IV V and VI illustrate this findings
Table V Mean anthropometric measurements of 628 boys
Age No of
studen
ts
Wt(plusmnSD)
Kg
Ht(plusmnSD)
m
WC(plusmnSD)
cm
BMI(plusmnSD)
Kgm2)
48
10 9 349(50) 143(001
)
613(06) 169(01)
11 20 354(25) 143(002
)
617(13) 170(07)
12 36 363(51) 146(002
)
616(14) 167(06)
13 96 379(51) 150(003
)
602(40) 165(08)
14 92 412(50) 154(003
)
623(32) 169(08)
15 92 471(60) 160(003
)
634(39) 178(08)
16 66 525(52) 164(002
)
672(24) 192(09)
17 78 555(51) 167(002
)
680(31) 197(08)
18 79 576(61) 169(002
)
707(18) 200(08)
19 60 590(57) 170(002
)
716(16) 203(07)
Total 628 477(115 16(01) 652(91) 183(27)
49
)
Wt=Weight Ht=Height WC=Waist Circumference BMI=Body Mass Index SD=Standard Deviation
Table VI Mean anthropometric measurements of 722 girls
Age No of
students
Wt(plusmnSD)
Kg
Ht(plusmnSD)
m
WC(plusmnSD)
cm
BMI(plusmnSD)
Kgm2
10 13 313(34) 139(001) 582(05) 156(02)
11 31 361(53) 144(002) 611(12) 170(05)
12 52 403(64) 149(002) 625(21) 178(09)
13 85 458(66) 154(002) 657(22) 188(12)
14 115 478(74) 157(003) 627(48) 187(10)
15 111 508(65) 159(002) 666(34) 199(13)
16 116 521(60) 159(002) 678(28) 201(11)
17 91 541(62) 161(002) 681(28) 203(11)
18 70 556(63) 161(002) 696(21) 211(11)
19 38 540(48) 158(002) 688(14) 208(06)
Total 722 493(103) 16(010) 651(23) 190(09)
Wt=Weight Ht=Height WC=Waist circumference BMI=Body Mass Index SD=Standard Deviation
Blood pressure (BP) measurements
50
Table VII shows mean blood pressure distribution of the study population for all ages
The highest SBP and DBP were 165mmHg and 95mmHg at 18years and 15 years
respectively Table VIII displays mean BP distribution in relation to age and sex The
tables show that both systolic and diastolic blood pressure increased with age This is also
depicted in Figure 2
Table VII Mean and ranges of blood pressure of 1350 subjects
Systolic Blood Pressure
(mmHg)
Diastolic Blood Pressure
(mmHg)
Age
No of
students
Mean(plusmnSD) Range
Mean(plusmnSD) Range
10 22 936(74) 80-107 600(50) 47-70
11 51 992(106) 76-120 629(71) 47-83
12 88 1036(110) 80-140 657(60) 53-82
13 181 1042(108) 80-143 660(74) 48-88
14 207 1070(115) 83-150 675(76) 47-90
15 203 1090(119) 80-150 678(82) 47-95
16 182 1122(124) 80-150 696(80) 50-90
51
17 169 1132(118) 90-153 698(83) 48-93
18 149 1138(121) 90-165 712(88) 50-90
19 98 1131(127) 90-143 726(76) 57-90
Total 1350 1089(125) 76-165 683(82) 47-95
Table VIII Mean blood pressure in relation to age and sex
Mean(plusmnSD) Systolic blood pressure
(mmHg)
Mean(plusmnSD) Diastolic blood
pressure (mmHg)
A
ge
Male
n=628
Female
n=722
t p Male
n=62
8
Fema
le
n=72
2
t p
52
10 954(3
9)
923(6
0)
1
02
03
20
619(
32)
586(
46)
1
36
0
01
91
11 985(5
5)
997(9
2)
0
42
0
06
80
648(
39)
617(
57)
1
56
0
01
26
12 999(8
9)
1062(
117)
2
84
0
00
06
653(
29)
660(
52)
-
0
52
0
06
07
13 1012(
73)
1075(
73)
4
03
4
00
00
649(
43)
672(
59)
-
0
03
0
00
44
14 1036(
78)
1098(
78)
3
93
0
00
01
653(
44)
693(
58)
3
90
0
00
01
15 1071(
80)
1105(
87)
2
05
0
00
42
665(
58)
689(
56)
-
2
10
0
00
37
16 1135(
82)
1114(
91)
1
03
0
03
10
697(
51)
695(
61)
0
15
0
08
81
53
17 1152(
87)
1115(
77)
2
04
00
43
698(
59)
698(
58)
0
02
0
09
81
18 1141(
96)
1135(
74)
0
27
0
07
91
704(
62)
721(
63)
1
61
0
02
49
19 1146(
97)
1108(
80)
1
41
0
01
64
733(
63)
714(
43)
1
21
0
02
28
To
tal
1081(
133)
1095(
117)
-
2
05
4
00
40
678(
81)
687(
82)
-
2
07
7
00
38
Statistically significant p values at 005 levels of significance
54
Figure 2 Blood pressure distribution in relation to age and sex
SBP =Systolic blood pressure DBP=Diastolic blood pressure
Blood pressure and stages of adolescence
Table IX displays mean blood pressure according to stages of adolescence Girls had a
higher mean SBP than boys from early adolescence (t=3754 p=0000) to middle
adolescence (t=-3025 p=0003) and this was statistically significant This dominance was
also demonstrated in the DBP and was statistically significant in middle adolescence (t=-
3517 plt0000) Adolescents from private schools had higher mean SBP (t=-222
plt0027) and mean DBP (t=-461 p=0000) than those from public schools and these
differences were statistically significant
Table IX Mean blood pressure according to sex and stages of adolescence
Mean BP
(mmHg)
Age (years)
Male SBP
Female SBP
Male DBP
Female DBP
55
Stages
of
adolesc
ents
(years)
Mean(plusmnSD) systolic blood pressure
(mmHg)
Mean(plusmnSD) diastolic blood pressure
(mmHg)
Male Female t p Male Fema
le
t p
Early
(10-13)
1000(9
6)
1040(1
18)
37
54
00
00
648(
56)
653(
82)
05
99
05
50
Middle
(14-16)
1075(1
29)
1105(1
13)
-
30
25
00
03
670(
81)
694(
77)
-
35
17
00
00
Late
(17-19)
1140(1
28)
1121(1
11)
21
45
00
33
717(
85)
710(
83)
00
70
09
45
1082(1
33)
1092(1
17)
-
20
54
00
40
678(
81)
687(
82)
-
20
77
00
38
Statistically significant p values at 005 level of significance SD=Standard Deviation
Table X shows blood pressure pattern according to stages of adolescence
Prehypertension and hypertension were more prevalent in late adolescence than early and
middle adolescence (χ2=49054 p=0000) and (χ2=10305 p=0006) both of which were
statistically significant
Table X The pattern of normal BP Prehypertension and hypertension according to stages
of adolescence
56
Blood
pressure
pattern
Stages of adolescence
Early
n()
Middle
n()
Late
n()
Total
N()
χ2 p
Normal 290(84
8)
428(72
3)
275(66
1)
993(73
5)
429
79
000
0
prehypertens
ion
43(12
6)
135(22
8)
120(28
8)
298(22
1)
490
54
000
0
Hypertensio
n
9(26) 29(49) 21(51) 59(44) 103
05
000
6
342(10
0)
592(10
0)
416(10
0)
1350(1
00)
350
93
000
0
Statistically significant p value at 005 level of significance
Relationship between blood pressure and the measured anthropometry
There was a positive correlation between SBP and DBP with age and the anthropometric
variables of weight height waist circumference and BMI (Table XI) SBP showed a
stronger correlation with the anthropometries than the DBP and was stronger for weight
(r=051) and height (r=044) The waist circumference though statistically significant
showed the weakest correlation
Table XI Correlation between blood pressure age (yrs) and anthropometry
Parameters
Systolic Blood Pressure Diastolic Blood Pressure
Correlation
coefficient
p Correlation
coefficient
p
57
Age (yrs) 035 lt0000 030 lt0000
Height (m) 044 lt0000 034 lt0000
Weight (Kg) 051 lt0000 038 lt0000
WC (cm) 040 lt0000 029 lt0000
BMI
(Kgm2)
031 lt0000 023 lt0000
Statistically significant p values at 005 level of significance Wt=Weight Ht=Height WC=Waist
circumference BMI=Body Mass Index
Blood pressure distribution and socio-economic classes
Table XII shows mean blood pressure according to socio-economic class of the subjects
Lower social classes had higher mean SBP (t=1650 p=2850) and DBP (t=0193
p=00058) but these were not statistically significant
Table XII Mean Blood pressure in relation to socioeconomic classes
Blood
pressur
e
Socioeconomic classes
Upper (1 amp
2) n=184
Middle (3)
n=516
Lower (4 amp
5)
n=650
f(anova
)
p
Mean
(SD)
10857(126
)
10866(128
)
11040(109
)
1650 285
0
58
SBP
Mean
(DBP)
6820(83) 6791(83) 6957(76) 0193 005
8
SEC= Socioeconomic class SBP=Systolic Blood Pressure DBP=Diastolic Blood Pressure SD=Standard
Deviation
Table XIII shows blood pressure pattern in relation to socioeconomic classes of the
subjects The percentage of students with prehypertension was higher in the upper social
class ((χ2=3067 p=0216) while the percentage of hypertension were higher in the lower
socioeconomic classes (χ2=1037 p=0568) but these differences were not statistically
significant
Table XIII Blood pressure pattern in relation to socioeconomic status
Blood
pressure
pattern
Socioeconomic classes
Upper
(1 amp 2)
n()
Middle
(3)
n()
Lower
(4 amp 5)
n()
Total
N()
χ2 p
Normal 127(69
)
383(74
2)
483(74
3)
993(73
6)
417
6
012
4
Prehypertens
ion
52(28
3)
108(20
9)
138(21
2)
298(22
1)
306
7
021
6
Hypertension 5(27) 25(48) 29(45) 59(44) 103 056
59
7 8
184(10
0)
516(10
0)
650(10
0)
1350(10
0)
573
0
022
0
Prevalence of Hypertension and Prehypertension
Table XIV shows the prevalence of hypertension in the study population The total
number of students with hypertension was 59 giving an overall prevalence of 44
Thirty four students (25) had systolic hypertension sixteen (12) had diastolic
hypertension and nine students (07) had both systolic and diastolic hypertension
Systolic hypertension was more prevalent in the females and was more at the age of 16
years while diastolic hypertension was higher in males and this also occurred at 16 years
Among those with hypertension 27 and 16 subjects had stage 1 and 2 systolic
hypertension respectively With regard to diastolic hypertension 24 and 1 subjects had
stage 1 and 2 hypertension respectively The gender difference in the prevalence of
hypertension is not statistically significant (χ2=0831 p=0362)
The number of students with pre-hypertension was 298 giving an overall prevalence of
221 Of this 131 were males and 167 are females This is illustrated in Table XIV
Prehypertension is more prevalent in females than males and this was statistically
significant (χ2=4349 p=0037)
60
Table XIV Overall Blood pressure pattern and prevalence of hypertension and
prehypertension of 1350 students in Jalingo
Blood pressure
pattern
Males
n=()
Females
n=()
Total
N()
χ2 p
Normal 471(750) 522(723) 993(735) 2619 0106
Prehypertension 131(209) 167(231) 298(221) 4349 0037
Hypertension 26(41) 33(46) 59(44) 0831 0362
628(100) 722(100) 1350(100) 1260 0533
statistically significant p value at 005 level of significance
61
DISCUSSION
The findings of this study showed that the BP of secondary school adolescents in Jalingo
was similar in terms of mean values range and trend of progression with age to that of
other adolescents from Ibadan63 and Kogi60 (Nigeria) Ashanti (Ghana)59 and Lebanon54
The mean value was however lower than the mean BP of adolescents from Zaria
(Nigeria)21 Belgrade ( Serbia)78 and Fortaleza-Cearaacute (Brazil)83 who had higher mean BP
in both sexes and at all ages The lower mean BP in this study compared to that of
adolescents from Zaria21 Belgrade78 and Brazil83 could be due to lower mean
anthropometry of weight height and BMI in adolescents from Jalingo resulting in lower
mean BP The sample sizes of these studies7883 were also different and could have
affected the mean BP of the study population For instance the sample size in the
Brazilian study83 is 151 compared to the study in Lebanon54 with 5710 subjects The use
of the fifth Korotkoff sounds as DBP in this study21 could also have accounted for the
lower mean BP in contrast to a similar study in Zaria21 where the fourth Korotkoff sound
was used as the DBP
A progressive increase in blood pressure with age was found in this study This
was similar to most findings by researchers in Nigeria 215358-606566107 and
worldwide54555961 The peak age of rise in BP in this study was in middle adolescence
between 15-16 years in boys but much earlier in girls for both systolic and diastolic BP
This was similar to the study by Akinkugbe Akinwolere and Kayode56 in Ibadan and
Ejeke Ugwu and Ezeanyika et al60 in Lokoja This age group is usually the period of
onset of puberty The chronologic age is not the main factor responsible for BP increase
62
with age but rather the progressive increase in size of the individual Increase in body
size with growth and maturity of organs associated with the physical and hormonal
changes during puberty potentially lead to increasing BP The simultaneous increase in
weight height and other anthropometric indices alongside BP with age seen in this study
and others is in agreement with that The implication of this increase in blood pressure
with age is that those with prehypertensionhypertension in childhood may continue into
adulthood hence further increasing the high prevalence of hypertension in the adult
population with its attendant morbidity disability and mortality
Overall significant higher mean BP was recorded in girls than boys in this study
This was seen from early to middle adolescence after which it reversed in favour of the
boys Reports on the relationship between BP and sex have been inconsistent Some have
reported higher mean BP in females54-56 others higher in males5883 while yet another
reported no sex differences22 The findings of this study were similar to those of Bugaje
Yakubu and Ogala21 and Ujunwa Ikefuna and Nwokocha100 who reported a consistently
higher mean blood pressure in female adolescents up to 16 years compared to their male
counterparts of similar ages Early female predominance in mean blood pressure was also
reports by Agyemang Redekop and Owusu-Dabo et al59 in Ashanti adolescents in Ghana
and Obika Adedoyin and Olowoyeye22 in Illorin The finding was however in contrast
with the study in Calabar58 where higher mean BP was found in boys than girls at all
ages The reason for the higher mean BP in females than boys could be because of earlier
onset of puberty in girls The differences in blood pressure between boys and girls in this
study could also be accounted for by variation in the anthropometric variables of the
individuals as girls were seen to be heavier and taller up to middle adolescence
This study demonstrated a consistently positive relationship between blood
pressure and the anthropometric variables of weight height body mass index and waist
63
circumference as widely reported in other studies 545558-6165107100 Weight is reported to
correlate positively with blood pressure in several studies53565871 Body mass index
(BMI) also showed a positive relation with BP in this study as reported in other
studies5978-81 This is in-keeping with the findings in Port Hacourt71 Abeokuta83 the
Gambia69 Brazil82 and Belgrade77 children Some of these studies however were made
up of younger and older age groups Even in lean populations BMI is known to correlate
positively with BP Waist circumference was also found in this study to correlate
positively with BP This was similar to reports from other studies79-8183 It was found to
be a better predictor of BP in two Italian study8081 while it was not in another82
Comparing BMI and waist circumference and their effects on BP Arauzo Lopes and
Moriera et al82 in Brazilian children found BMI to be a better predictor of BP than waist
circumference This was similar to the report by Sebanjo and Oshikoya83 in Nigerian
adolescents in Akure Guagnano Ballone and Colagrande et al81 however found waist
circumference to be better than BMI The study81 however involved adults and may not
be applicable in children and adolescents The present study demonstrated BMI and WC
to be significant but found BMI to be a better determinant of BP than waist
circumference BMI and waist circumference measure obesity in an individual Whereas
BMI is a measure of overall obesity WC measures centralabdominal fat accumulation
and thus said to be more predictive of adverse health risk79 Obese individuals may be
prone to such condition as dyslipidaemia insulin resistance and hypertension with
reduction in the quality of life Weight BMI and or waist circumference affects blood
pressure through decreased physical activity increased cardiac output insulin resistance
impaired pulmonary function and other hormonal abnormalities8084 It seems therefore
that BMI is a better predictor of BP in adolescents than waist circumference The reason
64
for this is not obvious but it may be because of the nature of uniform fat distribution in
adolescents associated with growth and hormonal changes at puberty
Blood pressure distribution in relation to the parental socio-economic class in this
study showed that students from low socio-economic classes had higher mean blood
pressure than those from upper socioeconomic classes but this was not statistically
significant A study in Ibadanl56 reported a statistically significant negative relation
between blood pressure and parental socio-economic status It was also similar to the
study58 in Calabar In contrast other studies found the reverse536022 The reasons for the
inverse relationship between BP and socioeconomic includes exposure to chronic
environmental stress with sustained sympathetic nervous system stimulation Others are
poor health seeking behaviours due to low income andor inadequate health knowledge
high low birth weight rate and inadequate healthy diets among others97101 In the same
environment individuals from a high social class are believed to be more educated with
high income61 They have easy access to health education and awareness on hypertension
prevention and control and better accessibility and adherence to medical treatment617374
The former might be responsible for the finding of this study as Jalingo is a semi urban
community Most of its inhabitants are subsistent farmers civil servants and traders with
low income The high number of students in the lower socioeconomic class lays credence
to that
The overall point prevalence of hypertension in this study was 44 while that of
pre-hypertension was 221 This prevalence of hypertension is similar to the prevalence
of 48 by Antia-Obong and Antia-Obong107 but higher than the prevalence rate of 37
reported in Zaria21 and lower than the prevalence of 58 reported in Ibadan56 54 in
Enugu100 and the 72 reported in Kano65 The prevalence of pre-hypertension was lower
than that reported by Ejeke Ugwu and Ezeanyika99 who found a prehypertensive
65
prevalence of 25 among adolescents in Lokoja It is higher than the 173 reported by
Ujunwa Ikefuna and Nwokocha et al100 in Enugu and 12-17 by Redwine and
Daniels96 among US adolescents The differences in the reported prevalence of
hypertension and prehypertension in adolescents could have resulted from the different
criteria applied by the various researchers in defining hypertension For instance whereas
this study used BP greater than 95th percentile as hypertension a study in Kano65 used the
adult hypertensive value of BPgt14090mmHg as hypertension and got a prevalence of
72 The prevalence in that study65 could have been higher if the percentile or the
statistical definition was used as many children with BP 14090mmHg would probably be
at stage 2 hypertension This was demonstrated in the study by Bugaje Yakubu and
Ogala21 who found a prevalence of hypertension in their study to be 06 when the adult
cut off value of gt14090mmHg was used but it increased to 37 when the statistical
definition of BPgt 2 standard deviations was used
The number of times blood pressure is taken could affect the outcome as repeated
measurements over a time interval is known to give lower BP values than if BP is taken
once This study used the average of three blood pressure values taken at one sitting but
Ujunwa Ekefuna and Nwokocha100 took three readings at five minutes interval with two
other readings at a week interval In that study100 the prevalence of prehypertension
dropped from 745 during the first set of readings to 173 after the third week
readings The prevalence of hypertension also dropped from 135 to 54 over the same
period Similar decrease in the prevalence of both prehypertension and hypertension was
reported by Redwine and Daniels96 in US adolescents when blood pressure was taken
over time interval Another factor which might have affected the overall prevalence is the
Korotkoff sound used for diastolic pressure23 The 4th or 5th Korotkoff sounds has been
used by different researchers resulting in different diastolic BP The study21 in Zaria used
66
the 4th Korotkoff sound while most other researchers2265100 used the 5th About 5-
10mmHg difference is said to exist between the 4th and 5th Korotkoff sounds230 In this
study the 5th Korotkoff sound was used thus giving a higher prevalence of hypertension
in the studied population than in those where the 4th sound was used
The implication of the outcome of this study is that 44 of adolescents in Jalingo
are already hypertensive while 221 of them are at risk of developing hypertension as
they are pre-hypertensive Since 856 (255 of 298) of the prehypertensives were in the
middle and late adolescence these individuals are likely to be adults with high blood
pressure Therefore regular screening of this group of individuals who were assumed to
be a healthy population is highly important for early detection of hypertension and
intervention such as life style changes and treatment
67
CONCLUSIONS
The following conclusions can be made from this study
1 The mean and range of blood pressure of adolescents in Jalingo was similar to
those of other adolescents in Nigeria and other parts of the world Blood pressure
increased progressively with age
2 All measured anthropometry of weight height body mass index and waist
circumference correlated positively with BP but weight was the most significant
variable in BP determination
3 Socioeconomic status was not significantly related with blood pressure
4 The point prevalence of hypertension and pre-hypertension was 44 and 221
respectively using a recommended definition
RECOMMENDATIONS
1 In view of the high prevalence of prehypertension in this study it is recommended
that students should have their blood pressure measured at school entry as this will
68
help identify those with abnormal BP for early intervention Thereafter BP check
should be offered at least once a year at the beginning of a new session especially for
those found with abnormal BP at school entry
2 Physical and health education should be revived in all the schools This will lead to
increased physical activity and reduced risk of obesity and its consequences
3 School health programmes should be strengthened in schools where it already exist
and effort made to establish same in schools where it is yet to exist The programme
should include measures to detect early prehypertension and hypertension and other
health related needs of the students
LIMITATIONS
The following limitations were encountered in the course of the study
1 Exclusion and inclusion of students that were based on volunteered information and
physical evaluation This could have led to inclusion andor exclusion of adolescentss
69
with or without background renal diseases which could have affected the result of this
study
2 Home blood pressure measurement especially early morning measurement for those
with high blood pressure to possibly eliminate the effect of stress traffic andor
trekking and other school related stresses which may affect blood pressure during the
day
LINES OF FUTURE RESEARCH
This study was questionnaire based and time bound Consequently students were not
investigated for background diseases co-mordid conditions target organ damage or risk
factors for high blood pressure They were also not followed up In view of this future
research on blood pressure in adolescents should include-
70
1 Investigations such as urinalysis electrolytes urea and creatinine random blood
sugar (RBS) lipid profile and echocardiography as part of blood pressure evaluation
in adolescents
2 A long period of study to allow for follow-up over months or years to identify those
that are truly hypertensive considering the definition of hypertension It will also
reveal the rate of progression from pre-hypertension to hypertension
3 Risk factors evaluation for high blood pressure including genetic predispositions
REFERENCES
1 Blood pressure from Wikipedia the free Error Hyperlink reference not valid
Accessed 24th November 2011
2 Pickering TG Hall JE Appel LJ Falkner BE Graves J Hill MN Jones DW Kurtz T
Sheps SG Roccella EJ Recommendations for blood pressure measurement in humans
and experimental animals Part 1 Blood pressure measurement in humans A
statement for professionals from the subcommittee of professional and public
71
education of the American Heart Association council on high blood pressure research
Hypertension 2005 45 142-61
3 da Silva IRR de Souza MDG de Camargo CAC Blood pressure measurement in
children and adolescents Guidelines of high blood pressure recommendations and
current clinical practice Arq Bras Cardiol 2007 88 434-7
4 Sinaiko AR Hypertension in children N Engl J Med 1996 3351968-73
5 US Preventive Services Task Force Screening for high blood pressure
recommendations and rationale Am J Prev Med 2003 25 159-64
6 Report of the second task force on blood pressure control in children Pediatrics 1987
79 1-25
7 National high blood pressure education programme working group on hypertension
control in children and adolescents update on the 1987 task force report on high blood
pressure in children and adolescents A working group report from the national high
blood pressure education program Pediatrics 1996 98 649-58
8 National high blood pressure education program working group on high blood
pressure in children and adolescents The fourth report on the diagnosis evaluation
and treatment of high blood pressure in children and adolescents Pediatrics 2004
114 255-76
9 Aderele WI Seriki O Hypertension in Nigerian children Arch Dis Child 1974
49313-7
10 Bo S Gambino R Gentile L Pagano G Rosato R Saracco GM Cassader M
Durazzo M Cavallo-Perin P High-normal blood pressure is associated with a cluster
of cardiovascular and metabolic risk factors a population based study J Hypertens
2009 27 102-8
72
11 Bao W Threefoot SA Srinivasan SR Berenson GS Essential hypertension
predicted by tracking of elevated blood pressure from childhood to adulthood The
Bogalusa Heart Study Am J Hypertens 1995 8 657- 65
12 Richard A Rodgers M Hedley AJ Mitchel JRA Changes in blood pressure and
blood lipid during adolescence BMJ 1980 28 1563-6
13 Sundstroumlm J Neovius M Tynelius P Rasmussen F Association of blood pressure in
late adolescence with subsequent mortality cohort study of Swedish male conscripts
BMJ 2011 342 643-8
14 Zimmet P Alberti G Kaufman F Tajima N Silink M Arslanian S Wong S Bennett
P Shaw J Caprio S On behalf of the International Diabetes Federation Task Force on
Epidemiology and Prevention of Diabetes The metabolic syndrome in children and
adolescents the IDF consensus Diabetic Voice 20075229-32
15 Abdulrahman FA Babaoye AA Childhood hypertension in northern Nigeria West
Afr J Med 1978 1 7-11
16 Adediran O Jimoh A Di M Relationship between body mass index and blood
pressure in rural Nigerian dwellers Internet J Nutri Wellness 2009 7 431-4
17 World Health Organization (WHO)UNICEF Adolescence at a glance 2003 p 2
18 The National Population Commission constitution of the Federal Republic of Nigeria
(AP 23 LFN) legal notice on publication issued April 21st 2007
19 Heald FP and Gong EJ Diet Nutrition and adolescents In Shils ME and Ross AC
(eds) Modern Nutrition in Health and Disease 9th ed William and Wilkins
Maryland USA 1999 p 32
20 Okonkon CT The prevalence of Hypertension among civil servants in Calabar Nig
Med J 1979 7422-5
21 Bugaje MA Yakubu AM Ogala WN Prevalence of adolescent hypertension in Zaria
Nig J Paediatr 2005 32 77-82
73
22 Obika LF Adedoyin MA Olowoyeye JO Pattern of paediatric blood pressure in
rural semi urban and urban communities in Ilorin Nigeria Afri J Med Sci 1995 24
371-7
23 Jeremy B A short history of blood pressure measurement section of the history of
medicine Proc Roy Soc Med 1977 70 793-9
24 Lewis O Stephen Hales and the measurement of blood pressure J Hum Hypertens
1994 8 865-71
25 Crile GW Blood Pressure in Surgery An experimental and Clinical Research
Philadelphia Lippincott 1903 p 358
26 Lewis WH The evolution of clinical sphygmomanometer Bull N Y Acad Med 1941
17 871-81
27 Browne WC OrsquoBrien ET Semple PF The sphygmomanometer of Riva Roci 1896-
1996 J Hum Hypertens 1994 610 723-4
28 Segal HN How Korotkoff the Surgeon discovered the auscultatory method of
measuring arterial pressure Ann Intern Med1975 83 561-2
29 Goodman FH and Howell AA Clinical studies in the auscultatory method of
determining blood pressure University of Pennsylvania Bulletin 1911 23 469-75
30 Crenner CW Introduction of the blood pressure cuff into US medical practice
technology and skilled practice Ann Intern Med 1998 128 488-493
31 Ganon WF Circulation In Review of Medical Physiol Lange Medical Publication
New York 22nd edition 2005 p 234-63
32 Beth C Homeostatic Regulation of Blood pressure Available from
URLhttpwwweHowcom Accessed on 1st December 2011
33 Rajinder KG Fahim M Regulation of cardiovascular functions during acute blood
loss Indian J Physiol Pharmacol 2005 49 213ndash9
74
34 Dampney AL Coleman MJ Fonts MAP Hirooka Y Horiuchi J Polson JW Potts
PD Tagawa T Central mechanisms underlying short-term and long-term regulation
of the cardiovascular system Proc Austr Physio Pharmacosociety 2001 32 333-44
35 Koshiya N Guyenet PG Noradrenergic neurons and the carotid sympathetic
chemoreflex Am J Physiol 1994 267 519-26
36 Prakash ES The ultimate goal in neural regulation of cardiovascular function Adv
Phyiol Educ 2008 32 107-8
37 Allen AM Inhibition of the hypothalamic paraventricular nucleus reduces
sympathetic nerve discharge and blood pressure Proc Austr Neuroscience Society
2001 29 44-7
38 Reid IA Interactions between ANG II sympathetic nervous system and
baroreceptor reflexes in regulation of blood pressure Am J Physiol 1992 262 763-
78
39 Brooks VL Osborn JW Hormonal-sympathetic interactions in long-term
regulation of arterial pressure A hypothesis Am J Physiol 1995 268 1343-58
40 Reckelhoff JF Gender Differences in the Regulation of Blood Pressure
Hypertension 2001 37 1199-208
41 Fink GD The systemic circulation as a regulated free-market economy A new
approach for understanding the long-term control of blood pressure Clin Exp
Pharmacol Physiol 2005 32 377ndash83
42 Benard K Sources of error in blood pressure measurement Hospital Physician 2002
12 33-7 Available from URLhttp wwwturnerwhitecom
43 Chyun DA A comparism of intra arterial and auscultatory blood pressure readings
Heart lung 1985 14 223-31
75
44 Nwankwo MU Lorenz JM Gardiner JC A Standard Protocol for Blood Pressure
Measurement in the Newborn Pediatrics 1997 99 1342-9
45 Deakin CD Low JL Accuracy of the advanced trauma life support guidelines for
predicting systolic blood pressure using carotid femoral and radial pulses
observational study BMJ 2000 321 673ndash4
46 OrsquoBrian E Replacing mercury sphygmomanometers require clinician to demand
better automated device BMJ 2000 320 815-6
47 McKay DW Raju MK Campbell NR Assessment of blood pressure measuring
techniques Med Educ 1992 26 208ndash12
48 Baker RH Ende J Confounders of auscultatory blood pressure measurement J Gen
Intern Med 1995 10 223ndash31
49 Neufeld PD Johnson DL Observer error in blood pressure measurement CMAJ
1986 135 633ndash7
50 van Montfrans GA Oscillometric blood pressure measurement progress and
problems Blood Press Monit 2001 6 287ndash90
51 Ware RW Laenger CJ Indirect blood pressure measurement by Doppler ultrasonic
kinetoartriography Proceedings 20th Annual Conference Engineering Medical
Biology 1967 9 27-30
52 Matthew Fox Blood pressure measurement technique Available from URL http
wwwlivestrongcom Last edited 2nd September 2010 Accessed on 30th November
2011
53 Akor F Okolo SN Okolo AA Blood pressure and anthropometric measurements in
healthy Primary School entrants in Jos Nigeria SAJCH 2010 4 42-5
54 Merhi BM Al-Hajj F Al-Tannir M Zaide F El-Rajab M A survey of blood pressure
in Lebanese children and adolescents North Am J Med Sci 2011 3 24-9
76
55 Al-Salloum AA El-Mouzan AH Al-Herbish AS Al-Umar AA Qurashi MM Blood
pressure standard for Saudi children and adolescents Ann Saudi Med 2009 29 173-8
56 Akinkugbe FM Akinwolere AO Kayode CM Blood Pressure Pattern in
Adolescence West Afri J Med 1999 18 196-202
57 Wanzhu T Eckert GJ Saha C and Pratt JH Synchronization of Adolescent Blood
Pressure and Pubertal Somatic Growth J Clin Endo Metab 2009 94
58 Ansa VO Anah MU Odey FA Mbu PN Agbor EI Relationship between parental
socioeconomic status and casual blood pressure in coastal Nigeria Adolescents West
Afri J Med 2010 29146-52
59 Agyemang C Redekop WK Owusu-Dabo E Bruijnzeels MA Blood pressure
patterns in rural semi-urban and urban children in the Ashanti region of Ghana West
Africa BMC Public Health 2005 5114-21
60 Ejeke CCE Ugwu CE Ezeanyika LUS Olayemi AT Blood pressure patterns in
relation to geographic area of residence a cross-sectional study of adolescents in Kogi
state Nigeria BMC Public Health 2008 8 411-5
61 Colhoun HM Hemminway H Poulter WR Socioeconomic status and blood
pressure an overview analysis J Human Hypertension 1998 12 91-110
62 Badaruddoza KR Familial aggregation and heritability for cardiovascular risk factors
a family based study in Punjab India Natural Science 2010 2 732-6
63 Livshits G Gerber LM Familial factors of blood pressure and adiposity co-variation
Hypertension 2001 37 928-35
64 Fermino RC Seabra A Garganta R Antoacutenio J Maia R Genetic factors in familial
aggregation of blood pressure of Portuguese nuclear families Arq Bras Cardiol 2009
92 463-9
77
65 Mijinyawa MS Iliyasu Z Borodo MM Prevalence of hypertension among teenage
students in Kano Nigeria Nig J Med 2008 17 173-7
66 The Wellcome Trust case control consortium Genome-wide association study of
14000 cases of seven common diseases and 3000 shared controls Nature 2007 447
661-78
67 Levy D Destefano AL Larson MG ODonnell CJ Lifton RP Gavras H Evidence for
a gene influencing blood pressure on chromosome 17 genome scan linkage results for
longitudinal blood pressure phenotypes in subjects from the Framingham heart study
Hypertension 2000 36 477- 83
68 Lifton RP Wilson FH Choate KA Geller DS Salt and blood pressure new insight
from human genetic studies Cold Spring Harb Symp Quant Biol 2002 67 445ndash50
69 van der Sande MA Milligan PJ Nyan OA Rowley JT Banya WA Ceesay SM
Dolmans WM Blood pressure patterns and cardiovascular risk factors in rural and
urban Gambian communities J Hum Hypertens 2000 14 489-96
70 Akinkugbe OO Ojo OA Arterial blood pressure in rural and urban population of
Nigeria BMJ 1969 2 22-4
71 Okagua J Anochie IC Akani NA Adolescent blood pressure in Rivers State Nigeria
A rural-urban comparism NJP 20154221-7
72 Urrutia-Rojas X Egbuchunam CU Bae S Menchaca J Bayona M Rivers PA Singh
KP High blood pressure in school children Prevalence and risk factors BMC
Pediatrics 2006 6 32-9
73 Sorof JM Lai D Turner J Poffenbarger T Potman R Overweight ethnicity and the
prevalence of hypertension in school-aged children Pediatrics 2004 113 475-82
78
74 Rosner B Prineas R Daniels SR Blood pressure differences between blacks and
whites in relation to body size among US children and adolescents Am J Epidemiol
2000 151 1007-18
75 Harding S Whitrow M Lenguerrand E Maynard M Teyhan A Cruickshank JK Der
G Ethnic differences in blood pressure in adolescence the determinants of adolescent
social well-being and health study Hypertension 2010 55 1063-9
76 Cruickshank JK Mzayek F Liu L Kieltyka L Sherwin R Webber LS Srinavasan SR
Berenson GS Origins of the ldquoblackwhiterdquo difference in blood pressure roles of birth
77 Vlajinac H Miljus D Adanja B Marinkoic J ipetic S Kocev N Blood pressure levels
in 7 to 14-year-old Belgrade children J Human Hypertension 2003 17 761ndash5
78 Menezes AMB Hallal PC Dumith SC Adolescent blood pressure body mass index
and skin folds sorting out the effects of early weight and length gains J Epid Comm
Health 2011 12 42-8
79 Karelis AD St-Pierre DH Conus F Rabasa-Lhoret R Poehlman EJ Metabolic and
body composition factors in subgroups of obesity what do we know J Clin Endo
Metab 2004 89 2569-75
80 Katzmarzyk PT Srinivasan ER Chen W Malina RM Bouchard C Berenson GS
Body mass index waist circumference and clustering of cardiovascular disease risk
factors in a biracial sample of children and adolescents Pediatrics 2004 114 198-205
81 Guagnano MT Ballone E Colagrande V Della Vecchia R Manigrasso MR Merlitti
D Riccioni G Sensi S Large waist circumference and risk of hypertension Int J
Obesity 2001 25 1360 ndash 4
82 Araujo TA Lopes MVO Moriera RP Cavalcante TF Gurdes NG MartinS dA Silva
V Blood pressure of children and teenagers from a public school in Fortaleza - Cearaacute
Acta paul enferm 200720103-15
79
83 Sebanjo IO Oshikoya KA Obesity and blood pressure levels of adolescents in
Abeokuta Nigeria Cardiovasc J Afr 2011 221-5
84 Messerli FN Obesity and essential hypertension Haemodynamics sodium excretion
and plasma rennin activity Arch Int Med 1981 141 81-5
85 Appel LJ Brands MW Daniels SR Karanja N Elmer PJ Sacks FM Dietary
Approaches to Prevent and Treat Hypertension A Scientific Statement from the
American Heart Association Hypertension 2006 47 296-308
86 Sacks FM Svetkey LP Vollmer WM Appel LJ Bray GA Harsha D Obarzanek E
Conlin PR Miller ER 3rd Simons-Morton DG Karanja N Lin PH for the DASH-
Sodium Collaborative Research Group Effects on blood pressure of reduced dietary
sodium and the Dietary Approaches to Stop Hypertension (DASH) diet DASH-
Sodium Collaborative Research Group N Engl J Med 2001 344 3ndash10
87 Appel LJ Moore TJ Obarzanek E Vollmer WM Svetkey LP Sacks FM Bray GA
Vogt TM Cutler JA Windhauser MM Lin PH Karanja N A clinical trial of the
effects of dietary patterns on blood pressure DASH Collaborative Research Group N
Engl J Med 1997 3361117ndash24
88 Appel LJ Sacks FM Carey VJ Obarzanek E Swain JF Miller ER 3rd Conlin PR
Erlinger TP Rosner BA Laranjo NM Charleston J McCarron P Bishop LM for the
OmniHeart Collaborative Research Group Effects of protein monounsaturated fat and
carbohydrate intake on blood pressure and serum lipids results of the OmniHeart
randomized trial JAMA 2005 294 2455ndash64
89 Karanja NM Obarzanek E Lin PH McCullough ML Phillips KM Swain JF
Champagne CM Hoben KP Descriptive characteristics of the dietary patterns used in
the Dietary Approaches to Stop Hypertension Trial DASH Collaborative Research
Group J Am Diet Assoc 1999 99 19ndash27
80
90 Nwokocha ARC Adolescence and associated problems In Azubuike JC and
Nkanginieme KEO (eds) Paediatrics and Child Health in a Tropical Region African
Educational Services Owerri Nigeria 2nd edition 2007 p 84-99
91 Rogol RT Roemmich JN Clark PA Growth and puberty J Adol Hlth 2002 31 192-
200
92 Tanner JM Marshal WA Variation in the pattern of puberty changes in boys and girls
Arch Dis Child 1970 45 13-23
93 Nwakoro SO Ifoda K Onochie O Olomu JM Anthropometric assessment of
nutritional status and growth of 10-20 years individuals in Benin City metropolis
Nigeria Pakistan J Nutr 2006 5 117-21
94 Shankar RR Eckert GJ Saha C Tu W Pratt JH The change in blood pressure during
pubertal growth J Clin Endo Metab 2005 90 163-7
95 Department of Health and Human Services 2000 CDC Growth Charts for the United
States methods and development Series Report 11 No 246 Available from URL
httpwwwcdcgovGrowthCharts
96 Redwine KM Daniels SR Prehypertension in Adolescents Risk and Progression
Journ Clin Hypertension 2012 14 360ndash4
97 Falkner B Gidding SS Portman R Rosner B Blood pressure variability and
classification of prehypertension and hypertension in adolescence Pediatrics 2008
122238ndash42
98 Redwine KM Acosta AA Poffenbarger T Development of hypertension in
adolescents with pre-hypertension J Pediatr 2012 16098ndash103
99 Ejike ECCC Ugwu CE and Ezeanyika LUS Variations in the prevalence of point
prehypertension in a Nigerian school-going adolescent population living in a semi-
urban and an urban area BMC Pediatr 2010 1013
81
100 Ujunwa FA Ikefuna AN Nwokocha AR Chinawa JM Hypertension and
prehypertension among adolescents in secondary schools in Enugu South East Nigeria
Italian J Pediatr 20133970-5
101 Chobanian AV Bakris GL Black HR Seventh report of the Joint National
Committee on Prevention Detection Evaluation and Treatment of High Blood
Pressure Hypertension2003 421206ndash52
102 Lande MB Systemic Hypertension In Kliegman RM Behrman RE Jenson HG and
Stanton BF (eds) Nelson Textbook of Pediatrics Saunders Elsevier Philadelphia 19th
Edition 2011 pg 1592-8
103 Luma GB Spiotta RT Hypertension in Children and Adolescent Am Fam Physician
2006 73 1558-68
104 Arvind B Rupesh J Vijayakumar M Madhuri K Ali U Evaluation and management
of hypertension Indian Paediatr 2007 44 103-21
105 Flynn JT Neonatal hypertension Diagnosis and management Pediatr Nephrol 2000
14 332-41
106 Steyn K de Wet T Richter L Cameron N Levitt NS Morrel C Cardiovascular
diseases risk factors in 5-year old urban South African children- The Birth to Ten
Study SAMJ 2000 90 7126
107 Antia-Obong OE Antia-obong LE Arterial blood pressure of Nigerian Urban and
Rural school children Nig J Paediatr 1991 18 3-11
108 Nguyen NT Magno CP Lane KT Hinojosa MW Lane JS Association of
hypertension diabetes dyslipidemia and metabolic syndrome with obesity findings
from the National Health and Nutrition Examination Survey 1999 to 2004 J Am Coll
Surg 2008 207 928-34
82
109 Solar MB Gill A Rey J Epidemiology of arterial blood pressure in school children
population Aten Primaria 1992 9 212-4
110 Steyn K de Wet T Richter L Cameron N Levitt NS Morrel C Cardiovascular
diseases risk factors in 5-year old urban South African children- The Birth to Ten
Study SAMJ 2000 90 7126
111 Linkas J The assessment and management of hypertensive emergencies and
urgencies in children Pediatr Emerg Care 2005 21391-6
112 Croix B Feig DI Childhood hypertension is not a silent disease Pediatr Nephrol
2006 21527-32
113 Flynn JT Anderson MH Characteristics of children with primary hypertension seen
at a referral centre Pediatr Nephrol 2007 44 103-21
114 Nakao M Yano E Nomura S Kuboki T Blood pressure lowering effects of
biofeedback treatment in hypertension a meta-analysis of randomized controlled trials
Hypertension 2003 26 37- 46
115 Jalingo Available from URLhttpwwwencyclopedia Britanica Accessed on 3rd
December 2011
116 Araoye MO Research Methodology with Statistics for Health and Social Sciences
Nathadex Publishers Saw-Mill Ilorin Nigeria 2004 pg 115-21
117 Olusanya O Okpere E Ezimokhai M The importance of social class in voluntary
fertility control in a developing country West Afr J Med 1985 4 205-12
118 World Health Organization expert committee Physical status the use and
interpretation of anthropometry WHO technical report series No 894 Geneva WHO
1995 p 424ndash38
119 Guidelines subcommittee WHOISH guideline for management of hypertension J
Hypertens 1999 17 151-83
83
120 Aubay B How to measure waist circumference Available from
URLhttpwwwehowcom Last updated August 10th 2011 and accessed on December
9th 2011
APPENDICES
Appendix 1
PROFORMA ON BLOOD PRESSURE PATTERN IN APPARENTLY HEALTHY
SECONDARY SCHOOL ADOLESCENTS IN JALINGO
PUBLIC SCHOOL [ ]
Serial No
84
PRIVATE SCHOOL [ ]
A BIODATA
1 Age (years) 10[ ] 11[ ] 12[ ] 13[ ] 14[ ] 15[ ] 16[ ] 17[ ] 18[ ] 19[ ]
2 Gender M [ ] F [ ]
3 Class JSS 1-3 [ ] SS1-3 [ ]
B MEDICAL AND SOCIAL HISTORY Yes [1] No [2]
1 Have you ever passed blood in your urine [ ]
2 Have you ever had your face or legs swollen [ ]
3 Are you on any drug for long time (such as pills steroids marijuana codeine
NSAIDs containing drugs tramal and others) [ ]
If yes specifyhelliphelliphellip
C SOCIO-ECONOMIC CLASSIFICATION
Fatherrsquos occupation
Score 1 Professionals top civil servants politicians and top businessmen
2Middle-level civil servants technicians skilled-artisans and well-to-do
traders
3 Unskilled workers and those in general whose income would be at or below
the national minimum wage
Mothers educational level
Score 0 Education up to University level
1 Secondary or tertiary level below the University
2 No formal education or up to primary level only
D ANTHROPOMETRY
i Weight (Kg) ndash 1helliphellip 2helliphelliphellip Averagehelliphelliphelliphellip
ii Height (m) ndash 1helliphellip 2helliphellip Averagehelliphelliphelliphellip
85
iii Body mass index = weightheight (kgm2)
v Waist circumference (cm) ndash 1helliphellip 2helliphelliphellip Averagehelliphelliphelliphellip
iv Blood Pressure (mmHg) - 1helliphellip 2hellip 3helliphellip Averagehelliphelliphelliphellip
Appendix 2
AUTHORIZATION AND CONSENT TO PARTICIPATE IN A RESEARCH
I Dr Peter Teru Yaru of the Department of Paediatrics Ahmadu Bello University
Teaching Hospital (ABUTH) Zaria Irsquom conducting a research on the blood pressure
pattern among secondary school adolescents in Jalingo
The aim of the study is to know the level of blood pressure among their age
groups Those with high blood pressure (or hypertension) will be identified appropriately
advised and referred for further care The study will involve taking their weight height
blood pressure and waist circumference Female assistants shall be responsible for
86
measuring waist circumference of female students Students will also be given a
questionnaire on some of their activities drug use among others all aimed at looking for
factors which can affect their blood pressure Information obtained shall be treated with
utmost confidentiality and for this research work only Please note that participation is
voluntary I will be glad if you give consent for your childward to participate in the
study
Statement by parents Irsquove read and understood this consent form and agreed for my
child to be included in the study
Parents name Researcherrsquos name and sign
Parents phone no if any Date
Parents signthumb print Phone no
87
Appendix 3
SOCIO-ECONOMIC SCORE
The classification of socio-economic scores based on fatherrsquos occupation and motherrsquos
education by Olusanya et al117
A Husband (fatherrsquos occupation)
Score 1 Professionals top civil servants politicians and businessmen
2 Middle-level bureaucrats technicians skilled-artisans and well-to-do traders
3 Unskilled workers and those in general whose income would be at or below
the national minimum wage
B Mothers educational level
Score 0 Education up to University level
1 Secondary or tertiary level below the University
2 No formal education or up to primary level only
The socio-economic class of the childrsquos mother is obtained by adding the scores from A
and B above and graded I-V as appropriate for example
Score (1) from A plus score (0) from B = social class I
Score (2) from A plus score (0) from B = social class II
Score (2) from A plus score (1) from B = social class III
Score (2) from A plus score (2) from B = social class IV
Score (3) from A plus score (0) from B = social class III
Score (3) from A plus score (1) from B = social class IV
Score (3) from A plus score (2) from B= social class V
Page 15
15
LITERATURE REVIEW
HISTORICAL PERSPECTIVE
Blood pressure measurement first started in the eighteenth century with the experiment of
Stephen Hales to whom its discovery can be attributed as reported by Jeremy2324
Accurate study of blood pressure as reported by Crile25 began with the introduction of a
manometer by Poiseuille a century later The first truly accurate blood pressure
measurement in man was by the Surgeon Faivre in 1856 when he connected an artery to a
mercury manometer to obtain direct readings24 Non-invasive methods of BP
measurement started with the discovery of the sphygmograph in 1855 by Vierordt as
reported by Crile25 and improvement by Potain in 1889 gave birth to the
sphygmomanometer26 In 1896 Scipione Riva-Rocci developed the method upon which
present-day technique is based27
Segal28 reported that the use of stethoscope for BP measurement was first highlighted
in 1905 by a Russian surgeon Korotkoff who documented hearing a tapping sound using a
stethoscope placed over the brachial artery as the Riva-Rocci cuff was deflated Goodman
and Howell29 recommended the division of the changing sounds into five distinct phases and
physicians subsequently determined blood pressure according to the point of appearance and
muffling or disappearance of the sounds30
DEFINITION AND REGULATION OF BLOOD PRESSURE
Blood pressure is defined as the product of cardiac output and peripheral vascular
resistance131 During each heartbeat BP varies between a maximum (systolic) and a
minimum (diastolic) pressure and is measured in millimeters of mercury (mmHg)1 Blood
16
pressure is regulated by different mechanisms acting either rapidly or slowly to maintain it
within normal range for optimal cellular performance3132
Intrinsic Regulation
Intrinsic factors regulating BP include stroke volume and heart rate which both influence
cardiac output31 Stroke volume depends on the volume of blood that fills the ventricles and
this depends on the preload and afterload33 A higher afterload will decrease stroke volume
causing low cardiac output and low BP and vice versa When cardiac output increases more
volume is derived from the venous pool increasing preload Similarly an increased heart rate
will lead to increased cardiac output and BP3134
Reflex Regulation
The baroreceptors within the aortic arch and carotid sinuses contain sympathetic and
parasympathetic nerve fibres3435 These are sensory nerves which run from the medulla
and they respond to stretch of the tissue in which they lie by increasing or decreasing the
rate of signaling36 and act fast in regulating BP34 Sympathetic stimulation causes
increased heart rate and widespread vasoconstriction to increase BP while
parasympathetic stimulation produces the opposite3537
Hormonal Regulation
Hormones regulating blood pressure include renin-angiotensin-aldosterone and
antidiuretic hormone (ADH) They act slowly by responding to changes in intravascular
volume and osmolality38 Angiotensin II is a potent vasoconstrictor and stimulates the
release of aldosterone from the adrenal gland39 Aldosterone increases sodium absorption
and fluid retention leading to increased BP ADH is a potent vasoconstrictor and plasma
volume regulator and its stimulation results in fluid retention and vasoconstriction39
Other hormones regulating BP include the sex hormones thyroid parathyroid cortisol
and ACTH They act on the rennin-angiotensin-aldosterone system to regulate BP3940
17
Renal Regulation
The kidneys control blood pressure through the retention and excretion of extracellular
fluid35 An increase in renal fluid retention will increase extracellular volume and higher
blood pressure whereas increased renal excretion leads to lower blood pressure41 This is
achieved through the action of ADH aldosterone and atrial natriuretic peptide (ANP)41
METHODS OF MEASURING BLOOD PRESSURE
Blood pressure can be measured by invasive and non-invasive methods
1) Invasive (or direct) method - Blood pressure is most accurately measured invasively
through an arterial line4243 It is the gold standard by which the accuracy of other blood
pressure measuring devices and methods are assessed4344 Chyun43 compared direct and
indirect blood pressure readings in 14 intensive care unit patients and found that the
auscultatory method overestimates the systolic and diastolic BP especially if the VI Kortkoff
sounds is used as an indicator of diastolic BP This can often over estimate reading by as
much as 20 mm Hg43 This study is made up of very small sample size to make general
conclusion on the differences in BP values from the two methods compared Although the
invasive method is the gold standard for true BP measurement it is associated with serious
complications related to arterial catheterization and the procedure itself may be technically
difficult It is mainly used in experimental procedures and in monitoring critically ill patients
in intensive care units42
2) Non invasive (indirect) methods These are simpler and quicker than the invasive
method and are commonly used for routine blood pressure examinations They may
however yield lower accuracy and small systematic differences in numerical results43
These methods include-
18
a) Palpation method - A minimum systolic value can be estimated by palpation Deakin
and Low45 reported that a palpable radial femoral or carotid pulse indicates a minimum
systolic BP of 80 70 and 60 mmHg respectively The study was carried out among adults
and these values could not be applicable in children and neonate whose maximum
systolic BP may be lower than the reported minimum values A more accurate systolic BP
value can be determined by inflating and then deflating sphygmomanometer cuff while
palpating the pulse The systolic BP corresponds to the pressure at which the radial pulse
becomes palpable45 Its disadvantages are that pressure obtained is usually 2-5mmHg less
than those obtained by auscultation and diastolic BP cannot be measured32
b) Auscultation method- Also called the Korotkoff method is the method of choice in
clinical practice142 It involves using a stethoscope and a sphygmomanometer46 The
mercury sphygmomanometer is the gold standard for BP measurement A Riva-Rocci
cuff 27 is placed over the arm and inflated to occlude the brachial artery It is then
gradually deflated until blood flow is re-established accompanied by a tapping sound
which can be detected by the stethoscope held over the artery Five sounds are
traditionally heard and classified into phases30 The first phase corresponds to the systolic
BP while the last or fifth phase corresponds to the diastolic BP30 The fourth phase
alternatively is used to measure the diastolic pressure if a 10 mmHg or greater
differences exist between the initiation of phases fourth and five or if the fifth sound is
heard down to 0 mmHg8 This may occur in cases of high cardiac output or peripheral
vasodilatation children or in pregnancy This method though the method of choice in
clinical practice may however be associated with errors arising from faulty technique and
equipment4748 as well as observer bias49 This method was used for this study because of
its widespread general usage its reliability and accuracy Unlike other methods the
instruments (mercury sphygmomanometer and stethoscope) do not require any
19
calibration and values obtained do not require validation by other methods The standard
World Health OrganizationCenter for Disease Control (WHOCDC) blood pressure
reference percentile tables were generated using the mercury sphygmomanometer hence
the auscultation method is the gold standard for BP evaluation258
The aneroid sphygmomanometer measures BP by mechanical system of metal
bellows that expand as the cuff pressure increases in a series of levers that register the
pressure on a circular scale The hybrid shygmomanometer combines some of the features
of the two and uses an electric transducer to record blood pressure2
c) Oscillometric technique- This uses the oscillometric device Oscillation of pressure in a
sphygmomanometer cuff is recorded during gradual deflation The point of maximum
oscillation corresponds to the mean arterial pressure50 The oscillation begins well above
systolic BP and continues below diastolic BP so that systolic and diastolic BP can only
be estimated indirectly according to some empirically derived algorithm
d) Ultrasound method - This uses an ultrasound transmitter and receiver placed over the
brachial artery under a sphygmomanometer cuff As the cuff is deflated the movement of
the arterial wall and systolic BP cause a Doppler phase shift in the reflected ultrasound
The diastolic BP is recorded as the point of diminished arterial motion51 Its advantage
includes the ability to detect diastolic BP in atrial fibrillation and hypotension where
Korotkoff sound is faint152
FACTORS AFFECTING BLOOD PRESSURE IN ADOLESCENTS
Several inter-related factors affect blood pressure These include-
Age - A progressive BP elevation with age has been observed in several studies2153-55
The rate of rise varies in boys and girls5455 The average systolic increase ranges between
20
166 and 286 mmHgyr for boys and 144 and 263mmHgyr for girls while that of
diastolic BP ranges from 083 and 177mmHgyr for boys and 077 and 148mmHg for
girls2155 Bugaje Yakubu and Ogala21 studied blood pressure pattern among 2035
adolescents in Zaria and found a consistent rise of BP with age The rate of rise was fairly
constant until 11-13 years in boys and 12-14 years in girls when the rise became rapid A
similar study53 also found a BP rise with age among 650 healthy school children in Jos In
a large population studies in Lebanon56 and Saudi Arabia55 BP was similarly reported to
increase consistently with age Rapid growth and biological maturation of organs which
are normal occurrences during adolescence were thought to be responsible rather than the
chronological age56 The results of these studies showed increasing blood pressure with
age despite the fact that one study55 used oscillometric method for their study while the
standard auscultation was used in the other studies Also the studied sample sizes across
these studies varied greatly with sizes of 65053 203521 571054 and 1622655 Despite this
the findings were similar
Gender ndash Results of studies on the effect of gender on BP showed that sex positively
affects blood pressure2153-55 Merhi Al-Hajj and Al-Tannir et al54 studied BP pattern in
5710 Lebanese school children while Al-Salloum El-Mouzan and Al-Herbish et al55
studied BP pattern in 16226 Saudi children and adolescents The authors reported a
higher BP in girls than boys at all ages A study21 of BP pattern in adolescents in Zaria
Nigeria demonstrated an initial higher BP in boys before puberty which reversed with the
onset of puberty up to the age of 14-15yrs when it reversed again to be higher in boys
Akinkugbe Akinwolere and Kayode56 reported no sex differences in adolescent BP in
Ibadan The reported sex difference is said to be likely due to differences in sex hormone
and pattern of growth in boys and girls57 Differences in age range of the study population
may however be responsible for the observed BP variation For instance these studies5455
21
comprised of both adolescents and pre-adolescent age groups combined in one study
while the other two studies2156 were purely adolescents21 Blood pressure is reported to be
equal in both sexes before adolescence after which the gender difference starts to
manifest most likely due to physical and hormonal changes
Socioeconomic Factors - Belonging to either end of the socioeconomic strata is found to
be associated with elevated blood pressure5859 A study in Ibadan56 reported an inverse
relationship between parental socioeconomic status and level of BP in adolescents The
authors suggested that this might be the result of the health behaviours and problems
characteristic of the lower socioeconomic class On the other hand Ejeke Ugwu and
Ezeanyika et al60 in Lokoja and another study53 in Jos both found higher BP in children
from high socioeconomic class Colhoun Hemminway and Poulter61 in a meta-analysis of
BP and socioeconomic status in developed and developing countries found an inverse
relationship of BP with socioeconomic status in developed nations and a direct correlation
in developing countries These different findings may be due to methodological
differences in socio-demographic stratification For instance Akinkugbe and
colleagues59 used fatherrsquos level of education for social classification Parentrsquos educational
level may however not equate well with level of family income The other study60 used an
automated device for their study whose values may require validation using the
recommended auscultation method Difference in environmental stresses may also be
different considering the level of development of the areas where the studies were carried
out
GeneticFamilial Factors - The effect of geneticfamilial factors on BP has been
demonstrated in some studies62-64 Familialgenetic correlations reflected in BP and other
anthropometry generally are higher among genetically close relatives such as brother-
sisters or parent-offspring than among spouses62 Levshit and Gerber63 surveyed 514
22
individuals from 135 nuclear families in Russia while Budaruddoza62 studied 1400
individuals from 380 families in India and found significant genetic influence on BP
Mijinyawa Iliyasu and Borodo65 also reported family history of hypertension as risk
factor for developing high BP in a study on prevalence of hypertension among 1000
teenagers in Kano The authors concluded that this could be due to genetic predisposition
They however did not evaluate further to determine the genetic defects The authors did
not also consider shared environmental factors known to influence blood pressure in
individuals Molecular genetic studies have identified genes as possible regulators of
BP6667 These genes regulate the renin-angiotensin-aldosterone system involved in renal
salt handling69 Mutations that increase sodium reabsorption and salt sensitivity is
associated with higher BP and vice versa68 while shared environmental risk factors may
potentiate the development of such familial conditions which might have been
responsible for outcome of the above studies6364
Environmental Factors ndash Environmental factors greatly influence BP variation in a
population592269 Akinkugbe and Ojo70 reported a consistently higher BP in Nigerian
adolescents than their counterparts of similar ages in black and white American children
The authors are of the view that this could be due to different environmental factors of the
study population Obika Adedoyin and Olowoyeye22 studied BP pattern in 2526
children aged 1-14 years in rural semi-urban and urban communities in Ilorin Nigeria
and demonstrated a hypertension prevalence of 95 in urban compared to 63 in rural
communities This was similar to the study59 in Ghana and Gambia69 The authors592269
argued that the differences were due to socioeconomic status which is higher in the urban
than the rural areas The BP variation could be accounted for by the nature of dietary
intake since the rural communities generally consume more of natural foods with less salt
and lsquojunk foodsrsquo compared to the urban populace This was demonstrated by one study61
23
which reported higher mean BP among urban communities in developing nations due to
changes in their dietary pattern Rural areas are also less exposed to the stress and hassle
of the urban cities It is of interest to note however that urban areas are a mixture of
social classes as a result of migrant workers seeking lsquogreener pasturesrsquo Okagua Anochie
and Akani71 on the other hand reported higher mean BP among rural adolescents than
their urban counter parts in Port Harcourt The authors could not identify the reason(s) for
their finding but concluded that the seemingly protective privilege of rural life may be
fading gradually The differences in the reports could however result from the sample size
composition comprising of preadolescents22 adolescents71 and adults69
Race - Higher BP levels have been reported in African-American and Hispanic school-
age children than their Caucasian counterparts and among African-Americans than the
Hispanics7273 Akinkugbe and Ojo70 demonstrated a consistently high systolic and
diastolic BP in Nigerian children compared with black and white American children of
similar age Exposure to chronic environmental stress low socioeconomic status and high
obesity rate among African American and Hispanic youths could contribute to higher
BP72-74 It can be inferred from the study that race alone may not be responsible for the
observed differences but shared environmental factors and socioeconomic status may be
contributory77 Other studies7475 however found no significant BP differences in relation
to race
Anthropometry and blood pressure (BP) - A positive correlation has been observed
between BP and anthropometry in various studies58-5977 These studies585678 observed a
significant correlation between systolic BP and weight height and body mass index
(BMI) in boys but only with weight in girls Body mass index (BMI) is used as a
measure of overall obesity but it is known to be a poor indicator of actual body fat79
Waist circumference (WC) is an aggregate measurement of the actual amount of total and
24
abdominal fat accumulation80 It is therefore a better predictor of BP and other
cardiovascular diseases8081 Guagnano Ballone and Colagrande et al81 studied the
relationship between BP and BMI WC and waist hip ratio (WHR) in 461 people and
found WC to be the most consistent anthropometry affecting BP It is of interest to note
that the study by Guagnano et al81 was in adults population while the other studies56-59
were in children and adolescents WC was also found to be a better predictor of BP in an
Italian study8081 while it was not in others56-6982 Comparing BMI and waist
circumference and their effects on BP Arauzo Lopes and Moriera et al83 in Brazilian
children found BMI to be a better predictor of BP than waist circumference This was
similar to the study by Sebanjo and Oshikoya82 in Nigerian adolescents in Akure Thus
waist circumference measurements may not be useful in the evaluation of obesity andor
hypertension in children and adolescents This may partly be explained by the uniform fat
distribution due to hormonal effect at puberty in adolescents compared to the
disproportionate fat distribution in adults Possible mechanisms for the positive
relationship between BP and high BMI includes decreased physical activity increased
salt intake impaired pulmonary functions and development of metabolic abnormalities
such as dyslipidaemia and insulin resistance8084
Nutritional factors - Diet has been a primary link between humans and their environment
and substantial evidence supports the concept that multiple dietary factors affect BP85
Well-established dietary modifications that lower BP are reduced salt intake increased
potassium intake increased protein particularly plant protein high vegetable and
polyunsaturated fats85 High sodium intake on the other hand is said to be associated with
elevated blood pressure86 A series of 3 large controlled feeding studies tested the effects
of dietary patterns on BP86-89 Of the 3 diets studied the dietary approach to stop
hypertension (DASH) emphasized fruits vegetables low-fat dairy products whole
25
grains poultry fish nuts potassium magnesium calcium and fibre as the most effective
diet89 Among all participants the DASH diet significantly lowered mean systolic BP by
55 mm Hg and mean diastolic BP by 30 mm Hg each net of changes in the control diet
DEFINITION AND CLASSIFICATION OF ADOLESCENCE
Adolescence is the transitional stage between childhood and adulthood during which many
life patterns are learnt and established90 According to World Health Organization (WHO)
adolescents are individuals between the age range of 10-19 years17 The most significant
feature of adolescence is puberty characterized by an exceptionally rapid rate of biological
growth and development including physical and sexual maturation9091 The pubertal changes
have been described by Tanner and Marshal92 and are grouped into five stages This utilizes
definite criteria for growth and development of secondary sexual characteristics like pubic
hair and breast in females and pubic hair and genitalia in males9092 The timing of these
events and the rate of growth vary due to genetic and environmental factors in different
populations92 Adolescence is divided into early middle and late periods17
Early adolescence (10-13 years) ndash This is a period of rapid growth and development of
secondary sexual characteristics and varies according to sex It corresponds to Tanner stages
1 and 290 The main features of this stage are breast bud development and menarche in girls
while testicular enlargement and seminal emission occurs in boys93
Middle adolescence (14-16 years) ndash In this stage rapid growth decreases and there is more
cognitive development as the adolescents move from concrete thinking to formal operation
and develop greater competence at abstract thinking91 This corresponds to Tanner stages 3
and 4
Late adolescence (17-19 years) ndash Here slowing of physical changes continue which permits
the emergence of a more stable body image Cognition tends to be less self-centered with
26
demonstration of care for others with increasing thought about concepts such as justice
patriotism and history It corresponds to Tanner stage 59092
ADOLESCENCE AND BLOOD PRESSURE
Adolescence is characteristically associated with increasing blood pressure because of the
physical growth and hormonal changes associated with puberty5794 After the age of one year
normal BP increases more during puberty than probably at any other time in an individualrsquos
lifetime95 Wanzhu Eckert and Saha et al57 examined data from a cohort of 182 normotensive
children in Indiana who had blood pressure measurements taken semi-annually for up to 12
yr The authors found that the rate of change in BP and weight peaked at the age of maximum
pubertal growth spurt (PGS) This BP spurt roughly coincides with growth spurt during
puberty94 Surveys of BP patterns from childhood through adolescence shows systolic and
diastolic pressures increase with age and in adolescents the increase in males is more marked
than in females especially the systolic pressure5458229495
CLASSIFICATION OF BLOOD PRESSURE IN ADOLESCENTS
The National High Blood Pressure Education Program Working Group (NHBPEPWG) of the
United States established guidelines for the definition of normal and elevated blood pressures
in children in 19876 These guidelines were revised in 20048 The definition of childhood
hypertension in the guidelines are based upon the normative distribution of blood pressure
(BP) in healthy children rather than clinical outcome data as in adults The guidelines
classified BP as normal prehypertensive or hypertensive Hypertension is graded into stage
one and two8
Normal BP - Blood pressure lt90th percentile for age sex and height Children and
adolescents with normal BP should be followed annually from the age of 3 years5 They
27
should be encouraged to maintain a healthy life style such as good dietary intake physical
activities and adequate rest8
Pre-hypertension - Blood pressure between the 90th and lt 95th or if BP exceeds
12080mmHg (even if lt90th percentile) but lt95th It was previously called high normal
BP This new description was introduced to help identify children at risk for the
development of persistent hypertension for whom targeted prevention programmes would
be most beneficial96 While recommendations for the diagnosis of hypertension in
children require that BP remains elevated on three separate occasions repeated
measurements are not necessary to classify an adolescent as pre-hypertensive11 The
prevalence of childhoodadolescence pre-hypertension in US is reported to be between
12-1796-98 In Nigeria Ejeke Ugwu and Ezeanyika99 in a study of the prevalence of
point prehypertension and hypertension in 843 adolescents in Lokoja reported a
prevalence of point prehypertension of 222 and 250 in semi urban and urban
communities respectively Ujunwa Ikefuna and Nwokocha et al100 reported 175
prehypertension prevalence among adolescents in Enugu Among adults with pre-
hypertension it is reported that as much as 10 per year develop hypertension101 There
is little information on the time course for children and adolescents with prehypertension
developing hypertension A value of between 11-7 per year has been reported in US
adolescents98 There is no known study on rate of progression of prehypertension to
hypertension in Nigerian adolescents The NHBPEP recommended that children with
pre-hypertension should have their BP checked after every six (6) months to monitor for
progression to hypertension They should be encouraged to engage in physical activity
healthy dietary behaviours and weight management if overweight Pharmacologic therapy
is not indicated except if there is strong evidence of renal disease heart failure left
ventricular hypertrophy or diabetes mellitus8
28
Hypertension Hypertension is BP persistently equal to or above the 95th percentile for
age sex and height measured on three or more separate occasions If the blood pressure
measurement obtained is gt 95th percentile the degree of hypertension should be staged
Stage 1 hypertension- BP value between the 95th and the 99th percentile plus 5mmHg It
is recommended that BP should be rechecked in 1ndash2 wks or sooner if the patient is
symptomatic If persistently elevated on 2 additional occasions it should be evaluated or
referred to source of care for pharmacologic treatment within 1 month 8
Stage 2 hypertension- BP value gt99th percentile plus 5mmHg This stage calls for more
prompt evaluation and commencement of pharmacologic therapy102 It is recommended
that the individual be evaluated or referred to source of care within 1wk or immediately if
the patient is symptomatic8
Aetiology of hypertension
Hypertension is classified as primary (essential) when there is no identifiable cause
or secondary if due to an underlying disease31 Factors such as heredity diet stress drugs and
obesity play a role in the development of essential hypertension103104 Causes of secondary
hypertension include umbilical artery catheterization renal diseases coarctation of the aorta
and endocrine disorders105106 Aderele and Sereki6 in their study of hypertension in children
reported hypertension secondary to renal pathology as the commonest cause of elevated BP
in children This study was mainly in preadolescent population in which secondary
hypertension is a common finding On the other hand Antia-Obong and Antia-Obong107
reported no apparent cause in greater than 90 of the studied subjects with elevated BP and
also reported proteinuria of 1 in the same population without any associated elevated blood
pressure The study did not however evaluate the etiology of the proteinuria A study65 of BP
in teenagers in Kano found family history of hypertension a risk factor in the study
population Another study in Enugu100 examined modifiable risk factors associated with
29
hypertension in 2694 adolescents and found only 1 and 06 of the hypertensive subjects
to be overweight and obese respectively The authors also found that smoking and alcohol
consumption were not significant risk for hypertension This may however be due to the
shorter period of consumption of these products by the students as a cumulative effect from
long term consumption is known to be associated with adverse health outcomes
Prevalence of hypertension in adolescents
The prevalence of hypertension in adolescents varies widely due to arbitrary and imprecise
definition by different researchers It was in view of this that the National High Blood
Pressure Education Program Working Group (NHBPEPWG) of the United States established
guidelines for the definition of normal and elevated blood pressures in children and
adolescents for uniformity68 In the USA the prevalence is about 20 in normal weight and
50 in their obese counterparts108 A prevalence rate of 77109 10554 and 223110 has
been reported in Spain Lebanon and South Africa respectively In Kano Nigeria a study65
on the prevalence of hypertension among 1000 teenagers found a prevalence of 72 Similar
study in Enugu100 on the prevalence of hypertension among 2694 secondary school
adolescents reported a hypertension prevalence of 54 It is of interest to note that different
prevalence was reported because of the different methodology used by the authors While the
study in Kano65 applied the adult blood pressure criterion of BP greater than 14090mmHg as
hypertension the study in Enugu100 used blood pressure greater than 95th percentile for age
and sex Also the study in Kano65 took a single set of measurement while the study100 in
Enugu measured blood pressure of the subject three times at weekly intervals Bugaje
Yakubu and Ogala21 on the other hand defined hypertension as blood pressure greater than
two standard deviations from the mean and also took six readings over thirty minutes and got
a prevalence of hypertension of 34 A prevalence rate of 48107 and 9522 in Southern
and Western region of the Nigeria respectively was also reported It is obvious that because
30
of the various defining criteria for hypertension in adolescents the prevalence of adolescent
hypertension remains imprecise
Clinical presentation- Hypertension is usually asymptomatic unless it has been
sustained or is rising rapidly109 Adolescents with essential hypertension are usually
detected during routine evaluation96 Non-specific symptoms such as lethargy headache
dizziness drowsiness visual disturbance and confusion may be present109 These could
also be signs of complications111 Secondary hypertension may show obvious features of
the underlying disease such as growth failure heat intolerance abdominal stria tremors
body swelling and haematuria8102 Croix and Feig112 studied the spectrum of symptoms in
409 children aged 7-18 years newly diagnosed hypertensive in Texas USA and reported
15 common symptoms than in the controls The symptoms were said to resolve after
commencement of antihypertensive medications The authors concluded that hypertensive
children had a variety of non-specific symptoms The three most common symptoms
reported were headache daytime tiredness and difficulty initiating sleep The study
however did not specify if other possible causes of these symptoms were excluded
Complications of hypertension - Hypertension is usually asymptomatic in adolescents
which if left unidentified overtime can cause serious complications109 Organs commonly
affected in the complication of hypertension are the heart kidneys brain and the eyes
leading to lowered life expectancy and premature death13 Left ventricular hypertrophy
(LVH) is the most prominent clinical evidence of end organ damage10 Studies have
shown that LVH can be seen in as many as 41 of patients even in adolescents with
asymptomatic hypertension10103 Adolescents with severe cases of hypertension are also
at increased risk of developing hypertensive encephalopathy seizures cerebrovascular
accidents and congestive heart failure103109 However data documenting such
complications in children and adolescents are generally lacking In a study of
31
hypertension among teenagers in Kano the researchers65 could not find any
complications in all the 1000 teenagers studied
Investigations and treatment- Basic investigations are all that may be required in
adolescents who are obese and with a family history of hypertension stage 1 disease and
normal findings on physical examination113 This is because primary hypertension is
commoner in adolescents Adolescents that are symptomatic or with stage 2 hypertension or
have features of secondary hypertension should be evaluated in more detail
Treatment of hypertension includes non-pharmacological and pharmacological
methods Non-pharmacologic management involves life style modification such as weight
reduction increased physical activities and dietary adjustment114 In a study to evaluate the
effect of diet and salt on treatment and prevention of hypertension Sacks Svetkey and
Vollmer et al86 reported the beneficial effect of both reduced salt intake and appropriate
dietary adjustment in the control of hypertension Similar benefits were reported in other
studies8788 Although both studies had fairly good sample size (n=412) the studies did not
specify if participants were on other substances or activities other than antihypertensive that
might have affected their BP The studies were also in adults and whether it has the same
effects in children and adolescents has not been evaluation However there is no doubt that
the outcome will be similar in adolescents as dietary modifications have been advocated as
non-pharmacologic management in them Non pharmacologic treatment is usually the initial
treatment in essential hypertension and as adjuvant to drug therapy in those with secondary or
complicated hypertension101114 Pharmacologic (drug) treatment includes diuretics beta-
blockers calcium channel blockers angiotensin converting enzyme inhibitors (ACEIs) and
angiotensin receptor blockers (ARB) among others106114 They are used in those with
symptomatic disease and in acute or chronic complications106
32
Prevention of hypertension may be viewed as part of the prevention of cardiovascular
disease102 In adolescents approaches to prevention include reduction in obesity
discouraging cigarette smoking and alcohol intake113 reduction in sodium intake and increase
in physical activity through community and school-based programmes103104 Growth
monitoring BP check during preventive care visit physical activity and urine screening for
proteinuria and haematuria can be used starting from early childhood
33
AIM AND OBJECTIVES
GENERAL AIM
To determine the blood pressure pattern of apparently healthy secondary school adolescents
in Jalingo Taraba State
SPECIFIC OBJECTIVES
To determine
1 Blood pressure pattern in relation to age and sex among adolescents aged 10-19
years
2 The relationship if any between blood pressure and the anthropometric parameters of
weight height BMI and waist circumference
3 The association between blood pressure and parental social-economic status
4 The point prevalence of prehypertension and hypertension in adolescents
34
MATERIALS AND METHODS
Study area
A cross-sectional survey of the blood pressure pattern of apparently healthy secondary
school adolescents aged 10-19 years was conducted in Jalingo over a six month period
from January to June 2014 Jalingo is the capital of Taraba State and lies within the
savannah belt of North Eastern Nigeria It lies between latitude 80 54rsquo north and longitude
110 21rsquo east and at an altitude of 360 meters above sea level115 Jalingo had a population of
118198 people18 The primary inhabitants are the Konas Mumuyes and Fulanis who are
mostly farmers Other indigenous ethnic groups include the Jukun Kuteb WurkumTiv
and host of other tribes The Ibos Hausas Yorubas among others are the non-indigenous
ethnic groups and are mostly civil servants and businessmen Jalingo has a tertiary health
centre the Federal Medical Centre Jalingo and the state specialist hospital It also has 15
private clinicshospital and many primary health care centres There are also tertiary
education institutions including Taraba State University As at 2013 there were 56
secondary schools in Jalingo 24 public and 32 private all of which were mixed schools
except one which is a girlsrsquo only school
Study design
The study was a cross sectional descriptive study of 1350 apparently healthy secondary
school adolescents in Jalingo
Ethical approval
Ethical approval for this study was obtained from the Scientific and Health Ethics Research
Committee of Ahmadu Bello University Teaching Hospital Zaria (Appendix 4) The Taraba
State Ministry of Education also gave the approval and permission to conduct the study in the
35
selected schools Consent was given by the studentsrsquo parents or guardian (Appendix 2) All
students whose parents gave consent voluntarily participated in the study
Sample size determination
The minimum sample size was calculated using the formula116
N=Z2 (pq) E2
Where N = minimum sample size
p = Prevalence of hypertension in adolescents A prevalence of 3421 was used
q = 1- p
E = margin of error tolerated =1
Z = 196 at 95 confidence level
N = 1962 x 0034 x (1-0034) 0012 = 1262
Therefore the minimum sample size was one thousand two hundred and sixty two
Allowance for non-responders of 5 63 extra subjects were added to the calculated
minimum sample size bringing the total to 1325 students To enhance representativeness of
the sample and to compensate for missing information and poorly filled proforma while
maintaining the sample size a total of 1350 was decided upon
Inclusion criteria
1 Students (ages 10-19 years) in the selected secondary schools
2 Students whose parents gave consent to participate in the study
3 Students who gave assent to participate in the study
Exclusion criteria
1 Students who had obvious skeletal deformities of the spine and legs which can affect
the height and ultimately the BMI
36
2 Students with known chronic disease (or history of such disease) like anaemia
chronic renal disease and cardiac disease because they are not apparently healthy and
these conditions could affect their blood pressure
3 Students with present or past history of chronic drug ingestion that can affect blood
pressure such as steriods and contraceptives
4 Students with high blood pressure already on antihypertensive
Pilot study
A pilot study was carried out in one of the schools a week before the commencement of
the study The school was selected by random sampling method using balloting and did
not participate in the main study The pilot study was carried out with the aim of
assessing the competence of the research assistants in the various measurements
following their training to ensure reliability It was also used to test the questionnaire
before its use during the main study and to provide information on the number of students
that can be measured in a day Consequently twenty students had their blood pressure
and anthropometry measured independently by the researcher and the research assistants
and data were compared using Students t-test There were no statistically significant
differences between the measurements The result of the pilot study is highlighted in
Table I It was also found that some parts of the questionnaire were not well understood
by most students and were adjusted appropriately in the main study (Appendix 1) The 20
students had their measurements done over a period of 3-4 hours (between 8am - 12noon)
by the researcher and the research assistants
Table I Result of pilot study
Variables Researcher Research t p
37
assistants
Mean(plusmnSD) SBP
mmHg
106(11) 104(12) 0550 0586
Mean(plusmnSD) DBP
mmHg
617(83) 63(10) 0450 0657
Mean(plusmnSD) Weight
kg
544(82) 527(122) 0520 0608
Mean(plusmnSD) Height m 16(01) 16(01) 0000 1000
Mean(plusmnSD) BMI
kgm2
198(36) 202(33) 0370 0716
Mean(plusmnSD) WC cm 692(72) 682(133) 0300 0769
Sampling method
Students were selected by multistage random sampling technique The list of secondary
schools obtained from the Taraba State Post Primary Schools Board served as the sampling
frame for schools There were 56 secondary schools 24 of which were public and 32 were
private schools a ratio of 113 Ten (10) schools were randomly selected by balloting four
(4) from public schools six (6) from private based on the number and approximately similar
ratio of private to public schools of 115 (46) Ten schools were selected to ensure wider
coverage and even distribution of students so that it could be truly representative of the
community All the ten schools had an overall total of eight thousand one hundred and seven
(8107) students The public schools had a total of five thousand nine hundred and forty
(5940) with nine hundred and eighty nine (989) students participating The private schools
had a total of two thousand one hundred and sixty-seven (2167) students with three hundred
and sixty one (361) participating These number (989 and 361) was calculated based on the
38
relative population of each school and proportionate to number of students in each school
Thereafter the number of students to participate per school was calculated proportionately to
the number of students in each school based on the number given by the school authority
Then the number in each class was also calculated proportionately from JSS1 to SS3 to
ensure fair and equal chance of participation for all age groups The calculation was done
thus n= a b x c
Where n= number of students per selected school
a= total numberpopulation of students in the school
b= total numberpopulation of students in all 10 selected schools (8107)
c= calculated total sample size (1350)
Students in each class from junior secondary school (JSS) 1-3 and senior secondary school
(SS) 1-3 were then randomly selected by balloting The number of selected schools total
number of students in a school and the number of students selected per school is outlined in
Table II
Table II Selected schools and number of students in each of the ten schools in Jalingo
Selected schools Total no of No of students
39
student in the
school (a)
n=8107
selected (n=abxc)
n=1350
Public schools
Govt Science Secondary School 2800 466
Govt Day Secondary School SGari 1200 200
Salisu Dogo Secondary School 1100 183
Govt Secondary School Magami 840 140
Total 5940 989
Private schools
Winners Comprehensive Secondary School 650 108
Hawai Secondary School 562 94
Centre for Quranic Science and Islamic Education 543 90
Good Success Secondary School 155 26
Jetters Academy 140 23
Yagai Academy 117 20
Total 2167 361
The study
The first contact with the students was a familiarization exercise to each of the schools during
which the teachers and students were given a talk by the researcher on blood pressure and the
40
importance of periodic blood pressure measurement They were given the opportunity to ask
questions which were responded to Both the students and their teachers actively participated
in the lectures
On the second day students were selected as described above and those selected
underwent general physical examination in the presence of a chaperon to identify those
who did not fulfilled the inclusion criteria Each selected student was given a proforma
(Appendix 1) in which information on their biodata and medical history were recorded
Other information obtained was parentrsquos medical history and their socioeconomic status
using the format described by Olusanya Okpere and Ezimokhai117 (Appendix 3) The
study was carried out in a relatively quiet and empty classroom to ensure privacy for both
male and female students The procedure for blood pressure measurement was
demonstrated on one of the research assistants and sometimes on one of the teachers by
the researcher to assure the students and allay their anxiety BP and anthropometric values
obtained were recorded in the study proforma An average of 15-20 students per day were
attended to over a period of 3-4 hours (between 8am - 12noon daily) by the researcher
one of the research assistants who is a medical officer a male nurse and a lady Youth
Corper (NYSC)
Blood pressure measurement
This was measured by the researcher and the research assistant (the medical officer) The
standard auscultation method was employed using a mercury sphygmomanometer (Acosson)
and a standard Littman stethoscope according to the guideline of the fourth report on the
diagnosis evaluation and treatment of hypertension in children and adolescents8 Each
students was rest-seated for 5 minutes before BP measurement With the student seated the
right arm rested on a table at the level of the heart an appropriate cuff size which covered
41
two-third (23rd) of the length of the arm was applied round the arm about 2cm above the
antecubital fossa Two cuff sizes were used for this study with dimensions of 10 x 24cm and
13 x 30cm the smaller cuff for the smaller adolescents and vice versa The bladder cuff was
inflated rapidly to 20-30mmHg above the point where the brachial artery was no longer
palpable The bell of the stethoscope was then placed over the brachial artery and the cuff
was deflated slowly at 2-5mmHgsecond while listening to the Korotkoff sounds Phases one
and five of the Korotkoff sounds were recorded as the systolic and diastolic BP
respectively119 Three recordings were taken at intervals of 3-5 minutes and the average was
the final BP in mmHg BP was interpreted based on the standard set by the fourth report on
the diagnosis evaluation and treatment of hypertension in children and adolescents of the
United States8 thus-
Normal BP ndash BP value between the 5th and lt 90th percentile for age sex and height
Prehypertension - BP value between the 90th and the lt95th percentile for age sex and height
or BP of 12080mmHg but less than the 95th percentile
Hypertension ndash BP value ge95th percentile for age sex and height
Students found to have prehypertension were educated and counseled on life style
modifications and the need to have their blood pressure checked in six monthsrsquo time and
annually subsequently Those with hypertension were educated on the implications of the
findings and were referred to the Federal Medical Center Jalingo for evaluation management
and follow-up
Height measurement
Height was measured in centimeters using a locally constructed stadiometer by the research
assistants Each student was measured barefooted standing with the heel back and occiput
42
against the stadiometre The head was held straight looking forward with the lower border of
the eye socket at a horizontal plane with that of the external auditory meatus The movable
part of the stadiometre was adjusted to rest on the vertex and the corresponding value read to
the nearest 01cm
Weight measurement
The weight was measured in kilograms by the researcher and the research assistants using a
bathroom scale (HANSON) Students were weighed in their approved school uniform
without caps head ties or cardigan and with their shoes removed The scale was checked
daily for accuracy using standard calibrated weight before and midway through each session
The weight of the student was measured to the nearest 01 kg
Body mass index (BMI)
This was calculated from the measured weight and height of the subject using the
formula118
BMI= Weight (kg) Height (m2)
Waist circumference measurement
WC was measured in centimeters using a measuring tape by the research assistants The
male assistant measured for boys and the lady Youth Corper measured for girls
Measurement was taken with the student standing completely relax and breathing
normally Clothing was pulled up or down and an inelastic measuring tape was placed
around the waist mid-way between the iliac crest and the lowest rib margin The ends of
the tape were pulled together lightly towards each other and the value read to the nearest
01cm117120
43
Data analysis
Data obtained were analyzed using Epi-Info statistical software package version 7 The
results obtained were presented in figures tables graphs and charts as appropriate Individual
mean BP levels were used as dependent variables and other measured variables as
independent variables The means and standard deviations were used to summarize
quantitative variables such as BP weight height waist circumference and BMI The chi-
squared test was used to test the significance of associations between categorical variables
Studentrsquos t-test was used to compare means of any two normally distributed continuous
variables Pearsonrsquos correlation coefficient and regression analysis were used to examine the
strength of association between BP and the anthropometries Probability level of statistical
significance value was set at lt005
RESULTS
General characteristics
A total of 1350 students were enrolled between January and June 2014 to determine their
blood pressure pattern 628 (465) were males and 722 (535) were females with
malefemale ratio of 111 Students enrolled in the study were drawn from both public and
44
private schools The number of students from public schools was 989 (733) while 361
(267) were from private schools as shown in Table II The mean age of the study subjects
was 153plusmn22 years with a range of 10-19 years The age and sex distribution of the students
is illustrated in Table III
Table III Age and sex distribution of 1350 study subjects in Jalingo
Ag
e
Male
n ()
Female
n ()
Total
N()
10 9(14) 13(18) 22 (16)
11 20(32) 31(43) 51(38)
12 36(57) 52(72) 88(65)
13 96(153) 85(118) 181(134)
14 92(146) 115(158) 207(153)
15 92(146) 111(154) 203(151)
16 66(105) 116(161) 182(135)
17 78(125) 91(126) 169(125)
18 79(126) 70(97) 149(110)
19 60(96) 38(53) 98(73)
To
tal
628(100) 722(100) 1350(100)
45
Socio-economic classes (SEC) ndash Most of the students were from the lower social classes
(4 and 5) with population of 650 (415 and 235) students The upper social classes (1 and
2) had the least population with 184 (62 and122) students The middle social class (3) had
516 students The distribution of the study subjects according to individual
socioeconomic class is shown in Figure I
Figure 1 Socioeconomic class distribution of students in Jalingo
Anthropometry
The anthropometric characteristics of the students are displayed in Tables IV V and VI
All the anthropometric parameters showed increasing values with age (Tables V and VI)
There were significant differences in the anthropometric indices of height (p=0000)
weight (p=0010) and body mass index (p=0000) between boys and girls but not
statistically significant for waist circumference (p=0145) as shown in Table IV
Weight ndash The mean weight of the students was 486plusmn109kg with a range of 23-100kg
(Table IV) Girls were heavier than boys up to middle adolescence after which males
46
were heavier than the females (Table V and VI) and this was statistically significant (t= -
256 p=0010)
Table IV Overall mean anthropometric measurements of the study subjects
Anthropometr
y
Male Female Total
n=628 n=722 N=1350 t p
Wt (kg)
Mean(plusmnSD) 4773(115
)
4926(103
)
4855(plusmn109
)
-
25
6
0007
Range 236-848 227-100 23-100
Ht (m)
Mean(plusmnSD) 159(012) 157(008) 158(plusmn010) 35
5
0000
Range 122-185 126-179 122-185
WC (cm)
Mean(plusmnSD) 6524(91) 6595(86) 6562(plusmn89) -
14
6
0145
Range 225-905 215-100 22-100
47
BMI (kgm2)
Mean(plusmnSD) 1825(27) 1947(33) 1891(plusmn31) -
74
1
0000
Range 117-325 114-42 114-42
Statistically significant p values at 005 level of significance Wt=Weight Ht=Height WC=Waist
Circumference BMI=Body Mass Index SD=Standard Deviation
Height- The mean height of the study population was 158plusmn09m and ranged from 122-
185m (Table IV) Girls were taller than boys at early and middle adolescence but these
reversed from 16 years in favour of the boys (Table V and VI) This differences was
statistically significant (t=448 p=0000)
Waist circumference (WC) - The overall mean waist circumference was 6562plusmn89cm and
a range of 225-100cm Girls had higher WC until late adolescence (18 years) when it
reversed but this was not statistically significant (t=-146 p=0145) This is displayed in
Tables IV V and VI
Body Mass Index (BMI) - Overall mean BMI was 189plusmn31 with a range of 114-42
There was a statistically significant difference between girls and boys (t=-741 p=0000)
Tables IV V and VI illustrate this findings
Table V Mean anthropometric measurements of 628 boys
Age No of
studen
ts
Wt(plusmnSD)
Kg
Ht(plusmnSD)
m
WC(plusmnSD)
cm
BMI(plusmnSD)
Kgm2)
48
10 9 349(50) 143(001
)
613(06) 169(01)
11 20 354(25) 143(002
)
617(13) 170(07)
12 36 363(51) 146(002
)
616(14) 167(06)
13 96 379(51) 150(003
)
602(40) 165(08)
14 92 412(50) 154(003
)
623(32) 169(08)
15 92 471(60) 160(003
)
634(39) 178(08)
16 66 525(52) 164(002
)
672(24) 192(09)
17 78 555(51) 167(002
)
680(31) 197(08)
18 79 576(61) 169(002
)
707(18) 200(08)
19 60 590(57) 170(002
)
716(16) 203(07)
Total 628 477(115 16(01) 652(91) 183(27)
49
)
Wt=Weight Ht=Height WC=Waist Circumference BMI=Body Mass Index SD=Standard Deviation
Table VI Mean anthropometric measurements of 722 girls
Age No of
students
Wt(plusmnSD)
Kg
Ht(plusmnSD)
m
WC(plusmnSD)
cm
BMI(plusmnSD)
Kgm2
10 13 313(34) 139(001) 582(05) 156(02)
11 31 361(53) 144(002) 611(12) 170(05)
12 52 403(64) 149(002) 625(21) 178(09)
13 85 458(66) 154(002) 657(22) 188(12)
14 115 478(74) 157(003) 627(48) 187(10)
15 111 508(65) 159(002) 666(34) 199(13)
16 116 521(60) 159(002) 678(28) 201(11)
17 91 541(62) 161(002) 681(28) 203(11)
18 70 556(63) 161(002) 696(21) 211(11)
19 38 540(48) 158(002) 688(14) 208(06)
Total 722 493(103) 16(010) 651(23) 190(09)
Wt=Weight Ht=Height WC=Waist circumference BMI=Body Mass Index SD=Standard Deviation
Blood pressure (BP) measurements
50
Table VII shows mean blood pressure distribution of the study population for all ages
The highest SBP and DBP were 165mmHg and 95mmHg at 18years and 15 years
respectively Table VIII displays mean BP distribution in relation to age and sex The
tables show that both systolic and diastolic blood pressure increased with age This is also
depicted in Figure 2
Table VII Mean and ranges of blood pressure of 1350 subjects
Systolic Blood Pressure
(mmHg)
Diastolic Blood Pressure
(mmHg)
Age
No of
students
Mean(plusmnSD) Range
Mean(plusmnSD) Range
10 22 936(74) 80-107 600(50) 47-70
11 51 992(106) 76-120 629(71) 47-83
12 88 1036(110) 80-140 657(60) 53-82
13 181 1042(108) 80-143 660(74) 48-88
14 207 1070(115) 83-150 675(76) 47-90
15 203 1090(119) 80-150 678(82) 47-95
16 182 1122(124) 80-150 696(80) 50-90
51
17 169 1132(118) 90-153 698(83) 48-93
18 149 1138(121) 90-165 712(88) 50-90
19 98 1131(127) 90-143 726(76) 57-90
Total 1350 1089(125) 76-165 683(82) 47-95
Table VIII Mean blood pressure in relation to age and sex
Mean(plusmnSD) Systolic blood pressure
(mmHg)
Mean(plusmnSD) Diastolic blood
pressure (mmHg)
A
ge
Male
n=628
Female
n=722
t p Male
n=62
8
Fema
le
n=72
2
t p
52
10 954(3
9)
923(6
0)
1
02
03
20
619(
32)
586(
46)
1
36
0
01
91
11 985(5
5)
997(9
2)
0
42
0
06
80
648(
39)
617(
57)
1
56
0
01
26
12 999(8
9)
1062(
117)
2
84
0
00
06
653(
29)
660(
52)
-
0
52
0
06
07
13 1012(
73)
1075(
73)
4
03
4
00
00
649(
43)
672(
59)
-
0
03
0
00
44
14 1036(
78)
1098(
78)
3
93
0
00
01
653(
44)
693(
58)
3
90
0
00
01
15 1071(
80)
1105(
87)
2
05
0
00
42
665(
58)
689(
56)
-
2
10
0
00
37
16 1135(
82)
1114(
91)
1
03
0
03
10
697(
51)
695(
61)
0
15
0
08
81
53
17 1152(
87)
1115(
77)
2
04
00
43
698(
59)
698(
58)
0
02
0
09
81
18 1141(
96)
1135(
74)
0
27
0
07
91
704(
62)
721(
63)
1
61
0
02
49
19 1146(
97)
1108(
80)
1
41
0
01
64
733(
63)
714(
43)
1
21
0
02
28
To
tal
1081(
133)
1095(
117)
-
2
05
4
00
40
678(
81)
687(
82)
-
2
07
7
00
38
Statistically significant p values at 005 levels of significance
54
Figure 2 Blood pressure distribution in relation to age and sex
SBP =Systolic blood pressure DBP=Diastolic blood pressure
Blood pressure and stages of adolescence
Table IX displays mean blood pressure according to stages of adolescence Girls had a
higher mean SBP than boys from early adolescence (t=3754 p=0000) to middle
adolescence (t=-3025 p=0003) and this was statistically significant This dominance was
also demonstrated in the DBP and was statistically significant in middle adolescence (t=-
3517 plt0000) Adolescents from private schools had higher mean SBP (t=-222
plt0027) and mean DBP (t=-461 p=0000) than those from public schools and these
differences were statistically significant
Table IX Mean blood pressure according to sex and stages of adolescence
Mean BP
(mmHg)
Age (years)
Male SBP
Female SBP
Male DBP
Female DBP
55
Stages
of
adolesc
ents
(years)
Mean(plusmnSD) systolic blood pressure
(mmHg)
Mean(plusmnSD) diastolic blood pressure
(mmHg)
Male Female t p Male Fema
le
t p
Early
(10-13)
1000(9
6)
1040(1
18)
37
54
00
00
648(
56)
653(
82)
05
99
05
50
Middle
(14-16)
1075(1
29)
1105(1
13)
-
30
25
00
03
670(
81)
694(
77)
-
35
17
00
00
Late
(17-19)
1140(1
28)
1121(1
11)
21
45
00
33
717(
85)
710(
83)
00
70
09
45
1082(1
33)
1092(1
17)
-
20
54
00
40
678(
81)
687(
82)
-
20
77
00
38
Statistically significant p values at 005 level of significance SD=Standard Deviation
Table X shows blood pressure pattern according to stages of adolescence
Prehypertension and hypertension were more prevalent in late adolescence than early and
middle adolescence (χ2=49054 p=0000) and (χ2=10305 p=0006) both of which were
statistically significant
Table X The pattern of normal BP Prehypertension and hypertension according to stages
of adolescence
56
Blood
pressure
pattern
Stages of adolescence
Early
n()
Middle
n()
Late
n()
Total
N()
χ2 p
Normal 290(84
8)
428(72
3)
275(66
1)
993(73
5)
429
79
000
0
prehypertens
ion
43(12
6)
135(22
8)
120(28
8)
298(22
1)
490
54
000
0
Hypertensio
n
9(26) 29(49) 21(51) 59(44) 103
05
000
6
342(10
0)
592(10
0)
416(10
0)
1350(1
00)
350
93
000
0
Statistically significant p value at 005 level of significance
Relationship between blood pressure and the measured anthropometry
There was a positive correlation between SBP and DBP with age and the anthropometric
variables of weight height waist circumference and BMI (Table XI) SBP showed a
stronger correlation with the anthropometries than the DBP and was stronger for weight
(r=051) and height (r=044) The waist circumference though statistically significant
showed the weakest correlation
Table XI Correlation between blood pressure age (yrs) and anthropometry
Parameters
Systolic Blood Pressure Diastolic Blood Pressure
Correlation
coefficient
p Correlation
coefficient
p
57
Age (yrs) 035 lt0000 030 lt0000
Height (m) 044 lt0000 034 lt0000
Weight (Kg) 051 lt0000 038 lt0000
WC (cm) 040 lt0000 029 lt0000
BMI
(Kgm2)
031 lt0000 023 lt0000
Statistically significant p values at 005 level of significance Wt=Weight Ht=Height WC=Waist
circumference BMI=Body Mass Index
Blood pressure distribution and socio-economic classes
Table XII shows mean blood pressure according to socio-economic class of the subjects
Lower social classes had higher mean SBP (t=1650 p=2850) and DBP (t=0193
p=00058) but these were not statistically significant
Table XII Mean Blood pressure in relation to socioeconomic classes
Blood
pressur
e
Socioeconomic classes
Upper (1 amp
2) n=184
Middle (3)
n=516
Lower (4 amp
5)
n=650
f(anova
)
p
Mean
(SD)
10857(126
)
10866(128
)
11040(109
)
1650 285
0
58
SBP
Mean
(DBP)
6820(83) 6791(83) 6957(76) 0193 005
8
SEC= Socioeconomic class SBP=Systolic Blood Pressure DBP=Diastolic Blood Pressure SD=Standard
Deviation
Table XIII shows blood pressure pattern in relation to socioeconomic classes of the
subjects The percentage of students with prehypertension was higher in the upper social
class ((χ2=3067 p=0216) while the percentage of hypertension were higher in the lower
socioeconomic classes (χ2=1037 p=0568) but these differences were not statistically
significant
Table XIII Blood pressure pattern in relation to socioeconomic status
Blood
pressure
pattern
Socioeconomic classes
Upper
(1 amp 2)
n()
Middle
(3)
n()
Lower
(4 amp 5)
n()
Total
N()
χ2 p
Normal 127(69
)
383(74
2)
483(74
3)
993(73
6)
417
6
012
4
Prehypertens
ion
52(28
3)
108(20
9)
138(21
2)
298(22
1)
306
7
021
6
Hypertension 5(27) 25(48) 29(45) 59(44) 103 056
59
7 8
184(10
0)
516(10
0)
650(10
0)
1350(10
0)
573
0
022
0
Prevalence of Hypertension and Prehypertension
Table XIV shows the prevalence of hypertension in the study population The total
number of students with hypertension was 59 giving an overall prevalence of 44
Thirty four students (25) had systolic hypertension sixteen (12) had diastolic
hypertension and nine students (07) had both systolic and diastolic hypertension
Systolic hypertension was more prevalent in the females and was more at the age of 16
years while diastolic hypertension was higher in males and this also occurred at 16 years
Among those with hypertension 27 and 16 subjects had stage 1 and 2 systolic
hypertension respectively With regard to diastolic hypertension 24 and 1 subjects had
stage 1 and 2 hypertension respectively The gender difference in the prevalence of
hypertension is not statistically significant (χ2=0831 p=0362)
The number of students with pre-hypertension was 298 giving an overall prevalence of
221 Of this 131 were males and 167 are females This is illustrated in Table XIV
Prehypertension is more prevalent in females than males and this was statistically
significant (χ2=4349 p=0037)
60
Table XIV Overall Blood pressure pattern and prevalence of hypertension and
prehypertension of 1350 students in Jalingo
Blood pressure
pattern
Males
n=()
Females
n=()
Total
N()
χ2 p
Normal 471(750) 522(723) 993(735) 2619 0106
Prehypertension 131(209) 167(231) 298(221) 4349 0037
Hypertension 26(41) 33(46) 59(44) 0831 0362
628(100) 722(100) 1350(100) 1260 0533
statistically significant p value at 005 level of significance
61
DISCUSSION
The findings of this study showed that the BP of secondary school adolescents in Jalingo
was similar in terms of mean values range and trend of progression with age to that of
other adolescents from Ibadan63 and Kogi60 (Nigeria) Ashanti (Ghana)59 and Lebanon54
The mean value was however lower than the mean BP of adolescents from Zaria
(Nigeria)21 Belgrade ( Serbia)78 and Fortaleza-Cearaacute (Brazil)83 who had higher mean BP
in both sexes and at all ages The lower mean BP in this study compared to that of
adolescents from Zaria21 Belgrade78 and Brazil83 could be due to lower mean
anthropometry of weight height and BMI in adolescents from Jalingo resulting in lower
mean BP The sample sizes of these studies7883 were also different and could have
affected the mean BP of the study population For instance the sample size in the
Brazilian study83 is 151 compared to the study in Lebanon54 with 5710 subjects The use
of the fifth Korotkoff sounds as DBP in this study21 could also have accounted for the
lower mean BP in contrast to a similar study in Zaria21 where the fourth Korotkoff sound
was used as the DBP
A progressive increase in blood pressure with age was found in this study This
was similar to most findings by researchers in Nigeria 215358-606566107 and
worldwide54555961 The peak age of rise in BP in this study was in middle adolescence
between 15-16 years in boys but much earlier in girls for both systolic and diastolic BP
This was similar to the study by Akinkugbe Akinwolere and Kayode56 in Ibadan and
Ejeke Ugwu and Ezeanyika et al60 in Lokoja This age group is usually the period of
onset of puberty The chronologic age is not the main factor responsible for BP increase
62
with age but rather the progressive increase in size of the individual Increase in body
size with growth and maturity of organs associated with the physical and hormonal
changes during puberty potentially lead to increasing BP The simultaneous increase in
weight height and other anthropometric indices alongside BP with age seen in this study
and others is in agreement with that The implication of this increase in blood pressure
with age is that those with prehypertensionhypertension in childhood may continue into
adulthood hence further increasing the high prevalence of hypertension in the adult
population with its attendant morbidity disability and mortality
Overall significant higher mean BP was recorded in girls than boys in this study
This was seen from early to middle adolescence after which it reversed in favour of the
boys Reports on the relationship between BP and sex have been inconsistent Some have
reported higher mean BP in females54-56 others higher in males5883 while yet another
reported no sex differences22 The findings of this study were similar to those of Bugaje
Yakubu and Ogala21 and Ujunwa Ikefuna and Nwokocha100 who reported a consistently
higher mean blood pressure in female adolescents up to 16 years compared to their male
counterparts of similar ages Early female predominance in mean blood pressure was also
reports by Agyemang Redekop and Owusu-Dabo et al59 in Ashanti adolescents in Ghana
and Obika Adedoyin and Olowoyeye22 in Illorin The finding was however in contrast
with the study in Calabar58 where higher mean BP was found in boys than girls at all
ages The reason for the higher mean BP in females than boys could be because of earlier
onset of puberty in girls The differences in blood pressure between boys and girls in this
study could also be accounted for by variation in the anthropometric variables of the
individuals as girls were seen to be heavier and taller up to middle adolescence
This study demonstrated a consistently positive relationship between blood
pressure and the anthropometric variables of weight height body mass index and waist
63
circumference as widely reported in other studies 545558-6165107100 Weight is reported to
correlate positively with blood pressure in several studies53565871 Body mass index
(BMI) also showed a positive relation with BP in this study as reported in other
studies5978-81 This is in-keeping with the findings in Port Hacourt71 Abeokuta83 the
Gambia69 Brazil82 and Belgrade77 children Some of these studies however were made
up of younger and older age groups Even in lean populations BMI is known to correlate
positively with BP Waist circumference was also found in this study to correlate
positively with BP This was similar to reports from other studies79-8183 It was found to
be a better predictor of BP in two Italian study8081 while it was not in another82
Comparing BMI and waist circumference and their effects on BP Arauzo Lopes and
Moriera et al82 in Brazilian children found BMI to be a better predictor of BP than waist
circumference This was similar to the report by Sebanjo and Oshikoya83 in Nigerian
adolescents in Akure Guagnano Ballone and Colagrande et al81 however found waist
circumference to be better than BMI The study81 however involved adults and may not
be applicable in children and adolescents The present study demonstrated BMI and WC
to be significant but found BMI to be a better determinant of BP than waist
circumference BMI and waist circumference measure obesity in an individual Whereas
BMI is a measure of overall obesity WC measures centralabdominal fat accumulation
and thus said to be more predictive of adverse health risk79 Obese individuals may be
prone to such condition as dyslipidaemia insulin resistance and hypertension with
reduction in the quality of life Weight BMI and or waist circumference affects blood
pressure through decreased physical activity increased cardiac output insulin resistance
impaired pulmonary function and other hormonal abnormalities8084 It seems therefore
that BMI is a better predictor of BP in adolescents than waist circumference The reason
64
for this is not obvious but it may be because of the nature of uniform fat distribution in
adolescents associated with growth and hormonal changes at puberty
Blood pressure distribution in relation to the parental socio-economic class in this
study showed that students from low socio-economic classes had higher mean blood
pressure than those from upper socioeconomic classes but this was not statistically
significant A study in Ibadanl56 reported a statistically significant negative relation
between blood pressure and parental socio-economic status It was also similar to the
study58 in Calabar In contrast other studies found the reverse536022 The reasons for the
inverse relationship between BP and socioeconomic includes exposure to chronic
environmental stress with sustained sympathetic nervous system stimulation Others are
poor health seeking behaviours due to low income andor inadequate health knowledge
high low birth weight rate and inadequate healthy diets among others97101 In the same
environment individuals from a high social class are believed to be more educated with
high income61 They have easy access to health education and awareness on hypertension
prevention and control and better accessibility and adherence to medical treatment617374
The former might be responsible for the finding of this study as Jalingo is a semi urban
community Most of its inhabitants are subsistent farmers civil servants and traders with
low income The high number of students in the lower socioeconomic class lays credence
to that
The overall point prevalence of hypertension in this study was 44 while that of
pre-hypertension was 221 This prevalence of hypertension is similar to the prevalence
of 48 by Antia-Obong and Antia-Obong107 but higher than the prevalence rate of 37
reported in Zaria21 and lower than the prevalence of 58 reported in Ibadan56 54 in
Enugu100 and the 72 reported in Kano65 The prevalence of pre-hypertension was lower
than that reported by Ejeke Ugwu and Ezeanyika99 who found a prehypertensive
65
prevalence of 25 among adolescents in Lokoja It is higher than the 173 reported by
Ujunwa Ikefuna and Nwokocha et al100 in Enugu and 12-17 by Redwine and
Daniels96 among US adolescents The differences in the reported prevalence of
hypertension and prehypertension in adolescents could have resulted from the different
criteria applied by the various researchers in defining hypertension For instance whereas
this study used BP greater than 95th percentile as hypertension a study in Kano65 used the
adult hypertensive value of BPgt14090mmHg as hypertension and got a prevalence of
72 The prevalence in that study65 could have been higher if the percentile or the
statistical definition was used as many children with BP 14090mmHg would probably be
at stage 2 hypertension This was demonstrated in the study by Bugaje Yakubu and
Ogala21 who found a prevalence of hypertension in their study to be 06 when the adult
cut off value of gt14090mmHg was used but it increased to 37 when the statistical
definition of BPgt 2 standard deviations was used
The number of times blood pressure is taken could affect the outcome as repeated
measurements over a time interval is known to give lower BP values than if BP is taken
once This study used the average of three blood pressure values taken at one sitting but
Ujunwa Ekefuna and Nwokocha100 took three readings at five minutes interval with two
other readings at a week interval In that study100 the prevalence of prehypertension
dropped from 745 during the first set of readings to 173 after the third week
readings The prevalence of hypertension also dropped from 135 to 54 over the same
period Similar decrease in the prevalence of both prehypertension and hypertension was
reported by Redwine and Daniels96 in US adolescents when blood pressure was taken
over time interval Another factor which might have affected the overall prevalence is the
Korotkoff sound used for diastolic pressure23 The 4th or 5th Korotkoff sounds has been
used by different researchers resulting in different diastolic BP The study21 in Zaria used
66
the 4th Korotkoff sound while most other researchers2265100 used the 5th About 5-
10mmHg difference is said to exist between the 4th and 5th Korotkoff sounds230 In this
study the 5th Korotkoff sound was used thus giving a higher prevalence of hypertension
in the studied population than in those where the 4th sound was used
The implication of the outcome of this study is that 44 of adolescents in Jalingo
are already hypertensive while 221 of them are at risk of developing hypertension as
they are pre-hypertensive Since 856 (255 of 298) of the prehypertensives were in the
middle and late adolescence these individuals are likely to be adults with high blood
pressure Therefore regular screening of this group of individuals who were assumed to
be a healthy population is highly important for early detection of hypertension and
intervention such as life style changes and treatment
67
CONCLUSIONS
The following conclusions can be made from this study
1 The mean and range of blood pressure of adolescents in Jalingo was similar to
those of other adolescents in Nigeria and other parts of the world Blood pressure
increased progressively with age
2 All measured anthropometry of weight height body mass index and waist
circumference correlated positively with BP but weight was the most significant
variable in BP determination
3 Socioeconomic status was not significantly related with blood pressure
4 The point prevalence of hypertension and pre-hypertension was 44 and 221
respectively using a recommended definition
RECOMMENDATIONS
1 In view of the high prevalence of prehypertension in this study it is recommended
that students should have their blood pressure measured at school entry as this will
68
help identify those with abnormal BP for early intervention Thereafter BP check
should be offered at least once a year at the beginning of a new session especially for
those found with abnormal BP at school entry
2 Physical and health education should be revived in all the schools This will lead to
increased physical activity and reduced risk of obesity and its consequences
3 School health programmes should be strengthened in schools where it already exist
and effort made to establish same in schools where it is yet to exist The programme
should include measures to detect early prehypertension and hypertension and other
health related needs of the students
LIMITATIONS
The following limitations were encountered in the course of the study
1 Exclusion and inclusion of students that were based on volunteered information and
physical evaluation This could have led to inclusion andor exclusion of adolescentss
69
with or without background renal diseases which could have affected the result of this
study
2 Home blood pressure measurement especially early morning measurement for those
with high blood pressure to possibly eliminate the effect of stress traffic andor
trekking and other school related stresses which may affect blood pressure during the
day
LINES OF FUTURE RESEARCH
This study was questionnaire based and time bound Consequently students were not
investigated for background diseases co-mordid conditions target organ damage or risk
factors for high blood pressure They were also not followed up In view of this future
research on blood pressure in adolescents should include-
70
1 Investigations such as urinalysis electrolytes urea and creatinine random blood
sugar (RBS) lipid profile and echocardiography as part of blood pressure evaluation
in adolescents
2 A long period of study to allow for follow-up over months or years to identify those
that are truly hypertensive considering the definition of hypertension It will also
reveal the rate of progression from pre-hypertension to hypertension
3 Risk factors evaluation for high blood pressure including genetic predispositions
REFERENCES
1 Blood pressure from Wikipedia the free Error Hyperlink reference not valid
Accessed 24th November 2011
2 Pickering TG Hall JE Appel LJ Falkner BE Graves J Hill MN Jones DW Kurtz T
Sheps SG Roccella EJ Recommendations for blood pressure measurement in humans
and experimental animals Part 1 Blood pressure measurement in humans A
statement for professionals from the subcommittee of professional and public
71
education of the American Heart Association council on high blood pressure research
Hypertension 2005 45 142-61
3 da Silva IRR de Souza MDG de Camargo CAC Blood pressure measurement in
children and adolescents Guidelines of high blood pressure recommendations and
current clinical practice Arq Bras Cardiol 2007 88 434-7
4 Sinaiko AR Hypertension in children N Engl J Med 1996 3351968-73
5 US Preventive Services Task Force Screening for high blood pressure
recommendations and rationale Am J Prev Med 2003 25 159-64
6 Report of the second task force on blood pressure control in children Pediatrics 1987
79 1-25
7 National high blood pressure education programme working group on hypertension
control in children and adolescents update on the 1987 task force report on high blood
pressure in children and adolescents A working group report from the national high
blood pressure education program Pediatrics 1996 98 649-58
8 National high blood pressure education program working group on high blood
pressure in children and adolescents The fourth report on the diagnosis evaluation
and treatment of high blood pressure in children and adolescents Pediatrics 2004
114 255-76
9 Aderele WI Seriki O Hypertension in Nigerian children Arch Dis Child 1974
49313-7
10 Bo S Gambino R Gentile L Pagano G Rosato R Saracco GM Cassader M
Durazzo M Cavallo-Perin P High-normal blood pressure is associated with a cluster
of cardiovascular and metabolic risk factors a population based study J Hypertens
2009 27 102-8
72
11 Bao W Threefoot SA Srinivasan SR Berenson GS Essential hypertension
predicted by tracking of elevated blood pressure from childhood to adulthood The
Bogalusa Heart Study Am J Hypertens 1995 8 657- 65
12 Richard A Rodgers M Hedley AJ Mitchel JRA Changes in blood pressure and
blood lipid during adolescence BMJ 1980 28 1563-6
13 Sundstroumlm J Neovius M Tynelius P Rasmussen F Association of blood pressure in
late adolescence with subsequent mortality cohort study of Swedish male conscripts
BMJ 2011 342 643-8
14 Zimmet P Alberti G Kaufman F Tajima N Silink M Arslanian S Wong S Bennett
P Shaw J Caprio S On behalf of the International Diabetes Federation Task Force on
Epidemiology and Prevention of Diabetes The metabolic syndrome in children and
adolescents the IDF consensus Diabetic Voice 20075229-32
15 Abdulrahman FA Babaoye AA Childhood hypertension in northern Nigeria West
Afr J Med 1978 1 7-11
16 Adediran O Jimoh A Di M Relationship between body mass index and blood
pressure in rural Nigerian dwellers Internet J Nutri Wellness 2009 7 431-4
17 World Health Organization (WHO)UNICEF Adolescence at a glance 2003 p 2
18 The National Population Commission constitution of the Federal Republic of Nigeria
(AP 23 LFN) legal notice on publication issued April 21st 2007
19 Heald FP and Gong EJ Diet Nutrition and adolescents In Shils ME and Ross AC
(eds) Modern Nutrition in Health and Disease 9th ed William and Wilkins
Maryland USA 1999 p 32
20 Okonkon CT The prevalence of Hypertension among civil servants in Calabar Nig
Med J 1979 7422-5
21 Bugaje MA Yakubu AM Ogala WN Prevalence of adolescent hypertension in Zaria
Nig J Paediatr 2005 32 77-82
73
22 Obika LF Adedoyin MA Olowoyeye JO Pattern of paediatric blood pressure in
rural semi urban and urban communities in Ilorin Nigeria Afri J Med Sci 1995 24
371-7
23 Jeremy B A short history of blood pressure measurement section of the history of
medicine Proc Roy Soc Med 1977 70 793-9
24 Lewis O Stephen Hales and the measurement of blood pressure J Hum Hypertens
1994 8 865-71
25 Crile GW Blood Pressure in Surgery An experimental and Clinical Research
Philadelphia Lippincott 1903 p 358
26 Lewis WH The evolution of clinical sphygmomanometer Bull N Y Acad Med 1941
17 871-81
27 Browne WC OrsquoBrien ET Semple PF The sphygmomanometer of Riva Roci 1896-
1996 J Hum Hypertens 1994 610 723-4
28 Segal HN How Korotkoff the Surgeon discovered the auscultatory method of
measuring arterial pressure Ann Intern Med1975 83 561-2
29 Goodman FH and Howell AA Clinical studies in the auscultatory method of
determining blood pressure University of Pennsylvania Bulletin 1911 23 469-75
30 Crenner CW Introduction of the blood pressure cuff into US medical practice
technology and skilled practice Ann Intern Med 1998 128 488-493
31 Ganon WF Circulation In Review of Medical Physiol Lange Medical Publication
New York 22nd edition 2005 p 234-63
32 Beth C Homeostatic Regulation of Blood pressure Available from
URLhttpwwweHowcom Accessed on 1st December 2011
33 Rajinder KG Fahim M Regulation of cardiovascular functions during acute blood
loss Indian J Physiol Pharmacol 2005 49 213ndash9
74
34 Dampney AL Coleman MJ Fonts MAP Hirooka Y Horiuchi J Polson JW Potts
PD Tagawa T Central mechanisms underlying short-term and long-term regulation
of the cardiovascular system Proc Austr Physio Pharmacosociety 2001 32 333-44
35 Koshiya N Guyenet PG Noradrenergic neurons and the carotid sympathetic
chemoreflex Am J Physiol 1994 267 519-26
36 Prakash ES The ultimate goal in neural regulation of cardiovascular function Adv
Phyiol Educ 2008 32 107-8
37 Allen AM Inhibition of the hypothalamic paraventricular nucleus reduces
sympathetic nerve discharge and blood pressure Proc Austr Neuroscience Society
2001 29 44-7
38 Reid IA Interactions between ANG II sympathetic nervous system and
baroreceptor reflexes in regulation of blood pressure Am J Physiol 1992 262 763-
78
39 Brooks VL Osborn JW Hormonal-sympathetic interactions in long-term
regulation of arterial pressure A hypothesis Am J Physiol 1995 268 1343-58
40 Reckelhoff JF Gender Differences in the Regulation of Blood Pressure
Hypertension 2001 37 1199-208
41 Fink GD The systemic circulation as a regulated free-market economy A new
approach for understanding the long-term control of blood pressure Clin Exp
Pharmacol Physiol 2005 32 377ndash83
42 Benard K Sources of error in blood pressure measurement Hospital Physician 2002
12 33-7 Available from URLhttp wwwturnerwhitecom
43 Chyun DA A comparism of intra arterial and auscultatory blood pressure readings
Heart lung 1985 14 223-31
75
44 Nwankwo MU Lorenz JM Gardiner JC A Standard Protocol for Blood Pressure
Measurement in the Newborn Pediatrics 1997 99 1342-9
45 Deakin CD Low JL Accuracy of the advanced trauma life support guidelines for
predicting systolic blood pressure using carotid femoral and radial pulses
observational study BMJ 2000 321 673ndash4
46 OrsquoBrian E Replacing mercury sphygmomanometers require clinician to demand
better automated device BMJ 2000 320 815-6
47 McKay DW Raju MK Campbell NR Assessment of blood pressure measuring
techniques Med Educ 1992 26 208ndash12
48 Baker RH Ende J Confounders of auscultatory blood pressure measurement J Gen
Intern Med 1995 10 223ndash31
49 Neufeld PD Johnson DL Observer error in blood pressure measurement CMAJ
1986 135 633ndash7
50 van Montfrans GA Oscillometric blood pressure measurement progress and
problems Blood Press Monit 2001 6 287ndash90
51 Ware RW Laenger CJ Indirect blood pressure measurement by Doppler ultrasonic
kinetoartriography Proceedings 20th Annual Conference Engineering Medical
Biology 1967 9 27-30
52 Matthew Fox Blood pressure measurement technique Available from URL http
wwwlivestrongcom Last edited 2nd September 2010 Accessed on 30th November
2011
53 Akor F Okolo SN Okolo AA Blood pressure and anthropometric measurements in
healthy Primary School entrants in Jos Nigeria SAJCH 2010 4 42-5
54 Merhi BM Al-Hajj F Al-Tannir M Zaide F El-Rajab M A survey of blood pressure
in Lebanese children and adolescents North Am J Med Sci 2011 3 24-9
76
55 Al-Salloum AA El-Mouzan AH Al-Herbish AS Al-Umar AA Qurashi MM Blood
pressure standard for Saudi children and adolescents Ann Saudi Med 2009 29 173-8
56 Akinkugbe FM Akinwolere AO Kayode CM Blood Pressure Pattern in
Adolescence West Afri J Med 1999 18 196-202
57 Wanzhu T Eckert GJ Saha C and Pratt JH Synchronization of Adolescent Blood
Pressure and Pubertal Somatic Growth J Clin Endo Metab 2009 94
58 Ansa VO Anah MU Odey FA Mbu PN Agbor EI Relationship between parental
socioeconomic status and casual blood pressure in coastal Nigeria Adolescents West
Afri J Med 2010 29146-52
59 Agyemang C Redekop WK Owusu-Dabo E Bruijnzeels MA Blood pressure
patterns in rural semi-urban and urban children in the Ashanti region of Ghana West
Africa BMC Public Health 2005 5114-21
60 Ejeke CCE Ugwu CE Ezeanyika LUS Olayemi AT Blood pressure patterns in
relation to geographic area of residence a cross-sectional study of adolescents in Kogi
state Nigeria BMC Public Health 2008 8 411-5
61 Colhoun HM Hemminway H Poulter WR Socioeconomic status and blood
pressure an overview analysis J Human Hypertension 1998 12 91-110
62 Badaruddoza KR Familial aggregation and heritability for cardiovascular risk factors
a family based study in Punjab India Natural Science 2010 2 732-6
63 Livshits G Gerber LM Familial factors of blood pressure and adiposity co-variation
Hypertension 2001 37 928-35
64 Fermino RC Seabra A Garganta R Antoacutenio J Maia R Genetic factors in familial
aggregation of blood pressure of Portuguese nuclear families Arq Bras Cardiol 2009
92 463-9
77
65 Mijinyawa MS Iliyasu Z Borodo MM Prevalence of hypertension among teenage
students in Kano Nigeria Nig J Med 2008 17 173-7
66 The Wellcome Trust case control consortium Genome-wide association study of
14000 cases of seven common diseases and 3000 shared controls Nature 2007 447
661-78
67 Levy D Destefano AL Larson MG ODonnell CJ Lifton RP Gavras H Evidence for
a gene influencing blood pressure on chromosome 17 genome scan linkage results for
longitudinal blood pressure phenotypes in subjects from the Framingham heart study
Hypertension 2000 36 477- 83
68 Lifton RP Wilson FH Choate KA Geller DS Salt and blood pressure new insight
from human genetic studies Cold Spring Harb Symp Quant Biol 2002 67 445ndash50
69 van der Sande MA Milligan PJ Nyan OA Rowley JT Banya WA Ceesay SM
Dolmans WM Blood pressure patterns and cardiovascular risk factors in rural and
urban Gambian communities J Hum Hypertens 2000 14 489-96
70 Akinkugbe OO Ojo OA Arterial blood pressure in rural and urban population of
Nigeria BMJ 1969 2 22-4
71 Okagua J Anochie IC Akani NA Adolescent blood pressure in Rivers State Nigeria
A rural-urban comparism NJP 20154221-7
72 Urrutia-Rojas X Egbuchunam CU Bae S Menchaca J Bayona M Rivers PA Singh
KP High blood pressure in school children Prevalence and risk factors BMC
Pediatrics 2006 6 32-9
73 Sorof JM Lai D Turner J Poffenbarger T Potman R Overweight ethnicity and the
prevalence of hypertension in school-aged children Pediatrics 2004 113 475-82
78
74 Rosner B Prineas R Daniels SR Blood pressure differences between blacks and
whites in relation to body size among US children and adolescents Am J Epidemiol
2000 151 1007-18
75 Harding S Whitrow M Lenguerrand E Maynard M Teyhan A Cruickshank JK Der
G Ethnic differences in blood pressure in adolescence the determinants of adolescent
social well-being and health study Hypertension 2010 55 1063-9
76 Cruickshank JK Mzayek F Liu L Kieltyka L Sherwin R Webber LS Srinavasan SR
Berenson GS Origins of the ldquoblackwhiterdquo difference in blood pressure roles of birth
77 Vlajinac H Miljus D Adanja B Marinkoic J ipetic S Kocev N Blood pressure levels
in 7 to 14-year-old Belgrade children J Human Hypertension 2003 17 761ndash5
78 Menezes AMB Hallal PC Dumith SC Adolescent blood pressure body mass index
and skin folds sorting out the effects of early weight and length gains J Epid Comm
Health 2011 12 42-8
79 Karelis AD St-Pierre DH Conus F Rabasa-Lhoret R Poehlman EJ Metabolic and
body composition factors in subgroups of obesity what do we know J Clin Endo
Metab 2004 89 2569-75
80 Katzmarzyk PT Srinivasan ER Chen W Malina RM Bouchard C Berenson GS
Body mass index waist circumference and clustering of cardiovascular disease risk
factors in a biracial sample of children and adolescents Pediatrics 2004 114 198-205
81 Guagnano MT Ballone E Colagrande V Della Vecchia R Manigrasso MR Merlitti
D Riccioni G Sensi S Large waist circumference and risk of hypertension Int J
Obesity 2001 25 1360 ndash 4
82 Araujo TA Lopes MVO Moriera RP Cavalcante TF Gurdes NG MartinS dA Silva
V Blood pressure of children and teenagers from a public school in Fortaleza - Cearaacute
Acta paul enferm 200720103-15
79
83 Sebanjo IO Oshikoya KA Obesity and blood pressure levels of adolescents in
Abeokuta Nigeria Cardiovasc J Afr 2011 221-5
84 Messerli FN Obesity and essential hypertension Haemodynamics sodium excretion
and plasma rennin activity Arch Int Med 1981 141 81-5
85 Appel LJ Brands MW Daniels SR Karanja N Elmer PJ Sacks FM Dietary
Approaches to Prevent and Treat Hypertension A Scientific Statement from the
American Heart Association Hypertension 2006 47 296-308
86 Sacks FM Svetkey LP Vollmer WM Appel LJ Bray GA Harsha D Obarzanek E
Conlin PR Miller ER 3rd Simons-Morton DG Karanja N Lin PH for the DASH-
Sodium Collaborative Research Group Effects on blood pressure of reduced dietary
sodium and the Dietary Approaches to Stop Hypertension (DASH) diet DASH-
Sodium Collaborative Research Group N Engl J Med 2001 344 3ndash10
87 Appel LJ Moore TJ Obarzanek E Vollmer WM Svetkey LP Sacks FM Bray GA
Vogt TM Cutler JA Windhauser MM Lin PH Karanja N A clinical trial of the
effects of dietary patterns on blood pressure DASH Collaborative Research Group N
Engl J Med 1997 3361117ndash24
88 Appel LJ Sacks FM Carey VJ Obarzanek E Swain JF Miller ER 3rd Conlin PR
Erlinger TP Rosner BA Laranjo NM Charleston J McCarron P Bishop LM for the
OmniHeart Collaborative Research Group Effects of protein monounsaturated fat and
carbohydrate intake on blood pressure and serum lipids results of the OmniHeart
randomized trial JAMA 2005 294 2455ndash64
89 Karanja NM Obarzanek E Lin PH McCullough ML Phillips KM Swain JF
Champagne CM Hoben KP Descriptive characteristics of the dietary patterns used in
the Dietary Approaches to Stop Hypertension Trial DASH Collaborative Research
Group J Am Diet Assoc 1999 99 19ndash27
80
90 Nwokocha ARC Adolescence and associated problems In Azubuike JC and
Nkanginieme KEO (eds) Paediatrics and Child Health in a Tropical Region African
Educational Services Owerri Nigeria 2nd edition 2007 p 84-99
91 Rogol RT Roemmich JN Clark PA Growth and puberty J Adol Hlth 2002 31 192-
200
92 Tanner JM Marshal WA Variation in the pattern of puberty changes in boys and girls
Arch Dis Child 1970 45 13-23
93 Nwakoro SO Ifoda K Onochie O Olomu JM Anthropometric assessment of
nutritional status and growth of 10-20 years individuals in Benin City metropolis
Nigeria Pakistan J Nutr 2006 5 117-21
94 Shankar RR Eckert GJ Saha C Tu W Pratt JH The change in blood pressure during
pubertal growth J Clin Endo Metab 2005 90 163-7
95 Department of Health and Human Services 2000 CDC Growth Charts for the United
States methods and development Series Report 11 No 246 Available from URL
httpwwwcdcgovGrowthCharts
96 Redwine KM Daniels SR Prehypertension in Adolescents Risk and Progression
Journ Clin Hypertension 2012 14 360ndash4
97 Falkner B Gidding SS Portman R Rosner B Blood pressure variability and
classification of prehypertension and hypertension in adolescence Pediatrics 2008
122238ndash42
98 Redwine KM Acosta AA Poffenbarger T Development of hypertension in
adolescents with pre-hypertension J Pediatr 2012 16098ndash103
99 Ejike ECCC Ugwu CE and Ezeanyika LUS Variations in the prevalence of point
prehypertension in a Nigerian school-going adolescent population living in a semi-
urban and an urban area BMC Pediatr 2010 1013
81
100 Ujunwa FA Ikefuna AN Nwokocha AR Chinawa JM Hypertension and
prehypertension among adolescents in secondary schools in Enugu South East Nigeria
Italian J Pediatr 20133970-5
101 Chobanian AV Bakris GL Black HR Seventh report of the Joint National
Committee on Prevention Detection Evaluation and Treatment of High Blood
Pressure Hypertension2003 421206ndash52
102 Lande MB Systemic Hypertension In Kliegman RM Behrman RE Jenson HG and
Stanton BF (eds) Nelson Textbook of Pediatrics Saunders Elsevier Philadelphia 19th
Edition 2011 pg 1592-8
103 Luma GB Spiotta RT Hypertension in Children and Adolescent Am Fam Physician
2006 73 1558-68
104 Arvind B Rupesh J Vijayakumar M Madhuri K Ali U Evaluation and management
of hypertension Indian Paediatr 2007 44 103-21
105 Flynn JT Neonatal hypertension Diagnosis and management Pediatr Nephrol 2000
14 332-41
106 Steyn K de Wet T Richter L Cameron N Levitt NS Morrel C Cardiovascular
diseases risk factors in 5-year old urban South African children- The Birth to Ten
Study SAMJ 2000 90 7126
107 Antia-Obong OE Antia-obong LE Arterial blood pressure of Nigerian Urban and
Rural school children Nig J Paediatr 1991 18 3-11
108 Nguyen NT Magno CP Lane KT Hinojosa MW Lane JS Association of
hypertension diabetes dyslipidemia and metabolic syndrome with obesity findings
from the National Health and Nutrition Examination Survey 1999 to 2004 J Am Coll
Surg 2008 207 928-34
82
109 Solar MB Gill A Rey J Epidemiology of arterial blood pressure in school children
population Aten Primaria 1992 9 212-4
110 Steyn K de Wet T Richter L Cameron N Levitt NS Morrel C Cardiovascular
diseases risk factors in 5-year old urban South African children- The Birth to Ten
Study SAMJ 2000 90 7126
111 Linkas J The assessment and management of hypertensive emergencies and
urgencies in children Pediatr Emerg Care 2005 21391-6
112 Croix B Feig DI Childhood hypertension is not a silent disease Pediatr Nephrol
2006 21527-32
113 Flynn JT Anderson MH Characteristics of children with primary hypertension seen
at a referral centre Pediatr Nephrol 2007 44 103-21
114 Nakao M Yano E Nomura S Kuboki T Blood pressure lowering effects of
biofeedback treatment in hypertension a meta-analysis of randomized controlled trials
Hypertension 2003 26 37- 46
115 Jalingo Available from URLhttpwwwencyclopedia Britanica Accessed on 3rd
December 2011
116 Araoye MO Research Methodology with Statistics for Health and Social Sciences
Nathadex Publishers Saw-Mill Ilorin Nigeria 2004 pg 115-21
117 Olusanya O Okpere E Ezimokhai M The importance of social class in voluntary
fertility control in a developing country West Afr J Med 1985 4 205-12
118 World Health Organization expert committee Physical status the use and
interpretation of anthropometry WHO technical report series No 894 Geneva WHO
1995 p 424ndash38
119 Guidelines subcommittee WHOISH guideline for management of hypertension J
Hypertens 1999 17 151-83
83
120 Aubay B How to measure waist circumference Available from
URLhttpwwwehowcom Last updated August 10th 2011 and accessed on December
9th 2011
APPENDICES
Appendix 1
PROFORMA ON BLOOD PRESSURE PATTERN IN APPARENTLY HEALTHY
SECONDARY SCHOOL ADOLESCENTS IN JALINGO
PUBLIC SCHOOL [ ]
Serial No
84
PRIVATE SCHOOL [ ]
A BIODATA
1 Age (years) 10[ ] 11[ ] 12[ ] 13[ ] 14[ ] 15[ ] 16[ ] 17[ ] 18[ ] 19[ ]
2 Gender M [ ] F [ ]
3 Class JSS 1-3 [ ] SS1-3 [ ]
B MEDICAL AND SOCIAL HISTORY Yes [1] No [2]
1 Have you ever passed blood in your urine [ ]
2 Have you ever had your face or legs swollen [ ]
3 Are you on any drug for long time (such as pills steroids marijuana codeine
NSAIDs containing drugs tramal and others) [ ]
If yes specifyhelliphelliphellip
C SOCIO-ECONOMIC CLASSIFICATION
Fatherrsquos occupation
Score 1 Professionals top civil servants politicians and top businessmen
2Middle-level civil servants technicians skilled-artisans and well-to-do
traders
3 Unskilled workers and those in general whose income would be at or below
the national minimum wage
Mothers educational level
Score 0 Education up to University level
1 Secondary or tertiary level below the University
2 No formal education or up to primary level only
D ANTHROPOMETRY
i Weight (Kg) ndash 1helliphellip 2helliphelliphellip Averagehelliphelliphelliphellip
ii Height (m) ndash 1helliphellip 2helliphellip Averagehelliphelliphelliphellip
85
iii Body mass index = weightheight (kgm2)
v Waist circumference (cm) ndash 1helliphellip 2helliphelliphellip Averagehelliphelliphelliphellip
iv Blood Pressure (mmHg) - 1helliphellip 2hellip 3helliphellip Averagehelliphelliphelliphellip
Appendix 2
AUTHORIZATION AND CONSENT TO PARTICIPATE IN A RESEARCH
I Dr Peter Teru Yaru of the Department of Paediatrics Ahmadu Bello University
Teaching Hospital (ABUTH) Zaria Irsquom conducting a research on the blood pressure
pattern among secondary school adolescents in Jalingo
The aim of the study is to know the level of blood pressure among their age
groups Those with high blood pressure (or hypertension) will be identified appropriately
advised and referred for further care The study will involve taking their weight height
blood pressure and waist circumference Female assistants shall be responsible for
86
measuring waist circumference of female students Students will also be given a
questionnaire on some of their activities drug use among others all aimed at looking for
factors which can affect their blood pressure Information obtained shall be treated with
utmost confidentiality and for this research work only Please note that participation is
voluntary I will be glad if you give consent for your childward to participate in the
study
Statement by parents Irsquove read and understood this consent form and agreed for my
child to be included in the study
Parents name Researcherrsquos name and sign
Parents phone no if any Date
Parents signthumb print Phone no
87
Appendix 3
SOCIO-ECONOMIC SCORE
The classification of socio-economic scores based on fatherrsquos occupation and motherrsquos
education by Olusanya et al117
A Husband (fatherrsquos occupation)
Score 1 Professionals top civil servants politicians and businessmen
2 Middle-level bureaucrats technicians skilled-artisans and well-to-do traders
3 Unskilled workers and those in general whose income would be at or below
the national minimum wage
B Mothers educational level
Score 0 Education up to University level
1 Secondary or tertiary level below the University
2 No formal education or up to primary level only
The socio-economic class of the childrsquos mother is obtained by adding the scores from A
and B above and graded I-V as appropriate for example
Score (1) from A plus score (0) from B = social class I
Score (2) from A plus score (0) from B = social class II
Score (2) from A plus score (1) from B = social class III
Score (2) from A plus score (2) from B = social class IV
Score (3) from A plus score (0) from B = social class III
Score (3) from A plus score (1) from B = social class IV
Score (3) from A plus score (2) from B= social class V
Page 16
16
pressure is regulated by different mechanisms acting either rapidly or slowly to maintain it
within normal range for optimal cellular performance3132
Intrinsic Regulation
Intrinsic factors regulating BP include stroke volume and heart rate which both influence
cardiac output31 Stroke volume depends on the volume of blood that fills the ventricles and
this depends on the preload and afterload33 A higher afterload will decrease stroke volume
causing low cardiac output and low BP and vice versa When cardiac output increases more
volume is derived from the venous pool increasing preload Similarly an increased heart rate
will lead to increased cardiac output and BP3134
Reflex Regulation
The baroreceptors within the aortic arch and carotid sinuses contain sympathetic and
parasympathetic nerve fibres3435 These are sensory nerves which run from the medulla
and they respond to stretch of the tissue in which they lie by increasing or decreasing the
rate of signaling36 and act fast in regulating BP34 Sympathetic stimulation causes
increased heart rate and widespread vasoconstriction to increase BP while
parasympathetic stimulation produces the opposite3537
Hormonal Regulation
Hormones regulating blood pressure include renin-angiotensin-aldosterone and
antidiuretic hormone (ADH) They act slowly by responding to changes in intravascular
volume and osmolality38 Angiotensin II is a potent vasoconstrictor and stimulates the
release of aldosterone from the adrenal gland39 Aldosterone increases sodium absorption
and fluid retention leading to increased BP ADH is a potent vasoconstrictor and plasma
volume regulator and its stimulation results in fluid retention and vasoconstriction39
Other hormones regulating BP include the sex hormones thyroid parathyroid cortisol
and ACTH They act on the rennin-angiotensin-aldosterone system to regulate BP3940
17
Renal Regulation
The kidneys control blood pressure through the retention and excretion of extracellular
fluid35 An increase in renal fluid retention will increase extracellular volume and higher
blood pressure whereas increased renal excretion leads to lower blood pressure41 This is
achieved through the action of ADH aldosterone and atrial natriuretic peptide (ANP)41
METHODS OF MEASURING BLOOD PRESSURE
Blood pressure can be measured by invasive and non-invasive methods
1) Invasive (or direct) method - Blood pressure is most accurately measured invasively
through an arterial line4243 It is the gold standard by which the accuracy of other blood
pressure measuring devices and methods are assessed4344 Chyun43 compared direct and
indirect blood pressure readings in 14 intensive care unit patients and found that the
auscultatory method overestimates the systolic and diastolic BP especially if the VI Kortkoff
sounds is used as an indicator of diastolic BP This can often over estimate reading by as
much as 20 mm Hg43 This study is made up of very small sample size to make general
conclusion on the differences in BP values from the two methods compared Although the
invasive method is the gold standard for true BP measurement it is associated with serious
complications related to arterial catheterization and the procedure itself may be technically
difficult It is mainly used in experimental procedures and in monitoring critically ill patients
in intensive care units42
2) Non invasive (indirect) methods These are simpler and quicker than the invasive
method and are commonly used for routine blood pressure examinations They may
however yield lower accuracy and small systematic differences in numerical results43
These methods include-
18
a) Palpation method - A minimum systolic value can be estimated by palpation Deakin
and Low45 reported that a palpable radial femoral or carotid pulse indicates a minimum
systolic BP of 80 70 and 60 mmHg respectively The study was carried out among adults
and these values could not be applicable in children and neonate whose maximum
systolic BP may be lower than the reported minimum values A more accurate systolic BP
value can be determined by inflating and then deflating sphygmomanometer cuff while
palpating the pulse The systolic BP corresponds to the pressure at which the radial pulse
becomes palpable45 Its disadvantages are that pressure obtained is usually 2-5mmHg less
than those obtained by auscultation and diastolic BP cannot be measured32
b) Auscultation method- Also called the Korotkoff method is the method of choice in
clinical practice142 It involves using a stethoscope and a sphygmomanometer46 The
mercury sphygmomanometer is the gold standard for BP measurement A Riva-Rocci
cuff 27 is placed over the arm and inflated to occlude the brachial artery It is then
gradually deflated until blood flow is re-established accompanied by a tapping sound
which can be detected by the stethoscope held over the artery Five sounds are
traditionally heard and classified into phases30 The first phase corresponds to the systolic
BP while the last or fifth phase corresponds to the diastolic BP30 The fourth phase
alternatively is used to measure the diastolic pressure if a 10 mmHg or greater
differences exist between the initiation of phases fourth and five or if the fifth sound is
heard down to 0 mmHg8 This may occur in cases of high cardiac output or peripheral
vasodilatation children or in pregnancy This method though the method of choice in
clinical practice may however be associated with errors arising from faulty technique and
equipment4748 as well as observer bias49 This method was used for this study because of
its widespread general usage its reliability and accuracy Unlike other methods the
instruments (mercury sphygmomanometer and stethoscope) do not require any
19
calibration and values obtained do not require validation by other methods The standard
World Health OrganizationCenter for Disease Control (WHOCDC) blood pressure
reference percentile tables were generated using the mercury sphygmomanometer hence
the auscultation method is the gold standard for BP evaluation258
The aneroid sphygmomanometer measures BP by mechanical system of metal
bellows that expand as the cuff pressure increases in a series of levers that register the
pressure on a circular scale The hybrid shygmomanometer combines some of the features
of the two and uses an electric transducer to record blood pressure2
c) Oscillometric technique- This uses the oscillometric device Oscillation of pressure in a
sphygmomanometer cuff is recorded during gradual deflation The point of maximum
oscillation corresponds to the mean arterial pressure50 The oscillation begins well above
systolic BP and continues below diastolic BP so that systolic and diastolic BP can only
be estimated indirectly according to some empirically derived algorithm
d) Ultrasound method - This uses an ultrasound transmitter and receiver placed over the
brachial artery under a sphygmomanometer cuff As the cuff is deflated the movement of
the arterial wall and systolic BP cause a Doppler phase shift in the reflected ultrasound
The diastolic BP is recorded as the point of diminished arterial motion51 Its advantage
includes the ability to detect diastolic BP in atrial fibrillation and hypotension where
Korotkoff sound is faint152
FACTORS AFFECTING BLOOD PRESSURE IN ADOLESCENTS
Several inter-related factors affect blood pressure These include-
Age - A progressive BP elevation with age has been observed in several studies2153-55
The rate of rise varies in boys and girls5455 The average systolic increase ranges between
20
166 and 286 mmHgyr for boys and 144 and 263mmHgyr for girls while that of
diastolic BP ranges from 083 and 177mmHgyr for boys and 077 and 148mmHg for
girls2155 Bugaje Yakubu and Ogala21 studied blood pressure pattern among 2035
adolescents in Zaria and found a consistent rise of BP with age The rate of rise was fairly
constant until 11-13 years in boys and 12-14 years in girls when the rise became rapid A
similar study53 also found a BP rise with age among 650 healthy school children in Jos In
a large population studies in Lebanon56 and Saudi Arabia55 BP was similarly reported to
increase consistently with age Rapid growth and biological maturation of organs which
are normal occurrences during adolescence were thought to be responsible rather than the
chronological age56 The results of these studies showed increasing blood pressure with
age despite the fact that one study55 used oscillometric method for their study while the
standard auscultation was used in the other studies Also the studied sample sizes across
these studies varied greatly with sizes of 65053 203521 571054 and 1622655 Despite this
the findings were similar
Gender ndash Results of studies on the effect of gender on BP showed that sex positively
affects blood pressure2153-55 Merhi Al-Hajj and Al-Tannir et al54 studied BP pattern in
5710 Lebanese school children while Al-Salloum El-Mouzan and Al-Herbish et al55
studied BP pattern in 16226 Saudi children and adolescents The authors reported a
higher BP in girls than boys at all ages A study21 of BP pattern in adolescents in Zaria
Nigeria demonstrated an initial higher BP in boys before puberty which reversed with the
onset of puberty up to the age of 14-15yrs when it reversed again to be higher in boys
Akinkugbe Akinwolere and Kayode56 reported no sex differences in adolescent BP in
Ibadan The reported sex difference is said to be likely due to differences in sex hormone
and pattern of growth in boys and girls57 Differences in age range of the study population
may however be responsible for the observed BP variation For instance these studies5455
21
comprised of both adolescents and pre-adolescent age groups combined in one study
while the other two studies2156 were purely adolescents21 Blood pressure is reported to be
equal in both sexes before adolescence after which the gender difference starts to
manifest most likely due to physical and hormonal changes
Socioeconomic Factors - Belonging to either end of the socioeconomic strata is found to
be associated with elevated blood pressure5859 A study in Ibadan56 reported an inverse
relationship between parental socioeconomic status and level of BP in adolescents The
authors suggested that this might be the result of the health behaviours and problems
characteristic of the lower socioeconomic class On the other hand Ejeke Ugwu and
Ezeanyika et al60 in Lokoja and another study53 in Jos both found higher BP in children
from high socioeconomic class Colhoun Hemminway and Poulter61 in a meta-analysis of
BP and socioeconomic status in developed and developing countries found an inverse
relationship of BP with socioeconomic status in developed nations and a direct correlation
in developing countries These different findings may be due to methodological
differences in socio-demographic stratification For instance Akinkugbe and
colleagues59 used fatherrsquos level of education for social classification Parentrsquos educational
level may however not equate well with level of family income The other study60 used an
automated device for their study whose values may require validation using the
recommended auscultation method Difference in environmental stresses may also be
different considering the level of development of the areas where the studies were carried
out
GeneticFamilial Factors - The effect of geneticfamilial factors on BP has been
demonstrated in some studies62-64 Familialgenetic correlations reflected in BP and other
anthropometry generally are higher among genetically close relatives such as brother-
sisters or parent-offspring than among spouses62 Levshit and Gerber63 surveyed 514
22
individuals from 135 nuclear families in Russia while Budaruddoza62 studied 1400
individuals from 380 families in India and found significant genetic influence on BP
Mijinyawa Iliyasu and Borodo65 also reported family history of hypertension as risk
factor for developing high BP in a study on prevalence of hypertension among 1000
teenagers in Kano The authors concluded that this could be due to genetic predisposition
They however did not evaluate further to determine the genetic defects The authors did
not also consider shared environmental factors known to influence blood pressure in
individuals Molecular genetic studies have identified genes as possible regulators of
BP6667 These genes regulate the renin-angiotensin-aldosterone system involved in renal
salt handling69 Mutations that increase sodium reabsorption and salt sensitivity is
associated with higher BP and vice versa68 while shared environmental risk factors may
potentiate the development of such familial conditions which might have been
responsible for outcome of the above studies6364
Environmental Factors ndash Environmental factors greatly influence BP variation in a
population592269 Akinkugbe and Ojo70 reported a consistently higher BP in Nigerian
adolescents than their counterparts of similar ages in black and white American children
The authors are of the view that this could be due to different environmental factors of the
study population Obika Adedoyin and Olowoyeye22 studied BP pattern in 2526
children aged 1-14 years in rural semi-urban and urban communities in Ilorin Nigeria
and demonstrated a hypertension prevalence of 95 in urban compared to 63 in rural
communities This was similar to the study59 in Ghana and Gambia69 The authors592269
argued that the differences were due to socioeconomic status which is higher in the urban
than the rural areas The BP variation could be accounted for by the nature of dietary
intake since the rural communities generally consume more of natural foods with less salt
and lsquojunk foodsrsquo compared to the urban populace This was demonstrated by one study61
23
which reported higher mean BP among urban communities in developing nations due to
changes in their dietary pattern Rural areas are also less exposed to the stress and hassle
of the urban cities It is of interest to note however that urban areas are a mixture of
social classes as a result of migrant workers seeking lsquogreener pasturesrsquo Okagua Anochie
and Akani71 on the other hand reported higher mean BP among rural adolescents than
their urban counter parts in Port Harcourt The authors could not identify the reason(s) for
their finding but concluded that the seemingly protective privilege of rural life may be
fading gradually The differences in the reports could however result from the sample size
composition comprising of preadolescents22 adolescents71 and adults69
Race - Higher BP levels have been reported in African-American and Hispanic school-
age children than their Caucasian counterparts and among African-Americans than the
Hispanics7273 Akinkugbe and Ojo70 demonstrated a consistently high systolic and
diastolic BP in Nigerian children compared with black and white American children of
similar age Exposure to chronic environmental stress low socioeconomic status and high
obesity rate among African American and Hispanic youths could contribute to higher
BP72-74 It can be inferred from the study that race alone may not be responsible for the
observed differences but shared environmental factors and socioeconomic status may be
contributory77 Other studies7475 however found no significant BP differences in relation
to race
Anthropometry and blood pressure (BP) - A positive correlation has been observed
between BP and anthropometry in various studies58-5977 These studies585678 observed a
significant correlation between systolic BP and weight height and body mass index
(BMI) in boys but only with weight in girls Body mass index (BMI) is used as a
measure of overall obesity but it is known to be a poor indicator of actual body fat79
Waist circumference (WC) is an aggregate measurement of the actual amount of total and
24
abdominal fat accumulation80 It is therefore a better predictor of BP and other
cardiovascular diseases8081 Guagnano Ballone and Colagrande et al81 studied the
relationship between BP and BMI WC and waist hip ratio (WHR) in 461 people and
found WC to be the most consistent anthropometry affecting BP It is of interest to note
that the study by Guagnano et al81 was in adults population while the other studies56-59
were in children and adolescents WC was also found to be a better predictor of BP in an
Italian study8081 while it was not in others56-6982 Comparing BMI and waist
circumference and their effects on BP Arauzo Lopes and Moriera et al83 in Brazilian
children found BMI to be a better predictor of BP than waist circumference This was
similar to the study by Sebanjo and Oshikoya82 in Nigerian adolescents in Akure Thus
waist circumference measurements may not be useful in the evaluation of obesity andor
hypertension in children and adolescents This may partly be explained by the uniform fat
distribution due to hormonal effect at puberty in adolescents compared to the
disproportionate fat distribution in adults Possible mechanisms for the positive
relationship between BP and high BMI includes decreased physical activity increased
salt intake impaired pulmonary functions and development of metabolic abnormalities
such as dyslipidaemia and insulin resistance8084
Nutritional factors - Diet has been a primary link between humans and their environment
and substantial evidence supports the concept that multiple dietary factors affect BP85
Well-established dietary modifications that lower BP are reduced salt intake increased
potassium intake increased protein particularly plant protein high vegetable and
polyunsaturated fats85 High sodium intake on the other hand is said to be associated with
elevated blood pressure86 A series of 3 large controlled feeding studies tested the effects
of dietary patterns on BP86-89 Of the 3 diets studied the dietary approach to stop
hypertension (DASH) emphasized fruits vegetables low-fat dairy products whole
25
grains poultry fish nuts potassium magnesium calcium and fibre as the most effective
diet89 Among all participants the DASH diet significantly lowered mean systolic BP by
55 mm Hg and mean diastolic BP by 30 mm Hg each net of changes in the control diet
DEFINITION AND CLASSIFICATION OF ADOLESCENCE
Adolescence is the transitional stage between childhood and adulthood during which many
life patterns are learnt and established90 According to World Health Organization (WHO)
adolescents are individuals between the age range of 10-19 years17 The most significant
feature of adolescence is puberty characterized by an exceptionally rapid rate of biological
growth and development including physical and sexual maturation9091 The pubertal changes
have been described by Tanner and Marshal92 and are grouped into five stages This utilizes
definite criteria for growth and development of secondary sexual characteristics like pubic
hair and breast in females and pubic hair and genitalia in males9092 The timing of these
events and the rate of growth vary due to genetic and environmental factors in different
populations92 Adolescence is divided into early middle and late periods17
Early adolescence (10-13 years) ndash This is a period of rapid growth and development of
secondary sexual characteristics and varies according to sex It corresponds to Tanner stages
1 and 290 The main features of this stage are breast bud development and menarche in girls
while testicular enlargement and seminal emission occurs in boys93
Middle adolescence (14-16 years) ndash In this stage rapid growth decreases and there is more
cognitive development as the adolescents move from concrete thinking to formal operation
and develop greater competence at abstract thinking91 This corresponds to Tanner stages 3
and 4
Late adolescence (17-19 years) ndash Here slowing of physical changes continue which permits
the emergence of a more stable body image Cognition tends to be less self-centered with
26
demonstration of care for others with increasing thought about concepts such as justice
patriotism and history It corresponds to Tanner stage 59092
ADOLESCENCE AND BLOOD PRESSURE
Adolescence is characteristically associated with increasing blood pressure because of the
physical growth and hormonal changes associated with puberty5794 After the age of one year
normal BP increases more during puberty than probably at any other time in an individualrsquos
lifetime95 Wanzhu Eckert and Saha et al57 examined data from a cohort of 182 normotensive
children in Indiana who had blood pressure measurements taken semi-annually for up to 12
yr The authors found that the rate of change in BP and weight peaked at the age of maximum
pubertal growth spurt (PGS) This BP spurt roughly coincides with growth spurt during
puberty94 Surveys of BP patterns from childhood through adolescence shows systolic and
diastolic pressures increase with age and in adolescents the increase in males is more marked
than in females especially the systolic pressure5458229495
CLASSIFICATION OF BLOOD PRESSURE IN ADOLESCENTS
The National High Blood Pressure Education Program Working Group (NHBPEPWG) of the
United States established guidelines for the definition of normal and elevated blood pressures
in children in 19876 These guidelines were revised in 20048 The definition of childhood
hypertension in the guidelines are based upon the normative distribution of blood pressure
(BP) in healthy children rather than clinical outcome data as in adults The guidelines
classified BP as normal prehypertensive or hypertensive Hypertension is graded into stage
one and two8
Normal BP - Blood pressure lt90th percentile for age sex and height Children and
adolescents with normal BP should be followed annually from the age of 3 years5 They
27
should be encouraged to maintain a healthy life style such as good dietary intake physical
activities and adequate rest8
Pre-hypertension - Blood pressure between the 90th and lt 95th or if BP exceeds
12080mmHg (even if lt90th percentile) but lt95th It was previously called high normal
BP This new description was introduced to help identify children at risk for the
development of persistent hypertension for whom targeted prevention programmes would
be most beneficial96 While recommendations for the diagnosis of hypertension in
children require that BP remains elevated on three separate occasions repeated
measurements are not necessary to classify an adolescent as pre-hypertensive11 The
prevalence of childhoodadolescence pre-hypertension in US is reported to be between
12-1796-98 In Nigeria Ejeke Ugwu and Ezeanyika99 in a study of the prevalence of
point prehypertension and hypertension in 843 adolescents in Lokoja reported a
prevalence of point prehypertension of 222 and 250 in semi urban and urban
communities respectively Ujunwa Ikefuna and Nwokocha et al100 reported 175
prehypertension prevalence among adolescents in Enugu Among adults with pre-
hypertension it is reported that as much as 10 per year develop hypertension101 There
is little information on the time course for children and adolescents with prehypertension
developing hypertension A value of between 11-7 per year has been reported in US
adolescents98 There is no known study on rate of progression of prehypertension to
hypertension in Nigerian adolescents The NHBPEP recommended that children with
pre-hypertension should have their BP checked after every six (6) months to monitor for
progression to hypertension They should be encouraged to engage in physical activity
healthy dietary behaviours and weight management if overweight Pharmacologic therapy
is not indicated except if there is strong evidence of renal disease heart failure left
ventricular hypertrophy or diabetes mellitus8
28
Hypertension Hypertension is BP persistently equal to or above the 95th percentile for
age sex and height measured on three or more separate occasions If the blood pressure
measurement obtained is gt 95th percentile the degree of hypertension should be staged
Stage 1 hypertension- BP value between the 95th and the 99th percentile plus 5mmHg It
is recommended that BP should be rechecked in 1ndash2 wks or sooner if the patient is
symptomatic If persistently elevated on 2 additional occasions it should be evaluated or
referred to source of care for pharmacologic treatment within 1 month 8
Stage 2 hypertension- BP value gt99th percentile plus 5mmHg This stage calls for more
prompt evaluation and commencement of pharmacologic therapy102 It is recommended
that the individual be evaluated or referred to source of care within 1wk or immediately if
the patient is symptomatic8
Aetiology of hypertension
Hypertension is classified as primary (essential) when there is no identifiable cause
or secondary if due to an underlying disease31 Factors such as heredity diet stress drugs and
obesity play a role in the development of essential hypertension103104 Causes of secondary
hypertension include umbilical artery catheterization renal diseases coarctation of the aorta
and endocrine disorders105106 Aderele and Sereki6 in their study of hypertension in children
reported hypertension secondary to renal pathology as the commonest cause of elevated BP
in children This study was mainly in preadolescent population in which secondary
hypertension is a common finding On the other hand Antia-Obong and Antia-Obong107
reported no apparent cause in greater than 90 of the studied subjects with elevated BP and
also reported proteinuria of 1 in the same population without any associated elevated blood
pressure The study did not however evaluate the etiology of the proteinuria A study65 of BP
in teenagers in Kano found family history of hypertension a risk factor in the study
population Another study in Enugu100 examined modifiable risk factors associated with
29
hypertension in 2694 adolescents and found only 1 and 06 of the hypertensive subjects
to be overweight and obese respectively The authors also found that smoking and alcohol
consumption were not significant risk for hypertension This may however be due to the
shorter period of consumption of these products by the students as a cumulative effect from
long term consumption is known to be associated with adverse health outcomes
Prevalence of hypertension in adolescents
The prevalence of hypertension in adolescents varies widely due to arbitrary and imprecise
definition by different researchers It was in view of this that the National High Blood
Pressure Education Program Working Group (NHBPEPWG) of the United States established
guidelines for the definition of normal and elevated blood pressures in children and
adolescents for uniformity68 In the USA the prevalence is about 20 in normal weight and
50 in their obese counterparts108 A prevalence rate of 77109 10554 and 223110 has
been reported in Spain Lebanon and South Africa respectively In Kano Nigeria a study65
on the prevalence of hypertension among 1000 teenagers found a prevalence of 72 Similar
study in Enugu100 on the prevalence of hypertension among 2694 secondary school
adolescents reported a hypertension prevalence of 54 It is of interest to note that different
prevalence was reported because of the different methodology used by the authors While the
study in Kano65 applied the adult blood pressure criterion of BP greater than 14090mmHg as
hypertension the study in Enugu100 used blood pressure greater than 95th percentile for age
and sex Also the study in Kano65 took a single set of measurement while the study100 in
Enugu measured blood pressure of the subject three times at weekly intervals Bugaje
Yakubu and Ogala21 on the other hand defined hypertension as blood pressure greater than
two standard deviations from the mean and also took six readings over thirty minutes and got
a prevalence of hypertension of 34 A prevalence rate of 48107 and 9522 in Southern
and Western region of the Nigeria respectively was also reported It is obvious that because
30
of the various defining criteria for hypertension in adolescents the prevalence of adolescent
hypertension remains imprecise
Clinical presentation- Hypertension is usually asymptomatic unless it has been
sustained or is rising rapidly109 Adolescents with essential hypertension are usually
detected during routine evaluation96 Non-specific symptoms such as lethargy headache
dizziness drowsiness visual disturbance and confusion may be present109 These could
also be signs of complications111 Secondary hypertension may show obvious features of
the underlying disease such as growth failure heat intolerance abdominal stria tremors
body swelling and haematuria8102 Croix and Feig112 studied the spectrum of symptoms in
409 children aged 7-18 years newly diagnosed hypertensive in Texas USA and reported
15 common symptoms than in the controls The symptoms were said to resolve after
commencement of antihypertensive medications The authors concluded that hypertensive
children had a variety of non-specific symptoms The three most common symptoms
reported were headache daytime tiredness and difficulty initiating sleep The study
however did not specify if other possible causes of these symptoms were excluded
Complications of hypertension - Hypertension is usually asymptomatic in adolescents
which if left unidentified overtime can cause serious complications109 Organs commonly
affected in the complication of hypertension are the heart kidneys brain and the eyes
leading to lowered life expectancy and premature death13 Left ventricular hypertrophy
(LVH) is the most prominent clinical evidence of end organ damage10 Studies have
shown that LVH can be seen in as many as 41 of patients even in adolescents with
asymptomatic hypertension10103 Adolescents with severe cases of hypertension are also
at increased risk of developing hypertensive encephalopathy seizures cerebrovascular
accidents and congestive heart failure103109 However data documenting such
complications in children and adolescents are generally lacking In a study of
31
hypertension among teenagers in Kano the researchers65 could not find any
complications in all the 1000 teenagers studied
Investigations and treatment- Basic investigations are all that may be required in
adolescents who are obese and with a family history of hypertension stage 1 disease and
normal findings on physical examination113 This is because primary hypertension is
commoner in adolescents Adolescents that are symptomatic or with stage 2 hypertension or
have features of secondary hypertension should be evaluated in more detail
Treatment of hypertension includes non-pharmacological and pharmacological
methods Non-pharmacologic management involves life style modification such as weight
reduction increased physical activities and dietary adjustment114 In a study to evaluate the
effect of diet and salt on treatment and prevention of hypertension Sacks Svetkey and
Vollmer et al86 reported the beneficial effect of both reduced salt intake and appropriate
dietary adjustment in the control of hypertension Similar benefits were reported in other
studies8788 Although both studies had fairly good sample size (n=412) the studies did not
specify if participants were on other substances or activities other than antihypertensive that
might have affected their BP The studies were also in adults and whether it has the same
effects in children and adolescents has not been evaluation However there is no doubt that
the outcome will be similar in adolescents as dietary modifications have been advocated as
non-pharmacologic management in them Non pharmacologic treatment is usually the initial
treatment in essential hypertension and as adjuvant to drug therapy in those with secondary or
complicated hypertension101114 Pharmacologic (drug) treatment includes diuretics beta-
blockers calcium channel blockers angiotensin converting enzyme inhibitors (ACEIs) and
angiotensin receptor blockers (ARB) among others106114 They are used in those with
symptomatic disease and in acute or chronic complications106
32
Prevention of hypertension may be viewed as part of the prevention of cardiovascular
disease102 In adolescents approaches to prevention include reduction in obesity
discouraging cigarette smoking and alcohol intake113 reduction in sodium intake and increase
in physical activity through community and school-based programmes103104 Growth
monitoring BP check during preventive care visit physical activity and urine screening for
proteinuria and haematuria can be used starting from early childhood
33
AIM AND OBJECTIVES
GENERAL AIM
To determine the blood pressure pattern of apparently healthy secondary school adolescents
in Jalingo Taraba State
SPECIFIC OBJECTIVES
To determine
1 Blood pressure pattern in relation to age and sex among adolescents aged 10-19
years
2 The relationship if any between blood pressure and the anthropometric parameters of
weight height BMI and waist circumference
3 The association between blood pressure and parental social-economic status
4 The point prevalence of prehypertension and hypertension in adolescents
34
MATERIALS AND METHODS
Study area
A cross-sectional survey of the blood pressure pattern of apparently healthy secondary
school adolescents aged 10-19 years was conducted in Jalingo over a six month period
from January to June 2014 Jalingo is the capital of Taraba State and lies within the
savannah belt of North Eastern Nigeria It lies between latitude 80 54rsquo north and longitude
110 21rsquo east and at an altitude of 360 meters above sea level115 Jalingo had a population of
118198 people18 The primary inhabitants are the Konas Mumuyes and Fulanis who are
mostly farmers Other indigenous ethnic groups include the Jukun Kuteb WurkumTiv
and host of other tribes The Ibos Hausas Yorubas among others are the non-indigenous
ethnic groups and are mostly civil servants and businessmen Jalingo has a tertiary health
centre the Federal Medical Centre Jalingo and the state specialist hospital It also has 15
private clinicshospital and many primary health care centres There are also tertiary
education institutions including Taraba State University As at 2013 there were 56
secondary schools in Jalingo 24 public and 32 private all of which were mixed schools
except one which is a girlsrsquo only school
Study design
The study was a cross sectional descriptive study of 1350 apparently healthy secondary
school adolescents in Jalingo
Ethical approval
Ethical approval for this study was obtained from the Scientific and Health Ethics Research
Committee of Ahmadu Bello University Teaching Hospital Zaria (Appendix 4) The Taraba
State Ministry of Education also gave the approval and permission to conduct the study in the
35
selected schools Consent was given by the studentsrsquo parents or guardian (Appendix 2) All
students whose parents gave consent voluntarily participated in the study
Sample size determination
The minimum sample size was calculated using the formula116
N=Z2 (pq) E2
Where N = minimum sample size
p = Prevalence of hypertension in adolescents A prevalence of 3421 was used
q = 1- p
E = margin of error tolerated =1
Z = 196 at 95 confidence level
N = 1962 x 0034 x (1-0034) 0012 = 1262
Therefore the minimum sample size was one thousand two hundred and sixty two
Allowance for non-responders of 5 63 extra subjects were added to the calculated
minimum sample size bringing the total to 1325 students To enhance representativeness of
the sample and to compensate for missing information and poorly filled proforma while
maintaining the sample size a total of 1350 was decided upon
Inclusion criteria
1 Students (ages 10-19 years) in the selected secondary schools
2 Students whose parents gave consent to participate in the study
3 Students who gave assent to participate in the study
Exclusion criteria
1 Students who had obvious skeletal deformities of the spine and legs which can affect
the height and ultimately the BMI
36
2 Students with known chronic disease (or history of such disease) like anaemia
chronic renal disease and cardiac disease because they are not apparently healthy and
these conditions could affect their blood pressure
3 Students with present or past history of chronic drug ingestion that can affect blood
pressure such as steriods and contraceptives
4 Students with high blood pressure already on antihypertensive
Pilot study
A pilot study was carried out in one of the schools a week before the commencement of
the study The school was selected by random sampling method using balloting and did
not participate in the main study The pilot study was carried out with the aim of
assessing the competence of the research assistants in the various measurements
following their training to ensure reliability It was also used to test the questionnaire
before its use during the main study and to provide information on the number of students
that can be measured in a day Consequently twenty students had their blood pressure
and anthropometry measured independently by the researcher and the research assistants
and data were compared using Students t-test There were no statistically significant
differences between the measurements The result of the pilot study is highlighted in
Table I It was also found that some parts of the questionnaire were not well understood
by most students and were adjusted appropriately in the main study (Appendix 1) The 20
students had their measurements done over a period of 3-4 hours (between 8am - 12noon)
by the researcher and the research assistants
Table I Result of pilot study
Variables Researcher Research t p
37
assistants
Mean(plusmnSD) SBP
mmHg
106(11) 104(12) 0550 0586
Mean(plusmnSD) DBP
mmHg
617(83) 63(10) 0450 0657
Mean(plusmnSD) Weight
kg
544(82) 527(122) 0520 0608
Mean(plusmnSD) Height m 16(01) 16(01) 0000 1000
Mean(plusmnSD) BMI
kgm2
198(36) 202(33) 0370 0716
Mean(plusmnSD) WC cm 692(72) 682(133) 0300 0769
Sampling method
Students were selected by multistage random sampling technique The list of secondary
schools obtained from the Taraba State Post Primary Schools Board served as the sampling
frame for schools There were 56 secondary schools 24 of which were public and 32 were
private schools a ratio of 113 Ten (10) schools were randomly selected by balloting four
(4) from public schools six (6) from private based on the number and approximately similar
ratio of private to public schools of 115 (46) Ten schools were selected to ensure wider
coverage and even distribution of students so that it could be truly representative of the
community All the ten schools had an overall total of eight thousand one hundred and seven
(8107) students The public schools had a total of five thousand nine hundred and forty
(5940) with nine hundred and eighty nine (989) students participating The private schools
had a total of two thousand one hundred and sixty-seven (2167) students with three hundred
and sixty one (361) participating These number (989 and 361) was calculated based on the
38
relative population of each school and proportionate to number of students in each school
Thereafter the number of students to participate per school was calculated proportionately to
the number of students in each school based on the number given by the school authority
Then the number in each class was also calculated proportionately from JSS1 to SS3 to
ensure fair and equal chance of participation for all age groups The calculation was done
thus n= a b x c
Where n= number of students per selected school
a= total numberpopulation of students in the school
b= total numberpopulation of students in all 10 selected schools (8107)
c= calculated total sample size (1350)
Students in each class from junior secondary school (JSS) 1-3 and senior secondary school
(SS) 1-3 were then randomly selected by balloting The number of selected schools total
number of students in a school and the number of students selected per school is outlined in
Table II
Table II Selected schools and number of students in each of the ten schools in Jalingo
Selected schools Total no of No of students
39
student in the
school (a)
n=8107
selected (n=abxc)
n=1350
Public schools
Govt Science Secondary School 2800 466
Govt Day Secondary School SGari 1200 200
Salisu Dogo Secondary School 1100 183
Govt Secondary School Magami 840 140
Total 5940 989
Private schools
Winners Comprehensive Secondary School 650 108
Hawai Secondary School 562 94
Centre for Quranic Science and Islamic Education 543 90
Good Success Secondary School 155 26
Jetters Academy 140 23
Yagai Academy 117 20
Total 2167 361
The study
The first contact with the students was a familiarization exercise to each of the schools during
which the teachers and students were given a talk by the researcher on blood pressure and the
40
importance of periodic blood pressure measurement They were given the opportunity to ask
questions which were responded to Both the students and their teachers actively participated
in the lectures
On the second day students were selected as described above and those selected
underwent general physical examination in the presence of a chaperon to identify those
who did not fulfilled the inclusion criteria Each selected student was given a proforma
(Appendix 1) in which information on their biodata and medical history were recorded
Other information obtained was parentrsquos medical history and their socioeconomic status
using the format described by Olusanya Okpere and Ezimokhai117 (Appendix 3) The
study was carried out in a relatively quiet and empty classroom to ensure privacy for both
male and female students The procedure for blood pressure measurement was
demonstrated on one of the research assistants and sometimes on one of the teachers by
the researcher to assure the students and allay their anxiety BP and anthropometric values
obtained were recorded in the study proforma An average of 15-20 students per day were
attended to over a period of 3-4 hours (between 8am - 12noon daily) by the researcher
one of the research assistants who is a medical officer a male nurse and a lady Youth
Corper (NYSC)
Blood pressure measurement
This was measured by the researcher and the research assistant (the medical officer) The
standard auscultation method was employed using a mercury sphygmomanometer (Acosson)
and a standard Littman stethoscope according to the guideline of the fourth report on the
diagnosis evaluation and treatment of hypertension in children and adolescents8 Each
students was rest-seated for 5 minutes before BP measurement With the student seated the
right arm rested on a table at the level of the heart an appropriate cuff size which covered
41
two-third (23rd) of the length of the arm was applied round the arm about 2cm above the
antecubital fossa Two cuff sizes were used for this study with dimensions of 10 x 24cm and
13 x 30cm the smaller cuff for the smaller adolescents and vice versa The bladder cuff was
inflated rapidly to 20-30mmHg above the point where the brachial artery was no longer
palpable The bell of the stethoscope was then placed over the brachial artery and the cuff
was deflated slowly at 2-5mmHgsecond while listening to the Korotkoff sounds Phases one
and five of the Korotkoff sounds were recorded as the systolic and diastolic BP
respectively119 Three recordings were taken at intervals of 3-5 minutes and the average was
the final BP in mmHg BP was interpreted based on the standard set by the fourth report on
the diagnosis evaluation and treatment of hypertension in children and adolescents of the
United States8 thus-
Normal BP ndash BP value between the 5th and lt 90th percentile for age sex and height
Prehypertension - BP value between the 90th and the lt95th percentile for age sex and height
or BP of 12080mmHg but less than the 95th percentile
Hypertension ndash BP value ge95th percentile for age sex and height
Students found to have prehypertension were educated and counseled on life style
modifications and the need to have their blood pressure checked in six monthsrsquo time and
annually subsequently Those with hypertension were educated on the implications of the
findings and were referred to the Federal Medical Center Jalingo for evaluation management
and follow-up
Height measurement
Height was measured in centimeters using a locally constructed stadiometer by the research
assistants Each student was measured barefooted standing with the heel back and occiput
42
against the stadiometre The head was held straight looking forward with the lower border of
the eye socket at a horizontal plane with that of the external auditory meatus The movable
part of the stadiometre was adjusted to rest on the vertex and the corresponding value read to
the nearest 01cm
Weight measurement
The weight was measured in kilograms by the researcher and the research assistants using a
bathroom scale (HANSON) Students were weighed in their approved school uniform
without caps head ties or cardigan and with their shoes removed The scale was checked
daily for accuracy using standard calibrated weight before and midway through each session
The weight of the student was measured to the nearest 01 kg
Body mass index (BMI)
This was calculated from the measured weight and height of the subject using the
formula118
BMI= Weight (kg) Height (m2)
Waist circumference measurement
WC was measured in centimeters using a measuring tape by the research assistants The
male assistant measured for boys and the lady Youth Corper measured for girls
Measurement was taken with the student standing completely relax and breathing
normally Clothing was pulled up or down and an inelastic measuring tape was placed
around the waist mid-way between the iliac crest and the lowest rib margin The ends of
the tape were pulled together lightly towards each other and the value read to the nearest
01cm117120
43
Data analysis
Data obtained were analyzed using Epi-Info statistical software package version 7 The
results obtained were presented in figures tables graphs and charts as appropriate Individual
mean BP levels were used as dependent variables and other measured variables as
independent variables The means and standard deviations were used to summarize
quantitative variables such as BP weight height waist circumference and BMI The chi-
squared test was used to test the significance of associations between categorical variables
Studentrsquos t-test was used to compare means of any two normally distributed continuous
variables Pearsonrsquos correlation coefficient and regression analysis were used to examine the
strength of association between BP and the anthropometries Probability level of statistical
significance value was set at lt005
RESULTS
General characteristics
A total of 1350 students were enrolled between January and June 2014 to determine their
blood pressure pattern 628 (465) were males and 722 (535) were females with
malefemale ratio of 111 Students enrolled in the study were drawn from both public and
44
private schools The number of students from public schools was 989 (733) while 361
(267) were from private schools as shown in Table II The mean age of the study subjects
was 153plusmn22 years with a range of 10-19 years The age and sex distribution of the students
is illustrated in Table III
Table III Age and sex distribution of 1350 study subjects in Jalingo
Ag
e
Male
n ()
Female
n ()
Total
N()
10 9(14) 13(18) 22 (16)
11 20(32) 31(43) 51(38)
12 36(57) 52(72) 88(65)
13 96(153) 85(118) 181(134)
14 92(146) 115(158) 207(153)
15 92(146) 111(154) 203(151)
16 66(105) 116(161) 182(135)
17 78(125) 91(126) 169(125)
18 79(126) 70(97) 149(110)
19 60(96) 38(53) 98(73)
To
tal
628(100) 722(100) 1350(100)
45
Socio-economic classes (SEC) ndash Most of the students were from the lower social classes
(4 and 5) with population of 650 (415 and 235) students The upper social classes (1 and
2) had the least population with 184 (62 and122) students The middle social class (3) had
516 students The distribution of the study subjects according to individual
socioeconomic class is shown in Figure I
Figure 1 Socioeconomic class distribution of students in Jalingo
Anthropometry
The anthropometric characteristics of the students are displayed in Tables IV V and VI
All the anthropometric parameters showed increasing values with age (Tables V and VI)
There were significant differences in the anthropometric indices of height (p=0000)
weight (p=0010) and body mass index (p=0000) between boys and girls but not
statistically significant for waist circumference (p=0145) as shown in Table IV
Weight ndash The mean weight of the students was 486plusmn109kg with a range of 23-100kg
(Table IV) Girls were heavier than boys up to middle adolescence after which males
46
were heavier than the females (Table V and VI) and this was statistically significant (t= -
256 p=0010)
Table IV Overall mean anthropometric measurements of the study subjects
Anthropometr
y
Male Female Total
n=628 n=722 N=1350 t p
Wt (kg)
Mean(plusmnSD) 4773(115
)
4926(103
)
4855(plusmn109
)
-
25
6
0007
Range 236-848 227-100 23-100
Ht (m)
Mean(plusmnSD) 159(012) 157(008) 158(plusmn010) 35
5
0000
Range 122-185 126-179 122-185
WC (cm)
Mean(plusmnSD) 6524(91) 6595(86) 6562(plusmn89) -
14
6
0145
Range 225-905 215-100 22-100
47
BMI (kgm2)
Mean(plusmnSD) 1825(27) 1947(33) 1891(plusmn31) -
74
1
0000
Range 117-325 114-42 114-42
Statistically significant p values at 005 level of significance Wt=Weight Ht=Height WC=Waist
Circumference BMI=Body Mass Index SD=Standard Deviation
Height- The mean height of the study population was 158plusmn09m and ranged from 122-
185m (Table IV) Girls were taller than boys at early and middle adolescence but these
reversed from 16 years in favour of the boys (Table V and VI) This differences was
statistically significant (t=448 p=0000)
Waist circumference (WC) - The overall mean waist circumference was 6562plusmn89cm and
a range of 225-100cm Girls had higher WC until late adolescence (18 years) when it
reversed but this was not statistically significant (t=-146 p=0145) This is displayed in
Tables IV V and VI
Body Mass Index (BMI) - Overall mean BMI was 189plusmn31 with a range of 114-42
There was a statistically significant difference between girls and boys (t=-741 p=0000)
Tables IV V and VI illustrate this findings
Table V Mean anthropometric measurements of 628 boys
Age No of
studen
ts
Wt(plusmnSD)
Kg
Ht(plusmnSD)
m
WC(plusmnSD)
cm
BMI(plusmnSD)
Kgm2)
48
10 9 349(50) 143(001
)
613(06) 169(01)
11 20 354(25) 143(002
)
617(13) 170(07)
12 36 363(51) 146(002
)
616(14) 167(06)
13 96 379(51) 150(003
)
602(40) 165(08)
14 92 412(50) 154(003
)
623(32) 169(08)
15 92 471(60) 160(003
)
634(39) 178(08)
16 66 525(52) 164(002
)
672(24) 192(09)
17 78 555(51) 167(002
)
680(31) 197(08)
18 79 576(61) 169(002
)
707(18) 200(08)
19 60 590(57) 170(002
)
716(16) 203(07)
Total 628 477(115 16(01) 652(91) 183(27)
49
)
Wt=Weight Ht=Height WC=Waist Circumference BMI=Body Mass Index SD=Standard Deviation
Table VI Mean anthropometric measurements of 722 girls
Age No of
students
Wt(plusmnSD)
Kg
Ht(plusmnSD)
m
WC(plusmnSD)
cm
BMI(plusmnSD)
Kgm2
10 13 313(34) 139(001) 582(05) 156(02)
11 31 361(53) 144(002) 611(12) 170(05)
12 52 403(64) 149(002) 625(21) 178(09)
13 85 458(66) 154(002) 657(22) 188(12)
14 115 478(74) 157(003) 627(48) 187(10)
15 111 508(65) 159(002) 666(34) 199(13)
16 116 521(60) 159(002) 678(28) 201(11)
17 91 541(62) 161(002) 681(28) 203(11)
18 70 556(63) 161(002) 696(21) 211(11)
19 38 540(48) 158(002) 688(14) 208(06)
Total 722 493(103) 16(010) 651(23) 190(09)
Wt=Weight Ht=Height WC=Waist circumference BMI=Body Mass Index SD=Standard Deviation
Blood pressure (BP) measurements
50
Table VII shows mean blood pressure distribution of the study population for all ages
The highest SBP and DBP were 165mmHg and 95mmHg at 18years and 15 years
respectively Table VIII displays mean BP distribution in relation to age and sex The
tables show that both systolic and diastolic blood pressure increased with age This is also
depicted in Figure 2
Table VII Mean and ranges of blood pressure of 1350 subjects
Systolic Blood Pressure
(mmHg)
Diastolic Blood Pressure
(mmHg)
Age
No of
students
Mean(plusmnSD) Range
Mean(plusmnSD) Range
10 22 936(74) 80-107 600(50) 47-70
11 51 992(106) 76-120 629(71) 47-83
12 88 1036(110) 80-140 657(60) 53-82
13 181 1042(108) 80-143 660(74) 48-88
14 207 1070(115) 83-150 675(76) 47-90
15 203 1090(119) 80-150 678(82) 47-95
16 182 1122(124) 80-150 696(80) 50-90
51
17 169 1132(118) 90-153 698(83) 48-93
18 149 1138(121) 90-165 712(88) 50-90
19 98 1131(127) 90-143 726(76) 57-90
Total 1350 1089(125) 76-165 683(82) 47-95
Table VIII Mean blood pressure in relation to age and sex
Mean(plusmnSD) Systolic blood pressure
(mmHg)
Mean(plusmnSD) Diastolic blood
pressure (mmHg)
A
ge
Male
n=628
Female
n=722
t p Male
n=62
8
Fema
le
n=72
2
t p
52
10 954(3
9)
923(6
0)
1
02
03
20
619(
32)
586(
46)
1
36
0
01
91
11 985(5
5)
997(9
2)
0
42
0
06
80
648(
39)
617(
57)
1
56
0
01
26
12 999(8
9)
1062(
117)
2
84
0
00
06
653(
29)
660(
52)
-
0
52
0
06
07
13 1012(
73)
1075(
73)
4
03
4
00
00
649(
43)
672(
59)
-
0
03
0
00
44
14 1036(
78)
1098(
78)
3
93
0
00
01
653(
44)
693(
58)
3
90
0
00
01
15 1071(
80)
1105(
87)
2
05
0
00
42
665(
58)
689(
56)
-
2
10
0
00
37
16 1135(
82)
1114(
91)
1
03
0
03
10
697(
51)
695(
61)
0
15
0
08
81
53
17 1152(
87)
1115(
77)
2
04
00
43
698(
59)
698(
58)
0
02
0
09
81
18 1141(
96)
1135(
74)
0
27
0
07
91
704(
62)
721(
63)
1
61
0
02
49
19 1146(
97)
1108(
80)
1
41
0
01
64
733(
63)
714(
43)
1
21
0
02
28
To
tal
1081(
133)
1095(
117)
-
2
05
4
00
40
678(
81)
687(
82)
-
2
07
7
00
38
Statistically significant p values at 005 levels of significance
54
Figure 2 Blood pressure distribution in relation to age and sex
SBP =Systolic blood pressure DBP=Diastolic blood pressure
Blood pressure and stages of adolescence
Table IX displays mean blood pressure according to stages of adolescence Girls had a
higher mean SBP than boys from early adolescence (t=3754 p=0000) to middle
adolescence (t=-3025 p=0003) and this was statistically significant This dominance was
also demonstrated in the DBP and was statistically significant in middle adolescence (t=-
3517 plt0000) Adolescents from private schools had higher mean SBP (t=-222
plt0027) and mean DBP (t=-461 p=0000) than those from public schools and these
differences were statistically significant
Table IX Mean blood pressure according to sex and stages of adolescence
Mean BP
(mmHg)
Age (years)
Male SBP
Female SBP
Male DBP
Female DBP
55
Stages
of
adolesc
ents
(years)
Mean(plusmnSD) systolic blood pressure
(mmHg)
Mean(plusmnSD) diastolic blood pressure
(mmHg)
Male Female t p Male Fema
le
t p
Early
(10-13)
1000(9
6)
1040(1
18)
37
54
00
00
648(
56)
653(
82)
05
99
05
50
Middle
(14-16)
1075(1
29)
1105(1
13)
-
30
25
00
03
670(
81)
694(
77)
-
35
17
00
00
Late
(17-19)
1140(1
28)
1121(1
11)
21
45
00
33
717(
85)
710(
83)
00
70
09
45
1082(1
33)
1092(1
17)
-
20
54
00
40
678(
81)
687(
82)
-
20
77
00
38
Statistically significant p values at 005 level of significance SD=Standard Deviation
Table X shows blood pressure pattern according to stages of adolescence
Prehypertension and hypertension were more prevalent in late adolescence than early and
middle adolescence (χ2=49054 p=0000) and (χ2=10305 p=0006) both of which were
statistically significant
Table X The pattern of normal BP Prehypertension and hypertension according to stages
of adolescence
56
Blood
pressure
pattern
Stages of adolescence
Early
n()
Middle
n()
Late
n()
Total
N()
χ2 p
Normal 290(84
8)
428(72
3)
275(66
1)
993(73
5)
429
79
000
0
prehypertens
ion
43(12
6)
135(22
8)
120(28
8)
298(22
1)
490
54
000
0
Hypertensio
n
9(26) 29(49) 21(51) 59(44) 103
05
000
6
342(10
0)
592(10
0)
416(10
0)
1350(1
00)
350
93
000
0
Statistically significant p value at 005 level of significance
Relationship between blood pressure and the measured anthropometry
There was a positive correlation between SBP and DBP with age and the anthropometric
variables of weight height waist circumference and BMI (Table XI) SBP showed a
stronger correlation with the anthropometries than the DBP and was stronger for weight
(r=051) and height (r=044) The waist circumference though statistically significant
showed the weakest correlation
Table XI Correlation between blood pressure age (yrs) and anthropometry
Parameters
Systolic Blood Pressure Diastolic Blood Pressure
Correlation
coefficient
p Correlation
coefficient
p
57
Age (yrs) 035 lt0000 030 lt0000
Height (m) 044 lt0000 034 lt0000
Weight (Kg) 051 lt0000 038 lt0000
WC (cm) 040 lt0000 029 lt0000
BMI
(Kgm2)
031 lt0000 023 lt0000
Statistically significant p values at 005 level of significance Wt=Weight Ht=Height WC=Waist
circumference BMI=Body Mass Index
Blood pressure distribution and socio-economic classes
Table XII shows mean blood pressure according to socio-economic class of the subjects
Lower social classes had higher mean SBP (t=1650 p=2850) and DBP (t=0193
p=00058) but these were not statistically significant
Table XII Mean Blood pressure in relation to socioeconomic classes
Blood
pressur
e
Socioeconomic classes
Upper (1 amp
2) n=184
Middle (3)
n=516
Lower (4 amp
5)
n=650
f(anova
)
p
Mean
(SD)
10857(126
)
10866(128
)
11040(109
)
1650 285
0
58
SBP
Mean
(DBP)
6820(83) 6791(83) 6957(76) 0193 005
8
SEC= Socioeconomic class SBP=Systolic Blood Pressure DBP=Diastolic Blood Pressure SD=Standard
Deviation
Table XIII shows blood pressure pattern in relation to socioeconomic classes of the
subjects The percentage of students with prehypertension was higher in the upper social
class ((χ2=3067 p=0216) while the percentage of hypertension were higher in the lower
socioeconomic classes (χ2=1037 p=0568) but these differences were not statistically
significant
Table XIII Blood pressure pattern in relation to socioeconomic status
Blood
pressure
pattern
Socioeconomic classes
Upper
(1 amp 2)
n()
Middle
(3)
n()
Lower
(4 amp 5)
n()
Total
N()
χ2 p
Normal 127(69
)
383(74
2)
483(74
3)
993(73
6)
417
6
012
4
Prehypertens
ion
52(28
3)
108(20
9)
138(21
2)
298(22
1)
306
7
021
6
Hypertension 5(27) 25(48) 29(45) 59(44) 103 056
59
7 8
184(10
0)
516(10
0)
650(10
0)
1350(10
0)
573
0
022
0
Prevalence of Hypertension and Prehypertension
Table XIV shows the prevalence of hypertension in the study population The total
number of students with hypertension was 59 giving an overall prevalence of 44
Thirty four students (25) had systolic hypertension sixteen (12) had diastolic
hypertension and nine students (07) had both systolic and diastolic hypertension
Systolic hypertension was more prevalent in the females and was more at the age of 16
years while diastolic hypertension was higher in males and this also occurred at 16 years
Among those with hypertension 27 and 16 subjects had stage 1 and 2 systolic
hypertension respectively With regard to diastolic hypertension 24 and 1 subjects had
stage 1 and 2 hypertension respectively The gender difference in the prevalence of
hypertension is not statistically significant (χ2=0831 p=0362)
The number of students with pre-hypertension was 298 giving an overall prevalence of
221 Of this 131 were males and 167 are females This is illustrated in Table XIV
Prehypertension is more prevalent in females than males and this was statistically
significant (χ2=4349 p=0037)
60
Table XIV Overall Blood pressure pattern and prevalence of hypertension and
prehypertension of 1350 students in Jalingo
Blood pressure
pattern
Males
n=()
Females
n=()
Total
N()
χ2 p
Normal 471(750) 522(723) 993(735) 2619 0106
Prehypertension 131(209) 167(231) 298(221) 4349 0037
Hypertension 26(41) 33(46) 59(44) 0831 0362
628(100) 722(100) 1350(100) 1260 0533
statistically significant p value at 005 level of significance
61
DISCUSSION
The findings of this study showed that the BP of secondary school adolescents in Jalingo
was similar in terms of mean values range and trend of progression with age to that of
other adolescents from Ibadan63 and Kogi60 (Nigeria) Ashanti (Ghana)59 and Lebanon54
The mean value was however lower than the mean BP of adolescents from Zaria
(Nigeria)21 Belgrade ( Serbia)78 and Fortaleza-Cearaacute (Brazil)83 who had higher mean BP
in both sexes and at all ages The lower mean BP in this study compared to that of
adolescents from Zaria21 Belgrade78 and Brazil83 could be due to lower mean
anthropometry of weight height and BMI in adolescents from Jalingo resulting in lower
mean BP The sample sizes of these studies7883 were also different and could have
affected the mean BP of the study population For instance the sample size in the
Brazilian study83 is 151 compared to the study in Lebanon54 with 5710 subjects The use
of the fifth Korotkoff sounds as DBP in this study21 could also have accounted for the
lower mean BP in contrast to a similar study in Zaria21 where the fourth Korotkoff sound
was used as the DBP
A progressive increase in blood pressure with age was found in this study This
was similar to most findings by researchers in Nigeria 215358-606566107 and
worldwide54555961 The peak age of rise in BP in this study was in middle adolescence
between 15-16 years in boys but much earlier in girls for both systolic and diastolic BP
This was similar to the study by Akinkugbe Akinwolere and Kayode56 in Ibadan and
Ejeke Ugwu and Ezeanyika et al60 in Lokoja This age group is usually the period of
onset of puberty The chronologic age is not the main factor responsible for BP increase
62
with age but rather the progressive increase in size of the individual Increase in body
size with growth and maturity of organs associated with the physical and hormonal
changes during puberty potentially lead to increasing BP The simultaneous increase in
weight height and other anthropometric indices alongside BP with age seen in this study
and others is in agreement with that The implication of this increase in blood pressure
with age is that those with prehypertensionhypertension in childhood may continue into
adulthood hence further increasing the high prevalence of hypertension in the adult
population with its attendant morbidity disability and mortality
Overall significant higher mean BP was recorded in girls than boys in this study
This was seen from early to middle adolescence after which it reversed in favour of the
boys Reports on the relationship between BP and sex have been inconsistent Some have
reported higher mean BP in females54-56 others higher in males5883 while yet another
reported no sex differences22 The findings of this study were similar to those of Bugaje
Yakubu and Ogala21 and Ujunwa Ikefuna and Nwokocha100 who reported a consistently
higher mean blood pressure in female adolescents up to 16 years compared to their male
counterparts of similar ages Early female predominance in mean blood pressure was also
reports by Agyemang Redekop and Owusu-Dabo et al59 in Ashanti adolescents in Ghana
and Obika Adedoyin and Olowoyeye22 in Illorin The finding was however in contrast
with the study in Calabar58 where higher mean BP was found in boys than girls at all
ages The reason for the higher mean BP in females than boys could be because of earlier
onset of puberty in girls The differences in blood pressure between boys and girls in this
study could also be accounted for by variation in the anthropometric variables of the
individuals as girls were seen to be heavier and taller up to middle adolescence
This study demonstrated a consistently positive relationship between blood
pressure and the anthropometric variables of weight height body mass index and waist
63
circumference as widely reported in other studies 545558-6165107100 Weight is reported to
correlate positively with blood pressure in several studies53565871 Body mass index
(BMI) also showed a positive relation with BP in this study as reported in other
studies5978-81 This is in-keeping with the findings in Port Hacourt71 Abeokuta83 the
Gambia69 Brazil82 and Belgrade77 children Some of these studies however were made
up of younger and older age groups Even in lean populations BMI is known to correlate
positively with BP Waist circumference was also found in this study to correlate
positively with BP This was similar to reports from other studies79-8183 It was found to
be a better predictor of BP in two Italian study8081 while it was not in another82
Comparing BMI and waist circumference and their effects on BP Arauzo Lopes and
Moriera et al82 in Brazilian children found BMI to be a better predictor of BP than waist
circumference This was similar to the report by Sebanjo and Oshikoya83 in Nigerian
adolescents in Akure Guagnano Ballone and Colagrande et al81 however found waist
circumference to be better than BMI The study81 however involved adults and may not
be applicable in children and adolescents The present study demonstrated BMI and WC
to be significant but found BMI to be a better determinant of BP than waist
circumference BMI and waist circumference measure obesity in an individual Whereas
BMI is a measure of overall obesity WC measures centralabdominal fat accumulation
and thus said to be more predictive of adverse health risk79 Obese individuals may be
prone to such condition as dyslipidaemia insulin resistance and hypertension with
reduction in the quality of life Weight BMI and or waist circumference affects blood
pressure through decreased physical activity increased cardiac output insulin resistance
impaired pulmonary function and other hormonal abnormalities8084 It seems therefore
that BMI is a better predictor of BP in adolescents than waist circumference The reason
64
for this is not obvious but it may be because of the nature of uniform fat distribution in
adolescents associated with growth and hormonal changes at puberty
Blood pressure distribution in relation to the parental socio-economic class in this
study showed that students from low socio-economic classes had higher mean blood
pressure than those from upper socioeconomic classes but this was not statistically
significant A study in Ibadanl56 reported a statistically significant negative relation
between blood pressure and parental socio-economic status It was also similar to the
study58 in Calabar In contrast other studies found the reverse536022 The reasons for the
inverse relationship between BP and socioeconomic includes exposure to chronic
environmental stress with sustained sympathetic nervous system stimulation Others are
poor health seeking behaviours due to low income andor inadequate health knowledge
high low birth weight rate and inadequate healthy diets among others97101 In the same
environment individuals from a high social class are believed to be more educated with
high income61 They have easy access to health education and awareness on hypertension
prevention and control and better accessibility and adherence to medical treatment617374
The former might be responsible for the finding of this study as Jalingo is a semi urban
community Most of its inhabitants are subsistent farmers civil servants and traders with
low income The high number of students in the lower socioeconomic class lays credence
to that
The overall point prevalence of hypertension in this study was 44 while that of
pre-hypertension was 221 This prevalence of hypertension is similar to the prevalence
of 48 by Antia-Obong and Antia-Obong107 but higher than the prevalence rate of 37
reported in Zaria21 and lower than the prevalence of 58 reported in Ibadan56 54 in
Enugu100 and the 72 reported in Kano65 The prevalence of pre-hypertension was lower
than that reported by Ejeke Ugwu and Ezeanyika99 who found a prehypertensive
65
prevalence of 25 among adolescents in Lokoja It is higher than the 173 reported by
Ujunwa Ikefuna and Nwokocha et al100 in Enugu and 12-17 by Redwine and
Daniels96 among US adolescents The differences in the reported prevalence of
hypertension and prehypertension in adolescents could have resulted from the different
criteria applied by the various researchers in defining hypertension For instance whereas
this study used BP greater than 95th percentile as hypertension a study in Kano65 used the
adult hypertensive value of BPgt14090mmHg as hypertension and got a prevalence of
72 The prevalence in that study65 could have been higher if the percentile or the
statistical definition was used as many children with BP 14090mmHg would probably be
at stage 2 hypertension This was demonstrated in the study by Bugaje Yakubu and
Ogala21 who found a prevalence of hypertension in their study to be 06 when the adult
cut off value of gt14090mmHg was used but it increased to 37 when the statistical
definition of BPgt 2 standard deviations was used
The number of times blood pressure is taken could affect the outcome as repeated
measurements over a time interval is known to give lower BP values than if BP is taken
once This study used the average of three blood pressure values taken at one sitting but
Ujunwa Ekefuna and Nwokocha100 took three readings at five minutes interval with two
other readings at a week interval In that study100 the prevalence of prehypertension
dropped from 745 during the first set of readings to 173 after the third week
readings The prevalence of hypertension also dropped from 135 to 54 over the same
period Similar decrease in the prevalence of both prehypertension and hypertension was
reported by Redwine and Daniels96 in US adolescents when blood pressure was taken
over time interval Another factor which might have affected the overall prevalence is the
Korotkoff sound used for diastolic pressure23 The 4th or 5th Korotkoff sounds has been
used by different researchers resulting in different diastolic BP The study21 in Zaria used
66
the 4th Korotkoff sound while most other researchers2265100 used the 5th About 5-
10mmHg difference is said to exist between the 4th and 5th Korotkoff sounds230 In this
study the 5th Korotkoff sound was used thus giving a higher prevalence of hypertension
in the studied population than in those where the 4th sound was used
The implication of the outcome of this study is that 44 of adolescents in Jalingo
are already hypertensive while 221 of them are at risk of developing hypertension as
they are pre-hypertensive Since 856 (255 of 298) of the prehypertensives were in the
middle and late adolescence these individuals are likely to be adults with high blood
pressure Therefore regular screening of this group of individuals who were assumed to
be a healthy population is highly important for early detection of hypertension and
intervention such as life style changes and treatment
67
CONCLUSIONS
The following conclusions can be made from this study
1 The mean and range of blood pressure of adolescents in Jalingo was similar to
those of other adolescents in Nigeria and other parts of the world Blood pressure
increased progressively with age
2 All measured anthropometry of weight height body mass index and waist
circumference correlated positively with BP but weight was the most significant
variable in BP determination
3 Socioeconomic status was not significantly related with blood pressure
4 The point prevalence of hypertension and pre-hypertension was 44 and 221
respectively using a recommended definition
RECOMMENDATIONS
1 In view of the high prevalence of prehypertension in this study it is recommended
that students should have their blood pressure measured at school entry as this will
68
help identify those with abnormal BP for early intervention Thereafter BP check
should be offered at least once a year at the beginning of a new session especially for
those found with abnormal BP at school entry
2 Physical and health education should be revived in all the schools This will lead to
increased physical activity and reduced risk of obesity and its consequences
3 School health programmes should be strengthened in schools where it already exist
and effort made to establish same in schools where it is yet to exist The programme
should include measures to detect early prehypertension and hypertension and other
health related needs of the students
LIMITATIONS
The following limitations were encountered in the course of the study
1 Exclusion and inclusion of students that were based on volunteered information and
physical evaluation This could have led to inclusion andor exclusion of adolescentss
69
with or without background renal diseases which could have affected the result of this
study
2 Home blood pressure measurement especially early morning measurement for those
with high blood pressure to possibly eliminate the effect of stress traffic andor
trekking and other school related stresses which may affect blood pressure during the
day
LINES OF FUTURE RESEARCH
This study was questionnaire based and time bound Consequently students were not
investigated for background diseases co-mordid conditions target organ damage or risk
factors for high blood pressure They were also not followed up In view of this future
research on blood pressure in adolescents should include-
70
1 Investigations such as urinalysis electrolytes urea and creatinine random blood
sugar (RBS) lipid profile and echocardiography as part of blood pressure evaluation
in adolescents
2 A long period of study to allow for follow-up over months or years to identify those
that are truly hypertensive considering the definition of hypertension It will also
reveal the rate of progression from pre-hypertension to hypertension
3 Risk factors evaluation for high blood pressure including genetic predispositions
REFERENCES
1 Blood pressure from Wikipedia the free Error Hyperlink reference not valid
Accessed 24th November 2011
2 Pickering TG Hall JE Appel LJ Falkner BE Graves J Hill MN Jones DW Kurtz T
Sheps SG Roccella EJ Recommendations for blood pressure measurement in humans
and experimental animals Part 1 Blood pressure measurement in humans A
statement for professionals from the subcommittee of professional and public
71
education of the American Heart Association council on high blood pressure research
Hypertension 2005 45 142-61
3 da Silva IRR de Souza MDG de Camargo CAC Blood pressure measurement in
children and adolescents Guidelines of high blood pressure recommendations and
current clinical practice Arq Bras Cardiol 2007 88 434-7
4 Sinaiko AR Hypertension in children N Engl J Med 1996 3351968-73
5 US Preventive Services Task Force Screening for high blood pressure
recommendations and rationale Am J Prev Med 2003 25 159-64
6 Report of the second task force on blood pressure control in children Pediatrics 1987
79 1-25
7 National high blood pressure education programme working group on hypertension
control in children and adolescents update on the 1987 task force report on high blood
pressure in children and adolescents A working group report from the national high
blood pressure education program Pediatrics 1996 98 649-58
8 National high blood pressure education program working group on high blood
pressure in children and adolescents The fourth report on the diagnosis evaluation
and treatment of high blood pressure in children and adolescents Pediatrics 2004
114 255-76
9 Aderele WI Seriki O Hypertension in Nigerian children Arch Dis Child 1974
49313-7
10 Bo S Gambino R Gentile L Pagano G Rosato R Saracco GM Cassader M
Durazzo M Cavallo-Perin P High-normal blood pressure is associated with a cluster
of cardiovascular and metabolic risk factors a population based study J Hypertens
2009 27 102-8
72
11 Bao W Threefoot SA Srinivasan SR Berenson GS Essential hypertension
predicted by tracking of elevated blood pressure from childhood to adulthood The
Bogalusa Heart Study Am J Hypertens 1995 8 657- 65
12 Richard A Rodgers M Hedley AJ Mitchel JRA Changes in blood pressure and
blood lipid during adolescence BMJ 1980 28 1563-6
13 Sundstroumlm J Neovius M Tynelius P Rasmussen F Association of blood pressure in
late adolescence with subsequent mortality cohort study of Swedish male conscripts
BMJ 2011 342 643-8
14 Zimmet P Alberti G Kaufman F Tajima N Silink M Arslanian S Wong S Bennett
P Shaw J Caprio S On behalf of the International Diabetes Federation Task Force on
Epidemiology and Prevention of Diabetes The metabolic syndrome in children and
adolescents the IDF consensus Diabetic Voice 20075229-32
15 Abdulrahman FA Babaoye AA Childhood hypertension in northern Nigeria West
Afr J Med 1978 1 7-11
16 Adediran O Jimoh A Di M Relationship between body mass index and blood
pressure in rural Nigerian dwellers Internet J Nutri Wellness 2009 7 431-4
17 World Health Organization (WHO)UNICEF Adolescence at a glance 2003 p 2
18 The National Population Commission constitution of the Federal Republic of Nigeria
(AP 23 LFN) legal notice on publication issued April 21st 2007
19 Heald FP and Gong EJ Diet Nutrition and adolescents In Shils ME and Ross AC
(eds) Modern Nutrition in Health and Disease 9th ed William and Wilkins
Maryland USA 1999 p 32
20 Okonkon CT The prevalence of Hypertension among civil servants in Calabar Nig
Med J 1979 7422-5
21 Bugaje MA Yakubu AM Ogala WN Prevalence of adolescent hypertension in Zaria
Nig J Paediatr 2005 32 77-82
73
22 Obika LF Adedoyin MA Olowoyeye JO Pattern of paediatric blood pressure in
rural semi urban and urban communities in Ilorin Nigeria Afri J Med Sci 1995 24
371-7
23 Jeremy B A short history of blood pressure measurement section of the history of
medicine Proc Roy Soc Med 1977 70 793-9
24 Lewis O Stephen Hales and the measurement of blood pressure J Hum Hypertens
1994 8 865-71
25 Crile GW Blood Pressure in Surgery An experimental and Clinical Research
Philadelphia Lippincott 1903 p 358
26 Lewis WH The evolution of clinical sphygmomanometer Bull N Y Acad Med 1941
17 871-81
27 Browne WC OrsquoBrien ET Semple PF The sphygmomanometer of Riva Roci 1896-
1996 J Hum Hypertens 1994 610 723-4
28 Segal HN How Korotkoff the Surgeon discovered the auscultatory method of
measuring arterial pressure Ann Intern Med1975 83 561-2
29 Goodman FH and Howell AA Clinical studies in the auscultatory method of
determining blood pressure University of Pennsylvania Bulletin 1911 23 469-75
30 Crenner CW Introduction of the blood pressure cuff into US medical practice
technology and skilled practice Ann Intern Med 1998 128 488-493
31 Ganon WF Circulation In Review of Medical Physiol Lange Medical Publication
New York 22nd edition 2005 p 234-63
32 Beth C Homeostatic Regulation of Blood pressure Available from
URLhttpwwweHowcom Accessed on 1st December 2011
33 Rajinder KG Fahim M Regulation of cardiovascular functions during acute blood
loss Indian J Physiol Pharmacol 2005 49 213ndash9
74
34 Dampney AL Coleman MJ Fonts MAP Hirooka Y Horiuchi J Polson JW Potts
PD Tagawa T Central mechanisms underlying short-term and long-term regulation
of the cardiovascular system Proc Austr Physio Pharmacosociety 2001 32 333-44
35 Koshiya N Guyenet PG Noradrenergic neurons and the carotid sympathetic
chemoreflex Am J Physiol 1994 267 519-26
36 Prakash ES The ultimate goal in neural regulation of cardiovascular function Adv
Phyiol Educ 2008 32 107-8
37 Allen AM Inhibition of the hypothalamic paraventricular nucleus reduces
sympathetic nerve discharge and blood pressure Proc Austr Neuroscience Society
2001 29 44-7
38 Reid IA Interactions between ANG II sympathetic nervous system and
baroreceptor reflexes in regulation of blood pressure Am J Physiol 1992 262 763-
78
39 Brooks VL Osborn JW Hormonal-sympathetic interactions in long-term
regulation of arterial pressure A hypothesis Am J Physiol 1995 268 1343-58
40 Reckelhoff JF Gender Differences in the Regulation of Blood Pressure
Hypertension 2001 37 1199-208
41 Fink GD The systemic circulation as a regulated free-market economy A new
approach for understanding the long-term control of blood pressure Clin Exp
Pharmacol Physiol 2005 32 377ndash83
42 Benard K Sources of error in blood pressure measurement Hospital Physician 2002
12 33-7 Available from URLhttp wwwturnerwhitecom
43 Chyun DA A comparism of intra arterial and auscultatory blood pressure readings
Heart lung 1985 14 223-31
75
44 Nwankwo MU Lorenz JM Gardiner JC A Standard Protocol for Blood Pressure
Measurement in the Newborn Pediatrics 1997 99 1342-9
45 Deakin CD Low JL Accuracy of the advanced trauma life support guidelines for
predicting systolic blood pressure using carotid femoral and radial pulses
observational study BMJ 2000 321 673ndash4
46 OrsquoBrian E Replacing mercury sphygmomanometers require clinician to demand
better automated device BMJ 2000 320 815-6
47 McKay DW Raju MK Campbell NR Assessment of blood pressure measuring
techniques Med Educ 1992 26 208ndash12
48 Baker RH Ende J Confounders of auscultatory blood pressure measurement J Gen
Intern Med 1995 10 223ndash31
49 Neufeld PD Johnson DL Observer error in blood pressure measurement CMAJ
1986 135 633ndash7
50 van Montfrans GA Oscillometric blood pressure measurement progress and
problems Blood Press Monit 2001 6 287ndash90
51 Ware RW Laenger CJ Indirect blood pressure measurement by Doppler ultrasonic
kinetoartriography Proceedings 20th Annual Conference Engineering Medical
Biology 1967 9 27-30
52 Matthew Fox Blood pressure measurement technique Available from URL http
wwwlivestrongcom Last edited 2nd September 2010 Accessed on 30th November
2011
53 Akor F Okolo SN Okolo AA Blood pressure and anthropometric measurements in
healthy Primary School entrants in Jos Nigeria SAJCH 2010 4 42-5
54 Merhi BM Al-Hajj F Al-Tannir M Zaide F El-Rajab M A survey of blood pressure
in Lebanese children and adolescents North Am J Med Sci 2011 3 24-9
76
55 Al-Salloum AA El-Mouzan AH Al-Herbish AS Al-Umar AA Qurashi MM Blood
pressure standard for Saudi children and adolescents Ann Saudi Med 2009 29 173-8
56 Akinkugbe FM Akinwolere AO Kayode CM Blood Pressure Pattern in
Adolescence West Afri J Med 1999 18 196-202
57 Wanzhu T Eckert GJ Saha C and Pratt JH Synchronization of Adolescent Blood
Pressure and Pubertal Somatic Growth J Clin Endo Metab 2009 94
58 Ansa VO Anah MU Odey FA Mbu PN Agbor EI Relationship between parental
socioeconomic status and casual blood pressure in coastal Nigeria Adolescents West
Afri J Med 2010 29146-52
59 Agyemang C Redekop WK Owusu-Dabo E Bruijnzeels MA Blood pressure
patterns in rural semi-urban and urban children in the Ashanti region of Ghana West
Africa BMC Public Health 2005 5114-21
60 Ejeke CCE Ugwu CE Ezeanyika LUS Olayemi AT Blood pressure patterns in
relation to geographic area of residence a cross-sectional study of adolescents in Kogi
state Nigeria BMC Public Health 2008 8 411-5
61 Colhoun HM Hemminway H Poulter WR Socioeconomic status and blood
pressure an overview analysis J Human Hypertension 1998 12 91-110
62 Badaruddoza KR Familial aggregation and heritability for cardiovascular risk factors
a family based study in Punjab India Natural Science 2010 2 732-6
63 Livshits G Gerber LM Familial factors of blood pressure and adiposity co-variation
Hypertension 2001 37 928-35
64 Fermino RC Seabra A Garganta R Antoacutenio J Maia R Genetic factors in familial
aggregation of blood pressure of Portuguese nuclear families Arq Bras Cardiol 2009
92 463-9
77
65 Mijinyawa MS Iliyasu Z Borodo MM Prevalence of hypertension among teenage
students in Kano Nigeria Nig J Med 2008 17 173-7
66 The Wellcome Trust case control consortium Genome-wide association study of
14000 cases of seven common diseases and 3000 shared controls Nature 2007 447
661-78
67 Levy D Destefano AL Larson MG ODonnell CJ Lifton RP Gavras H Evidence for
a gene influencing blood pressure on chromosome 17 genome scan linkage results for
longitudinal blood pressure phenotypes in subjects from the Framingham heart study
Hypertension 2000 36 477- 83
68 Lifton RP Wilson FH Choate KA Geller DS Salt and blood pressure new insight
from human genetic studies Cold Spring Harb Symp Quant Biol 2002 67 445ndash50
69 van der Sande MA Milligan PJ Nyan OA Rowley JT Banya WA Ceesay SM
Dolmans WM Blood pressure patterns and cardiovascular risk factors in rural and
urban Gambian communities J Hum Hypertens 2000 14 489-96
70 Akinkugbe OO Ojo OA Arterial blood pressure in rural and urban population of
Nigeria BMJ 1969 2 22-4
71 Okagua J Anochie IC Akani NA Adolescent blood pressure in Rivers State Nigeria
A rural-urban comparism NJP 20154221-7
72 Urrutia-Rojas X Egbuchunam CU Bae S Menchaca J Bayona M Rivers PA Singh
KP High blood pressure in school children Prevalence and risk factors BMC
Pediatrics 2006 6 32-9
73 Sorof JM Lai D Turner J Poffenbarger T Potman R Overweight ethnicity and the
prevalence of hypertension in school-aged children Pediatrics 2004 113 475-82
78
74 Rosner B Prineas R Daniels SR Blood pressure differences between blacks and
whites in relation to body size among US children and adolescents Am J Epidemiol
2000 151 1007-18
75 Harding S Whitrow M Lenguerrand E Maynard M Teyhan A Cruickshank JK Der
G Ethnic differences in blood pressure in adolescence the determinants of adolescent
social well-being and health study Hypertension 2010 55 1063-9
76 Cruickshank JK Mzayek F Liu L Kieltyka L Sherwin R Webber LS Srinavasan SR
Berenson GS Origins of the ldquoblackwhiterdquo difference in blood pressure roles of birth
77 Vlajinac H Miljus D Adanja B Marinkoic J ipetic S Kocev N Blood pressure levels
in 7 to 14-year-old Belgrade children J Human Hypertension 2003 17 761ndash5
78 Menezes AMB Hallal PC Dumith SC Adolescent blood pressure body mass index
and skin folds sorting out the effects of early weight and length gains J Epid Comm
Health 2011 12 42-8
79 Karelis AD St-Pierre DH Conus F Rabasa-Lhoret R Poehlman EJ Metabolic and
body composition factors in subgroups of obesity what do we know J Clin Endo
Metab 2004 89 2569-75
80 Katzmarzyk PT Srinivasan ER Chen W Malina RM Bouchard C Berenson GS
Body mass index waist circumference and clustering of cardiovascular disease risk
factors in a biracial sample of children and adolescents Pediatrics 2004 114 198-205
81 Guagnano MT Ballone E Colagrande V Della Vecchia R Manigrasso MR Merlitti
D Riccioni G Sensi S Large waist circumference and risk of hypertension Int J
Obesity 2001 25 1360 ndash 4
82 Araujo TA Lopes MVO Moriera RP Cavalcante TF Gurdes NG MartinS dA Silva
V Blood pressure of children and teenagers from a public school in Fortaleza - Cearaacute
Acta paul enferm 200720103-15
79
83 Sebanjo IO Oshikoya KA Obesity and blood pressure levels of adolescents in
Abeokuta Nigeria Cardiovasc J Afr 2011 221-5
84 Messerli FN Obesity and essential hypertension Haemodynamics sodium excretion
and plasma rennin activity Arch Int Med 1981 141 81-5
85 Appel LJ Brands MW Daniels SR Karanja N Elmer PJ Sacks FM Dietary
Approaches to Prevent and Treat Hypertension A Scientific Statement from the
American Heart Association Hypertension 2006 47 296-308
86 Sacks FM Svetkey LP Vollmer WM Appel LJ Bray GA Harsha D Obarzanek E
Conlin PR Miller ER 3rd Simons-Morton DG Karanja N Lin PH for the DASH-
Sodium Collaborative Research Group Effects on blood pressure of reduced dietary
sodium and the Dietary Approaches to Stop Hypertension (DASH) diet DASH-
Sodium Collaborative Research Group N Engl J Med 2001 344 3ndash10
87 Appel LJ Moore TJ Obarzanek E Vollmer WM Svetkey LP Sacks FM Bray GA
Vogt TM Cutler JA Windhauser MM Lin PH Karanja N A clinical trial of the
effects of dietary patterns on blood pressure DASH Collaborative Research Group N
Engl J Med 1997 3361117ndash24
88 Appel LJ Sacks FM Carey VJ Obarzanek E Swain JF Miller ER 3rd Conlin PR
Erlinger TP Rosner BA Laranjo NM Charleston J McCarron P Bishop LM for the
OmniHeart Collaborative Research Group Effects of protein monounsaturated fat and
carbohydrate intake on blood pressure and serum lipids results of the OmniHeart
randomized trial JAMA 2005 294 2455ndash64
89 Karanja NM Obarzanek E Lin PH McCullough ML Phillips KM Swain JF
Champagne CM Hoben KP Descriptive characteristics of the dietary patterns used in
the Dietary Approaches to Stop Hypertension Trial DASH Collaborative Research
Group J Am Diet Assoc 1999 99 19ndash27
80
90 Nwokocha ARC Adolescence and associated problems In Azubuike JC and
Nkanginieme KEO (eds) Paediatrics and Child Health in a Tropical Region African
Educational Services Owerri Nigeria 2nd edition 2007 p 84-99
91 Rogol RT Roemmich JN Clark PA Growth and puberty J Adol Hlth 2002 31 192-
200
92 Tanner JM Marshal WA Variation in the pattern of puberty changes in boys and girls
Arch Dis Child 1970 45 13-23
93 Nwakoro SO Ifoda K Onochie O Olomu JM Anthropometric assessment of
nutritional status and growth of 10-20 years individuals in Benin City metropolis
Nigeria Pakistan J Nutr 2006 5 117-21
94 Shankar RR Eckert GJ Saha C Tu W Pratt JH The change in blood pressure during
pubertal growth J Clin Endo Metab 2005 90 163-7
95 Department of Health and Human Services 2000 CDC Growth Charts for the United
States methods and development Series Report 11 No 246 Available from URL
httpwwwcdcgovGrowthCharts
96 Redwine KM Daniels SR Prehypertension in Adolescents Risk and Progression
Journ Clin Hypertension 2012 14 360ndash4
97 Falkner B Gidding SS Portman R Rosner B Blood pressure variability and
classification of prehypertension and hypertension in adolescence Pediatrics 2008
122238ndash42
98 Redwine KM Acosta AA Poffenbarger T Development of hypertension in
adolescents with pre-hypertension J Pediatr 2012 16098ndash103
99 Ejike ECCC Ugwu CE and Ezeanyika LUS Variations in the prevalence of point
prehypertension in a Nigerian school-going adolescent population living in a semi-
urban and an urban area BMC Pediatr 2010 1013
81
100 Ujunwa FA Ikefuna AN Nwokocha AR Chinawa JM Hypertension and
prehypertension among adolescents in secondary schools in Enugu South East Nigeria
Italian J Pediatr 20133970-5
101 Chobanian AV Bakris GL Black HR Seventh report of the Joint National
Committee on Prevention Detection Evaluation and Treatment of High Blood
Pressure Hypertension2003 421206ndash52
102 Lande MB Systemic Hypertension In Kliegman RM Behrman RE Jenson HG and
Stanton BF (eds) Nelson Textbook of Pediatrics Saunders Elsevier Philadelphia 19th
Edition 2011 pg 1592-8
103 Luma GB Spiotta RT Hypertension in Children and Adolescent Am Fam Physician
2006 73 1558-68
104 Arvind B Rupesh J Vijayakumar M Madhuri K Ali U Evaluation and management
of hypertension Indian Paediatr 2007 44 103-21
105 Flynn JT Neonatal hypertension Diagnosis and management Pediatr Nephrol 2000
14 332-41
106 Steyn K de Wet T Richter L Cameron N Levitt NS Morrel C Cardiovascular
diseases risk factors in 5-year old urban South African children- The Birth to Ten
Study SAMJ 2000 90 7126
107 Antia-Obong OE Antia-obong LE Arterial blood pressure of Nigerian Urban and
Rural school children Nig J Paediatr 1991 18 3-11
108 Nguyen NT Magno CP Lane KT Hinojosa MW Lane JS Association of
hypertension diabetes dyslipidemia and metabolic syndrome with obesity findings
from the National Health and Nutrition Examination Survey 1999 to 2004 J Am Coll
Surg 2008 207 928-34
82
109 Solar MB Gill A Rey J Epidemiology of arterial blood pressure in school children
population Aten Primaria 1992 9 212-4
110 Steyn K de Wet T Richter L Cameron N Levitt NS Morrel C Cardiovascular
diseases risk factors in 5-year old urban South African children- The Birth to Ten
Study SAMJ 2000 90 7126
111 Linkas J The assessment and management of hypertensive emergencies and
urgencies in children Pediatr Emerg Care 2005 21391-6
112 Croix B Feig DI Childhood hypertension is not a silent disease Pediatr Nephrol
2006 21527-32
113 Flynn JT Anderson MH Characteristics of children with primary hypertension seen
at a referral centre Pediatr Nephrol 2007 44 103-21
114 Nakao M Yano E Nomura S Kuboki T Blood pressure lowering effects of
biofeedback treatment in hypertension a meta-analysis of randomized controlled trials
Hypertension 2003 26 37- 46
115 Jalingo Available from URLhttpwwwencyclopedia Britanica Accessed on 3rd
December 2011
116 Araoye MO Research Methodology with Statistics for Health and Social Sciences
Nathadex Publishers Saw-Mill Ilorin Nigeria 2004 pg 115-21
117 Olusanya O Okpere E Ezimokhai M The importance of social class in voluntary
fertility control in a developing country West Afr J Med 1985 4 205-12
118 World Health Organization expert committee Physical status the use and
interpretation of anthropometry WHO technical report series No 894 Geneva WHO
1995 p 424ndash38
119 Guidelines subcommittee WHOISH guideline for management of hypertension J
Hypertens 1999 17 151-83
83
120 Aubay B How to measure waist circumference Available from
URLhttpwwwehowcom Last updated August 10th 2011 and accessed on December
9th 2011
APPENDICES
Appendix 1
PROFORMA ON BLOOD PRESSURE PATTERN IN APPARENTLY HEALTHY
SECONDARY SCHOOL ADOLESCENTS IN JALINGO
PUBLIC SCHOOL [ ]
Serial No
84
PRIVATE SCHOOL [ ]
A BIODATA
1 Age (years) 10[ ] 11[ ] 12[ ] 13[ ] 14[ ] 15[ ] 16[ ] 17[ ] 18[ ] 19[ ]
2 Gender M [ ] F [ ]
3 Class JSS 1-3 [ ] SS1-3 [ ]
B MEDICAL AND SOCIAL HISTORY Yes [1] No [2]
1 Have you ever passed blood in your urine [ ]
2 Have you ever had your face or legs swollen [ ]
3 Are you on any drug for long time (such as pills steroids marijuana codeine
NSAIDs containing drugs tramal and others) [ ]
If yes specifyhelliphelliphellip
C SOCIO-ECONOMIC CLASSIFICATION
Fatherrsquos occupation
Score 1 Professionals top civil servants politicians and top businessmen
2Middle-level civil servants technicians skilled-artisans and well-to-do
traders
3 Unskilled workers and those in general whose income would be at or below
the national minimum wage
Mothers educational level
Score 0 Education up to University level
1 Secondary or tertiary level below the University
2 No formal education or up to primary level only
D ANTHROPOMETRY
i Weight (Kg) ndash 1helliphellip 2helliphelliphellip Averagehelliphelliphelliphellip
ii Height (m) ndash 1helliphellip 2helliphellip Averagehelliphelliphelliphellip
85
iii Body mass index = weightheight (kgm2)
v Waist circumference (cm) ndash 1helliphellip 2helliphelliphellip Averagehelliphelliphelliphellip
iv Blood Pressure (mmHg) - 1helliphellip 2hellip 3helliphellip Averagehelliphelliphelliphellip
Appendix 2
AUTHORIZATION AND CONSENT TO PARTICIPATE IN A RESEARCH
I Dr Peter Teru Yaru of the Department of Paediatrics Ahmadu Bello University
Teaching Hospital (ABUTH) Zaria Irsquom conducting a research on the blood pressure
pattern among secondary school adolescents in Jalingo
The aim of the study is to know the level of blood pressure among their age
groups Those with high blood pressure (or hypertension) will be identified appropriately
advised and referred for further care The study will involve taking their weight height
blood pressure and waist circumference Female assistants shall be responsible for
86
measuring waist circumference of female students Students will also be given a
questionnaire on some of their activities drug use among others all aimed at looking for
factors which can affect their blood pressure Information obtained shall be treated with
utmost confidentiality and for this research work only Please note that participation is
voluntary I will be glad if you give consent for your childward to participate in the
study
Statement by parents Irsquove read and understood this consent form and agreed for my
child to be included in the study
Parents name Researcherrsquos name and sign
Parents phone no if any Date
Parents signthumb print Phone no
87
Appendix 3
SOCIO-ECONOMIC SCORE
The classification of socio-economic scores based on fatherrsquos occupation and motherrsquos
education by Olusanya et al117
A Husband (fatherrsquos occupation)
Score 1 Professionals top civil servants politicians and businessmen
2 Middle-level bureaucrats technicians skilled-artisans and well-to-do traders
3 Unskilled workers and those in general whose income would be at or below
the national minimum wage
B Mothers educational level
Score 0 Education up to University level
1 Secondary or tertiary level below the University
2 No formal education or up to primary level only
The socio-economic class of the childrsquos mother is obtained by adding the scores from A
and B above and graded I-V as appropriate for example
Score (1) from A plus score (0) from B = social class I
Score (2) from A plus score (0) from B = social class II
Score (2) from A plus score (1) from B = social class III
Score (2) from A plus score (2) from B = social class IV
Score (3) from A plus score (0) from B = social class III
Score (3) from A plus score (1) from B = social class IV
Score (3) from A plus score (2) from B= social class V
Page 17
17
Renal Regulation
The kidneys control blood pressure through the retention and excretion of extracellular
fluid35 An increase in renal fluid retention will increase extracellular volume and higher
blood pressure whereas increased renal excretion leads to lower blood pressure41 This is
achieved through the action of ADH aldosterone and atrial natriuretic peptide (ANP)41
METHODS OF MEASURING BLOOD PRESSURE
Blood pressure can be measured by invasive and non-invasive methods
1) Invasive (or direct) method - Blood pressure is most accurately measured invasively
through an arterial line4243 It is the gold standard by which the accuracy of other blood
pressure measuring devices and methods are assessed4344 Chyun43 compared direct and
indirect blood pressure readings in 14 intensive care unit patients and found that the
auscultatory method overestimates the systolic and diastolic BP especially if the VI Kortkoff
sounds is used as an indicator of diastolic BP This can often over estimate reading by as
much as 20 mm Hg43 This study is made up of very small sample size to make general
conclusion on the differences in BP values from the two methods compared Although the
invasive method is the gold standard for true BP measurement it is associated with serious
complications related to arterial catheterization and the procedure itself may be technically
difficult It is mainly used in experimental procedures and in monitoring critically ill patients
in intensive care units42
2) Non invasive (indirect) methods These are simpler and quicker than the invasive
method and are commonly used for routine blood pressure examinations They may
however yield lower accuracy and small systematic differences in numerical results43
These methods include-
18
a) Palpation method - A minimum systolic value can be estimated by palpation Deakin
and Low45 reported that a palpable radial femoral or carotid pulse indicates a minimum
systolic BP of 80 70 and 60 mmHg respectively The study was carried out among adults
and these values could not be applicable in children and neonate whose maximum
systolic BP may be lower than the reported minimum values A more accurate systolic BP
value can be determined by inflating and then deflating sphygmomanometer cuff while
palpating the pulse The systolic BP corresponds to the pressure at which the radial pulse
becomes palpable45 Its disadvantages are that pressure obtained is usually 2-5mmHg less
than those obtained by auscultation and diastolic BP cannot be measured32
b) Auscultation method- Also called the Korotkoff method is the method of choice in
clinical practice142 It involves using a stethoscope and a sphygmomanometer46 The
mercury sphygmomanometer is the gold standard for BP measurement A Riva-Rocci
cuff 27 is placed over the arm and inflated to occlude the brachial artery It is then
gradually deflated until blood flow is re-established accompanied by a tapping sound
which can be detected by the stethoscope held over the artery Five sounds are
traditionally heard and classified into phases30 The first phase corresponds to the systolic
BP while the last or fifth phase corresponds to the diastolic BP30 The fourth phase
alternatively is used to measure the diastolic pressure if a 10 mmHg or greater
differences exist between the initiation of phases fourth and five or if the fifth sound is
heard down to 0 mmHg8 This may occur in cases of high cardiac output or peripheral
vasodilatation children or in pregnancy This method though the method of choice in
clinical practice may however be associated with errors arising from faulty technique and
equipment4748 as well as observer bias49 This method was used for this study because of
its widespread general usage its reliability and accuracy Unlike other methods the
instruments (mercury sphygmomanometer and stethoscope) do not require any
19
calibration and values obtained do not require validation by other methods The standard
World Health OrganizationCenter for Disease Control (WHOCDC) blood pressure
reference percentile tables were generated using the mercury sphygmomanometer hence
the auscultation method is the gold standard for BP evaluation258
The aneroid sphygmomanometer measures BP by mechanical system of metal
bellows that expand as the cuff pressure increases in a series of levers that register the
pressure on a circular scale The hybrid shygmomanometer combines some of the features
of the two and uses an electric transducer to record blood pressure2
c) Oscillometric technique- This uses the oscillometric device Oscillation of pressure in a
sphygmomanometer cuff is recorded during gradual deflation The point of maximum
oscillation corresponds to the mean arterial pressure50 The oscillation begins well above
systolic BP and continues below diastolic BP so that systolic and diastolic BP can only
be estimated indirectly according to some empirically derived algorithm
d) Ultrasound method - This uses an ultrasound transmitter and receiver placed over the
brachial artery under a sphygmomanometer cuff As the cuff is deflated the movement of
the arterial wall and systolic BP cause a Doppler phase shift in the reflected ultrasound
The diastolic BP is recorded as the point of diminished arterial motion51 Its advantage
includes the ability to detect diastolic BP in atrial fibrillation and hypotension where
Korotkoff sound is faint152
FACTORS AFFECTING BLOOD PRESSURE IN ADOLESCENTS
Several inter-related factors affect blood pressure These include-
Age - A progressive BP elevation with age has been observed in several studies2153-55
The rate of rise varies in boys and girls5455 The average systolic increase ranges between
20
166 and 286 mmHgyr for boys and 144 and 263mmHgyr for girls while that of
diastolic BP ranges from 083 and 177mmHgyr for boys and 077 and 148mmHg for
girls2155 Bugaje Yakubu and Ogala21 studied blood pressure pattern among 2035
adolescents in Zaria and found a consistent rise of BP with age The rate of rise was fairly
constant until 11-13 years in boys and 12-14 years in girls when the rise became rapid A
similar study53 also found a BP rise with age among 650 healthy school children in Jos In
a large population studies in Lebanon56 and Saudi Arabia55 BP was similarly reported to
increase consistently with age Rapid growth and biological maturation of organs which
are normal occurrences during adolescence were thought to be responsible rather than the
chronological age56 The results of these studies showed increasing blood pressure with
age despite the fact that one study55 used oscillometric method for their study while the
standard auscultation was used in the other studies Also the studied sample sizes across
these studies varied greatly with sizes of 65053 203521 571054 and 1622655 Despite this
the findings were similar
Gender ndash Results of studies on the effect of gender on BP showed that sex positively
affects blood pressure2153-55 Merhi Al-Hajj and Al-Tannir et al54 studied BP pattern in
5710 Lebanese school children while Al-Salloum El-Mouzan and Al-Herbish et al55
studied BP pattern in 16226 Saudi children and adolescents The authors reported a
higher BP in girls than boys at all ages A study21 of BP pattern in adolescents in Zaria
Nigeria demonstrated an initial higher BP in boys before puberty which reversed with the
onset of puberty up to the age of 14-15yrs when it reversed again to be higher in boys
Akinkugbe Akinwolere and Kayode56 reported no sex differences in adolescent BP in
Ibadan The reported sex difference is said to be likely due to differences in sex hormone
and pattern of growth in boys and girls57 Differences in age range of the study population
may however be responsible for the observed BP variation For instance these studies5455
21
comprised of both adolescents and pre-adolescent age groups combined in one study
while the other two studies2156 were purely adolescents21 Blood pressure is reported to be
equal in both sexes before adolescence after which the gender difference starts to
manifest most likely due to physical and hormonal changes
Socioeconomic Factors - Belonging to either end of the socioeconomic strata is found to
be associated with elevated blood pressure5859 A study in Ibadan56 reported an inverse
relationship between parental socioeconomic status and level of BP in adolescents The
authors suggested that this might be the result of the health behaviours and problems
characteristic of the lower socioeconomic class On the other hand Ejeke Ugwu and
Ezeanyika et al60 in Lokoja and another study53 in Jos both found higher BP in children
from high socioeconomic class Colhoun Hemminway and Poulter61 in a meta-analysis of
BP and socioeconomic status in developed and developing countries found an inverse
relationship of BP with socioeconomic status in developed nations and a direct correlation
in developing countries These different findings may be due to methodological
differences in socio-demographic stratification For instance Akinkugbe and
colleagues59 used fatherrsquos level of education for social classification Parentrsquos educational
level may however not equate well with level of family income The other study60 used an
automated device for their study whose values may require validation using the
recommended auscultation method Difference in environmental stresses may also be
different considering the level of development of the areas where the studies were carried
out
GeneticFamilial Factors - The effect of geneticfamilial factors on BP has been
demonstrated in some studies62-64 Familialgenetic correlations reflected in BP and other
anthropometry generally are higher among genetically close relatives such as brother-
sisters or parent-offspring than among spouses62 Levshit and Gerber63 surveyed 514
22
individuals from 135 nuclear families in Russia while Budaruddoza62 studied 1400
individuals from 380 families in India and found significant genetic influence on BP
Mijinyawa Iliyasu and Borodo65 also reported family history of hypertension as risk
factor for developing high BP in a study on prevalence of hypertension among 1000
teenagers in Kano The authors concluded that this could be due to genetic predisposition
They however did not evaluate further to determine the genetic defects The authors did
not also consider shared environmental factors known to influence blood pressure in
individuals Molecular genetic studies have identified genes as possible regulators of
BP6667 These genes regulate the renin-angiotensin-aldosterone system involved in renal
salt handling69 Mutations that increase sodium reabsorption and salt sensitivity is
associated with higher BP and vice versa68 while shared environmental risk factors may
potentiate the development of such familial conditions which might have been
responsible for outcome of the above studies6364
Environmental Factors ndash Environmental factors greatly influence BP variation in a
population592269 Akinkugbe and Ojo70 reported a consistently higher BP in Nigerian
adolescents than their counterparts of similar ages in black and white American children
The authors are of the view that this could be due to different environmental factors of the
study population Obika Adedoyin and Olowoyeye22 studied BP pattern in 2526
children aged 1-14 years in rural semi-urban and urban communities in Ilorin Nigeria
and demonstrated a hypertension prevalence of 95 in urban compared to 63 in rural
communities This was similar to the study59 in Ghana and Gambia69 The authors592269
argued that the differences were due to socioeconomic status which is higher in the urban
than the rural areas The BP variation could be accounted for by the nature of dietary
intake since the rural communities generally consume more of natural foods with less salt
and lsquojunk foodsrsquo compared to the urban populace This was demonstrated by one study61
23
which reported higher mean BP among urban communities in developing nations due to
changes in their dietary pattern Rural areas are also less exposed to the stress and hassle
of the urban cities It is of interest to note however that urban areas are a mixture of
social classes as a result of migrant workers seeking lsquogreener pasturesrsquo Okagua Anochie
and Akani71 on the other hand reported higher mean BP among rural adolescents than
their urban counter parts in Port Harcourt The authors could not identify the reason(s) for
their finding but concluded that the seemingly protective privilege of rural life may be
fading gradually The differences in the reports could however result from the sample size
composition comprising of preadolescents22 adolescents71 and adults69
Race - Higher BP levels have been reported in African-American and Hispanic school-
age children than their Caucasian counterparts and among African-Americans than the
Hispanics7273 Akinkugbe and Ojo70 demonstrated a consistently high systolic and
diastolic BP in Nigerian children compared with black and white American children of
similar age Exposure to chronic environmental stress low socioeconomic status and high
obesity rate among African American and Hispanic youths could contribute to higher
BP72-74 It can be inferred from the study that race alone may not be responsible for the
observed differences but shared environmental factors and socioeconomic status may be
contributory77 Other studies7475 however found no significant BP differences in relation
to race
Anthropometry and blood pressure (BP) - A positive correlation has been observed
between BP and anthropometry in various studies58-5977 These studies585678 observed a
significant correlation between systolic BP and weight height and body mass index
(BMI) in boys but only with weight in girls Body mass index (BMI) is used as a
measure of overall obesity but it is known to be a poor indicator of actual body fat79
Waist circumference (WC) is an aggregate measurement of the actual amount of total and
24
abdominal fat accumulation80 It is therefore a better predictor of BP and other
cardiovascular diseases8081 Guagnano Ballone and Colagrande et al81 studied the
relationship between BP and BMI WC and waist hip ratio (WHR) in 461 people and
found WC to be the most consistent anthropometry affecting BP It is of interest to note
that the study by Guagnano et al81 was in adults population while the other studies56-59
were in children and adolescents WC was also found to be a better predictor of BP in an
Italian study8081 while it was not in others56-6982 Comparing BMI and waist
circumference and their effects on BP Arauzo Lopes and Moriera et al83 in Brazilian
children found BMI to be a better predictor of BP than waist circumference This was
similar to the study by Sebanjo and Oshikoya82 in Nigerian adolescents in Akure Thus
waist circumference measurements may not be useful in the evaluation of obesity andor
hypertension in children and adolescents This may partly be explained by the uniform fat
distribution due to hormonal effect at puberty in adolescents compared to the
disproportionate fat distribution in adults Possible mechanisms for the positive
relationship between BP and high BMI includes decreased physical activity increased
salt intake impaired pulmonary functions and development of metabolic abnormalities
such as dyslipidaemia and insulin resistance8084
Nutritional factors - Diet has been a primary link between humans and their environment
and substantial evidence supports the concept that multiple dietary factors affect BP85
Well-established dietary modifications that lower BP are reduced salt intake increased
potassium intake increased protein particularly plant protein high vegetable and
polyunsaturated fats85 High sodium intake on the other hand is said to be associated with
elevated blood pressure86 A series of 3 large controlled feeding studies tested the effects
of dietary patterns on BP86-89 Of the 3 diets studied the dietary approach to stop
hypertension (DASH) emphasized fruits vegetables low-fat dairy products whole
25
grains poultry fish nuts potassium magnesium calcium and fibre as the most effective
diet89 Among all participants the DASH diet significantly lowered mean systolic BP by
55 mm Hg and mean diastolic BP by 30 mm Hg each net of changes in the control diet
DEFINITION AND CLASSIFICATION OF ADOLESCENCE
Adolescence is the transitional stage between childhood and adulthood during which many
life patterns are learnt and established90 According to World Health Organization (WHO)
adolescents are individuals between the age range of 10-19 years17 The most significant
feature of adolescence is puberty characterized by an exceptionally rapid rate of biological
growth and development including physical and sexual maturation9091 The pubertal changes
have been described by Tanner and Marshal92 and are grouped into five stages This utilizes
definite criteria for growth and development of secondary sexual characteristics like pubic
hair and breast in females and pubic hair and genitalia in males9092 The timing of these
events and the rate of growth vary due to genetic and environmental factors in different
populations92 Adolescence is divided into early middle and late periods17
Early adolescence (10-13 years) ndash This is a period of rapid growth and development of
secondary sexual characteristics and varies according to sex It corresponds to Tanner stages
1 and 290 The main features of this stage are breast bud development and menarche in girls
while testicular enlargement and seminal emission occurs in boys93
Middle adolescence (14-16 years) ndash In this stage rapid growth decreases and there is more
cognitive development as the adolescents move from concrete thinking to formal operation
and develop greater competence at abstract thinking91 This corresponds to Tanner stages 3
and 4
Late adolescence (17-19 years) ndash Here slowing of physical changes continue which permits
the emergence of a more stable body image Cognition tends to be less self-centered with
26
demonstration of care for others with increasing thought about concepts such as justice
patriotism and history It corresponds to Tanner stage 59092
ADOLESCENCE AND BLOOD PRESSURE
Adolescence is characteristically associated with increasing blood pressure because of the
physical growth and hormonal changes associated with puberty5794 After the age of one year
normal BP increases more during puberty than probably at any other time in an individualrsquos
lifetime95 Wanzhu Eckert and Saha et al57 examined data from a cohort of 182 normotensive
children in Indiana who had blood pressure measurements taken semi-annually for up to 12
yr The authors found that the rate of change in BP and weight peaked at the age of maximum
pubertal growth spurt (PGS) This BP spurt roughly coincides with growth spurt during
puberty94 Surveys of BP patterns from childhood through adolescence shows systolic and
diastolic pressures increase with age and in adolescents the increase in males is more marked
than in females especially the systolic pressure5458229495
CLASSIFICATION OF BLOOD PRESSURE IN ADOLESCENTS
The National High Blood Pressure Education Program Working Group (NHBPEPWG) of the
United States established guidelines for the definition of normal and elevated blood pressures
in children in 19876 These guidelines were revised in 20048 The definition of childhood
hypertension in the guidelines are based upon the normative distribution of blood pressure
(BP) in healthy children rather than clinical outcome data as in adults The guidelines
classified BP as normal prehypertensive or hypertensive Hypertension is graded into stage
one and two8
Normal BP - Blood pressure lt90th percentile for age sex and height Children and
adolescents with normal BP should be followed annually from the age of 3 years5 They
27
should be encouraged to maintain a healthy life style such as good dietary intake physical
activities and adequate rest8
Pre-hypertension - Blood pressure between the 90th and lt 95th or if BP exceeds
12080mmHg (even if lt90th percentile) but lt95th It was previously called high normal
BP This new description was introduced to help identify children at risk for the
development of persistent hypertension for whom targeted prevention programmes would
be most beneficial96 While recommendations for the diagnosis of hypertension in
children require that BP remains elevated on three separate occasions repeated
measurements are not necessary to classify an adolescent as pre-hypertensive11 The
prevalence of childhoodadolescence pre-hypertension in US is reported to be between
12-1796-98 In Nigeria Ejeke Ugwu and Ezeanyika99 in a study of the prevalence of
point prehypertension and hypertension in 843 adolescents in Lokoja reported a
prevalence of point prehypertension of 222 and 250 in semi urban and urban
communities respectively Ujunwa Ikefuna and Nwokocha et al100 reported 175
prehypertension prevalence among adolescents in Enugu Among adults with pre-
hypertension it is reported that as much as 10 per year develop hypertension101 There
is little information on the time course for children and adolescents with prehypertension
developing hypertension A value of between 11-7 per year has been reported in US
adolescents98 There is no known study on rate of progression of prehypertension to
hypertension in Nigerian adolescents The NHBPEP recommended that children with
pre-hypertension should have their BP checked after every six (6) months to monitor for
progression to hypertension They should be encouraged to engage in physical activity
healthy dietary behaviours and weight management if overweight Pharmacologic therapy
is not indicated except if there is strong evidence of renal disease heart failure left
ventricular hypertrophy or diabetes mellitus8
28
Hypertension Hypertension is BP persistently equal to or above the 95th percentile for
age sex and height measured on three or more separate occasions If the blood pressure
measurement obtained is gt 95th percentile the degree of hypertension should be staged
Stage 1 hypertension- BP value between the 95th and the 99th percentile plus 5mmHg It
is recommended that BP should be rechecked in 1ndash2 wks or sooner if the patient is
symptomatic If persistently elevated on 2 additional occasions it should be evaluated or
referred to source of care for pharmacologic treatment within 1 month 8
Stage 2 hypertension- BP value gt99th percentile plus 5mmHg This stage calls for more
prompt evaluation and commencement of pharmacologic therapy102 It is recommended
that the individual be evaluated or referred to source of care within 1wk or immediately if
the patient is symptomatic8
Aetiology of hypertension
Hypertension is classified as primary (essential) when there is no identifiable cause
or secondary if due to an underlying disease31 Factors such as heredity diet stress drugs and
obesity play a role in the development of essential hypertension103104 Causes of secondary
hypertension include umbilical artery catheterization renal diseases coarctation of the aorta
and endocrine disorders105106 Aderele and Sereki6 in their study of hypertension in children
reported hypertension secondary to renal pathology as the commonest cause of elevated BP
in children This study was mainly in preadolescent population in which secondary
hypertension is a common finding On the other hand Antia-Obong and Antia-Obong107
reported no apparent cause in greater than 90 of the studied subjects with elevated BP and
also reported proteinuria of 1 in the same population without any associated elevated blood
pressure The study did not however evaluate the etiology of the proteinuria A study65 of BP
in teenagers in Kano found family history of hypertension a risk factor in the study
population Another study in Enugu100 examined modifiable risk factors associated with
29
hypertension in 2694 adolescents and found only 1 and 06 of the hypertensive subjects
to be overweight and obese respectively The authors also found that smoking and alcohol
consumption were not significant risk for hypertension This may however be due to the
shorter period of consumption of these products by the students as a cumulative effect from
long term consumption is known to be associated with adverse health outcomes
Prevalence of hypertension in adolescents
The prevalence of hypertension in adolescents varies widely due to arbitrary and imprecise
definition by different researchers It was in view of this that the National High Blood
Pressure Education Program Working Group (NHBPEPWG) of the United States established
guidelines for the definition of normal and elevated blood pressures in children and
adolescents for uniformity68 In the USA the prevalence is about 20 in normal weight and
50 in their obese counterparts108 A prevalence rate of 77109 10554 and 223110 has
been reported in Spain Lebanon and South Africa respectively In Kano Nigeria a study65
on the prevalence of hypertension among 1000 teenagers found a prevalence of 72 Similar
study in Enugu100 on the prevalence of hypertension among 2694 secondary school
adolescents reported a hypertension prevalence of 54 It is of interest to note that different
prevalence was reported because of the different methodology used by the authors While the
study in Kano65 applied the adult blood pressure criterion of BP greater than 14090mmHg as
hypertension the study in Enugu100 used blood pressure greater than 95th percentile for age
and sex Also the study in Kano65 took a single set of measurement while the study100 in
Enugu measured blood pressure of the subject three times at weekly intervals Bugaje
Yakubu and Ogala21 on the other hand defined hypertension as blood pressure greater than
two standard deviations from the mean and also took six readings over thirty minutes and got
a prevalence of hypertension of 34 A prevalence rate of 48107 and 9522 in Southern
and Western region of the Nigeria respectively was also reported It is obvious that because
30
of the various defining criteria for hypertension in adolescents the prevalence of adolescent
hypertension remains imprecise
Clinical presentation- Hypertension is usually asymptomatic unless it has been
sustained or is rising rapidly109 Adolescents with essential hypertension are usually
detected during routine evaluation96 Non-specific symptoms such as lethargy headache
dizziness drowsiness visual disturbance and confusion may be present109 These could
also be signs of complications111 Secondary hypertension may show obvious features of
the underlying disease such as growth failure heat intolerance abdominal stria tremors
body swelling and haematuria8102 Croix and Feig112 studied the spectrum of symptoms in
409 children aged 7-18 years newly diagnosed hypertensive in Texas USA and reported
15 common symptoms than in the controls The symptoms were said to resolve after
commencement of antihypertensive medications The authors concluded that hypertensive
children had a variety of non-specific symptoms The three most common symptoms
reported were headache daytime tiredness and difficulty initiating sleep The study
however did not specify if other possible causes of these symptoms were excluded
Complications of hypertension - Hypertension is usually asymptomatic in adolescents
which if left unidentified overtime can cause serious complications109 Organs commonly
affected in the complication of hypertension are the heart kidneys brain and the eyes
leading to lowered life expectancy and premature death13 Left ventricular hypertrophy
(LVH) is the most prominent clinical evidence of end organ damage10 Studies have
shown that LVH can be seen in as many as 41 of patients even in adolescents with
asymptomatic hypertension10103 Adolescents with severe cases of hypertension are also
at increased risk of developing hypertensive encephalopathy seizures cerebrovascular
accidents and congestive heart failure103109 However data documenting such
complications in children and adolescents are generally lacking In a study of
31
hypertension among teenagers in Kano the researchers65 could not find any
complications in all the 1000 teenagers studied
Investigations and treatment- Basic investigations are all that may be required in
adolescents who are obese and with a family history of hypertension stage 1 disease and
normal findings on physical examination113 This is because primary hypertension is
commoner in adolescents Adolescents that are symptomatic or with stage 2 hypertension or
have features of secondary hypertension should be evaluated in more detail
Treatment of hypertension includes non-pharmacological and pharmacological
methods Non-pharmacologic management involves life style modification such as weight
reduction increased physical activities and dietary adjustment114 In a study to evaluate the
effect of diet and salt on treatment and prevention of hypertension Sacks Svetkey and
Vollmer et al86 reported the beneficial effect of both reduced salt intake and appropriate
dietary adjustment in the control of hypertension Similar benefits were reported in other
studies8788 Although both studies had fairly good sample size (n=412) the studies did not
specify if participants were on other substances or activities other than antihypertensive that
might have affected their BP The studies were also in adults and whether it has the same
effects in children and adolescents has not been evaluation However there is no doubt that
the outcome will be similar in adolescents as dietary modifications have been advocated as
non-pharmacologic management in them Non pharmacologic treatment is usually the initial
treatment in essential hypertension and as adjuvant to drug therapy in those with secondary or
complicated hypertension101114 Pharmacologic (drug) treatment includes diuretics beta-
blockers calcium channel blockers angiotensin converting enzyme inhibitors (ACEIs) and
angiotensin receptor blockers (ARB) among others106114 They are used in those with
symptomatic disease and in acute or chronic complications106
32
Prevention of hypertension may be viewed as part of the prevention of cardiovascular
disease102 In adolescents approaches to prevention include reduction in obesity
discouraging cigarette smoking and alcohol intake113 reduction in sodium intake and increase
in physical activity through community and school-based programmes103104 Growth
monitoring BP check during preventive care visit physical activity and urine screening for
proteinuria and haematuria can be used starting from early childhood
33
AIM AND OBJECTIVES
GENERAL AIM
To determine the blood pressure pattern of apparently healthy secondary school adolescents
in Jalingo Taraba State
SPECIFIC OBJECTIVES
To determine
1 Blood pressure pattern in relation to age and sex among adolescents aged 10-19
years
2 The relationship if any between blood pressure and the anthropometric parameters of
weight height BMI and waist circumference
3 The association between blood pressure and parental social-economic status
4 The point prevalence of prehypertension and hypertension in adolescents
34
MATERIALS AND METHODS
Study area
A cross-sectional survey of the blood pressure pattern of apparently healthy secondary
school adolescents aged 10-19 years was conducted in Jalingo over a six month period
from January to June 2014 Jalingo is the capital of Taraba State and lies within the
savannah belt of North Eastern Nigeria It lies between latitude 80 54rsquo north and longitude
110 21rsquo east and at an altitude of 360 meters above sea level115 Jalingo had a population of
118198 people18 The primary inhabitants are the Konas Mumuyes and Fulanis who are
mostly farmers Other indigenous ethnic groups include the Jukun Kuteb WurkumTiv
and host of other tribes The Ibos Hausas Yorubas among others are the non-indigenous
ethnic groups and are mostly civil servants and businessmen Jalingo has a tertiary health
centre the Federal Medical Centre Jalingo and the state specialist hospital It also has 15
private clinicshospital and many primary health care centres There are also tertiary
education institutions including Taraba State University As at 2013 there were 56
secondary schools in Jalingo 24 public and 32 private all of which were mixed schools
except one which is a girlsrsquo only school
Study design
The study was a cross sectional descriptive study of 1350 apparently healthy secondary
school adolescents in Jalingo
Ethical approval
Ethical approval for this study was obtained from the Scientific and Health Ethics Research
Committee of Ahmadu Bello University Teaching Hospital Zaria (Appendix 4) The Taraba
State Ministry of Education also gave the approval and permission to conduct the study in the
35
selected schools Consent was given by the studentsrsquo parents or guardian (Appendix 2) All
students whose parents gave consent voluntarily participated in the study
Sample size determination
The minimum sample size was calculated using the formula116
N=Z2 (pq) E2
Where N = minimum sample size
p = Prevalence of hypertension in adolescents A prevalence of 3421 was used
q = 1- p
E = margin of error tolerated =1
Z = 196 at 95 confidence level
N = 1962 x 0034 x (1-0034) 0012 = 1262
Therefore the minimum sample size was one thousand two hundred and sixty two
Allowance for non-responders of 5 63 extra subjects were added to the calculated
minimum sample size bringing the total to 1325 students To enhance representativeness of
the sample and to compensate for missing information and poorly filled proforma while
maintaining the sample size a total of 1350 was decided upon
Inclusion criteria
1 Students (ages 10-19 years) in the selected secondary schools
2 Students whose parents gave consent to participate in the study
3 Students who gave assent to participate in the study
Exclusion criteria
1 Students who had obvious skeletal deformities of the spine and legs which can affect
the height and ultimately the BMI
36
2 Students with known chronic disease (or history of such disease) like anaemia
chronic renal disease and cardiac disease because they are not apparently healthy and
these conditions could affect their blood pressure
3 Students with present or past history of chronic drug ingestion that can affect blood
pressure such as steriods and contraceptives
4 Students with high blood pressure already on antihypertensive
Pilot study
A pilot study was carried out in one of the schools a week before the commencement of
the study The school was selected by random sampling method using balloting and did
not participate in the main study The pilot study was carried out with the aim of
assessing the competence of the research assistants in the various measurements
following their training to ensure reliability It was also used to test the questionnaire
before its use during the main study and to provide information on the number of students
that can be measured in a day Consequently twenty students had their blood pressure
and anthropometry measured independently by the researcher and the research assistants
and data were compared using Students t-test There were no statistically significant
differences between the measurements The result of the pilot study is highlighted in
Table I It was also found that some parts of the questionnaire were not well understood
by most students and were adjusted appropriately in the main study (Appendix 1) The 20
students had their measurements done over a period of 3-4 hours (between 8am - 12noon)
by the researcher and the research assistants
Table I Result of pilot study
Variables Researcher Research t p
37
assistants
Mean(plusmnSD) SBP
mmHg
106(11) 104(12) 0550 0586
Mean(plusmnSD) DBP
mmHg
617(83) 63(10) 0450 0657
Mean(plusmnSD) Weight
kg
544(82) 527(122) 0520 0608
Mean(plusmnSD) Height m 16(01) 16(01) 0000 1000
Mean(plusmnSD) BMI
kgm2
198(36) 202(33) 0370 0716
Mean(plusmnSD) WC cm 692(72) 682(133) 0300 0769
Sampling method
Students were selected by multistage random sampling technique The list of secondary
schools obtained from the Taraba State Post Primary Schools Board served as the sampling
frame for schools There were 56 secondary schools 24 of which were public and 32 were
private schools a ratio of 113 Ten (10) schools were randomly selected by balloting four
(4) from public schools six (6) from private based on the number and approximately similar
ratio of private to public schools of 115 (46) Ten schools were selected to ensure wider
coverage and even distribution of students so that it could be truly representative of the
community All the ten schools had an overall total of eight thousand one hundred and seven
(8107) students The public schools had a total of five thousand nine hundred and forty
(5940) with nine hundred and eighty nine (989) students participating The private schools
had a total of two thousand one hundred and sixty-seven (2167) students with three hundred
and sixty one (361) participating These number (989 and 361) was calculated based on the
38
relative population of each school and proportionate to number of students in each school
Thereafter the number of students to participate per school was calculated proportionately to
the number of students in each school based on the number given by the school authority
Then the number in each class was also calculated proportionately from JSS1 to SS3 to
ensure fair and equal chance of participation for all age groups The calculation was done
thus n= a b x c
Where n= number of students per selected school
a= total numberpopulation of students in the school
b= total numberpopulation of students in all 10 selected schools (8107)
c= calculated total sample size (1350)
Students in each class from junior secondary school (JSS) 1-3 and senior secondary school
(SS) 1-3 were then randomly selected by balloting The number of selected schools total
number of students in a school and the number of students selected per school is outlined in
Table II
Table II Selected schools and number of students in each of the ten schools in Jalingo
Selected schools Total no of No of students
39
student in the
school (a)
n=8107
selected (n=abxc)
n=1350
Public schools
Govt Science Secondary School 2800 466
Govt Day Secondary School SGari 1200 200
Salisu Dogo Secondary School 1100 183
Govt Secondary School Magami 840 140
Total 5940 989
Private schools
Winners Comprehensive Secondary School 650 108
Hawai Secondary School 562 94
Centre for Quranic Science and Islamic Education 543 90
Good Success Secondary School 155 26
Jetters Academy 140 23
Yagai Academy 117 20
Total 2167 361
The study
The first contact with the students was a familiarization exercise to each of the schools during
which the teachers and students were given a talk by the researcher on blood pressure and the
40
importance of periodic blood pressure measurement They were given the opportunity to ask
questions which were responded to Both the students and their teachers actively participated
in the lectures
On the second day students were selected as described above and those selected
underwent general physical examination in the presence of a chaperon to identify those
who did not fulfilled the inclusion criteria Each selected student was given a proforma
(Appendix 1) in which information on their biodata and medical history were recorded
Other information obtained was parentrsquos medical history and their socioeconomic status
using the format described by Olusanya Okpere and Ezimokhai117 (Appendix 3) The
study was carried out in a relatively quiet and empty classroom to ensure privacy for both
male and female students The procedure for blood pressure measurement was
demonstrated on one of the research assistants and sometimes on one of the teachers by
the researcher to assure the students and allay their anxiety BP and anthropometric values
obtained were recorded in the study proforma An average of 15-20 students per day were
attended to over a period of 3-4 hours (between 8am - 12noon daily) by the researcher
one of the research assistants who is a medical officer a male nurse and a lady Youth
Corper (NYSC)
Blood pressure measurement
This was measured by the researcher and the research assistant (the medical officer) The
standard auscultation method was employed using a mercury sphygmomanometer (Acosson)
and a standard Littman stethoscope according to the guideline of the fourth report on the
diagnosis evaluation and treatment of hypertension in children and adolescents8 Each
students was rest-seated for 5 minutes before BP measurement With the student seated the
right arm rested on a table at the level of the heart an appropriate cuff size which covered
41
two-third (23rd) of the length of the arm was applied round the arm about 2cm above the
antecubital fossa Two cuff sizes were used for this study with dimensions of 10 x 24cm and
13 x 30cm the smaller cuff for the smaller adolescents and vice versa The bladder cuff was
inflated rapidly to 20-30mmHg above the point where the brachial artery was no longer
palpable The bell of the stethoscope was then placed over the brachial artery and the cuff
was deflated slowly at 2-5mmHgsecond while listening to the Korotkoff sounds Phases one
and five of the Korotkoff sounds were recorded as the systolic and diastolic BP
respectively119 Three recordings were taken at intervals of 3-5 minutes and the average was
the final BP in mmHg BP was interpreted based on the standard set by the fourth report on
the diagnosis evaluation and treatment of hypertension in children and adolescents of the
United States8 thus-
Normal BP ndash BP value between the 5th and lt 90th percentile for age sex and height
Prehypertension - BP value between the 90th and the lt95th percentile for age sex and height
or BP of 12080mmHg but less than the 95th percentile
Hypertension ndash BP value ge95th percentile for age sex and height
Students found to have prehypertension were educated and counseled on life style
modifications and the need to have their blood pressure checked in six monthsrsquo time and
annually subsequently Those with hypertension were educated on the implications of the
findings and were referred to the Federal Medical Center Jalingo for evaluation management
and follow-up
Height measurement
Height was measured in centimeters using a locally constructed stadiometer by the research
assistants Each student was measured barefooted standing with the heel back and occiput
42
against the stadiometre The head was held straight looking forward with the lower border of
the eye socket at a horizontal plane with that of the external auditory meatus The movable
part of the stadiometre was adjusted to rest on the vertex and the corresponding value read to
the nearest 01cm
Weight measurement
The weight was measured in kilograms by the researcher and the research assistants using a
bathroom scale (HANSON) Students were weighed in their approved school uniform
without caps head ties or cardigan and with their shoes removed The scale was checked
daily for accuracy using standard calibrated weight before and midway through each session
The weight of the student was measured to the nearest 01 kg
Body mass index (BMI)
This was calculated from the measured weight and height of the subject using the
formula118
BMI= Weight (kg) Height (m2)
Waist circumference measurement
WC was measured in centimeters using a measuring tape by the research assistants The
male assistant measured for boys and the lady Youth Corper measured for girls
Measurement was taken with the student standing completely relax and breathing
normally Clothing was pulled up or down and an inelastic measuring tape was placed
around the waist mid-way between the iliac crest and the lowest rib margin The ends of
the tape were pulled together lightly towards each other and the value read to the nearest
01cm117120
43
Data analysis
Data obtained were analyzed using Epi-Info statistical software package version 7 The
results obtained were presented in figures tables graphs and charts as appropriate Individual
mean BP levels were used as dependent variables and other measured variables as
independent variables The means and standard deviations were used to summarize
quantitative variables such as BP weight height waist circumference and BMI The chi-
squared test was used to test the significance of associations between categorical variables
Studentrsquos t-test was used to compare means of any two normally distributed continuous
variables Pearsonrsquos correlation coefficient and regression analysis were used to examine the
strength of association between BP and the anthropometries Probability level of statistical
significance value was set at lt005
RESULTS
General characteristics
A total of 1350 students were enrolled between January and June 2014 to determine their
blood pressure pattern 628 (465) were males and 722 (535) were females with
malefemale ratio of 111 Students enrolled in the study were drawn from both public and
44
private schools The number of students from public schools was 989 (733) while 361
(267) were from private schools as shown in Table II The mean age of the study subjects
was 153plusmn22 years with a range of 10-19 years The age and sex distribution of the students
is illustrated in Table III
Table III Age and sex distribution of 1350 study subjects in Jalingo
Ag
e
Male
n ()
Female
n ()
Total
N()
10 9(14) 13(18) 22 (16)
11 20(32) 31(43) 51(38)
12 36(57) 52(72) 88(65)
13 96(153) 85(118) 181(134)
14 92(146) 115(158) 207(153)
15 92(146) 111(154) 203(151)
16 66(105) 116(161) 182(135)
17 78(125) 91(126) 169(125)
18 79(126) 70(97) 149(110)
19 60(96) 38(53) 98(73)
To
tal
628(100) 722(100) 1350(100)
45
Socio-economic classes (SEC) ndash Most of the students were from the lower social classes
(4 and 5) with population of 650 (415 and 235) students The upper social classes (1 and
2) had the least population with 184 (62 and122) students The middle social class (3) had
516 students The distribution of the study subjects according to individual
socioeconomic class is shown in Figure I
Figure 1 Socioeconomic class distribution of students in Jalingo
Anthropometry
The anthropometric characteristics of the students are displayed in Tables IV V and VI
All the anthropometric parameters showed increasing values with age (Tables V and VI)
There were significant differences in the anthropometric indices of height (p=0000)
weight (p=0010) and body mass index (p=0000) between boys and girls but not
statistically significant for waist circumference (p=0145) as shown in Table IV
Weight ndash The mean weight of the students was 486plusmn109kg with a range of 23-100kg
(Table IV) Girls were heavier than boys up to middle adolescence after which males
46
were heavier than the females (Table V and VI) and this was statistically significant (t= -
256 p=0010)
Table IV Overall mean anthropometric measurements of the study subjects
Anthropometr
y
Male Female Total
n=628 n=722 N=1350 t p
Wt (kg)
Mean(plusmnSD) 4773(115
)
4926(103
)
4855(plusmn109
)
-
25
6
0007
Range 236-848 227-100 23-100
Ht (m)
Mean(plusmnSD) 159(012) 157(008) 158(plusmn010) 35
5
0000
Range 122-185 126-179 122-185
WC (cm)
Mean(plusmnSD) 6524(91) 6595(86) 6562(plusmn89) -
14
6
0145
Range 225-905 215-100 22-100
47
BMI (kgm2)
Mean(plusmnSD) 1825(27) 1947(33) 1891(plusmn31) -
74
1
0000
Range 117-325 114-42 114-42
Statistically significant p values at 005 level of significance Wt=Weight Ht=Height WC=Waist
Circumference BMI=Body Mass Index SD=Standard Deviation
Height- The mean height of the study population was 158plusmn09m and ranged from 122-
185m (Table IV) Girls were taller than boys at early and middle adolescence but these
reversed from 16 years in favour of the boys (Table V and VI) This differences was
statistically significant (t=448 p=0000)
Waist circumference (WC) - The overall mean waist circumference was 6562plusmn89cm and
a range of 225-100cm Girls had higher WC until late adolescence (18 years) when it
reversed but this was not statistically significant (t=-146 p=0145) This is displayed in
Tables IV V and VI
Body Mass Index (BMI) - Overall mean BMI was 189plusmn31 with a range of 114-42
There was a statistically significant difference between girls and boys (t=-741 p=0000)
Tables IV V and VI illustrate this findings
Table V Mean anthropometric measurements of 628 boys
Age No of
studen
ts
Wt(plusmnSD)
Kg
Ht(plusmnSD)
m
WC(plusmnSD)
cm
BMI(plusmnSD)
Kgm2)
48
10 9 349(50) 143(001
)
613(06) 169(01)
11 20 354(25) 143(002
)
617(13) 170(07)
12 36 363(51) 146(002
)
616(14) 167(06)
13 96 379(51) 150(003
)
602(40) 165(08)
14 92 412(50) 154(003
)
623(32) 169(08)
15 92 471(60) 160(003
)
634(39) 178(08)
16 66 525(52) 164(002
)
672(24) 192(09)
17 78 555(51) 167(002
)
680(31) 197(08)
18 79 576(61) 169(002
)
707(18) 200(08)
19 60 590(57) 170(002
)
716(16) 203(07)
Total 628 477(115 16(01) 652(91) 183(27)
49
)
Wt=Weight Ht=Height WC=Waist Circumference BMI=Body Mass Index SD=Standard Deviation
Table VI Mean anthropometric measurements of 722 girls
Age No of
students
Wt(plusmnSD)
Kg
Ht(plusmnSD)
m
WC(plusmnSD)
cm
BMI(plusmnSD)
Kgm2
10 13 313(34) 139(001) 582(05) 156(02)
11 31 361(53) 144(002) 611(12) 170(05)
12 52 403(64) 149(002) 625(21) 178(09)
13 85 458(66) 154(002) 657(22) 188(12)
14 115 478(74) 157(003) 627(48) 187(10)
15 111 508(65) 159(002) 666(34) 199(13)
16 116 521(60) 159(002) 678(28) 201(11)
17 91 541(62) 161(002) 681(28) 203(11)
18 70 556(63) 161(002) 696(21) 211(11)
19 38 540(48) 158(002) 688(14) 208(06)
Total 722 493(103) 16(010) 651(23) 190(09)
Wt=Weight Ht=Height WC=Waist circumference BMI=Body Mass Index SD=Standard Deviation
Blood pressure (BP) measurements
50
Table VII shows mean blood pressure distribution of the study population for all ages
The highest SBP and DBP were 165mmHg and 95mmHg at 18years and 15 years
respectively Table VIII displays mean BP distribution in relation to age and sex The
tables show that both systolic and diastolic blood pressure increased with age This is also
depicted in Figure 2
Table VII Mean and ranges of blood pressure of 1350 subjects
Systolic Blood Pressure
(mmHg)
Diastolic Blood Pressure
(mmHg)
Age
No of
students
Mean(plusmnSD) Range
Mean(plusmnSD) Range
10 22 936(74) 80-107 600(50) 47-70
11 51 992(106) 76-120 629(71) 47-83
12 88 1036(110) 80-140 657(60) 53-82
13 181 1042(108) 80-143 660(74) 48-88
14 207 1070(115) 83-150 675(76) 47-90
15 203 1090(119) 80-150 678(82) 47-95
16 182 1122(124) 80-150 696(80) 50-90
51
17 169 1132(118) 90-153 698(83) 48-93
18 149 1138(121) 90-165 712(88) 50-90
19 98 1131(127) 90-143 726(76) 57-90
Total 1350 1089(125) 76-165 683(82) 47-95
Table VIII Mean blood pressure in relation to age and sex
Mean(plusmnSD) Systolic blood pressure
(mmHg)
Mean(plusmnSD) Diastolic blood
pressure (mmHg)
A
ge
Male
n=628
Female
n=722
t p Male
n=62
8
Fema
le
n=72
2
t p
52
10 954(3
9)
923(6
0)
1
02
03
20
619(
32)
586(
46)
1
36
0
01
91
11 985(5
5)
997(9
2)
0
42
0
06
80
648(
39)
617(
57)
1
56
0
01
26
12 999(8
9)
1062(
117)
2
84
0
00
06
653(
29)
660(
52)
-
0
52
0
06
07
13 1012(
73)
1075(
73)
4
03
4
00
00
649(
43)
672(
59)
-
0
03
0
00
44
14 1036(
78)
1098(
78)
3
93
0
00
01
653(
44)
693(
58)
3
90
0
00
01
15 1071(
80)
1105(
87)
2
05
0
00
42
665(
58)
689(
56)
-
2
10
0
00
37
16 1135(
82)
1114(
91)
1
03
0
03
10
697(
51)
695(
61)
0
15
0
08
81
53
17 1152(
87)
1115(
77)
2
04
00
43
698(
59)
698(
58)
0
02
0
09
81
18 1141(
96)
1135(
74)
0
27
0
07
91
704(
62)
721(
63)
1
61
0
02
49
19 1146(
97)
1108(
80)
1
41
0
01
64
733(
63)
714(
43)
1
21
0
02
28
To
tal
1081(
133)
1095(
117)
-
2
05
4
00
40
678(
81)
687(
82)
-
2
07
7
00
38
Statistically significant p values at 005 levels of significance
54
Figure 2 Blood pressure distribution in relation to age and sex
SBP =Systolic blood pressure DBP=Diastolic blood pressure
Blood pressure and stages of adolescence
Table IX displays mean blood pressure according to stages of adolescence Girls had a
higher mean SBP than boys from early adolescence (t=3754 p=0000) to middle
adolescence (t=-3025 p=0003) and this was statistically significant This dominance was
also demonstrated in the DBP and was statistically significant in middle adolescence (t=-
3517 plt0000) Adolescents from private schools had higher mean SBP (t=-222
plt0027) and mean DBP (t=-461 p=0000) than those from public schools and these
differences were statistically significant
Table IX Mean blood pressure according to sex and stages of adolescence
Mean BP
(mmHg)
Age (years)
Male SBP
Female SBP
Male DBP
Female DBP
55
Stages
of
adolesc
ents
(years)
Mean(plusmnSD) systolic blood pressure
(mmHg)
Mean(plusmnSD) diastolic blood pressure
(mmHg)
Male Female t p Male Fema
le
t p
Early
(10-13)
1000(9
6)
1040(1
18)
37
54
00
00
648(
56)
653(
82)
05
99
05
50
Middle
(14-16)
1075(1
29)
1105(1
13)
-
30
25
00
03
670(
81)
694(
77)
-
35
17
00
00
Late
(17-19)
1140(1
28)
1121(1
11)
21
45
00
33
717(
85)
710(
83)
00
70
09
45
1082(1
33)
1092(1
17)
-
20
54
00
40
678(
81)
687(
82)
-
20
77
00
38
Statistically significant p values at 005 level of significance SD=Standard Deviation
Table X shows blood pressure pattern according to stages of adolescence
Prehypertension and hypertension were more prevalent in late adolescence than early and
middle adolescence (χ2=49054 p=0000) and (χ2=10305 p=0006) both of which were
statistically significant
Table X The pattern of normal BP Prehypertension and hypertension according to stages
of adolescence
56
Blood
pressure
pattern
Stages of adolescence
Early
n()
Middle
n()
Late
n()
Total
N()
χ2 p
Normal 290(84
8)
428(72
3)
275(66
1)
993(73
5)
429
79
000
0
prehypertens
ion
43(12
6)
135(22
8)
120(28
8)
298(22
1)
490
54
000
0
Hypertensio
n
9(26) 29(49) 21(51) 59(44) 103
05
000
6
342(10
0)
592(10
0)
416(10
0)
1350(1
00)
350
93
000
0
Statistically significant p value at 005 level of significance
Relationship between blood pressure and the measured anthropometry
There was a positive correlation between SBP and DBP with age and the anthropometric
variables of weight height waist circumference and BMI (Table XI) SBP showed a
stronger correlation with the anthropometries than the DBP and was stronger for weight
(r=051) and height (r=044) The waist circumference though statistically significant
showed the weakest correlation
Table XI Correlation between blood pressure age (yrs) and anthropometry
Parameters
Systolic Blood Pressure Diastolic Blood Pressure
Correlation
coefficient
p Correlation
coefficient
p
57
Age (yrs) 035 lt0000 030 lt0000
Height (m) 044 lt0000 034 lt0000
Weight (Kg) 051 lt0000 038 lt0000
WC (cm) 040 lt0000 029 lt0000
BMI
(Kgm2)
031 lt0000 023 lt0000
Statistically significant p values at 005 level of significance Wt=Weight Ht=Height WC=Waist
circumference BMI=Body Mass Index
Blood pressure distribution and socio-economic classes
Table XII shows mean blood pressure according to socio-economic class of the subjects
Lower social classes had higher mean SBP (t=1650 p=2850) and DBP (t=0193
p=00058) but these were not statistically significant
Table XII Mean Blood pressure in relation to socioeconomic classes
Blood
pressur
e
Socioeconomic classes
Upper (1 amp
2) n=184
Middle (3)
n=516
Lower (4 amp
5)
n=650
f(anova
)
p
Mean
(SD)
10857(126
)
10866(128
)
11040(109
)
1650 285
0
58
SBP
Mean
(DBP)
6820(83) 6791(83) 6957(76) 0193 005
8
SEC= Socioeconomic class SBP=Systolic Blood Pressure DBP=Diastolic Blood Pressure SD=Standard
Deviation
Table XIII shows blood pressure pattern in relation to socioeconomic classes of the
subjects The percentage of students with prehypertension was higher in the upper social
class ((χ2=3067 p=0216) while the percentage of hypertension were higher in the lower
socioeconomic classes (χ2=1037 p=0568) but these differences were not statistically
significant
Table XIII Blood pressure pattern in relation to socioeconomic status
Blood
pressure
pattern
Socioeconomic classes
Upper
(1 amp 2)
n()
Middle
(3)
n()
Lower
(4 amp 5)
n()
Total
N()
χ2 p
Normal 127(69
)
383(74
2)
483(74
3)
993(73
6)
417
6
012
4
Prehypertens
ion
52(28
3)
108(20
9)
138(21
2)
298(22
1)
306
7
021
6
Hypertension 5(27) 25(48) 29(45) 59(44) 103 056
59
7 8
184(10
0)
516(10
0)
650(10
0)
1350(10
0)
573
0
022
0
Prevalence of Hypertension and Prehypertension
Table XIV shows the prevalence of hypertension in the study population The total
number of students with hypertension was 59 giving an overall prevalence of 44
Thirty four students (25) had systolic hypertension sixteen (12) had diastolic
hypertension and nine students (07) had both systolic and diastolic hypertension
Systolic hypertension was more prevalent in the females and was more at the age of 16
years while diastolic hypertension was higher in males and this also occurred at 16 years
Among those with hypertension 27 and 16 subjects had stage 1 and 2 systolic
hypertension respectively With regard to diastolic hypertension 24 and 1 subjects had
stage 1 and 2 hypertension respectively The gender difference in the prevalence of
hypertension is not statistically significant (χ2=0831 p=0362)
The number of students with pre-hypertension was 298 giving an overall prevalence of
221 Of this 131 were males and 167 are females This is illustrated in Table XIV
Prehypertension is more prevalent in females than males and this was statistically
significant (χ2=4349 p=0037)
60
Table XIV Overall Blood pressure pattern and prevalence of hypertension and
prehypertension of 1350 students in Jalingo
Blood pressure
pattern
Males
n=()
Females
n=()
Total
N()
χ2 p
Normal 471(750) 522(723) 993(735) 2619 0106
Prehypertension 131(209) 167(231) 298(221) 4349 0037
Hypertension 26(41) 33(46) 59(44) 0831 0362
628(100) 722(100) 1350(100) 1260 0533
statistically significant p value at 005 level of significance
61
DISCUSSION
The findings of this study showed that the BP of secondary school adolescents in Jalingo
was similar in terms of mean values range and trend of progression with age to that of
other adolescents from Ibadan63 and Kogi60 (Nigeria) Ashanti (Ghana)59 and Lebanon54
The mean value was however lower than the mean BP of adolescents from Zaria
(Nigeria)21 Belgrade ( Serbia)78 and Fortaleza-Cearaacute (Brazil)83 who had higher mean BP
in both sexes and at all ages The lower mean BP in this study compared to that of
adolescents from Zaria21 Belgrade78 and Brazil83 could be due to lower mean
anthropometry of weight height and BMI in adolescents from Jalingo resulting in lower
mean BP The sample sizes of these studies7883 were also different and could have
affected the mean BP of the study population For instance the sample size in the
Brazilian study83 is 151 compared to the study in Lebanon54 with 5710 subjects The use
of the fifth Korotkoff sounds as DBP in this study21 could also have accounted for the
lower mean BP in contrast to a similar study in Zaria21 where the fourth Korotkoff sound
was used as the DBP
A progressive increase in blood pressure with age was found in this study This
was similar to most findings by researchers in Nigeria 215358-606566107 and
worldwide54555961 The peak age of rise in BP in this study was in middle adolescence
between 15-16 years in boys but much earlier in girls for both systolic and diastolic BP
This was similar to the study by Akinkugbe Akinwolere and Kayode56 in Ibadan and
Ejeke Ugwu and Ezeanyika et al60 in Lokoja This age group is usually the period of
onset of puberty The chronologic age is not the main factor responsible for BP increase
62
with age but rather the progressive increase in size of the individual Increase in body
size with growth and maturity of organs associated with the physical and hormonal
changes during puberty potentially lead to increasing BP The simultaneous increase in
weight height and other anthropometric indices alongside BP with age seen in this study
and others is in agreement with that The implication of this increase in blood pressure
with age is that those with prehypertensionhypertension in childhood may continue into
adulthood hence further increasing the high prevalence of hypertension in the adult
population with its attendant morbidity disability and mortality
Overall significant higher mean BP was recorded in girls than boys in this study
This was seen from early to middle adolescence after which it reversed in favour of the
boys Reports on the relationship between BP and sex have been inconsistent Some have
reported higher mean BP in females54-56 others higher in males5883 while yet another
reported no sex differences22 The findings of this study were similar to those of Bugaje
Yakubu and Ogala21 and Ujunwa Ikefuna and Nwokocha100 who reported a consistently
higher mean blood pressure in female adolescents up to 16 years compared to their male
counterparts of similar ages Early female predominance in mean blood pressure was also
reports by Agyemang Redekop and Owusu-Dabo et al59 in Ashanti adolescents in Ghana
and Obika Adedoyin and Olowoyeye22 in Illorin The finding was however in contrast
with the study in Calabar58 where higher mean BP was found in boys than girls at all
ages The reason for the higher mean BP in females than boys could be because of earlier
onset of puberty in girls The differences in blood pressure between boys and girls in this
study could also be accounted for by variation in the anthropometric variables of the
individuals as girls were seen to be heavier and taller up to middle adolescence
This study demonstrated a consistently positive relationship between blood
pressure and the anthropometric variables of weight height body mass index and waist
63
circumference as widely reported in other studies 545558-6165107100 Weight is reported to
correlate positively with blood pressure in several studies53565871 Body mass index
(BMI) also showed a positive relation with BP in this study as reported in other
studies5978-81 This is in-keeping with the findings in Port Hacourt71 Abeokuta83 the
Gambia69 Brazil82 and Belgrade77 children Some of these studies however were made
up of younger and older age groups Even in lean populations BMI is known to correlate
positively with BP Waist circumference was also found in this study to correlate
positively with BP This was similar to reports from other studies79-8183 It was found to
be a better predictor of BP in two Italian study8081 while it was not in another82
Comparing BMI and waist circumference and their effects on BP Arauzo Lopes and
Moriera et al82 in Brazilian children found BMI to be a better predictor of BP than waist
circumference This was similar to the report by Sebanjo and Oshikoya83 in Nigerian
adolescents in Akure Guagnano Ballone and Colagrande et al81 however found waist
circumference to be better than BMI The study81 however involved adults and may not
be applicable in children and adolescents The present study demonstrated BMI and WC
to be significant but found BMI to be a better determinant of BP than waist
circumference BMI and waist circumference measure obesity in an individual Whereas
BMI is a measure of overall obesity WC measures centralabdominal fat accumulation
and thus said to be more predictive of adverse health risk79 Obese individuals may be
prone to such condition as dyslipidaemia insulin resistance and hypertension with
reduction in the quality of life Weight BMI and or waist circumference affects blood
pressure through decreased physical activity increased cardiac output insulin resistance
impaired pulmonary function and other hormonal abnormalities8084 It seems therefore
that BMI is a better predictor of BP in adolescents than waist circumference The reason
64
for this is not obvious but it may be because of the nature of uniform fat distribution in
adolescents associated with growth and hormonal changes at puberty
Blood pressure distribution in relation to the parental socio-economic class in this
study showed that students from low socio-economic classes had higher mean blood
pressure than those from upper socioeconomic classes but this was not statistically
significant A study in Ibadanl56 reported a statistically significant negative relation
between blood pressure and parental socio-economic status It was also similar to the
study58 in Calabar In contrast other studies found the reverse536022 The reasons for the
inverse relationship between BP and socioeconomic includes exposure to chronic
environmental stress with sustained sympathetic nervous system stimulation Others are
poor health seeking behaviours due to low income andor inadequate health knowledge
high low birth weight rate and inadequate healthy diets among others97101 In the same
environment individuals from a high social class are believed to be more educated with
high income61 They have easy access to health education and awareness on hypertension
prevention and control and better accessibility and adherence to medical treatment617374
The former might be responsible for the finding of this study as Jalingo is a semi urban
community Most of its inhabitants are subsistent farmers civil servants and traders with
low income The high number of students in the lower socioeconomic class lays credence
to that
The overall point prevalence of hypertension in this study was 44 while that of
pre-hypertension was 221 This prevalence of hypertension is similar to the prevalence
of 48 by Antia-Obong and Antia-Obong107 but higher than the prevalence rate of 37
reported in Zaria21 and lower than the prevalence of 58 reported in Ibadan56 54 in
Enugu100 and the 72 reported in Kano65 The prevalence of pre-hypertension was lower
than that reported by Ejeke Ugwu and Ezeanyika99 who found a prehypertensive
65
prevalence of 25 among adolescents in Lokoja It is higher than the 173 reported by
Ujunwa Ikefuna and Nwokocha et al100 in Enugu and 12-17 by Redwine and
Daniels96 among US adolescents The differences in the reported prevalence of
hypertension and prehypertension in adolescents could have resulted from the different
criteria applied by the various researchers in defining hypertension For instance whereas
this study used BP greater than 95th percentile as hypertension a study in Kano65 used the
adult hypertensive value of BPgt14090mmHg as hypertension and got a prevalence of
72 The prevalence in that study65 could have been higher if the percentile or the
statistical definition was used as many children with BP 14090mmHg would probably be
at stage 2 hypertension This was demonstrated in the study by Bugaje Yakubu and
Ogala21 who found a prevalence of hypertension in their study to be 06 when the adult
cut off value of gt14090mmHg was used but it increased to 37 when the statistical
definition of BPgt 2 standard deviations was used
The number of times blood pressure is taken could affect the outcome as repeated
measurements over a time interval is known to give lower BP values than if BP is taken
once This study used the average of three blood pressure values taken at one sitting but
Ujunwa Ekefuna and Nwokocha100 took three readings at five minutes interval with two
other readings at a week interval In that study100 the prevalence of prehypertension
dropped from 745 during the first set of readings to 173 after the third week
readings The prevalence of hypertension also dropped from 135 to 54 over the same
period Similar decrease in the prevalence of both prehypertension and hypertension was
reported by Redwine and Daniels96 in US adolescents when blood pressure was taken
over time interval Another factor which might have affected the overall prevalence is the
Korotkoff sound used for diastolic pressure23 The 4th or 5th Korotkoff sounds has been
used by different researchers resulting in different diastolic BP The study21 in Zaria used
66
the 4th Korotkoff sound while most other researchers2265100 used the 5th About 5-
10mmHg difference is said to exist between the 4th and 5th Korotkoff sounds230 In this
study the 5th Korotkoff sound was used thus giving a higher prevalence of hypertension
in the studied population than in those where the 4th sound was used
The implication of the outcome of this study is that 44 of adolescents in Jalingo
are already hypertensive while 221 of them are at risk of developing hypertension as
they are pre-hypertensive Since 856 (255 of 298) of the prehypertensives were in the
middle and late adolescence these individuals are likely to be adults with high blood
pressure Therefore regular screening of this group of individuals who were assumed to
be a healthy population is highly important for early detection of hypertension and
intervention such as life style changes and treatment
67
CONCLUSIONS
The following conclusions can be made from this study
1 The mean and range of blood pressure of adolescents in Jalingo was similar to
those of other adolescents in Nigeria and other parts of the world Blood pressure
increased progressively with age
2 All measured anthropometry of weight height body mass index and waist
circumference correlated positively with BP but weight was the most significant
variable in BP determination
3 Socioeconomic status was not significantly related with blood pressure
4 The point prevalence of hypertension and pre-hypertension was 44 and 221
respectively using a recommended definition
RECOMMENDATIONS
1 In view of the high prevalence of prehypertension in this study it is recommended
that students should have their blood pressure measured at school entry as this will
68
help identify those with abnormal BP for early intervention Thereafter BP check
should be offered at least once a year at the beginning of a new session especially for
those found with abnormal BP at school entry
2 Physical and health education should be revived in all the schools This will lead to
increased physical activity and reduced risk of obesity and its consequences
3 School health programmes should be strengthened in schools where it already exist
and effort made to establish same in schools where it is yet to exist The programme
should include measures to detect early prehypertension and hypertension and other
health related needs of the students
LIMITATIONS
The following limitations were encountered in the course of the study
1 Exclusion and inclusion of students that were based on volunteered information and
physical evaluation This could have led to inclusion andor exclusion of adolescentss
69
with or without background renal diseases which could have affected the result of this
study
2 Home blood pressure measurement especially early morning measurement for those
with high blood pressure to possibly eliminate the effect of stress traffic andor
trekking and other school related stresses which may affect blood pressure during the
day
LINES OF FUTURE RESEARCH
This study was questionnaire based and time bound Consequently students were not
investigated for background diseases co-mordid conditions target organ damage or risk
factors for high blood pressure They were also not followed up In view of this future
research on blood pressure in adolescents should include-
70
1 Investigations such as urinalysis electrolytes urea and creatinine random blood
sugar (RBS) lipid profile and echocardiography as part of blood pressure evaluation
in adolescents
2 A long period of study to allow for follow-up over months or years to identify those
that are truly hypertensive considering the definition of hypertension It will also
reveal the rate of progression from pre-hypertension to hypertension
3 Risk factors evaluation for high blood pressure including genetic predispositions
REFERENCES
1 Blood pressure from Wikipedia the free Error Hyperlink reference not valid
Accessed 24th November 2011
2 Pickering TG Hall JE Appel LJ Falkner BE Graves J Hill MN Jones DW Kurtz T
Sheps SG Roccella EJ Recommendations for blood pressure measurement in humans
and experimental animals Part 1 Blood pressure measurement in humans A
statement for professionals from the subcommittee of professional and public
71
education of the American Heart Association council on high blood pressure research
Hypertension 2005 45 142-61
3 da Silva IRR de Souza MDG de Camargo CAC Blood pressure measurement in
children and adolescents Guidelines of high blood pressure recommendations and
current clinical practice Arq Bras Cardiol 2007 88 434-7
4 Sinaiko AR Hypertension in children N Engl J Med 1996 3351968-73
5 US Preventive Services Task Force Screening for high blood pressure
recommendations and rationale Am J Prev Med 2003 25 159-64
6 Report of the second task force on blood pressure control in children Pediatrics 1987
79 1-25
7 National high blood pressure education programme working group on hypertension
control in children and adolescents update on the 1987 task force report on high blood
pressure in children and adolescents A working group report from the national high
blood pressure education program Pediatrics 1996 98 649-58
8 National high blood pressure education program working group on high blood
pressure in children and adolescents The fourth report on the diagnosis evaluation
and treatment of high blood pressure in children and adolescents Pediatrics 2004
114 255-76
9 Aderele WI Seriki O Hypertension in Nigerian children Arch Dis Child 1974
49313-7
10 Bo S Gambino R Gentile L Pagano G Rosato R Saracco GM Cassader M
Durazzo M Cavallo-Perin P High-normal blood pressure is associated with a cluster
of cardiovascular and metabolic risk factors a population based study J Hypertens
2009 27 102-8
72
11 Bao W Threefoot SA Srinivasan SR Berenson GS Essential hypertension
predicted by tracking of elevated blood pressure from childhood to adulthood The
Bogalusa Heart Study Am J Hypertens 1995 8 657- 65
12 Richard A Rodgers M Hedley AJ Mitchel JRA Changes in blood pressure and
blood lipid during adolescence BMJ 1980 28 1563-6
13 Sundstroumlm J Neovius M Tynelius P Rasmussen F Association of blood pressure in
late adolescence with subsequent mortality cohort study of Swedish male conscripts
BMJ 2011 342 643-8
14 Zimmet P Alberti G Kaufman F Tajima N Silink M Arslanian S Wong S Bennett
P Shaw J Caprio S On behalf of the International Diabetes Federation Task Force on
Epidemiology and Prevention of Diabetes The metabolic syndrome in children and
adolescents the IDF consensus Diabetic Voice 20075229-32
15 Abdulrahman FA Babaoye AA Childhood hypertension in northern Nigeria West
Afr J Med 1978 1 7-11
16 Adediran O Jimoh A Di M Relationship between body mass index and blood
pressure in rural Nigerian dwellers Internet J Nutri Wellness 2009 7 431-4
17 World Health Organization (WHO)UNICEF Adolescence at a glance 2003 p 2
18 The National Population Commission constitution of the Federal Republic of Nigeria
(AP 23 LFN) legal notice on publication issued April 21st 2007
19 Heald FP and Gong EJ Diet Nutrition and adolescents In Shils ME and Ross AC
(eds) Modern Nutrition in Health and Disease 9th ed William and Wilkins
Maryland USA 1999 p 32
20 Okonkon CT The prevalence of Hypertension among civil servants in Calabar Nig
Med J 1979 7422-5
21 Bugaje MA Yakubu AM Ogala WN Prevalence of adolescent hypertension in Zaria
Nig J Paediatr 2005 32 77-82
73
22 Obika LF Adedoyin MA Olowoyeye JO Pattern of paediatric blood pressure in
rural semi urban and urban communities in Ilorin Nigeria Afri J Med Sci 1995 24
371-7
23 Jeremy B A short history of blood pressure measurement section of the history of
medicine Proc Roy Soc Med 1977 70 793-9
24 Lewis O Stephen Hales and the measurement of blood pressure J Hum Hypertens
1994 8 865-71
25 Crile GW Blood Pressure in Surgery An experimental and Clinical Research
Philadelphia Lippincott 1903 p 358
26 Lewis WH The evolution of clinical sphygmomanometer Bull N Y Acad Med 1941
17 871-81
27 Browne WC OrsquoBrien ET Semple PF The sphygmomanometer of Riva Roci 1896-
1996 J Hum Hypertens 1994 610 723-4
28 Segal HN How Korotkoff the Surgeon discovered the auscultatory method of
measuring arterial pressure Ann Intern Med1975 83 561-2
29 Goodman FH and Howell AA Clinical studies in the auscultatory method of
determining blood pressure University of Pennsylvania Bulletin 1911 23 469-75
30 Crenner CW Introduction of the blood pressure cuff into US medical practice
technology and skilled practice Ann Intern Med 1998 128 488-493
31 Ganon WF Circulation In Review of Medical Physiol Lange Medical Publication
New York 22nd edition 2005 p 234-63
32 Beth C Homeostatic Regulation of Blood pressure Available from
URLhttpwwweHowcom Accessed on 1st December 2011
33 Rajinder KG Fahim M Regulation of cardiovascular functions during acute blood
loss Indian J Physiol Pharmacol 2005 49 213ndash9
74
34 Dampney AL Coleman MJ Fonts MAP Hirooka Y Horiuchi J Polson JW Potts
PD Tagawa T Central mechanisms underlying short-term and long-term regulation
of the cardiovascular system Proc Austr Physio Pharmacosociety 2001 32 333-44
35 Koshiya N Guyenet PG Noradrenergic neurons and the carotid sympathetic
chemoreflex Am J Physiol 1994 267 519-26
36 Prakash ES The ultimate goal in neural regulation of cardiovascular function Adv
Phyiol Educ 2008 32 107-8
37 Allen AM Inhibition of the hypothalamic paraventricular nucleus reduces
sympathetic nerve discharge and blood pressure Proc Austr Neuroscience Society
2001 29 44-7
38 Reid IA Interactions between ANG II sympathetic nervous system and
baroreceptor reflexes in regulation of blood pressure Am J Physiol 1992 262 763-
78
39 Brooks VL Osborn JW Hormonal-sympathetic interactions in long-term
regulation of arterial pressure A hypothesis Am J Physiol 1995 268 1343-58
40 Reckelhoff JF Gender Differences in the Regulation of Blood Pressure
Hypertension 2001 37 1199-208
41 Fink GD The systemic circulation as a regulated free-market economy A new
approach for understanding the long-term control of blood pressure Clin Exp
Pharmacol Physiol 2005 32 377ndash83
42 Benard K Sources of error in blood pressure measurement Hospital Physician 2002
12 33-7 Available from URLhttp wwwturnerwhitecom
43 Chyun DA A comparism of intra arterial and auscultatory blood pressure readings
Heart lung 1985 14 223-31
75
44 Nwankwo MU Lorenz JM Gardiner JC A Standard Protocol for Blood Pressure
Measurement in the Newborn Pediatrics 1997 99 1342-9
45 Deakin CD Low JL Accuracy of the advanced trauma life support guidelines for
predicting systolic blood pressure using carotid femoral and radial pulses
observational study BMJ 2000 321 673ndash4
46 OrsquoBrian E Replacing mercury sphygmomanometers require clinician to demand
better automated device BMJ 2000 320 815-6
47 McKay DW Raju MK Campbell NR Assessment of blood pressure measuring
techniques Med Educ 1992 26 208ndash12
48 Baker RH Ende J Confounders of auscultatory blood pressure measurement J Gen
Intern Med 1995 10 223ndash31
49 Neufeld PD Johnson DL Observer error in blood pressure measurement CMAJ
1986 135 633ndash7
50 van Montfrans GA Oscillometric blood pressure measurement progress and
problems Blood Press Monit 2001 6 287ndash90
51 Ware RW Laenger CJ Indirect blood pressure measurement by Doppler ultrasonic
kinetoartriography Proceedings 20th Annual Conference Engineering Medical
Biology 1967 9 27-30
52 Matthew Fox Blood pressure measurement technique Available from URL http
wwwlivestrongcom Last edited 2nd September 2010 Accessed on 30th November
2011
53 Akor F Okolo SN Okolo AA Blood pressure and anthropometric measurements in
healthy Primary School entrants in Jos Nigeria SAJCH 2010 4 42-5
54 Merhi BM Al-Hajj F Al-Tannir M Zaide F El-Rajab M A survey of blood pressure
in Lebanese children and adolescents North Am J Med Sci 2011 3 24-9
76
55 Al-Salloum AA El-Mouzan AH Al-Herbish AS Al-Umar AA Qurashi MM Blood
pressure standard for Saudi children and adolescents Ann Saudi Med 2009 29 173-8
56 Akinkugbe FM Akinwolere AO Kayode CM Blood Pressure Pattern in
Adolescence West Afri J Med 1999 18 196-202
57 Wanzhu T Eckert GJ Saha C and Pratt JH Synchronization of Adolescent Blood
Pressure and Pubertal Somatic Growth J Clin Endo Metab 2009 94
58 Ansa VO Anah MU Odey FA Mbu PN Agbor EI Relationship between parental
socioeconomic status and casual blood pressure in coastal Nigeria Adolescents West
Afri J Med 2010 29146-52
59 Agyemang C Redekop WK Owusu-Dabo E Bruijnzeels MA Blood pressure
patterns in rural semi-urban and urban children in the Ashanti region of Ghana West
Africa BMC Public Health 2005 5114-21
60 Ejeke CCE Ugwu CE Ezeanyika LUS Olayemi AT Blood pressure patterns in
relation to geographic area of residence a cross-sectional study of adolescents in Kogi
state Nigeria BMC Public Health 2008 8 411-5
61 Colhoun HM Hemminway H Poulter WR Socioeconomic status and blood
pressure an overview analysis J Human Hypertension 1998 12 91-110
62 Badaruddoza KR Familial aggregation and heritability for cardiovascular risk factors
a family based study in Punjab India Natural Science 2010 2 732-6
63 Livshits G Gerber LM Familial factors of blood pressure and adiposity co-variation
Hypertension 2001 37 928-35
64 Fermino RC Seabra A Garganta R Antoacutenio J Maia R Genetic factors in familial
aggregation of blood pressure of Portuguese nuclear families Arq Bras Cardiol 2009
92 463-9
77
65 Mijinyawa MS Iliyasu Z Borodo MM Prevalence of hypertension among teenage
students in Kano Nigeria Nig J Med 2008 17 173-7
66 The Wellcome Trust case control consortium Genome-wide association study of
14000 cases of seven common diseases and 3000 shared controls Nature 2007 447
661-78
67 Levy D Destefano AL Larson MG ODonnell CJ Lifton RP Gavras H Evidence for
a gene influencing blood pressure on chromosome 17 genome scan linkage results for
longitudinal blood pressure phenotypes in subjects from the Framingham heart study
Hypertension 2000 36 477- 83
68 Lifton RP Wilson FH Choate KA Geller DS Salt and blood pressure new insight
from human genetic studies Cold Spring Harb Symp Quant Biol 2002 67 445ndash50
69 van der Sande MA Milligan PJ Nyan OA Rowley JT Banya WA Ceesay SM
Dolmans WM Blood pressure patterns and cardiovascular risk factors in rural and
urban Gambian communities J Hum Hypertens 2000 14 489-96
70 Akinkugbe OO Ojo OA Arterial blood pressure in rural and urban population of
Nigeria BMJ 1969 2 22-4
71 Okagua J Anochie IC Akani NA Adolescent blood pressure in Rivers State Nigeria
A rural-urban comparism NJP 20154221-7
72 Urrutia-Rojas X Egbuchunam CU Bae S Menchaca J Bayona M Rivers PA Singh
KP High blood pressure in school children Prevalence and risk factors BMC
Pediatrics 2006 6 32-9
73 Sorof JM Lai D Turner J Poffenbarger T Potman R Overweight ethnicity and the
prevalence of hypertension in school-aged children Pediatrics 2004 113 475-82
78
74 Rosner B Prineas R Daniels SR Blood pressure differences between blacks and
whites in relation to body size among US children and adolescents Am J Epidemiol
2000 151 1007-18
75 Harding S Whitrow M Lenguerrand E Maynard M Teyhan A Cruickshank JK Der
G Ethnic differences in blood pressure in adolescence the determinants of adolescent
social well-being and health study Hypertension 2010 55 1063-9
76 Cruickshank JK Mzayek F Liu L Kieltyka L Sherwin R Webber LS Srinavasan SR
Berenson GS Origins of the ldquoblackwhiterdquo difference in blood pressure roles of birth
77 Vlajinac H Miljus D Adanja B Marinkoic J ipetic S Kocev N Blood pressure levels
in 7 to 14-year-old Belgrade children J Human Hypertension 2003 17 761ndash5
78 Menezes AMB Hallal PC Dumith SC Adolescent blood pressure body mass index
and skin folds sorting out the effects of early weight and length gains J Epid Comm
Health 2011 12 42-8
79 Karelis AD St-Pierre DH Conus F Rabasa-Lhoret R Poehlman EJ Metabolic and
body composition factors in subgroups of obesity what do we know J Clin Endo
Metab 2004 89 2569-75
80 Katzmarzyk PT Srinivasan ER Chen W Malina RM Bouchard C Berenson GS
Body mass index waist circumference and clustering of cardiovascular disease risk
factors in a biracial sample of children and adolescents Pediatrics 2004 114 198-205
81 Guagnano MT Ballone E Colagrande V Della Vecchia R Manigrasso MR Merlitti
D Riccioni G Sensi S Large waist circumference and risk of hypertension Int J
Obesity 2001 25 1360 ndash 4
82 Araujo TA Lopes MVO Moriera RP Cavalcante TF Gurdes NG MartinS dA Silva
V Blood pressure of children and teenagers from a public school in Fortaleza - Cearaacute
Acta paul enferm 200720103-15
79
83 Sebanjo IO Oshikoya KA Obesity and blood pressure levels of adolescents in
Abeokuta Nigeria Cardiovasc J Afr 2011 221-5
84 Messerli FN Obesity and essential hypertension Haemodynamics sodium excretion
and plasma rennin activity Arch Int Med 1981 141 81-5
85 Appel LJ Brands MW Daniels SR Karanja N Elmer PJ Sacks FM Dietary
Approaches to Prevent and Treat Hypertension A Scientific Statement from the
American Heart Association Hypertension 2006 47 296-308
86 Sacks FM Svetkey LP Vollmer WM Appel LJ Bray GA Harsha D Obarzanek E
Conlin PR Miller ER 3rd Simons-Morton DG Karanja N Lin PH for the DASH-
Sodium Collaborative Research Group Effects on blood pressure of reduced dietary
sodium and the Dietary Approaches to Stop Hypertension (DASH) diet DASH-
Sodium Collaborative Research Group N Engl J Med 2001 344 3ndash10
87 Appel LJ Moore TJ Obarzanek E Vollmer WM Svetkey LP Sacks FM Bray GA
Vogt TM Cutler JA Windhauser MM Lin PH Karanja N A clinical trial of the
effects of dietary patterns on blood pressure DASH Collaborative Research Group N
Engl J Med 1997 3361117ndash24
88 Appel LJ Sacks FM Carey VJ Obarzanek E Swain JF Miller ER 3rd Conlin PR
Erlinger TP Rosner BA Laranjo NM Charleston J McCarron P Bishop LM for the
OmniHeart Collaborative Research Group Effects of protein monounsaturated fat and
carbohydrate intake on blood pressure and serum lipids results of the OmniHeart
randomized trial JAMA 2005 294 2455ndash64
89 Karanja NM Obarzanek E Lin PH McCullough ML Phillips KM Swain JF
Champagne CM Hoben KP Descriptive characteristics of the dietary patterns used in
the Dietary Approaches to Stop Hypertension Trial DASH Collaborative Research
Group J Am Diet Assoc 1999 99 19ndash27
80
90 Nwokocha ARC Adolescence and associated problems In Azubuike JC and
Nkanginieme KEO (eds) Paediatrics and Child Health in a Tropical Region African
Educational Services Owerri Nigeria 2nd edition 2007 p 84-99
91 Rogol RT Roemmich JN Clark PA Growth and puberty J Adol Hlth 2002 31 192-
200
92 Tanner JM Marshal WA Variation in the pattern of puberty changes in boys and girls
Arch Dis Child 1970 45 13-23
93 Nwakoro SO Ifoda K Onochie O Olomu JM Anthropometric assessment of
nutritional status and growth of 10-20 years individuals in Benin City metropolis
Nigeria Pakistan J Nutr 2006 5 117-21
94 Shankar RR Eckert GJ Saha C Tu W Pratt JH The change in blood pressure during
pubertal growth J Clin Endo Metab 2005 90 163-7
95 Department of Health and Human Services 2000 CDC Growth Charts for the United
States methods and development Series Report 11 No 246 Available from URL
httpwwwcdcgovGrowthCharts
96 Redwine KM Daniels SR Prehypertension in Adolescents Risk and Progression
Journ Clin Hypertension 2012 14 360ndash4
97 Falkner B Gidding SS Portman R Rosner B Blood pressure variability and
classification of prehypertension and hypertension in adolescence Pediatrics 2008
122238ndash42
98 Redwine KM Acosta AA Poffenbarger T Development of hypertension in
adolescents with pre-hypertension J Pediatr 2012 16098ndash103
99 Ejike ECCC Ugwu CE and Ezeanyika LUS Variations in the prevalence of point
prehypertension in a Nigerian school-going adolescent population living in a semi-
urban and an urban area BMC Pediatr 2010 1013
81
100 Ujunwa FA Ikefuna AN Nwokocha AR Chinawa JM Hypertension and
prehypertension among adolescents in secondary schools in Enugu South East Nigeria
Italian J Pediatr 20133970-5
101 Chobanian AV Bakris GL Black HR Seventh report of the Joint National
Committee on Prevention Detection Evaluation and Treatment of High Blood
Pressure Hypertension2003 421206ndash52
102 Lande MB Systemic Hypertension In Kliegman RM Behrman RE Jenson HG and
Stanton BF (eds) Nelson Textbook of Pediatrics Saunders Elsevier Philadelphia 19th
Edition 2011 pg 1592-8
103 Luma GB Spiotta RT Hypertension in Children and Adolescent Am Fam Physician
2006 73 1558-68
104 Arvind B Rupesh J Vijayakumar M Madhuri K Ali U Evaluation and management
of hypertension Indian Paediatr 2007 44 103-21
105 Flynn JT Neonatal hypertension Diagnosis and management Pediatr Nephrol 2000
14 332-41
106 Steyn K de Wet T Richter L Cameron N Levitt NS Morrel C Cardiovascular
diseases risk factors in 5-year old urban South African children- The Birth to Ten
Study SAMJ 2000 90 7126
107 Antia-Obong OE Antia-obong LE Arterial blood pressure of Nigerian Urban and
Rural school children Nig J Paediatr 1991 18 3-11
108 Nguyen NT Magno CP Lane KT Hinojosa MW Lane JS Association of
hypertension diabetes dyslipidemia and metabolic syndrome with obesity findings
from the National Health and Nutrition Examination Survey 1999 to 2004 J Am Coll
Surg 2008 207 928-34
82
109 Solar MB Gill A Rey J Epidemiology of arterial blood pressure in school children
population Aten Primaria 1992 9 212-4
110 Steyn K de Wet T Richter L Cameron N Levitt NS Morrel C Cardiovascular
diseases risk factors in 5-year old urban South African children- The Birth to Ten
Study SAMJ 2000 90 7126
111 Linkas J The assessment and management of hypertensive emergencies and
urgencies in children Pediatr Emerg Care 2005 21391-6
112 Croix B Feig DI Childhood hypertension is not a silent disease Pediatr Nephrol
2006 21527-32
113 Flynn JT Anderson MH Characteristics of children with primary hypertension seen
at a referral centre Pediatr Nephrol 2007 44 103-21
114 Nakao M Yano E Nomura S Kuboki T Blood pressure lowering effects of
biofeedback treatment in hypertension a meta-analysis of randomized controlled trials
Hypertension 2003 26 37- 46
115 Jalingo Available from URLhttpwwwencyclopedia Britanica Accessed on 3rd
December 2011
116 Araoye MO Research Methodology with Statistics for Health and Social Sciences
Nathadex Publishers Saw-Mill Ilorin Nigeria 2004 pg 115-21
117 Olusanya O Okpere E Ezimokhai M The importance of social class in voluntary
fertility control in a developing country West Afr J Med 1985 4 205-12
118 World Health Organization expert committee Physical status the use and
interpretation of anthropometry WHO technical report series No 894 Geneva WHO
1995 p 424ndash38
119 Guidelines subcommittee WHOISH guideline for management of hypertension J
Hypertens 1999 17 151-83
83
120 Aubay B How to measure waist circumference Available from
URLhttpwwwehowcom Last updated August 10th 2011 and accessed on December
9th 2011
APPENDICES
Appendix 1
PROFORMA ON BLOOD PRESSURE PATTERN IN APPARENTLY HEALTHY
SECONDARY SCHOOL ADOLESCENTS IN JALINGO
PUBLIC SCHOOL [ ]
Serial No
84
PRIVATE SCHOOL [ ]
A BIODATA
1 Age (years) 10[ ] 11[ ] 12[ ] 13[ ] 14[ ] 15[ ] 16[ ] 17[ ] 18[ ] 19[ ]
2 Gender M [ ] F [ ]
3 Class JSS 1-3 [ ] SS1-3 [ ]
B MEDICAL AND SOCIAL HISTORY Yes [1] No [2]
1 Have you ever passed blood in your urine [ ]
2 Have you ever had your face or legs swollen [ ]
3 Are you on any drug for long time (such as pills steroids marijuana codeine
NSAIDs containing drugs tramal and others) [ ]
If yes specifyhelliphelliphellip
C SOCIO-ECONOMIC CLASSIFICATION
Fatherrsquos occupation
Score 1 Professionals top civil servants politicians and top businessmen
2Middle-level civil servants technicians skilled-artisans and well-to-do
traders
3 Unskilled workers and those in general whose income would be at or below
the national minimum wage
Mothers educational level
Score 0 Education up to University level
1 Secondary or tertiary level below the University
2 No formal education or up to primary level only
D ANTHROPOMETRY
i Weight (Kg) ndash 1helliphellip 2helliphelliphellip Averagehelliphelliphelliphellip
ii Height (m) ndash 1helliphellip 2helliphellip Averagehelliphelliphelliphellip
85
iii Body mass index = weightheight (kgm2)
v Waist circumference (cm) ndash 1helliphellip 2helliphelliphellip Averagehelliphelliphelliphellip
iv Blood Pressure (mmHg) - 1helliphellip 2hellip 3helliphellip Averagehelliphelliphelliphellip
Appendix 2
AUTHORIZATION AND CONSENT TO PARTICIPATE IN A RESEARCH
I Dr Peter Teru Yaru of the Department of Paediatrics Ahmadu Bello University
Teaching Hospital (ABUTH) Zaria Irsquom conducting a research on the blood pressure
pattern among secondary school adolescents in Jalingo
The aim of the study is to know the level of blood pressure among their age
groups Those with high blood pressure (or hypertension) will be identified appropriately
advised and referred for further care The study will involve taking their weight height
blood pressure and waist circumference Female assistants shall be responsible for
86
measuring waist circumference of female students Students will also be given a
questionnaire on some of their activities drug use among others all aimed at looking for
factors which can affect their blood pressure Information obtained shall be treated with
utmost confidentiality and for this research work only Please note that participation is
voluntary I will be glad if you give consent for your childward to participate in the
study
Statement by parents Irsquove read and understood this consent form and agreed for my
child to be included in the study
Parents name Researcherrsquos name and sign
Parents phone no if any Date
Parents signthumb print Phone no
87
Appendix 3
SOCIO-ECONOMIC SCORE
The classification of socio-economic scores based on fatherrsquos occupation and motherrsquos
education by Olusanya et al117
A Husband (fatherrsquos occupation)
Score 1 Professionals top civil servants politicians and businessmen
2 Middle-level bureaucrats technicians skilled-artisans and well-to-do traders
3 Unskilled workers and those in general whose income would be at or below
the national minimum wage
B Mothers educational level
Score 0 Education up to University level
1 Secondary or tertiary level below the University
2 No formal education or up to primary level only
The socio-economic class of the childrsquos mother is obtained by adding the scores from A
and B above and graded I-V as appropriate for example
Score (1) from A plus score (0) from B = social class I
Score (2) from A plus score (0) from B = social class II
Score (2) from A plus score (1) from B = social class III
Score (2) from A plus score (2) from B = social class IV
Score (3) from A plus score (0) from B = social class III
Score (3) from A plus score (1) from B = social class IV
Score (3) from A plus score (2) from B= social class V