Dissolved Organic Carbon, Turbidity and Nutrients in Lake Viken History and a Snapshot of Sub-catchment contributions Peter Kloss Degree project in biology, Master of science (2 years), 2014 Examensarbete i biologi 30 hp till masterexamen, 2014 Biology Education Centre Supervisor: Lars Tranvik External opponent: Jovana Kokic
Transcript
Dissolved Organic Carbon, Turbidity andNutrients in Lake Viken
History and a Snapshot of Sub-catchmentcontributions
Peter Kloss
Degree project in biology, Master of science (2 years), 2014Examensarbete i biologi 30 hp till masterexamen, 2014Biology Education CentreSupervisor: Lars TranvikExternal opponent: Jovana Kokic
Abstract Lake Viken, situated in mid south Sweden, in the county of Västra Götaland, has in recent years become increasingly turbid and brownish, according to people living in the area. The question was raised whether a ongoing drainage of a peat-bog in the catchment area was contributing to the deterioration of the water quality. The main aims of this work were:
• Investigate how the water quality has changed over time by compiling historic data.
• Map the lake´s sub-catchments and in the water from these measure concentrations and transported amounts of substances, e.g. dissolved organic carbon (DOC) and nutrients.
• Investigate possible correlations between land-types in the sub-catchments and concentrations.
• Compare water chemistry in drainage from the drained bog and a natural bog, and finally, from the results and former studies discuss which impact the drained bog may have on Lake Viken.
The most obvious changes in water quality in Lake Viken, during 1965- 2012 were increased pH and DOC-levels and decreased concentration of total phosphorus . Precipitation in the area increased during the time period and varied together with absorbance. Turbidity showed no trend over time but perhaps it has been a change in what causes it. It could have been a shift from phytoplankton to turbidity caused by terrestrial and sediment originated particles. High proportion of mire and low altitudes in the sub-catchments seemed the most important factors to explain high DOC-levels in run-off water, while phosphorus was linked to proportion of agricultural land. Measurement of suspended matter has to be conducted continuously over a long period in order to give a true picture. The comparison between the drained bog and the natural bog showed that water from the drained bog contained more DOC, suspended materials and nutrients. The drainage of the bog may have increased the total inflow to Lake Viken by about 2%. The contribution of suspended material could be of greater importance.
SammanfattningFolk boende runt sjön Viken, belägen i Västra Götaland, har de senaste åren noterat att dess vatten blivit allt grumligare. Man undrade huruvida en då pågående utdikning av en mosse i avrinningsområdet bidrog till den försämrade vattenkvalitén. Detta arbetes syfte var att undersöka hur vattenkvalitén har förändrats genom tiden genom att sammanställa historisk data, kartlägga sjöns delavrinningsområden och i vatten från dessa områden mäta koncentrationer och transporter av olika ämnen som t ex löst organiskt kol och fosfor, påvisa korrelationer mellan marktyper och koncentationer samt att göra en jämförelse mellan den dikade mossen och en naturlig mosse för att slutligen, med hjälp av tidigare studier, dra slutsatser kring den dränerade mossens påverkan på sjön Viken. Resultaten visar att halten löst organiskt kol (DOC) och pH-värdet i Viken har ökat över en längre tid och samtidigt har fosforhalten minskat. Nederbörden i området ökade under tidsperioden och varierade samstämmigt med absorbansen. Turbiditeten uppvisade ingen trend över tiden men möjligen kan det ha skett en förändring av vad som är orsaken. Vattenkvalitén från de olika delavrinningsområdena skiljer sig mycket. Koncentrationer av DOC korrelerade starkast med medel-altituden i avrinningsområdet och med andelen myrmark, medan fosfor kopplades till jordbruksmark. Mätning av turbiditet och suspenderat material måste ske kontinuerligt över en längre tid för att ge en representativ bild. Jämförelsen mellan den dikade mossen och den naturliga visade att högre halter av DOC, suspenderat material och näringsämnen kom från den dikade mossen. Dikningen av mossen kan ha ökat tillflödet av DOC med ca 2% till hela sjön men tillskottet av suspenderat material kan vara av större betydelse.
1
Table of Contents1. Introduction ................................................................................................................ 3
2.1. Historic compilation of Lake Viken.........................................................................4
2.2 Snapshot of inflows and catchment analysis..........................................................52.2.1 Sampling and analysis.........................................................................................52.2.2 Catchment analysis..............................................................................................52.2.3 Loads....................................................................................................................62.2.4 In-lake loss...........................................................................................................62.2.5Gradient in Lake Viken..........................................................................................6
2.3 Comparison of a Natural Bog and a Drained Bog...................................................6
3.1 Historic Compilation of Lake Viken..........................................................................7
3.2 Snapshot of Inflows and Catchment Analysis.........................................................83.2.1 Gradient in Lake Viken.......................................................................................103.2.2 Loads..................................................................................................................103.2.3 Loss....................................................................................................................11
3.3 Comparison of a natural bog and a drained bog...................................................11
Appendix 1: Historic data on water chemistry from the channel of Forsvik and precipitation in Skara.....................................................................................................................................................20Appendix 2: Results from sampling of rivers and from Lake Viken and the bog Myrhulta mosse....20
2
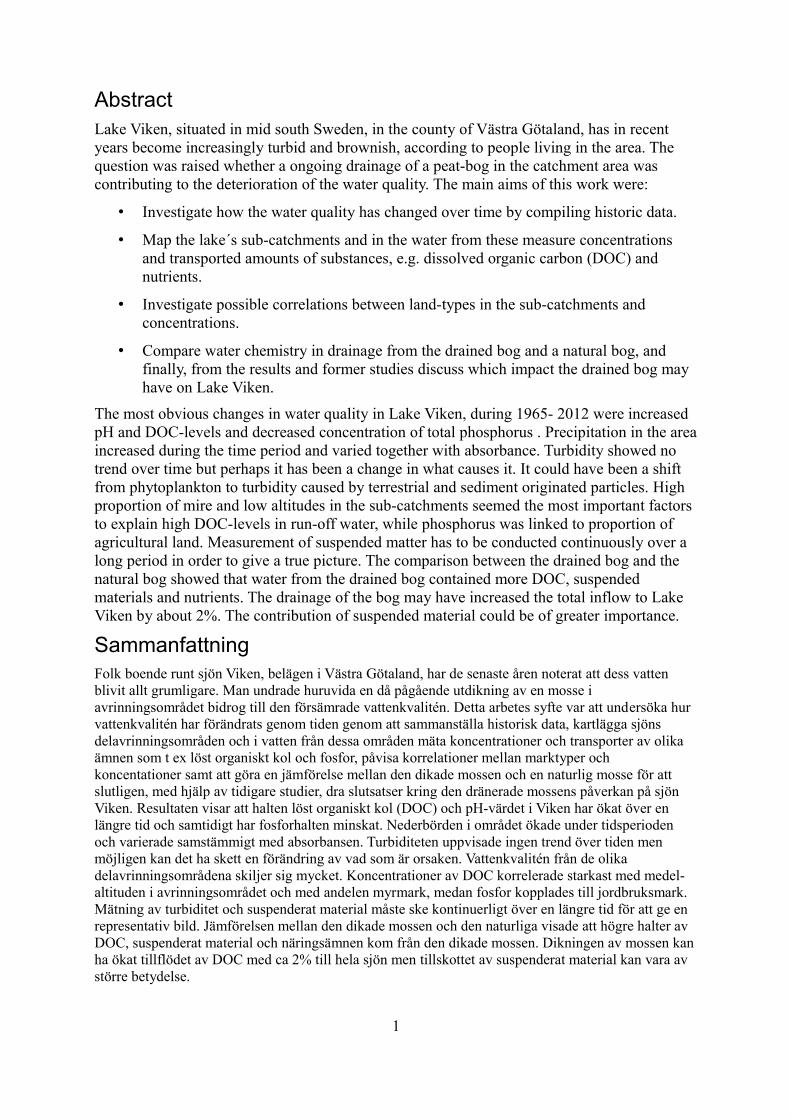
1. IntroductionLake Viken, situated in mid south Sweden, in the county of Västra Götaland (fig.1), has in recent years become increasingly turbid and brownish, according to the water owners and conservation association of Lake Viken (Vikens fiskevårdsområdesförening 2012).The direct cause for brown water is in most cases humic dissolved organic carbon (DOC) of terrestrial origin (Watts et al. 2001) but could also be iron or manganese (Kritzberg & Ekström 2011). Change in DOC concentration affects the lake ecosystem in several ways. Being a substrate for bacteria (De Lange et al. 2003) DOC plays an important role in the food web structure in lakes (Jansson et al. 2007). DOC reduces penetration of solar ultraviolet (Morris et al. 1995) and photosynthetically available radiation (Karlsson et al. 2009), which in turn affects organisms in the lake.There is a trend for several decades in Europe and North America that lakes become browner (Worrall & Burt 2007, Freeman et al 2001). Proposed explanations for this trend are: Higher temperatures through climate change may increase the net primary production as well as degradation of organic matter and consequently, as DOC is a product of decomposition, the load of DOC to lakes (Jansson et al. 2008, Freeman et al. 2001, Worrall et al. 2003). However, temperature alone is unlikely to explain changes in DOC fluxes or concentrations (Tranvik & Jansson 2002, Worrall et al 2004). Production, flux and decomposition of DOC are also linked to hydrology. If warmer and dryer climate results in more oxygenated soils, in which decomposition (DOC-production) speeds up, the DOC concentrations in streams increase. Lower flows, however, may transport less amounts (though more concentrated) of DOC where longer retention time in lakes means more time for degradation processes in lakes and thus lower DOC-levels.In northern Europe precipitation is thought to increase (SMHI 2013), and also wash out more DOC from the catchments (Hongve 2004, Arvola et al. 2004). At high flows water tends to take a more shallow way through the soils, where the content of DOC is high, and hence high amounts of DOC are flushed into streams (McDowell and Likens 1988).Humic organic matter is less soluble at lower pH. Accordingly, the recovery from acidification in recent decades, higher pH has been proposed to enhance the solubility of DOC and its transport to streams and lakes. (Monteith et al. 2007). The higher solubility of more negatively charged humic molecules also make them less prone to form aggregates (flocculation) that could leave the water column through sedimentation (Gerritsen and Bradley 1987, von Wachenfeldt & Tranvik 2008).Changes in land-use may affect the export of DOC from soils. Drainage of blanket bogs and peat covered catchments have been shown to increase the release of DOC (Conway & Millar 1960, Mitchell and McDonald 1992, Holden et al. 2004, Mitchell and McDonald1995) and also deforestation could have the same effect (Neal et al. 1998, Schelker et al. 2011, Laudon
3
Figure 1: Position of lake Viken between the two largest lakes of Sweden, lake Vänern and lake Vättern. Made with free vector and raster map data from naturalearthdata.com.
et al. 2009, Nieminen 2004).Nitrogen fertilization by atmospheric NOx deposition may enhance the production of organic matter and consequently accelerate the DOC production in catchments (Matson et al. 2002).Turbidity is caused by particles, either of autochtonous origin, i.e. plankton and resuspended material from the sediment, or of allochtonous origin through erosion in the catchment. Run off water from peat cutting sites are known to have higher turbidity than the run off from undisturbed peatlands (Pavey et al. 2007).The Water Owners and Conservation Association of Lake Viken (Vikens fiskevårdsområdesförening 2012) has expressed concerns about the impact on the water quality of a recent initiated peat mining area.A relationship has been seen between wetland cover and stream DOC-levels (Eckhardt & Moore 1990). Hope et al. (1997) found a significant correlation between DOC-levels and percentage of peat cover and also with altitude. It is interesting to investigate this type of relationships since they may help to explain differences between sub-catchments of lake Viken.This project aims to :
1. Map the history of Lake Viken's water chemistry by using data from previous years in order to verify whether there is a trend in water quality and if Lake Viken becomes browner and/or more turbid.
2. Investigate the importance of a majority of the inlets to Lake Viken when it comes to transport of DOC, particles and nutrients, and to put them in relation to each other.
3. Investigate signs on in-lake processing of carbon, suspended material and nutrients.4. Analyse whether there are connections between different land types and elevation in
the catchment and the chemistry of the drained water.5. Compare water chemistry in drainage from a recently drained bog and a natural bog,
to shed light on the potential effect on turbidity and DOC of ditching bogs.6. From the results and other studies discuss which impact the drained bog in the
catchment may have on Lake Viken.
2. Methods2.1. Historic compilation of Lake VikenData on water chemistry was provided by the Swedish University of Agricultural Sciences (SLU 2013). As data from the middle of Viken only goes back to 1994 data from the main outlet, Forsvik Channel, were used. Data from the outlet Forsvik Channel is a good proxy of the processes in the lake and the water quality should be very similar. Precipitation data comes from Swedish Metrological and Hydrological Institute (SMHI 2013). Annual mean-values for chemical parameters and total annual amount of precipitation were calculated. Correlations between parameters and patterns over time where investigated by plotting parameters on the time line and using principal component analysis (PCA) which is a multi variable analysis.
4
2.2 Snapshot of inflows and catchment analysis2.2.1 Sampling and analysisDuring one day (22/11 2012) the cross section area and stream velocity of a majority of all inlets (fig.2) to Lake Viken were measured. Stream velocity was measured using a flow probe that sends the water velocity data to a digital readout display in m/s. The next day, I collected 5 litres of water from each inlet and a duplicate fraction from each sample was filtered through pre-combusted and pre-weighted Whatman GF/F filters. Filters were dried and then stored in a desiccator to prevent moisture uptake until secondary weighing. Change in mass of filters was used to calculate the amount of suspended matter. Samples were also taken from the major outlet from the drained bog, Ryholms stormosse at Spetsbolet, and also upstream and downstream the point where the drained water from bog Ryholms stormosse reaches River Örlan. No or very little precipitation had fallen in recent weeks or during the days of sampling. Water was analysed for absorbance (water colour), which is a proxy for DOC, by using spectrophotometric colour determination of filtered water at 436nm (A436), total phosphorous (tot-P) (Menzel 1965), Molybdate reactive phosphorus (MRP) (Murphy 1962), total nitrogen (tot-N) (Crumpton et al 1992), ammonium-N (Berthelot 1859), nitrite-N, nitrate-N (SS-EN ISO 13395), turbidity, suspended matter (Svensk standard 1983), pH (25oC)(Skoog et al. 1976, Svensk standard 1979) and conductivity (25oC)(Svensk standard SS 02 81 24 1985). Concentrations of DOC were measured using a Shimadzu TOC-5000 with test tube changer ASI-5000A (SS-EN 1484 - SIS)2.2.2 Catchment analysisTo describe the catchment area of each sample point (inlet) the software Quantum GIS (QGIS) was used together with integrated GRASS-modules. A raster of new national elevation data (nnh) from Swedish Surveying Authority was used. The module r.watershed was used to generate theoretical streams and associated sub-basins in raster format from an elevation raster data set. These generated rasters were “thinned” using the GRASS module r_thin and “vectorized” using GRASS module r.vectorize. The generated streams revealed which of the
small generated basins that connect and they were manually merged to greater basins representing the inlets for each sample point, i.e. the sub- catchments (fig.2).Areas of different land types and the areas of houses were calculated in Q-GIS by making intersections of the modelled polygons of basins and polygons of land types, achieved from the digital vector-format map of terrain (Terrängkartan), or of polygons of houses, achieved from the vector property map (Fastighetskartan).The average elevation of each catchment was generated by the Q-GIS module Zonal Statistics.Relationships between parameters were screened by principal component analysis (PCA) using PAST (PAleontological STatistics, University of Oslo) software and also a Pearson's correlation coefficient matrix was set up to show connections between all parameters. 2.2.3 LoadsI calculated the transported amount per second, from all sub-catchments and from each of the analysed substances, i.e. the loads to Lake Viken, by multiplying the concentrations in streams with respective flow.Load = massin/time =Volumein /time* Conc.in
2.2.4 In-lake lossIn-lake-losses per second of all measured substances were calculated. Loss (in lake)= (massin - massout )/time Loss per unit of time is expressed as the difference between total transport (m/t) into the lake and the total transport through the outlets (Brosundet and Göta kanal).2.2.5Gradient in Lake VikenAs the major outlet of Lake Viken is situated in the east end it could be assumed to be a flow of water from the west to the east. I looked at samples from different locations in the lake to see whether a gradient in concentrations exists. If it is so, the western part of the lake could be regarded as less affected by streams entering the eastern part.
2.3 Comparison of a natural bog and a drained bogAt the same day as inlets to Lake Viken were sampled I also sampled water from the outlet of the drained bog and from another nearby natural bog, Myrhulta mosse (figure 2) and the same analyses were made as for the other sampling sites.
6
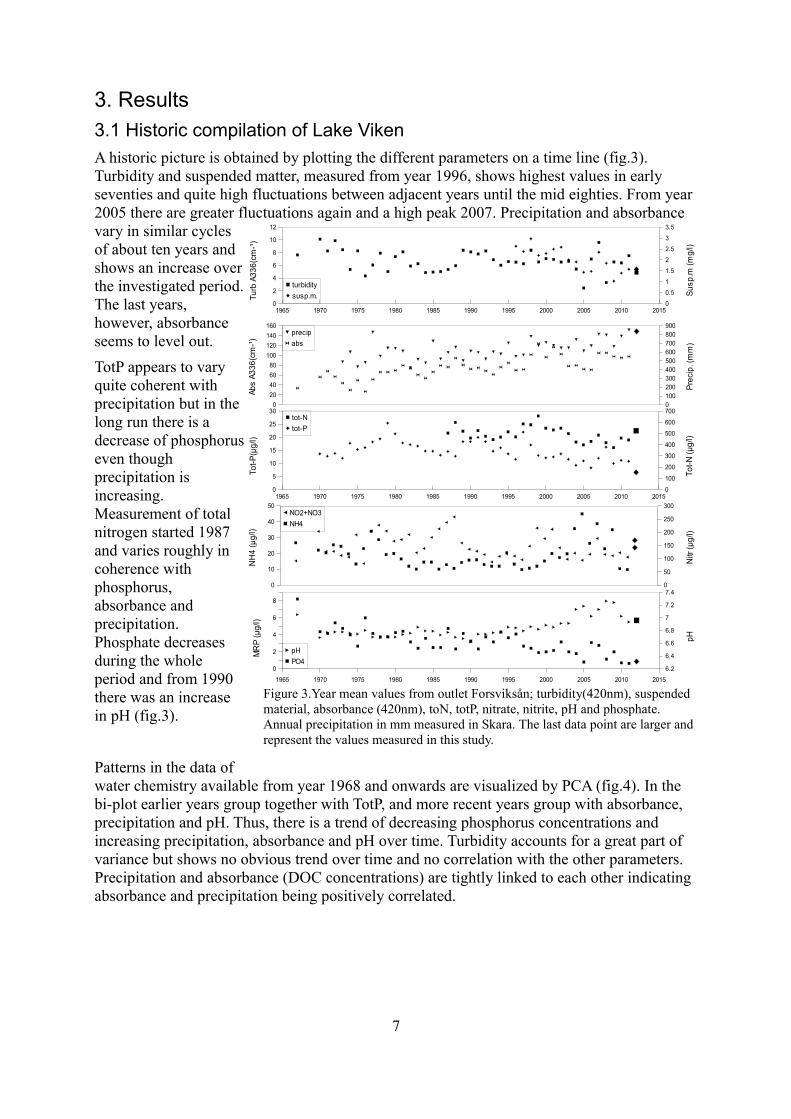
3. Results3.1 Historic compilation of Lake VikenA historic picture is obtained by plotting the different parameters on a time line (fig.3). Turbidity and suspended matter, measured from year 1996, shows highest values in early seventies and quite high fluctuations between adjacent years until the mid eighties. From year 2005 there are greater fluctuations again and a high peak 2007. Precipitation and absorbance vary in similar cycles of about ten years and shows an increase over the investigated period. The last years, however, absorbance seems to level out.TotP appears to vary quite coherent with precipitation but in the long run there is a decrease of phosphorus even though precipitation is increasing. Measurement of total nitrogen started 1987 and varies roughly in coherence with phosphorus, absorbance and precipitation. Phosphate decreases during the whole period and from 1990 there was an increase in pH (fig.3).
Patterns in the data of water chemistry available from year 1968 and onwards are visualized by PCA (fig.4). In the bi-plot earlier years group together with TotP, and more recent years group with absorbance, precipitation and pH. Thus, there is a trend of decreasing phosphorus concentrations and increasing precipitation, absorbance and pH over time. Turbidity accounts for a great part of variance but shows no obvious trend over time and no correlation with the other parameters. Precipitation and absorbance (DOC concentrations) are tightly linked to each other indicating absorbance and precipitation being positively correlated.
7
Figure 3.Year mean values from outlet Forsviksån; turbidity(420nm), suspended material, absorbance (420nm), toN, totP, nitrate, nitrite, pH and phosphate. Annual precipitation in mm measured in Skara. The last data point are larger and represent the values measured in this study.
Figure 4: PCA bi-plot. Years in rows and concentrations of parameters in columns. All values are standardized and a constant, c=3, was added to all to avoid negative values.
3.2 Snapshot of inflows and catchment analysisConcentrations, absorbance and turbidity of the water samples, and also the catchment composition were standardized and analysed by a PCA (fig.5). DOC and absorbance (A436nm) were closely related, and also related to proportion of mire in the sub-catchments. Turbidity and total phosphorus were related and both of them were quite related to suspended material which, in turn, seemed to be related to proportion of agriculture land in the catchment. A Pearson's correlation coefficient matrix was made for all parameters (Table 1). High correlation (R=0.97) for DOC and absorbance indicates that DOC is the main factor controlling colour and thus iron and manganese are considered of secondary importance and where not analysed for.Correlation between DOC-levels in streams and percentage of mire in the respective sub-catchment areas of Lake Viken had an R-value of 0.65.
8
9
Figure 5. PCA bi-plot of sample points (inlets) in rows and concentrations of parameters and proportion of land types in columns. All values are standardized and c=3 added. Variance explained by proportion of lake cover and forest cover where small and therefore excluded.
Table 1. Pearson correlation matrix of r-values between proportion of land-types in sub-catchments and measured parameters. Values higher than 0.5 or lower than -0.5 are bold. The p-value for r=0.5 is 0.025 and for r=0.4 p= 0.081 (sample size = 20). Correlations between land types and parameters are marked by a grey background.
condukt. 436nm filt. susp.[mg/l] tot N [µg/l]NH4[µg/l] Tot P [µg/l]MRP [µg/l]nitr.[µg/l]
condukt
436nm filt
susp.
nitr. a
Also in this case the mean altitudes of each sub-catchment negatively correlated with DOC-levels (R=-0.78) Also TotP and TotN correlates negatively with altitude (R=-0.85, R=-0.84)Percentage of farm-land and phosphorus (R=0.59) and also farm-land and suspended matter correlated (R=0.56). 3.2.1 Gradient in Lake VikenResults from concentrations measured in Lake Viken (table 2)(fig.6) show gradients in turbidity and concentration of tot-P and DOC from the south west part of Viken (sample point:Viken 2, fig. 2) to the south east (Brosundet). No gradient was obvious for concentrations of DOC.
3.2.2 LoadsTo the western part of Lake Viken River Örlan (Örlenbron) and Åsen contributed most suspended material and tubidity. River Örlan contributed most DOC (8g/s) of which 25% (2g/s) originated from the drained bog Ryholms stormosse.For the whole of Lake Viken most of turbidity (7 abs*l/s) and suspended matter (4g/s) originated from the inlet Näs. Largest amounts of DOC came from River Edsån, which by far is the greatest inlet, and from the inlet Liaängen. River Edsån also contributed most tot-N and tot-P. (table 3). The concentration of ammonium (NH4) was high in the outlet from bog Ryholms stormosse. The contribution to the lake as a whole reached 15% even though the flow is very low.
10
Table 2: Values measured In Lake Viken (23/11 2012). Sample points can be found in figure 2.mg/l Abs420/cm [mg/l]
Figure 6:Results for turbidity, TotP, absorbance and DOC from different locations in Lake Viken. See figure 1 for positions. From left:Viken1, Viken2, Viken3 and outlet Brosundet.
3.2.3 LossGreatest in-lake losses (table 4) compared to the inflow transport was for NH4- N, nitrate-N +nitrite-N, MRP and tot-N. Only 3% of DOC was lost in the lake. There is a quite big difference in loss between suspended matter (23%) and turbidity (8%).
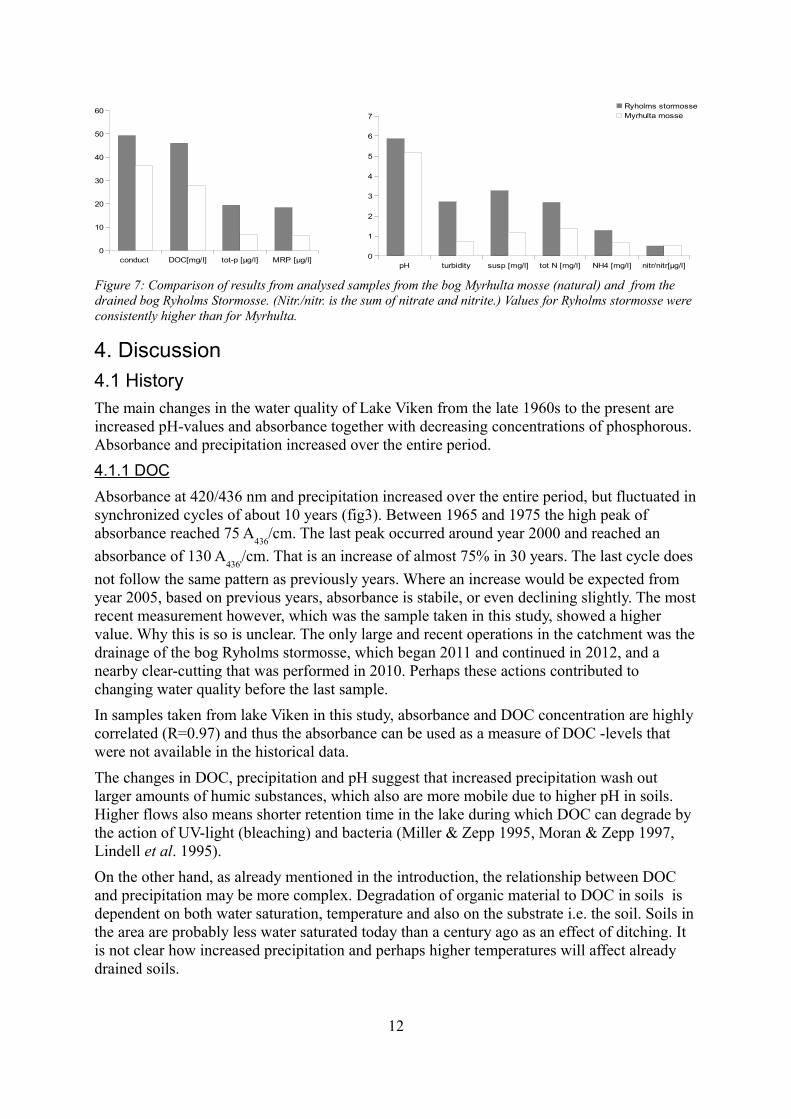
3.3 Comparison of a natural bog and a drained bogConcentrations, absorbance and turbidity of the natural bog Myrhulta mosse and the drained bog Ryholms stormosse were compared (fig 7). Nitrate/nitrite showed no or little difference between sites. All other parameters were higher in Ryholms stormosse, especially suspended material, turbidity and phosphorus.
11
Table 3.Transports of substances (loads) from sub-catchments to lake Viken and in-lake losses.Top five sample points represent the inlets to the western part of lake Viken. The three rows below “Örlenbron” represent the transports just upstream the outlet from the drained bog Ryholms stormosse, the transport at the outlet from the bog and immediately downstream the outlet.
susp m [g/s] turb [abs*l/s] Nitr. [mg/s]a TotP [mg/s]ÖrlenbronÖrlan upstreamBog (Ryholm) outl.Örlan downstreamÅsenFägre bodaSjötorp-Gäddeb.Hästabäckensum inflow western Viken
HalnatorpValönVispåsLiaängenEdsånSkarvuddenNäsSannumRosendalaBjurbäckenSolvikenSum inflow to Viken
Brosundet(bron)G.kanal Tåtorp
Table 4. In-lake losses of parameters and in losses as percentage of total inflow of respective parameter. “Loss/inflow”represent the loss as proportion of the total transport of the parameter into the lake.
a sum of nitrate and nitrite
sample point DOC [g/s] Tot N [mg/s] NH4 [mg/s] MPR [mg/s]In-lake-loss (g/s) 2.8 2.5 1.3 1909 217 1201 3.3 4.4loss/inflow 23% 8% 3% 40% 62% 56% 8% 47%
susp m [g/s] turb [abs*l/s] Nitr. [mg/s] a TotP [mg/s]
4. Discussion4.1 HistoryThe main changes in the water quality of Lake Viken from the late 1960s to the present are increased pH-values and absorbance together with decreasing concentrations of phosphorous. Absorbance and precipitation increased over the entire period.4.1.1 DOCAbsorbance at 420/436 nm and precipitation increased over the entire period, but fluctuated in synchronized cycles of about 10 years (fig3). Between 1965 and 1975 the high peak of absorbance reached 75 A
436/cm. The last peak occurred around year 2000 and reached an
absorbance of 130 A436'
/cm. That is an increase of almost 75% in 30 years. The last cycle does not follow the same pattern as previously years. Where an increase would be expected from year 2005, based on previous years, absorbance is stabile, or even declining slightly. The most recent measurement however, which was the sample taken in this study, showed a higher value. Why this is so is unclear. The only large and recent operations in the catchment was the drainage of the bog Ryholms stormosse, which began 2011 and continued in 2012, and a nearby clear-cutting that was performed in 2010. Perhaps these actions contributed to changing water quality before the last sample.In samples taken from lake Viken in this study, absorbance and DOC concentration are highly correlated (R=0.97) and thus the absorbance can be used as a measure of DOC -levels that were not available in the historical data. The changes in DOC, precipitation and pH suggest that increased precipitation wash out larger amounts of humic substances, which also are more mobile due to higher pH in soils. Higher flows also means shorter retention time in the lake during which DOC can degrade by the action of UV-light (bleaching) and bacteria (Miller & Zepp 1995, Moran & Zepp 1997, Lindell et al. 1995).On the other hand, as already mentioned in the introduction, the relationship between DOC and precipitation may be more complex. Degradation of organic material to DOC in soils is dependent on both water saturation, temperature and also on the substrate i.e. the soil. Soils in the area are probably less water saturated today than a century ago as an effect of ditching. It is not clear how increased precipitation and perhaps higher temperatures will affect already drained soils.
12
Figure 7: Comparison of results from analysed samples from the bog Myrhulta mosse (natural) and from the drained bog Ryholms Stormosse. (Nitr./nitr. is the sum of nitrate and nitrite.) Values for Ryholms stormosse were consistently higher than for Myrhulta.
conduct DOC[mg/l] tot-p [µg/l] MRP [µg/l]0
10
20
30
40
50
60
pH turbidity susp [mg/l] tot N [mg/l] NH4 [mg/l] nitr/nitr[µg/l]0
1
2
3
4
5
6
7Ryholms stormosseMyrhulta mosse
The effect of pH also has more than one side. Increasing pH has been linked to increased wash out of humic substances from soils and also to a decrease in the ability of particles and DOC to form aggregates in the water column. DOC in aggregates may settle to the sediment due to the higher weight (Gerritsen and Bradley 1987, von Wachenfeldt & Tranvik 2008). Also UV-light is thought to facilitate the aggregation (von Wachenfeldt et al. 2008). 4.1.2 TurbidityEven though no change in turbidity could be seen it may be a change in what causes it. The historic data shows higher phosphorus concentrations in earlier years, which likely have promoted phytoplankton production (Schindler 1974), while higher DOC concentrations in more recent years are likely to have inhibited phytoplankton growth by light inhibition (Karlsson et al. 2009). Turbidity caused by phytoplankton thus can be assumed to have decreased as phosphorus decreased. Simultaneously, increasing terrestrial DOC may have induced production of particles by flocculation (von Wachenfeldt & Tranvik 2008) a process which may be promoted by UV-light (von Wachenfeldt et al. 2008). It is also feasibly that inflow of terrestrial particles has increased due to higher precipitation. To get a more detailed picture of the development of turbidity in lake Viken it would be relevant to investigate the sediment layers from present and back in time to test if there is a shift from phytoplankton residues to other kinds of particles of other origins.Other factors, as well, such as littoral vegetation, land use like drainage of the catchment and food web structure (i.e. fish species and zoo plankton) of the lake may be important factors to explain the level and nature of turbidity. According to people living close to Lake Viken, wide riparian zones were earlier covered by reed belts, but these disappeared during the 1980s. They testify about decreases in pike catches and increased amounts of Canadian geese since then. During the moulting period the geese forage in the water and by grazing on common reed therefore can reduce the prevalence of reed. In nearby Lake Vänern geese foraging on common reed have been shown to inhibit their propagation (Palm 2009). Less of submerged macrophytes may promote turbidity by increasing re-suspension of sediment and by increased erosion in the riparian zone by stabilizing the sediment and also functioning as breakwaters (Jackson & Starrett 1959, Dieter 1990, James & Barko 1990, Petticrew & Kalff 1992). Also phytoplankton are less abundant in macrophyte stands as a result of light and nutrient competition and also because they constitute refugia for zoo-plankton (Wium-Andersen et al. 1982, Timms & Moss 1984).A decrease in piscivores (e.g. pike) probably results in more bentivorous cyprinids that by foraging in the sediment also contribute to turbidity by causing re -suspension (Hansson et al. 1998).Increase in turbidity and colour (DOC) may result in a negative spiral of descending water quality. Piscivores will have difficulties finding their prey, i.e cyprinides, who by their foraging on bentic fauna, zoo -plankton and macrophytes continue to worsen the quality of water. Due to less sunlight penetration macrophytes will have difficulties to establish at the bottom. Absence of vegetation means destabilized sediments more prone to re-suspension.As mentioned above, suspension of sediment can induce the DOC production when it breaks down, and in this way loss of sediment stability also can contribute to higher DOC -levels.
13
4.2 Snapshot -study4.2.1 Gradient in Lake VikenIn the western part of lakeViken the impact of river Edsån could be assumed less than in eastern part if there was a current from the west towards east. The gradient in DOC-levels from the western part to Brosundet in east was low, indicating quite good mixing of the water. This argues against the idea that Lake Viken should be considered as two parts where the eastern part has little influence on the western part. Suspended material, on the other hand, showed higher values in the western part and was declining towards the eastern outlet.4.2.2 LoadsThe snapshot analysis of the inlets to Lake Viken showed large spatial differences in concentrations and transport. River Edsån, which is the major inlet, had much lower concentration of DOC than the lake it self but contributed most DOC due to high flow.4.2.3 In-lake lossThe lack of a gradient in DOC along the lake concomitant with a decrease in particles supports that the loss of particulate material by sedimentation is faster than the degradation of DOC. Hence, sedimentation occurs at a time scale faster than the mixing of the lake, while DOC is lost at a rate that is slow compared to the mixing of the water throughout the lake basins.Loss of turbidity and suspended matter was 8% and 23% of ingoing amounts. Turbidity is the difference between absorbance of filtrated water and unfiltered. A reason for less loss of turbidity than of suspended material could be that heavier particles (mineral) were replaced by lighter (plankton). This change in kind of particles affects mass of suspended material but maintain turbidity. 4.2.4 CorrelationsProportions of mire in sub-catchments correlate positively with concentrations of DOC. This results where expected as wetlands are important sources of DOC (Eckhardt & Moore 1990). Wetlands has also been shown to have particularly high contribution to water DOC-levels during low flows (Laudon et al. 2011), which was the case when the samples where collected. At higher flows, forest covered land could be expected to be of higher significance for DOC.Altitude correlated negatively with levels of DOC and nutrients (tab.1). This is consistent with earlier studies (Hope et al. 1997). The pretty weak correlation between proportion of mire in sub-catchments and altitude (R = -0.38), suggests that not merely the absence of mire makes upland areas emit less DOC.Mire and low-land seems to be most important terrain-factors for DOC -levels run -off water. At higher precipitation and flows forested areas may increase in contribution.Agricultural land correlates positively with conductivity, turbidity, suspended material and phosphorus.
4.3 Importance of the drained bog Ryholms stormosseThe contribution of DOC from the bog Ryhoms stormosse was about 15% to the western part of lake Viken and 4% to the whole lake. Further investigations are necessary to define the impact of the drainage. Compared to the intact bog, Myrhulta mosse, the DOC-level was about 50% higher in the bog Ryholms Stormosse. The results are supported by previous
14
studies in which drainages of blanket bogs and peat covered catchments have been shown to increase the release of DOC (Conway & Millar 1960, Mitchell and Mc Donald 1992, Holden et al. 2004).Based on the measured transport and the difference in concentrations in water from the two bogs, the drainage may have increased the contribution of Ryholms Stormosse to Lake Viken as a whole by about 2 % units. Drainage of other land areas and factors as higher precipitation, pH and forestry are likely to have contributed to higher DOC -levels as well.According to the Water Owners Association of Lake Viken and also the peat mining company, Rölunda produkter, there has been a major emission of sediment in 2010 upon ditching. This is said to have affected the lake much at the time. Future emissions of sediment may be avoided by improved sedimentation ponds. However, a Canadian study indicated that the ponds have to be very large and the cleaning process must be carefully conducted not to generate loss of sediment (Pavey et al. 2007).Suspended sediments concentrations (SSC) in run off from drained and harvested bogs in Canada has been shown to be significantly higher than from natural bogs (Pavey et al. 2007). The recommended daily maximum concentration issued in the current Canadian province was 25 mg suspended sediment. This limit was exceeded 30% of the time for natural bogs and 70% of the time for harvested bogs. More extreme loads of 500 mg/l or more was present only 4% of the time in a natural bog but 30 % in harvested bogs (Pavey et al. 2007). The loads are highest in autumn and spring when flows are highest. The ratio of drainage area to pond volume (m2/m3) could in part explain the difference between different harvested mires. A higher m2/m3 -ratio was shown to be related to higher SSC. The mean ratio in the study was 240 m2/m3. Transferred to Ryholms stormosse this ratio suggests a total pond volume of 23000 m3 if a harvested area of 550 ha is assumed. Considering ponds to be 5 m wide and 2 m deep, the total length of ponds should be 2.3 km to give a total volume of 23000 m3. But the study showed that the volume of the settling ponds was not sufficient. Entertainment of dams could have both good and bad effect on retention efficiency. The cleaning process may release material to the streams. Comparison with the Canadian study above shows that the measured values for suspended material in this study are low, 1mg/l for natural the bog Myrhulta mosse and 3 mg/l for the drained bog Ryholms stormosse, and that much higher values could be expected by higher flows. This further support the assumption that emissions of suspended material occur very intermittently and that attempts for measurements has to be continuously conducted in order to monitor the transported amounts.The ammonium (NH3 – NH4+) concentration in the drainage water from the bog Ryholms stormosse was remarkably high. Ammonium can affect lake-ecosystems in several ways depending on current physical conditions. Acute poisoning of fishes and other aquatic animals is caused by non ionic ammonia. Particularly sensitive species have given us limits that should not be exceeded. Harris et al. (1998) proposed that concentrations of ammonia (NH3) should never exceed 0,01-0,02 mg/liter. This was not exceeded in river Örlan nor in the main drainage stream of the bog Ryholms stormosse where the measured NH4-concentration was 1.28 mg/litre. According to (Emmerson et al.) the proportion of NH3 could be assumed be 0,0397 % of NH4 at pH 6.0 (pH 5.9 was mesured at the main drainage stream.) and a temperature of 20 Co. This would result in a NH3-concentration of 0,0003 mg/l and wich would be harmless.
15
4.4 Conclusions and outlookThe most obvious changes in water quality in lake Viken, from year 1965- 2012 were increased pH and DOC-level and decreased concentration of tot-P. Precipitation increased in the same pattern as DOC. Turbidity showed no trend but perhaps it has been a change in origin of particles. High proportion of mire and low altitudes seem to be the most important landscape-factors to explain high DOC-levels. The drainage of the bog Ryholms stormosse increased the transport of DOC to lake Viken about 2%. Measurements of transport of suspended matter have to be conducted continuously during a long period. This was not the case in this study. Anyway, the concentration of suspended material was much higher in water from the drained bog. In order to slow down further browning of lake Viken, blocking of ditches in peat-soils and less forestry activity, could be done on the shorter term. On longer term it may be important to reverse the trend of global warming. The turbidity of the lake could possibly be decreased by increased reed-belts as a result of geese-hunting. It is also important to improve conditions for piscivores.
5. AcknowledgmentsThanks to Anders Ahlenius and Herbert Andersson in Töreboda for hosting and guiding around lake Viken, Jan-Erik Johansson for help in lab, Lisa Olausson for walking with me around the bog Ryholms stormosse, Lars Tranvik for supervising, Jovana Kokic for opposing and Anna-Kristina Brunberg for refining this report!
16
ReferencesARVOLA, L., RÄIKE, A., KORTELAINEN P. & JÄRVINEN, M. 2004. The effect of climate and land use
on TOC concentrations in Finnish rivers. Borial Environment Research, 9, 381-387.
CONWAY, V.M. & MILLAR, A. 1960. The hydrology of some small peat-covered catchments in the northern Pennines. Journal of the Institute of Water Engineers, 14, 415–24.
CRUMTON, W.G., ISENHART, T.M. & MITCHELL, P.D. 1992. Nitrate and organic N analysis with second-derivate spectroscopy. Limnology & Oceanography 37, 907-913.
DE LANGE H.J., MORRIS D.P. & WILLIAMSON CE. 2003. Solar ultraviolet photodegradation of DOC may stimulate fresh water food webs. J Plankton Res., 25, 111−117
DIETER, C.D. 1990. The importance of emergent vegetation in reducing sediment resuspension in wetlands. Journal of Freshwater Ecology, 5, 467–473.
ECKHARDT, B.W. & MOORE, T.R. 1990, Controls on dissolved organic carbon concentrations in streams, southern Quebec. Canadian journal of fisheries and aquatic sciences, 47, 1537–1544.
EMERSON, K., R.C. RUSSO, R.E. LUND, & R.V. THURSTON. 1975. Aqueous ammonia equilibrium calculations: effect of pH and temperature. Journal of the Fisheries Research Board of Canada, 32, 2379-2383.
FREEMAN, C., EVANS, C.D., MONTIETH, D.T., REYNOLDS, B. & FENNER, N. 2001. Export of organic carbon from peat soils. Nature, 412, 785–786.
GERRITSEN, J. & BRADLEY, S. W. 1987. Electrophoretic mobility of natural particles and cultured organisms in fresh-waters. Limnology & Oceanography, 32, 1049–1058.
HANSSON, L-A., ANNADOTTER, H., BERGMAN, E., HAMRIN, S.F., JEPPERSEN, E., KAIRESALO, T., LUOKKANEN, E., NILSSON, P-Å., SØNDERGAARD, M. & STRAND, J. 1998. Biomanipulation as an application of food -chain theory: constraints, sythesis and recommendations for temperate lakes. Ecosystems, 1, 558-574.
HARRIS, J.O., MAGUIRE, G.B.,EDWARDS, S. &HINDRUM, S.M. 1998. Effect of ammonia on the growth rate and oxygen consumption of juvenile greenlip abalone, Haliotis laevigata Donovan. Aquaculture, 160, 259–272.
HONGVE, D. 2004. Increased colour and organic acid concentrations in Norwegian forest lakes and drinking water - a result of increased precipitation? Aquatic sciences, 66, 231 -238.
HOLDEN, J., CHAPMAN, P.J. & LABADZ, J.C. 2004. Artificial drainage of peatlands: hydrological and hydrochemical process and wetland restoration. Progress in Physical Geography 28,1, 95–123.
HOPE, D., BILLETT, M.F., MILNE, R. & BROWN, T. A. W. 1997. Exports of organic carbon in British rivers.. Hydrological Processes, 11, 325–344.
HOPE, D., BILLETT,M. F. & CRESSER, M.S. 1997. The export of organic carbon in two river systems in N E Scotland, Journal of Hydrology, 193, 61–82, 1997.
JACKSON, H.O. & STARRETT W.C. 1959. Turbidity and sedimentation at lake Chatauqua, Illinois. Journal of Wildlife Management, 23,157–168.
JAMES W.F. & BARKO J.W. 1990. Macrophyte influences on the zonation of sediment accretion and composition in a north-temperate lake. Archiv für Hydrobiologie, 20, 129–142.
JANSSON, M., PERSSON L., DE ROOS AM., JONES R. & TRANVIK LJ. 2007. Terrestrial carbon and intraspecific size-variation shape lake ecosystems. Trends in Ecology and Evolution, 22, 316–22.
JANSSON, M., HICKLER, T., JONSSON, A. & KARLSSON, J. 2008. Links between terrestrial primary
17
production and bacterial production and respiration in lakes in a climate gradient in subarctic Sweden. Ecosystems, 11, 367–376.
KARLSSON, J., BYSTRÖM, P., ASK, J., ASK, P., PERSSON, L. & JANSSON, M. 2009. Light limitation of nutrient-poor lake ecosystems. Nature, 460, 506-509.
KRITZBERG, E. S.& EKSTRÖM, S. M. 2011. Increasing iron concentrations in surface waters – a factor behind brownification? Biogeosciences, 9, 1465–1478.
LAUDON, H., BERGGREN. M., ÅGREN, A., BUFFAM, I., BISHOP, K., GRABS, T. JANSSON, M. & KÖHLER, S. 2011, Patterns and Dynamics of Dissolved Organic Carbon (DOC) in Boreal Streams: The Role of Processes, Connectivity and Scaling. Ecosystems,14, 880 - 893.
LAUDON, H., HEDTJÄRN, J., JAKOB SCHELKER, J., BISHOP, K., SØRENSEN, R. & ANNELI ÅGREN. 2009.Response of Dissolved Organic Carbon following Forest Harvesting in a Boreal Forest. Ambio, 38, 381-386.
LINDELL, M. J., GRANÉLI, W. & TRANVIK, L. J. 1995. Enhanced bacterial growth in response to photochemical transformation of dissolved organic matter. Limnology & Oceanography, 40, 195–199.
MATSON, P., LOHSE, K.A. & HALL, S.J. 2002. The globalization of nitrogen deposition: consequences for terrestrial ecosystems. Ambio, 31, 113–119.
MCDOWELL, W.H. & LIKENS, G.E. 1988. Origin, composition, and flux of dissolved organic-carbon in the Hubbard Brook valley. Ecological Monographs, 58, 177–195.
MENZEL, D.H. & CORWIN, N. 1965. The measurement of total phosphorous in seawater based on liberation of organically bound fractions by persulphate oxidation. Limnology & Oceanography, 10, 280-282.
MITCHELL, G. & MCDONALD A.T. 1992. Discolouration of water by peat following induced drought and rainfall simulation. Water Research, 26, 321–326.
MITCHEL G. & MC DONALD A.T. 1995. Catchment charactrization as a tool for upland water quality management. Journal of Environmental Management, 44, 83-95.
MILLER, W.L. & ZEPP, R.G. 1995. Photochemical production of dissolved inorganic carbon from terrestrial organic matter: significance to the oceanic organic carbon cycle. Geophysical Research Letters, 22, 417–420.
MONTEITH, D.T., STODDARD, J.L., EVANS, C.D., DE WIT H.A., FORSIUS, M., HOGASEN, T., WILANDER, A., SKJELKVALE, B.L., JEFFRIES, D.S., VUORENMAA, J., KELLER, B., KOPACEK, J. & VESELY, J. 2007. Dissolved organic carbon trends resulting from changes in atmospheric deposition chemistry. Nature, 450, 537–9.
MORAN, M.A. & ZEPP, R.G. 1997. Role of photoreactions in the formation of biologically labile compounds from dissolved organic matter. Limnology & Oceanography, 42, 1307–1316.
MORRIS, D.P., ZAGARESE H., WILLIAMSON, C. E., BALSEIRO E.G., HARGREAVES, B. R., MODENUTTI, B., MOELLER, R. & QUEIMALINOS, C. 1995. The attenuation of solar UV radiation in lakes and the role of dissolved organic carbon. Limnology & Oceanography, 40, 1381-1391.
MURPHY J., & RILEY I. P. 1962. A modified single solution method for the determination of phosphate in natural waters. Analytica Chimica Acta, 27, 31-6.
NEAL, C., REYNOLDS, B., WILKINSON, J., HILL, T., NEAL, M., HILL, S. & HARROW, M. 1998. The impacts of conifer harvesting on runoff water quality: a regional survey for Wales. Hydrology and Earth System Sciences, 2, 323–344.
NIEMINEN, M., 2004. Export of dissolved organic carbon, nitrogen and phosphorus following clear-cutting of three Norway spruce forests growing on drained peatland in southern Finland. Silvia
18
Fennica 38, 123-132.
PALM, E. 2009. Gåsbete och vasstäthet i fyra Vänervikar. Delprojekt i miljöeffektuppföljningen av Vänerns nya vattenreglering. Rapport nr 50. Vänerns vattenvårdsförbund.
PAVEY, B., SAINT-HILAIRE,A., COURTENAY, S., OUARDA, T. & BOBÉE, B. 2007. Exploratory study of suspended sediment concentrations downstream of harvested peat bogs. Environmental Monitoring and Assessment, 135, 369-382.
PETTICREW E.L. & KALFF J. 1992. Water flow and clay retention in submerged macrophyte beds. Canadian Journal of Fisheries and Aquatic Sciences, 49,2483–2489.
SCHELKER, J., EKLÖF, K., BISHOP, K. & LAUDON, H. 2012.Effects of forestry operations on dissolved organic carbon concentrations and export in boreal first-order streams. J. Geophysical Research, 117.
SCHINDLER, D. W. 1974. Eutrophication and Recovery in Experimental Lakes: Implications for Lake Management. Science, New Series, 184, 897-899.
SLU 2013. Swedish University of Agricultural Sciences. WWW database of water chemistry of Lake Viken and River Forsviksån 2013: http://info1.ma.slu.se/max/www_max.acgi$Station?ID=Intro&pID=66&sID=2799, http://info1.ma.slu.se/max/www_max.acgi$Station?ID=Intro&pID=69&sID=2966.Year visited 2013.
SMHI 2013. Swedish Metrological and Hydrological Institute. WWW database of climate data 2013, Climate research at Rossby Centre: www.smhi.se/klimatdata/Framtidens-klimat/Klimatscenarier/2.2252/2.2264?area=eur&var=n&sc=rcp85&seas=ar&dnr=0&sx=0&sy=100#area=eur&dnr=0&sc=rcp85&seas=ar&var=n. Year visited 2013.
TRANVIK, LJ. & JANSSON, M. 2002. Terrestrial export of organic carbon. Nature, 415, 861-862.
TIMMS, R.M. & MOSS B. 1984. Prevention of growth of potentially dense phytoplankton populations by zooplankton grazing, in the presence of zooplanktivorous fish in a shallow wetland ecosystem. Limnology and Oceanography, 29, 472–486.
VIKENS FISKEVÅRDSOMRÅDESFÖRENING (orally), Annual general meeting, spring 2012, Halna bygdegård, Töreboda.
VON WACHENFELDT, E., SOBEK, S., BASTVIKEN, D. & TRANVIK, L. J. 2008. Linking allochthonous dissolved organic matter and boreal lake sediment carbon sequestration: The role of light-mediated flocculation. Limnology & Oceanography, 53, 2416–2426.
VON WACHENFELDT, E. & TRANVIK, L. J. 2008. Sedimentation in boreal lakes— the role of flocculation of allochthonous dissolved organic matter in the water column. Ecosystems, 11, 803–814.
WATTS, C.D., NADEN, P.S., MACHELL, J. & BANKS, J. 2001. Long term variation in water colour from Yorkshire catchments. Science of the Total Environment, 278, 57-72.
WIUM-ANDERSEN S.U., ANTHONI U., CHRISTOPHERSEN C. & HOUEN G. (1982) Allelopathic effects on phytoplankton by substances isolated from aquatic macrophytes (Charales). Oikos, 39, 187–190.
WORRALL, F., BURT, T.P. & SHEDDEN, R. 2003. Long terms records of riverine carbon flux. Biogeochemistry, 64, 165–178.
WORRALL, F., BURT, T.P., ADAMSON, J.K. 2004. Can climate change explain increases in DOC flux from upland peat catchments? Science of the Total Environment 326, 95–112.
Worrall, F. & Burt, T.P. 2007. Trends in DOC concentration in Great Britain. Journal of Hydrology, 346, 81 – 92.