294
DISTILLATION – ADVANCES FROM MODELING TO APPLICATIONS Edited by Sina Zereshki
| Date post: | 23-Oct-2014 |
| Category: |
Documents |
| Upload: | mrrightisme8396 |
| View: | 532 times |
| Download: | 5 times |
DISTILLATION – ADVANCES FROM MODELING TO
APPLICATIONS
Edited by Sina Zereshki

Distillation – Advances from Modeling to Applications Edited by Sina Zereshki Published by InTech Janeza Trdine 9, 51000 Rijeka, Croatia Copyright © 2012 InTech All chapters are Open Access distributed under the Creative Commons Attribution 3.0 license, which allows users to download, copy and build upon published articles even for commercial purposes, as long as the author and publisher are properly credited, which ensures maximum dissemination and a wider impact of our publications. After this work has been published by InTech, authors have the right to republish it, in whole or part, in any publication of which they are the author, and to make other personal use of the work. Any republication, referencing or personal use of the work must explicitly identify the original source. As for readers, this license allows users to download, copy and build upon published chapters even for commercial purposes, as long as the author and publisher are properly credited, which ensures maximum dissemination and a wider impact of our publications. Notice Statements and opinions expressed in the chapters are these of the individual contributors and not necessarily those of the editors or publisher. No responsibility is accepted for the accuracy of information contained in the published chapters. The publisher assumes no responsibility for any damage or injury to persons or property arising out of the use of any materials, instructions, methods or ideas contained in the book. Publishing Process Manager Martina Blecic Technical Editor Teodora Smiljanic Cover Designer InTech Design Team First published March, 2012 Printed in Croatia A free online edition of this book is available at www.intechopen.com Additional hard copies can be obtained from [email protected] Distillation – Advances from Modeling to Applications, Edited by Sina Zereshki p. cm. ISBN 978-953-51-0428-5


Contents
Preface IX
Part 1 Modeling and Simulation 1
Chapter 1 Modeling and Control Simulation for a Condensate Distillation Column 3 Vu Trieu Minh and John Pumwa
Chapter 2 Energy Conservation in Ethanol-Water Distillation Column with Vapour Recompression Heat Pump 35 Christopher Enweremadu
Chapter 3 The Design and Simulation of the Synthesis of Dimethyl Carbonate and the Product Separation Process Plant 61 Feng Wang, Ning Zhao, Fukui Xiao, Wei Wei and Yuhan Sun
Chapter 4 Batch Distillation: Thermodynamic Efficiency 91 José C. Zavala-Loría and Asteria Narváez-García
Part 2 Food and Aroma Concentration 107
Chapter 5 Distillation of Natural Fatty Acids and Their Chemical Derivatives 109 Steven C. Cermak, Roque L. Evangelista and James A. Kenar
Chapter 6 Changes in the Qualitative and Quantitative Composition of Essential Oils of Clary Sage and Roman Chamomile During Steam Distillation in Pilot Plant Scale 141 Susanne Wagner, Angela Pfleger, Michael Mandl and Herbert Böchzelt
Chapter 7 Distillation of Brazilian Sugar Cane Spirits (Cachaças) 159 Sergio Nicolau Freire Bruno

VI Contents
Chapter 8 Spirits and Liqueurs from Melon Fruits (Cucumis melo L.) 183 Ana Briones, Juan Ubeda-Iranzo and Luis Hernández-Gómez
Part 3 New Applications and Improvments 197
Chapter 9 Separation of Odor Constituents by Microscale Fractional Bulb-To-Bulb Distillation 199 Toshio Hasegawa
Chapter 10 Mass Transport Improvement by PEF – Applications in the Area of Extraction and Distillation 211 Claudia Siemer, Stefan Toepfl and Volker Heinz
Chapter 11 Membrane Distillation: Principle, Advances, Limitations and Future Prospects in Food Industry 233 Pelin Onsekizoglu
Chapter 12 The Separation of Tritium Radionuclide from Environmental Samples by Distillation Technique 267 Poppy Intan Tjahaja and Putu Sukmabuana


Preface
Distillation is probably one of the oldest systematic processes in the field of chemistry and chemical engineering which goes back to the first century AD. The initial concepts were applied in the production of distilled water. Distillation was a single step batch process at the beginning. However, fractional distillation as is used today was developed more than 10 centuries later.
Distillation has a wide application range in the industries from food to petroleum refinery nowadays. Distillation towers are still the symbol of chemical and petrochemical industry. During decades many improvements and optimizations have been made to this process along with the new technologies and findings, particularly before the 20th century. Although distillation is considered as a matured industrial process, there are yet many ways open for research in this field. Combining other technologies with distillation in the form of hybrid processes in order to merge the advantages of the both processes and avoid the inherent weaknesses of each process, e.g. distillation of azeotropic mixtures, is only one of the new improvements to the field.
Modeling of distillation process significantly helped its understanding and improvement with the minimum costs. This includes mathematical and theoretical basics as well as computer aided modeling and simulations. Therefore a main section of this book is dedicated to the mathematical modeling and simulation of distillation. The next section will discuss few experimental case studies mainly in the field of food processing and odor and aroma extraction. Several new concepts and applications of other novel technologies in distillation field are moved to the third section. The majority of the chapters in this section are on food applications as well.
The respected authors of the chapters are well-known professionals and it is my pleasure to acknowledge their kind contribution to this book. The collected chapters provide valuable knowledge on research and development of distillation technology. Both the fundamental concepts and practical experiences provided by the learned authors could certainly be a useful insight for the interested researchers in distillation field.
X Preface
As the editor, I would like to appreciate again the nice work of all the authors of different chapters as well as the open access publisher which did the best to provide a quality book.
February 2012
Dr. Sina Zereshki
Chemical Engineering Department, Kermanshah University of Technology, Kermanshah
Iran


Part 1
Modeling and Simulation


1
Modeling and Control Simulation for a Condensate Distillation Column
Vu Trieu Minh and John Pumwa Papua New Guinea University of Technology (UNITECH), Lae
Papua New Guinea
1. Introduction Distillation is a process that separates two or more components into an overhead distillate and a bottoms product. The bottoms product is almost exclusively liquid, while the distillate may be liquid or a vapor or both.
The separation process requires three things. Firstly, a second phase must be formed so that both liquid and vapor phases are present and can contact each other on each stage within a separation column. Secondly, the components have different volatilities so that they will partition between the two phases to a different extent. Lastly, the two phases can be separated by gravity or other mechanical means.
Calculation of the distillation column in this chapter is based on a real petroleum project to build a gas processing plant to raise the utility value of condensate. The nominal capacity of the plant is 130,000 tons of raw condensate per year based on 24 operating hours per day and 350 working days per year. The quality of the output products is the purity of the distillate, xD, higher than or equal to 98% and the impurity of the bottoms, xB, may be less/equal than 2%. The basic feed stock data and its actual compositions are based on the other literature (PetroVietnam Gas Company,1999).
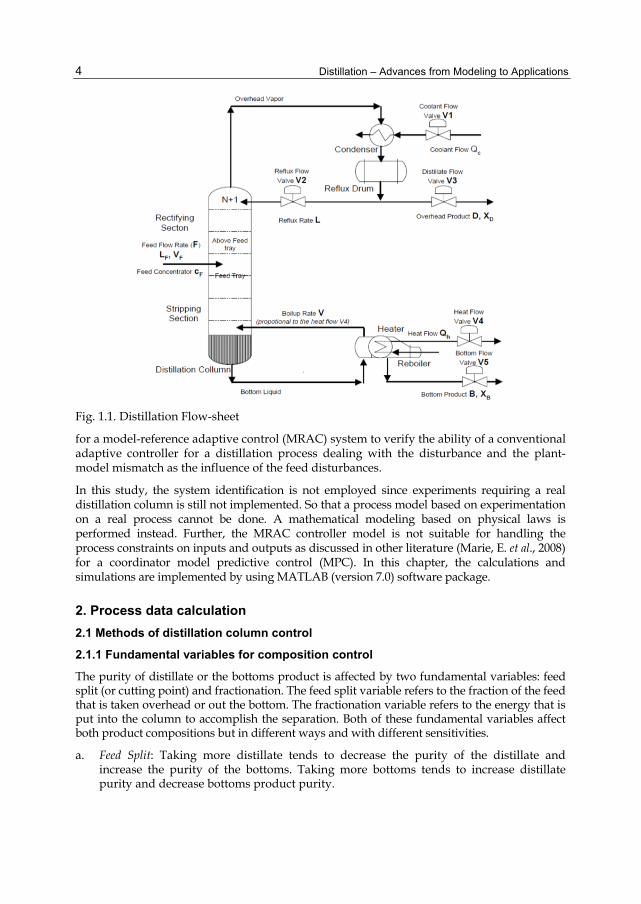
The distillation column contains one feed component, Fx . The product stream exiting the top has a composition of Dx of the light component. The product stream leaving the bottom contains a composition of Bx of the light component. The column is broken in two sections. The top section is referred to as the rectifying section. The bottom section is known as the stripping section as shown in Figure 1.1.
The top product stream passes through a total condenser. This effectively condenses all of the vapor distillate to liquid. The bottom product stream uses a partial re-boiler. This allows for the input of energy into the column. Distillation of condensate (or natural gasoline) is cutting off light components as propane and butane to ensure the saturated vapor pressure and volatility of the final product.
The goals of this chapter are twofold: first, to present a theoretical calculation procedure of a condensate column for simulation and analysis as an initial step of a project feasibility study, and second, for the controller design: a reduced-order linear model is derived such that it best reflects the dynamics of the distillation process and used as the reference model
Distillation – Advances from Modeling to Applications 4
Fig. 1.1. Distillation Flow-sheet
for a model-reference adaptive control (MRAC) system to verify the ability of a conventional adaptive controller for a distillation process dealing with the disturbance and the plant-model mismatch as the influence of the feed disturbances.
In this study, the system identification is not employed since experiments requiring a real distillation column is still not implemented. So that a process model based on experimentation on a real process cannot be done. A mathematical modeling based on physical laws is performed instead. Further, the MRAC controller model is not suitable for handling the process constraints on inputs and outputs as discussed in other literature (Marie, E. et al., 2008) for a coordinator model predictive control (MPC). In this chapter, the calculations and simulations are implemented by using MATLAB (version 7.0) software package.
2. Process data calculation 2.1 Methods of distillation column control
2.1.1 Fundamental variables for composition control
The purity of distillate or the bottoms product is affected by two fundamental variables: feed split (or cutting point) and fractionation. The feed split variable refers to the fraction of the feed that is taken overhead or out the bottom. The fractionation variable refers to the energy that is put into the column to accomplish the separation. Both of these fundamental variables affect both product compositions but in different ways and with different sensitivities.
a. Feed Split: Taking more distillate tends to decrease the purity of the distillate and increase the purity of the bottoms. Taking more bottoms tends to increase distillate purity and decrease bottoms product purity.
Modeling and Control Simulation for a Condensate Distillation Column 5
b. Fractionation: Increasing the reflux ratio (or boil-up rate) will reduce the impurities in both distillate and the bottoms product.
Feed split usually has a much stronger effect on product compositions than does fractionation. One of the important consequences of the overwhelming effect of feed split is that it is usually impossible to control any composition (or temperature) in a column if the feed split is fixed (i.e. the distillate or the bottoms product flows are held constant). Any small changes in feed rate or feed composition will drastically affect the compositions of both products, and will not be possible to change fractionation enough to counter this effect.
2.1.2 Degrees of freedom of the distillation process
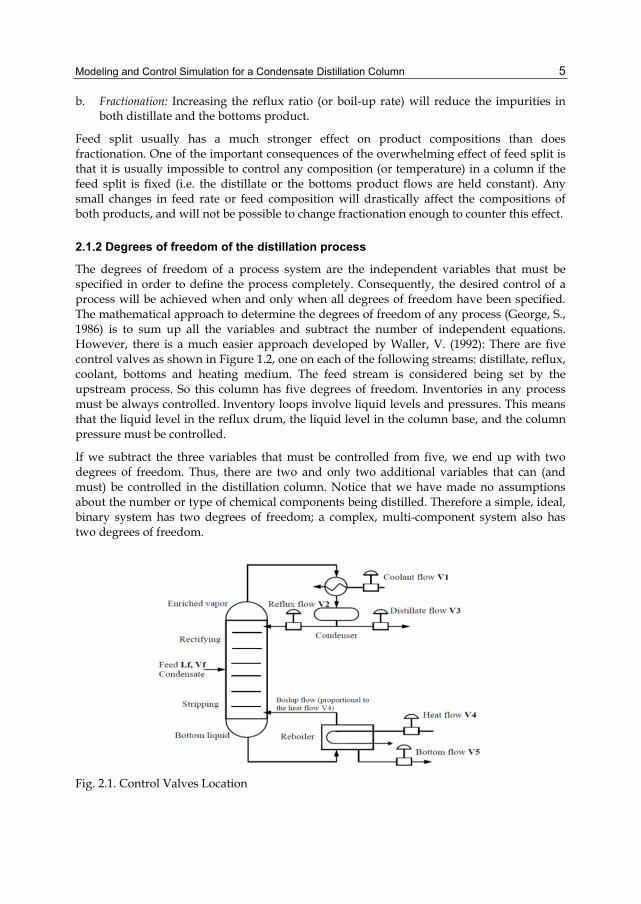
The degrees of freedom of a process system are the independent variables that must be specified in order to define the process completely. Consequently, the desired control of a process will be achieved when and only when all degrees of freedom have been specified. The mathematical approach to determine the degrees of freedom of any process (George, S., 1986) is to sum up all the variables and subtract the number of independent equations. However, there is a much easier approach developed by Waller, V. (1992): There are five control valves as shown in Figure 1.2, one on each of the following streams: distillate, reflux, coolant, bottoms and heating medium. The feed stream is considered being set by the upstream process. So this column has five degrees of freedom. Inventories in any process must be always controlled. Inventory loops involve liquid levels and pressures. This means that the liquid level in the reflux drum, the liquid level in the column base, and the column pressure must be controlled.
If we subtract the three variables that must be controlled from five, we end up with two degrees of freedom. Thus, there are two and only two additional variables that can (and must) be controlled in the distillation column. Notice that we have made no assumptions about the number or type of chemical components being distilled. Therefore a simple, ideal, binary system has two degrees of freedom; a complex, multi-component system also has two degrees of freedom.
Fig. 2.1. Control Valves Location

Distillation – Advances from Modeling to Applications 6
2.1.3 Control structure
The manipulated variables and controlled variables of a distillation column are displayed in the Table 2.1 and in the Figure 2.1.
Controlled variables Manipulated variables Control valve 1 Column pressure Condenser duty Coolant flow V1 2 Concentration (temperature) of distillate Reflux flow rate Reflux flow V2 3 Liquid level in the reflux drum Distillate flow rate Distillate flow V3 4 Concentration (temperature) of bottoms Re-boiler duty Heat flow V4 5 Liquid level in the column base Bottoms flow rate Bottom flow V5
Table 2.1. Manipulated variables and controlled variables of a distillation column
Selecting a control structure is a complex problem with many facets. It requires looking at the column control problem from several perspectives:
Local perspective considering the steady state characteristics of the column. Local perspective considering the dynamic characteristics of the column. Global perspective considering the interaction of the column with other unit operations
in the plant.
2.1.4 Energy balance control structure (L-V)
The L-V control structure, which is called energy balance structure, can be viewed as the standard control structure for dual composition control of distillation. In this control structure, the reflux flow rate L and the boil-up flow rate V are used to control the “primary” outputs associated with the product specifications. The liquid holdups in the drum and in the column base (the “secondary” outputs) are usually controlled by distillate flow rate D and the bottoms flow rate B.
2.1.5 Material balance control structure (D-V) and (L-B)
Two other frequently used control structures are the material balance structures (D-V) and (L-B). The (D-V) structure seems very similar to the (L-V) structure. The only difference between the (L-V) and the (D-V) structures is that the roles of L and D are switched.
2.2 Distillation process calculation
2.2.1 Preparation for initial data
The plant nominal capacity is 130,000 tons of raw condensate per year based on 24 operating hours per day and 350 working days per year. The plant equipment is specified with a design margin of 10% above the nominal capacity and turndown ratio of 50%. Hence, the raw condensate feed rate for the plant is determined as follows:
130,000 15.47619 /
(24 ) x (350 )tons
Feed tons hourh working days
(2.1)

Modeling and Control Simulation for a Condensate Distillation Column 7
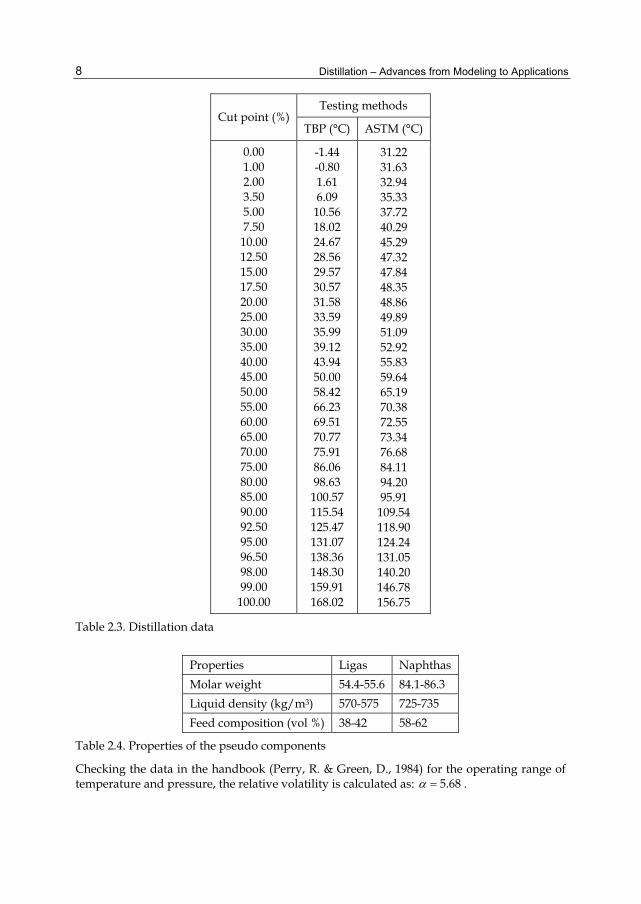
The actual composition of the raw condensate for the gas processing plant is always fluctuates around the average composition as shown in the Table 2.2. The distillation data for given raw condensate are shown in the Table 2.3.
Component Mole %
Propane Normal Butane Iso-butane Iso-pentane Normal Pentane Hexane Heptane Octane Nonane Normal Decane n-C11H24 n-C12H26 Cyclopentane MethylclopentaneBenzene Toluen O-xylene E-benzen 124-Mbenzen
0.00 19.00 26.65 20.95 10.05 7.26 3.23 1.21 0.00 0.00 1.94 2.02 1.61 2.02 1.61 0.00 0.00 0.00 0.00
Table 2.2. Compositions of raw condensate
The feed is considered as a pseudo binary mixture of Ligas (iso-butane, n-butane and propane) and Naphthas (iso-pentane, n-pentane, and heavier components). The column is designed with N=14 trays. The model is simplified by lumping some components together (pseudocomponents) and modeling of the column dynamics is based on these pseudocomponents only (Kehlen, H. & Ratzsch, M., 1987). Depending on the feed composition fluctuation, the properties of pseudo components are allowed to change within the range as shown in the Table 2.4.
Relative volatility:
Relative volatility is a measure of the differences in volatility between two components, and hence their boiling points. It indicates how easy or difficult a particular separation will be. The relative volatility of component i with respect to component j is defined as:
i
i iij
jj
j
yx K
Ky
x
where
mole fraction of component i in the vapor mole fraction of component i in the liquid
i
i
yx
Distillation – Advances from Modeling to Applications 8
Cut point (%)Testing methods
TBP (°C) ASTM (°C)
0.00 1.00 2.00 3.50 5.00 7.50 10.00 12.50 15.00 17.50 20.00 25.00 30.00 35.00 40.00 45.00 50.00 55.00 60.00 65.00 70.00 75.00 80.00 85.00 90.00 92.50 95.00 96.50 98.00 99.00
100.00
-1.44 -0.80 1.61 6.09
10.56 18.02 24.67 28.56 29.57 30.57 31.58 33.59 35.99 39.12 43.94 50.00 58.42 66.23 69.51 70.77 75.91 86.06 98.63 100.57 115.54 125.47 131.07 138.36 148.30 159.91 168.02
31.22 31.63 32.94 35.33 37.72 40.29 45.29 47.32 47.84 48.35 48.86 49.89 51.09 52.92 55.83 59.64 65.19 70.38 72.55 73.34 76.68 84.11 94.20 95.91
109.54 118.90 124.24 131.05 140.20 146.78 156.75
Table 2.3. Distillation data
Properties Ligas NaphthasMolar weight 54.4-55.6 84.1-86.3 Liquid density (kg/m3) 570-575 725-735 Feed composition (vol %) 38-42 58-62
Table 2.4. Properties of the pseudo components
Checking the data in the handbook (Perry, R. & Green, D., 1984) for the operating range of temperature and pressure, the relative volatility is calculated as: 5.68 .

Modeling and Control Simulation for a Condensate Distillation Column 9
Correlation between TBP and Equilibrium Flash Vaporization (EFV):
The EFV curve is converted from the TBP data according to (Luyben, W., 1990). The initial data are:
50%( ) 58.42TBPt °C
(30% 10%)( ) 35.99 24.67 11.32TBPt °C
Consulting TBP-EFV correlation chart, we obtain 50%( ) 5.2EFV TBPt °C
Therefore: 50%( ) 58.42 5.2 63.62EFVt °C
Repeating the above procedure for all TBP data, the EFV (1 atm) data are determined. Then convert the EFV (1 atm) data into the EFV (4.6 atm) data by using Cox chart. The results are shown in the Table 2.5.
Operating pressure:
The column is designed with 14 trays, and the pressure drop across each tray is 80 kPa. Thus the pressures at feed section and top section are 4.6 atm and 4 atm respectively.
% vol.TBP EFV (1 atm) EFV (4.6 atm)
t °C t t t °C t °C
I.B.P. -1.44 41.62 93 1.2 1.5
5 10.56 43.12 95 14.11 4
10 24.67 47.12 102 6.91 3
20 31.58 50.12 106 4.41 2.5
30 35.99 52.62 110 7.95 5
40 43.93 57.62 116 14.48 6
50 58.42 63.62 125 11.09 5.5
60 69.51 69.12 132 6.4 6.5
70 75.91 75.62 141 22.72 7.5
80 98.63 83.12 150 16.91 7
115.54 90.12 158
Table 2.5. Correlation between TBP and EFV of raw condensate

Distillation – Advances from Modeling to Applications 10
2.2.2 Calculation for feed section
The feed is in liquid-gas equilibrium with gas percentage of 38% volume. However it is usual to deeply cut 4% of the unexpected heavy components, which will be condensed and refluxed to the columnmore bottom. Thus there are two equilibrium phase flows: vapor VF=38+4=42% and liquid LF=100-42=58%.
Operating temperature:
Consulting the EFV curve (4.6 atm) of feed section, the required feed temperature is 118 0C corresponding to 42% volume point.
The phase equilibrium is shown in the Figure 2.2.
Fig. 2.2. The Equilibrium phase flows at the feed section
Where, VF: Vapor phase rate in the feed flow; LF: Liquid phase rate in the feed flow; Vf: Vapor flow arising from the stripping section; Lf: Internal reflux descending across the feed section.
The heavy fraction flow Lf dissolved an amount of light components is descending to the column bottom. These undesirable light components shall be caught by the vapor flow Vf arising to the top column. Vf, which can be calculated by empirical method, is equal to 28% vol. The bottoms product flow B is determined by yield curve as 62% vol. Hence, the internal reflux across the feed section can be computed as: f F fL B L V =62+28=32%vol.
Material balances for the feed section is shown in the Table 2.6. The calculation based on the raw condensate feed rate for the plant: 15.4762 tons/hour.
2.2.3 Calculation for stripping section
In the stripping section, liquid flows, which are descending from the feed section, include the equilibrium phase flow LF, and the internal reflux flow Lf. They are contacting with the arising vapor flow Vf for heat transfer and mass transfer. This process is accomplished with the aid of heat flow supplied by the re-boiler.
Main parameters to be determined are the bottoms product temperature and the re-boiler duty QB.

Modeling and Control Simulation for a Condensate Distillation Column 11
Stream Volume fraction% vol
Liquid flow ratem3/h
Liquid density ton/ m3
Mass flow rate ton/h
VF 42 10.9983 0.591 6.5000 Vf 28 7.2464 0.598 4.3333 Lf -32 -8.0527 0.615 -4.9524
Total light fraction 38 10.1923 0.577 5.8810
LF 58 12.3639 0.726 8.9762 Vf -28 -7.2464 0.598 -4.3333 Lf 32 8.0527 0.615 4.9524 B 62 13.1984 0.727 9.5952
Table 2.6. Material Balances for the Feed Section
The column base pressure is approximately the pressure at the feed section because pressure drop across this section is negligible. Consulting the EFV curve of stripping section and the Cox chart, the equilibrium temperature at this section is 144 °C. The re-boiler duty is equal to heat input in order to generate boil-up of stripping section an increment of 144-118=26 °C.
The material and energy balances for stripping section is displayed in the Table 2.7 and with one calTC = 4.184 J.
The re-boiler duty must be supplied: 36283.535 3983.575 2299.96 * 10BQ (kJ/h).
INLET ton/h kcal/kg kcal/h.103 kJ/h.103
LF 8.9762 68 610.3816 2553.837 Lf 4.9524 69 341.7156 1429.738
Total 13.9286 952.0972 3983.575 OUTLET
ton/h kcal/kg kcal/h.103 kJ/h.103 Vf 4.3333 165 714.9945 2991.537 B 9.5952 82 786.8064 3291.998
Total 13.9285 1501.801 6283.535
Table 2.7. Material and Energy Balances for Stripping Section
2.2.4 Calculation for rectifying section
The overhead vapor flow, which includes VF from feed section and Vf from stripping section, passes through the condenser (to remove heat) and then enter into the reflux drum. There exists two equilibrium phases: liquid (butane as major amount) and vapor (butane vapor, uncondensed gas – dry gas: C1, C2, e.g.). The liquid from the reflux drum is partly pumped back into the top tray as reflux flow L and partly removed as distillate flow D. The top pressure is 4 atm due to pressure drop across the rectifying section. The dew point of distillate is correspondingly the point 100% of the EFV curve of rectifying section. Also consulting the Cox chart, the top section temperature is determined as 46 °C .

Distillation – Advances from Modeling to Applications 12
The equilibrium phase flows at the rectifying sections are displayed in the Table 2.8.
INLET ton/h kcal/kg kcal/h.103 kJ/h.103
VF+Vf 10.8333 115 1245.83 5212.553 L0 L0 24 24xL0 100.416xL0
Total 10.8333+ L0 1245.83+24xL0 5212.553+100.416*L0
OUTLET ton/h kcal/kg kcal/h.103 kJ/h.103
Total light fraction+L0 5.8810+L0 97 570.457+97xL0 2386.792+405.848xL0 Lf 4.9524 16 79.2384 331.533
Total 10.8334+L0 649.695+97xL0 2718.326+405.848xL0
Table 2.8. Material and Energy Balances for Rectifying Section
Calculate the internal reflux flow L0: Energy balance, INLET=OUTLET:
0 0 0
0
5212.553 100.416 2718.326 405.848 8.166 (ton/h)Total light fraction + L 14.047 (ton/h)
L L L
Calculate the external reflux flow L: Enthalpy data of reflux flow L looked up the experimental chart for petroleum enthalpy are corresponding to the liquid state of 40 °C (liquid inlet at the top tray) and the vapor state of 46 °C (vapor outlet at the column top).
L inlet at 40 °C: H liquid(inlet) = 22 kcal/kg; L outlet at 46 °C: H vapor(outlet) = 106 kcal/kg. Then,
0 0L LH L H L (115 24)(8.166) (106 22) 8.847 (ton/h)L L .
2.2.5 Latent heat and boil-up flow rate
The heat input of QB (re-boiler duty) to the reboiler is to increase the temperature of
stripping section and to generate boil-up V0 as (Franks, R., 1972):
0
( )B B B FQ Bc t tV ,
where, QB: re-boiler duty – 2299.96*103 (kJ/h); B: flow rate of bottom product – 9595.2 (kg/h); cB: specific heat capacity – 85 (kJ/kg. °C); tF: inlet temperature – 118 (°C, the feed temperature); tB: outlet temperature – 144 °C; : the latent heat or heat of vaporization.
The latent heat at any temperature is described in terms of the latent heat at the normal
boiling point (Nelson, W., 1985): BB
TT
(kJ/kg), where, : latent heat at absolute
temperature T (kJ/kg); B : latent heat at absolute normal boiling point TB (kJ/kg); : correction factor obtained from the empirical chart. The result: =8500 (kJ/kg); V0=4540.42 (kg/h) or 77.67 (kmole/h); Vf=4333.3 (kg/h) or 74.13 (kmole/h). The average vapor flow
rate is rising in the stripping section
0 77.67 74.132 2
fV VV =75.9 (kmole/h).

Modeling and Control Simulation for a Condensate Distillation Column 13
2.2.6 Liquid holdup
Major design parameters to determine the liquid holdup on a tray, column base and reflux drum are calculated mainly based on other literature (Joshi, M., 1979; Wanrren, L. et al., 2005; & Wuithier, P., 1972):
Velocity of vapor phase arising in the column:
L Gn
G
C (m/s), where: L : density of
liquid phase; G : density of vapor phase; C: correction factor depending flow rates of two-
phase flows, obtained from the empirical chart , f fC P with
Gf
L
LP
G. The actual
velocity is normally selected that (0.80 0.85) n for paraffinic vapor. The diameter of
the column is calculated with the formula:
4
3600m
kV
D (m), where, mV : the mean flow of
vapor in the column. Result: 1.75kD (m).
The height of the column is calculated on distance of trays. The distance is selected on basis of the column diameter. The holdup in the column base is determined as:
2
4 ( )NB k B
BB
H D dM
MW
(kmole) (2.2)
where: NBH : normal liquid level in the column base (m); ( )BMW : molar weight of the bottom product (kg/kmole); Bd : density of the bottom product (kg/m3). Then,
23.14(1.4)(1.75) 726.5 31.11
4 78.6BM (kmole).
The holdup on each tray:
20.954 ( )
T k T
T
h D dM
MW(kmole), where, Th : average depth of
clear liquid on a tray (m); ( )TMW : molar weight of the liquid holdup on a tray (kg/kmole);
Td : the mean density of the liquid holdup on a tray (kg/m3). Then,
20.95(3.14)(0.28)(1.75) 680
4 75M =5.80 kmole.
The holdup in the reflux drum: Liquid holdup DM is equal to the quantity of distillate
contained in the reflux drum,
5( )
60f f
D
L DM (kmole), where, DM : holdup in the reflux
drum; fL : the reflux flow rate – (4952.4 kg/h)/(60.1 mole weight) = 82.4 kmole/h; fV : the
distillate flow rate – (4333.3 kg/h)/(58.2 mole weight) = 74.46 kmole/h. Then,
5(82.4 74.46) 13.07
60DM (kmole).

Distillation – Advances from Modeling to Applications 14
3. Mathematic model 3.1 Equations for flows throughout general trays
The total mole holdup in the nth tray Mn is considered constant, but the imbalance in the input and output flows is taken into account for in the component and heat balance equations as shown in Figure 3.1.
Fig. 3.1. A General nth Tray
Total mass balance:
1 1( )n
n n n nd M
L L V Vdt
(3.1)
Component balance:
1 1 1 1( )n n
n n n n n n n nd M x
L x L x V y V ydt
(3.2)
By differentiating (3.2) and substituting for (3.1), the following expression is obtained:
1 1 1 1 1 1( ) ( )( ) n n n n n n n n n nn
n
L x V y L V x V y xd xdt M
(3.3)
Energy balance:
1 1 1 1( )n n
n n n n n n n nd M h
h L h L H V H Vdt
(3.4)
or
1 1 1 1n n
n n n n n n n n n ndh dM
M h h L H V h L H Vdt dt
(3.5)
Because the term ndhdt
is approximately zero, substituting for the change of hold up ndMdt
in
(3.5), and rearranging the terms, the following expression is obtained:
Modeling and Control Simulation for a Condensate Distillation Column 15
1 1 1 1 1 1( )n n n n n n n
nn n
h L H V L V hV
H h (3.6)
where, n: tray nth; V: vapor flow; L: liquid flow; x: liquid concentration of light component; y: vapor concentration of light component; h: enthalpy for liquid; H: enthalpy for vapor.
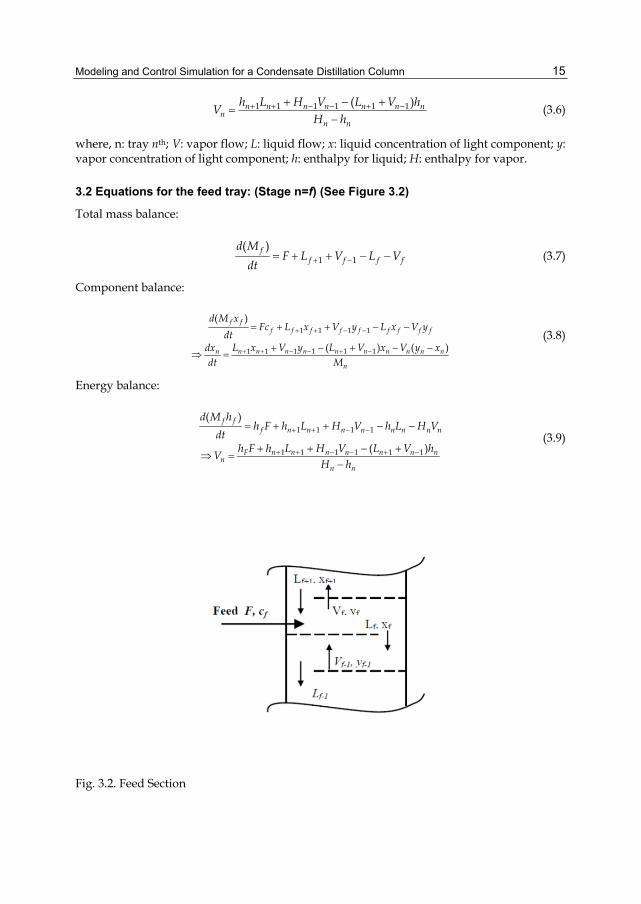
3.2 Equations for the feed tray: (Stage n=f) (See Figure 3.2)
Total mass balance:
1 1( )f
f f f f
d MF L V L V
dt (3.7)
Component balance:
1 1 1 1
1 1 1 1 1 1
( )
( ) ( )
f ff f f f f f f f f
n n n n n n n n n nn
n
d M xFc L x V y L x V y
dtL x V y L V x V y xdx
dt M
(3.8)
Energy balance:
1 1 1 1
1 1 1 1 1 1
( )
( )
f ff n n n n n n n n
F n n n n n n nn
n n
d M hh F h L H V h L H V
dth F h L H V L V h
VH h
(3.9)
Fig. 3.2. Feed Section
Distillation – Advances from Modeling to Applications 16
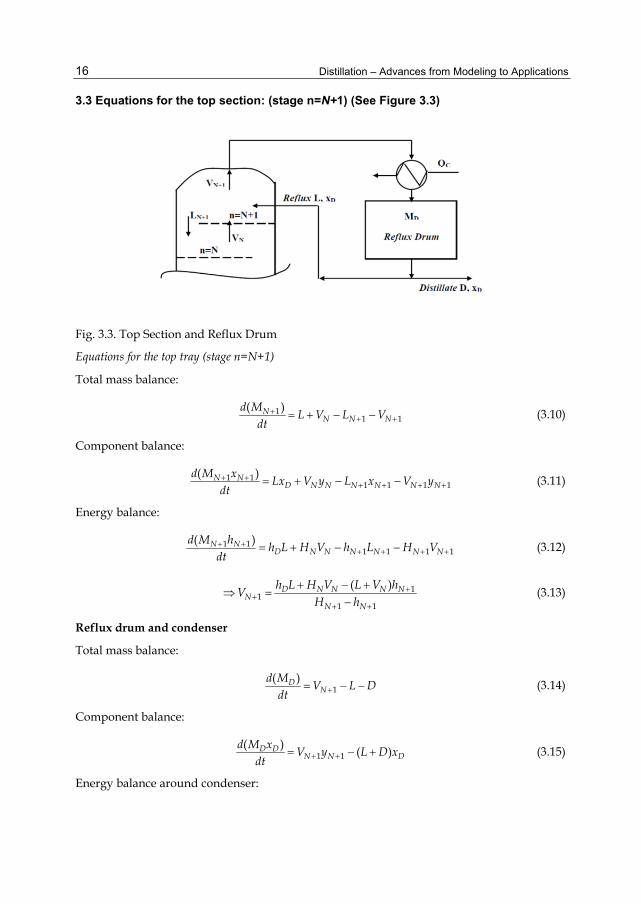
3.3 Equations for the top section: (stage n=N+1) (See Figure 3.3)
Fig. 3.3. Top Section and Reflux Drum
Equations for the top tray (stage n=N+1)
Total mass balance:
1
1 1( )N
N N Nd M
L V L Vdt
(3.10)
Component balance:
1 1
1 1 1 1( )N N
D N N N N N Nd M x
Lx V y L x V ydt
(3.11)
Energy balance:
1 1
1 1 1 1( )N N
D N N N N N Nd M h
h L H V h L H Vdt
(3.12)
1
11 1
( )D N N N NN
N N
h L H V L V hV
H h (3.13)
Reflux drum and condenser
Total mass balance:
1( )D
Nd M
V L Ddt
(3.14)
Component balance:
1 1( ) ( )D D
N N Dd M x
V y L D xdt
(3.15)
Energy balance around condenser:
Modeling and Control Simulation for a Condensate Distillation Column 17
The condenser duty CQ is equal to the latent heat required to condense the overhead vapor to bubble point:
( )C in in out out N N NQ H V h L V H h (3.16)
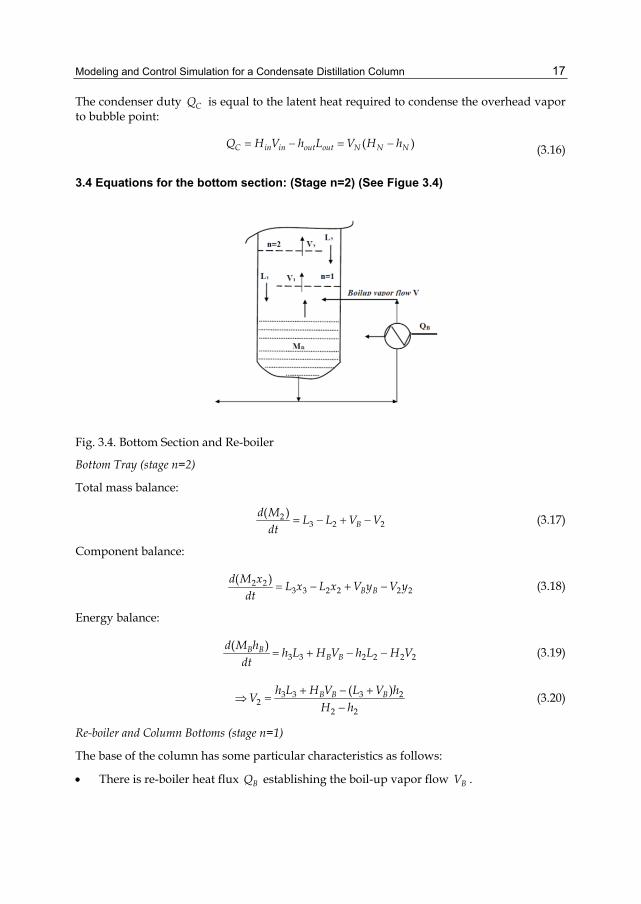
3.4 Equations for the bottom section: (Stage n=2) (See Figue 3.4)
Fig. 3.4. Bottom Section and Re-boiler
Bottom Tray (stage n=2)
Total mass balance:
23 2 2
( )B
d ML L V V
dt (3.17)
Component balance:
2 23 3 2 2 2 2
( )B B
d M xL x L x V y V y
dt (3.18)
Energy balance:
3 3 2 2 2 2( )B B
B Bd M h
h L H V h L H Vdt
(3.19)
3 3 3 2
22 2
( )B B Bh L H V L V hV
H h (3.20)
Re-boiler and Column Bottoms (stage n=1)
The base of the column has some particular characteristics as follows:
There is re-boiler heat flux BQ establishing the boil-up vapor flow BV .

Distillation – Advances from Modeling to Applications 18
The holdup is variable and changes in sensible heat cannot be neglected. The outflow of liquid from the bottoms B is determined externally to be controlled by a
bottoms level controller. Total mass balance:
2( )B
Bd M
L V Bdt
(3.21)
Component balance:
2 2( )B B
B B Bd M x
L x V y Bxdt
(3.22)
Energy balance:
2 2( )B B
B B B Bd M h
h L Q h B H Vdt
(3.23)
2 2
B BB B B B
BB
dh dMh L Q h B M h
dt dtVH
(3.24)
When all the modeling equations above are resolved, we find out how the flow rate and concentrations of the two product streams (distillate product and bottoms product) change with time, in the presence of changes in the various input variables.
3.5 Simplified model
To simplify the model, we make the following assumption (Papadouratis, A. et al. 1989):
The relative volatility is constant throughout the column. This means the vapor-liquid equilibrium relationship can be expressed by
1 ( 1)
nn
n
xy
x (3.25)
where nx : liquid composition on nth stage; ny : vapor composition on nth stage; and : relative volatility.
The overhead vapor is totally condensed in a condenser. The liquid holdups on each tray, condenser, and the re-boiler are constant and perfectly
mixed (i.e. immediate liquid response, ( 2 3 2...... NdL dL dL dL ). The holdup of vapor is negligible throughout the system (i.e. immediate vapor
response, 1 2 1...... NdV dV dV dV ). The molar flow rates of the vapor and liquid through the stripping and rectifying
sections are constant: 1 2 1....... NV V V and 2 3 2........ NL L L . The column is numbered from bottom (n=1 for the re-boiler, n=2 for the first tray, n=f
for the feed tray, n=N+1 for the top tray and n=N+2 for the condenser).
Modeling and Control Simulation for a Condensate Distillation Column 19
Under these assumptions, the dynamic model can be expressed by (George, S., 1986):
Condenser (n=N+2):
1( )D n F n n nM x V V y Lx Dx (3.26)
Tray n (n=f+2, …, N+1):
1 1( )( ) ( )n F n n n nMx V V y y L x x (3.27)
Tray above the feed flow (n=f+1):
1 1( ) ( ) ( )n n n n n F F nMx V y y L x x V y y (3.28)
Tray below the feed flow (n=f):
1 1( ) ( ) ( )n n n n n F F nMx V y y L x x L x x (3.29)
Tray n (n=2, …, f-1):
1 1( ) ( )( )n n n F n nMx V y y L L x x (3.30)
Re-boiler (n=1):
1 2 1 1( )B FM x L L x Vy Bx (3.31)
Flow rate are assumed as constant molar flows as
F FL q F (3.32)
F FV F L (3.33)
Assuming condenser holdup constant
N FD V L V V L (3.34)
Assuming boiler holdup constant
2 1 FB L V L L V (3.35)
Composition Fx in the liquid and Fy in the vapor phase of the feed are obtained by solving the flash equations:
F F F F FFc L x V y (3.36)
And
1 ( 1)
FF
F
xy
x (3.37)
where, is the relative volatility.
Although the model order is reduced, the representation of the distillation system is still nonlinear due to the vapor-liquid equilibrium relationship in equation (3.25).

Distillation – Advances from Modeling to Applications 20
4. Model simulation and analysis 4.1 Model dynamic equations
In the process data calculation, we have calculated for the distillation column with 14 trays with the following initial data - equations (2.1), (2.2), (2.3) and (2.4): The feed mass rate of the plant: 15.47619massF (tons/hour); The holdup in the column base: 31.11BM (kmole);
The holdup on each tray: 5.80M (kmole); The holdup in the reflux drum: 13.07DM
(kmole); The gas percentage in the feed flow: 38%Fc ; The internal vapor flow fV selected
by empirical: 28%fV ; The feed stream (m3/h) with the density dF=0.670 (ton/m3);
15.47619
0.670mass
F
FF
d=23.0988 (m3/h). The calculated stream data is displayed in the table 4.1.
Stream Formular % Volume (m3/h)
Density (ton/m3)
Mass (ton/h)
Molar (kg/kmol)
Molar flow (kmole/h)
Vapor rate in feed VF cF+4 42 9.7015 0.591 5.7336 58.2 98.5152
Liquid rate in feed LF 100-cF 58 13.3973 0.726 9.7264 93.3 104.2491
Internal vapor rate V Vf 28 6.4677 0.598 3.8677 58.3 66.3407
Internal liquid rate L Vf+4 32 7.3916 0.615 4.5458 60.1 75.6380
Distillate flow rate D cF 38 8.7775 0.576 5.0554 54.5 92.7597
Bottoms flow rate B 100-cF 62 14.3213 0.727 10.405 93.8 110.9235
Table 4.1. Summary of Stream Data
Solving flash equation with the relative volatility ( 5.68 ), 0.26095; 0.66728F Fx y .
Reference to equations from (3.28) to (3.39) we can develop a set of nonlinear differential and algebraic equations for the simplified model can be developed as:
16 15 16 1613.07 164.8559 75.6380 92.7597x y x x 16 15 1612.6133 12.8863x y x (4.1)
15 14 15 16 155.8 164.8559( ) 75.6380( )x y y x x 15 14 15 16 1528.4234 28.4234 13.0410 13.0410x y y x x (4.2)
14 13 14 15 145.8 164.8559( ) 75.6380( )x y y x x 14 13 14 15 1428.4234 28.4234 13.0410 13.0410x y y x x (4.3)

Modeling and Control Simulation for a Condensate Distillation Column 21
13 12 13 14 135.8 164.8559( ) 75.6380( )x y y x x 13 12 13 14 1328.4234 28.4234 13.0410 13.0410x y y x x (4.4)
12 11 12 13 125.8 164.8559( ) 75.6380( )x y y x x 12 11 12 13 1228.4234 28.4234 13.0410 13.0410x y y x x (4.5)
11 10 11 12 115.8 164.8559( ) 75.6380( )x y y x x 11 10 11 12 1128.4234 28.4234 13.0410 13.0410x y y x x (4.6)
10 9 10 11 105.8 164.8559( ) 75.6380( )x y y x x 10 9 10 11 1028.4234 28.4234 13.0410 13.0410x y y x x (4.7)
9 8 9 10 9 95.8 66.3407( ) 75.6380( ) 98.5152(0.66728 )x y y x x y 9 8 9 9 1011.4381 28.4234 13.0410 13.0410 11.3340x y y x x (4.8)
8 7 8 9 8 85.8 66.3407( ) 75.6380( ) 104.2491(0.26.95 )x y y x x x 8 7 8 8 911.4381 11.4381 31.0150 13.0410 4.8440x y y x x (4.9)
7 6 7 8 75.8 66.3407( ) 179.8871( )x y y x x 7 6 7 8 711.4381 11.4381 31.0150 31.0150x y y x x (4.10)
6 5 6 7 65.8 66.3407( ) 179.8871( )x y y x x 6 5 6 7 611.4381 11.4381 31.0150 31.0150x y y x x (4.11)
5 4 5 6 55.8 66.3407( ) 179.8871( )x y y x x 5 4 5 6 511.4380 11.4381 31.0150 31.0150x y y x x (4.12)
4 3 4 5 45.8 66.3407( ) 179.8871( )x y y x x 4 3 4 5 411.4381 11.4381 31.0150 31.0150x y y x x (4.13)
3 2 3 4 35.8 66.3407( ) 179.8871( )x y y x x 3 2 3 4 311.4381 11.4381 31.0150 31.0150x y y x x (4.14)
2 1 2 3 25.8 66.3407( ) 179.8871( )x y y x x 2 1 2 3 211.4381 11.4381 31.0150 31.0150x y y x x (4.15)
1 2 1 131.11 179.8871 110.9235 66.3407x x x y 1 1 2 13.5655 5.7823 2.1325x x x y (4.16)
And vapor-liquid equilibrium on each tray (n=1-16):
5.68
1 4.68n
nn
xy
x (4.17)
Distillation – Advances from Modeling to Applications 22
4.2 Model simulation with Matlab Simulink
4.2.1 Simulation without disturbances
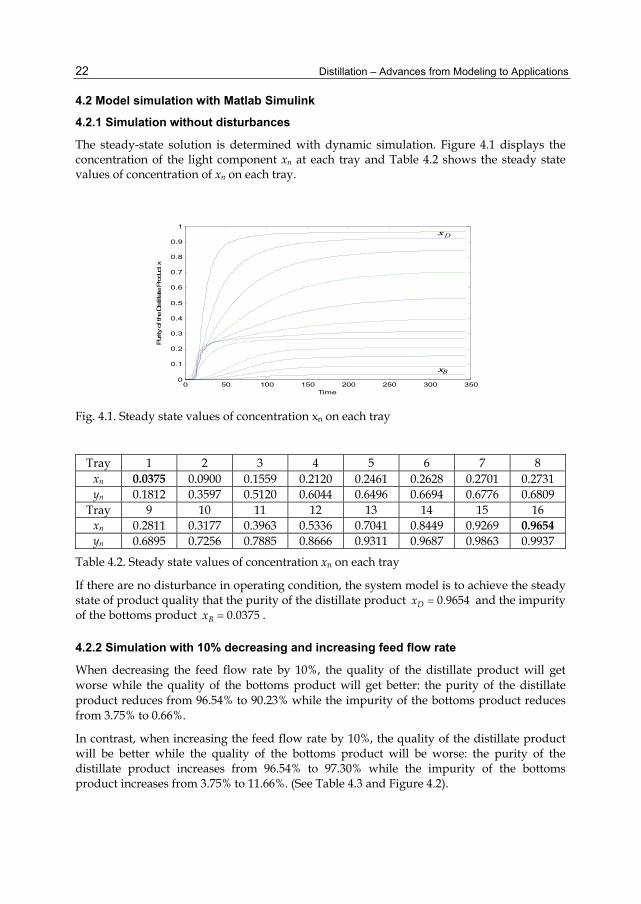
The steady-state solution is determined with dynamic simulation. Figure 4.1 displays the concentration of the light component xn at each tray and Table 4.2 shows the steady state values of concentration of xn on each tray.
Fig. 4.1. Steady state values of concentration xn on each tray
Tray 1 2 3 4 5 6 7 8 xn 0.0375 0.0900 0.1559 0.2120 0.2461 0.2628 0.2701 0.2731 yn 0.1812 0.3597 0.5120 0.6044 0.6496 0.6694 0.6776 0.6809
Tray 9 10 11 12 13 14 15 16 xn 0.2811 0.3177 0.3963 0.5336 0.7041 0.8449 0.9269 0.9654 yn 0.6895 0.7256 0.7885 0.8666 0.9311 0.9687 0.9863 0.9937
Table 4.2. Steady state values of concentration xn on each tray
If there are no disturbance in operating condition, the system model is to achieve the steady state of product quality that the purity of the distillate product 0.9654Dx and the impurity of the bottoms product 0.0375Bx .
4.2.2 Simulation with 10% decreasing and increasing feed flow rate
When decreasing the feed flow rate by 10%, the quality of the distillate product will get worse while the quality of the bottoms product will get better: the purity of the distillate product reduces from 96.54% to 90.23% while the impurity of the bottoms product reduces from 3.75% to 0.66%.
In contrast, when increasing the feed flow rate by 10%, the quality of the distillate product will be better while the quality of the bottoms product will be worse: the purity of the distillate product increases from 96.54% to 97.30% while the impurity of the bottoms product increases from 3.75% to 11.66%. (See Table 4.3 and Figure 4.2).
0 50 100 150 200 250 300 3500
0.1
0.2
0.3
0.4
0.5
0.6
0.7
0.8
0.9
1
Pur
ity o
f the
Distillate
Pro
duct
x
Time
x
xB
D
Modeling and Control Simulation for a Condensate Distillation Column 23
Purity of the Distillate Product (%)
Impurity of the Bottoms Product (%)
Normal Feed Rate (100%) 96.54 3.75 Reduced Feed Rate (90%) 90.23 0.66
Increased Feed Rate (110%) 97.30 11.66
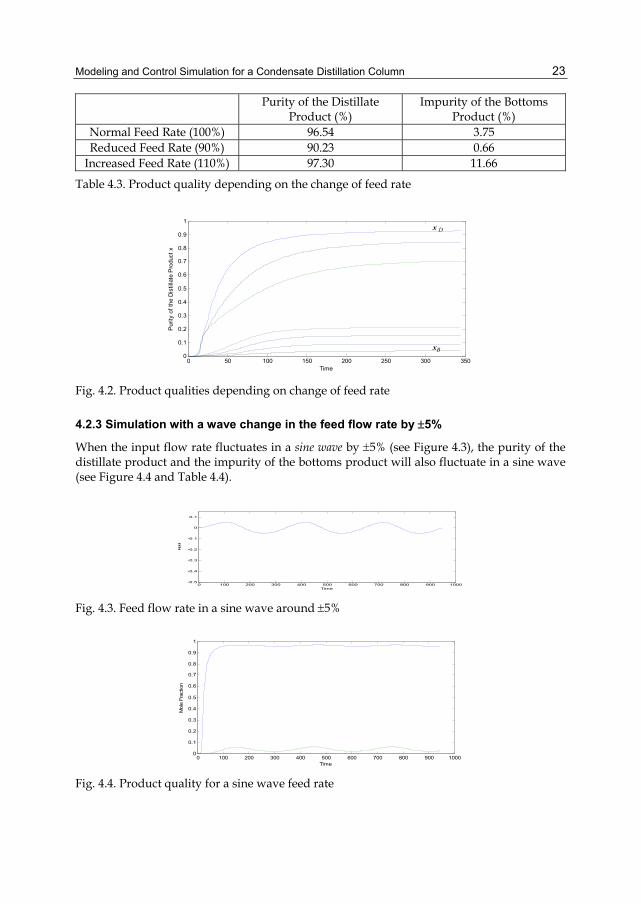
Table 4.3. Product quality depending on the change of feed rate
Fig. 4.2. Product qualities depending on change of feed rate
4.2.3 Simulation with a wave change in the feed flow rate by 5%
When the input flow rate fluctuates in a sine wave by 5% (see Figure 4.3), the purity of the distillate product and the impurity of the bottoms product will also fluctuate in a sine wave (see Figure 4.4 and Table 4.4).
Fig. 4.3. Feed flow rate in a sine wave around 5%
Fig. 4.4. Product quality for a sine wave feed rate
0 50 100 150 200 250 300 3500
0.1
0.2
0.3
0.4
0.5
0.6
0.7
0.8
0.9
1
Pur
ity o
f the
Dis
tilla
te P
rodu
ct x
Time
x
xB
D
0 100 200 300 400 500 600 700 800 900 1000-0.5
-0.4
-0.3
-0.2
-0.1
0
0.1
Time
Inpu
t
0 100 200 300 400 500 600 700 800 900 10000
0.1
0.2
0.3
0.4
0.5
0.6
0.7
0.8
0.9
1
Mol
e Fr
actio
n
Time
Distillation – Advances from Modeling to Applications 24
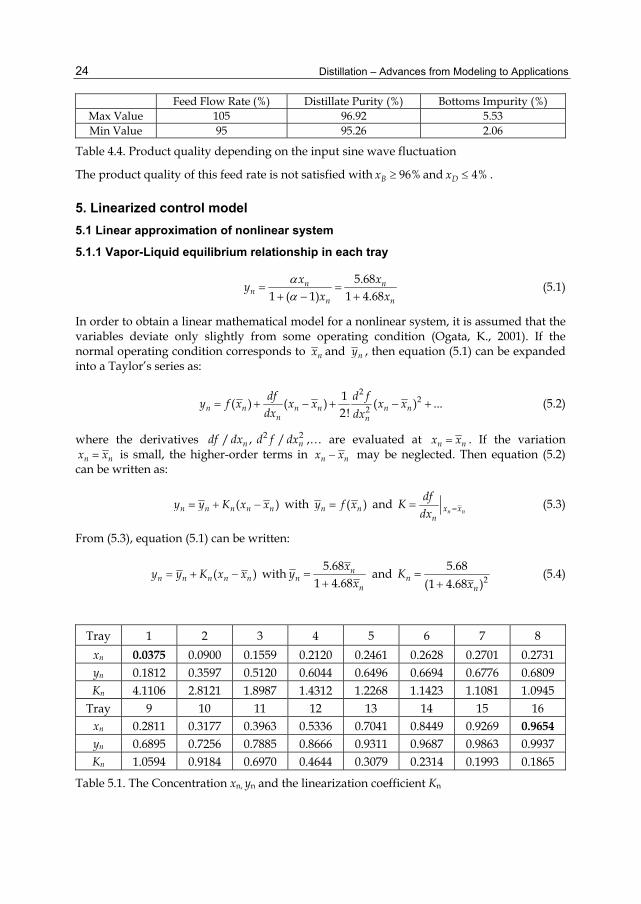
Feed Flow Rate (%) Distillate Purity (%) Bottoms Impurity (%) Max Value 105 96.92 5.53 Min Value 95 95.26 2.06
Table 4.4. Product quality depending on the input sine wave fluctuation
The product quality of this feed rate is not satisfied with 96%Bx and 4%Dx .
5. Linearized control model 5.1 Linear approximation of nonlinear system
5.1.1 Vapor-Liquid equilibrium relationship in each tray
5.681 ( 1) 1 4.68
n nn
n n
x xy
x x (5.1)
In order to obtain a linear mathematical model for a nonlinear system, it is assumed that the variables deviate only slightly from some operating condition (Ogata, K., 2001). If the normal operating condition corresponds to nx and ny , then equation (5.1) can be expanded into a Taylor’s series as:
2
22
1( ) ( ) ( ) ...2!n n n n n n
n n
df d fy f x x x x x
dx dx (5.2)
where the derivatives 2 2/ , /n ndf dx d f dx ,… are evaluated at n nx x . If the variation n nx x is small, the higher-order terms in n nx x may be neglected. Then equation (5.2)
can be written as:
( )n n n n ny y K x x with ( )n ny f x and n nx x
n
dfK
dx (5.3)
From (5.3), equation (5.1) can be written:
( )n n n n ny y K x x with 5.68
1 4.68n
nn
xy
x and
25.68
(1 4.68 )nn
Kx
(5.4)
Tray 1 2 3 4 5 6 7 8 xn 0.0375 0.0900 0.1559 0.2120 0.2461 0.2628 0.2701 0.2731 yn 0.1812 0.3597 0.5120 0.6044 0.6496 0.6694 0.6776 0.6809 Kn 4.1106 2.8121 1.8987 1.4312 1.2268 1.1423 1.1081 1.0945
Tray 9 10 11 12 13 14 15 16 xn 0.2811 0.3177 0.3963 0.5336 0.7041 0.8449 0.9269 0.9654 yn 0.6895 0.7256 0.7885 0.8666 0.9311 0.9687 0.9863 0.9937 Kn 1.0594 0.9184 0.6970 0.4644 0.3079 0.2314 0.1993 0.1865
Table 5.1. The Concentration xn, yn and the linearization coefficient Kn
Modeling and Control Simulation for a Condensate Distillation Column 25
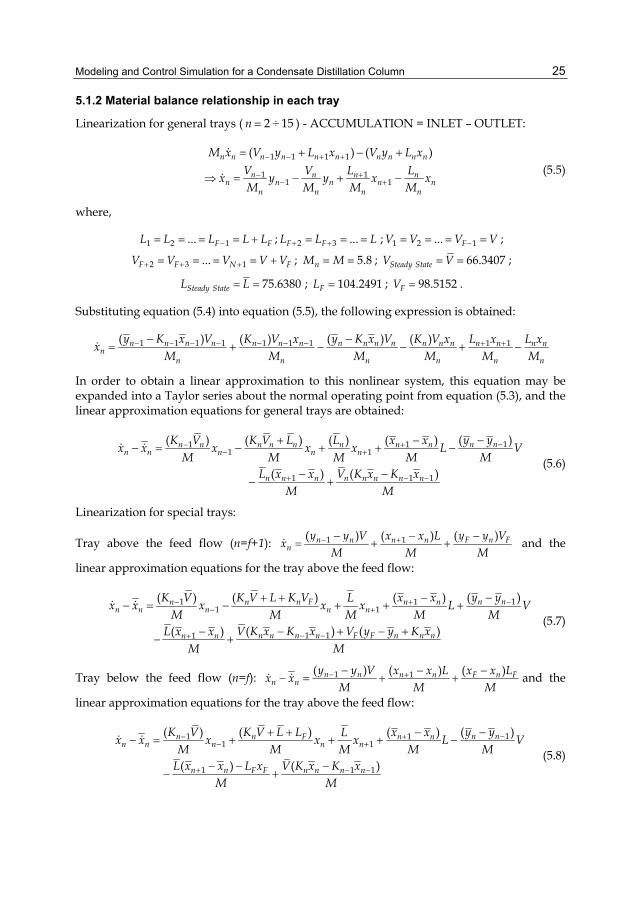
5.1.2 Material balance relationship in each tray
Linearization for general trays ( ÷ 2 15n ) - ACCUMULATION = INLET – OUTLET:
1 1 1 1
1 11 1
( ) ( )n n n n n n n n n n
n n n nn n n n n
n n n n
M x V y L x V y L xV V L L
x y y x xM M M M
(5.5)
where,
1 2 1... F FL L L L L ; 2 3 ...F FL L L ; 1 2 1... FV V V V ;
2 3 1...F F N FV V V V V ; 5.8nM M ; 66.3407Steady StateV V ;
75.6380Steady StateL L ; 104.2491FL ; 98.5152FV .
Substituting equation (5.4) into equation (5.5), the following expression is obtained:
1 1 1 1 1 1 1 1 1( ) ( )( ) ( )n n n n n n n nn n n n n n n n n n
nn n n n n n
y K x V y K x VK V x K V x L x L xx
M M M M M M
In order to obtain a linear approximation to this nonlinear system, this equation may be expanded into a Taylor series about the normal operating point from equation (5.3), and the linear approximation equations for general trays are obtained:
11 11 1
1 1 1
( )( ) ( ) ( ) ( )
( ) ( )
n nn n n n n n n nn n n n n
n n n n n n n n
y yK V K V L L x xx x x x x L V
M M M M ML x x V K x K x
M M
(5.6)
Linearization for special trays:
Tray above the feed flow (n=f+1): 1 1( ) ( )( )n n F n Fn n
ny y V y y Vx x L
xM M M
and the
linear approximation equations for the tray above the feed flow:
11 11 1
1 11
( )( ) ( ) ( )
( ) ( )( )
n nn n n F n nn n n n n
n n n n F F n n nn n
y yK V K V L K V x xLx x x x x L V
M M M M MV K x K x V y y K xL x x
M M
(5.7)
Tray below the feed flow (n=f): 1 1( ) ( ) ( )n n n n F n F
n ny y V x x L x x L
x xM M M
and the
linear approximation equations for the tray above the feed flow:
11 11 1
1 1 1
( )( ) ( ) ( )
( ) ( )
n nn n F n nn n n n n
n n F F n n n n
y yK V K V L L x xLx x x x x L V
M M M M ML x x L x V K x K x
M M
(5.8)
Distillation – Advances from Modeling to Applications 26
Reboiler (n=1): 12 2 11
B B B
VyL x Bxx
M M M, where, 31.11BM a, 110.9235B , and the linear
approximation equations for the reboiler:
11 2 2 1 1
1 1 1 2( )( ) ( ) ( ) (( ) ) ( )F F
B B B B B B
yK V B L L x L L x VK xx x x x L V
M M M M M M (5.9)
Condenser (n=N): 15 15 16 1616
D D D
V y Lx Dxx
M M M, where, 13.07DM , 92.7597D , and the
linear approximation equations for the condenser:
1515 16 16 15 15
16 16 15 16( )( ( )) ( ) ( ) (( ) )( )F F
D D D D D D
yK V V x Lx V V K xL Dx x x x L V
M M M M M M (5.10)
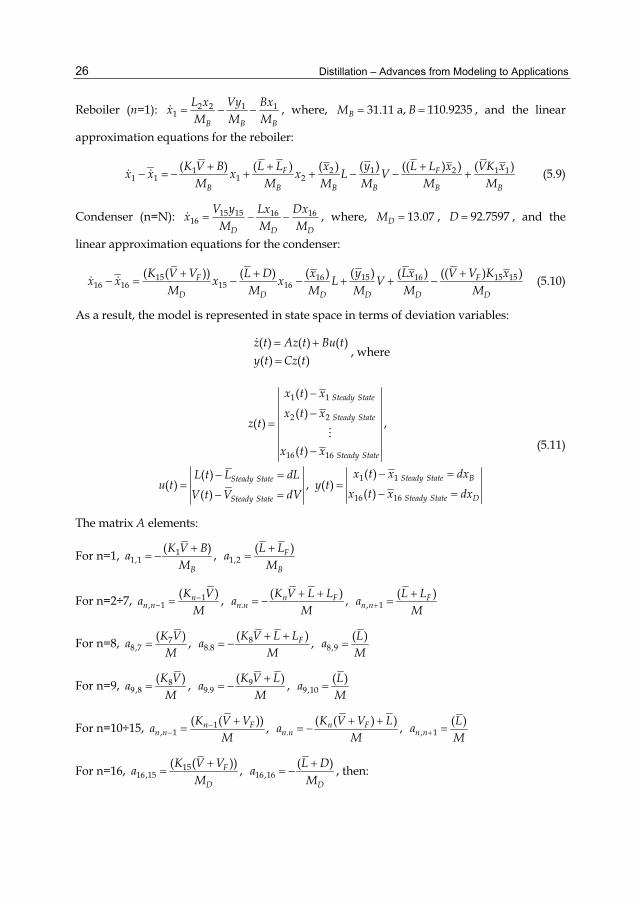
As a result, the model is represented in state space in terms of deviation variables:
( ) ( ) ( )( ) ( )
z t Az t Bu ty t Cz t
, where
1 1
2 2
16 16
1 1
16 16
( )( )
( ) ,
( )
( )( )( ) , ( )
( )( )
Steady State
Steady State
Steady State
Steady State BSteady State
Steady State DSteady State
x t x
x t xz t
x t x
x t x dxL t L dLu t y t
x t x dxV t V dV
(5.11)
The matrix A elements:
For n=1, 1
1,1 1,2( ) ( ), F
B B
K V B L La a
M M
For n=2÷7,
1
, 1 . , 1( ) ( ) ( ), , n n F F
n n n n n nK V K V L L L L
a a aM M M
For n=8, 87
8,7 8.8 8,9( )( ) ( ), , FK V L LK V L
a a aM M M
For n=9, 8 9
9,8 9.9 9,10( ) ( ) ( ), , K V K V L L
a a aM M M
For n=10÷15,
1
, 1 . , 1( ( )) ( ( ) ) ( ), , n F n F
n n n n n nK V V K V V L L
a a aM M M
For n=16, 15
16,15 16,16( ( )) ( ), F
D D
K V V L Da a
M M, then:

Modeling and Control Simulation for a Condensate Distillation Column 27
12.3312 5.7823 0 0 0 0 0 0 0 0 0 0 0 0 0 047.0173 63.1800 31.0150 0 0 0 0 0 0 0 0 0 0 0 0 0
0 32.1649 52.7324 31.0150 0 0 0 0 0 0 0 0 0 0 0 00 0 21.7174 47.3852 31.0150 0 0 0 0 0 0 0 0 0 0 00 0 0 16.3701 45.0472 31.0150 0 0 0 0 0 0 0 0 0 00 0 0 0 14.0322 44.0807 31.0150 0 0 0 0
A
0 0 0 0 00 0 0 0 0 13.0657 43.6895 31.0150 0 0 0 0 0 0 0 00 0 0 0 0 0 12.6745 43.5340 13.0410 0 0 0 0 0 0 00 0 0 0 0 0 0 12.5189 43.1528 13.0410 0 0 0 0 0 00 0 0 0 0 0 0 0 30.1118 39.1451 13.0410 0 0 0 0 00 0 0 0 0 0 0 0 0 26.1041 32.8522 13.0410 0 0 0 00 0 0 0 0 0 0 0 0 0 19.8111 26
.2409 13.0410 0 0 00 0 0 0 0 0 0 0 0 0 0 13.1998 21.7926 13.0410 0 00 0 0 0 0 0 0 0 0 0 0 0 8.7516 19.6182 13.0410 00 0 0 0 0 0 0 0 0 0 0 0 0 6.5772 18.7058 13.04100 0 0 0 0 0 0 0 0 0 0 0 0 0 2.5138 12.8843
The matrix B elements:
For n=1, 121,1 1,2
( )( ) , bB B
yxb L V
M M
For n=2÷15, 11
,1 ,2( )( ) , n nn n
n ny yx x
b L b VM M
For n=16, 151616,1 16,2
( )( ) , D D
yxb L b V
M M, then:
0.0029 0.00580.0114 0.03080.0097 0.02630.0059 0.01590.0029 0.00780.0013 0.00340.0005 0.00140.0014 0.00060.0063 0.00150.0136 0.00620.0237 0.01080.0294 0.01350.0243 0.01110.0141 0.00650.0066 0.00300.
B
0739 0.0755
And the output matrix C is:
1 0 0 0 0 0 0 0 0 0 0 0 0 0 0 00 0 0 0 0 0 0 0 0 0 0 0 0 0 0 1
C
Distillation – Advances from Modeling to Applications 28
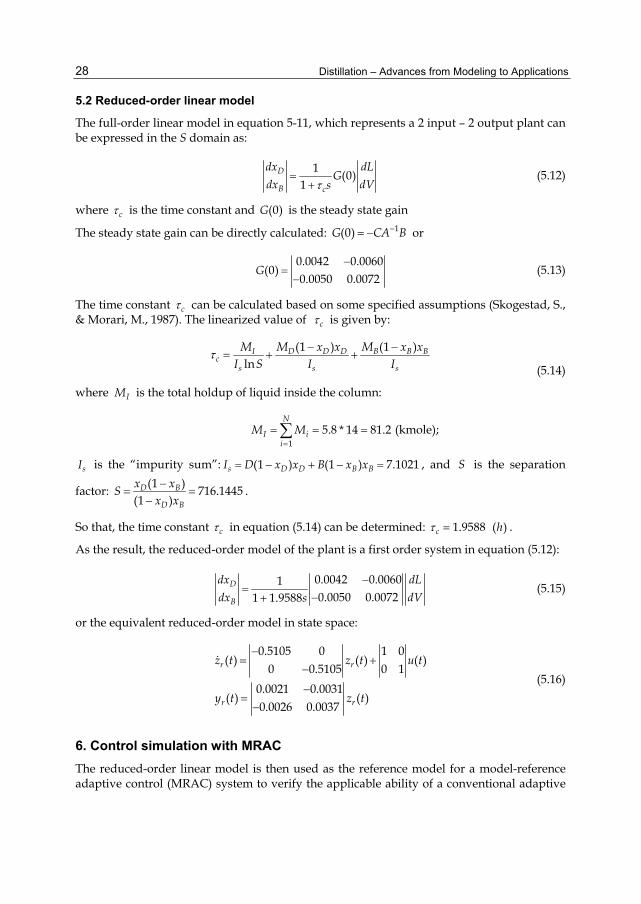
5.2 Reduced-order linear model
The full-order linear model in equation 5-11, which represents a 2 input – 2 output plant can be expressed in the S domain as:
1 (0)
1D
B c
dx dLG
dx dVs (5.12)
where c is the time constant and (0)G is the steady state gain
The steady state gain can be directly calculated: 1(0)G CA B or
0.0042 0.0060
(0)0.0050 0.0072
G (5.13)
The time constant c can be calculated based on some specified assumptions (Skogestad, S., & Morari, M., 1987). The linearized value of c is given by:
(1 ) (1 )
lnI D D D B B B
cs s s
M M x x M x xI S I I (5.14)
where IM is the total holdup of liquid inside the column:
1
5.8 * 14 81.2N
I ii
M M (kmole);
sI is the “impurity sum”: (1 ) (1 ) 7.1021s D D B BI D x x B x x , and S is the separation
factor:
(1 ) 716.1445
(1 )D B
D B
x xS
x x.
So that, the time constant c in equation (5.14) can be determined: 1.9588 ( )c h .
As the result, the reduced-order model of the plant is a first order system in equation (5.12):
0.0042 0.006010.0050 0.00721 1.9588
D
B
dx dLdx dVs
(5.15)
or the equivalent reduced-order model in state space:
0.5105 0 1 0
( ) ( ) ( )0 0.5105 0 1
0.0021 0.0031( ) ( )
0.0026 0.0037
r r
r r
z t z t u t
y t z t
(5.16)
6. Control simulation with MRAC The reduced-order linear model is then used as the reference model for a model-reference adaptive control (MRAC) system to verify the applicable ability of a conventional adaptive

Modeling and Control Simulation for a Condensate Distillation Column 29
controller for a distillation column dealing with the disturbance and the model-plant mismatch as the influence of the plant feed disturbances.
Adaptive control system is the ability of a controller which can adjust its parameters in such a way as to compensate for the variations in the characteristics of the process. Adaptive control is widely applied in petroleum industries because of the two main reasons: Firstly, most processes are nonlinear and the linearized models are used to design the controllers, so that the controller must change and adapt to the model-plant mismatch; Secondly, most of the processes are non-stationary or their characteristics are changed with time, this leads again to adapt the changing control parameters.
The general form of a MRAC is based on an inner-loop Linear Model Reference Controller (LMRC) and an outer adaptive loop shown in Fig. 6.1. In order to eliminate errors between the model, the plant and the controller is asymptotically stable, MRAC will calculate online the adjustment parameters in gains L and M by ( )L t and ( )M t as detected state error
( )e t when changing A , B in the process plant.
Fig. 6.1. MRAC block diagram
Simulation program is constructed using Maltab Simulink with the following data:
Process Plant:
z Az Bu noisey Cz

Distillation – Advances from Modeling to Applications 30
where
1
2
00
A ,
1
2
00
B ,
0.004 0.0070.0011 0.0017
C and 1 , 2 , 1 , 2 are
changing and dependent on the process dynamics.
Reference Model:
m m m m c
m m m
z A z B uy C z
where
0.2616 00 0.2616mA ,
1 00 1mB ,
0.004 0.0070.0011 0.0017mC
State Feedback:
cu Mu Lz where
1
2
00
L and
3
4
00
M .
Closed Loop:
( ) ( ) ( )c c c cz A BL z BMu A z B u
Error Equation:
1
2m
ee z z
e is a vector of state errors,
0( ( ) ) ( ( ) ) ( )m m m m c m c m c m c me z z Az Bu A z B u A e A A z B B u A e
where
1 1 1 1
2 2 2 2
0 00 0
c
c
z uz u
Lyapunov Function:
0 01( , ) ( ) ( )2
T TV e e Pe where is an adaptive gain and P is a Lyapunov
matrix.
Derivative Calculation of Lyapunov Matrix:
0( )2
T T TdV de Qe Pe
dt dt where T
m mQ A P PA .
For the stability of the system, 0dVdt
, we can assign the second item
0( ) 0T TdPe
dt or Td
Pedt
. Then we always have:
2TdV
e Qedt
. If we
select a positive matrix 0P , for instance,
1 00 2
P , then we have

Modeling and Control Simulation for a Condensate Distillation Column 31
0.5232 00 1.0465
Tm mQ A P PA . Since matrix Q is obviously positive definite, then we
always have 0
2TdV
e Qedt
and the system is stable with any plant-model mismatches.
Parameters Adjustment:
1 1 1 1 1 1
2 2 1 2 2 2 2
1 1 2 3 1 1 1
2 2 4 2 2 2
0 /0 / 2
0 /0 / 2
c
c c
z d dt z ez e d dt z ed
Pc u e d dt u edt
u d dt u e
Simulation results and analysis:
It is assumed that the reduced-order linear model in equation (11) can also maintain the similar steady state outputs as the basic nonlinear model. Now this model is used as an MRAC to take the process plant from these steady state outputs ( 0.9654Dx and
0.0375Bx ) to the desired targets ( 0.98 1Dx and 0 0.02Bx ) amid the disturbances and the plant-model mismatches as the influence of the feed stock disturbances.
The design of a new adaptive controller is shown in Figure 6.2 where we install an MRAC and a closed-loop PID (Proportional, Integral, Derivative) controller to eliminate the errors between the reference set-points and the outputs.
Fig. 6.2. Adaptive controller with MRAC and PID
Distillation – Advances from Modeling to Applications 32
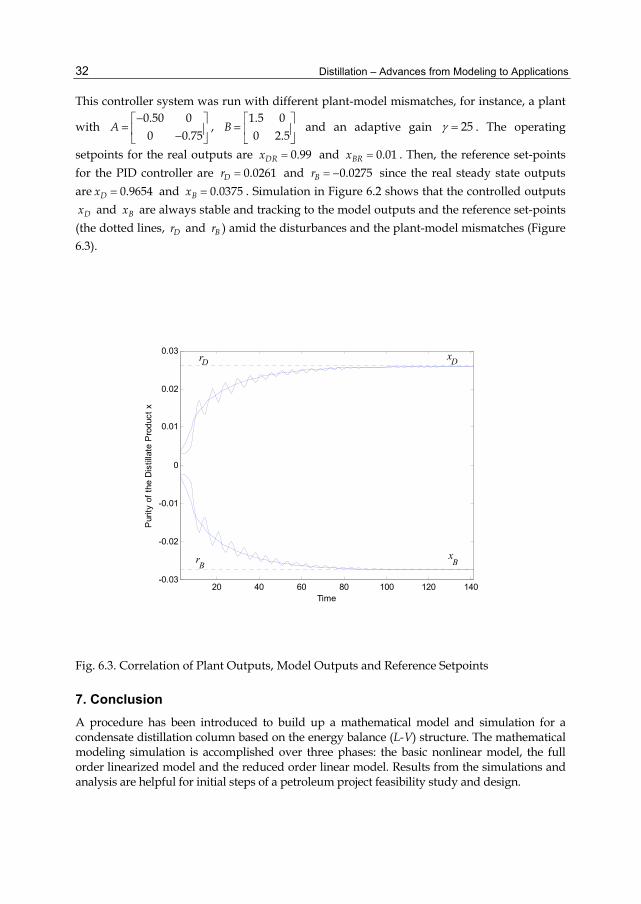
This controller system was run with different plant-model mismatches, for instance, a plant
with
0.50 00 0.75
A ,
1.5 00 2.5
B and an adaptive gain 25 . The operating
setpoints for the real outputs are 0.99DRx and 0.01BRx . Then, the reference set-points for the PID controller are 0.0261Dr and 0.0275Br since the real steady state outputs are 0.9654Dx and 0.0375Bx . Simulation in Figure 6.2 shows that the controlled outputs
Dx and Bx are always stable and tracking to the model outputs and the reference set-points (the dotted lines, Dr and Br ) amid the disturbances and the plant-model mismatches (Figure 6.3).
Fig. 6.3. Correlation of Plant Outputs, Model Outputs and Reference Setpoints
7. Conclusion A procedure has been introduced to build up a mathematical model and simulation for a condensate distillation column based on the energy balance (L-V) structure. The mathematical modeling simulation is accomplished over three phases: the basic nonlinear model, the full order linearized model and the reduced order linear model. Results from the simulations and analysis are helpful for initial steps of a petroleum project feasibility study and design.
20 40 60 80 100 120 140-0.03
-0.02
-0.01
0
0.01
0.02
0.03
Pur
ity o
f the
Dis
tilla
te P
rodu
ct x
Time
r
r
x
x
D
B
D
B
Modeling and Control Simulation for a Condensate Distillation Column 33
The reduced order linear model is used as the reference model for an MRAC controller. The controller of MRAC and PID theoretically allows the plant outputs tracking the reference set-points to achieve the desired product quality amid the disturbances and the model-plant mismatches as the influence of the feed stock disturbances.
In this chapter, the calculation of the mathematical model building and the reduced-order linear adaptive controller is only based on the physical laws from the process. The real system identifications including the experimental production factors, specific designed structures, parameters estimation and the system validation are not discussed here.
8. Acknowledgment The authors would like to thank InTech for providing the opportunity to print this book chapter. Special thanks are also due to the anonymous reviewers and editor, who assisted the author in improving this book chapter significantly. Lastly, the authors would like to thank the Papua New Guinea University of Technology (UNITECH) for their support in the preparation of this book chapter.
9. References Franks, R. (1972), Modeling and Simulation in Chemical Engineering, Wiley-Interscience,
New York, ISBN: 978-0471275350. George, S. (1986). Chemical Process Control: An Introduction to Theory and Practice,
Prentice-Hall, ISBN: 9780131286290, New Jersey. Kehlen, H. & Ratzsch, M. (1987). Complex Multicomponent Distillation Calculations by
Continuous Thermodynamics. Chem. Eng. Sci., Vol. 42(2), pp. 221-232 ISSN: 0009-2509.
Luyben, W. (1990). Process Modeling, Simulation, and Control for Chemical Engineers, McGraw-Hill, ISBN: 978-0070391598, New York.
Marie, E.; Strand, S. & Skogestad S. (2008). Coordinator MPC for Maximizing Plant Throughput. Computer & Chemical Engineering, Vol. 32(2), pp. 195-204, ISSN: 0098-1354.
Nelson, W. (1985), Petroleum Refinery Engineering, McGraw-Hill, ISBN: 978-0-8247-0599-2, Singapore.
Ogata, K. (2001). Modern Control Engineering, Prentice Hall, ISBN: 978-0130609076, New York.
Papadouratis, A.; Doherty, M. & Douglas, J. (1989). Approximate Dynamic Models for Chemical Process Systems. Ind. & Eng. Ch. Re., Vol. 28(5), pp. 546-522, ISSN: 0888-5885.
Perry, R. & Green, D. (1984). Perry’s Chemical Engineers Handbook, McGraw-Hill, ISBN: 0-471-58626-9, New York.
PetroVietnam Gas Company. (1999), Condensate Processing Plant Project – Process Description Document No. 82036-02BM-01, Hanoi.
Skogestad, S., & Morari, M. (1987). The Dominant Time Constant for Distillation Columns. Computers & Chemical Engineering, Vol. 11(6), pp. 607-617, ISSN: 0098-1354.
Waller, V. (1992).Practical Distillation Control, Van Nostrand Reinhold, ISBN: 9780442006013, New York.

Distillation – Advances from Modeling to Applications 34
Wanrren, L.; Julian, C. & Peter, H. (2005). Unit Operations of Chemical Engineering, McGraw-Hill, IBSN : 978-0072848236, New York.
Wuithier, P. (1972). Le Petrole Raffinage et Genie Chimique, Publications de l’Institut Francais du Petrole, IBSN : 978-2710801993, Paris.

2
Energy Conservation in Ethanol-Water Distillation Column
with Vapour Recompression Heat Pump Christopher Enweremadu
University of South Africa, Florida Campus South Africa
1. Introduction Ethanol or ethyl alcohol CH3CH2OH, a colorless liquid with characteristic odor and taste; commonly called grain alcohol has been described as one of the most exotic synthetic oxygen-containing organic chemicals because of its unique combination of properties as a solvent, a germicide, a beverage, an antifreeze, a fuel, a depressant, and especially because of its versatility as a chemical intermediate for other organic chemicals. Ethanol could be derived from any material containing simple or complex sugars. The sugar-containing material is fermented after which the liquid mixture of ethanol and water is separated into their components using distillation.
Distillation is the most widely used separation operation in chemical and petrochemical industries accounting for around 25-40% of the energy usage. One disadvantage of distillation process is the large energy requirement. Distillation consumes a great deal of energy for providing heat to change liquid to vapour and condense the vapour back to liquid at the condenser. Distillation is carried out in distillation columns which are used for about 95% of liquid separations and the energy use from this process accounts for an estimated 3% of the world energy consumption (Hewitt et al, 1999). It has been estimated that the energy use in distillation is in excess. With rising energy awareness and growing environmental concerns there is a need to reduce the energy use in industry. The potential for energy savings therefore exists and design and operation of energy efficient distillation systems will have a substantial effect on the overall plant energy consumption and operating costs.
The economic competitiveness of ethanol has been heightened by concerns over prices and availability of crude oil as well as greenhouse gas emissions which have stimulated interest in alternatives to crude oil to provide for automotive power and also by the use of bioethanol in the production of hydrogen for fuel cells. Therefore, there is the need to explore ways of producing ethanol at competitive costs by the use of energy efficient processes. To cope with the high energy demand and improve the benefits from the process, the concept of polygeneration and hydrothermal treatment especially when dealing with small scale ethanol plants is fast gaining interest. However, the analysis of the bioethanol process shows that distillation is still the most widely used.

Distillation – Advances from Modeling to Applications
36
Over the years, there have been many searches for lower energy alternatives or improved efficiencies in distillation columns. One such search led to the use of heat pumps, the idea which was introduced in the 1950s. Also, Jorapur and Rajvanshi (1991) have used solar energy for alcohol distillation and concluded that it was not economically viable. Heat pumping, however, has been known as an economical energy integration technology for reduction in consumption of primary energy and to minimize negative impact of large cooling and heating demands to the environment. One of the heat pump cycles which have been widely studied is the recompression of the vapours where the reboiler is heated by adding a compressor to the column to recover some of the heat lost in the distillate.
Most studies have concluded that heat pumping is an effective means of saving energy and reducing column size without estimating the actual energy consumption and the parameters that are likely to have significant effect on energy consumption. Estimating the actual energy consumption is an important aspect towards the determination of the viability of the system in ethanol–water separation.
The purpose of this chapter was to study how previously neglected and/or assumed values of different parameters (the pressure increase across the compressor was ignored, column heat loss was assumed to be 10% of the reboiler heat transfer rate, and the overall heat transfer coefficient was determined without considering it as an explicit function of dimensionless numbers, and its dependence on fluid viscosity and thermal conductivity neglected) affect the process efficiency, energy consumption and the column size of a vapour recompression heat pump.
2. Energy requirements in ethanol distillation Ethanol distillation, like any other distillation process requires a high amount of thermal energy. Studies carried out by several authors reveal that the distillation process in ethanol distilleries consumes more than half of the total energy used at the distillery (Pfeffer et al. 2007). It has been estimated that distillation takes up about 70-85% of total energy consumed in ethanol production. Pfeffer et al (2007) estimated that distillation consumes half of the total production energy 5.6 MJ/Liter out of 11.1 – 12.5 MJ/Liter.
The energy requirements for ethanol production have improved markedly during the past decade due to a variety of technology and plant design improvements. The energy needed to produce a liter of ethanol has decreased nearly 50% over the past decade and that trend is likely to continue as process technology improves ( Braisher et al, 2006).
3. Energy conservation schemes in distillation column Distillation columns are usually among the major energy-consuming units in the food, chemical, petrochemical and refining industries. According to Danziger (1979), the most effective method of economizing energy in a distillation column is energy recovery of which direct vapour recompression has been regarded as the best solution.
3.1 Heat pumping distillation systems
Basically, the heat pump can be regarded simply as reverse heat engine. The heat pump requires either work input or external driving thermal energy to remove the heat from a low temperature source and transform it to a higher level.
Energy Conservation in Ethanol-Water Distillation Column with Vapour Recompression Heat Pump
37
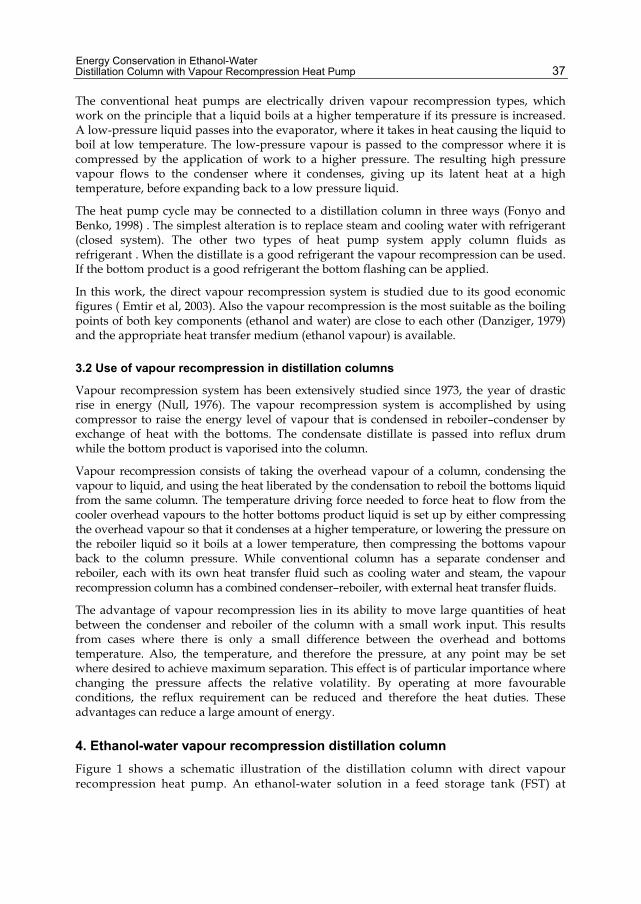
The conventional heat pumps are electrically driven vapour recompression types, which work on the principle that a liquid boils at a higher temperature if its pressure is increased. A low-pressure liquid passes into the evaporator, where it takes in heat causing the liquid to boil at low temperature. The low-pressure vapour is passed to the compressor where it is compressed by the application of work to a higher pressure. The resulting high pressure vapour flows to the condenser where it condenses, giving up its latent heat at a high temperature, before expanding back to a low pressure liquid.
The heat pump cycle may be connected to a distillation column in three ways (Fonyo and Benko, 1998) . The simplest alteration is to replace steam and cooling water with refrigerant (closed system). The other two types of heat pump system apply column fluids as refrigerant . When the distillate is a good refrigerant the vapour recompression can be used. If the bottom product is a good refrigerant the bottom flashing can be applied.
In this work, the direct vapour recompression system is studied due to its good economic figures ( Emtir et al, 2003). Also the vapour recompression is the most suitable as the boiling points of both key components (ethanol and water) are close to each other (Danziger, 1979) and the appropriate heat transfer medium (ethanol vapour) is available.
3.2 Use of vapour recompression in distillation columns
Vapour recompression system has been extensively studied since 1973, the year of drastic rise in energy (Null, 1976). The vapour recompression system is accomplished by using compressor to raise the energy level of vapour that is condensed in reboiler–condenser by exchange of heat with the bottoms. The condensate distillate is passed into reflux drum while the bottom product is vaporised into the column.
Vapour recompression consists of taking the overhead vapour of a column, condensing the vapour to liquid, and using the heat liberated by the condensation to reboil the bottoms liquid from the same column. The temperature driving force needed to force heat to flow from the cooler overhead vapours to the hotter bottoms product liquid is set up by either compressing the overhead vapour so that it condenses at a higher temperature, or lowering the pressure on the reboiler liquid so it boils at a lower temperature, then compressing the bottoms vapour back to the column pressure. While conventional column has a separate condenser and reboiler, each with its own heat transfer fluid such as cooling water and steam, the vapour recompression column has a combined condenser–reboiler, with external heat transfer fluids.
The advantage of vapour recompression lies in its ability to move large quantities of heat between the condenser and reboiler of the column with a small work input. This results from cases where there is only a small difference between the overhead and bottoms temperature. Also, the temperature, and therefore the pressure, at any point may be set where desired to achieve maximum separation. This effect is of particular importance where changing the pressure affects the relative volatility. By operating at more favourable conditions, the reflux requirement can be reduced and therefore the heat duties. These advantages can reduce a large amount of energy.
4. Ethanol-water vapour recompression distillation column Figure 1 shows a schematic illustration of the distillation column with direct vapour recompression heat pump. An ethanol-water solution in a feed storage tank (FST) at

Distillation – Advances from Modeling to Applications
38
Fig. 1. Schematic Diagram of Column with Direct Vapour Recompression Heat Pump
ambient conditions, is preheated with bottom product and condensate in heat exchangers, preheaters PH1 and PH2, and fed to the column. An auxiliary reboiler (AR) is used to start the unit. This reboiler supplies the auxiliary heat duty, which is the heat of vaporization because the main reboiler can work only if there is some compressed vapour already available. The overhead vapours from the top are compressed in the compressor (CP) up to the necessary pressure in such a way that its condensing temperature is greater than the boiling temperature of the column bottom product. The vapour is then condensed by exchanging heat within the tubes of the reboiler-condenser (RC). In a condenser, the inlet temperature is equal to the outlet temperature. Ethanol vapour will only lose its latent heat of condensation. At the same time, the cold fluid (ethanol-water mixture) in the reboiler will absorb this latent heat and its temperature will increase to boil up the mixture to temperature TCEV. The liberated latent heat of condensation provides the boil-up rate to the column while the excess heat extracted from the condensate is exchanged with the feed in preheater PH2. The condensate, which is cooled in the cooler (CL) up to its bubble point at the column operating pressure, expands through the throttling valve (TV) at the same pressure and reaches the flash tank (FT). After expansion, the output phases are a vapour phase in equilibrium with a liquid phase. One part of the product in the liquid phase is removed as distillate and stored in the tank (DST), while the remainder is recycled into the column as reflux L1. The excess of vapour is recycled to the compressor.
4.1 Methodology
Like this work, nearly all publications in this field are based on modelling and simulation (Brousse et al., 1985; Ferre et al., 1985; Collura and Luyben, 1988; Muhrer et al, 1990; Oliveira
Energy Conservation in Ethanol-Water Distillation Column with Vapour Recompression Heat Pump
39
et al. 2001). The mathematical modeling of the distillation system is derived by applying energy, composition and overall material balances together with vapour-liquid equilibrium under some assumptions (see Muhrer et al, 1990 and Enweremadu, 2007). These and other assumptions are aimed at simplifying the otherwise cumbersome heat-and mass-transfer, and the fluid flow equations Mori et al (2002).
4.2 Calculation of the distillation column
In this system, there is a direct coupling between the distillation column and the rest of the system, as the heat pump working fluid is the column’s own fluid which, is a binary mixture of ethanol and water at composition XD. Therefore, the set of equations are not solved separately as in distillation column assisted by an external heat pump.
The detailed calculation of the overall material and component material balance such as the bottom flow rate, B and distillate flow rate, D; reflux ratio, Rr; the molar vapour flow rate which leaves the column top and feeds the condenser, V1; feed vapour flow rate, VF; feed vapour fraction, q; vapour molar flow rate remaining at the bottom of the column, L2 are given (see Enweremadu, 2007).
The overall (global) energy balance equation applied to a control volume comprising the distillation column and the feed pre-heaters provides the total energy demand in the reboiler:
Qreb = DhD + BhB + L1hLV, e + Qlosses – FhF – Q1 – Q2 (1)
where Qreb is the total heat load added to the reboiler, Qlosses represents the heat losses in the column, which are to be determined; Q1 and Q2 are the heat loads of the pre-heaters; hLV,e is latent heat of vaporisation downstream of throttling valve; hD, is the enthalpy of the distillate; hB is the enthalpy of the bottom product; hF, is the enthalpy of the feed. The details of the mass balance variables are determined in Enweremadu (2007).
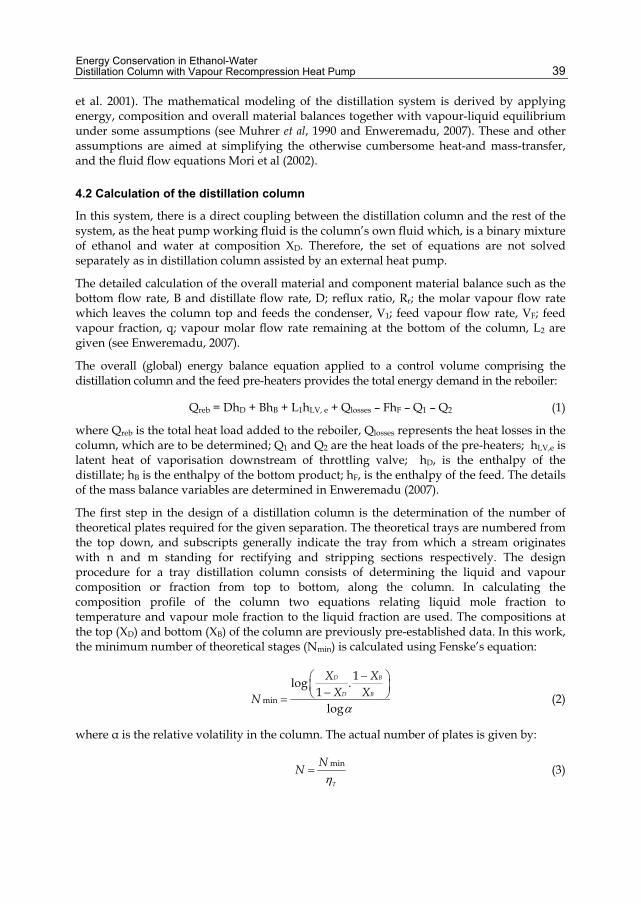
The first step in the design of a distillation column is the determination of the number of theoretical plates required for the given separation. The theoretical trays are numbered from the top down, and subscripts generally indicate the tray from which a stream originates with n and m standing for rectifying and stripping sections respectively. The design procedure for a tray distillation column consists of determining the liquid and vapour composition or fraction from top to bottom, along the column. In calculating the composition profile of the column two equations relating liquid mole fraction to temperature and vapour mole fraction to the liquid fraction are used. The compositions at the top (XD) and bottom (XB) of the column are previously pre-established data. In this work, the minimum number of theoretical stages (Nmin) is calculated using Fenske’s equation:
min
1log .1
log
D B
D B
X XX XN
(2)
where α is the relative volatility in the column. The actual number of plates is given by:
min
T
NN
(3)
Distillation – Advances from Modeling to Applications
40
where T is the tray efficiency.
4.2.1 Heat losses from distillation column
The heat loss from the distillation column is the main factor that affects heat added and removed at the reboiler and condenser respectively. Most distillation columns operate above ambient temperature, and heat losses along the column are inevitable since insulating materials have a finite thermal conductivity. Heat loss along the distillation column increase condensation and reduces evaporation. Thus, the amount of vapour diminishes in the upward part of the column, where the flow of liquid is also less than at the bottom.
To prevent loss of heat, the distillation column should be well insulated. Insulation of columns using vapour recompression varies with the situation. Where the column is hot and extra reboiler duty is used, the column should be insulated (Sloley, 2001). The imperfect insulation of the column causes some heat output.
In determining the heat loss from the distillation column, it is assumed that the temperature is uniform in the space between two plates. The heat transfer between the column wall and the surrounding is then determined from the well-known relationship for overall heat transfer coefficient:
Losses oP PQ U A T (4)
where Up, the overall heat transfer coefficient is given by Gani, Ruiz and Cameron (1986), as
1, , , , , ,pp o i o m insU f h h K A A A t (5)
where the temperature difference, pT , is given as p ambpT T T
ho, the heat transfer coefficient between the surroundings and the column external surface, is given as
ho = f(Nu, Kins, do, tins) (6)
hi is the heat transfer coefficient inside the column; Kp is the thermal conductivity of the tray material; Ao is the external area of heat exchange; Ai is the internal area of heat exchange; Am is the logarithmic mean area; tins is the thickness of insulation.
The heat output is calculated with the general expression for convection around cylindrical objects.
ln / ln /1 1wall wall ins wall
ambPlosso i o
wall walli i o oins m
T TQ
r r r rh A h AK A K A
(7)
The column inner surface heat transfer resistance is neglected as the heat transfer coefficient for condensing vapor is large and therefore will have little effect on the overall heat transfer.
Based on the assumptions in Enweremadu (2007), the heat transfer due to free convection between the surroundings and the external column wall and due to conduction through the insulation materials is predicted.

Energy Conservation in Ethanol-Water Distillation Column with Vapour Recompression Heat Pump
41
Also, from geometry of the insulated cylinder (Fig.2), the external diameter of insulation is given as
dins = do + 2tins (8)
Details of how the logarithmic mean diameter of the insulating layer (dins,m), external area of heat exchange (Ao) and the logarithmic mean area (Am) can be found in Enweremadu (2007).
From dimensional analysis,
2
inso
o ins
K Nuh
d t
(9)
where, tins is the thickness of insulation; Kins – thermal conductivity of the insulation materials; Nu – Nusselt number; do – external diameter of column; Tamb – temperature of the surrounding; Tp – plate temperature.
Fig. 2. Hypotethical Section of the Distillation Column with Insulation
For vertical cylinders, the commonly used correlations for free convection are adapted from Rajput (2002) as:
For laminar flow,
1/4Nu 0.59 Gr.Pr for (104<Gr.Pr<109) (10)
For turbulent flow,
1/30.10 Gr.PrNu for (109<Gr.Pr<1012) (11)
where Gr is the Grashof number and Pr is Prandtl.
Based on the assumptions of neglecting hi, Ai and the effect of thermal resistance, equation (5) reduces to:
ri
rowrins
hot fluid
Cold fluid (air)
QLo
ho
Ti Tins
To
Tsurf Kins
Kwal
Tp
hi

Distillation – Advances from Modeling to Applications
42
UP = f(ho, Kp, Ao, Am, tins) (12)
while equation (7) is given as
( )
ln / 1ins wall
p amb slosses
o
p m o o
T T P NQ
r rK A h A
(13)
where 1
ln 1wallP
oins
p m o o
Ur r
K A h A
The heat loss from the column trays is given by
loss from trays
, .
( )2ln 1
2 . ( )2 2ln 1
amb sP
oins
s ins insp ins m sins o inso
T T P NQ
r rP t K Nu
K d Pt d td
(14)
The total heat loss from the column is expressed as
loss from trayslossQ Q Heat loss from the two cylinder heads (15)
Based on the assumptions made, heat loss through the cylinder heads is given by
2p amb oloss at cylinder heads
ins
p
2(T - T ) rQ t 1K oh
(16)
Therefore,
, .
( )2ln 1
2 . ( )2 2ln 1
amb SPloss
oins
s ins ins ins mP sins o inso
T T P NQ
r rP t K Nu
K d Pt d td
2P amb
ins
p
2(T - T )t 1K
o
o
r
h
(17)
4.3 Calculation of heat pump and compressor parameters
The heat pump is thermodynamically linked to the column through the heat load from the pump to the column QHPC and from the column to the pump QCHP, and reboiler–condenser temperature. These parameters provide the basis for the heat pump calculation.
The calculation of the heat pump parameters begins with the estimation of the working fluid condensation temperature obtained from the reboiler temperature and temperature drop across the heat exchangers.
TCHP = TCEV + ∆TCHP (18)

Energy Conservation in Ethanol-Water Distillation Column with Vapour Recompression Heat Pump
43
where TCEV is the column vapourization (reboiler) temperature and ΔTCHP, a pre-established mean temperature difference across the heat exchangers (temperature drop in reboiler-condenser). Next is the estimation of the relevant thermodynamic properties of the working fluid. These are obtained from thermodynamic correlations.
The thermodynamic properties are determined as functions of temperature. The relationships used for calculating the working fluid density, viscosity, thermal conductivity and heat capacity for input at various locations are presented in Enweremadu (2007). The condensation pressure, PCHP is expressed as a function of condensation temperature as
PCHP = f(TCHP) (19)
while the condensation pressure is determined from ideal gas equation.
The latent heat of condensation from column to heat pump is numerically exactly equal to the latent heat of vaporisation, but has the opposite sign: latent heat of vaporisation is always positive (heat is absorbed by the substance), whereas latent heat of condensation is always negative (heat is released by the substance). Latent heat of condensation is expressed as a function of condensation temperature and is determined from the relationship (Ackland, 1990):
CHP
CHP C
CLV,CHP
bp
C
vap
TA B 1-T T1- Th H T1- T
(20)
where vapH is the heat of vapourisation at the boiling point of ethanol; TC is the critical temperature; A and B are constants.
The vapour specific volume at location “a” (entrance to the compressor) is expressed as a function of column condensation temperature, TCC and pressure at the top of the column, PTOP:
ccT Ra
TOP
xv
P (21)
Since compression is polytropic, at location “b” (compressor discharge), the vapour specific volume is determined by:
b
1
v TOP
aCHP
nPP Pv
(22)
where n is the polytropic index and ΔP is the pressure increase across the compressor.
The vapour specific enthalpy at “a” is a function of top pressure,PTOP and top temperature, TTOP.
ha=f(TTOP, PTOP) (23)
Distillation – Advances from Modeling to Applications
44
The vapour specific enthalpy at “b” may be determined as a function of compressor discharge temperature Tb and condensation pressure PCHP but in this study, it is determined by the development of numerical computation with calculations utilizing the Redlich – Kwong equation of state. The Redlich – Kwong equation of state is given as
1
2 )RT a
PV b T V V b
(24)
Where
a = 0.42747 5
22c
c
R TP
b = 0.08664 c
c
RTP
and P = pressure (atm); V = molar volume (liters/g-mol); T = temperature (K); R = gas constant (atm. Liter/g-mol.K); Pc = critical pressure (atm).
Taking the reference state for the enthalpy of liquid ethanol oLh , temperature, To and the
enthalpy of vaporisation Δ ovapH , then the enthalpy of ethanol vapour as an ideal gas at
temperature T can be calculated from
o obh h
o
To ovapL T
H C dTp (25)
Using the isothermal enthalpy departure and the Redlich-Kwong equation of state, the enthalpy of ethanol vapour at T and P can be calculated from
1.51.51 ln 1
o
To o ob L vap T
a bh h H C dT RT Zp VbRT
(26)
where Z is the compressibility factor, Cpo is the molar specific heat capacities of gases at zero pressure given as a polynomial in temperature.
Equations 24–26 are then solved with POLYMATH(R) Simultaneous Algebraic Equation Solver (See Enweremadu, 2007).
The vapour specific heat at location “e” is calculated thus (Oliveira et al, 2002):
e ,h LL c SCh Cp T (27)
The specific liquid enthalpies have been assumed to be simple functions of temperature.
The liquid specific enthalpy at location “c” is determined from EZChemDB Thermodynamic Properties Table for Ethanol (AM Cola LLC, 2005) using the expression
L,c CHPh f(T ) (28)
Energy Conservation in Ethanol-Water Distillation Column with Vapour Recompression Heat Pump
45
while the liquid specific enthalpy at location e (at the exit of the throttling valve) is determined from
hL,e=f(TCC) (29)
The temperature at compressor discharge is determined from the knowledge of the compressor efficiency. The ideal discharge temperature (the temperature that gives an overall change in entropy equal to zero) is calculated before correcting with the compressor efficiency.
CHPTOP
TOP
b TOP
0.263P PT -1P
T Tpol
(30)
The dryness fraction after the isenthalpic expansion is given by
,
,
L
LV
e ee
e
h h
h
(31)
where the molar latent heat of vaporization at location “e” is adapted from Ackland (1990):
, * 1 1 1LVbp
e d dvap C bp C Ch H T T T T A B T T
(32)
Since this is a throttling process, Td = Te and hd = he
The molar vapour flow rate which is recycled in the flash tank and conveyed to the compressor is calculated by
1
1e
Re
VV
(33)
Therefore, the molar flow rate across the compressor is expressed as
1 RM V V (34)
While the dryness fraction at condenser exit is determined by
,
23 L
LV CHP
P CHP dc
Q M C T T
h
(35)
where Q23 is the distribution of excess heat between the pre-heater Q2 and the cooler Q3 and CpL is the molar specific heat of the working fluid in the liquid phase.
The energy balance, applied to the heat pump working fluid, yields the available energy for exchange at the condenser, as follows:
,1vcd b CHP c LV CHPQ M Cp T T h (36)
Distillation – Advances from Modeling to Applications
46
A comparison is made between this energy available at the condenser, Qcd, with the energy required by the column reboiler, Qreb. This brings about the following heat load control.
i. If the rate of energy available at the heat pump condenser, Qcd, is greater than the rate of energy required by the reboiler Qreb, then the condenser gives up Qreb to the reboiler and the remaining energy is conveyed to the preheaters (Q2) and cooler (Q3)
if cd rebQ Q then HPC rebQ Q (37)
ii. But if Qcd is smaller than or equal to Qreb, then all energy available is transferred to the reboiler and the auxiliary reboiler will provide the “extra” Qreb i.e.
if cd rebQ Q then HPC cdQ Q (38)
where QHPC is the energy yield by the heat pump to the distillation column. The factor by which the heat pump contributes to the heat load of the reboiler is given as
HPC
reb
Qf
Q (39)
For a distillation column with vapour recompression, driving the compressor uses the most energy. Thus, the power consumption must be known so as to assess the feasibility of such a system. For a perfect gas, that is, a gas having a constant specific heat, Cp = Cpo, then the specific enthalpy rise between the compressor inlet and outlet is
ob a b ah h h C T Tp (40)
And if the change of state is isentropic,
1
11
b ba
a
PRu Th vdp
M P
(41)
In reality, ideal gases do not exist and therefore improvements are made on equation (41).
Therefore, compression is polytropic and the isentropic index γ, is replaced by the polytropic index, n (see Enweremadu, 2007). The compressor polytropic efficiency
pol = 0.7 - 0.8 is used.
Also, because a saturated vapour, especially at higher pressures, shows deviations from the ideal gas behaviour, the compressibility factor, Z is used. Hence equation (41) becomes
1
11
nn
u a beff
pol a
Z R T Pnh
n M P
(42)
Therefore, the power input for driving the compressor is the energy that increase the enthalpy of the gas
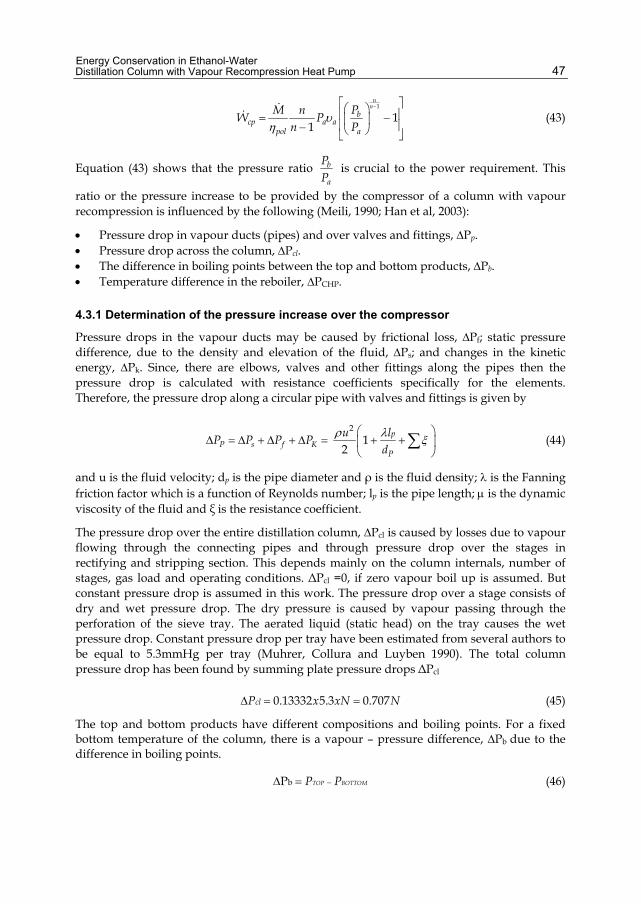
Energy Conservation in Ethanol-Water Distillation Column with Vapour Recompression Heat Pump
47
1
11
nn
bcp a a
pol a
PM nW P
n P
(43)
Equation (43) shows that the pressure ratio b
a
PP
is crucial to the power requirement. This
ratio or the pressure increase to be provided by the compressor of a column with vapour recompression is influenced by the following (Meili, 1990; Han et al, 2003):
Pressure drop in vapour ducts (pipes) and over valves and fittings, ∆Pp. Pressure drop across the column, ∆Pcl. The difference in boiling points between the top and bottom products, ∆Pb. Temperature difference in the reboiler, ∆PCHP.
4.3.1 Determination of the pressure increase over the compressor
Pressure drops in the vapour ducts may be caused by frictional loss, ∆Pf; static pressure difference, due to the density and elevation of the fluid, ∆Ps; and changes in the kinetic energy, ∆Pk. Since, there are elbows, valves and other fittings along the pipes then the pressure drop is calculated with resistance coefficients specifically for the elements. Therefore, the pressure drop along a circular pipe with valves and fittings is given by
P s f KP P P P 2
12
p
P
u ld
(44)
and u is the fluid velocity; dp is the pipe diameter and ρ is the fluid density; is the Fanning friction factor which is a function of Reynolds number; lp is the pipe length; is the dynamic viscosity of the fluid and ξ is the resistance coefficient.
The pressure drop over the entire distillation column, ∆Pcl is caused by losses due to vapour flowing through the connecting pipes and through pressure drop over the stages in rectifying and stripping section. This depends mainly on the column internals, number of stages, gas load and operating conditions. ΔPcl =0, if zero vapour boil up is assumed. But constant pressure drop is assumed in this work. The pressure drop over a stage consists of dry and wet pressure drop. The dry pressure is caused by vapour passing through the perforation of the sieve tray. The aerated liquid (static head) on the tray causes the wet pressure drop. Constant pressure drop per tray have been estimated from several authors to be equal to 5.3mmHg per tray (Muhrer, Collura and Luyben 1990). The total column pressure drop has been found by summing plate pressure drops ΔPcl
0.13332 5.3 0.707clP x xN N (45)
The top and bottom products have different compositions and boiling points. For a fixed bottom temperature of the column, there is a vapour – pressure difference, ∆Pb due to the difference in boiling points.
bP TOP BOTTOMP P (46)
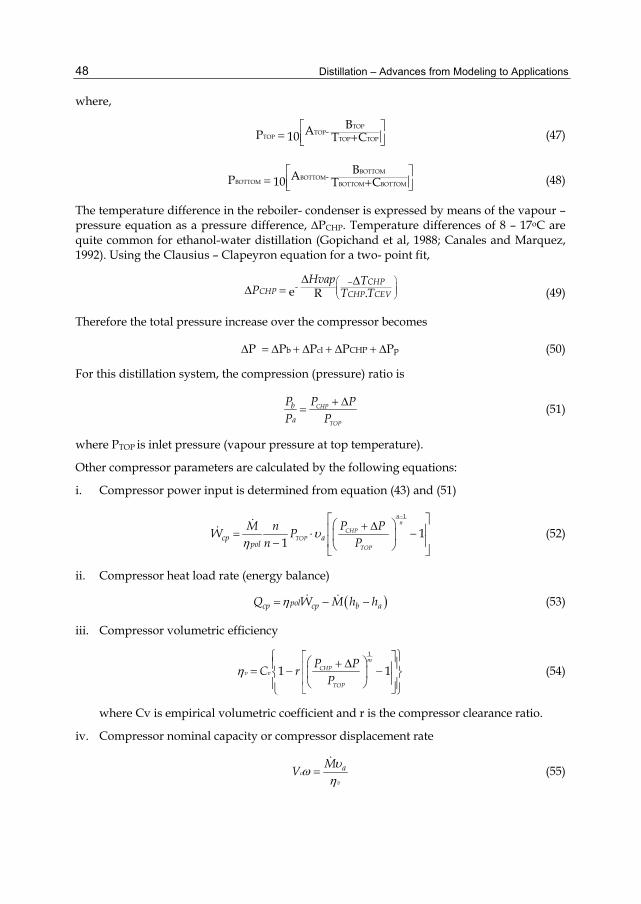
Distillation – Advances from Modeling to Applications
48
where,
TOP
TOPTOP TOP TOP
-BAP 10 T C
(47)
BOTTOM
BOTTOMBOTTOM BOTTOM BOTTOM
-BAP 10 T C
(48)
The temperature difference in the reboiler- condenser is expressed by means of the vapour – pressure equation as a pressure difference, ∆PCHP. Temperature differences of 8 – 17oC are quite common for ethanol-water distillation (Gopichand et al, 1988; Canales and Marquez, 1992). Using the Clausius – Clapeyron equation for a two- point fit,
- e R .CHP
CHP CHP CEV
Hvap TP T T
(49)
Therefore the total pressure increase over the compressor becomes
b cl CHP pP P P P P (50)
For this distillation system, the compression (pressure) ratio is
CHP
TOP
b
a
P P PP P
(51)
where PTOP is inlet pressure (vapour pressure at top temperature).
Other compressor parameters are calculated by the following equations:
i. Compressor power input is determined from equation (43) and (51)
1
11
nn
CHPTOP
TOP
cp apol
M n P PW P
n P
(52)
ii. Compressor heat load rate (energy balance)
polcp cp b aQ W M h h (53)
iii. Compressor volumetric efficiency
1
1 1m
CHPv v
TOP
P PC r
P
(54)
where Cv is empirical volumetric coefficient and r is the compressor clearance ratio.
iv. Compressor nominal capacity or compressor displacement rate
c
v
aMV
(55)
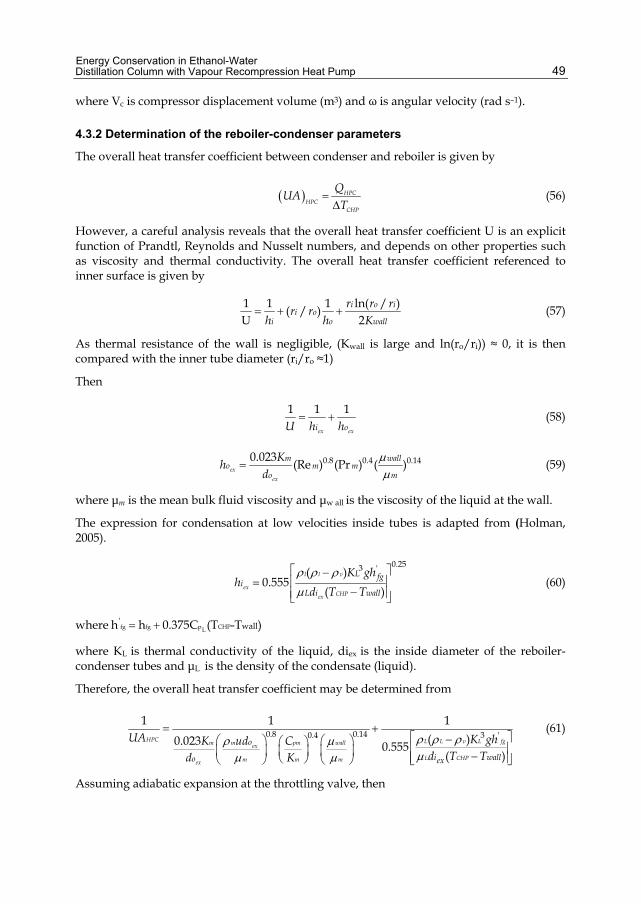
Energy Conservation in Ethanol-Water Distillation Column with Vapour Recompression Heat Pump
49
where Vc is compressor displacement volume (m3) and ω is angular velocity (rad s–1).
4.3.2 Determination of the reboiler-condenser parameters
The overall heat transfer coefficient between condenser and reboiler is given by
HPCHPC
CHP
QUA
T
(56)
However, a careful analysis reveals that the overall heat transfer coefficient U is an explicit function of Prandtl, Reynolds and Nusselt numbers, and depends on other properties such as viscosity and thermal conductivity. The overall heat transfer coefficient referenced to inner surface is given by
1 1 1 ln( / )( / )U 2
i o ii o
i o wall
r r rr r
h h K (57)
As thermal resistance of the wall is negligible, (Kwall is large and ln(ro/ri)) ≈ 0, it is then compared with the inner tube diameter (ri/ro ≈1)
Then
1 1 1ex exi oU h h
(58)
0.8 0.4 0.140.023 (Re ) (Pr ) ( )ex
ex
m wallo m m
o m
Kh
d
(59)
where μm is the mean bulk fluid viscosity and μw all is the viscosity of the liquid at the wall.
The expression for condensation at low velocities inside tubes is adapted from (Holman, 2005).
0.253 '( )
0.555( )
l l v
exCHPex
L fgi
L i wall
K ghh
d T T
(60)
where fg fg p CHPL' wallh h 0.375C (T -T )
where KL is thermal conductivity of the liquid, diex is the inside diameter of the reboiler-condenser tubes and μL is the density of the condensate (liquid).
Therefore, the overall heat transfer coefficient may be determined from
0.8 0.14 3 '0.41 1 1
( )0.023 0.555( )
HPC L L v L fgm m pm wallex
L CHPm m mex
o
i wallo ex
UA K ghK ud Cd T Td K
(61)
Assuming adiabatic expansion at the throttling valve, then

Distillation – Advances from Modeling to Applications
50
he = hd = hL,c – CpL.ΔTSC (62)
From the condenser prescribed degree of sub-cooling, the temperature of the working fluid after cooling and before throttling is given by
Td = TCHP – TSC (63)
where TSC is the degree of sub-cooling (K)
The corresponding latent heat (enthalpy) is given as
, Ld L c SCh h C TP (64)
4.4 Analysis of distribution of excess heat rate
The distillation system uses the column’s working fluid as refrigerant and does not execute a closed cycle. Therefore the excess heat which may occur is not assessed by an overall energy balance but by the method of Oliveira et al (2001). When the energy available at the condenser Qcd, is greater than the energy required by the reboiler Qreb, the column receives the amount Qcd and the energy left over corresponds to the excess. But if Qcd is smaller than or equal to Qreb, then all the energy available is transferred to the reboiler, i.e. there will be no excess. Thus,
if cd rebQ Q then 23 cd rebQ Q Q (65)
if cd rebQ Q then 23 0Q
where Q23 is the excess heat due to energy interactions between the heat pump and the reboiler.
The distribution of the excess heat rate, Q23 , between the pre-heater (Q2) and cooler (Q3) is accomplished by controlling the feed condition pre-heated by Q2. In other words, the value of Q2 should be such that the feed reaches a prescribed condition. The pre-heating of the feed is carried out by Q1 (heat exchanged between the bottom product and the feed) and Q2
(heat exchange between the heat pump working fluid and the feed), in the heat exchangers. The heat provided by the bottom product is determined as follows:
1 . p CEV BEBBC T TQ (66)
where, TCEV is the column evaporation temperature. CpB is the specific heat of the bottom product. TBE is the temperature at the bottom product flow exit.
The best feed condition is that of saturated liquid (Halvorsen, 2001). The energy required to pre-heat the feed to reach saturated condition is expressed as
,. ( )FSL PF F FsatQ F C T T (67)
where, Tsat,F and TF are the saturation temperature of the feed source and the temperature of the feed source respectively. CpF is the specific heat of the feed source.
To make the feed a saturated vapour, the energy required is given as
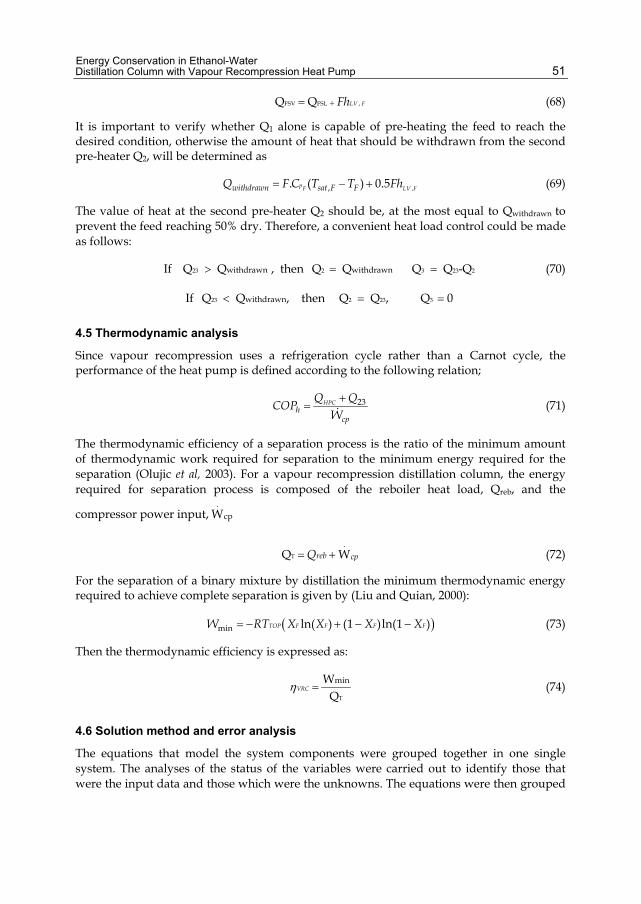
Energy Conservation in Ethanol-Water Distillation Column with Vapour Recompression Heat Pump
51
FSV FSL ,Q Q LV FFh (68)
It is important to verify whether Q1 alone is capable of pre-heating the feed to reach the desired condition, otherwise the amount of heat that should be withdrawn from the second pre-heater Q2, will be determined as
,,. ( ) 0.5pF LV Fwithdrawn sat F FQ F C T T Fh (69)
The value of heat at the second pre-heater Q2 should be, at the most equal to Qwithdrawn to prevent the feed reaching 50% dry. Therefore, a convenient heat load control could be made as follows:
If 23 withdrawnQ Q , then 2 withdrawnQ Q 3 23 2Q Q -Q (70)
If 23 withdrawnQ Q , then 2 23Q Q , 3 Q 0
4.5 Thermodynamic analysis
Since vapour recompression uses a refrigeration cycle rather than a Carnot cycle, the performance of the heat pump is defined according to the following relation;
23HPCh
cp
Q QCOP
W
(71)
The thermodynamic efficiency of a separation process is the ratio of the minimum amount of thermodynamic work required for separation to the minimum energy required for the separation (Olujic et al, 2003). For a vapour recompression distillation column, the energy required for separation process is composed of the reboiler heat load, Qreb, and the
compressor power input,.
cpW
T
.Q Wreb cpQ (72)
For the separation of a binary mixture by distillation the minimum thermodynamic energy required to achieve complete separation is given by (Liu and Quian, 2000):
min ln( ) (1 )ln(1 )TOP F F F FW RT X X X X (73)
Then the thermodynamic efficiency is expressed as:
T
minWQ
VRC (74)
4.6 Solution method and error analysis
The equations that model the system components were grouped together in one single system. The analyses of the status of the variables were carried out to identify those that were the input data and those which were the unknowns. The equations were then grouped

Distillation – Advances from Modeling to Applications
52
together, resulting in a set of non-linear algebraic equations, which were solved iteratively based on the step by step use of the successive substitution method. Solution was obtained when convergence was attained. The convergence was checked by using the criterion:
i 1
i 1
ia
X - Xx 100%
X
(75)
The model is coded in MATLAB environment and used to evaluate the unknowns. A control programme for column VRC was written to compare the actual column (column in which the parameters studied were considered, VRCΔP).
5. Discussion of results 5.1 Effects of pressure increase over the compressor
Figure 3 shows how the compressor power input, .
cpW varies with the pressure increase over the compressor, ΔP. It is obvious from the plots that an increase in pressure over the compressor increases the compression (pressure) ratio leading to increase in compressor power input. The curve in Figure 3 shows the effect of pressure increase over the compressor on coefficient of performance. As the pressure increase over the compressor, ΔP increases, the compression ratio increases and the coefficient of performance, COP decreases due to increase in compressor power input.
0.5
0.52
0.54
0.56
0.58
0.6
5
5.2
5.4
5.6
5.8
6
0 20 40 60 80 100
Com
pres
sor p
ower
inpu
t (kW
)
Coe
ffic
ient
of p
erfo
rman
ce
Pressure increase across compressor (kPa)
COPPower
Fig. 3. The variation of coefficient of performance and compressor power input with pressure increase across compressor
In Figure 4, a negative non-linear relationship exists between the compressor volumetric efficiency and pressure increase over the compressor. For a given compressor nominal capacity, when the pressure increase across the compressor, ΔP increases, the pressure ratio also increases resulting in the reduction in volumetric efficiency.
The influence of pressure increase over the compressor, ΔP on the required compressor displacement rate (Vcω) is shown in Figure 4. The linear relationship that exists between the
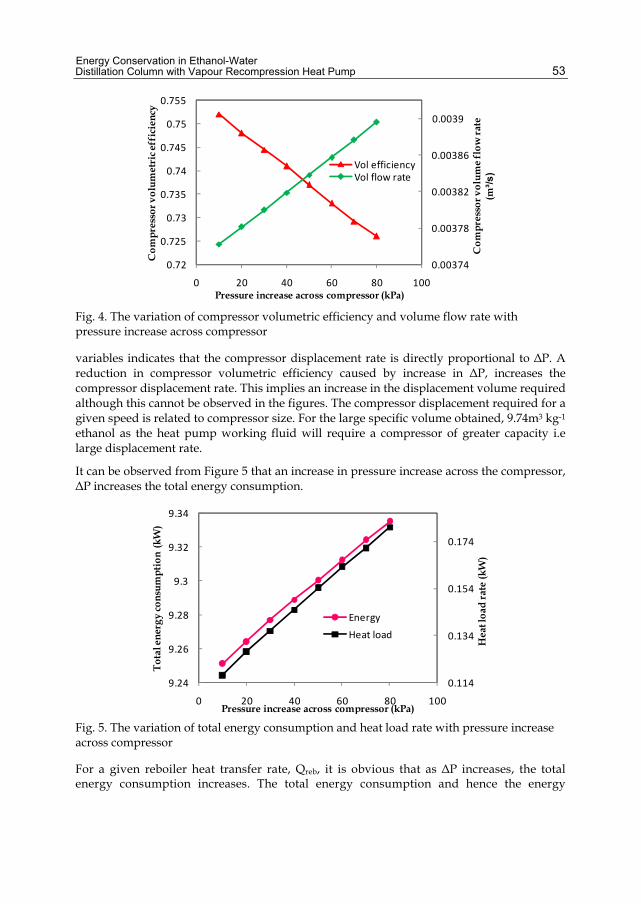
Energy Conservation in Ethanol-Water Distillation Column with Vapour Recompression Heat Pump
53
0.00374
0.00378
0.00382
0.00386
0.0039
0.72
0.725
0.73
0.735
0.74
0.745
0.75
0.755
0 20 40 60 80 100
Com
pres
sor v
olum
e flo
w ra
te
(m³/s
)
Com
pres
sor v
olum
etri
c eff
icie
ncy
Pressure increase across compressor (kPa)
Vol efficiencyVol flow rate
Fig. 4. The variation of compressor volumetric efficiency and volume flow rate with pressure increase across compressor
variables indicates that the compressor displacement rate is directly proportional to ΔP. A reduction in compressor volumetric efficiency caused by increase in ΔP, increases the compressor displacement rate. This implies an increase in the displacement volume required although this cannot be observed in the figures. The compressor displacement required for a given speed is related to compressor size. For the large specific volume obtained, 9.74m3 kg-1 ethanol as the heat pump working fluid will require a compressor of greater capacity i.e large displacement rate.
It can be observed from Figure 5 that an increase in pressure increase across the compressor, ΔP increases the total energy consumption.
0.114
0.134
0.154
0.174
9.24
9.26
9.28
9.3
9.32
9.34
0 20 40 60 80 100
Hea
t loa
d ra
te (k
W)
Tota
l ene
rgy
cons
umpt
ion
(kW
)
Pressure increase across compressor (kPa)
EnergyHeat load
Fig. 5. The variation of total energy consumption and heat load rate with pressure increase across compressor
For a given reboiler heat transfer rate, Qreb, it is obvious that as ΔP increases, the total energy consumption increases. The total energy consumption and hence the energy

Distillation – Advances from Modeling to Applications
54
savings from the work of Oliveira et al (2001) in heat pump distillation gave lower values. This could be attributed to non-consideration of the effect of pressure increase over the compressor and the subsequent increase in compression ratio and in compression power input respectively.
5.2 Effects of column heat loss
The direct effect of column heat loss could be seen from equation (17). From the equation, it follows that, for a given reboiler heat load or heat expenditure, fewer trays are required for a given separation if heat losses are reduced. Where heat loss occurs, more vapour has to be produced in the reboiler, since the reboiler must provide not only the heat removed in the condenser but also the heat loss. The effect of this is a decrease in process and energy efficiency. Indirectly, heat loss affects the column size in terms of number of plates. In the control system, the reflux ratio was as high as 7.5 compared with 5.033 obtained for the actual system. Therefore, if heat losses are properly accounted for, there may not be any need for downward review of the number of plates in order to reduce the reflux ratio (Enweremadu and Rutto, 2010). Therefore, pressure drop across the column, ΔPcl and the difference in boiling points between the top and bottom products, ΔPb which have the most profound effects on the pressure increase across the compressor, ΔP will be properly predicted. The overall implication of this is that the column size would be determined properly.
5.2.1 Overall heat transfer coefficient
Analysis of the overall heat transfer coefficient, U of the heat pump reboiler-condenser revealed an increase in the value of U. This was expected as the value of U in boiling and condensation processes are high. Also, the value of the heat transfer coefficient of the condensing ethanol is dominated the relationship used in determining U. A low value of overall heat transfer coefficient U will result in an increase in the heat exchanger surface area which may be a disadvantage to ethanol-water system. But the results from this work showed an increase in the value of U with the implication of a reduction in the reboiler-condenser heat transfer area.
The variation of the reboiler-condenser thermal conductance (UA) with the heat pump distribution factor, f, is shown in Figure 6. The plots show that the greater the heat load taken by the heat pump i.e. larger f’s, the larger the thermal conductance, UA, and the larger the heat exchanger area. However, for better performance of any heat transfer system, the thermal resistance (Rth) which is the inverse of thermal conductance (Rth = 1/UA), should be as low as possible. Therefore the value of the heat transfer area for the VRCΔP system will be smaller compared to the VRC system. Hence, the reboiler-condenser studied has a better performance.
The relationship between the thermal conductance, UA and the reboiler-condenser temperature difference, ΔTCHP shows that the higher the reboiler-condenser temperature difference, the lower the thermal conductance. The implication of this is that a higher ΔTCHP causes a reduction of the necessary heat transfer area. However, beyond a certain limit of the thermal driving force, the heat transfer area and the performance of the heat pump reboiler-condenser reduces. This is expected as higher ΔTCHP leads to higher compression ratio, higher compressor power input and higher energy consumption.

Energy Conservation in Ethanol-Water Distillation Column with Vapour Recompression Heat Pump
55
0
0.2
0.4
0.6
0.8
1
1.2
0 0.2 0.4 0.6 0.8 1 1.2
Ther
mal
cond
ucta
nce
(kW
/K)
Condenser distribution factor Fig. 6. Variation of Reboiler-condenser thermal conductance with condenser distribution factor
5.3 Comparison of the vapour recompression distillation systems
Table 1 summarises the comparison of some parameters of the two vapour recompression columns studied, the control (VRC) and the actual (VRCΔP). Both systems operate at 101.2 kPa and the effect of pressure drop effect is considered to account properly for variations in heat duty. A pressure drop of 0.707kPa per tray is assumed here as a reasonable estimate for the purposes of this study. The pressure ratio as used throughout this work is the ratio of the condensation pressure, PCHP to the top pressure, PTOP, for the VRC system and sum of the condensation pressure, PCHP and pressure increase over the compressor, ΔP, to the top pressure, PTOP for the VRCΔP system. Since the energy consumption changes linearly with the feed flow rate, and as the present work makes a comparison of the relative performances, the base case flow rate was taken to be 1.098x10⁻⁴kmol s-1 . Also the column heat loss and the effect of such parameters as pressure increase across the compressor, the overall heat transfer coefficient of reboiler–condenser as an explicit function of Prandtl, Reynolds and Nusselt numbers which in turn depend on fluid properties are considered to account properly for variations in heat duty (Enweremadu, 2007; Enweremadu et al, 2009).
Table 1 shows that the VRC enables some energy savings when compared with VRCΔP. The VRC has a slightly lower compression ratio and consumes less energy than VRCΔP system. Although there was a marginal increase in ΔP, which increased the compressor power input slightly, the performances of the two systems differ greatly by 27.5%. However, in addition to the pressure increase, the energy consumption appears to depend more on the rate of heat transfer in the reboiler. Hence the total energy consumption is indirectly related to column heat loss and pressure increase across the compressor through reboiler heat transfer and compressor power input respectively.
Also from Table 1, the heat transfer duties of the reboiler-condenser in terms of the overall heat transfer coefficient for the two systems show that the VRCΔP has a higher value when compared with the VRC system. This implies that the VRCΔP will require a smaller heat
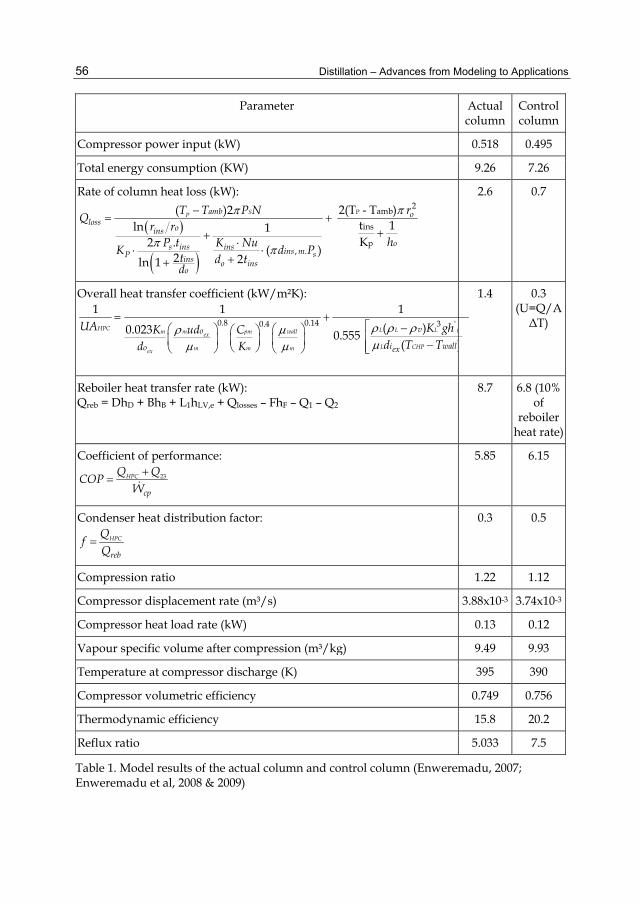
Distillation – Advances from Modeling to Applications
56
Parameter Actual column
Control column
Compressor power input (kW) 0.518 0.495
Total energy consumption (KW) 9.26 7.26
Rate of column heat loss (kW):
, .
( )2ln 1
2 . ( )2 2ln 1
SP ambloss
oins
s ins ins ins m sP ins o inso
T T P NQ
r rP t K Nu
d PKt d td
P2amb
ins
p
2(T - T )t 1K
o
o
r
h
2.6 0.7
Overall heat transfer coefficient (kW/m²K):
0.8 0.14 3 '0.41 1 1
( )0.023 0.555 ( )
HPC L L L fm m pm wallex
L CHPm m mex
vo
i wallo ex
UA K ghK ud Cd T Td K
1.4 0.3 (U=Q/AΔT)
Reboiler heat transfer rate (kW):Qreb = DhD + BhB + L1hLV,e + Qlosses – FhF – Q1 – Q2
8.7 6.8 (10% of
reboiler heat rate)
Coefficient of performance:23HPC
cp
Q QCOP
W
5.85 6.15
Condenser heat distribution factor:HPC
reb
Qf
Q
0.3 0.5
Compression ratio 1.22 1.12
Compressor displacement rate (m³/s) 3.88x10⁻³ 3.74x10⁻³
Compressor heat load rate (kW) 0.13 0.12
Vapour specific volume after compression (m³/kg) 9.49 9.93
Temperature at compressor discharge (K) 395 390
Compressor volumetric efficiency 0.749 0.756
Thermodynamic efficiency 15.8 20.2
Reflux ratio 5.033 7.5
Table 1. Model results of the actual column and control column (Enweremadu, 2007; Enweremadu et al, 2008 & 2009)

Energy Conservation in Ethanol-Water Distillation Column with Vapour Recompression Heat Pump
57
transfer area which is economical in terms of material conservation. Also, with higher U, the VRCΔP will have a better performance.
The column heat losses for the two vapour recompression distillation columns are shown in Table 1. The heat losses in distillation columns with heat pumps have been assumed to correspond to around 3% of the energy supplied to the reboiler (Danziger, 1979). Oliveira, Marques and Parise (2002) assumed it to be as high as 10%. However, in this study, the heat exchanged by the distillation column with the surroundings is considered and its effect included in the balance equation (1). The results obtained for the VRCΔP showed a marked difference between the two systems.
A comparison of the main reboiler heat transfer rate for the two systems is presented in Table 1. It is evident that neglecting and /or assuming a value for column heat loss instead of determining it had a significant effect on the values of Qreb in both systems. The heat pump distribution factor, f, for the VRCΔP system is 0.346 which is slightly less than that for the VRC system (0.451). Since low value of heat load taken by the heat pump, f implies lower thermal conductance, then the value of the heat transfer area for the VRCΔP system is smaller when compared to the VRC system. However, lower value of thermal conductance, UA, for the VRCΔP system indicates that the VRC system will have a better performance.
The simulation results also show that the coefficient of performance and the thermodynamic efficiency of the VRCΔP system is lower when compared to the VRC system. Fonyo and Benko (1998) have shown that the electrically-driven compression heat pump should work with a COP not lower than 3-5. The value of 5.85 obtained from this study has shown that although there is a decrease in the effectiveness of the VRCΔP system when compared with the VRC system with COP of 6.15, it is within the acceptable range. This may be due to the fact that the compressor power input and the total energy consumption in the VRCΔP system is higher than in the VRC system.
6. Conclusions From the outcome of the study, the following conclusions may be drawn:
1. Pressure increase across the compressor, ΔP increases the compression ratio, the compressor power input, temperature in the heat pump reboiler-condenser while the compressor volumetric efficiency decreases. The effect of these is the reduction in the heat pump coefficient of performance and the use of a compressor of greater capacity.
2. Neglecting the effects of pressure increase across the compressor, ΔP reduces the compression ratio and hence maximizes the energy efficiency. However, this leads to a substantial decrease in temperature in the heat pump reboiler-condenser. The overall effect of this is a decrease in the overall heat transfer coefficient, U resulting in an increase in heat transfer area.
3. From the comparison between the VRCΔP and VRC systems, there was a profound difference in the overall heat transfer coefficient while the column heat loss was substantial. The increase in the total energy consumption, reboiler heat transfer rate and the thermodynamic efficiency were appreciable, while there was only a marginal increase
Distillation – Advances from Modeling to Applications
58
in the compressor power input resulting in a difference of 5.12% in the coefficient of performance between the VRCΔP and VRC systems.
4. Calculation of the column heat loss in contrast to the assumed value of certain percentage of the reboiler heat transfer rate gives a higher value resulting in higher energy consumption and lower thermodynamic efficiency.
7. References Ackland, T. (1990). Physical Properties of Ethanol-Water Binary Mix. 20.07.2006, Available from
http://www.homedistillers.org AM Cola LLC (2005). EZChemDB Thermodynamic Properties Table for Ethanol Braisher, M.; Gill, S.; Treharne, W.; Wallace, M. & Winterburn, J. (2006). Design Proposal:
Bio-ethanol Production Plant. 15.02.2007, Available from http://www.ethanol.org Brousse, E.; Claudel, B. & Jallut, C. (1985). Modeling and Optimisation of the Steady
Operation of a Vapour Recompression Distillation Column. Chemical Engineering Science, Vol. 40, No. 11, pp, 2073–2078, ISSN 0009-2509
Canales, E. & Marquez, F. (1992). Operation and Experimental Results on a Vapor Recompression Pilot Plant Distillation Column. Industrial & Engineering Chemistry Research, Vol. 31, pp. 2547 -2555, ISSN 0888-5885
Collura, M. & Luyben, W. (1988). Energy – Saving Distillation Designs in Ethanol Production. Industrial & Engineering Chemistry Research, Vol. 27, pp. 1686–1696, ISSN 0888-5885
Danziger, R. (1979). Distillation Column with Vapor Recompression. Chemical Engineering Progress Vol. 75, No. 9, pp. 58-64, ISSN 0360-7275
Emtir, M.; Miszey, P.; Rev, E. & Fonyo, Z. (2003). Economic and Controllability Investigation and Comparison of Energy-Integrated Distillation Schemes. Chemical and Biochemical Engineering Quarterly. Vol. 17, No.1, pp. 31-42, ISSN 0352-9568
Enweremadu, C.(2007). Simulation of an ethanol–water distillation column with direct vapour recompression heat pump. PhD Thesis. Ladoke Akintola University of Technology, Ogbomoso, Nigeria
Enweremadu, C.; Waheed, M. & Ojediran, J. (2008). Parametric study of pressure increase across a compressor in ethanol-water vapour recompression distillation, Scientific Research and Essay, Vol. 3, No.9, pp. 231-241, ISSN 1992-2224
Enweremadu, C.; Waheed, M. & Ojediran, J. (2009). Parametric study of an ethanol-water distillation column with direct vapour recompression heat pump, Energy for Sustainable Development. Vol. 13, No. 2, pp. 96-105, ISSN 0973-0826
Enweremadu, C. & Rutto, H. (2010). Investigation of heat loss in ethanol-water distillation column with direct vapour recompression heat pump, Proceedings of World Academy of Science, Engineering & Technology 2010, International Conference on Thermal Engineering, pp. 69-76, ISSN 1307-6892, Amsterdam, The Netherlands, 28 – 30 September, 2010
Ferre, J.; Castells, F. & Flores, J. (1985). Optimization of a Distillation Column with a Direct Vapor Recompression Heat Pump. Industrial and Engineering Chemistry Process Design and Development, Vol. 24, pp. 128-132, ISSN 0196-4305

Energy Conservation in Ethanol-Water Distillation Column with Vapour Recompression Heat Pump
59
Fonyo, Z. & Benko, N. (1998). Comparison of various heat pump-assisted distillation configurations. Transactions of the Institution of Chemical Engineers. Vol. 76, Part A, pp. 348-360, ISSN 0046-9858
Gani, R.; Ruiz, C. & Cameron, I. (1986). A Generalised Model for Distillation Column I: Model Description and Applications. Computers & Chemical Engineering, Vol.10, No.3, pp.181-198, ISSN 0098-1354
Gopichand, S.; Devotta, S.; Diggory, P. & Holland, F. (1988). Heat Pump-Assisted Distillation VIII: Design of a System for Separating Ethanol and Water. International Journal of Energy Research, Vol.12, No. 1, pp.1-10, ISSN 0363-907X
Halvorsen, I. (2001). Minimum Energy Requirements in Complex Distillation Arrangements. Dr.Ing.Thesis, Department of Chemical Engineering, Norwegian University of Science and Technology. 20.10.2004, Available from
http://www.chembio.ntnu.no/users/skoge/publications Han, M.; Lin, H.; Yuan, Y.; Wang, D. & Jin, Y. (2003). Pressure Drop for Two-phase Counter-
current Flow in a Packed Column with a Novel Internal. Chemical Engineering Journal. Vol. 94, pp. 179-184, ISSN 1385-8947
Hewitt, G.; Quarini, J. & Morell, M. (1999). More Efficient Distillation. The Chemical Engineer, 21st October 1999
Holman, J. (2005). Heat Transfer, 9th Edition. McGraw-Hill Book Co., ISBN 0-07-029620-0, New York
Jorapur, R. & Rajvanshi, A. (1991). Alcohol distillation by solar energy, ISES Solar World Congress Proceedings, Vol. I, Part II, pp. 772-777, Denver, Colorado, USA, August 19-21, 1991
Liu, X. & Quian, J. (2001). Modelling, Control and Optimization of Ideal Internal Thermally Coupled Distillation Columns. Chemical Engineering & Technology. Vol. 23, No. 3, pp. 235– 241, ISSN 1521-4125
Meili, A .(1990). Heat Pumps for Distillation Columns. Chemical Engineering Progress, pp. 60–65, June 1990, ISSN 0360-7275
Mori, H.; Ito, C.; Taguchi, K. & Aragaki, T. (2002). Simplified Heat and Mass Transfer Model for Distillation Column Simulation. Journal of Chemical Engineering of Japan. Vol. 35, No.1, pp.100 - 106, ISSN 0021-9592
Muhrer, C.; Collura, M. & Luyben W. (1990). Control of Vapor Recompression Distillation Columns. Industrial Engineering and Chemistry Research., Vol. 29, No. 1, pp. 59-71, ISSN 0888-5885
Null, H. (1976). Heat Pumps in Distillation. Chemical Engineering Progress, pp. 58 –64, July 1976, ISSN 0360-7275
Oliveira S.; Marques R. & Parise, J. (2001). Modelling of an Ethanol – Water Distillation Column with Vapor Recompression. International Journal of Energy Research. Vol. 25, No. 10, pp. 845–858, ISSN 0363-907X
Oliveira, S.; Marques R. & Parise, J. (2002). Modelling of an Ethanol – Water Distillation Column Assisted by an External Heat Pump. International Journal of Energy Research. Vol. 26, pp, 1055 – 1072, ISSN 0363-907X
Distillation – Advances from Modeling to Applications
60
Olujic, Z.; Fakhri, F.; de Rijke, A.; de Graauw, J. & Jansen, P. (2003). Internal Heat Integration – the key to an energy-conserving distillation column. Journal of Chemical Technology and Biotechnology. Vol. 78, pp, 241 – 248, ISSN1097-4660
Pfeffer, M.; Wukovits, W.; Beckmann, G. & Friedl, A. (2007). Analysis and decrease of the energy demand of bioethanol production by process integration. Applied Thermal Engineering. Vol.27, No. , pp. 2657-2664, ISSN 1359-4311
Rajput, R. (2002). Heat and Mass Transfer. S.Chand and Co. Ltd., New Delhi, ISBN 81-219- 1777-8
Sloley, A. (2001). Energy Conservation Seminars for Industry: Texas Energy Conservation. Distillation Column Operations Manual. 16.11.2005, Available from
http://www.distillationgroup.com

3
The Design and Simulation of the Synthesis of Dimethyl Carbonate and the Product Separation Process Plant
Feng Wang1, Ning Zhao1, Fukui Xiao1, Wei Wei1 and Yuhan Sun1,2 1State Key Laboratory of Coal Conversion, Institute of Coal Chemistry,
Chinese Academy of Sciences, Taiyuan Shanxi 2Low Carbon Energy Conversion Center, Shanghai Advanced Research Institute,
Chinese Academy of Sciences, Shanghai P.R. China
1. Introduction Dimethyl carbonate (DMC) has become a green and environmental benign chemical due to its multiple reactivity and widely potential usage in chemical industry1. It has been used as a substitute to replace dimethyl sulfate and methyl halides in methylation reactions and as a carbonylation agent to substitute phosgene for the production of polycarbonates and urethane polymers. It also has been evaluated to apply as non-aqueous electrolyte component in lithium rechargeable batteries. Additionally, DMC is a strong contender to help the refining industry meet the Clean Air Act specifications for oxygen in gasoline. DMC has about 3 times the oxygen content as methyl tert-butyl ether (MTBE) and its synthesis is not dependent upon FCU isobutylene yields like MTBE. DMC has a good blending octane (R + M/2 = 105), it does not phase separate in a water stream like some alcohols do, and it is both low in toxicity and quickly biodegradable2.
Many of the properties of DMC make it a genuinely green reagent, particularly if compared to conventional alkylating agents, such as methyl halides (CH3X) and dimethyl sulfate (DMS) or to phosgene used as a methoxycarbonylating reagent. Firstly, DMC has been proved to be a nontoxic compound. Some of the toxicological properties of DMC and phosgene and DMS are compared in Table 1. Secondly, it has been classified as a flammable liquid, smells like methanol, and does not have irritating or mutagenic effects either by contact or inhalation. Therefore, it can be handled safely without the special precautions required for the poisonous and mutagenic methyl halides and DMS and the extremely toxic phosgene. Some physicochemical properties of DMC are listed in Table 2.
The phosgene-free route for synthesis of DMC has been widely concerned by academic and industrial researchers, such as the oxidative carbonylation of methanol, the transesterification of propylene or ethylene carbonate (PC or EC), the methanolysis of urea and direct synthesis of carbon dioxide with methanol. Recently, the newly derived route of the synthesis of DMC by urea methanolysis method was considered as a novel routine for the DMC synthesis because of the advantages of easily obtained materials, moderate
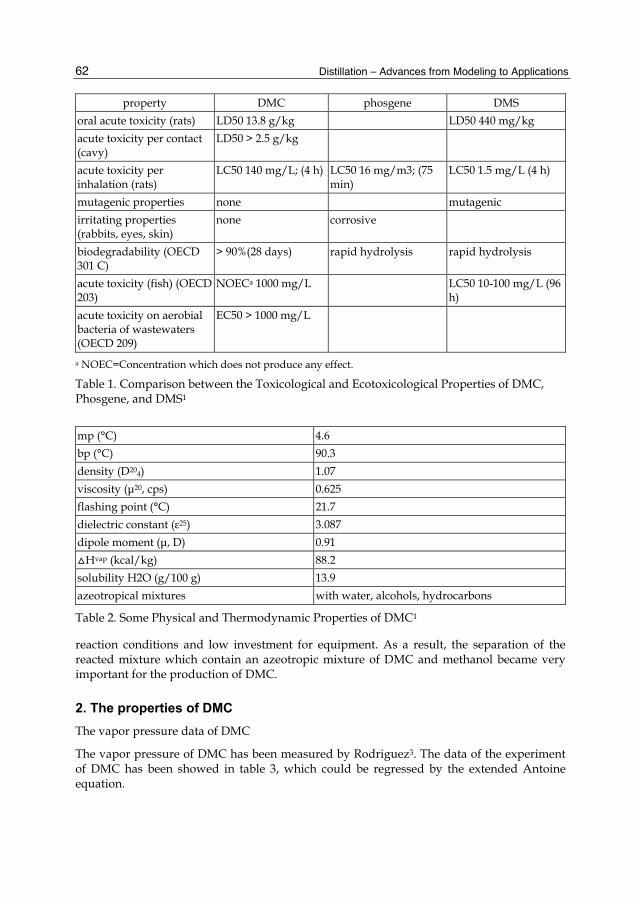
Distillation – Advances from Modeling to Applications
62
property DMC phosgene DMS oral acute toxicity (rats) LD50 13.8 g/kg LD50 440 mg/kg acute toxicity per contact (cavy)
LD50 > 2.5 g/kg
acute toxicity per inhalation (rats)
LC50 140 mg/L; (4 h) LC50 16 mg/m3; (75 min)
LC50 1.5 mg/L (4 h)
mutagenic properties none mutagenic irritating properties (rabbits, eyes, skin)
none corrosive
biodegradability (OECD 301 C)
> 90%(28 days) rapid hydrolysis rapid hydrolysis
acute toxicity (fish) (OECD 203)
NOECa 1000 mg/L LC50 10-100 mg/L (96 h)
acute toxicity on aerobial bacteria of wastewaters (OECD 209)
EC50 > 1000 mg/L
a NOEC=Concentration which does not produce any effect.
Table 1. Comparison between the Toxicological and Ecotoxicological Properties of DMC, Phosgene, and DMS1
mp (°C) 4.6 bp (°C) 90.3 density (D204) 1.07 viscosity (μ20, cps) 0.625 flashing point (°C) 21.7 dielectric constant (ε25) 3.087 dipole moment (μ, D) 0.91 △Hvap (kcal/kg) 88.2 solubility H2O (g/100 g) 13.9 azeotropical mixtures with water, alcohols, hydrocarbons
Table 2. Some Physical and Thermodynamic Properties of DMC1
reaction conditions and low investment for equipment. As a result, the separation of the reacted mixture which contain an azeotropic mixture of DMC and methanol became very important for the production of DMC.
2. The properties of DMC The vapor pressure data of DMC
The vapor pressure of DMC has been measured by Rodriguez3. The data of the experiment of DMC has been showed in table 3, which could be regressed by the extended Antoine equation.
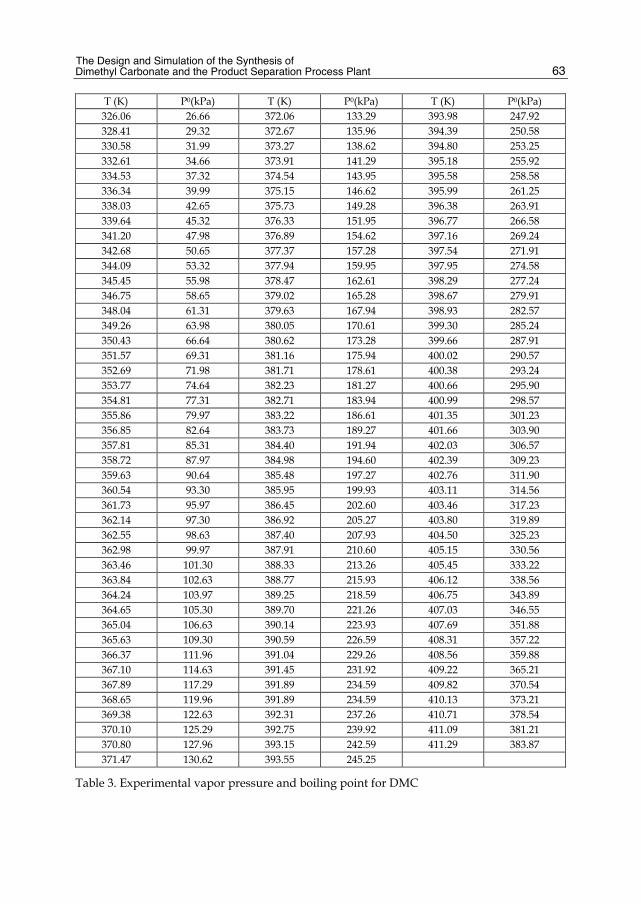
The Design and Simulation of the Synthesis of Dimethyl Carbonate and the Product Separation Process Plant
63
T (K) P0(kPa) T (K) P0(kPa) T (K) P0(kPa) 326.06 26.66 372.06 133.29 393.98 247.92 328.41 29.32 372.67 135.96 394.39 250.58 330.58 31.99 373.27 138.62 394.80 253.25 332.61 34.66 373.91 141.29 395.18 255.92 334.53 37.32 374.54 143.95 395.58 258.58 336.34 39.99 375.15 146.62 395.99 261.25 338.03 42.65 375.73 149.28 396.38 263.91 339.64 45.32 376.33 151.95 396.77 266.58 341.20 47.98 376.89 154.62 397.16 269.24 342.68 50.65 377.37 157.28 397.54 271.91 344.09 53.32 377.94 159.95 397.95 274.58 345.45 55.98 378.47 162.61 398.29 277.24 346.75 58.65 379.02 165.28 398.67 279.91 348.04 61.31 379.63 167.94 398.93 282.57 349.26 63.98 380.05 170.61 399.30 285.24 350.43 66.64 380.62 173.28 399.66 287.91 351.57 69.31 381.16 175.94 400.02 290.57 352.69 71.98 381.71 178.61 400.38 293.24 353.77 74.64 382.23 181.27 400.66 295.90 354.81 77.31 382.71 183.94 400.99 298.57 355.86 79.97 383.22 186.61 401.35 301.23 356.85 82.64 383.73 189.27 401.66 303.90 357.81 85.31 384.40 191.94 402.03 306.57 358.72 87.97 384.98 194.60 402.39 309.23 359.63 90.64 385.48 197.27 402.76 311.90 360.54 93.30 385.95 199.93 403.11 314.56 361.73 95.97 386.45 202.60 403.46 317.23 362.14 97.30 386.92 205.27 403.80 319.89 362.55 98.63 387.40 207.93 404.50 325.23 362.98 99.97 387.91 210.60 405.15 330.56 363.46 101.30 388.33 213.26 405.45 333.22 363.84 102.63 388.77 215.93 406.12 338.56 364.24 103.97 389.25 218.59 406.75 343.89 364.65 105.30 389.70 221.26 407.03 346.55 365.04 106.63 390.14 223.93 407.69 351.88 365.63 109.30 390.59 226.59 408.31 357.22 366.37 111.96 391.04 229.26 408.56 359.88 367.10 114.63 391.45 231.92 409.22 365.21 367.89 117.29 391.89 234.59 409.82 370.54 368.65 119.96 391.89 234.59 410.13 373.21 369.38 122.63 392.31 237.26 410.71 378.54 370.10 125.29 392.75 239.92 411.09 381.21 370.80 127.96 393.15 242.59 411.29 383.87 371.47 130.62 393.55 245.25
Table 3. Experimental vapor pressure and boiling point for DMC
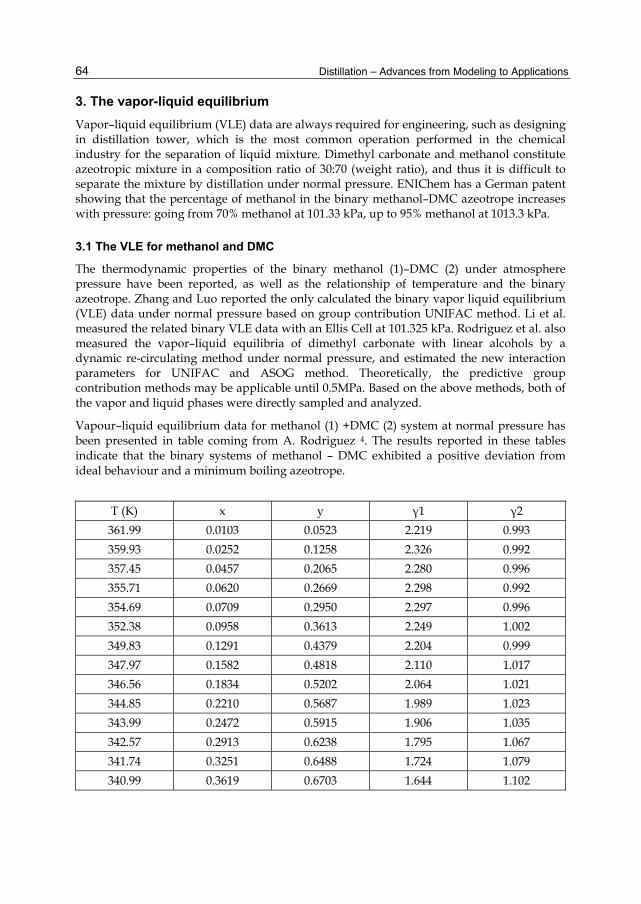
Distillation – Advances from Modeling to Applications
64
3. The vapor-liquid equilibrium Vapor–liquid equilibrium (VLE) data are always required for engineering, such as designing in distillation tower, which is the most common operation performed in the chemical industry for the separation of liquid mixture. Dimethyl carbonate and methanol constitute azeotropic mixture in a composition ratio of 30:70 (weight ratio), and thus it is difficult to separate the mixture by distillation under normal pressure. ENIChem has a German patent showing that the percentage of methanol in the binary methanol–DMC azeotrope increases with pressure: going from 70% methanol at 101.33 kPa, up to 95% methanol at 1013.3 kPa.
3.1 The VLE for methanol and DMC
The thermodynamic properties of the binary methanol (1)–DMC (2) under atmosphere pressure have been reported, as well as the relationship of temperature and the binary azeotrope. Zhang and Luo reported the only calculated the binary vapor liquid equilibrium (VLE) data under normal pressure based on group contribution UNIFAC method. Li et al. measured the related binary VLE data with an Ellis Cell at 101.325 kPa. Rodriguez et al. also measured the vapor–liquid equilibria of dimethyl carbonate with linear alcohols by a dynamic re-circulating method under normal pressure, and estimated the new interaction parameters for UNIFAC and ASOG method. Theoretically, the predictive group contribution methods may be applicable until 0.5MPa. Based on the above methods, both of the vapor and liquid phases were directly sampled and analyzed.
Vapour–liquid equilibrium data for methanol (1) +DMC (2) system at normal pressure has been presented in table coming from A. Rodriguez 4. The results reported in these tables indicate that the binary systems of methanol – DMC exhibited a positive deviation from ideal behaviour and a minimum boiling azeotrope.
T (K) x y γ1 γ2 361.99 0.0103 0.0523 2.219 0.993 359.93 0.0252 0.1258 2.326 0.992 357.45 0.0457 0.2065 2.280 0.996 355.71 0.0620 0.2669 2.298 0.992 354.69 0.0709 0.2950 2.297 0.996 352.38 0.0958 0.3613 2.249 1.002 349.83 0.1291 0.4379 2.204 0.999 347.97 0.1582 0.4818 2.110 1.017 346.56 0.1834 0.5202 2.064 1.021 344.85 0.2210 0.5687 1.989 1.023 343.99 0.2472 0.5915 1.906 1.035 342.57 0.2913 0.6238 1.795 1.067 341.74 0.3251 0.6488 1.724 1.079 340.99 0.3619 0.6703 1.644 1.102
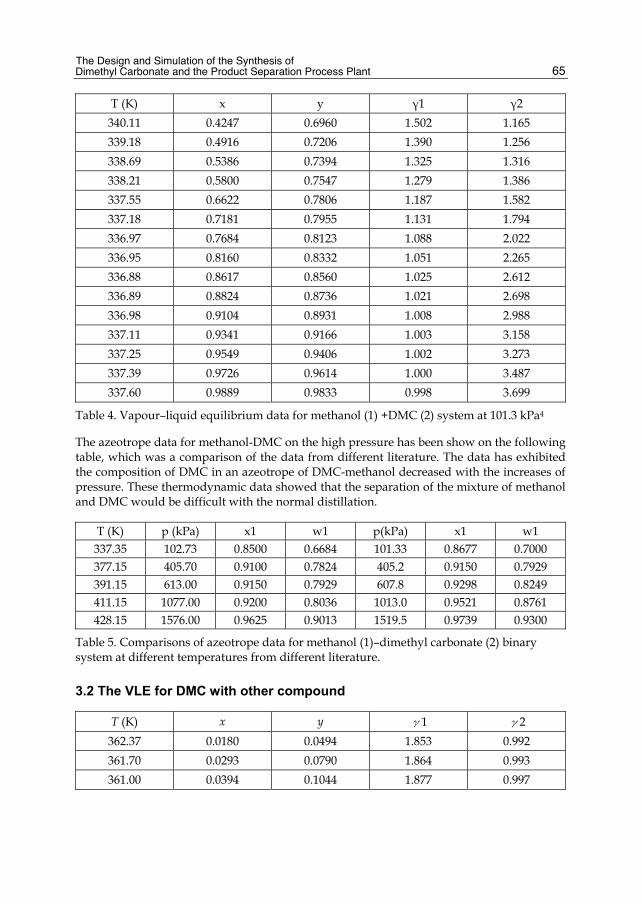
The Design and Simulation of the Synthesis of Dimethyl Carbonate and the Product Separation Process Plant
65
T (K) x y γ1 γ2 340.11 0.4247 0.6960 1.502 1.165 339.18 0.4916 0.7206 1.390 1.256 338.69 0.5386 0.7394 1.325 1.316 338.21 0.5800 0.7547 1.279 1.386 337.55 0.6622 0.7806 1.187 1.582 337.18 0.7181 0.7955 1.131 1.794 336.97 0.7684 0.8123 1.088 2.022 336.95 0.8160 0.8332 1.051 2.265 336.88 0.8617 0.8560 1.025 2.612 336.89 0.8824 0.8736 1.021 2.698 336.98 0.9104 0.8931 1.008 2.988 337.11 0.9341 0.9166 1.003 3.158 337.25 0.9549 0.9406 1.002 3.273 337.39 0.9726 0.9614 1.000 3.487 337.60 0.9889 0.9833 0.998 3.699
Table 4. Vapour–liquid equilibrium data for methanol (1) +DMC (2) system at 101.3 kPa4
The azeotrope data for methanol-DMC on the high pressure has been show on the following table, which was a comparison of the data from different literature. The data has exhibited the composition of DMC in an azeotrope of DMC-methanol decreased with the increases of pressure. These thermodynamic data showed that the separation of the mixture of methanol and DMC would be difficult with the normal distillation.
T (K) p (kPa) x1 w1 p(kPa) x1 w1 337.35 102.73 0.8500 0.6684 101.33 0.8677 0.7000 377.15 405.70 0.9100 0.7824 405.2 0.9150 0.7929 391.15 613.00 0.9150 0.7929 607.8 0.9298 0.8249 411.15 1077.00 0.9200 0.8036 1013.0 0.9521 0.8761 428.15 1576.00 0.9625 0.9013 1519.5 0.9739 0.9300
Table 5. Comparisons of azeotrope data for methanol (1)–dimethyl carbonate (2) binary system at different temperatures from different literature.
3.2 The VLE for DMC with other compound
T (K) x y γ1 γ2 362.37 0.0180 0.0494 1.853 0.992 361.70 0.0293 0.0790 1.864 0.993 361.00 0.0394 0.1044 1.877 0.997
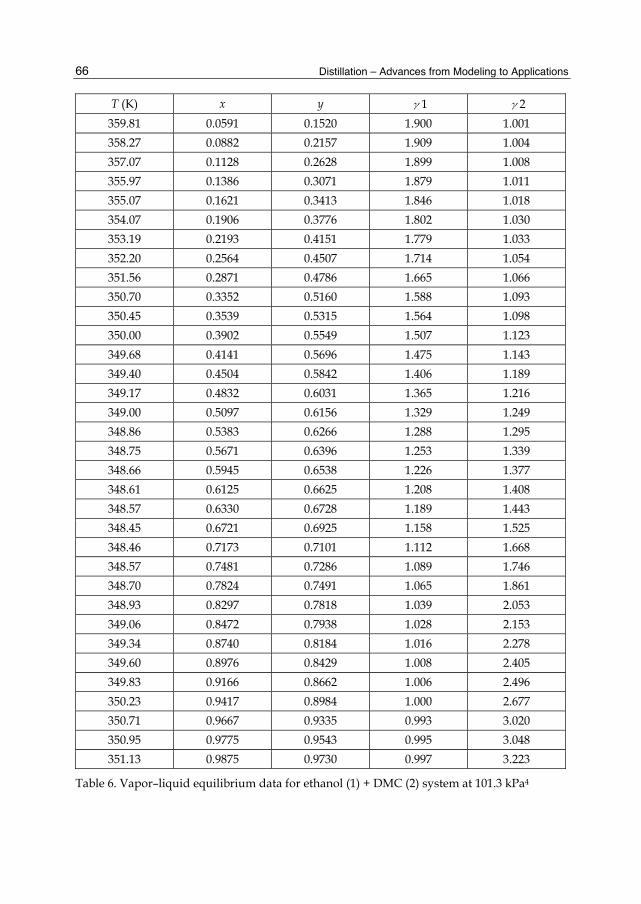
Distillation – Advances from Modeling to Applications
66
T (K) x y γ1 γ2 359.81 0.0591 0.1520 1.900 1.001 358.27 0.0882 0.2157 1.909 1.004 357.07 0.1128 0.2628 1.899 1.008 355.97 0.1386 0.3071 1.879 1.011 355.07 0.1621 0.3413 1.846 1.018 354.07 0.1906 0.3776 1.802 1.030 353.19 0.2193 0.4151 1.779 1.033 352.20 0.2564 0.4507 1.714 1.054 351.56 0.2871 0.4786 1.665 1.066 350.70 0.3352 0.5160 1.588 1.093 350.45 0.3539 0.5315 1.564 1.098 350.00 0.3902 0.5549 1.507 1.123 349.68 0.4141 0.5696 1.475 1.143 349.40 0.4504 0.5842 1.406 1.189 349.17 0.4832 0.6031 1.365 1.216 349.00 0.5097 0.6156 1.329 1.249 348.86 0.5383 0.6266 1.288 1.295 348.75 0.5671 0.6396 1.253 1.339 348.66 0.5945 0.6538 1.226 1.377 348.61 0.6125 0.6625 1.208 1.408 348.57 0.6330 0.6728 1.189 1.443 348.45 0.6721 0.6925 1.158 1.525 348.46 0.7173 0.7101 1.112 1.668 348.57 0.7481 0.7286 1.089 1.746 348.70 0.7824 0.7491 1.065 1.861 348.93 0.8297 0.7818 1.039 2.053 349.06 0.8472 0.7938 1.028 2.153 349.34 0.8740 0.8184 1.016 2.278 349.60 0.8976 0.8429 1.008 2.405 349.83 0.9166 0.8662 1.006 2.496 350.23 0.9417 0.8984 1.000 2.677 350.71 0.9667 0.9335 0.993 3.020 350.95 0.9775 0.9543 0.995 3.048 351.13 0.9875 0.9730 0.997 3.223
Table 6. Vapor–liquid equilibrium data for ethanol (1) + DMC (2) system at 101.3 kPa4
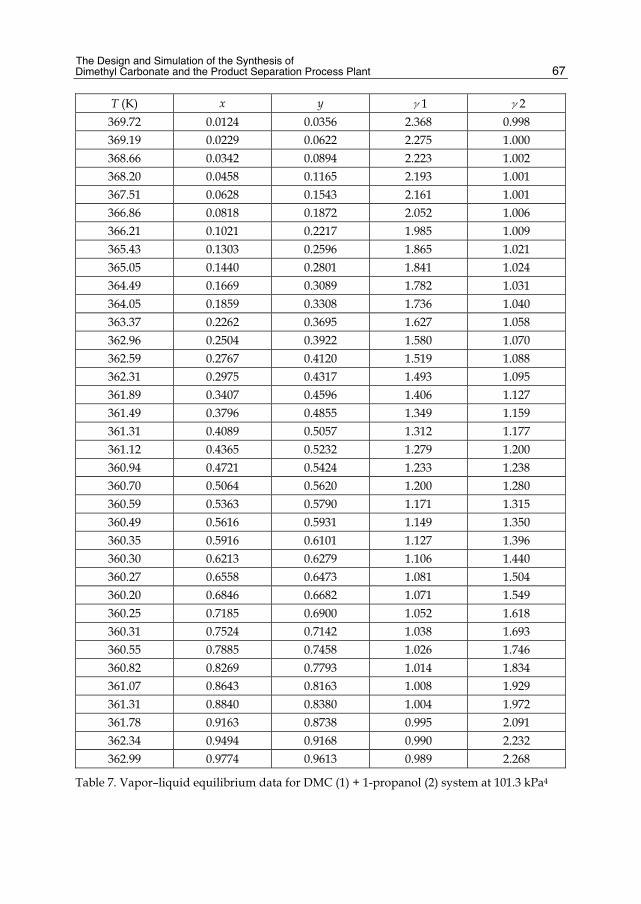
The Design and Simulation of the Synthesis of Dimethyl Carbonate and the Product Separation Process Plant
67
T (K) x y γ1 γ2 369.72 0.0124 0.0356 2.368 0.998 369.19 0.0229 0.0622 2.275 1.000 368.66 0.0342 0.0894 2.223 1.002 368.20 0.0458 0.1165 2.193 1.001 367.51 0.0628 0.1543 2.161 1.001 366.86 0.0818 0.1872 2.052 1.006 366.21 0.1021 0.2217 1.985 1.009 365.43 0.1303 0.2596 1.865 1.021 365.05 0.1440 0.2801 1.841 1.024 364.49 0.1669 0.3089 1.782 1.031 364.05 0.1859 0.3308 1.736 1.040 363.37 0.2262 0.3695 1.627 1.058 362.96 0.2504 0.3922 1.580 1.070 362.59 0.2767 0.4120 1.519 1.088 362.31 0.2975 0.4317 1.493 1.095 361.89 0.3407 0.4596 1.406 1.127 361.49 0.3796 0.4855 1.349 1.159 361.31 0.4089 0.5057 1.312 1.177 361.12 0.4365 0.5232 1.279 1.200 360.94 0.4721 0.5424 1.233 1.238 360.70 0.5064 0.5620 1.200 1.280 360.59 0.5363 0.5790 1.171 1.315 360.49 0.5616 0.5931 1.149 1.350 360.35 0.5916 0.6101 1.127 1.396 360.30 0.6213 0.6279 1.106 1.440 360.27 0.6558 0.6473 1.081 1.504 360.20 0.6846 0.6682 1.071 1.549 360.25 0.7185 0.6900 1.052 1.618 360.31 0.7524 0.7142 1.038 1.693 360.55 0.7885 0.7458 1.026 1.746 360.82 0.8269 0.7793 1.014 1.834 361.07 0.8643 0.8163 1.008 1.929 361.31 0.8840 0.8380 1.004 1.972 361.78 0.9163 0.8738 0.995 2.091 362.34 0.9494 0.9168 0.990 2.232 362.99 0.9774 0.9613 0.989 2.268
Table 7. Vapor–liquid equilibrium data for DMC (1) + 1-propanol (2) system at 101.3 kPa4

Distillation – Advances from Modeling to Applications
68
T (K) x y γ 1 γ 2 389.73 0.0120 0.0582 2.314 0.992 387.85 0.0315 0.1389 2.207 0.987 386.14 0.0490 0.1985 2.118 0.994 384.59 0.0678 0.2563 2.058 0.994 383.07 0.0862 0.3072 2.019 0.998 381.06 0.1158 0.3785 1.954 0.996 379.14 0.1454 0.4314 1.868 1.013 377.02 0.1845 0.4946 1.789 1.022 374.93 0.2287 0.5499 1.701 1.043 373.03 0.2797 0.5976 1.596 1.075 371.60 0.3265 0.6355 1.514 1.103 370.59 0.3654 0.6617 1.451 1.131 370.02 0.3897 0.6768 1.415 1.150 369.00 0.4397 0.7044 1.344 1.194 368.46 0.4694 0.7194 1.307 1.223 368.05 0.4941 0.7312 1.277 1.250 367.53 0.5268 0.7464 1.242 1.288 366.97 0.5638 0.7638 1.207 1.332 366.34 0.6087 0.7838 1.169 1.396 365.81 0.6478 0.8021 1.142 1.451 365.12 0.7029 0.8218 1.101 1.595 364.41 0.7646 0.8492 1.069 1.756 363.89 0.8175 0.8677 1.038 2.032 363.63 0.8497 0.8829 1.024 2.209 363.49 0.8911 0.9008 1.001 2.600 363.31 0.9335 0.9328 0.995 2.910 363.28 0.9678 0.9662 0.995 3.030
Table 8. Vapor–liquid equilibrium data for DMC(1) + 1-butanol (2) system at 101.3 kPa4
T (K) x y 1 2 409.75 0.0082 0.0469 1.687 1.006 408.28 0.0180 0.0970 1.642 1.009 405.75 0.0373 0.1863 1.611 1.008 403.40 0.0557 0.2587 1.581 1.013 400.41 0.0824 0.3516 1.558 1.010 397.81 0.1081 0.4229 1.520 1.013 393.86 0.1493 0.5209 1.492 1.016
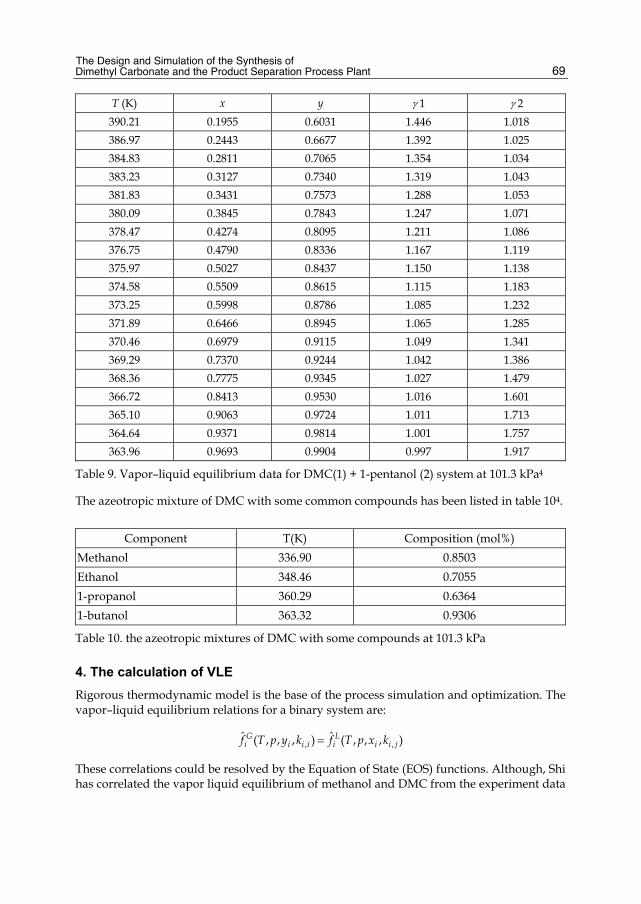
The Design and Simulation of the Synthesis of Dimethyl Carbonate and the Product Separation Process Plant
69
T (K) x y 1 2 390.21 0.1955 0.6031 1.446 1.018 386.97 0.2443 0.6677 1.392 1.025 384.83 0.2811 0.7065 1.354 1.034 383.23 0.3127 0.7340 1.319 1.043 381.83 0.3431 0.7573 1.288 1.053 380.09 0.3845 0.7843 1.247 1.071 378.47 0.4274 0.8095 1.211 1.086 376.75 0.4790 0.8336 1.167 1.119 375.97 0.5027 0.8437 1.150 1.138 374.58 0.5509 0.8615 1.115 1.183 373.25 0.5998 0.8786 1.085 1.232 371.89 0.6466 0.8945 1.065 1.285 370.46 0.6979 0.9115 1.049 1.341 369.29 0.7370 0.9244 1.042 1.386 368.36 0.7775 0.9345 1.027 1.479 366.72 0.8413 0.9530 1.016 1.601 365.10 0.9063 0.9724 1.011 1.713 364.64 0.9371 0.9814 1.001 1.757 363.96 0.9693 0.9904 0.997 1.917
Table 9. Vapor–liquid equilibrium data for DMC(1) + 1-pentanol (2) system at 101.3 kPa4
The azeotropic mixture of DMC with some common compounds has been listed in table 104.
Component T(K) Composition (mol%) Methanol 336.90 0.8503 Ethanol 348.46 0.7055 1-propanol 360.29 0.6364 1-butanol 363.32 0.9306
Table 10. the azeotropic mixtures of DMC with some compounds at 101.3 kPa
4. The calculation of VLE Rigorous thermodynamic model is the base of the process simulation and optimization. The vapor–liquid equilibrium relations for a binary system are:
, ,ˆ ˆ( , , , ) ( , , , )G Li i i i i i i jf T p y k f T p x k
These correlations could be resolved by the Equation of State (EOS) functions. Although, Shi has correlated the vapor liquid equilibrium of methanol and DMC from the experiment data
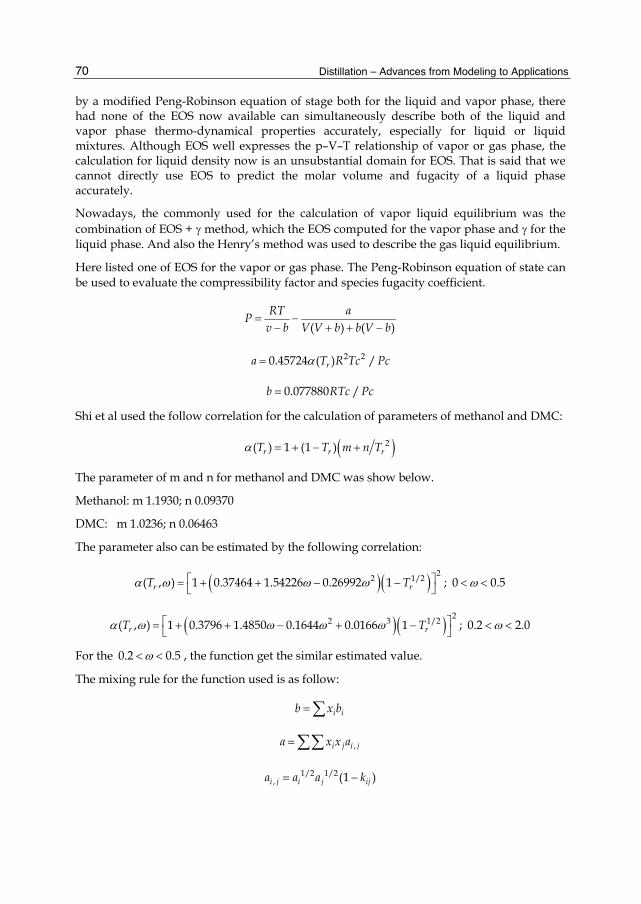
Distillation – Advances from Modeling to Applications
70
by a modified Peng-Robinson equation of stage both for the liquid and vapor phase, there had none of the EOS now available can simultaneously describe both of the liquid and vapor phase thermo-dynamical properties accurately, especially for liquid or liquid mixtures. Although EOS well expresses the p–V–T relationship of vapor or gas phase, the calculation for liquid density now is an unsubstantial domain for EOS. That is said that we cannot directly use EOS to predict the molar volume and fugacity of a liquid phase accurately.
Nowadays, the commonly used for the calculation of vapor liquid equilibrium was the combination of EOS + method, which the EOS computed for the vapor phase and for the liquid phase. And also the Henry’s method was used to describe the gas liquid equilibrium.
Here listed one of EOS for the vapor or gas phase. The Peng-Robinson equation of state can be used to evaluate the compressibility factor and species fugacity coefficient.
( ) ( )RT a
Pv b V V b b V b
2 20.45724 ( ) /ra T R Tc Pc
0.077880 /b RTc Pc
Shi et al used the follow correlation for the calculation of parameters of methanol and DMC:
2( ) 1 (1 )r r rT T m n T
The parameter of m and n for methanol and DMC was show below.
Methanol: m 1.1930; n 0.09370
DMC: m 1.0236; n 0.06463
The parameter also can be estimated by the following correlation:
22 1/2( , ) 1 0.37464 1.54226 0.26992 1r rT T ; 0 0.5
22 3 1/2( , ) 1 0.3796 1.4850 0.1644 0.0166 1r rT T ; 0.2 2.0
For the 0.2 0.5 , the function get the similar estimated value.
The mixing rule for the function used is as follow:
i ib x b
,i j i ja x x a
1/2 1/2, (1 )i j i j ija a a k

The Design and Simulation of the Synthesis of Dimethyl Carbonate and the Product Separation Process Plant
71
The Peng-Robinson equation of state may be written in compressibility factor form:
3 2 2 2 3(1 ) ( 2 3 ) ( ) 0Z B Z A B B Z AB B B
2A ap RT , B bp RT
Gi is expressed as follow:
ln 1 ln( )Gi i i i i iZ Z q I
where Zi is the compressibility factor and obtained from Eq. (4);
/r rP T ; ( ) /r r rq T P T ; 1 ln ZI
Z
EoS ( )rT
PR ( , )arT 1 2 1 2
a 22 1/2( , ) 1 0.37464 1.54226 0.26992 1r rT T
Table 11. Parameter assignments for PR EoS5.
Substance Tc/K pc/MPa ω
CO 132.85 3.494 0.045
O2 154.58 5.043 0.022
CO2 304.12 7.374 0.225
Table 12. Critical constants and acentric factors5
1. the method for the liquid activity coefficient
a. the Wilson method
ii
ln 1 ln ( / )
: 1
i j ij j ji l jlj j l
x x x
where
( )exp( )Lj ij ii
ij Li
V
RTV
Where V represents the liquid molar volume of pure component; ij ij represents the energy parameter.
The Wilson model is not supported for the prediction of the liquid-liquid equilibria.

Distillation – Advances from Modeling to Applications
72
b. the NRTL method
The non-random two-liquid model (NRTL equation) is an activity coefficient model that correlates the activity coefficients γi of a compound i with its mole fractions xi in the liquid phase concerned. The concept of NRTL is based on the hypothesis of Wilson that the local concentration around a molecule is different from the bulk concentration. This difference is due to a difference between the interaction energy of the central molecule with the molecules of its own kind Uii and that with the molecules of the other kind Uij. The energy difference also introduces a non-randomness at the local molecular level.
The general equation is:
1 1
1
1 1 1
ln( )
n n
j ji ji m mi minj j ij m
i ijn n nj
k ki k kj k kjk k k
x G x Gx G
x G x G x G
with
exp( )ij ij ijG
0 1ij ij ij T
2 ln( ) ijFij ijij ij ij ij
B CA D T E T
T T
c. the UNIFAC method
The UNIversal Functional Activity Coefficient (UNIFAC) method is a semi-empirical system for the prediction of non-electrolyte activity estimation in non-ideal mixtures, which was first published in 1975 by Fredenslund, Jones and Prausnitz. UNIFAC uses the functional groups present on the molecules that make up the liquid mixture to calculate activity coefficients. By utilizing interactions for each of the functional groups present on the molecules, as well as some binary interaction coefficients, the activity of each of the solutions can be calculated.
In the UNIFAC model the activity coefficients of component i of a mixture are described by a combinatorial and a residual contribution.
ln ln lnC Ri i i
Combinatorial part
1ln ln 1 ln 12
C i i i ii i
i i i i
J JZq
x x

The Design and Simulation of the Synthesis of Dimethyl Carbonate and the Product Separation Process Plant
73
where 2/3 2/3/i i i j jJ x r x r ; /i i i j jx r x r ; /i i i j jx q x q and Z = 10.
The coordination number, z, i.e. the number of close interacting molecules around a central molecule, is frequently set to 10. It can be regarded as an average value that lies between cubic (z=6) and hexagonal packing (z=12) of molecules that are simplified by spheres.
Where ri is the volume parameters of component i, computed by ( )ii j jr v R .
Where the ( )ijv is the number of groups of type k in component i, and Rj is the
volume parameter for group k; qi is the area parameter for component i, calculated as ( )i
i j jq v Q .
Residual part
( ) ( )ln ln lni iRi kk k
k
v
k is the group activity coefficient of group k in the mixture and (i) k is the group activity coefficient of group k in the pure substance.
ln 1 ln m mkk k m mk
n nkm mn
Q
m mm
n n
Q XQ X
; ( )
( )
jm jj
m jn jj n
v xX
v x
Xm represents the fraction of group m in the mixture.
exp nm mmnm
u u
T
Where the energy parameter of uij characterize the interaction between group i and j, and estimated from experiment data.
Alternatively, in some process simulation software τij can be expressed as follows:
2 2ln / ln /ij ij ij ij ij ijA B T C T D T E T
The "C", "D", and "E" coefficients are primarily used in fitting liquid–liquid equilibria (with "D" and "E" rarely used at that). The "C" coefficient is useful in vapor-liquid equilibria as well.
For the system mixture of DMC-Phenol and Phenol-Methanol
Wang6 measured the DMC-Phenol and Phenol-Methanol mixture system and predicted the VLE by the Wilson, NRTL, UNIQUAC equations with considering the ideal vapor behavior. The Wilson, NRTL, UNIQUAC equations energy

Distillation – Advances from Modeling to Applications
74
parameters can be obtained using the following expressions where aij , bij are the binary parameters regressed.
Wilson: exp( / )ij ij ija b T
NRTL: /ij ij ija b T
UNIQUAC: exp( / )ij ij ija b T
The regressed parameter from the experiment obtained by Wang listed in table 13.
equation parameters Phenol(1)-DMC(2) Phenol(1)-methanol(2)
Wilson a12; b12 -3.215767; 1465.520 -4632.789; 9.657878 a21; b21 1.213508; -423.7649 1777.066; -3.209978
NRTL a12; b12 -0.9630158; 386.8243 1712.322; -5.054467 a21; b21 3.061205; -1467.521 -3715.243; 9.690805
0.300 0.300
UNIQUAC a12; b12 0.7670656; -273.3901 -7802.509; -85.39368 a21; b21 -1.505834; 691.9294 289.7973; 0.2346874
Table 13. Binary parameters of Wilson, NRTL and UNIQUAC equations
2. Calculating the fugacity of gas in liquid by Henry’s method
For estimating the fugacity of component i in the liquid (L) phase, Eq. (6) was proposed by Sander et al.
1 , ,ˆ L
i i r i i rf x H
where the subscript i and r represent a gas and a reference solvent, respectively. Hi,r is Henry’s constant for gas i in a reference solvent. γi is called the activity coefficient in the unsymmetric convention. γ∞
i,r is the activity coefficient at infinite dilution in the symmetric convention.
The reference Henry’s constant Hi,r is calculated as a function of temperature from the following expression,
,ln / ln 101325i rB
H Pa A C TT
Wang et. al.5 has studied the gas liquid equilibrium of CO, O2 and CO2 with DMC by the Henry method with the UNIFAC model for liquid system. Table 14 and 15 presents the chosen reference solvents for studied gases (CO, O2 and CO2) in the Wang’s work and the estimated parameters A, B and C for calculating the reference Henry’s constant. The activity coefficients i is obtained from the modified UNIFAC model. The UNIFAC energy parameter that was obtained by Wang has listed in Table 16. And also the parameter data can be obtained in Wang’s article.

The Design and Simulation of the Synthesis of Dimethyl Carbonate and the Product Separation Process Plant
75
Gas A B C Reference solvent CO 7.53116 -6.36893 0.0 Propanol O2 26.1577 -924.307 -2.73771 Ethanol
CO2 27.5146 -1846.89 -2.99332 Hexadecane
Table 14. Constants for calculation of reference Henry’s constant according to Henry constant equation.
Group Rk Qk CO 2.094 2.120 O2 1.764 1.910
CO2 2.592 2.522 CH3 1.8022 1.696 CH2 1.3488 1.080 OH 1.060 1.168
–OCOO– 3.1642a 2.7874b a R–OCOO– = 2[Van der Waal’s volume from Bondi [20]]/15.17cm3 mol-1. b Q–OCOO– = 2[Van der Waal’s area from Bondi [20]]/(2.5×109) cm2 mol-1.
Table 15. The group parameters Rk and Qk values for GLE calculation.
Energy parameters, unm(K) CO O2 CO2 –CH3
–OCOO– −364.4 −328.5 −4.4 −786.5
Table 16. The new UNIFAC interaction-energy parameters obtained by Wang
5. Model for catalytic distillation for the synthesis of DMC by urea and methanol The current routes for the DMC synthesis are the oxy-carbonylation of methanol (EniChem process and UBE process) and the trans-esterification method (Texaco process). Recently, an attractive route for the synthesis of DMC by a urea methanolysis method over solid bases catalyst has been carried out in a catalytic distillation
The catalytic distillation (CD) 7, which is also known as reactive distillation (RD) that combines the heterogeneous catalyzed chemical reaction and the distillation in a single unit, has attracted more interest in academia and become more important in the chemical processing industry as it has been successfully used in several important industrial processes. The CD provides some advantages such as high conversion in excess of the chemical equilibrium, energy saving, overcoming of the azeotropic limitations and prolonging the catalyst lifetime.8 The number of the contributions both for the simulative and experimental investigations about catalytic distillation are greatly increasing in recent years, especially for the modeling and simulation studies. And the applications of the
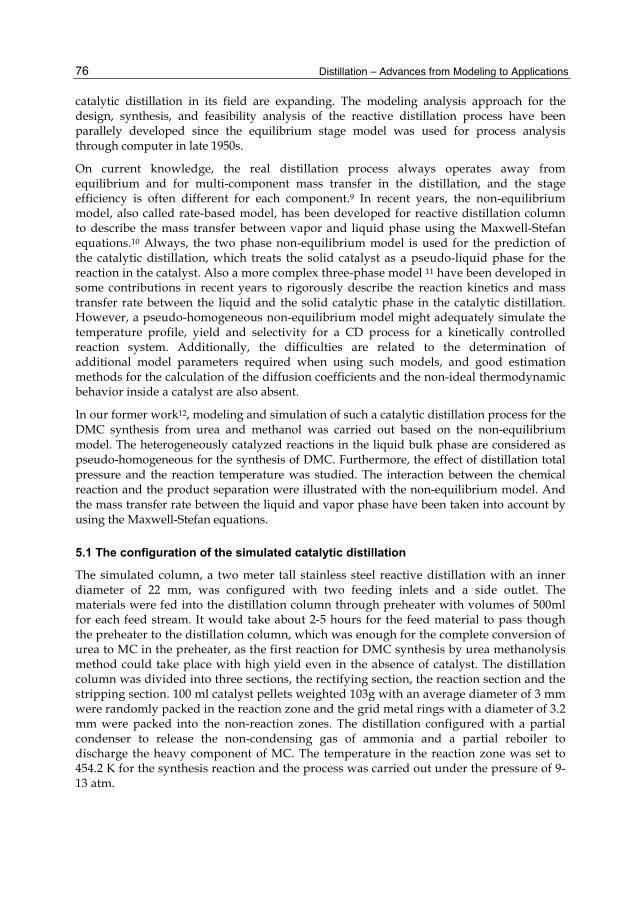
Distillation – Advances from Modeling to Applications
76
catalytic distillation in its field are expanding. The modeling analysis approach for the design, synthesis, and feasibility analysis of the reactive distillation process have been parallely developed since the equilibrium stage model was used for process analysis through computer in late 1950s.
On current knowledge, the real distillation process always operates away from equilibrium and for multi-component mass transfer in the distillation, and the stage efficiency is often different for each component.9 In recent years, the non-equilibrium model, also called rate-based model, has been developed for reactive distillation column to describe the mass transfer between vapor and liquid phase using the Maxwell-Stefan equations.10 Always, the two phase non-equilibrium model is used for the prediction of the catalytic distillation, which treats the solid catalyst as a pseudo-liquid phase for the reaction in the catalyst. Also a more complex three-phase model 11 have been developed in some contributions in recent years to rigorously describe the reaction kinetics and mass transfer rate between the liquid and the solid catalytic phase in the catalytic distillation. However, a pseudo-homogeneous non-equilibrium model might adequately simulate the temperature profile, yield and selectivity for a CD process for a kinetically controlled reaction system. Additionally, the difficulties are related to the determination of additional model parameters required when using such models, and good estimation methods for the calculation of the diffusion coefficients and the non-ideal thermodynamic behavior inside a catalyst are also absent.
In our former work12, modeling and simulation of such a catalytic distillation process for the DMC synthesis from urea and methanol was carried out based on the non-equilibrium model. The heterogeneously catalyzed reactions in the liquid bulk phase are considered as pseudo-homogeneous for the synthesis of DMC. Furthermore, the effect of distillation total pressure and the reaction temperature was studied. The interaction between the chemical reaction and the product separation were illustrated with the non-equilibrium model. And the mass transfer rate between the liquid and vapor phase have been taken into account by using the Maxwell-Stefan equations.
5.1 The configuration of the simulated catalytic distillation
The simulated column, a two meter tall stainless steel reactive distillation with an inner diameter of 22 mm, was configured with two feeding inlets and a side outlet. The materials were fed into the distillation column through preheater with volumes of 500ml for each feed stream. It would take about 2-5 hours for the feed material to pass though the preheater to the distillation column, which was enough for the complete conversion of urea to MC in the preheater, as the first reaction for DMC synthesis by urea methanolysis method could take place with high yield even in the absence of catalyst. The distillation column was divided into three sections, the rectifying section, the reaction section and the stripping section. 100 ml catalyst pellets weighted 103g with an average diameter of 3 mm were randomly packed in the reaction zone and the grid metal rings with a diameter of 3.2 mm were packed into the non-reaction zones. The distillation configured with a partial condenser to release the non-condensing gas of ammonia and a partial reboiler to discharge the heavy component of MC. The temperature in the reaction zone was set to 454.2 K for the synthesis reaction and the process was carried out under the pressure of 9-13 atm.
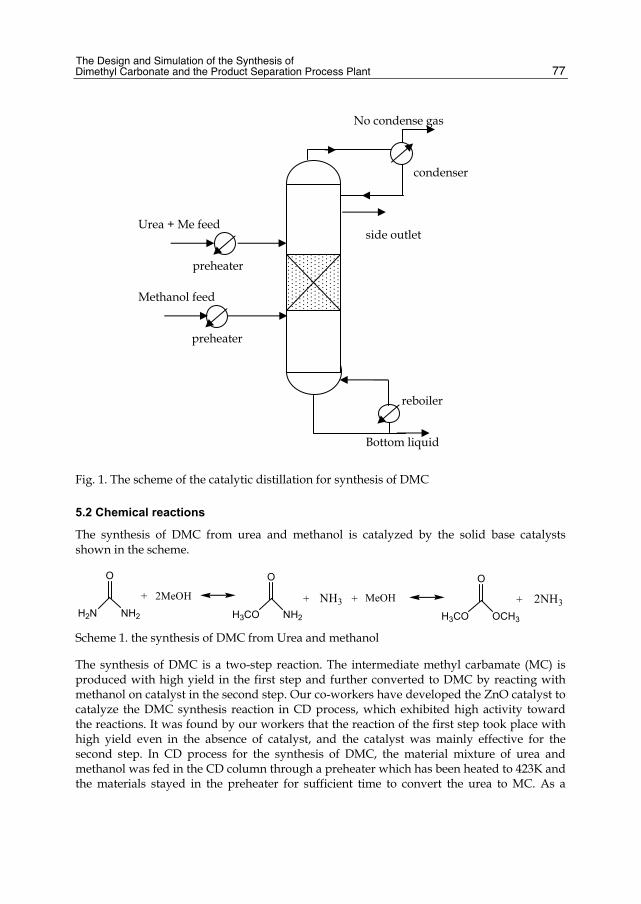
The Design and Simulation of the Synthesis of Dimethyl Carbonate and the Product Separation Process Plant
77
Fig. 1. The scheme of the catalytic distillation for synthesis of DMC
5.2 Chemical reactions
The synthesis of DMC from urea and methanol is catalyzed by the solid base catalysts shown in the scheme.
O
H2N NH2
O
H3CO NH2
O
H3CO OCH3
2MeOH+ + +NH3 + 2NH3MeOH
Scheme 1. the synthesis of DMC from Urea and methanol
The synthesis of DMC is a two-step reaction. The intermediate methyl carbamate (MC) is produced with high yield in the first step and further converted to DMC by reacting with methanol on catalyst in the second step. Our co-workers have developed the ZnO catalyst to catalyze the DMC synthesis reaction in CD process, which exhibited high activity toward the reactions. It was found by our workers that the reaction of the first step took place with high yield even in the absence of catalyst, and the catalyst was mainly effective for the second step. In CD process for the synthesis of DMC, the material mixture of urea and methanol was fed in the CD column through a preheater which has been heated to 423K and the materials stayed in the preheater for sufficient time to convert the urea to MC. As a
Urea + Me feed
Methanol feed
condenser
reboiler
side outlet
preheater
preheater
No condense gas
Bottom liquid

Distillation – Advances from Modeling to Applications
78
result, only second step of DMC synthesis reaction, where MC converting to DMC, took place in the catalytic distillation column (shown as follow).
MC + MeOH DMC + NH3 (1) The macro-kinetic model for the forward and reverse reactions by Arrhenius equations are represented as follows:
3
1 21 2exp( ) exp( )MC Me DMC NH
g g
Ea EaR k C C k C C
R T R T (2)
Where represents the amount of catalyst presented in the column section. k1 and k2 represent the Arrhenius frequency factors, and Ea1 and Ea2 are activation energy for the forward and reverse reactions, respectively. The values of Arrhenius parameters for the synthesis of DMC by urea and methanol over the solid base catalyst are listed in Table 17.
k1 (g-1mol-1Ls-1) k2 (g-1mol-1Ls-1) Ea1 (J/mol) Ea2 (J/mol) 1.104E3 1.464E-3 1.01E5 4.90E4
Table 17. Arrhenius parameters for DMC synthesis catalyzed by solid base catalyst
The system of DMC synthesis process in a CD column mainly involved four components: methanol, DMC, MC and ammonia, as the first step reaction was omitted in the distillation column. The boiling points of the pure components at atmospheric pressure was ranged as follows: methanol (Me) 337.66 K; DMC 363.45 K; MC 450.2 K; ammonia (NH3) 239.72 K, respectively. It could be seen that MC should almost exist in the liquid phase in CD process under high pressure and the reactions would take place in the liquid phase in a CD reaction zone. The system included a binary azeotrope of Me-DMC and the predicted data have been shown in Table 2, with respective boiling points at different pressures. Since the system included a no condenser component of ammonia and a binary azeotropic pair of methanol-DMC, it shows the strong non-ideal properties and the vapor liquid equilibrium was calculated by the EOS + activity method.
5.3 The non-equilibrium model
The non-equilibrium model is schematically shown in Fig.2. This NEQ stage represents a section of packing in a packed column. The heterogeneously catalyzed synthesis of DMC in CD process is treated as pseudo homogenous. Mass transfers at the vapor-liquid interface are usually described via the well-known two-film model. A rigorous model for catalytic distillation processes have been presented by Hegler, Taylor and Krishna. In the present contribution the two-phase non equilibrium model have been developed to investigate the steady state of the DMC synthesis process in catalytic distillation.
The follow assumptions have been made for the non-equilibrium model: (1) the process reached steady state; (2) the first reaction has been omitted as it took place with high yield in the preheater; (3) the reactions occurred entirely in the liquid bulk; (4) the reactions have been considered as pseudo-homogeneous; (5) the pressure in the CD column has been treated as constant.

The Design and Simulation of the Synthesis of Dimethyl Carbonate and the Product Separation Process Plant
79
The model equations composed of material balance, energy balance, mass transfer, energy transfer, phase equilibria, pressure drop equations and summation equations, which had been showed under the follows:
The material balances both for vapor and liquid phase are defined as:
1 , 1 , , ,(1 ) 0V V V Vj i j j j i j j i j i jV y S V y F z N (3)
1 , 1 , , , ,(1 ) 0L L L L Lj i j j j i j j i j i j i jL x S L x F z N R (4)
The multi-component mass transfer rates are described by the generalized Maxwell-Stefan equations. The mass transfer equations for liquid phase are described as follow:
1
L Lcj i i ji
T i L Lg j t ij
j i
x N x NxR T C k a
(5)
where i represent the chemical potential, Lijk is liquid mass transfer coefficient. Only
1c of these equations are independent. The vapor phase mass transfer has a similar relation to the liquid phase.
The energy balances for both vapor and liquid phase are defined as:
1 1 (1 ) 0V V V V VF V Vj j j j j j j j jV H S V H F H e Q (6)
1 1 (1 ) 0L L L L LF L LR Lj j j j j j j j j jL H S L H F H e H Q (7)
where the vapor and liquid energy transfer rate is considered as equal. The vapor heat transfer rate is defined as:
1
V CV V V V
ii
Te h a N H
(8)
The Vapor-liquid equilibrium occurs at the vapor-liquid interface:
, , , 0I I Ii j i j i jy K x (9)
where the superscript I denotes the equilibrium compositions at the vapor-liquid interface and ,
Ii jK represents the vapor liquid equilibrium ratio for component i on stage j. And the
equilibrium constant is computed by:
0 0
I i i ii
i
P fK
Pf
(10)
The Wilson equations for the liquid phase have been selected to calculate the liquid activity coefficient.
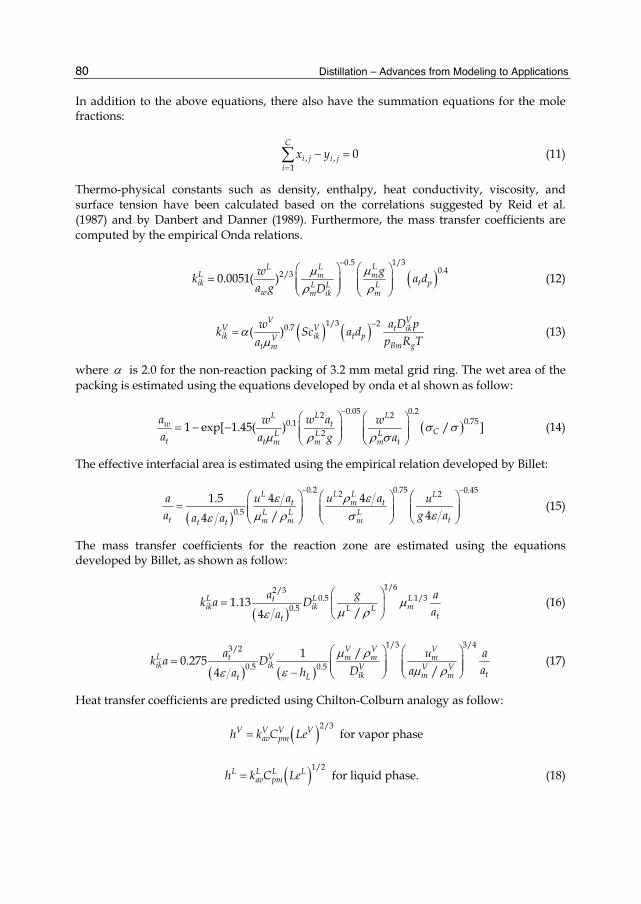
Distillation – Advances from Modeling to Applications
80
In addition to the above equations, there also have the summation equations for the mole fractions:
, ,1
0C
i j i ji
x y
(11)
Thermo-physical constants such as density, enthalpy, heat conductivity, viscosity, and surface tension have been calculated based on the correlations suggested by Reid et al. (1987) and by Danbert and Danner (1989). Furthermore, the mass transfer coefficients are computed by the empirical Onda relations.
1/30.5
0.42/30.0051( )LLL
L mmik t pL L L
w m ik m
gwk a d
a g D
(12)
1/3 20.7( )VV
V V t ikik ik t pV
Bm gt m
a D pwk Sc a d
p R Ta
(13)
where is 2.0 for the non-reaction packing of 3.2 mm metal grid ring. The wet area of the packing is estimated using the equations developed by onda et al shown as follow:
0.05 0.22 2
0.750.121 exp[ 1.45( ) / ]
LL Lw t
CL L Lt t m m m t
a w aw wa a g a
(14)
The effective interfacial area is estimated using the empirical relation developed by Billet:
0.2 0.75 0.452 2
0.54 41.5
4/4
L L L Lt m t
L L Lt tm m mt t
u a u aa ua g aa a
(15)
The mass transfer coefficients for the reaction zone are estimated using the equations developed by Billet, as shown as follow:
1/62/30.5 1/3
0.51.13/4
L L Ltik ik mL L
tt
ga ak a D
aa
(16)
1/3 3/43/2
0.5 0.5/10.275
/4
V V VL Vt m m mik ik V V V
tik m mLt
a u ak a D
aD aha
(17)
Heat transfer coefficients are predicted using Chilton-Colburn analogy as follow:
2/3V V V Vav pmh k C Le for vapor phase
1/2L L L Lav pmh k C Le for liquid phase. (18)

The Design and Simulation of the Synthesis of Dimethyl Carbonate and the Product Separation Process Plant
81
5.4 The treatment of the reaction for the synthesis of DMC
Commonly, the reaction rates are determined by the concentration of the component, not the volume of the component. And this factor could cause a negative composition of a component during the iteration for the solving of a catalytic distillation model. Consequently, the reaction of a system can be considered as the combination of the positive reactions and the negative reactions.
, , , , , , ,1
nrLi j i j i j j i m m j j i m m j
m
R R R v r v r
(19)
Defined the consumptive coefficient as:
, , ,Ri j i j i jE R x (20)
For the condition of xi equal zero, the consumptive coefficient is set to zero.
5.5 The method of Maxwell-Stefan equations
For the multi-component mass transfer in the catalytic distillation can be considered as the one dimensional mass transfer behavior13. And the vapor liquid equilibria is achieved at the vapor liquid interface. It can be noticed that there are no accumulation on the vapor liquid interface and the mass transfer of vapor and liquid are equal to each other.
Fig. 2. The multi-components mass transfer
According to the two-film theory, the Maxwell-Stefan equations for vapor and liquid phase are shown as:
1 1
c nj i i j j i i ji
T it ij t ijj j
j i j i
x N x N x J x JxRT C k C k
(21)
1 1
c nj i i j j i i ji
T it ij t ijj j
j i j i
y N y N y J y JyRT C k C k
(22)
y
xT
TVapor phase
Liquid phase N
E
LV

Distillation – Advances from Modeling to Applications
82
For the liquid mass transfer equations, it could be rearranged by n-1 matrix as:
L L L Lt t
xN C k x N
(23)
Where:
1Lk R
1
ni k
iiin ikk
k i
x xR
k k
,1 1
ij iij in
R xk k
(24)
represent the matrix of Thermal factor for multi-component. The elements of the thermal factor matrix are the partial molar difference of activity coefficient of the component mixture, which could be computed as follow:
1
ln
j
iij ij i
j x
xx
(25)
, 1,2,3, , 1i j n
Note: This solution of partial molar difference of activity coefficient was restricted by the summation equation. This should be especially noted.
For the liquid mass transfer equation, it could be written as:
L L Lt
xJ C k
(26)
The mass transfer rates were consistent along the film distance, and the differential equation could be written as:
dxx
d
(27)
1
ni k
ii L Lkt in t ikk i
N NC k C k
,1 1
ij i L Lt ij t in
NC k C k
, 1,2,3, , 1i j n
There were two boundary conditions as follow.
0,( ), ( ) ( )bbulk y y
1,( ), ( ) ( )Ifilm y y (28)
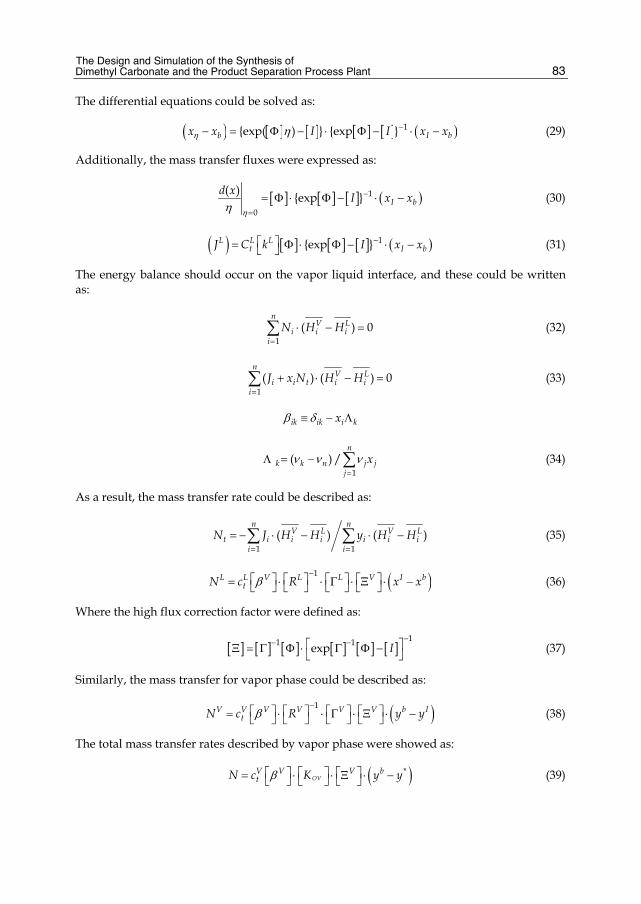
The Design and Simulation of the Synthesis of Dimethyl Carbonate and the Product Separation Process Plant
83
The differential equations could be solved as:
1{exp( ) } {exp }b I bx x I I x x (29)
Additionally, the mass transfer fluxes were expressed as:
1
0
( ) {exp } I bd x
I x x
(30)
1{exp }L L Lt I bJ C k I x x (31)
The energy balance should occur on the vapor liquid interface, and these could be written as:
1
( ) 0n
V Li i i
i
N H H
(32)
1( ) ( ) 0
nV L
i i t i ii
J x N H H
(33)
ik ik i kx
1
( ) /n
k k n j jj
x
(34)
As a result, the mass transfer rate could be described as:
1 1
( ) ( )n n
V L V Lt i i i i i i
i i
N J H H y H H
(35)
1L L V L L V I btN c R x x
(36)
Where the high flux correction factor were defined as:
11 1exp I
(37)
Similarly, the mass transfer for vapor phase could be described as:
1V V V V V V b ItN c R y y
(38)
The total mass transfer rates described by vapor phase were showed as:
*OV
V V V btN c K y y (39)

Distillation – Advances from Modeling to Applications
84
The solving for these mass transfer equations involved an iterative method and the more mathematic knowledge were needed for the calculation of high flux correction factor, which exponent calculations for a matrix were involved. The computational codes have been developed by the author. Otherwise, these equations were more complicated for the mass transfer in a catalytic distillation system.
Power et al. (1988) found that the high flux correction factor, which is for the calculation of multi-component mass transfer, is not important in distillation and it has been ignored in the calculation for distillation system. In the non-equilibrium stage model of Krishnamurthy and Taylor (1993), the total mass transfer rates are obtained by combining the liquid and vapor mass transfer equations, which the high flux correction factor has been ignored, and multiplying by the interfacial area available for mass transfer. As a result, the total mass transfer rates for the vapor phase described as matrix form are: 14
,L V V V OVj j t j j j j j jN N C K a y y (40)
1 1 1 1,
,
Vt jOV V E L L V
j j j j j jLt j
CK K K K
C
(41)
1V Vj jK
, ,,
1, ,
Ci j l jV
ii j V VliC j il jl i
y y
k k
, , ,, ,
1 1Vik j i j V V
ik j iC j
yk k
(42)
Where i ,k=1, 2, …, c-1.
, , ,,, ,1
cVap Vap VapV
ik j ik i j l jn jk j l jl
y H H y H
, (43)
The similar correlation can be described for liquid phase. Where is the unit matrix.
5.6 Solving of the non-equilibrium model
By combining the above mentioned equations, the vapor component can be determined by the liquid bulk composition, which described by the matrix form as: 15
1, 1 1 ,(1 )V V OV V V V V V OV
j t j j j j j j j j j j t j j j j jY c K a S V V Y F z c K a Y
(44)
Defined the single stage vaporizing coefficient:
*, , , , , ,
V Ei j i j i j i j i j i jE y y y K x (45)
For , 0i jx , , 1Vi jE .

The Design and Simulation of the Synthesis of Dimethyl Carbonate and the Product Separation Process Plant
85
And then we can get a modified tri-diagonal matrix method for solving the non-equilibrium stage model of the catalytic distillation.
1 1 1 1
2 2 2 2 2
, , ,
, ,
i i i i
i i i i i
i j i j i j ij ij
i n i n in in
B C x bA B C x b
A B C x b
A B x b
(46)
, 1
, , , , ,
, 1 , 1 , 1
, , , ,
(1 ) (1 )i j j
V E V L Ri j j j i j i j j j i j i j
E Vi j j i j i j
V V L Li j j i j j i j i j
A L
B S V K E S L x E
C V K E
b F z F z R
5.7 The model results
The typical modeling data for the catalytic distillation of DMC synthesis process from urea and methanol over solid base catalyst, which was operated under the pressure of 9 atm. 16-17
Parameter Measured Estimated Temperature of top (oC) 91.0 94.8 Temperature of reboiler (oC ) 165.3 169.1 T in reaction zone (oC) 180 181.1 Material feed (mL/h) 20 20 Methanol feed (mL/h) 60 60 Yield of DMC (%) 45 45 Reflux ratio 4 4 Condenser, mass fraction
Me 0.768 0.782 DMC 0.052 0.053 MC 0 0 Ammonia 0.18 0.165
Rebloiler, mass fraction Me 0.260 0.271 DMC 0 0 MC 0.740 0.729 Ammonia 0 0

Distillation – Advances from Modeling to Applications
86
Parameter Measured Estimated Product, mass fraction
Me 0.927 0.927 DMC 0.070 0.070 MC 0 0 Ammonia 0.003 0.003
Table 18. Typical results from experiment and predictions for the synthesis of DMC
0 10 20 30 400.0
0.1
0.2
0.3
0.4
0.5
0.6
0.7
0.8
0.9
1.0
Me DMC MC NH3
Vap
or m
ass f
ract
ion
Stage number Fig. 3. Vapor concentration distribution in distillation column.
0 10 20 30 400.0
0.1
0.2
0.3
0.4
0.5
0.6
0.7
0.8
0.9
1.0
0.00
0.05
0.10
0.15
0.20
0.25
0.30
0.35
0.40
Me MC
Liqu
id m
ass f
ract
ion
of M
e an
d M
C
Stage number
DMC NH3
Liq
uid
mas
s fra
ctio
nof
DM
C a
nd N
H3
Fig. 4. Liquid concentration distribution in distillation column
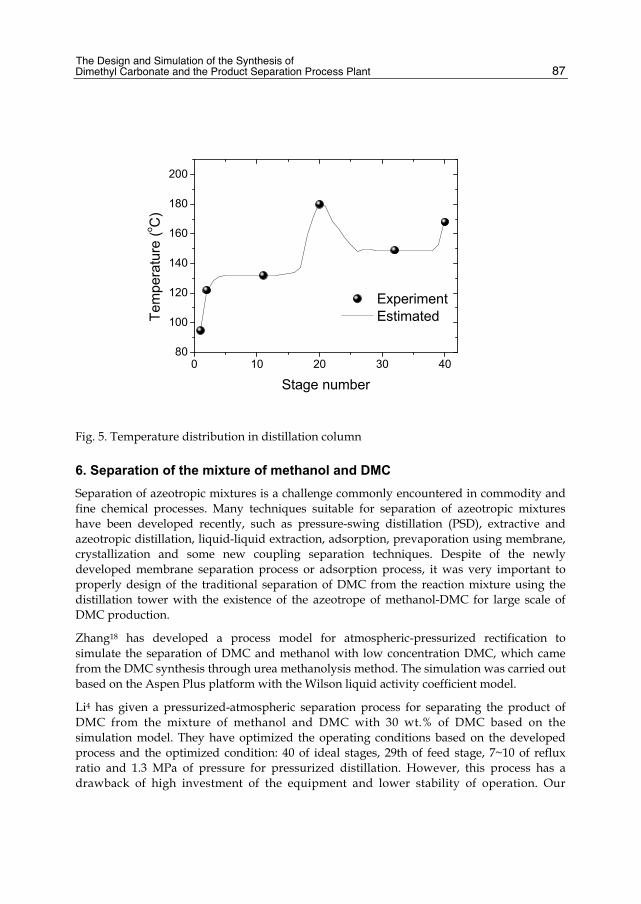
The Design and Simulation of the Synthesis of Dimethyl Carbonate and the Product Separation Process Plant
87
0 10 20 30 4080
100
120
140
160
180
200
Experiment Estimated
Te
mpe
ratu
re (o C
)
Stage number
Fig. 5. Temperature distribution in distillation column
6. Separation of the mixture of methanol and DMC Separation of azeotropic mixtures is a challenge commonly encountered in commodity and fine chemical processes. Many techniques suitable for separation of azeotropic mixtures have been developed recently, such as pressure-swing distillation (PSD), extractive and azeotropic distillation, liquid-liquid extraction, adsorption, prevaporation using membrane, crystallization and some new coupling separation techniques. Despite of the newly developed membrane separation process or adsorption process, it was very important to properly design of the traditional separation of DMC from the reaction mixture using the distillation tower with the existence of the azeotrope of methanol-DMC for large scale of DMC production.
Zhang18 has developed a process model for atmospheric-pressurized rectification to simulate the separation of DMC and methanol with low concentration DMC, which came from the DMC synthesis through urea methanolysis method. The simulation was carried out based on the Aspen Plus platform with the Wilson liquid activity coefficient model.
Li4 has given a pressurized-atmospheric separation process for separating the product of DMC from the mixture of methanol and DMC with 30 wt.% of DMC based on the simulation model. They have optimized the operating conditions based on the developed process and the optimized condition: 40 of ideal stages, 29th of feed stage, 7~10 of reflux ratio and 1.3 MPa of pressure for pressurized distillation. However, this process has a drawback of high investment of the equipment and lower stability of operation. Our
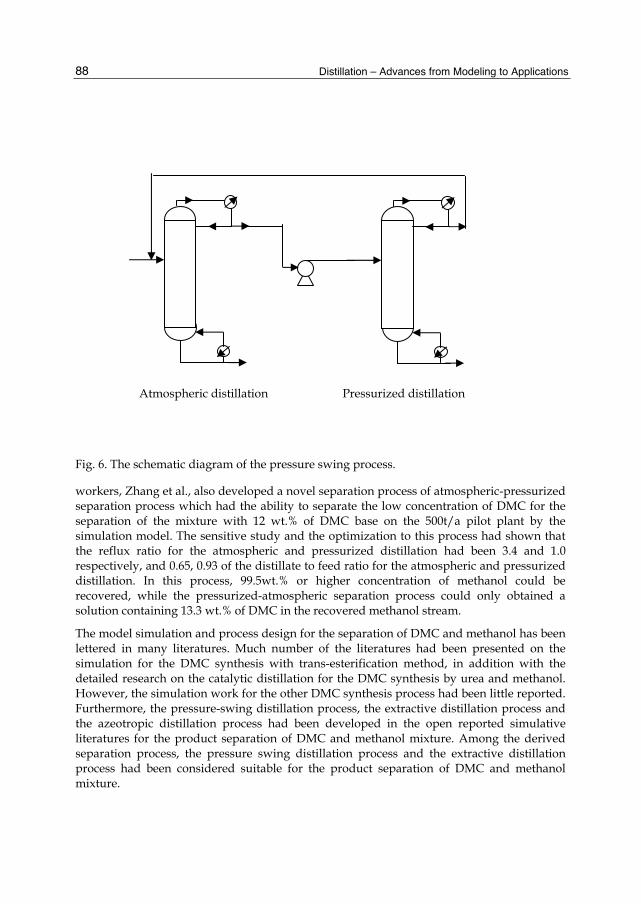
Distillation – Advances from Modeling to Applications
88
Fig. 6. The schematic diagram of the pressure swing process.
workers, Zhang et al., also developed a novel separation process of atmospheric-pressurized separation process which had the ability to separate the low concentration of DMC for the separation of the mixture with 12 wt.% of DMC base on the 500t/a pilot plant by the simulation model. The sensitive study and the optimization to this process had shown that the reflux ratio for the atmospheric and pressurized distillation had been 3.4 and 1.0 respectively, and 0.65, 0.93 of the distillate to feed ratio for the atmospheric and pressurized distillation. In this process, 99.5wt.% or higher concentration of methanol could be recovered, while the pressurized-atmospheric separation process could only obtained a solution containing 13.3 wt.% of DMC in the recovered methanol stream.
The model simulation and process design for the separation of DMC and methanol has been lettered in many literatures. Much number of the literatures had been presented on the simulation for the DMC synthesis with trans-esterification method, in addition with the detailed research on the catalytic distillation for the DMC synthesis by urea and methanol. However, the simulation work for the other DMC synthesis process had been little reported. Furthermore, the pressure-swing distillation process, the extractive distillation process and the azeotropic distillation process had been developed in the open reported simulative literatures for the product separation of DMC and methanol mixture. Among the derived separation process, the pressure swing distillation process and the extractive distillation process had been considered suitable for the product separation of DMC and methanol mixture.
Atmospheric distillation Pressurized distillation

The Design and Simulation of the Synthesis of Dimethyl Carbonate and the Product Separation Process Plant
89
7. References [1] Tundo, P.; Selva, M. The Chemistry of Dimethyl Carbonate. Acc. Chem. Res. 2002, 35,
706. [2] Ono, Y. Dimethyl Carbonate for Environmentally Benign Reactions. Catal. Today 1997,
35, 15. [3] Rodriguez, J. Canosa, A. Dominguez, J. Tojo. Isobaric vapour–liquid equilibria of
dimethyl carbonate with alkanes and cyclohexane at 101.3 kPa. Fluid Phase Equilibria 198 (2002) 95–109.
[4] Rodriguez, J. Canosa, A. Dominguez, J. Tojo. Vapour–liquid equilibria of dimethyl carbonate with linear alcohols and estimation of interaction parameters for the UNIFAC and ASOG method. Fluid Phase Equilibria 201 (2002) 187–201
[5] Ding Wang, Aiguo Xuan, Yuanxin Wua, Zhiguo Yana, Qimei Miao. Study on gas–liquid equilibria with the UNIFAC model for the systems of synthesizing dimethyl carbonate. Fluid Phase Equilibria, 302 (2011) 269–273
[6] Wang-Ming Hu, Lv-Ming Shen, Lu-Jun Zhao. Measurement of vapor–liquid equilibrium for binary mixtures of phenol–dimethyl carbonate and phenol–methanol at 101.3 kPa. Fluid Phase Equilibria, 219 (2004) 265–268
[7] Agreda, V. H.; Partin, P. H.; Heise, W. H. High Purity Methyl Acetate via Reactive Distillation. Chem. Eng. Process. 1990, 86, 40.
[8] Pilavachi, P. A.; Schenk, M.; Perez-Cisneros, E.; Gani, R. Modeling and Simulation of Reactive Distillation Operations. Ind. Eng. Chem. Res. 1997, 36, 3188.
[9] Malone, M. F.; Doherty, M. F. Reactive Distillation. Ind. Eng. Chem. Res. 2000, 39, 3953. [10] Tuchlenski, A.; Beckmann, A.; Reusch, D.; DuKssel, R.; Weidlich, U.; Janowsky, R.
Reactive Distillation - Industrial Applications, Process Design & Scale-up. Chem. Eng. Sci. 2001, 56, 387.
[11] Xu, Y.; Zheng, Y.; Ng, F. T. T.; Rempel, G. L. A Three-phase Nonequilibrium Dynamic Model for Catalytic Distillation. Chem. Eng. Sci. 2005, 60, 5637.
[12] Wang Feng, Zhao Ning, Li Junping, et al. Modeling of the Catalytic Distillation Process for the Synthesis of Dimethyl Carbonate by Urea Met hanolysis Method[J]. Ind Eng Chem Res,2007,46(26):8972–8979.
[13] Taylor, R.; Krishna, R. Multicomponent Mass Transfer; John Wiley and Sons: New York, 1993.
[14] Wang Feng, Zhao Ning, LI Jun-ping, Xiao Fu-kui, Wei Wei, Sun Yu-han. Modeling analysis for process operation of synthesis of Dimethyl carbonate. CHEMICAL ENGINEERING(CHINA), 2009, 37(2): 71-74
[15] Wang Feng, Zhao Ning, Li Junping, Xiao Fukui, Wei Wei, Sun Yuhan. Simulation of Catalyst distillation Using Non-Equilibrium model. PETROCHEMICAL TECHNOLOGY, 2007, 36(11): 1128-1133
[16] Wang Feng, Zhao Ning, Li Junping, et al. Non-Equilibrium Model for Catalytic Distillation Process[J].Rront Chem Eng Chin,2008, 2(4): 379-384.
[17] Wang Feng, Zhao Ning, Li Junping, Wu Dudu, Wei Wei, Sun Yuhan. Non-Equilibrium Stage Model for Dimethyl Carbonate Synthesis by Urea Methanolysis in Catalytic Distillation Tower. PETROCHEMICAL TECHNOLOGY, 2008, 37(4): 359-363
Distillation – Advances from Modeling to Applications
90
[18] Zhang Junliang, Wang Feng, Peng Weicai, Xiao Fukui, Wei Wei, Sun Yuhan. Process Simulation for Separation of Dimethyl Carbonate and Methanol Through Atmospheric-Pressurized Rectification. PETROCHEMICAL TECHNOLOGY, 2010, 39(6): 646-650
4
Batch Distillation: Thermodynamic Efficiency José C. Zavala-Loría* and Asteria Narváez-García
Universidad Autónoma del Carmen (UNACAR), DES-DAIT: Facultad de Química, Cd. del Carmen, Cam.
México
1. Introduction The batch distillation is a separation processes that requires great amounts of energy. Due to high energy costs, the study of energy consumption is of great interest in this process (Zavala et al. 2007). According to Luyben (1990), the energy consumption increases when operation occurs in a batch manner. Determining how efficient is the heat transfer under specific conditions and to modify them in order to find how efficient the heat is used, is an important task.
The analysis of thermodynamic efficiency in a batch distillation column has been presented by Kim and Diwekar (2000), Zavala-Loría (2004), Zavala et al. (2007), Zavala & Coronado (2008) and Zavala et al. (2011). The first work only developed expressions to calculate thermodynamic efficiency while the rest of the works developed expressions to calculate thermodynamic efficiency and have applied them to a new problem of optimal control: Maximum thermodynamic efficiency.
2. Description of the process For this study we used a conventional batch distillation column consisting of:
Reboiler Tray column Condenser Reflux drum Receiver
Figure 1 Shows a conventional batch column like the one used for this study.
Mass balances resulting from the process shown in Figure 1, allow us to obtain the mathematical model in Table 1. The model considers the following elements:
Theoretical stages Total condenser Neglible pressure drop
* Corresponding Author
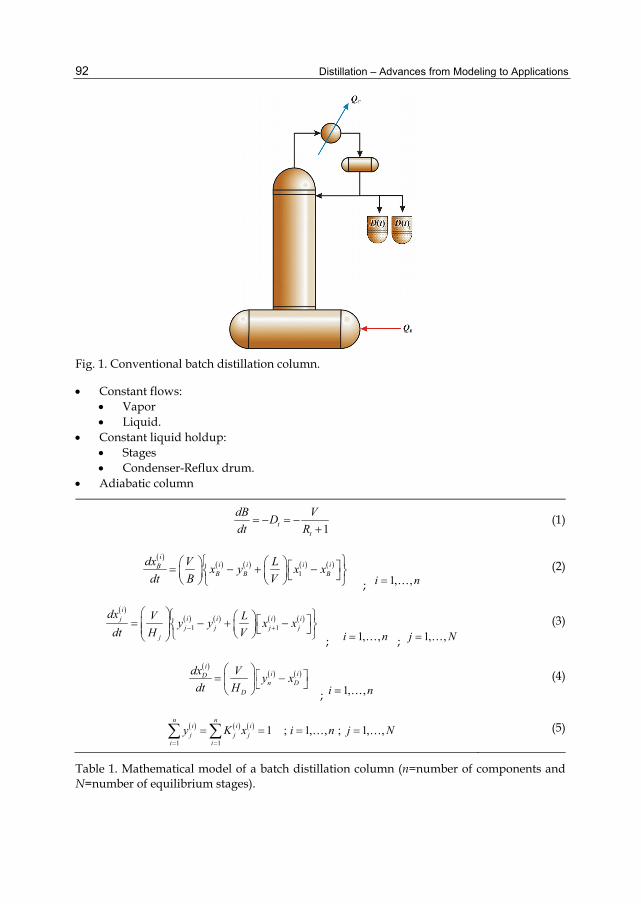
Distillation – Advances from Modeling to Applications 92
Fig. 1. Conventional batch distillation column.
Constant flows: Vapor Liquid.
Constant liquid holdup: Stages Condenser-Reflux drum.
Adiabatic column
1tt
dB VDdt R
(1)
1
ii i i iBB B B
dx V Lx y x xdt B V
; 1, ,i n (2)
1 1
ii i i ijj j j j
j
dx V Ly y x xdt H V
; 1, ,i n ; 1, ,j N
(3)
ii iDn D
D
dx V y xdt H
; 1, ,i n (4)
1 11 ; 1, , ; 1, ,
n ni i ij j j
i iy K x i n j N
(5)
Table 1. Mathematical model of a batch distillation column (n=number of components and N=number of equilibrium stages).
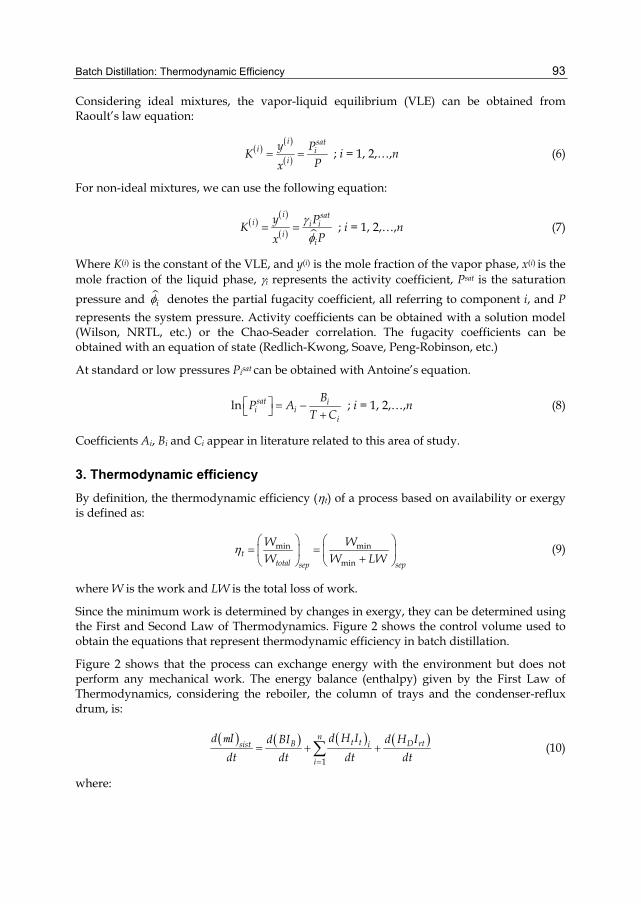
Batch Distillation: Thermodynamic Efficiency 93
Considering ideal mixtures, the vapor-liquid equilibrium (VLE) can be obtained from Raoult’s law equation:
i sati i
i
y PK
Px ; i = 1, 2,…,n (6)
For non-ideal mixtures, we can use the following equation:
i sati i i
ii
y PK
Px
; i = 1, 2,…,n (7)
Where K(i) is the constant of the VLE, and y(i) is the mole fraction of the vapor phase, x(i) is the mole fraction of the liquid phase, i represents the activity coefficient, Psat is the saturation pressure and i denotes the partial fugacity coefficient, all referring to component i, and P represents the system pressure. Activity coefficients can be obtained with a solution model (Wilson, NRTL, etc.) or the Chao-Seader correlation. The fugacity coefficients can be obtained with an equation of state (Redlich-Kwong, Soave, Peng-Robinson, etc.)
At standard or low pressures Pisat can be obtained with Antoine’s equation.
ln sat ii i
i
BP A
T C
; i = 1, 2,…,n (8)
Coefficients Ai, Bi and Ci appear in literature related to this area of study.
3. Thermodynamic efficiency By definition, the thermodynamic efficiency (t) of a process based on availability or exergy is defined as:
min min
mint
total sepsep
W WW W LW
(9)
where W is the work and LW is the total loss of work.
Since the minimum work is determined by changes in exergy, they can be determined using the First and Second Law of Thermodynamics. Figure 2 shows the control volume used to obtain the equations that represent thermodynamic efficiency in batch distillation.
Figure 2 shows that the process can exchange energy with the environment but does not perform any mechanical work. The energy balance (enthalpy) given by the First Law of Thermodynamics, considering the reboiler, the column of trays and the condenser-reflux drum, is:
1
nt t D rtBsist i
i
d H Id I d H Id BI
dt dt dt dt
m
(10)
where:
Distillation – Advances from Modeling to Applications 94
0sist
B C D
d IQ Q Q DI
dt
m (11)
According to the Second Law of Thermodynamics, the entropy balance is:
1
nt t D rtBsist i
i
d H Sd S d H Sd BS
dt dt dt dt
m
(12)
where:
0
0
sist CBD irr
B C
d S Q QQDS d S
dt T T T
m (13)
Fig. 2. Control volume for batch process.
I represents enthalpy, S is entropy, Q is the amount of heat, C represents the condenser, D represents the distillate, B represents the bottoms, m is the system mass, 0 is the reference state, t is the stage or tray and T is the temperature. The available work can be obtained if we combine equations (11) and (13). To do so, equation (13) must be multiplied by the temperature of the reference state T0 (it is considered that the reference state is liquid at 25 °C and 1.0 atm):
0 0 0
0 0 0sist
B C D irrB C
d T S T TQ Q Q DT S T d S
dt T T
m
0 0 0
0 0 0 0sist sist
B C D B C D irrB C
d T Sd I T TQ Q Q DI Q Q Q DT S T d S
dt dt T T
mm
Batch Distillation: Thermodynamic Efficiency 95
0 0 00 01 1B C D D irr
B C
d m I T S T TQ Q D I T S T d S
dt T T
(14)
the availability is represented as 0I T S A , then:
0 0
01 1sistB C D irr
B C
d T TQ Q D T d S
dt T T
mAA (15)
0 01 1sist
B C DB C
d T TQ Q D LW
dt T T
mAA (16)
Where the loss of work is defined as 0 irrLW T dS . The terms of the right hand side of Equation (16) represent the difference between the exergy or the availability of flows entering and leaving the system. The term on the left hand side is the change of exergy in the system. Finding the values in Equation (16), the work loss is:
0 01 1 sist
B C DB C
d mT TLW Q Q D
T T dt
AA (17)
sistd m
dt
A can be calculated, if discretised, by multiplying Equation (12) by T0 minus
Equation (10):
1
n
B t t D rtisist i
B H H
t t
mA A A
A (18)
Another way to estimate the value of sist
d m
dt
A is by applying an exergy balance at the
bottom of the column. Applying an exergy balance in the reboiler, we have:
B Bsist
B
d m d B d d BB
dt dt dt dt
A A AA (19)
Introducing Equation (1) from Table (1) in Equation (19), we obtain:
B BB
d B dB D
dt dt
A AA (20)
According to Kim and Diwekar (2000) and Zavala-Loría and Coronado-Velasco (2008), the total exergy can be calculated from its physical component ( phisA ) and its chemical
component ( chemA ), i.e.:
phis chem A A A (21)
Distillation – Advances from Modeling to Applications 96
where phisA considers the physical processes that involve thermal interactions with the
surroundings and chemA considers the mass and heat transfer with the surroundings. The main contribution to this energy is due to mixing effects and can be estimated from the chemical potential at low pressures (Kim and Diwekar, 2000). phisA is relatively lower than
chemA . Thus, the physical component can be regarded as constant for all chemical species and the derivative of this term is eliminated. The chemical component of exergy for an ideal mixture can be expressed as:
0 lni i
chemi
RT x x A (22)
whereas a non-ideal mixture can be calculated as:
0 lni i
chem ii
RT x x A (23)
and the exergy exchange in the reboiler for an ideal mixture can be calculated as:
0 ln
phis chem phis
i iB B B B B B
i
RT x x A A A A (24)
for a non-ideal mixture:
0 ,ln
phis chem phis
i iB B B B B iB B
i
RT x x A A A A (25)
Taking the derivative of Equations (24) and (25) yields:
0
lnchem
i iB B
B iB
d x xdd
RTdt dt dt
AA
(26)
,
0
lnchem
i iB iB B
B iB
d x xdd
RTdt dt dt
AA
(27)
The derivative of the term on the right hand side of Equations (26) and (27) can be represented in terms of the mathematical model of the column; thus, substituting Equation (2) of Table 1 yields:
1
ln1 ln
i iB B i
ii BB
i
i i i iB B B
i
d x xdx
xdt dt
V Lx y x x
B V
(28)

Batch Distillation: Thermodynamic Efficiency 97
,,
,,
,1
,
,
ln1 ln
1 ln
i ii BB B i i
i i Bi B Bi B B
i Bi
i i i i ii BB B B B
i
ii BB
i Bi
d x xddx x
xdt dt dt
V Lx y x x x
B V
dxdt
(29)
Substituting Equation (28) on the right hand side of Equation (20) for an ideal mixture, and Equation (29) on the right hand side of Equation (20) for a non-ideal mixture yields:
Ideal Mixture:
0 1
, 0
1 ln
ln
i i i i iBB B B B
i
i iB phis B B
i
d B LVRT x y x x x
dt V
D RT x x
A
A
(30)
Non-ideal Mixture:
0 ,1
,0
,
, 0 ,
1 ln
ln
i i i i iBi BB B B B
i
ii BB
i Bi
i it B phis i BB B
i
d B LVRT x y x x x
dt V
dxBRT
dt
D RT x x
A
A
(31)
The exergy of the current production (dome) that will be used in Equation (6) for an ideal mixture can be calculated as:
, 0 lni i
D D phis D Di
RT x x A A (32)
for a non-ideal mixture:
, 0 ,lni i
D D phis i DD Di
RT x x A A (33)
The exergy transfer associated with the transmission of energy as heat in the process can be calculated by the energy balances in the reboiler and condenser. Considering that Hvap is the same for each component and is not related to the temperature of the process, the Clausius-Clapeyron equation can be used to calculate Hvap, and the first two terms on the right hand side of Equation (16) can be calculated by the following equation;

Distillation – Advances from Modeling to Applications 98
Ideal Mixture:
0 00
1 11 1 vapB D
B D C B
T TQ Q V H T
T T T T
(34)
and considering constant relative volatility:
110 0
0 11
1 11 1 ln
1 1D
B DB D B
xT TQ Q VRT
T T x
(35)
Non-ideal Mixture:
1, 1, 1,0 00
1, 1, 1,1 1 ln D B B
B DB D B D D
KT TQ Q VRT
T T K
(36)
where, K is the liquid-vapor equilibrium constant and Φ is defined as:
expsat
k kkk sat
k
V P P
RT
; k = 1, 2, …,n (37)
Therefore, the term for exergy loss or work loss, LW in Equation (17) for an ideal mixture, can be calculated with Equation (35) and for a non-ideal mixture with Equation (36):
Ideal Mixture:
11
0 011
, ,
0 1
1 1ln ln ln
1 1
1 ln
i i i iDB B D D
i iB
B phis D phis
i i i i iB B B B
i
xLW VRT DRT x x x x
x
D
LVRT x y x x x
V
A A (38)
Non-ideal Mixture:
1, 1, 1,0 0 , ,
1, 1, 1,
, ,
0 ,1
,0
,
ln ln ln
1 ln
i i i iD B Bt i B i DB B D D
B D D i i
t B phis D phis
i i i i ii BB B B B
i
ii BB
i B
KLW VRT D RT x x x x
K
D
LVRT x y x x x
V
dxBRT
dt
A A
i
(39)
Considering that , , 0B phis D phis A A , then:
Batch Distillation: Thermodynamic Efficiency 99
Ideal Mixture:
11
0 11
0
0 1
1 1ln
1 1
ln ln
1 ln
D
B
i i i iB B D D
i i
i i i i iB B B B
i
xLW VRT
x
DRT x x x x
LVRT x y x x x
V
(40)
Non-ideal Mixture:
1, 1, 1,0 0 , ,
1, 1, 1,
,0 , 01
,
ln ln ln
1 ln
i i i iD B Bi B i DB B D D
B D D i i
ii i i i i i BB
i BB B B Bi Bi i
KLW VRT DRT x x x x
K
dxLVRT x y x x x BRT
V dt
(41)
the minimum work can be calculated as:
Ideal Mixture:
min 0
0 1
ln ln
1 ln
i i i iD D B B
i i
i i i i iB B B B
i
W DRT x x x x
LVRT x y x x x
V
(42)
Non-ideal Mixture:
min 0 , ,
0 ,1
,0
,
ln ln
1 ln
i i i ii D i BD D B B
i i
i i i i ii BB B B B
i
ii BB
i Bi
W DRT x x x x
LVRT x y x x x
V
dxBRT
dt
(43)
and the thermodynamic efficiency [Equation (9)] results in:
Ideal Mixture:
1
11
11
ln ln 1 ln
1 11 ln
1 1
i i i i i i i i iD D B B B B B B
it
D
B
x x x x R x y x y x
xR
x
(44)

Distillation – Advances from Modeling to Applications 100
Non-ideal Mixture:
,, , ,1
,
1, 1, 1,
1, 1, 1,
ln ln 1 ln
1 ln
ii i i i i i i i i i BB
i D i B i BD D B B B B B Bi Bi
tB B D
D D B
dxBx x x x R x y x y x
V dt
KR
K
(45)
Equation (45) can be reduced if one considers that the changes of activity coefficients in the reboiler are so small that they can be neglected. Then:
, ,1
1, 1, 1,
1, 1, 1,
ln 1 ln
1 ln
i i i i i i ii D i BB D D B B B
it
B B D
D D B
x x x R x y y x
KR
K
(46)
If the gas phase is ideal or close to ideality, then Equation (46) can be reduced even more:
, ,1
1, 1,
1, 1,
ln 1 ln
1 ln
i i i i i i ii D i BB D D B B B
it
B D
D B
x x x R x y y x
KR
K
(47)
The solution of Equation (45) or its simplifications [Equation (46) and (47)] require the calculation of activity coefficients of the mixtures, which can be obtained with an appropriate solution model (Wilson, NRTL, UNIQUAC, UNIFAC, etc.). According to Equations (44), (45), (46) and (47), the thermodynamic efficiency not only depends on the reflux ratio but on the concentration of components in both phases and the kind of mixture. A convenient way to express thermodynamic efficiency is the average thermodynamic equation used by Zavala Loría (2004), Zavala et al. (2007), Zavala and Coronado (2008). and Zavala et al. (2011) to solve the maximum thermodynamic efficiency problem:
0
tt
average
dt
t
(48)
4. Results and discussion Using the First and Second Law of Thermodynamics, this work has developed an expression for calculating the thermodynamic efficiency of a batch distillation process [Equations (44) and (45)]. To solve the mathematical model, the feeding was introduced at the top of the column at boiling temperature, neglecting the accumulation of vapor in each stage. The process was performed with total condenser, atmospheric pressure and adiabatic column.
To solve the model, two mixtures were considered. The first one is an ideal mixture of Hexane/Benzene/Chlorobenzene (HBC); the second one is a non-ideal mixture of Ethanol-Water (EW).
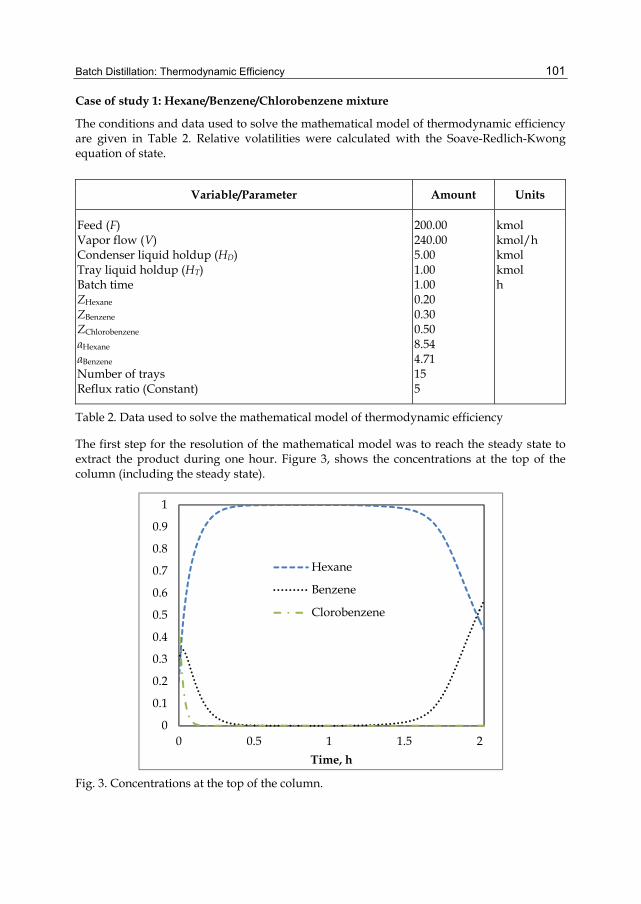
Batch Distillation: Thermodynamic Efficiency 101
Case of study 1: Hexane/Benzene/Chlorobenzene mixture
The conditions and data used to solve the mathematical model of thermodynamic efficiency are given in Table 2. Relative volatilities were calculated with the Soave-Redlich-Kwong equation of state.
Variable/Parameter Amount Units
Feed (F) Vapor flow (V) Condenser liquid holdup (HD) Tray liquid holdup (HT) Batch time ZHexane ZBenzene ZChlorobenzene
αHexane αBenzene Number of trays Reflux ratio (Constant)
200.00 240.00 5.00 1.00 1.00 0.20 0.30 0.50 8.54 4.71 15 5
kmol kmol/h kmol kmol h
Table 2. Data used to solve the mathematical model of thermodynamic efficiency
The first step for the resolution of the mathematical model was to reach the steady state to extract the product during one hour. Figure 3, shows the concentrations at the top of the column (including the steady state).
Fig. 3. Concentrations at the top of the column.
0
0.1
0.2
0.3
0.4
0.5
0.6
0.7
0.8
0.9
1
0 0.5 1 1.5 2Time, h
Hexane
Benzene
Clorobenzene
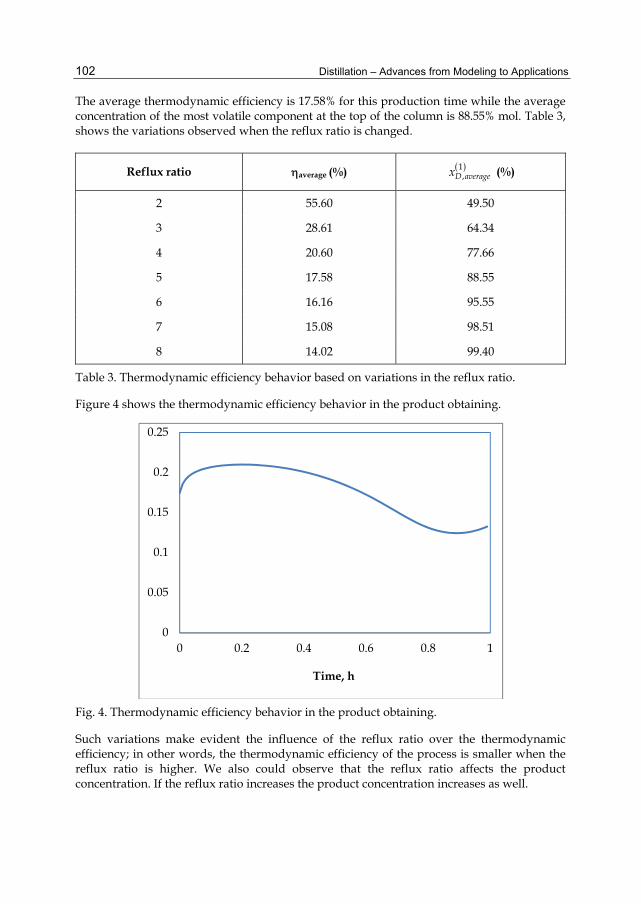
Distillation – Advances from Modeling to Applications 102
The average thermodynamic efficiency is 17.58% for this production time while the average concentration of the most volatile component at the top of the column is 88.55% mol. Table 3, shows the variations observed when the reflux ratio is changed.
Reflux ratio average (%) 1,D averagex (%)
2 55.60 49.50
3 28.61 64.34
4 20.60 77.66
5 17.58 88.55
6 16.16 95.55
7 15.08 98.51
8 14.02 99.40
Table 3. Thermodynamic efficiency behavior based on variations in the reflux ratio.
Figure 4 shows the thermodynamic efficiency behavior in the product obtaining.
Fig. 4. Thermodynamic efficiency behavior in the product obtaining.
Such variations make evident the influence of the reflux ratio over the thermodynamic efficiency; in other words, the thermodynamic efficiency of the process is smaller when the reflux ratio is higher. We also could observe that the reflux ratio affects the product concentration. If the reflux ratio increases the product concentration increases as well.
0
0.05
0.1
0.15
0.2
0.25
0 0.2 0.4 0.6 0.8 1
Time, h
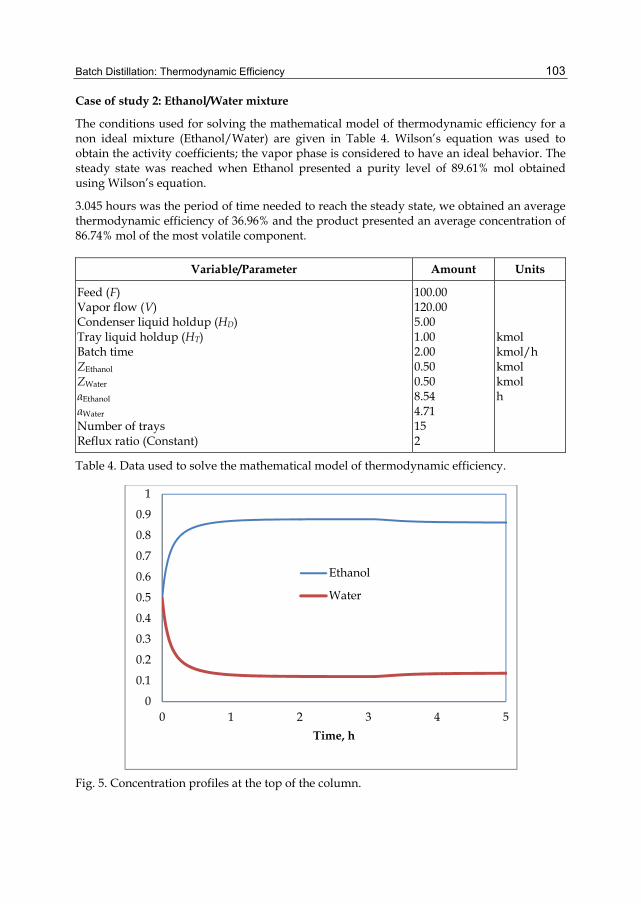
Batch Distillation: Thermodynamic Efficiency 103
Case of study 2: Ethanol/Water mixture
The conditions used for solving the mathematical model of thermodynamic efficiency for a non ideal mixture (Ethanol/Water) are given in Table 4. Wilson’s equation was used to obtain the activity coefficients; the vapor phase is considered to have an ideal behavior. The steady state was reached when Ethanol presented a purity level of 89.61% mol obtained using Wilson’s equation.
3.045 hours was the period of time needed to reach the steady state, we obtained an average thermodynamic efficiency of 36.96% and the product presented an average concentration of 86.74% mol of the most volatile component.
Variable/Parameter Amount Units
Feed (F) Vapor flow (V) Condenser liquid holdup (HD) Tray liquid holdup (HT) Batch time ZEthanol ZWater αEthanol
αWater Number of trays Reflux ratio (Constant)
100.00 120.00 5.00 1.00 2.00 0.50 0.50 8.54 4.71 15 2
kmol kmol/h kmol kmol h
Table 4. Data used to solve the mathematical model of thermodynamic efficiency.
Fig. 5. Concentration profiles at the top of the column.
0
0.1
0.2
0.3
0.4
0.5
0.6
0.7
0.8
0.9
1
0 1 2 3 4 5Time, h
Ethanol
Water

Distillation – Advances from Modeling to Applications 104
Figure 5 shows the behavior of the concentrations at the top of the column, while the behavior of punctual thermodynamic efficiency is shown in Figure 6. Table 5 shows the variations observed when different reflux ratios are used.
Fig. 6. Thermodynamic efficiency profile (obtaining product).
Reflux ratio average (%) 1,D averagex (%)
5 36.96 86.74
6 32.75 86.96
7 29.24 87.12
8 26.38 87.24
9 24.00 87.32
10 22.02 87.39
Table 5. Thermodynamic efficiency behavior with regards to the reflux ratio variation.
As in the last case, we observe that when the reflux ratio increases, the efficiency decreases; however, the concentration of the most volatile component presents also an increment. We can formulate the following heuristic rule: If the variables of the process are maintained, the reflux ratio will have an inverse effect on the thermodynamic efficiency of the process.
5. Concluding remarks Using the First and Second Law of Thermodynamics (exergy concept), this work has developed an expression for calculating the thermodynamic efficiency of a batch distillation
0
0.05
0.1
0.15
0.2
0.25
0.3
0.35
0.4
0.45
0 0.5 1 1.5 2Time, h
Batch Distillation: Thermodynamic Efficiency 105
process. The resulting equation was used to find the batch distillation thermodynamic efficiency for an ideal mixture and a non-ideal mixture. The equation obtained is a generalization of the equation developed by Zavala-Loría et al. (2007), Zavala and Coronado (2008) and Zavala et al. (2011).
The results obtained by solving the Equations, allowed us to observe the relationship between reflux and thermodynamic efficiency of the process. Furthermore, variables such as the product purity are affected by the reflux ratio, in other words, the purity of the product requires a greater amount of reflux to obtain a higher concentration.
6. Nomenclature Hj molar hold-up on tray j HD molar hold-up on the condenser I enthalpy (J/mol) S entropy (J/mol K) V vapor flow rate (mol/h) L liquid flow rate (mol/h) D distillate flow rate (mol/h) B amount of moles in the reboiler, mol n number of components N number of trays in the column Rt reflux ratio t time (h) W work (J) LW work loss (J) z mole fraction in the feed
( )ijx mole fraction in the liquid of component i at plate j ( )ijy mole fraction in the vapor of component i at plate j ( )iBx mole fraction in the liquid of component i in the reboiler ( )iDx mole fraction in the vapor of component i in the distillate ( )ijK equilibrium constant
T temperature A availability t punctual thermodynamic efficiency Hvap vaporization heat
Subindex
0 reference c condenser f end D distillate B boiler or reboiler t time

Distillation – Advances from Modeling to Applications 106
7. References Luyben, William L. (1990); Process modeling, Simulation and Control for Chemical
Engineers; McGraw-Hill. Second edition, 725 pp. Kim, K.J., Diwekar, U.M. (2000); Comparing Batch Column Configurations: Parametric
Study Involving Multiple Objetives; Aiche Journal, 46(12), pp. 2475-2488. Zavala-Loría, J.C. (2004); Optimización del Proceso de Destilación Discontinua; Tesis
Doctoral, Departamento de Ingeniería Química, Instituto Tecnológico de Celaya, Celaya, Guanajuato, México.
Zavala, José C., Córdova, Atl., Cerón, Rosa M. and Palí, Ramón J. (2007); Thermodynamic efficiencies of a conventional batch column; Int. J. Exergy, 4(4), pp. 371-383.
Zavala, J. C. and Coronado, Cristina (2008); Optimal Control Problem in Batch Distillation Using Thermodynamic Efficiency; Ind. Eng. Chem. Res., 47, pp. 2788-2793.
Zavala-Loría, J. C., Ruiz-Marín, A. and Coronado-Velásco, Cristina (2011); Maximum Thermodynamic Efficiency Problem in Batch Distillation; Brazilian Journal of Chemical Engineering, 28(2), pp. 333-342.
Part 2
Food and Aroma Concentration

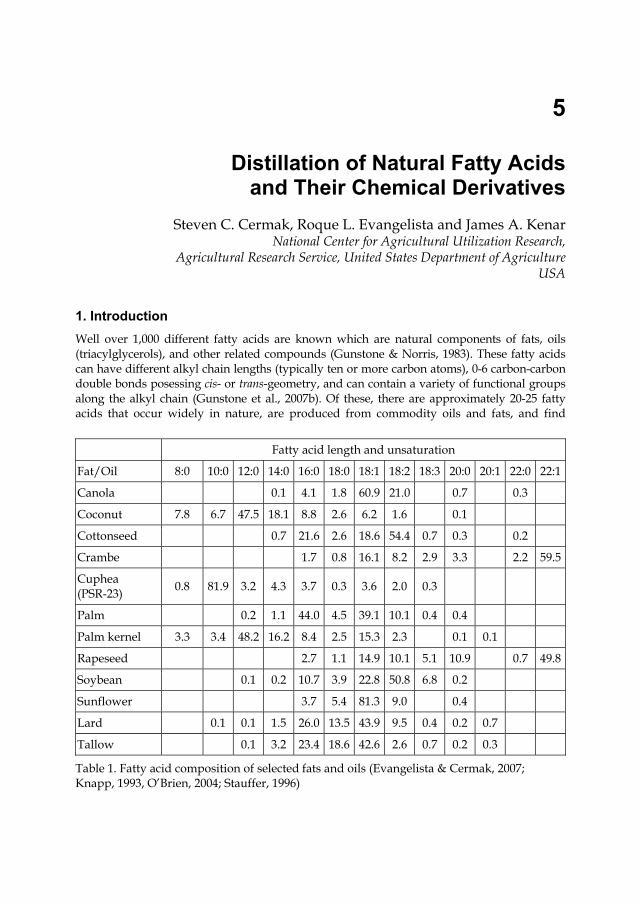
5
Distillation of Natural Fatty Acids and Their Chemical Derivatives
Steven C. Cermak, Roque L. Evangelista and James A. Kenar National Center for Agricultural Utilization Research,
Agricultural Research Service, United States Department of Agriculture USA
1. Introduction Well over 1,000 different fatty acids are known which are natural components of fats, oils (triacylglycerols), and other related compounds (Gunstone & Norris, 1983). These fatty acids can have different alkyl chain lengths (typically ten or more carbon atoms), 0-6 carbon-carbon double bonds posessing cis- or trans-geometry, and can contain a variety of functional groups along the alkyl chain (Gunstone et al., 2007b). Of these, there are approximately 20-25 fatty acids that occur widely in nature, are produced from commodity oils and fats, and find
Fatty acid length and unsaturation
Fat/Oil 8:0 10:0 12:0 14:0 16:0 18:0 18:1 18:2 18:3 20:0 20:1 22:0 22:1
Canola 0.1 4.1 1.8 60.9 21.0 0.7 0.3
Coconut 7.8 6.7 47.5 18.1 8.8 2.6 6.2 1.6 0.1
Cottonseed 0.7 21.6 2.6 18.6 54.4 0.7 0.3 0.2
Crambe 1.7 0.8 16.1 8.2 2.9 3.3 2.2 59.5
Cuphea (PSR-23) 0.8 81.9 3.2 4.3 3.7 0.3 3.6 2.0 0.3
Palm 0.2 1.1 44.0 4.5 39.1 10.1 0.4 0.4
Palm kernel 3.3 3.4 48.2 16.2 8.4 2.5 15.3 2.3 0.1 0.1
Rapeseed 2.7 1.1 14.9 10.1 5.1 10.9 0.7 49.8
Soybean 0.1 0.2 10.7 3.9 22.8 50.8 6.8 0.2
Sunflower 3.7 5.4 81.3 9.0 0.4
Lard 0.1 0.1 1.5 26.0 13.5 43.9 9.5 0.4 0.2 0.7
Tallow 0.1 3.2 23.4 18.6 42.6 2.6 0.7 0.2 0.3
Table 1. Fatty acid composition of selected fats and oils (Evangelista & Cermak, 2007; Knapp, 1993, O’Brien, 2004; Stauffer, 1996)
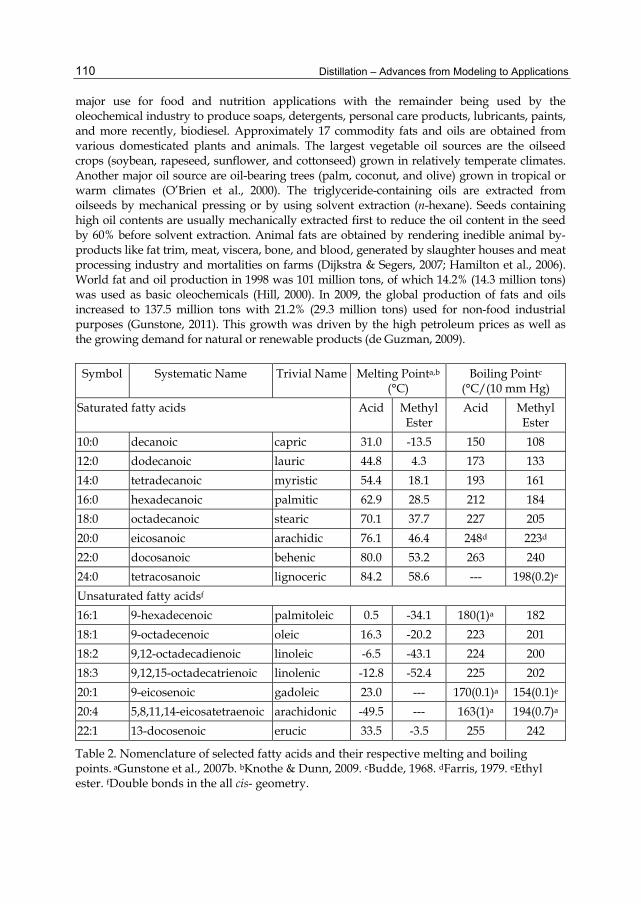
Distillation – Advances from Modeling to Applications 110
major use for food and nutrition applications with the remainder being used by the oleochemical industry to produce soaps, detergents, personal care products, lubricants, paints, and more recently, biodiesel. Approximately 17 commodity fats and oils are obtained from various domesticated plants and animals. The largest vegetable oil sources are the oilseed crops (soybean, rapeseed, sunflower, and cottonseed) grown in relatively temperate climates. Another major oil source are oil-bearing trees (palm, coconut, and olive) grown in tropical or warm climates (O’Brien et al., 2000). The triglyceride-containing oils are extracted from oilseeds by mechanical pressing or by using solvent extraction (n-hexane). Seeds containing high oil contents are usually mechanically extracted first to reduce the oil content in the seed by 60% before solvent extraction. Animal fats are obtained by rendering inedible animal by-products like fat trim, meat, viscera, bone, and blood, generated by slaughter houses and meat processing industry and mortalities on farms (Dijkstra & Segers, 2007; Hamilton et al., 2006). World fat and oil production in 1998 was 101 million tons, of which 14.2% (14.3 million tons) was used as basic oleochemicals (Hill, 2000). In 2009, the global production of fats and oils increased to 137.5 million tons with 21.2% (29.3 million tons) used for non-food industrial purposes (Gunstone, 2011). This growth was driven by the high petroleum prices as well as the growing demand for natural or renewable products (de Guzman, 2009).
Symbol Systematic Name Trivial Name Melting Pointa,b
(°C) Boiling Pointc
(°C/(10 mm Hg) Saturated fatty acids Acid Methyl
Ester Acid Methyl
Ester 10:0 decanoic capric 31.0 -13.5 150 108 12:0 dodecanoic lauric 44.8 4.3 173 133 14:0 tetradecanoic myristic 54.4 18.1 193 161 16:0 hexadecanoic palmitic 62.9 28.5 212 184 18:0 octadecanoic stearic 70.1 37.7 227 205 20:0 eicosanoic arachidic 76.1 46.4 248d 223d 22:0 docosanoic behenic 80.0 53.2 263 240 24:0 tetracosanoic lignoceric 84.2 58.6 --- 198(0.2)e Unsaturated fatty acidsf 16:1 9-hexadecenoic palmitoleic 0.5 -34.1 180(1)a 182 18:1 9-octadecenoic oleic 16.3 -20.2 223 201 18:2 9,12-octadecadienoic linoleic -6.5 -43.1 224 200 18:3 9,12,15-octadecatrienoic linolenic -12.8 -52.4 225 202 20:1 9-eicosenoic gadoleic 23.0 --- 170(0.1)a 154(0.1)e 20:4 5,8,11,14-eicosatetraenoic arachidonic -49.5 --- 163(1)a 194(0.7)a 22:1 13-docosenoic erucic 33.5 -3.5 255 242
Table 2. Nomenclature of selected fatty acids and their respective melting and boiling points. aGunstone et al., 2007b. bKnothe & Dunn, 2009. cBudde, 1968. dFarris, 1979. eEthyl ester. fDouble bonds in the all cis- geometry.
Distillation of Natural Fatty Acids and Their Chemical Derivatives 111
The fatty acid composition of fats and oils varies widely depending on the source (Table 1). Coconut and palm kernel oils contain high amounts of medium chain saturated fatty acids like lauric and myristic acids (Table 2). Palm, tallow and lard oils are high in longer saturated fatty acids (palmitic and stearic acids) and monounsaturated oleic acid. Canola, and sunflower oils are high in oleic acid while soybean oil has more linoleic acid. Rapeseed and crambe are good sources of long chain fatty acids like erucic acid.
The first step in fatty acid production (Fig. 1) is the splitting or hydrolysis of the triglyceride molecules of fats and oils in the presence of water to yield glycerine (10% yield) and a mixture of fatty acids (96% yield), (Gunstone et al., 2007a).
CH2OCR
CHOCR'
CH2OCR"
+ 3 H2O
RCOOH
R'COOH
R"COOH
+
CH2OH
CHOH
CH2OH
Triglyceride Water Fatty Acids Glycerine
O
O
O
Fig. 1. Splitting or hydrolysis of fat or oil triglycerides to fatty acids and glycerine
This can be done batch-wise using the Twitchell process (Ackelsberg, 1958; Twitchell, 1898) or continuously at high pressure and temperature like the Colgate-Emery process (Barnebey & Brown, 1948). Typically, the crude fatty acids obtained by the Colgate-Emery process are considerably lighter in color in comparison to those obtained by the Twitchell process. The degree of triglyceride hydrolysis is important as residual mono-, di-, triglycerides and free glycerol in the fatty acid prior to distillation will result in more distillation pot residue (Potts, 1956). The fatty acids from the fat splitting process are relatively dark in color and contain various impurities. The fatty acids are subsequently purified or separated into fractions by distillation and fractionation.
2. Distillation methods used in fatty acid industry Purification of fatty acids by distillation has been practiced for well over a hundred years and is still the most common and most efficient means of producing high purity fatty acids. Distillation removes both the low and high boiling impurities as well as odor substances. Distillation of fatty acids may be either batch or continous process, at atmospheric pressure or under reduced pressure. It may be simple distillation involving purification of mixed fatty acids or fractional distillation consisting of both purification and separation of fatty acids according to chain length (Gervajio, 2005; Muckerheide, 1952; Potts & White, 1953). Because of the inherent sensitivity of fatty acids toward heat, the distillation methods employed should be conducted at as low a temperature as practically and economically feasible while maintaining the shortest residence time of the fatty acid in the distillation unit. Today’s, modern distillation units rely upon high vacuum, effective heating, short contact times, effective mass transfer between vapor and condensate, and steam economy (Lausberg et al., 2008).
Distillation – Advances from Modeling to Applications 112
2.1 Batch distillation
Batch distillation at atmospheric pressure is probably the oldest of the commercial processes used in fatty acid distillation. It uses a direct-fired still pot fitted with a steam sparger. The pot is charged with fatty acids and heated to 260° to 316°C and sparged with saturated steam at 149°C. The ratio of steam to fatty acid vapor is typically 5 to 1. The steam and fatty acid vapor are condensed separately. The economics of this type of distillation is poor due to the large amount of steam used. Considerable amounts of fatty acids are also entrained in the steam condensate. Distillation is further complicated because of the prolonged heating of the fatty acids at high temperatures and the inherent thermal instability of the fatty acids. This combination often results in considerable decarboxylation and polymerization with consequently large amounts of viscous residue and pitch. Tall fatty acids of about 95% hydrolysis when distilled in this manner yield 15 to 20% entrained fatty acids and 10 to 15% residue. Re-splitting the residue and distillation yields low quality fatty acids and a final pitch residue of 5 to 8% (Muckerheide, 1952). Later improvements in this distillation technique included working at reduced pressure (5-50 mm Hg) and lowering the amount of injected steam. The water from the steam is desirable as it suppresses anhydride formation (Potts, 1956).
2.2 Continuous distillation
Probably the first fatty acid still to use continuous distillation was developed by Wecker (1927). A simplified diagram of this process is illustrated in Fig. 2. Preheated fatty acid feed enters through pipe c and flows through a series of reaction chambers a interconnected by pipe b. The reaction chambers are heated at the bottom by gas or oil burners. Superheated steam is introduced through pipe l and injected into the feed in each chamber by a sparger (m and n). The low pressure imposed in the reaction chamber and the high temperature of the feed caused the superheated steam to evaporate vigorously resulting in an instantaneous distillation of the fatty acids. The vapor are led to a pipe header g, condensed by a water-cooled condenser h, and collected in i. The steam passes on to the barometric condenser through k and the non-condensable gases are removed by a vacuum pump. The residue leaving the last reaction chamber is cooled in d and into collector e. Vacuum on the still is maintained at 30-35 mm Hg and the temperature in the still chambers ranged from 196° to 260°F. Residence time of fatty acids is about 30 min.
One disadvantage of steam distillation of fatty acids is the formation of emulsions in the last stage of condensation where a water spray is used. The calcium and magnesium salts in the water spray react with the fatty acids forming soaps. To recover the fatty acids, the soap is acidified and redistilled if desired. This can be avoided by employing dry distillation, i.e., distillation without using steam or any gaseous medium as carrier of the fatty acids. Such process was developed by Mills (1942) who employed a combination of dry and flash distillation to recover fatty acids from hydrolyzed fats and oils (Fig. 3). The fatty acid to be distilled is rapidly heated using a heat exchanger (4) to the boiling point corresponding to the operating pressure (≤ 12.7 mm Hg absolute) in the still (10). When the heated feed is introduced to the bottom of the tube (13) and exposed to the lower pressure in the still, the fatty acids vaporizes immediately. The vapors lift the undistilled residue (11) from the bottom of the still up the tube and splashes against the bottom of the baffle (15) creating a continuous curtain of liquid undistilled material. The vapor proceeds to the condensers (17
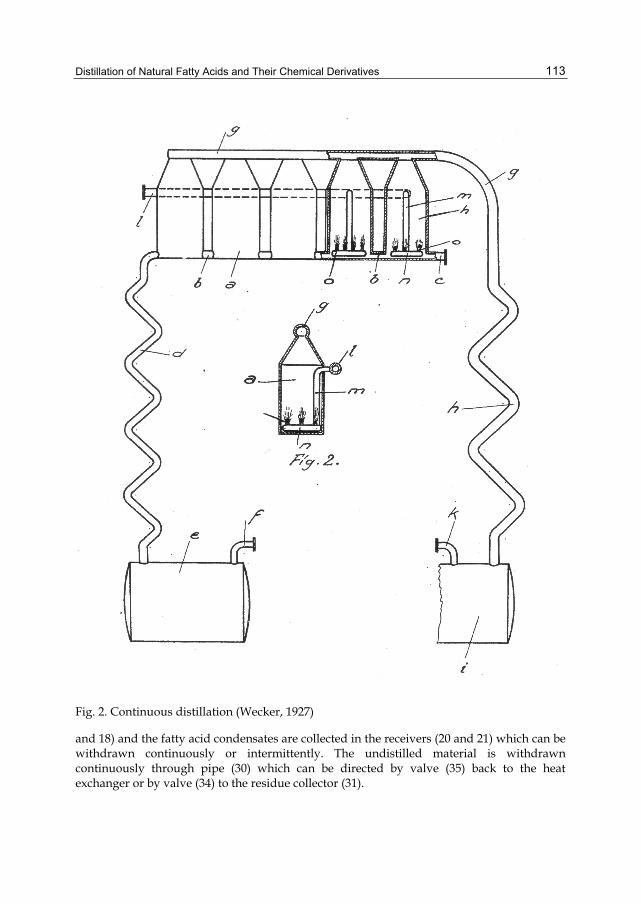
Distillation of Natural Fatty Acids and Their Chemical Derivatives 113
Fig. 2. Continuous distillation (Wecker, 1927)
and 18) and the fatty acid condensates are collected in the receivers (20 and 21) which can be withdrawn continuously or intermittently. The undistilled material is withdrawn continuously through pipe (30) which can be directed by valve (35) back to the heat exchanger or by valve (34) to the residue collector (31).
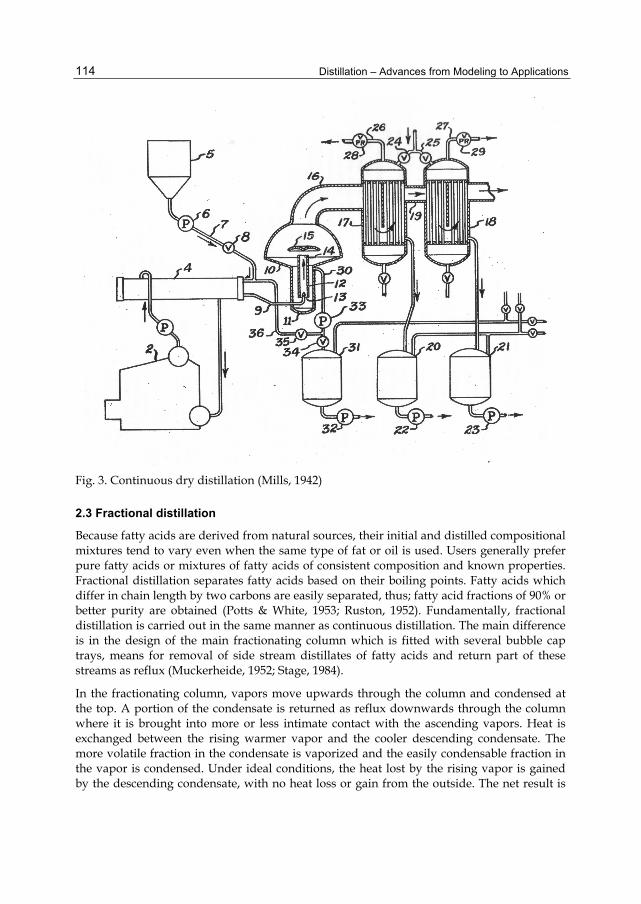
Distillation – Advances from Modeling to Applications 114
Fig. 3. Continuous dry distillation (Mills, 1942)
2.3 Fractional distillation
Because fatty acids are derived from natural sources, their initial and distilled compositional mixtures tend to vary even when the same type of fat or oil is used. Users generally prefer pure fatty acids or mixtures of fatty acids of consistent composition and known properties. Fractional distillation separates fatty acids based on their boiling points. Fatty acids which differ in chain length by two carbons are easily separated, thus; fatty acid fractions of 90% or better purity are obtained (Potts & White, 1953; Ruston, 1952). Fundamentally, fractional distillation is carried out in the same manner as continuous distillation. The main difference is in the design of the main fractionating column which is fitted with several bubble cap trays, means for removal of side stream distillates of fatty acids and return part of these streams as reflux (Muckerheide, 1952; Stage, 1984).
In the fractionating column, vapors move upwards through the column and condensed at the top. A portion of the condensate is returned as reflux downwards through the column where it is brought into more or less intimate contact with the ascending vapors. Heat is exchanged between the rising warmer vapor and the cooler descending condensate. The more volatile fraction in the condensate is vaporized and the easily condensable fraction in the vapor is condensed. Under ideal conditions, the heat lost by the rising vapor is gained by the descending condensate, with no heat loss or gain from the outside. The net result is
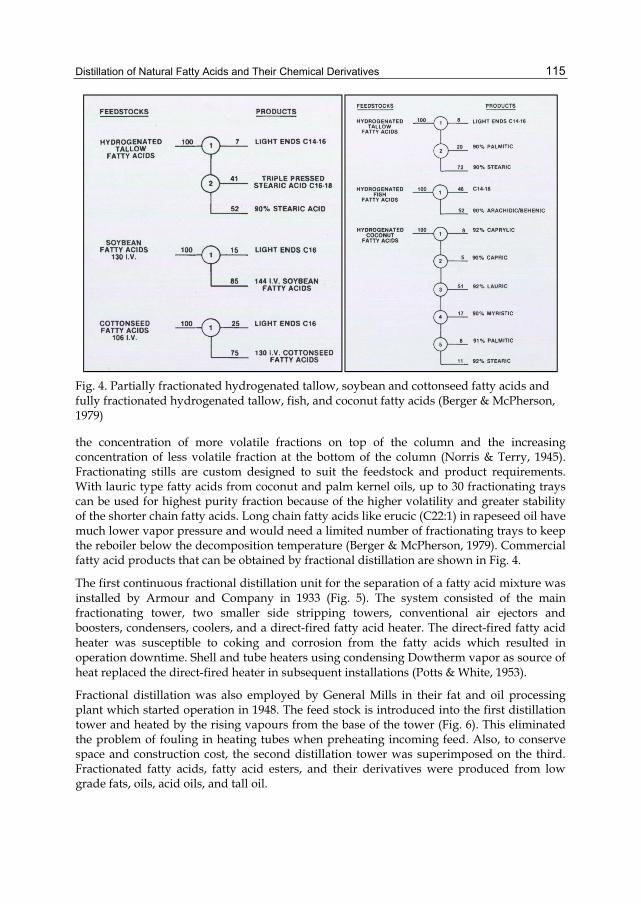
Distillation of Natural Fatty Acids and Their Chemical Derivatives 115
Fig. 4. Partially fractionated hydrogenated tallow, soybean and cottonseed fatty acids and fully fractionated hydrogenated tallow, fish, and coconut fatty acids (Berger & McPherson, 1979)
the concentration of more volatile fractions on top of the column and the increasing concentration of less volatile fraction at the bottom of the column (Norris & Terry, 1945). Fractionating stills are custom designed to suit the feedstock and product requirements. With lauric type fatty acids from coconut and palm kernel oils, up to 30 fractionating trays can be used for highest purity fraction because of the higher volatility and greater stability of the shorter chain fatty acids. Long chain fatty acids like erucic (C22:1) in rapeseed oil have much lower vapor pressure and would need a limited number of fractionating trays to keep the reboiler below the decomposition temperature (Berger & McPherson, 1979). Commercial fatty acid products that can be obtained by fractional distillation are shown in Fig. 4.
The first continuous fractional distillation unit for the separation of a fatty acid mixture was installed by Armour and Company in 1933 (Fig. 5). The system consisted of the main fractionating tower, two smaller side stripping towers, conventional air ejectors and boosters, condensers, coolers, and a direct-fired fatty acid heater. The direct-fired fatty acid heater was susceptible to coking and corrosion from the fatty acids which resulted in operation downtime. Shell and tube heaters using condensing Dowtherm vapor as source of heat replaced the direct-fired heater in subsequent installations (Potts & White, 1953).
Fractional distillation was also employed by General Mills in their fat and oil processing plant which started operation in 1948. The feed stock is introduced into the first distillation tower and heated by the rising vapours from the base of the tower (Fig. 6). This eliminated the problem of fouling in heating tubes when preheating incoming feed. Also, to conserve space and construction cost, the second distillation tower was superimposed on the third. Fractionated fatty acids, fatty acid esters, and their derivatives were produced from low grade fats, oils, acid oils, and tall oil.
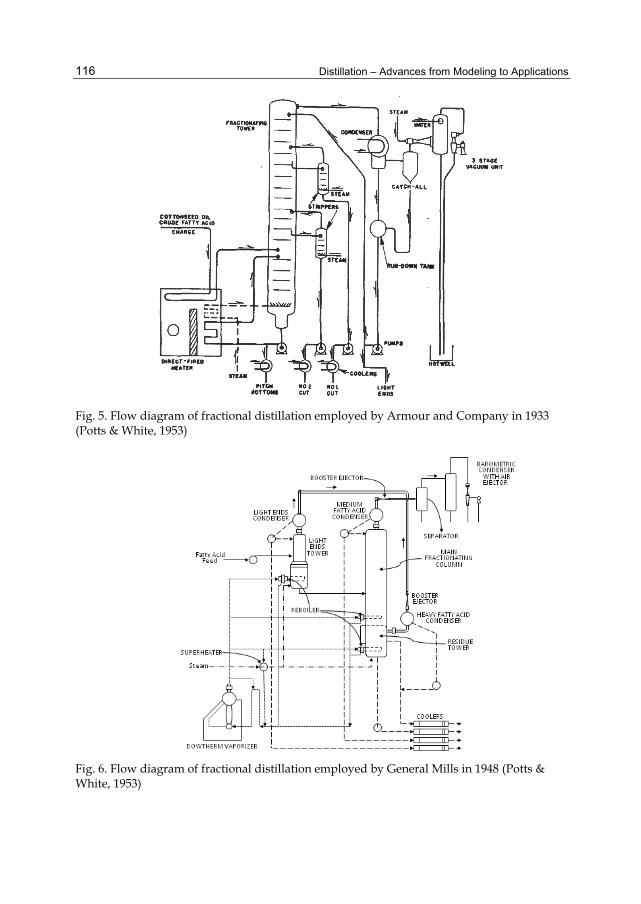
Distillation – Advances from Modeling to Applications 116
Fig. 5. Flow diagram of fractional distillation employed by Armour and Company in 1933 (Potts & White, 1953)
Fig. 6. Flow diagram of fractional distillation employed by General Mills in 1948 (Potts & White, 1953)

Distillation of Natural Fatty Acids and Their Chemical Derivatives 117
2.4 Molecular distillation
Molecular distillation is industrially useful in the purification of unstable or highly oxidatively unstable fats, oils and their derivatives. Molecular distillation consists of at least the following types: wiped film molecular distillation unit (Fig. 7) and centrifugal molecular distillation unit (Fig. 8).
Fig. 7. Wiped film molecular distillation unit (Marttinello et al., 2008)
Fig. 8. Centrifugal film molecular distillation unit (Nuns et al., 1994)
Distillation – Advances from Modeling to Applications 118
Molecular distillations are conducted under vacuum conditions, which allows for reduced distillation temperatures compared to conventional distillation techniques thus reducing the risk of oxidative damage. Separating the oil’s components by weight allows contaminates to be reduced far below industry standards. Current industrial applications include cosmetic applications, the concentration of omega-3 fatty acids (EPA and DHA) and corresponding esters in fish oil (Rossi et al., 2011), and contaminant removal. Additionally, Vitamin E (Pramparo et al., 2005), Vitamin A, cocoa butter, dimer acids, epoxy resins, lubricants, monoglycerides, insecticides, pharmaceuticals, perfumery and flavours, essential oils, Azadirachtin (Neem based pesticides) and its formulations as well as many other natural & herbal products have been distilled on an industrial scale using this process. Additional applications and information on fatty acid molecular distillation will be reported in Section 3.3 Distillation.
3. New crops and products Development of new crops in the United States is based on a history of screening and identifying plants for novel chemicals, germplasm development of a select few unique plants, isolation of raw materials (processing, refining and distilling), product development, evaluation, and scale-up to commercial production and, finally, the transfer of knowledge to industrial partners and farmers. In most cases, these new crop identifications initially begin with the individual selection based on oil composition and unique fatty acid profiles, followed by continued evaluation and development based on novel raw materials, industrial applications of the raw materials and agronomic potential. From this extensive survey, two crops were selected to focus on (Cuphea and Meadowfoam). Additionally, these crops have had been converted into industrial products which require some degree of purification. Thus separations of both the new crop fatty acids and new products have undergone distillations.
3.1 New crop examples
3.1.1 Meadowfoam
One example of a successful new crop is meadowfoam (Limnanthes alba). In the 1960’s, USDA scientists identified this plant as a potential new crop out of hundreds of others that needed further research. In the 1970’s, a meadowfoam breeding program began the daunting task of domesticating this plant. By the 1990’s, numerous varieties had been released and meadowfoam reached commercial scale (approximately 8000 acres in 1997) in the Willamette Valley of Oregon located in the Northwestern US. The unique long chain fatty acids of meadowfoam [5-eicosenoic acid (62%); 5,13-docosadienoic acid (19%); 5-docosenoic acid (3%); and 13-docosenoic acid (10%)] helped advance its development (Phillips et al., 1971). Finally, the 5 unsaturation itself has enhanced resistance to oxidative degradation as evidenced by the high OSI of the oil (246.9 h @ 110°C) which makes meadowfoam oil one of the most stable oils available on the market (Isbell et al., 1999). Meadowfoam oil is found in numerous cosmetic applications, such as hair shampoos and conditioners, skin creams, hair setting aids, permanents, hair relaxers, and hair colors.
Distillation of Natural Fatty Acids and Their Chemical Derivatives 119
3.1.2 Cuphea
Cuphea (Lythraceae) is a large genus of over 200 species of herbs and shrubs that produces a small seed with oil that is rich in saturated medium-chain triacylglycerols (which can be converted to medium chain fatty acids, MCFAs) (Graham et al., 1981; Knapp, 1993; Miller et al., 1964; Wolf et al., 1983). MCFAs (C8:0-C12:0) are used primarily in soaps (Nandi et al., 2004), detergents (Molly & Bruggeman, 2004), cosmetics (Brown et al., 2008), lubricants (Nagaoka & Ibuki, 2000), and food applications (Tholstrup et al., 2004). One-half of the MCFAs used by the US soap and detergent industry are obtained from coconut and palm kernel oils, while the other half is from petroleum (Hardin, 1991).
With the need for higher seed yields, oil content, and less seed shattering, Steve Knapp (1993) at Oregon State University began developing promising cuphea crosses. Cuphea PSR-23 is a hybrid between Cuphea viscosissima (a species native to the US) and Cuphea lanceolata (a species native to Mexico). One of these new germplasm lines, PSR-23, with partial seed retention and high in C10:0, decanoic acid, was developed and has been planted in the Midwest and mechanically harvested and dried (Cermak et al., 2005) by researchers at USDA since 2000. The seeds weighed 538 g/L (3.3 g/1,000 seeds) and contain up to 35% oil (Table 1). The oil typically contains around 82% capric, 4% oleic, 4% palmitic, 2% linoleic, 4% myristic, and 3% lauric acids (Evangelista & Manthey, 2004; Gesch et al., 2005; Kim et al., 2011).
Recent seed increases in Cuphea provided sufficient amounts of seed to conduct oil extraction studies and, at the same time, produce much needed oil for product development and applications testing. The first report on full press oil extraction from Cuphea seeds was also optimized in a pilot-scale study (Evangelista & Cermak, 2007). Oil extracted by pilot plant screw pressing of whole Cuphea seeds produced dark green colored oil. Chlorophyll content of the oil, ranging from 200-260 ppm, had been reported, but levels up to 326 ppm have recently been observed (Evangelista & Cermak, 2007). About 6.5-8% bleaching clay had been used in the bleaching step to bring the chlorophyll level in the refined oil to 0.5 ppm. Aside from the added cost of the bleaching clay, more oil is also lost as these adsorbents retain between 50-75% their weight of oil. With a supply of cuphea oil a series of new products could be developed from this new oil or corresponding fatty acids ranging from biodiesel (Geller et al., 1999), to cosmetics (Brown et al., 2008) to lubricants (Cermak & Isbell, 2004a,b; Cermak et al., 2008).
3.2 Estolides
Estolides have been used to help develop new products from industrial crops (Cermak & Isbell, 2001b). Estolides are formed by the formation of a carbocation that can undergo nucleophilic addition with or without carbocation migration along the length of the chain. The carboxylic acid functionality of one fatty acid links to the site of unsaturation of another fatty acid to form oligomeric esters. The extent of oligomerization is reported by estolide number (EN) which is defined as the average number of fatty acids added to the base fatty acid. The estolide carboxylic acid functionality can be converted in situ under esterification conditions with the addition of an alcohol to yield the corresponding estolide ester (Fig. 9).
Estolides from a number of fatty acids have been shown to have desirable low-temperature properties (Cermak & Isbell, 2001a,b; Isbell et al., 2000a) making them suitable for lubricants. However, the current market price of meadowfoam precludes its use in these markets.
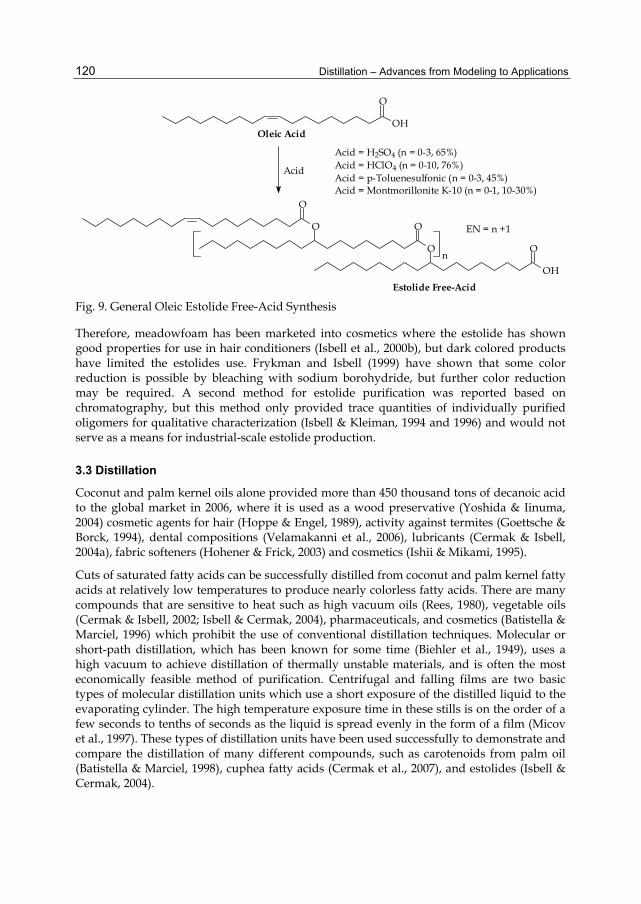
Distillation – Advances from Modeling to Applications 120
O
OHOleic Acid
O
O
O
O
OH
On
Acid
Estolide Free-Acid
Acid = H2SO4 (n = 0-3, 65%)Acid = HClO4 (n = 0-10, 76%)Acid = p-Toluenesulfonic (n = 0-3, 45%)Acid = Montmorillonite K-10 (n = 0-1, 10-30%)
EN = n +1
Fig. 9. General Oleic Estolide Free-Acid Synthesis
Therefore, meadowfoam has been marketed into cosmetics where the estolide has shown good properties for use in hair conditioners (Isbell et al., 2000b), but dark colored products have limited the estolides use. Frykman and Isbell (1999) have shown that some color reduction is possible by bleaching with sodium borohydride, but further color reduction may be required. A second method for estolide purification was reported based on chromatography, but this method only provided trace quantities of individually purified oligomers for qualitative characterization (Isbell & Kleiman, 1994 and 1996) and would not serve as a means for industrial-scale estolide production.
3.3 Distillation
Coconut and palm kernel oils alone provided more than 450 thousand tons of decanoic acid to the global market in 2006, where it is used as a wood preservative (Yoshida & Iinuma, 2004) cosmetic agents for hair (Hoppe & Engel, 1989), activity against termites (Goettsche & Borck, 1994), dental compositions (Velamakanni et al., 2006), lubricants (Cermak & Isbell, 2004a), fabric softeners (Hohener & Frick, 2003) and cosmetics (Ishii & Mikami, 1995).
Cuts of saturated fatty acids can be successfully distilled from coconut and palm kernel fatty acids at relatively low temperatures to produce nearly colorless fatty acids. There are many compounds that are sensitive to heat such as high vacuum oils (Rees, 1980), vegetable oils (Cermak & Isbell, 2002; Isbell & Cermak, 2004), pharmaceuticals, and cosmetics (Batistella & Marciel, 1996) which prohibit the use of conventional distillation techniques. Molecular or short-path distillation, which has been known for some time (Biehler et al., 1949), uses a high vacuum to achieve distillation of thermally unstable materials, and is often the most economically feasible method of purification. Centrifugal and falling films are two basic types of molecular distillation units which use a short exposure of the distilled liquid to the evaporating cylinder. The high temperature exposure time in these stills is on the order of a few seconds to tenths of seconds as the liquid is spread evenly in the form of a film (Micov et al., 1997). These types of distillation units have been used successfully to demonstrate and compare the distillation of many different compounds, such as carotenoids from palm oil (Batistella & Marciel, 1998), cuphea fatty acids (Cermak et al., 2007), and estolides (Isbell & Cermak, 2004).

Distillation of Natural Fatty Acids and Their Chemical Derivatives 121
At the USDA laboratory, estolides and new crop fatty acids have been distilled on both the Myers Lab 3 and Myers Pilot 15 molecular distillation units (Myers Vacuum, Kittanning, PA), the simpler of the two being the Myers Lab 3 (diagram illustrating the operational features of this unit is presented in Fig. 10). The condenser temperature can be set to the desired temperature, rotor speed was constant at 1725 rpm, and cold tap water was used to cool the diffusion pump and rotor bearing. Vacuum pressure is usually maintained at 6x10⁻⁴ – 3x10⁻³ mm Hg at both the chamber and foreline pressure sensors.
Residue FlaskDistillate Flask
Mechanical Pump
Foreline PressureSensor
Chamber Pressure SensorFeed Reservoir Degas Valve
Feed ReservoirMetering Valve
Heated Rotor
Diffusion Pump
Condenser
Feed Reservoir
Fig. 10. Schematic diagram of Myers Lab 3 short path molecular distillation unit
The more complex unit, a Myers Pilot-15 distillation unit (Fig. 11), was used for pilot scale distillations (Cermak & Isbell, 2002). It is a continuous, centrifugal 38.1 cm molecular still that contains all of the components needed for distilling raw feedstock. Raw feedstock is delivered with a metering valve and a gear pump. It first enters a degasser unit which is maintained at pressures between 5.4x10⁻³ – 6.8x10⁻² mm Hg. It then enters the heated evaporator cone or distillation chamber, where the molecular distillation takes place. The distillate and residue are continuously removed by transfer pumps. The material is passed to and from each station through stainless steel transfer lines, which are traced with heating tapes. This unit was designed for use in extended or large scale distillations of ~50 gals/day.
The major component of the Myers Pilot-15 distillation unit is a concave, heated evaporator cone, which rotates within the distillation chamber and is maintained at pressures as low as <6.8x10⁻⁵ mm Hg (Fig. 12). Degassed and/or stripped feedstock is metered by the feed pump into the center of the spinning evaporator cone (1700 rpm) and is spread rapidly and evenly outward in a thin film over the entire surface by centrifugal forces. As the film spreads and is heated, part of the feedstock reaches a temperature at which it vaporizes and
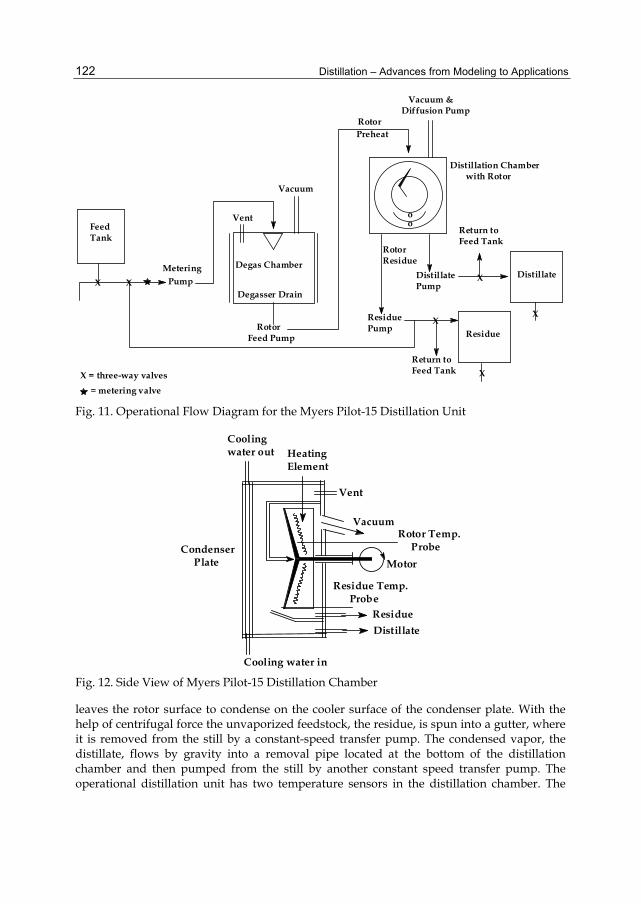
Distillation – Advances from Modeling to Applications 122
Feed Tank
Pump
Distillation Chamber with Rotor
Distillate
Residue
Degas Chamber
ResiduePump Rotor
Feed Pump
DistillatePump
oo
XX
X
X
X
X
Return toFeed Tank
Return toFeed Tank
Metering
X = three-way valves
Vacuum
Vacuum & Diffusion Pump
= metering valve
RotorPreheat
RotorResidue
Degasser Drain
Vent
Fig. 11. Operational Flow Diagram for the Myers Pilot-15 Distillation Unit
Vacuum
Motor
Cooling water out
Condenser Plate
ResidueDistillate
Cooling water in
HeatingElement
Residue Temp. Probe
Rotor Temp. Probe
Vent
Fig. 12. Side View of Myers Pilot-15 Distillation Chamber
leaves the rotor surface to condense on the cooler surface of the condenser plate. With the help of centrifugal force the unvaporized feedstock, the residue, is spun into a gutter, where it is removed from the still by a constant-speed transfer pump. The condensed vapor, the distillate, flows by gravity into a removal pipe located at the bottom of the distillation chamber and then pumped from the still by another constant speed transfer pump. The operational distillation unit has two temperature sensors in the distillation chamber. The

Distillation of Natural Fatty Acids and Their Chemical Derivatives 123
first sensor, which monitors the temperature of the rotor, is located by the electric heating elements just beneath the 38.1 cm rotor. This first temperature corresponds to the temperature of the heating element, not the temperature of the rotor. The actual temperature of the rotor can be varied by varying the flow of feed material without affecting the element temperature. The second and most important temperature sensor measures the temperature of the residue. This sensor is located in the gutter where the residue is collected during distillation. The residue sensor provides the closest temperature of the rotor, since it is a measurement of the temperature of the material that was just in contact with the rotor.
All the transfer lines and pumps are wrapped with heating tapes. The heating tape and electrical elements are controlled with digital controllers either based on percent power demand or actual measured temperature. Each region of the transfer line and pump has internal temperature probes that measure the temperature of the material as it passes the sensors.
These two distillation units common to industrial processes have allowed new crop fatty acids and products to be distilled at levels acceptable for industrial purposes. These materials have than been used in commercial products such as cosmetics (Brown et al., 2008; Isbell et al., 2000b) and lubricants (Cermak & Isbell, 2004a,b; Cermak et al., 2008).
3.3.1 Cuphea
Estolides have been previously synthesized by USDA’s National Laboratory in Peoria, IL, from C10:0 decanoic acid, cuphea oil, Table 1 (Cermak & Isbell, 2004a). These estolides have useful properties as lubricants based on the physical properties exhibited by these C10:0 materials. An issue associated with the decanoic estolides is the color of the final product. Commercial decanoic acid is not as refined as other mid-chain fatty acids, so removal of the color bodies is necessary for light colored estolides. The measurement of the color of a material is designated as the Gardner color. The Gardner color scale is from 1 to 18 with 1 containing the least amount of color and 18 with the maximum amount of color. Lubricant manufacturers and consumers would prefer lubricants with colors similar to current petroleum oils, lower numbers i.e. Gardner 1 to 3. To obtain these properties, the starting material must be distilled, which is costly and can lead to undesired additional color bodies with certain distillation techniques. The ability to achieve a fast and mild distillation of short-chain fatty acids could be used to obtain oil with low Gardner color while the residue would not be darkened by the distillation process. These improvements with decanoic acid would help with the commercialization of cuphea as a new oil seed and give US farmers a valuable rotation crop. This studies objective was to investigate the general conditions necessary for laboratory molecular distillation of decanoic acid or enrichment from cuphea fatty acids. Fatty acid profiles, Gardner colors, and flow rate requirements were examined to determine the best set of operating conditions.
The basic experimental conditions for the two different flow rates, high and low, over eight different rotor temperature settings, their effects on split ratio determined by mass, Gardner colors, and percent short saturated fatty acids are reported in Table 3. The split ratios of the high and low flow rates across the rotor are similar (Fig. 13A). However, as the rotor temperature was increased to 110°C and greater, the split ratios increased with the lower flow rate. The increased mass in the distillate fraction would be expected at the lower flow
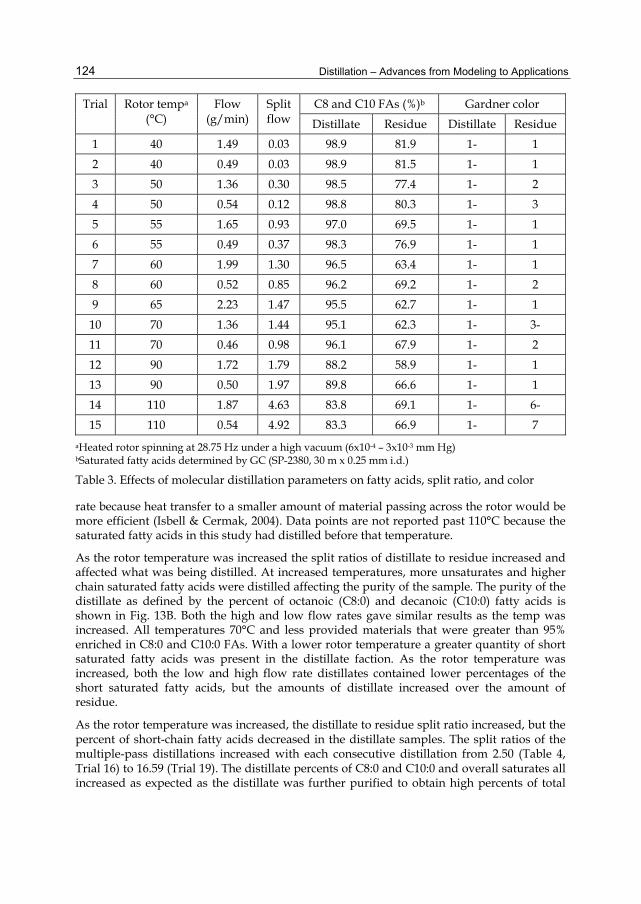
Distillation – Advances from Modeling to Applications 124
Trial Rotor tempa (°C)
Flow (g/min)
Split flow
C8 and C10 FAs (%)b Gardner color Distillate Residue Distillate Residue
1 40 1.49 0.03 98.9 81.9 1- 1 2 40 0.49 0.03 98.9 81.5 1- 1 3 50 1.36 0.30 98.5 77.4 1- 2 4 50 0.54 0.12 98.8 80.3 1- 3 5 55 1.65 0.93 97.0 69.5 1- 1 6 55 0.49 0.37 98.3 76.9 1- 1 7 60 1.99 1.30 96.5 63.4 1- 1 8 60 0.52 0.85 96.2 69.2 1- 2 9 65 2.23 1.47 95.5 62.7 1- 1 10 70 1.36 1.44 95.1 62.3 1- 3- 11 70 0.46 0.98 96.1 67.9 1- 2 12 90 1.72 1.79 88.2 58.9 1- 1 13 90 0.50 1.97 89.8 66.6 1- 1 14 110 1.87 4.63 83.8 69.1 1- 6- 15 110 0.54 4.92 83.3 66.9 1- 7
aHeated rotor spinning at 28.75 Hz under a high vacuum (6x10⁻⁴ – 3x10⁻³ mm Hg) bSaturated fatty acids determined by GC (SP-2380, 30 m x 0.25 mm i.d.)
Table 3. Effects of molecular distillation parameters on fatty acids, split ratio, and color
rate because heat transfer to a smaller amount of material passing across the rotor would be more efficient (Isbell & Cermak, 2004). Data points are not reported past 110°C because the saturated fatty acids in this study had distilled before that temperature.
As the rotor temperature was increased the split ratios of distillate to residue increased and affected what was being distilled. At increased temperatures, more unsaturates and higher chain saturated fatty acids were distilled affecting the purity of the sample. The purity of the distillate as defined by the percent of octanoic (C8:0) and decanoic (C10:0) fatty acids is shown in Fig. 13B. Both the high and low flow rates gave similar results as the temp was increased. All temperatures 70°C and less provided materials that were greater than 95% enriched in C8:0 and C10:0 FAs. With a lower rotor temperature a greater quantity of short saturated fatty acids was present in the distillate faction. As the rotor temperature was increased, both the low and high flow rate distillates contained lower percentages of the short saturated fatty acids, but the amounts of distillate increased over the amount of residue.
As the rotor temperature was increased, the distillate to residue split ratio increased, but the percent of short-chain fatty acids decreased in the distillate samples. The split ratios of the multiple-pass distillations increased with each consecutive distillation from 2.50 (Table 4, Trial 16) to 16.59 (Trial 19). The distillate percents of C8:0 and C10:0 and overall saturates all increased as expected as the distillate was further purified to obtain high percents of total

Distillation of Natural Fatty Acids and Their Chemical Derivatives 125
40 50 60 70 80 90 100 110
0.0
0.5
1.0
1.5
2.0
2.5
3.0
3.5
4.0
4.5
5.0
5.5
6.0
Low flow rate High flow rate
Split
ratio
Rotor temperature (oC)
40 50 60 70 80 90 100 11080
82
84
86
88
90
92
94
96
98
100 Low flow rate High flow rate
C-8
and
C-1
0 fa
tty a
cid
(%)
Rotor temperature (oC)
Fig. 13. A) Effect of rotor temperature on split ratio or B) Effect of rotor temperature on C8:0 and C10:0 fatty acids
Trial Distillation Split Flow
Ratio Fatty acid (%)a (pass) 8:0 10:0 12:0 14:0 16:0 18:0 18:1 18:2
16 First 2.50 0.8 89.8 3.1 3.0 1.6 0.0 1.0 0.6 17 Second 11.33 0.7 91.4 3.0 2.6 1.2 0.0 0.6 0.4 18 Third 15.50 0.7 92.4 2.9 2.4 0.9 0.0 0.4 0.3 19 Fourth 16.59 0.6 92.9 2.9 2.2 0.8 0.0 0.4 0.2 20 Fifth 11.79 0.6 93.8 2.7 2.0 0.6 0.0 0.2 0.0
aDetermined by GC (SP-2380, 30 m x 0.25 mm i.d.) and standard deviation < + 0.10
Table 4. Fatty acid profile of distillate distillations at 70°C
saturates (99.8 %, Trial 19). The fatty acid profile for the multiple-pass distillation is shown in Table 4. After the first pass (Trial 16), stearic and linolenic fatty acids were removed and each additional pass started to remove the linoleic and oleic fatty acids. The final pass yielded a material that contained only 0.2% oleic as the only unsaturation in the fraction.
Single-pass distillation is the simplest and least expensive mode of distillation, but some applications require additional distillations to achieve difficult separations. Separating materials that are very close in molecular weight or have very similar boiling points can require multiple-pass distillations. One of the main reasons for performing single or multiple-pass distillations is to aid in the removal of color bodies. All the cuphea FA distillates had very excellent Gardner colors of 1-, which is the lowest color rating (Table 3). The residues varied in the amount of color bodies in the samples depending on whether the residue was a single or multiple-pass distillation. A multiple-pass distillation of a distillate is prime example to explore the removal of color bodies. The first distillation gave a distillate with a Gardner color of 1-, however, when that material was re-distilled, the residue led to a Gardner color of 6+ (Cermak et al., 2007). Each consecutive distillation had higher split flow

Distillation – Advances from Modeling to Applications 126
rates and showed that most of the material was being distilled. This increase was expected as only small amounts of saturates and/or color bodies were left to be removed with each distillation. This multiple-pass distillate would be very desirable for very color sensitive applications.
With the Myers 3 being primarily a laboratory molecular distillation unit, one of the main goals was to have a high throughput while collecting quality saturated material. This equipment would meet these high throughput conditions when the rotor temperature was set to 65°C with a high flow rate of 2.2 g/min while maintaining a distillate to residue split ratio of about 1.5 as demonstrated in Table 3 (Trial 9). The distillate produced would contain high percents of C8:0 and C10:0 as well as no unsaturates. The Gardner color values were excellent under these conditions as well. Thus, cuphea fatty acids were effectively separated with the Myers 3 lab-scale centrifugal molecular distillation unit.
3.3.2 Meadowfoam
Previous studies of meadowfoam oil and the corresponding fatty acids have resulted in several novel compounds, i.e., estolides (Isbell & Kleiman, 1994 and 1996) and lactones (Isbell & Cermak, 2001). Meadowfoam estolides have cosmetic applications as they improve conditioning, shine, and comb-out compared with existing conditioners (Isbell et al., 2000b). One of the biggest problems with meadowfoam estolides is their color. Ideally, cosmetic ingredients should be colorless (Gardner=0). Crude meadowfoam fatty acids are very dark (Gardner=15+), which leads to very dark estolides (Gardner=18+). If crude meadowfoam fatty acids could be purified to a low Gardner color at a low cost, this would lead to a lower colored estolide and eliminate post-distillation decolorization (Frykman & Isbell, 1999). Color improvements in meadowfoam estolide and fatty acids would help the commercialization of this new oil seed and give US farmers a valuable rotation crop.
Crude mixtures of meadowfoam fatty acids were separated using a Myers Pilot-15 molecular centrifugal distillation unit. A series of conditions were examined to identify the optimum operating conditions including: rotor temperature, degas temperature, rotor preheat, and flow to the rotor (Cermak & Isbell, 2002). The main heating source for the distillation unit is the rotor element, which is located beneath the rotor and can range anywhere from room temperature to 800°C (Fig. 12). Thus, the easiest place to make a significant impact on heat available for distillation is in the distillation chamber. A set of conditions where the rotor temperature was varied while other system conditions remained constant is shown in Table 5. The flow rate of the feed stock was set at 100 g/min. The rotor temperature was changed from 275 to 475°C as the data points were collected. As the temperature increased, the distillate to residue ratio also increased, which was expected. At a rotor temperature of 475 °C, most of the material was distilled and only a small fraction was collected as residue. With the increased temperature, color bodies also distilled. The Gardner color for the distillation products with varying rotor temperature are reported in Table 5. The 475°C distillation had a Gardner color of 4, whereas the ideal Gardner color is 1.
The increased rotor temperature, unfortunately, maximized the amount of distilled material at the sacrifice of color. The fatty acid profile of both the residue and distillate are reported in Table 5. The crude meadowfoam main components were 5-eicosenoic acid (59.9%), 5,13-docosadienoic acid (17.3%), 5-docosenoic acid (4.3%), and 13-docosenoic acid (11.9%). The distillation at a rotor temperature of 425°C resulted in the closest percent composition to the

Distillation of Natural Fatty Acids and Their Chemical Derivatives 127
Rotor Temp
C20:1 (%)
C22:1 (%)
C22:2 (%)
Gardner color
°C Δ5-d Δ5-r Δ5-d Δ5-r Δ13-d Δ13-r Δ5,13-d Δ5,13-r Distillate S.M. 59.9 4.3 17.3 11.9 15 275 72.0 56.9 2.0 4.9 5.8 13.4 10.1 18.9 3 325 69.2 54.1 2.6 5.6 7.3 15.3 11.9 20.2 1 375 69.6 40.1 2.8 7.4 7.9 20.2 12.9 26.1 1 400 63.2 38.2 3.4 8.9 9.4 23.7 14.6 27.1 1 425 59.7 35.0 4.3 7.1 12.0 19.4 17.4 23.8 1 475 59.2 35.2 4.4 6.6 18.0 18.0 17.5 21.9 4
Table 5. Fatty acid profile - varying rotor temperature
crude meadowfoam fatty acids. Different ratios of fatty acids were distilled depending on the rotor temperature. For the two rotor temperature extremes of 275 and 475°C, the amount of 5-eicosenoic acid was enriched in the distillate to 72.0% at 275°C from 59.2%, whereas the 5,13-docosadienoic acid was enriched in the distillate to 17.5% at the upper temperature of 475°C from 10.1%.
Meadowfoam fatty acids were effectively separated by a Myers Pilot-15 molecular distillation unit. The precise distillation conditions were determined by varying conditions to obtain material that was light in color, Gardner color of 1. Conditions were then chosen to minimize high energy demands on any one element of the system. The varying conditions described were used to determine the ideal distillation conditions (Cermak & Isbell, 2002). All of the conditions played a vital role in conducting a successful distillation. The rotor temperature and flow rate had the greatest impact on the Gardner color and the fatty acid composition of the distillate. After the ideal conditions were determined, an additional larger volume (95 L) of meadowfoam fatty acids was distilled to verify the conditions.
Additionally, meadowfoam estolides can be distilled on the Myers Lab 3 (Fig. 10) to separate the monoestolides (EN=1) and polyestolides (EN>1) (Fig. 9). Table 6 shows experimental conditions for two flow rates over seven different temperature settings and their effect on split ratio, which was determined by mass. The split ratio for both high and low flow rates across the rotor are similar. However, at the low flow rate (0.32 g/min) and high temperatures (300°C), the split ratio is nearly twice that of the high flow rate (1.79 g/min). The increased mass in the distillate fraction would be expected at the lower flow rate because heat transfer to a smaller amount of material passing across the rotor would be more efficient. However, these higher split ratios lowers monoestolide purity which decreases beyond 275°C (Fig. 14). The highest distillate purity occurs for both the low and high flow rates at 200°C (Fig. 14). At 325°C, splatter from the feed stock bumping as it comes into contact with the hot rotor became a significant problem and contaminated the distillate. Therefore, the sample at high flow rate at 325°C was not collected.
Myers Lab 3 distillation unit proved effective. Color from the distillate was effectively removed from the monoestolide fraction with a Gardner color of 1 for those fractions below 250°C (Table 6). This corresponds well with the optimum distillation temperature of 225°C.

Distillation – Advances from Modeling to Applications 128
Set point Temperature (°C)
Isolated mass (g)
Rate Split ratio
Gardner color
(°C) Rotor Distillate Residue Distillate (g/min) Residue Distillate Low flow rate
175 174 29.3 0.9 19.2 1.01 0.05 12 1 200 201 29.4 2.4 15.9 0.92 0.15 12 1 225 226 29.8 2.7 12.9 0.78 0.21 12 1 250 249 29.9 3.6 9.5 0.66 0.38 12 1 275 274 29.8 5.2 9.5 0.74 0.55 12 4 300 299 30.1 3.0 3.3 0.32 0.91 12 5 325 322 30.2 8.1 6.2 0.72 1.31 12 6
High flow rate 175 174 29.7 4.0 39.9 2.20 0.10 12 3 200 198 29.5 7.6 34.2 2.09 0.22 13 1 225 225 30.2 7.5 31.0 1.93 0.24 14 3 250 248 30.5 8.7 18.7 1.37 0.47 14 4 275 274 29.7 8.2 20.2 1.42 0.41 14 4 300 299 30.4 13.8 21.9 1.79 0.63 14 6
Table 6. Effect of Myer Lab 3 distillation parameters on split and color
160 200 240 280 32040
60
80
100
Low Flow Rate
High Flow Rate
Mon
oest
olid
e (%
)
Temperature (oC) Fig. 14. Effect of rotor temperature on monoestolide composition in distillate fraction
Higher temperatures show degradation in color values as a result of co-distillation and splatter from the color bodies found in the polyestolide fraction. This color improvement from the starting material (Gardner color of 12) should greatly enhance the value of this material for cosmetic applications where product color is an important factor.
Distillation of Natural Fatty Acids and Their Chemical Derivatives 129
4. Fatty acid alkyl ester derivatives Industrially, mono-alkyl fatty acid esters can be prepared by reacting fat and oil triglycerides with an alcohol using akaline-catalyzed interesterification (alcoholysis) or from the direct esterification of fatty acids (Farris, 1979; Sonntag, 1982). Although a variety of alcohols can be utilized, fatty acid methyl esters (FAME) prepared using methanol are most common based on price and availability. These fatty acid esters not only serve as specialty chemicals but are also used extensively in various oleochemical processes as intermediates to produce fatty alcohols, alkanolamides, and -sulfonated methyl esters (Gervajio, 2005; Gunstone et al., 2007a). Additionally, fatty acid esters, particularly fatty acid methyl esters, are used extensively for the burgeoning biodiesel industry (mono-alkyl esters of long-chain fatty acids derived from vegetable oils or animal fats).
4.1 Distillation
With regards to distillation, mono-alkyl fatty acid esters have several significant advantages when compared to the distillation of fatty acids (Budde, 1968; Farris, 1979). Because the acid moiety is in the ester form, the fatty acid esters are less corrosive. Therefore, expensive corrosion resistant equipment may not be necessary. Since the ester group cannot participate in hydrogen bonding the esters have lower boiling points, are oftentimes easier to fractionate, and require less energy for their fractionation, Table 2. As can be seen from Table 2, the esters tend to boil approximately 30°C below their corresponding fatty acids. As a result of the two aforementioned properties, the esters are also less susceptible to color formation, decarboxylation and degradation during the distillation. Finally, the fatty acid methyl esters are more ameneable to fractional distillation and separation since they follow Raoult’s law more closely than their corresponding fatty acids, which show significant deviation from Raoult’s law making it difficult to fractionally distill and separate fatty acids differing by two carbon atoms in chain length (Budde, 1968; Markley, 1964).
Careful control of the distillation parameters allows the advantages inherent to the fatty acid esters to be exploited and used advantageously especially when attempting to fractionate thermolabile materials such as highly unsaturated esters derived from marine oils. Fractional distillation has been performed for some time on a variety of saturated and highly unsaturated fatty acid ester mixtures at reduced pressures on the laboratory scale as a method to purify fatty acid esters. Early reports examined the separation of various fatty acid methyl esters of corn (Baughman & Jamieson, 1921), sunflower (Baughman & Jamieson, 1922b), soybean (Baughman & Jamieson, 1922a), and menhaden oils (Brown & Beal, 1923) by fractional distillation into their various components. Later spinning band columns improved distillation fractionation; for example, Weitkamp (1945) reported the isolation of 32 compounds into four main compound classes (fatty acids, 2-hydroxy acids, and two types of branched iso and anteiso acids) from wool wax by distilling fatty acid methyl esters. Privett and coworkers (1959) distilled several fractions of methyl esters derived from pork liver lipids. Fractional distillation of unsaturated C20 esters from rapeseed (Haeffner, 1970) and herring oil methyl esters (Ackman et al., 1973) have also been reported. Methyl docosahexaenoate (C22:6) was fractionated from a fatty acid methyl ester mixture derived from tuna oil using spinning band distillation at a pressure of 0.025-0.030 mm Hg (Privett et al., 1969). Unique to this method, an amplified distillation process was used, wherein a mixture of carrier components based on long chain acetates (3 g myristyl, 7 g palmitoleyl, 7

Distillation – Advances from Modeling to Applications 130
g oleyl, 5 g of 11-eicosenoyl, and 3 g erucyl acetates) was employed to facilitate the fractionation of minor components and minimize artifacts arising from C22:6 methyl ester degradation by keeping the distillation temperature from rising sharply during fractionation. The carrier acetates were present in two-to three-fold excess over the fatty acid methyl esters and were chosen to have a range of boiling points covering that of the sample, not form azeotropes and could be separated easily with any sample components. Distillation gave fractions containing mixtures of the enriched methyl esters and acetates. These separate fractions containing the desired methyl esters and carrier acetates were then saponified to give long chain alcohols (from carriers) which were extracted from the soaps as nonsaponifiable matter. The sodium acetate was converted to acetic acid by acidification and separated from the desired fatty acids by extraction with distilled water. By this method a cut of tuna oil containing 84% C22:6 was obtained.
The development of molecular distillation techniques characterized by short exposure of the sample to high temperatures, short path length for the distillate, and high vacuum led to better column efficiencies. Many reports on the molecular distillation of fatty acid esters from sunflower and soybean esters (Pramparo et al., 2005), rapeseed fatty acid esters and tocopherols (Jiang et al., 2006), eicosapentaenoic (EPA) and docosahexaenoic acid ethyl esters (Brevik et al., 1997), and squid visceral oil ethyl esters (Liang & Hwang, 2000; Rossi et al., 2011) have been reported. Vázquez and Akoh (2010) reported a detailed study on the fractionation of short and medium chain fatty acid ethyl esters via short-path distillation that were obtained from a blend of coconut oil and dairy fat. They examined feed rates, temperatures, and single or multiple steps. They were able to obtain fractions containing a high purity of specific fatty acid ethyl esters with a desired composition and yield.
On an industrial scale, a recent set of patents describe a continuous process (~2,000 kg/h) whereby fractional distillation of palm kernel fatty acid methyl esters is done to produce technical grade oleic acid methyl esters (~75 wt%) containing low levels of saturated methyl palmitate (< 5 wt%) and methyl stearate (<2 wt%) (Heck et al., 2000; Heck et al., 2005). This method avoids additional crystallization steps currently used by other processes. The resulting enriched methyl oleate fraction could then be reduced to obtain the corresponding unsaturated fatty alcohols. In this process, the starting palm kernel methyl esters are first fractionally distilled to separate the C8-C14 esters from the C16-C18 esters. The bottom C16-C18 ester fraction is subsequently fractionally distilled to separate the C18 esters (saturated and unsaturated) from the C16 esters. Finally, the C18 esters are fractionally distilled to obtain an enriched C18 unsaturated fraction (methyl oleate) while reducing the saturated C18 ester (methyl stearate) to less than 2 wt%.
A 1999 patent describes the large scale fractional distillation of rapeseed methyl esters, among other fats and oil esters, to obtain a colorless fraction enriched in C22 (behenic) methyl esters with low acid value and purity of at least 86 wt% (Kenneally et al., 1999). The starting rapeseed methyl esters composition was C16-3.5%, C18-38.0%, C20-9.7%, C22-47.4%, C24-1.4%. Batch fractional distillation at 232-274°C of the rapeseed methyl esters using a packed column with 10 theoretical stages, overhead condenser, receiver, and vacuum pump operating between 5-25 mm Hg gave a 32% yield of the C22 methyl ester cut containing 92.6% C22 and 1.8% C18.
The explosive growth of the biodiesel industry has focused attention on mono-alkyl esters of long-chain fatty acids. Typically, biodiesel is comprised of fatty acid methyl esters, although

Distillation of Natural Fatty Acids and Their Chemical Derivatives 131
ethyl, propyl, butyl esters, etc. might be used for either B100 or blending applications. Because various esters may be used and these higher esters likely have boiling points higher than the methyl esters, focus on the distillation characteristics of these fatty acid esters with regards to biodiesel specifications are important. Accordingly, Schober and coworkers (2010) have examined the distillation characteristics for a series of fatty acid ethyl esters derived from various feedstock following ASTM D1160 specifications. They found the ethyl esters exceeded the maximum limit set for in the ASTM specifications which has important implications for higher esters to be used as biodiesel.
4.2 Reactive distillation
Reactive distillation has been known since the 1920‘s but has gotten renewed interest in recent years. The complexities of reactive distillation have been thoroughly reviewed (Malone & Doherty, 2000; Sharma & Singh, 2010; Taylor & Krishna, 2000). Reactive distillation is the simultaneous implementation of reaction and distillation within a single column unit, whereby the reactants are converted to products in a reaction zone in the presence of catalyst with simultaneous distillation of the products and recycling of unused reactants to the reaction zone (Doherty & Buzad, 1992; Kiss et al. 2008, Malone & Doherty, 2000; Omota et al., 2001; Omota et al., 2003ab; Sharma & Singh, 2010; Taylor & Krishna, 2000). A diagram comparing a conventional reaction and distillation process to a reactive distillation process is shown in Fig. 15.
Briefly, as seen in Fig 15a., the reaction in the presence of catalyst takes place in a separate reactor. The crude products are transferred to a sequence of distillation columns are required to produce pure C and D by the conventional process. The unreacted components, A and B, are recycled back to the reactor. In contrast, Fig 15b shows that by combining the reaction and distillation operations, A and B continuously react in the reaction zone while products C and D are removed from A and B in the rectifying and stripping sections at the top and bottom, respectively (Taylor, & Krishna, 2000). This technique can reach 100% conversion and potentially minimize operational and equipment costs and decrease waste energy. Reactive distillation is especially suited for the chemical reactions limited by thermodynamic and equilibrium constraints, since one or more of the products of the reaction are continuously separated from the reactants (Kiss, 2011; Nguyen & Demirel, 2011).
With regards to fatty acid ester production and purification, and more specifically to large scale production of biodiesel, it would appear that reactive distillation could provide an efficient and integrated approach to obtain the desired fatty acid esters. However, to date most studies have focused on computer aided modeling, simulation and economics of reactive distillation to produce fatty acid alkyl esters (Bhatia et al., 2007; Kiss, 2011; Kiss et al., 2006; Nguyen & Demirel, 2011; Omota et al., 2001; Omota et al., 2003ab) while more recent experimentally based studies are not as prevalent (Bhatia et al., 2006; He et al., 2006; Silva et al., 2010; Steinigeweg & Gmehling, 2003).
Steinigeweg and Gmehling (2003) reported the development of a reactive distillation process for the pilot plant production of decanoic acid methyl esters. The reaction was catalyzed heterogeneously using a strong acidic ion-exchange resin and supported by structured corrugated wire mesh sheets (Katapak-S) in the columns and reaction parameters such as
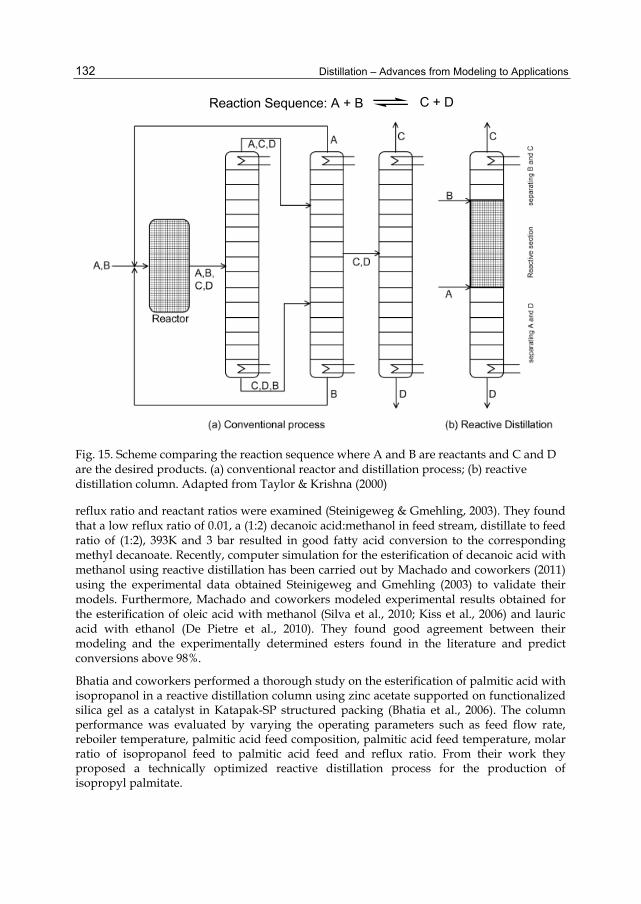
Distillation – Advances from Modeling to Applications 132
Reaction Sequence: A + B C + D
Fig. 15. Scheme comparing the reaction sequence where A and B are reactants and C and D are the desired products. (a) conventional reactor and distillation process; (b) reactive distillation column. Adapted from Taylor & Krishna (2000)
reflux ratio and reactant ratios were examined (Steinigeweg & Gmehling, 2003). They found that a low reflux ratio of 0.01, a (1:2) decanoic acid:methanol in feed stream, distillate to feed ratio of (1:2), 393K and 3 bar resulted in good fatty acid conversion to the corresponding methyl decanoate. Recently, computer simulation for the esterification of decanoic acid with methanol using reactive distillation has been carried out by Machado and coworkers (2011) using the experimental data obtained Steinigeweg and Gmehling (2003) to validate their models. Furthermore, Machado and coworkers modeled experimental results obtained for the esterification of oleic acid with methanol (Silva et al., 2010; Kiss et al., 2006) and lauric acid with ethanol (De Pietre et al., 2010). They found good agreement between their modeling and the experimentally determined esters found in the literature and predict conversions above 98%.
Bhatia and coworkers performed a thorough study on the esterification of palmitic acid with isopropanol in a reactive distillation column using zinc acetate supported on functionalized silica gel as a catalyst in Katapak-SP structured packing (Bhatia et al., 2006). The column performance was evaluated by varying the operating parameters such as feed flow rate, reboiler temperature, palmitic acid feed composition, palmitic acid feed temperature, molar ratio of isopropanol feed to palmitic acid feed and reflux ratio. From their work they proposed a technically optimized reactive distillation process for the production of isopropyl palmitate.

Distillation of Natural Fatty Acids and Their Chemical Derivatives 133
Using a laboratory scale continuous flow reactive distillation apparatus, He, Singh, & Thompson, (2006) examined a combined process which used a conventional pre-reactor coupled to a reactive distillation column to convert canola oil into its corresponding fatty acid methyl esters, Fig. 16.
Fig. 16. Schematic of reactive distillation reactor system used to convert canola oil into its corresponding fatty acid methyl esters (He et al., 2006)
Reaction parameters such as methanol:canola oil, feed rate of canola oil and potassium hydroxide catalyst, and temperature were examined for runs with and without the pre-reactor. A 95% conversion with a 94% yield (esters contained 1.1%, 2.0%, and 2.0% mono-, di-, and triglyceride, respectively) was obtained using a column temperature of 65°C and a 4:1 methanol:canola oil molar ratio with the pre-reactor. They were able to reduce reaction times 10 to 15 times while also reducing methanol consumption by 66% over conventional biodiesel processes.
Recently, Brazilian researchers used a pre-reactor (with sodium hydroxide catalyst) coupled to a reactive distillation column in a semi-batch system to examine the preparation of fatty acid methyl esters from soybean oil and bioethanol (Silva et al., 2010). They used experimental design to optimize the catalyst concentration (from 0.5 wt% to 1.5 wt %) and the ethanol/soybean oil molar ratio (from 3:1 to 9:1). The reactive column reflux rate was 83 ml/min, and the reaction time was 6 min. Their best conversion to esters was 98.18 wt% with 0.65 wt% of sodium hydroxide, ethanol/soybean oil molar ratio of 8:1, and reaction time of 6 min. The reaction time of 6 min means: 1 min in the pre-reactor and 5 min in the reactive distillation column.
A recently patent published application demonstrated a process to produce mixed fatty acid esters with a variety of heterogeneous catalysts. Again, a pre-reactor coupled to a reactive distillation column was used (Asthana et al., 2009). Crude fatty acid methyl esters are first prepared in the pre-reactor much like a conventional biodiesel process. After a crude separation of glycerol and other components the fatty acid methyl esters are transferred to the reactive distillation column where they undergo further reaction with different alcohols
Distillation – Advances from Modeling to Applications 134
from 2-8 carbon atoms to give a fatty acid alkyl ester mixture upon exiting the reactive distillation column.
Although the results described above are promising and represent good first steps toward implementation of reactive distillation for fatty acid ester production, as concluded by Taylor and Krishna in their 2000 review on reactive distillation, and with particular focus towards production and separation of fatty acid esters, they state:
…There is a crying need for research in this area. It is perhaps worth noting here that modern tools of computational fluid dynamics could be invaluable in developing better insights into hydrodynamics and mass transfer in RD columns. Besides more research on hydrodynamics and mass transfer, there is need for more experimental work with the express purpose of model validation…
There remains more work to be done in the use of reactive distillation to produce and purify fatty acid alkyl esters.
5. References Ackelsberg, O.J. (1958). Fat splitting. J. Am. Oil Chem. Soc. Vol.35, pp. 635-640, ISSN 0003-
021X Ackman, R.G., Ke, P.J., & Jangaard, P.M. (1973). Fractional vacuum distillation of herring oil
methyl esters. J. Am. Oil Chem. Soc. Vol.50, pp. 1-8, ISSN 0003-021X Asthana, N.S., Miller, D.J., Lira, C.T., & Bittner, E. (2009). Process for producing mixed esters
of fatty acids as biofuels. U.S. Patent Application 2009/0126262 Barnebey, H. & Brown, A.C. (1948). Continuous fat splitting plants using the Colgate-Emery
process. J. Am. Oil Chem. Soc. Vol.25, pp. 95-99, ISSN 0003-021X Batistella, C.B. & Maciel, M.R.W. (1996). Modeling, simulation and analysis of molecular
distillators: centrifugal and falling film. Computers & Chem. Eng. Vol.20, pp. S19-S24, ISSN 0098-1354
Batistella, C.B. & Maciel, M.R.W. (1998). Recovery of carotenoids from palm oil by molecular distillation. Computers & Chem. Eng. Vol.22, pp. S53-S60, ISSN 0098-1354
Baughman, W.F. & Jamieson, G.S. (1921). The chemical composition of corn oil. J. Am. Chem. Soc. Vol.43, pp. 2696-2702, ISSN 1520-5126
Baughman, W.F. & Jamieson, G.S. (1922a). The chemical composition of soya bean oil. J. Am. Chem. Soc. Vol.44, pp. 2947-2952, ISSN 1520-5126
Baughman, W.F. & Jamieson, G.S. (1922b). The chemical composition of sunflower-seed oil. J. Am. Chem. Soc. Vol.44, pp. 2952-2957, ISSN 1520-5126
Berger, R. & McPherson, W. (1979). Fractional distillation. J. Am. Oil Chem. Soc. Vol.56, pp. 743-744, ISSN 0003-021X
Bhatia, S., Ahmad, A.L., Mohamed, A.R., & Chin, S.Y. (2006). Production of isopropyl palmitate in a catalytic distillation column: Experimental studies. Chem. Eng. Sci. Vol.61, pp. 7436-7447, ISSN 0009-2509
Bhatia, S., Mohamed, A.R., Ahmad, A.L., & Chin, S.Y. (2007). Production of isopropyl palmitate in a catalytic distillation column: Comparison between experimental and simulation studies, Computers & Chem. Eng. Vol.31, pp. 1187-1198, ISSN 0098-1354
Biehler, R.M., Hickman, K.C.D., & Perry, E.S. (1949). Small laboratory centrifugal molecular still. Anal. Chem. Vol.21, pp. 638-640, ISSN 0003-2700

Distillation of Natural Fatty Acids and Their Chemical Derivatives 135
Brevik, H., Haraldsson, G.G., & Kristinsson, B. (1997). Preparation of highly purified concentrates of eicosapentaenoic acid and docosahexaenoic acid. J. Am. Oil Chem. Soc. Vol.74, pp. 1425-1429, ISSN 0003-021X
Brown, J.B. & Beal G.D. (1923). The highly unsaturated fatty acids of fish oils. J. Am. Chem. Vol.45, pp. 1289-1303, ISSN 1520-5126
Brown, J.H., Kleiman, R., Hill, J., Koritala, S., & Lotts, K. (2008). Cosmetic and topical compositions comprising cuphea oil and derivatives thereof. May 7, 2008. European Patent Application EP 1,916,988
Budde, W.M., Jr. (1968) General physical and chemical properties of fatty acids, In: Fatty Acids and Their Industrial Applications. Pattison, E.S. pp. 47-76, Marcel Dekker, Inc. ISBN 0318165236, New York, New York
Cermak, S.C., Biresaw, G., & Isbell, T.A. (2008). Comparison of a new estolide oxidative stability package. J. Am. Oil Chem. Soc. Vol.85, pp. 879-885, ISSN 0003-021X
Cermak, S.C. & Isbell, T.A. (2001a). Synthesis of estolides from oleic and saturated fatty acids. J. Am. Oil Chem. Soc. Vol.78, pp. 557-565, ISSN 0003-021X
Cermak, S.C. & Isbell, T.A. (2001b). Biodegradable oleic estolide ester having saturated fatty acid end group useful as lubricant base stock. November 13, 2001. U.S. Patent 6,316,649 B1
Cermak, S.C. & Isbell, T.A. (2002). Pilot-plant distillation of meadowfoam fatty acids. Ind. Crops Prod. Vol.15, pp. 145-154, ISSN 0926-6690
Cermak, S.C. & Isbell, T.A. (2004a). Synthesis and physical properties of Cuphea-oleic estolides and esters. J. Am. Oil Chem. Soc. Vol.81, pp. 297-303, ISSN 0003-021X
Cermak, S.C. & Isbell, T.A. (2004b). Estolides - The next bio-based functional fluid. Inform. Vol.15, pp. 515-517, ISSN 0897-8026
Cermak, S.C., Isbell, T.A., Isbell, J.E., Akerman, G.G., Lowery, B.A., & Deppe, A.B. (2005). Batch drying of cuphea seeds. Ind. Crops Prod. Vol.21, pp. 353-359, ISSN 0926-6690
Cermak, S.C., John, A.L., & Evangelista, R.L. (2007). Enrichment of decanoic acid in Cuphea fatty acids by molecular distillation. Ind. Crops Prod. Vol.26, pp. 93-99, ISSN 0926-6690
De Pietre, M.K., Almeida, L.C.P., Landers, R., Vinhas, R.C.G., & Luna, F. J. (2010). H3PO4 and H2SO4 treated niobic acid as heterogeneous catalyst for methyl ester production. React. Kinet., Mech. Catal. Vol.99, pp. 269-280, ISSN 1878-5204
Dijkstra, A.J. & Segers, J.C. (2007). Production and refining of oils and fats, In: The Lipid Handbook with CD-ROM, Third Edition, Gunstone, F., Harwood, J.L., & Dijkstra, A.J. pp. 143-262, CRC Press, ISBN 0-8496-9688-3, Boca Raton, Florida
Doherty, M.F. & Buzad, G. (1992). Reactive distillation by design. Trans. IChemE Vol.70, Part A, pp. 448-458, ISSN 0957-5820
Evangelista, R.L. & Cermak, S.C. (2007). Full-press oil extraction of Cuphea (PSR23) seeds. J. Am. Oil Chem. Soc. Vol.84, pp. 1169-1175, ISSN 0003-021X
Evangelista, R.L. & Manthey, L.K. (2004). Protein and oil contents and fatty acid compositions of Cuphea PSR23 seeds. The American Chemical Society 36th Annual Great Lakes Regional Meeting Program and Abstracts. October 17-20, Peoria, IL, pp. 188
Farris, R.D. (1979). Methyl esters in the fatty acid industry. J. Am. Oil Chem. Soc. Vol.56, pp. 770A-773A, ISSN 0003-021X

Distillation – Advances from Modeling to Applications 136
Frykman, H.B. & Isbell, T.A. (1999). Decolorization of meadowfoam estolides using sodium borohydride. J. Am. Oil Chem. Soc. Vol.76, pp. 765-767, ISSN 0003-021X
Geller, D.P., Goodruma, J.W., & Knapp S.J. (1999). Fuel properties of oil from genetically altered Cuphea viscosissima. Ind. Crops Prod. Vol.9, pp. 85-91, ISSN 0926-6690
Gervajio, G.C. (2005). Fatty acids and derivatives from coconut oil, In: Bailey’s Industrial Oil and Fat Products, six volume set, sixth Edition, Shahidi, F. Vol. 6. pp. 1-56, John Wiley & Sons Inc., ISBN 978-0-471-38546-2, New York, New York
Gesch, R.W., Cermak, S.C., Isbell, T.A., & Forcella, F. (2005). Seed yield and oil content of Cuphea as affected by harvest date. Agron. J. Vol.97, pp. 817-822, ISSN 0926-6690
Goettsche, R. & Borck, H-A. (1994). Wood preservative compositions having activity against termites and fungi. U.S. Patent 5,276,029
Graham, S.A., Hirsinger, F., & Röbbelen, G. (1981). Fatty acids of Cuphea (lythraceae) seed lipids and their systematic significance. Am. J. Bot. Vol.68, pp. 908-917, ISSN 0002-9122
Gunstone, F.D. (2011). Non-food uses of vegetable oils. Lipid Technol. Vol.23, pp. 24, ISSN 1863-5377
Gunstone, F.D. & Norris, F. (1983). Lipids in Foods: Chemistry, Biochemistry and Technology, Pergamon Press, ISBN 0-08-025499-3, Oxford, England
Gunstone, F.D., Alander, J., Erhan, S.Z., Sharma, B.K., McKeon, T.A., & Lin, J.-T. (2007a). Nonfood uses of oils and fats, In: The Lipid Handbook with CD-ROM, Third Edition, Gunstone, F., Harwood, J.L., & Dijkstra, A.J. pp. 591-636, CRC Press, ISBN 0-8496-9688-3, Boca Raton, Florida
Gunstone, F.D., Harwood, J.L., & Dijkstra, A.J. (Eds.) (2007b). The Lipid Handbook with CD-ROM, Third Edition, CRC Press, ISBN 0-8496-9688-3, Boca Raton, Florida
de Guzman, D. (April 2009). Sizzling Fats and Oils, In: ICIS Chemical Business, 19.10.2011, Available from http://www.icis.com/Articles/2009/04/27/9209502/development-for-fats-and-oils-based-chemicals-rises.html
Haeffner, E.W. (1970). Separation of the C2O unsaturated fatty acids from rapeseed oil by countercurrent distribution. Lipids Vol.5, pp. 489-491, ISSN 1558-9307
Hamilton, C.R., Kirstein, D., & Breitmeyer, R.E. (2006). The Rendering industry’s biosecurity contribution to public and animal health, In: Essential Rendering: All About the Animal By-Products Industry, Meeker, D., pp. 82-94, Kirby Lithographic Company, Inc., ISBN 0-9654660-3-5, Arlington, VA, USA
He, B.B., Singh, A.P., & Thompson, J.C. (2006). A novel continuous-flow reactor using reactive distillation for biodiesel production. Trans. Am. Soc. Agric. Bio. Eng. Vol. 49, pp. 107-112 ISSN 0001-2351
Hardin, B. (1991). Cuphea - Plants with beautiful future - Industrial applications of Cuphea: Agricultural Research. September, pp 16-17, ISBN 0-16-009204-3
Heck, S., Winterhoff, V., Gutsche, B., Fieg, G., Mueller, U., Rigal, J., & Kapala, T. (2005). Method for producing technical oleic acid methyl esters. U.S. Patent Application 2005/0090676 A1
Heck, S., Klein, N., Komp, H.-D., Boehr, C., Huebner, N., & Westfechtel, A. (2000). Production of unsaturated coconut and/or palm kernel fatty alcohols, useful as chemical intermediates, e.g. for surfactants and skin care products, involves

Distillation of Natural Fatty Acids and Their Chemical Derivatives 137
fractionating lower alkyl ester twice and hydrogenating unsaturated fraction. Germany patent application DE 19912684 A1
Hill, K. (2000). Fats and oils as oleochemical raw materials. Pure Appl. Chem. Vol.72, pp. 1255-1264, ISSN 1365-3075
Hohener, A. & Frick, R. (2003). Fabric softener composition. U.S. Patent 6,583,105 B1 Hoppe, U. & Engel, W. (1989). Cosmetic agents for hair. U.S. Patent 4,839,165 Isbell, T.A., Abbott, T.P., Asadauskas, S., & Lohr, J.E. (2000a). Biodegradable oleic estolide
ester base stocks and lubricants. U.S. Patent 6,018,063 Isbell, T.A., Abbott, T.P., & Carlson, K.D. (1999). Oxidative stability index of vegetable oils in
binary mixtures with Meadowfoam oil. Ind. Crops Prod. Vol.9, pp. 115-123, ISSN 0926-6690
Isbell, T.A., Abbott, T.A., & Dworak, J.A. (2000b). Shampoos and conditioners containing estolides. U.S. Patent 6,051,214
Isbell, T.A. & Cermak, S.C. (2004). Purification of meadowfoam monoestolide from polyestolide. Ind. Crops Prod. Vol.19, pp. 113–118, ISSN 0926-6690
Isbell, T.A. & Cermak, S.C. (2001). Synthesis of delta-eicosanolactone and delta-docosanolactone directly from meadowfoam oil. J. Am. Oil Chem. Soc. Vol.78, pp. 527-531, ISSN 0003-021X
Isbell, T.A. & Kleiman, R. (1994). Characterization of estolides produced from the acid-catalyzed condensation of oleic acid. J. Am. Oil Chem. Soc. Vol.71, pp. 379–383, ISSN 0003-021X
Isbell, T.A. & Kleiman, R. (1996). Mineral acid-catalyzed condensation of Meadowfoam fatty acids into estolides. J. Am. Oil Chem. Soc. Vol.73, pp. 1097-1107, ISSN 0003-021X
Ishii, H. & Mikami, N. (1995). Preparation of n-(long-chain acyl)amino acid esters as moisture-holding agents and emulsifiers for cosmetics and skin medicaments. Japan Patent 93-263900
Jiang, S.T., Shao, P., Pan, L.J., & Zhao, Y.Y. (2006). Molecular distillation for recovering tocopherol and fatty acid methyl esters from rapeseed oil deodoriser distillate, Biosystems Engineering Vol.93, pp. 383-391, ISSN 1537-5110
Kenneally, C.J., Busch, G.A., & Gansmuller, E.W. (1999). A process for making high purity fatty acid lower alkyl esters. World Patent WO 9924387 A1
Kim, K-I., Gesch, R.G., Cermak, S.C., Phippen, W.B., Berti, M.T., Johnson, B.L., & Marek, L. (2011). Cuphea growth, yield, and oil characteristics as influence by climate and soil environments across the upper Midwest USA. Ind. Crops Prod. Vol.33, pp. 99-107, ISSN 0926-6690
Kiss, A.A. Dimian, A.C., & Rothenberg, G. (2008). Biodiesel by catalytic reactive distillation powered by metal oxides. Energy & Fuels Vol.22, pp. 598–604, ISSN 1520-5029
Kiss, A.A., Omota, F., Dimian, A.C., & Rothenberg, G. (2006). The heterogeneous advantage: biodiesel by catalytic reactive distillation. Top. Catal. Vol.40, pp. 141-150, ISSN 1022-5528
Kiss, A.A. (2011). Heat-integrated reactive distillation process for synthesis of fatty esters, Fuel Processing Technology Vol.92, pp. 1288-1296, ISSN 0378-3820
Knapp, S.J. (1993). Breakthrough towards the domestication of Cuphea, in new crops. J. Janick and J.E. Simon (eds), Wiley, New York, pp 372-379, ISBN 0–471–59374–5
Distillation – Advances from Modeling to Applications 138
Knothe, G. & Dunn, R.O. (2009). A comprehensive evaluation of the melting points of fatty acids and esters determined by differential scanning calorimetry. J. Am. Oil Chem. Soc. Vol.86, pp. 843-856, ISSN 0003-021X
Liang J.-H. & Hwang L. (2000). Fractionation of squid visceral oil ethyl esters by short-path distillation. J. Am. Oil Chem. Soc. Vol.77, pp. 773-777, ISSN 0003-021X
Lausberg, N., Josten, H., Fieg, G., Kapala, T., Christoph, R., Suessenbach, A., Heidbreder, A., Mrozek, I., & Schwerin, A. (2008). Process for obtaining fatty acids with improved odor, color and heat stability. U.S. Patent 7,449,088
Machado, G.D., Aranda, D.A.G., Castier, M., Cabral, V.F., & Cardozo-Filho, L. (2011). Computer simulation of fatty acid esterification in reactive distillation columns, Ind.Eng. Chem. Res. Vol.50, pp. 10176-10184, ISSN 1520-5045
Markley, K. S. (1964). Techniques of separation, In: Fatty Acids, Their Chemistry, Properties, Production and Uses, , 2nd edition, Part 3, Markley, K.S., pp. 2016-2071, Interscience Publishers, New York, New York, ISBN 60-10162
Malone, M.F. & Doherty, M.F. (2000). Reactive distillation, Ind. Eng. Chem. Res. Vol.39, pp. 3953-3957, ISSN 1520-5045
Marttinello, M.A., Leone, I., & Pramparo, M. (2008). Simulation of deacidification process by molecular distillation of deodorizer distillate. Lat. Am. appl. res. Vol.38, pp. 299-304, ISSN 0327-0793
Micov, M., Lutisan, J., & Cvengros, J. (1997). Balance equations for molecular distillation. Sep. Sci. Technol. Vol.32, pp. 3051-3066, ISSN 0149-6395
Miller, R.W., Earle, F.R., & Wolff, L.A. (1964). Search for new industrial oils. IX. Cuphea, a versatile source of fatty acids. J. Am. Oil Chem. Soc. Vol.41, pp. 279-280, ISSN 0003-021X
Mills, V. (1942). Process of distilling higher fatty acids. U.S. Patent 2,274,801 Molly, K. & Bruggeman, G. (2004). Medium chain fatty acids applicable as antimicrobial
agents December 15, 2004. European Patent EP 1,294,371 Muckerheide, V. (1952). Fat splitting and distillation. J. Am. Oil Chem. Soc. Vol.29, pp. 490-
495, ISSN 0003-021X Nagaoka, S. & Ibuki, M. (2000). Biodegradable lubricant base oil and its manufacturing
process. U.S. Patent 6,117,827 Nandi, S., Gangopadhyay, S., & Ghosh, S. (2004). Production of medium chain glycerides
and monolaurin from coconut acid oil by lipase-catalyzed reactions. J. Oleo. Sci. Vol.53, pp. 497-501, ISSN 1345-8957
Nguyen, N. & Demirel, Y. (2011). Using thermally coupled reactive distillation columns in biodiesel production. Energy Vol.36, pp. 4838-4847, ISSN 0360-5442
Norris, F. & Terry, D. (1945). Precise laboratory fractional distillation of fatty acid esters. J. Am. Oil Chem. Soc. Vol.22, pp. 41-46, ISSN 0003-021X
Nuns, J., Girault, A., & Rancurel, A. (1994). Molecular distillation apparatus having induction heating. U.S. Patent 5,334,290
O’Brien, R. (2004). Fats and Oils: Formulating and Processing for Applications (second edition), CRC Press, ISBN 0-8493-1599-9, Boca Raton, Florida, USA.
O’Brien, R., Farr, W., & Wan, P. (Eds.). (2000) Introduction to Fats and Oils Technology (second edition), AOCS Press, ISBN 1-893997-13-8, Champaign, Illinois, USA.

Distillation of Natural Fatty Acids and Their Chemical Derivatives 139
Omota F., Dimian A.C., & Bliek A. (2001). Design of reactive distillation process for fatty acid esterification. Computer Aided Chemical Engineering Vol.9, pp. 463-468, ISSN 0009-2509.
Omota F., Dimian A.C., & Bliek A. (2003a). Fatty acid esterification by reactive distillation: Part 2 - kinetics-based design for sulphated zirconia catalysts, Chem. Eng. Sci. Vol.58, pp. 3175-3185, ISSN 0009-2509
Omota F., Dimian A.C., & Bliek A. (2003b). Fatty acid esterification by reactive distillation. Part 1: Equilibrium-based design, Chem. Eng. Sci. Vol.58, pp. 3159-3174, ISSN 0009-2509
Phillips, B.E., Smith, C.R., & Tallent, W.H. (1971). Glycerides of Limnanthes douglasii seed oil. Lipids. Vol.6, pp. 93-99, ISSN 0024-4201
Potts, R.H (1956). Distillation of fatty acid. J. Am. Oil Chem. Soc. Vol.33, pp. 545-548, ISSN 0003-021X
Potts, R.H & White, F.B. (1953). Fractional distillation of fatty acids. J. Am. Oil Chem. Soc. Vol.30, pp. 49-53, ISSN 0003-021X
Pramparo, M., Prizzon, S., & Martinello, M.A. (2005). Estudio de la purificación de ácidos grasos, tocoferoles y esteroles a partir del destilado de desodorización. Grasas y Aceites Vol.56, pp. 228-234, ISSN 0017-3495
Privett, O.S., Weber, R.P. & Nickell, E.C. (1959). Preparation and properties of methyl pork liver. J. Am. Oil Chem. Soc. Vol.36, pp. 443-449, ISSN 0003-021X
Privett, O.S., Nadenicek, J.D., Pusch, F.J., & Nickell, E.C. (1969). Application of high vacuum fractional distillation to complex mixtures of methyl esters of polyunsaturated fatty acids. J. Am. Oil Chem. Soc. Vol.46, pp. 13-17, ISSN 0003-021X
Rees, G.J. (1980). Centrifugal molecular distillation - II. Chem. Eng. Sci. Vol.35, pp. 841-845, ISSN 0009-2509
Rossi, P.C., Pramparo, M., Gaich, M.C., Grosso, N.R., & Nepote, V. (2011). Optimization of molecular distillation to concentrate ethyl esters of eicosapentaenoic (20:5 ω-3) and docosahexaenoic acids (22:6 ω-3) using simplified phenomenological modeling. J. Sci. food Agric. Vol.91, pp. 1452-1458, ISSN 1097-0010
Ruston, N. (1952). Commercial uses of fatty acids. J. Am. Oil Chem. Soc. Vol.29, pp. 495-498, ISSN 0003-021X
Schober, S., Wolf, M., & Mittelbach, M. (2010). Distillation characteristics of fatty acid ethyl esters. Energy Fuels, Vol.24, pp. 6693-6695, ISSN 1520-5029
Sharma, N. & Singh, K. (2010). Control of reactive distillation column: a review. IJCRE Vol. 8, pp. R5,1-55, ISSN 1542-6580
Silva, N. L., Santander, C. M. G., Batistella, C. B., Maciel Filho, R., & Maciel, M. R. W. (2010). Biodiesel production from integration between reaction and separation system: reactive distillation process. Appl. Biochem. Biotechnol. Vol.161, pp. 245-254, ISSN 1559-0291
Sonntag, N.O. (1982). Fat splitting, esterification, and interesterification, In: Bailey’s Industrial Oil and Fat Products, Fourth Edition, Swern, D. Vol. 2. pp. 97-174, John Wiley & Sons Inc., ISBN 0-471-83958-2, New York, New York
Stage, H. (1984). Fatty acid fractionation by column distillation: Purity, energy consumption and operating conditions. J. Am. Oil Chem. Soc. Vol.61, pp. 204-214, ISSN 0003-021X
Steinigeweg, S. & Gmehling, J. (2003). Esterification of a fatty acid by reactive distillation. Ind. Eng. Chem. Res. Vol.42, pp. 3612-2319, ISSN 1520-5045

Distillation – Advances from Modeling to Applications 140
Stauffer, C. (1996). Fats & Oils. Eagan Press, ISBN 0-913250-90-2. St. Paul, Minnesota, USA. Taylor, R. & Krishna, R. (2000). Modelling reactive distillation. Chem. Eng. Sci. Vol.55, pp.
5183-5229, ISSN 0009-2509 Tholstrup, T., Ehnholm, C., Jauhiainen, M., Petersen, M., Høy, C., Lund, P., & Sandström, B.
(2004). Effects of medium-chain fatty acids and oleic acid on blood lipids, lipoproteins, glucose, insulin, and lipid transfer protein activities. Am J Clin Nutr. Vol.79, pp. 564-569, ISSN 0002-9165
Twitchell, E. (1898). Process of decomposing fats or oils into fatty acids and glycerine. U.S. Patent 601,603
Vázquez, L. & Akoh, C. (2010). Fractionation of short and medium chain fatty acid ethyl esters from a blend of oils via ethanolysis and short-path distillation. J. Am. Oil Chem. Soc. Vol.87, pp. 917-928, ISSN 0003-021X
Velamakanni, B.V., Mitra, S.B., Wang, D., Scholz, M.T., & Aasen, S.M. (2006). Hardenable antimicrobial dental compositions and methods. U.S. Patent Appl. 2006/0205838
Wecker, H. (1927). Process for separation of volatile substances. U.S. Patent 1,622,126 Weitkamp, A.W. (1945). The acidic constituents of degras. A new method of structure
elucidation, J. Am. Chem. Soc. Vol.67, pp. 447-454, ISSN 1520-5126 Wolf, R.B., Graham, S.A., & Kleiman, R. (1983). Fatty acid composition of Cuphea seed oils.
J. Am. Oil Chem. Soc. Vol.60, pp. 103-104, ISSN 0003-021X Yoshida, S. & Iinuma, M. (2004). Wood preservative. U.S. Patent 6,827,949 B2

6
Changes in the Qualitative and Quantitative Composition of Essential
Oils of Clary Sage and Roman Chamomile During Steam Distillation in Pilot Plant Scale
Susanne Wagner, Angela Pfleger, Michael Mandl and Herbert Böchzelt Joanneum Research Forschungsgesellschaft mbH Graz, Resources, Institute of Water, Energy and Sustainability, Department for Plant Materials Sciences and Utilisation
Austria
1. Introduction Clary sage (Salvia sclarea L.) from the genus Salvia is a biennial or short-living herbaceous perennial plant. Its leaves are united to a basal rosette in the first year, 12 to 25 cm long and 7 to 15 cm wide, ovate, cordate at the base, obtuse and long-stemmed. All the leaves are reticulate-rugose and hairy on both sides. The flowers seem loose to fairly dense, often branched paniculate. They reach approximately 2 cm and the large heart-shaped bracts are long, tapering and purple in early stages, later greenish white. Blossom: June or July to August. The seeds are 2 to 3 mm long nuts. Its native regions are the northern Mediterranean
Fig. 1. Clary sage
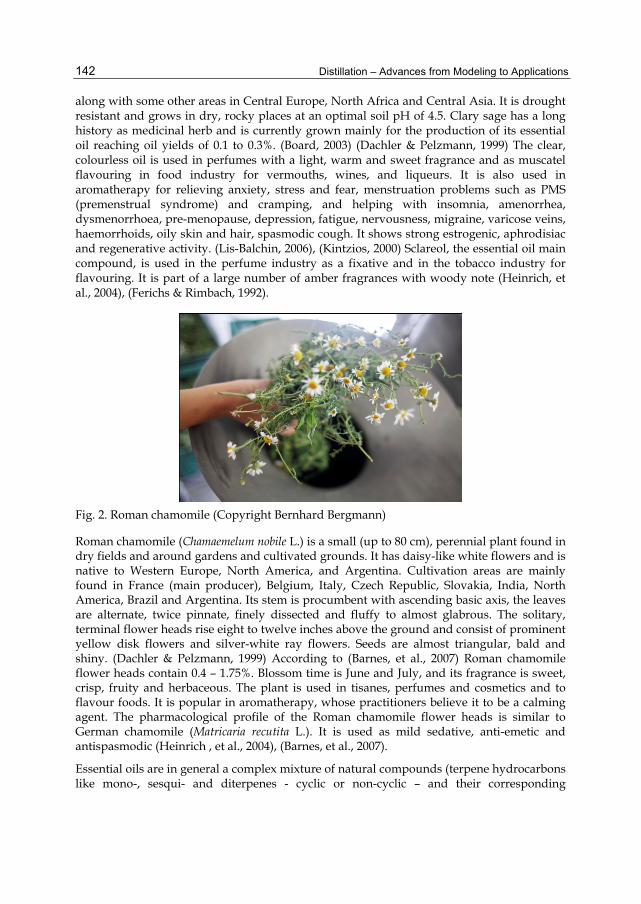
Distillation – Advances from Modeling to Applications 142
along with some other areas in Central Europe, North Africa and Central Asia. It is drought resistant and grows in dry, rocky places at an optimal soil pH of 4.5. Clary sage has a long history as medicinal herb and is currently grown mainly for the production of its essential oil reaching oil yields of 0.1 to 0.3%. (Board, 2003) (Dachler & Pelzmann, 1999) The clear, colourless oil is used in perfumes with a light, warm and sweet fragrance and as muscatel flavouring in food industry for vermouths, wines, and liqueurs. It is also used in aromatherapy for relieving anxiety, stress and fear, menstruation problems such as PMS (premenstrual syndrome) and cramping, and helping with insomnia, amenorrhea, dysmenorrhoea, pre-menopause, depression, fatigue, nervousness, migraine, varicose veins, haemorrhoids, oily skin and hair, spasmodic cough. It shows strong estrogenic, aphrodisiac and regenerative activity. (Lis-Balchin, 2006), (Kintzios, 2000) Sclareol, the essential oil main compound, is used in the perfume industry as a fixative and in the tobacco industry for flavouring. It is part of a large number of amber fragrances with woody note (Heinrich, et al., 2004), (Ferichs & Rimbach, 1992).
Fig. 2. Roman chamomile (Copyright Bernhard Bergmann)
Roman chamomile (Chamaemelum nobile L.) is a small (up to 80 cm), perennial plant found in dry fields and around gardens and cultivated grounds. It has daisy-like white flowers and is native to Western Europe, North America, and Argentina. Cultivation areas are mainly found in France (main producer), Belgium, Italy, Czech Republic, Slovakia, India, North America, Brazil and Argentina. Its stem is procumbent with ascending basic axis, the leaves are alternate, twice pinnate, finely dissected and fluffy to almost glabrous. The solitary, terminal flower heads rise eight to twelve inches above the ground and consist of prominent yellow disk flowers and silver-white ray flowers. Seeds are almost triangular, bald and shiny. (Dachler & Pelzmann, 1999) According to (Barnes, et al., 2007) Roman chamomile flower heads contain 0.4 – 1.75%. Blossom time is June and July, and its fragrance is sweet, crisp, fruity and herbaceous. The plant is used in tisanes, perfumes and cosmetics and to flavour foods. It is popular in aromatherapy, whose practitioners believe it to be a calming agent. The pharmacological profile of the Roman chamomile flower heads is similar to German chamomile (Matricaria recutita L.). It is used as mild sedative, anti-emetic and antispasmodic (Heinrich , et al., 2004), (Barnes, et al., 2007).
Essential oils are in general a complex mixture of natural compounds (terpene hydrocarbons like mono-, sesqui- and diterpenes - cyclic or non-cyclic – and their corresponding
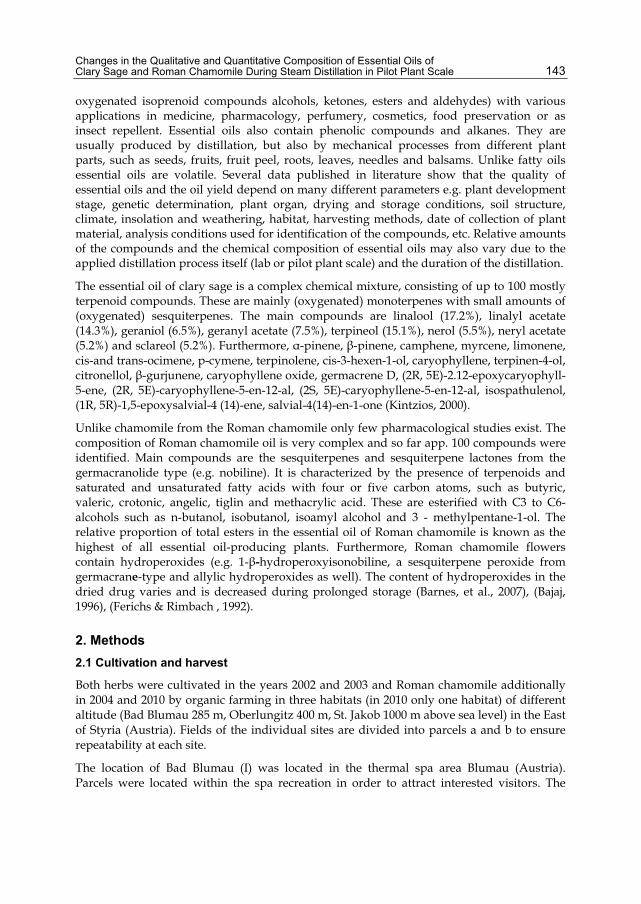
Changes in the Qualitative and Quantitative Composition of Essential Oils of Clary Sage and Roman Chamomile During Steam Distillation in Pilot Plant Scale 143
oxygenated isoprenoid compounds alcohols, ketones, esters and aldehydes) with various applications in medicine, pharmacology, perfumery, cosmetics, food preservation or as insect repellent. Essential oils also contain phenolic compounds and alkanes. They are usually produced by distillation, but also by mechanical processes from different plant parts, such as seeds, fruits, fruit peel, roots, leaves, needles and balsams. Unlike fatty oils essential oils are volatile. Several data published in literature show that the quality of essential oils and the oil yield depend on many different parameters e.g. plant development stage, genetic determination, plant organ, drying and storage conditions, soil structure, climate, insolation and weathering, habitat, harvesting methods, date of collection of plant material, analysis conditions used for identification of the compounds, etc. Relative amounts of the compounds and the chemical composition of essential oils may also vary due to the applied distillation process itself (lab or pilot plant scale) and the duration of the distillation.
The essential oil of clary sage is a complex chemical mixture, consisting of up to 100 mostly terpenoid compounds. These are mainly (oxygenated) monoterpenes with small amounts of (oxygenated) sesquiterpenes. The main compounds are linalool (17.2%), linalyl acetate (14.3%), geraniol (6.5%), geranyl acetate (7.5%), terpineol (15.1%), nerol (5.5%), neryl acetate (5.2%) and sclareol (5.2%). Furthermore, α-pinene, β-pinene, camphene, myrcene, limonene, cis-and trans-ocimene, p-cymene, terpinolene, cis-3-hexen-1-ol, caryophyllene, terpinen-4-ol, citronellol, β-gurjunene, caryophyllene oxide, germacrene D, (2R, 5E)-2.12-epoxycaryophyll-5-ene, (2R, 5E)-caryophyllene-5-en-12-al, (2S, 5E)-caryophyllene-5-en-12-al, isospathulenol, (1R, 5R)-1,5-epoxysalvial-4 (14)-ene, salvial-4(14)-en-1-one (Kintzios, 2000).
Unlike chamomile from the Roman chamomile only few pharmacological studies exist. The composition of Roman chamomile oil is very complex and so far app. 100 compounds were identified. Main compounds are the sesquiterpenes and sesquiterpene lactones from the germacranolide type (e.g. nobiline). It is characterized by the presence of terpenoids and saturated and unsaturated fatty acids with four or five carbon atoms, such as butyric, valeric, crotonic, angelic, tiglin and methacrylic acid. These are esterified with C3 to C6-alcohols such as n-butanol, isobutanol, isoamyl alcohol and 3 - methylpentane-1-ol. The relative proportion of total esters in the essential oil of Roman chamomile is known as the highest of all essential oil-producing plants. Furthermore, Roman chamomile flowers contain hydroperoxides (e.g. 1-β-hydroperoxyisonobiline, a sesquiterpene peroxide from germacrane-type and allylic hydroperoxides as well). The content of hydroperoxides in the dried drug varies and is decreased during prolonged storage (Barnes, et al., 2007), (Bajaj, 1996), (Ferichs & Rimbach , 1992).
2. Methods 2.1 Cultivation and harvest
Both herbs were cultivated in the years 2002 and 2003 and Roman chamomile additionally in 2004 and 2010 by organic farming in three habitats (in 2010 only one habitat) of different altitude (Bad Blumau 285 m, Oberlungitz 400 m, St. Jakob 1000 m above sea level) in the East of Styria (Austria). Fields of the individual sites are divided into parcels a and b to ensure repeatability at each site.
The location of Bad Blumau (I) was located in the thermal spa area Blumau (Austria). Parcels were located within the spa recreation in order to attract interested visitors. The

Distillation – Advances from Modeling to Applications 144
herbal plantation had been converted from a meadow and spa gardener took care of herbal test fields.
Agricultural fields of the family “Ocherbauer” in St. Jakob im Walde were site (II) of the project. As in Blumau a meadow was transformed into a field. The use of machineries for cultivation of herbal test areas was found difficult, because plantation was located on a steep slope.
Agricultural site (III) of the family “Oswald” is located in Oberlungitz. Agricultural areas are laid out in rows for simplifying organic farming cultivation.
Used eight parcels had 10 per 20 m each at the cultivation sites Bad Blumau and St. Jakob, thus covered a total area of 1600 m². In Oberlungitz plants were grown in rows with 4.5 m x 35 m and 4.5 m x 59 m respectively, yielding a total area of 1692 m².
Harvesting techniques differed at the three sites, because available machines and devices were different.
Plant material was harvested in different stages of development. A code for development stages based on the catalogue of codes for grain plants (“BBCH – scale”) was established (Meier, 2001). This catalogue was developed by the BBA (Federal Biological Research Centre for Agriculture and Forestry, Germany), the BSA (Protection and National Listing of new plant varieties, Germany), the IVA (Germany) and the IGZ (Institute of Vegetable and Ornamental Crops, Germany) and represents a code for the phenological development stages of mono- and dicotyledonous plants. The used herbs were characterised according to this code.
Clary sage is a biennial plant, which is harvested in the second year of cultivation, when the flowers are blooming. The optimum time for harvesting is June, since at that time the plant reaches the highest oil content. Moreover, in the period of 9 p.m. to 3 a.m., the highest oil yield can be achieved. Roman chamomile is harvested, when the florets wreath in the second third of the domed receptacle is already open. With increasing flowering process, the content of essential oil and chamazulene decrease. The characteristic blue colour is due to the formation of chamazulene in traces, which is formed from matricine by heating the oil. Delayed harvest may also lead to the disintegration of the flower heads. Harvest product should be the blooming chamomile heads (Dachler & Pelzmann, 1999).
For this project the entire herb of both plants was harvested in full bloom using bar- or power mower. For investigational reasons plant parts of clary sage were separated after harvest manually in order to compare the oil yield and composition of the essential oils gained by distillation of different plant parts. The vegetation progressing had been measured and documented regularly by taking several biomass yield samples at various stages; additionally sampling was done in order to document the total content of essential oil of the two herbs and their oil compositions. These data provided important information to determine the optimal harvest time, because the oil content depends on the plant development.
Plant height and inflorescence status of the herbs were noted and the samples were recorded photographically. The timing of sampling was based on the time of harvest.
According to the developed index (“BBCH scale”) clary sage was harvested at growth stage 6 (blossom) and the subsidiary stage 66 (beginning of the flowering of the side shoots).
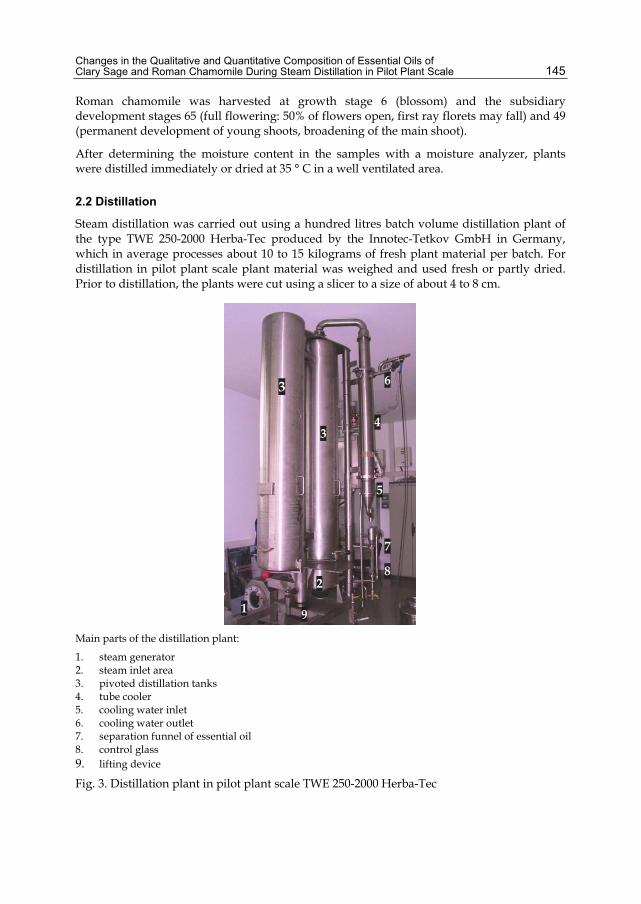
Changes in the Qualitative and Quantitative Composition of Essential Oils of Clary Sage and Roman Chamomile During Steam Distillation in Pilot Plant Scale 145
Roman chamomile was harvested at growth stage 6 (blossom) and the subsidiary development stages 65 (full flowering: 50% of flowers open, first ray florets may fall) and 49 (permanent development of young shoots, broadening of the main shoot).
After determining the moisture content in the samples with a moisture analyzer, plants were distilled immediately or dried at 35 ° C in a well ventilated area.
2.2 Distillation
Steam distillation was carried out using a hundred litres batch volume distillation plant of the type TWE 250-2000 Herba-Tec produced by the Innotec-Tetkov GmbH in Germany, which in average processes about 10 to 15 kilograms of fresh plant material per batch. For distillation in pilot plant scale plant material was weighed and used fresh or partly dried. Prior to distillation, the plants were cut using a slicer to a size of about 4 to 8 cm.
Main parts of the distillation plant:
1. steam generator 2. steam inlet area 3. pivoted distillation tanks 4. tube cooler 5. cooling water inlet 6. cooling water outlet 7. separation funnel of essential oil 8. control glass 9. lifting device Fig. 3. Distillation plant in pilot plant scale TWE 250-2000 Herba-Tec

Distillation – Advances from Modeling to Applications 146
Disintegration of plant material had three main reasons:
1. Smaller parts of plants are generally easier to handle than the whole herb. 2. For distillation a homogeneous plant material filling in the column should be achieved
avoiding cavities, which lead to shortcut steam flows. 3. The capacity of the distillation column is for cut plant material in general higher than for
uncut material, if stuffing is avoided. A special designed cutter was used to prevent any squeezing and pressing of the herbs during cutting to create a smooth, sharp cutting surface.
A gentle disintegration of plant material is of importance to avoid losses of essential oil.
The steam distillation unit consists of two cylindrical distillation tanks (inner diameter 25 cm, height 2 m), with a 100 litres volumetric capacity. The tanks are rotatable with a swinging sieve to be used separately to allow an alternating filling and distillation process. Thus a continuous batch distillation process can be realized.
The steam production is carried out in a separate, electrically powered steam generator outside the tanks. A constant steam flow of approximately 200 g steam per minute or 12 kg of steam per hour is supplied. This specific amount of steam was claimed by the producer as the optimum amount of operation in connection with the geometry of the tanks.
Fig. 4. Distillation processing steps
After the steam passed through the distillation column the condensation of the water/oil mixture takes place in a heat exchanger (cooler), which is traversed in counter current flow by the cooling water. Separation of the essential oil is carried out in a separation funnel device. By the geometry of the funnel flow conditions are created that support the floating
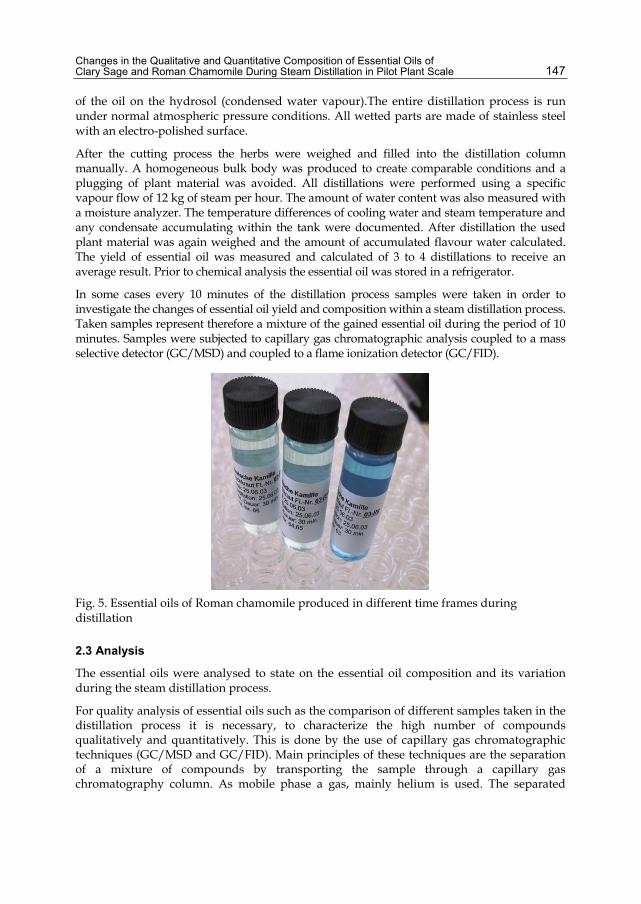
Changes in the Qualitative and Quantitative Composition of Essential Oils of Clary Sage and Roman Chamomile During Steam Distillation in Pilot Plant Scale 147
of the oil on the hydrosol (condensed water vapour).The entire distillation process is run under normal atmospheric pressure conditions. All wetted parts are made of stainless steel with an electro-polished surface.
After the cutting process the herbs were weighed and filled into the distillation column manually. A homogeneous bulk body was produced to create comparable conditions and a plugging of plant material was avoided. All distillations were performed using a specific vapour flow of 12 kg of steam per hour. The amount of water content was also measured with a moisture analyzer. The temperature differences of cooling water and steam temperature and any condensate accumulating within the tank were documented. After distillation the used plant material was again weighed and the amount of accumulated flavour water calculated. The yield of essential oil was measured and calculated of 3 to 4 distillations to receive an average result. Prior to chemical analysis the essential oil was stored in a refrigerator.
In some cases every 10 minutes of the distillation process samples were taken in order to investigate the changes of essential oil yield and composition within a steam distillation process. Taken samples represent therefore a mixture of the gained essential oil during the period of 10 minutes. Samples were subjected to capillary gas chromatographic analysis coupled to a mass selective detector (GC/MSD) and coupled to a flame ionization detector (GC/FID).
Fig. 5. Essential oils of Roman chamomile produced in different time frames during distillation
2.3 Analysis
The essential oils were analysed to state on the essential oil composition and its variation during the steam distillation process.
For quality analysis of essential oils such as the comparison of different samples taken in the distillation process it is necessary, to characterize the high number of compounds qualitatively and quantitatively. This is done by the use of capillary gas chromatographic techniques (GC/MSD and GC/FID). Main principles of these techniques are the separation of a mixture of compounds by transporting the sample through a capillary gas chromatography column. As mobile phase a gas, mainly helium is used. The separated

Distillation – Advances from Modeling to Applications 148
components leave the column due to different exchange mechanisms in the column at different times and are analyzed using special detectors. A frequently used detector is the flame ionization detector (FID), which is characterized by a high dynamic range for the universal detection of a large number of organic compounds. Because of this characteristic, this detector is often used in quantitative determinations. However, only limited information on the structure of the compounds is received. More specific information about the detected substances is provided by mass-selective detectors (MSD). The resulting mass spectra allow identification of chemical structures. By using the values of retention times, mass spectra and comparing results in literature and data bases, the chemical structure of a compound is detectable in most cases unambiguously.
Gas chromatographic method:
GC: Hewlett Packard 6890 GC system with integrated auto sampler MSD: Hewlett Packard 5973 Mass Selective Detector Column: J&W DB-5MS Capillary Column; Length: 30m; Diameter: 0.25 mm; Film thickness: 0.25 µm (non polar, coated with a phenyl arylene polymer – comparable to a 5% phenyl methyl polysiloxane column) Mobile phase gas: Helium Flow rate: 1 ml/min Split ratio: 20:1 Temperature program: 10 min at 50 °C, with 2 °C/min heated to 220 °C, 10 min hold at 220 °C Injection temperature: 220 °C Injection volume: 1 µl Temperature in Ion source: 250 °C Quadrupol temperature: 200 °C MS-Scan area: 20 - 350 m/z Temperature of FID detector: 250 °C
In this project compositions of the essential oils were determined by comparing the relative retention times of standards and mass spectra from data bases of oil compounds (Adams, NIST, WILEY). Progression and development of the qualitative composition and the relative amounts of the most predominant compounds (>2%) were examined. These are important factors for the pharmaceutical application of essential oils. The results provide the possibility to determine the composition of the oils or the optimised distillation time with the highest relative amount of the main compounds. In addition trends and correlations among these compounds will be shown.
3. Results 3.1 Clary sage (Salvia sclarea L.)
3.1.1 Oil yield
Clary sage could only be harvested in the year 2003, because it’s a biennial shrub. It shows big differences in essential oil yields in different parts of the plant - highest oil yields were obtained by distillation of the flowers. The oil yield of 7.9 ml/kg dry matter of the distillation of the flowers is 2.5 times higher than by distillation of the whole plant and 4.6 times higher than the distillation of stems (see figure 6).

Changes in the Qualitative and Quantitative Composition of Essential Oils of Clary Sage and Roman Chamomile During Steam Distillation in Pilot Plant Scale 149
Fig. 6. Oil yield of different plant parts of clary sage (DM…dry matter)
Distillations of the fresh whole plants indicated an oil yield of app. 60% (app. 6.0–7.0 ml/kg dry matter) after 20 minutes distillation. After 30 minutes app. 80% (8.5-9.5 ml/kg dry matter) were obtained. In the last 30 minutes only small oil yields were achieved. Figure 7 indicates the oil yield measured in between specified time frames (9.3 to 20 minutes, 30 to 40 minutes, 50 to 60 minutes).
Fig. 7. Oil yields for specific time frames during distillation of the whole plant of clary sage (DM…dry matter)
According to literature data 90% of oil yield was reached after 2 hours distillation time (Kintzios, 2000). The average oil yield of all three agricultural sites reached 7.9 to 9.8 ml/kg dry matter by distillation of the flowers (app. 0.8 to 1.0% oil yield) and by distillation of the whole plant app. 3 ml/kg dry matter (app. 0.3%). These results correspond to the range of the literature values of the essential oil yield of 0.1 to 0.3%.
For economic reasons and according to the results, a distillation time of the fresh plant of 40 minutes and for drug distillations of 30 minutes is recommended by the authors. After that time the oil content increases only slightly and a yield of 90 - 95% is satisfactory. One reason for the extremely high oil content of the distillations of the fresh plant in 2003 could
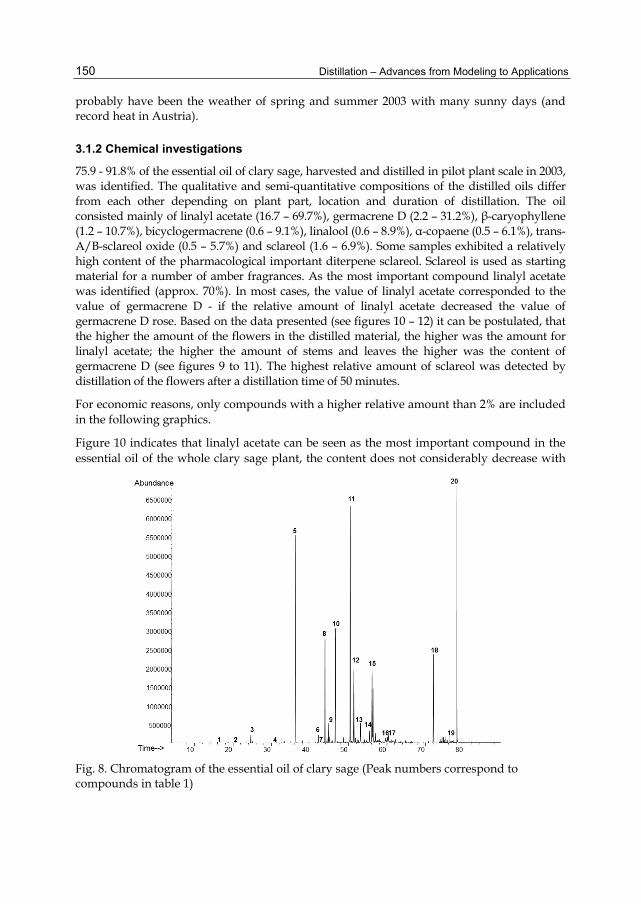
Distillation – Advances from Modeling to Applications 150
probably have been the weather of spring and summer 2003 with many sunny days (and record heat in Austria).
3.1.2 Chemical investigations
75.9 - 91.8% of the essential oil of clary sage, harvested and distilled in pilot plant scale in 2003, was identified. The qualitative and semi-quantitative compositions of the distilled oils differ from each other depending on plant part, location and duration of distillation. The oil consisted mainly of linalyl acetate (16.7 – 69.7%), germacrene D (2.2 – 31.2%), β-caryophyllene (1.2 – 10.7%), bicyclogermacrene (0.6 – 9.1%), linalool (0.6 – 8.9%), α-copaene (0.5 – 6.1%), trans-A/B-sclareol oxide (0.5 – 5.7%) and sclareol (1.6 – 6.9%). Some samples exhibited a relatively high content of the pharmacological important diterpene sclareol. Sclareol is used as starting material for a number of amber fragrances. As the most important compound linalyl acetate was identified (approx. 70%). In most cases, the value of linalyl acetate corresponded to the value of germacrene D - if the relative amount of linalyl acetate decreased the value of germacrene D rose. Based on the data presented (see figures 10 – 12) it can be postulated, that the higher the amount of the flowers in the distilled material, the higher was the amount for linalyl acetate; the higher the amount of stems and leaves the higher was the content of germacrene D (see figures 9 to 11). The highest relative amount of sclareol was detected by distillation of the flowers after a distillation time of 50 minutes.
For economic reasons, only compounds with a higher relative amount than 2% are included in the following graphics.
Figure 10 indicates that linalyl acetate can be seen as the most important compound in the essential oil of the whole clary sage plant, the content does not considerably decrease with
Fig. 8. Chromatogram of the essential oil of clary sage (Peak numbers correspond to compounds in table 1)
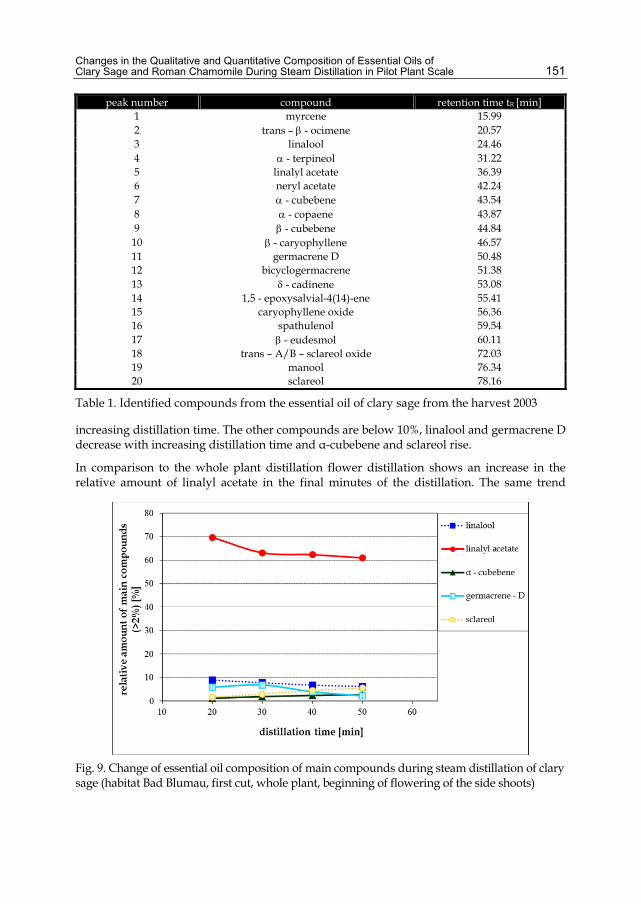
Changes in the Qualitative and Quantitative Composition of Essential Oils of Clary Sage and Roman Chamomile During Steam Distillation in Pilot Plant Scale 151
peak number compound retention time tR [min] 1 myrcene 15.99 2 trans – - ocimene 20.57 3 linalool 24.46 4 - terpineol 31.22 5 linalyl acetate 36.39 6 neryl acetate 42.24 7 - cubebene 43.54 8 - copaene 43.87 9 - cubebene 44.84 10 - caryophyllene 46.57 11 germacrene D 50.48 12 bicyclogermacrene 51.38 13 - cadinene 53.08 14 1,5 - epoxysalvial-4(14)-ene 55.41 15 caryophyllene oxide 56.36 16 spathulenol 59.54 17 - eudesmol 60.11 18 trans – A/B – sclareol oxide 72.03 19 manool 76.34 20 sclareol 78.16
Table 1. Identified compounds from the essential oil of clary sage from the harvest 2003
increasing distillation time. The other compounds are below 10%, linalool and germacrene D decrease with increasing distillation time and α-cubebene and sclareol rise.
In comparison to the whole plant distillation flower distillation shows an increase in the relative amount of linalyl acetate in the final minutes of the distillation. The same trend
Fig. 9. Change of essential oil composition of main compounds during steam distillation of clary sage (habitat Bad Blumau, first cut, whole plant, beginning of flowering of the side shoots)
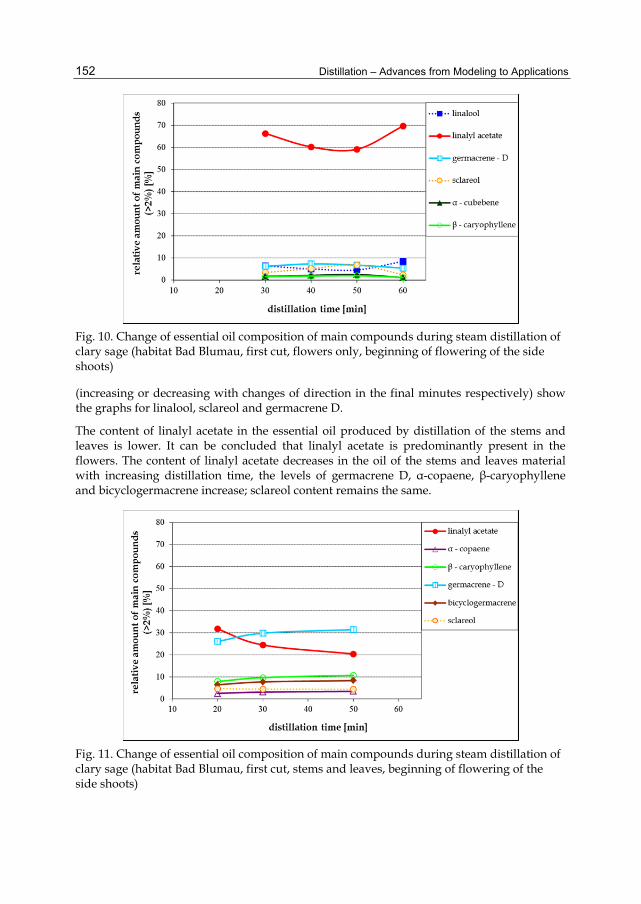
Distillation – Advances from Modeling to Applications 152
Fig. 10. Change of essential oil composition of main compounds during steam distillation of clary sage (habitat Bad Blumau, first cut, flowers only, beginning of flowering of the side shoots)
(increasing or decreasing with changes of direction in the final minutes respectively) show the graphs for linalool, sclareol and germacrene D.
The content of linalyl acetate in the essential oil produced by distillation of the stems and leaves is lower. It can be concluded that linalyl acetate is predominantly present in the flowers. The content of linalyl acetate decreases in the oil of the stems and leaves material with increasing distillation time, the levels of germacrene D, α-copaene, β-caryophyllene and bicyclogermacrene increase; sclareol content remains the same.
Fig. 11. Change of essential oil composition of main compounds during steam distillation of clary sage (habitat Bad Blumau, first cut, stems and leaves, beginning of flowering of the side shoots)
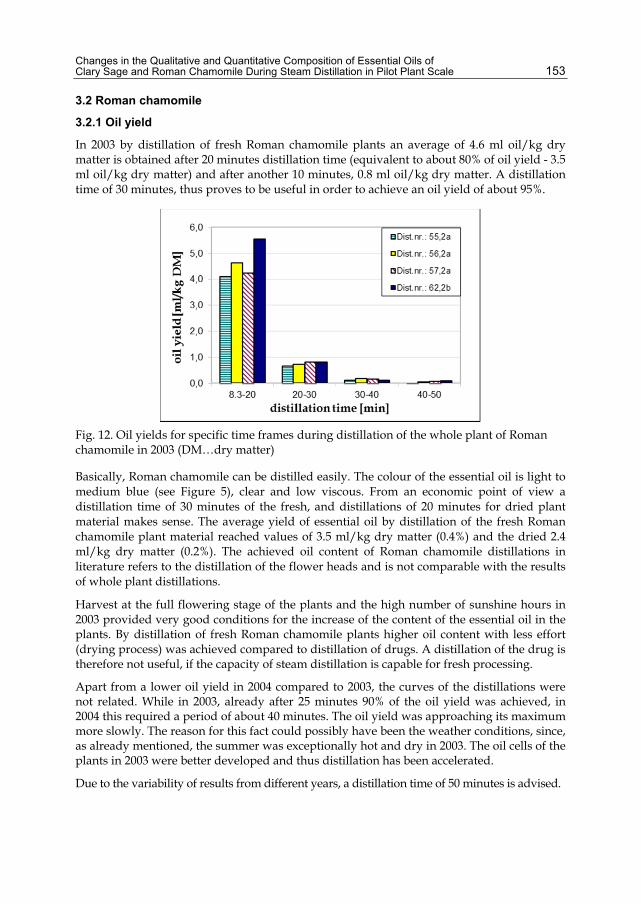
Changes in the Qualitative and Quantitative Composition of Essential Oils of Clary Sage and Roman Chamomile During Steam Distillation in Pilot Plant Scale 153
3.2 Roman chamomile
3.2.1 Oil yield
In 2003 by distillation of fresh Roman chamomile plants an average of 4.6 ml oil/kg dry matter is obtained after 20 minutes distillation time (equivalent to about 80% of oil yield - 3.5 ml oil/kg dry matter) and after another 10 minutes, 0.8 ml oil/kg dry matter. A distillation time of 30 minutes, thus proves to be useful in order to achieve an oil yield of about 95%.
Fig. 12. Oil yields for specific time frames during distillation of the whole plant of Roman chamomile in 2003 (DM…dry matter)
Basically, Roman chamomile can be distilled easily. The colour of the essential oil is light to medium blue (see Figure 5), clear and low viscous. From an economic point of view a distillation time of 30 minutes of the fresh, and distillations of 20 minutes for dried plant material makes sense. The average yield of essential oil by distillation of the fresh Roman chamomile plant material reached values of 3.5 ml/kg dry matter (0.4%) and the dried 2.4 ml/kg dry matter (0.2%). The achieved oil content of Roman chamomile distillations in literature refers to the distillation of the flower heads and is not comparable with the results of whole plant distillations.
Harvest at the full flowering stage of the plants and the high number of sunshine hours in 2003 provided very good conditions for the increase of the content of the essential oil in the plants. By distillation of fresh Roman chamomile plants higher oil content with less effort (drying process) was achieved compared to distillation of drugs. A distillation of the drug is therefore not useful, if the capacity of steam distillation is capable for fresh processing.
Apart from a lower oil yield in 2004 compared to 2003, the curves of the distillations were not related. While in 2003, already after 25 minutes 90% of the oil yield was achieved, in 2004 this required a period of about 40 minutes. The oil yield was approaching its maximum more slowly. The reason for this fact could possibly have been the weather conditions, since, as already mentioned, the summer was exceptionally hot and dry in 2003. The oil cells of the plants in 2003 were better developed and thus distillation has been accelerated.
Due to the variability of results from different years, a distillation time of 50 minutes is advised.

Distillation – Advances from Modeling to Applications 154
Fig. 13. Comparison of approximated oil recovery curves for the whole plant distillation of Roman chamomile in 2003 and 2004
By comparing the relative oil yields for the last two years the recovery curve is significantly different. One reason for the inhomogeneous curves from 2004 may have been the defective water dosing pump. The water supply had to be operated manually in this year, which might have led to fluctuations in the amount of steam. Apart from the already described different distillation maxima of 2004 and 2003, different heights of the curves can be recognized.
In 2003 Roman chamomile plants were harvested in full bloom and without any weeds, while in the cultivation year 2004 weeds proportion was high and the plants were harvested partially wet and prostrate. In summary, not only the weather, but also inflorescence, moisture and weeds are involved in the formation of the oil.
The distillation in 2010 differs from the distillation of the years 2003 and 2004. In the first cut 90% of the total oil yield was achieved after 20 minutes. The same distillation behaviour can be described for the second cut.
3.2.2 Chemical investigations
As the number of literature surveys on the Roman chamomile is scarce, few comparisons could be drawn to literature regarding the composition of the essential oil. In addition identification of compounds proved to be rather difficult, since the spectra exhibited many very similar esters, which are difficult to distinguish. As the composition also differed in the investigated years the following table is an example for the results of one investigation year (2003).
In both test series (fresh plant and drug material), the relative amounts of angelic acid 3-methylpentyl ester, 3-methyl-2-butenoic acid 3-methylbutyl ester, myrtenal and trans-pinocarveol increase, while the values for 3-methyl-2-butenoic acid pentadecyl ester, 3-methyl-2-butenoic acid cyclobutyl ester, 3-methyl 2-butenoic acid pentyl ester, α-pinene,

Changes in the Qualitative and Quantitative Composition of Essential Oils of Clary Sage and Roman Chamomile During Steam Distillation in Pilot Plant Scale 155
Fig. 14. Chromatogram of the essential oil of Roman chamomile (Peak numbers correspond to compounds in table 2)
peak number compound retention time tR [min] 1 isobutyl isobutyrate 10.13 2 - pinene 11.29 3 (E)-2-butenoic acid 2-methylpropyl ester 11.98 4 camphene 12.32 5 3-methacrylic acid-1-butene-4-yl-ester 13.27 6 - pinene 14.47 7 2 - methyl butanoic acid 2-isobutyl ester 17.02 8 isoamyl butyrate 17.85 9 isobutyric acid 3-methylbutyl ester 18.12 10 p - cymene 18.37 11 cyclopropane carboxylic acid 3-methylbutyl ester 20.08 12 3-methyl-2-butenoic acid pentadecyl ester 20.97 13 isobutyric acid 3-methyl-2-butenyl ester 21.54 14 3-methyl-2-butenoic acid cyclobutyl ester 22.28 15 butyl angelate 24.00 16 isoamyl 2-methylbutyrate 24.75 17 2-methyl-butanoic acid 2-methylbutyl ester 25.04 18 trans - pinocarveol 27.15 19 3-methyl-2-butenoic acid pentyl ester 28.54 20 3-methyl-2-butenoic acid 3-methylbutyl ester 28.85 21 6,6-dimethyl-2-methylene bicyclo[2,2,1]heptane-3-one 29.00 22 myrtenal 31.47 23 angelic acid 3-methylpentyl ester 36,07 24 germacrene-D 50,39
Table 2. Identified compounds from the essential oil of roman chamomile harvested in 2003

Distillation – Advances from Modeling to Applications 156
Fig. 15. Change of essential oil composition of main compounds during steam distillation of Roman chamomile (habitat Oberlungitz, first cut, fresh plant)
Fig. 16. Change of essential oil composition of main compounds during steam distillation of Roman chamomile (habitat Oberlungitz, first cut, drug)

Changes in the Qualitative and Quantitative Composition of Essential Oils of Clary Sage and Roman Chamomile During Steam Distillation in Pilot Plant Scale 157
6,6-dimethyl-2-methylene-bicyclo[2.2.1]heptane-3-one, isobutyl butyrate, isobutyric acid 3-methylbutyl ester and camphene decrease. 78.0 – 87.6% of the total Roman chamomile oil was identified and angelic acid 3-methylpentyl ester (8.4 - 19.3%), 3-methyl-2-butenoic acid pentadecyl ester (8.0 - 13.2%), α-pinene (3.8 - 12.2%), 3-methyl-2-butenoic acid 3-methylbutyl ester (7.0 - 11.6%), 3-methyl-2-butenoic acid cyclobutyl ester (6.6 - 10.2%), 3-methyl 2-butenoic acid pentyl ester (7.3 - 9.0%) and 6.6-dimethyl-2-methylene-bicyclo[2.2.1]heptane-3-one (2.5 - 6.1%) were identified as main compounds.
4. Conclusions Based on the sampling during the steam distillation process of the two essential oils changes in the composition of the oils were observed during distillation. Thus, the achievable relative content of individual compounds of the essential oil depending on the plant (plant part) can be optimized. Additionally other plants and their essential oils were investigated. This might be of importance for future product developments, if specific essential oil compositions are required. In most cases the pilot plant scale distillation must not exceed 60 minutes distillation time, because after this period only very small amounts of essential oils are generated. That fact would not justify a longer distillation process for economic reasons.
5. Acknowledgment Following organizations have provided financial support which is thankfully acknowledged:
REG plus – Funding Regional Innovation (a Funding Programme of FFG - Austrian Research Promotion Agency)
EUREGIO Styria – co financed by the INTERREG IIIa Programme
6. References Bajaj, Y., 1996. Biotechnology in Agriculture and Forestry - Medicinal and aromatic plants. 37 ed.
s.l.:Springer. Barnes, J., Anderson, L. & Phillipson, J., 2007. Herbal Medicines. Third edition ed.
s.l.:Pharmaceutical Press. Board, N., 2003. The complete technology book of essential oils (aromatic chemicals). s.l.:Asia
Pacific Business Press Inc.. Dachler, M. & Pelzmann, H., 1999. Arznei- und Gewürzpflanzenanbau, - ernte und -aufbereitung.
s.l.:Österreichischer Agrarverlag. Ferichs, G. & Rimbach , E., 1992. Hagers Handbuch der pharmazeutischen Praxis: für Apotheker,
Arzneimittelhersteller, Drogisten, Ärzte und Medizinalbeamte. Berlin: Springer. Heinrich , M., Barnes , J., Gibbons, S. & Williamson, E., 2004. Fundamentals of Pharmacognosy
and Phytotherapy. s.l.:Elsevier Science. Kintzios, S., 2000. SAGE - The genus Salvia. s.l.:harwood academic publishers. Lis-Balchin, M., 2006. Aromatherapy science: a guide for healthcare professionals. London:
Pharmaceutical Press.
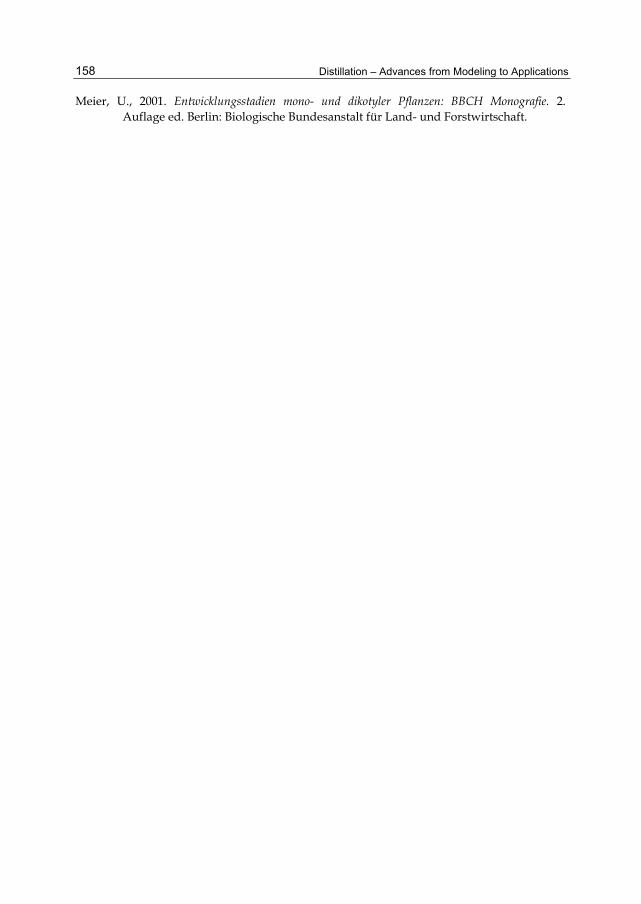
Distillation – Advances from Modeling to Applications 158
Meier, U., 2001. Entwicklungsstadien mono- und dikotyler Pflanzen: BBCH Monografie. 2. Auflage ed. Berlin: Biologische Bundesanstalt für Land- und Forstwirtschaft.

7
Distillation of Brazilian Sugar Cane Spirits (Cachaças)
Sergio Nicolau Freire Bruno Laboratório Nacional Agropecuário, RJ-MG, Ministério da Agricultura
Brazil
1. Introduction Cachaça is the sugar cane spirit typical of and exclusively produced in Brazil which has alcohol content between 38 and 48% in volume, at 20oC. It is obtained from the sugar cane fermented wort and has peculiar sensory characteristics. It may also include the addition of up to 6g/L of various sugars, expressed as sucrose (Brasil, 2005).
In the production of cachaças, as of other distilled beverages, a distillation process is used to isolate, select and concentrate specific volatile components of the “liquid mixture” by heating it (Boza & Horii, 1988; Léauté, 1990). After the fermentation, the distillation is the most important step for the quality of distilled beverages (Janzantti, 2004; Boza & Horii, 1988).
Distillation also promotes some heat induced chemical reactions such as the synthesis of acrolein through a Maillard reaction (Boza & Horii, 1988 ; Nykänen & Nykänen, 1991) and of heterocyclic aromatic compounds, such as furans (furfural, etc.), pyrazines and pyridines (Janzantti, 2004 ; Léauté, 1990). Besides that, distillation causes the extraction of certain long chain esters retained in the yeast cells at the end of the fermentation step, transferring them to the distillates (Nykänen & Nykänen, 1991).
The cachaças “wine” composition is quite complex and contains liquid, solid and gaseous substances. Ethanol is the main liquid component, with 5 to 8% v/v, and water is the substance present in the greatest amount - about 89 to 92% v/v. Other liquid components present in smaller amounts are glycerol, lactic acid and butyric acid; volatile components such as esters, acetic acid, propanoic acid, aldehydes and higher alcohols, among others (Novaes, 1999; Bruno, 2006 ; Nascimento et al., 1998a,b).
At every production of a distilled beverage, each volatile component will be more easily distilled according to three criteria: solubility in alcohol or water, boiling point and alcoholic content variation in the vapor phase during distillation (Janzantti, 2004 ; Léauté, 1990).
According to the components’ volatility, it is possible to isolate the volatile (water, ethanol and others) components from the non-volatile ones (suspended solids, minerals, yeast cells, non-fermentable sugars, proteins, etc.) obtaining two fractions, phlegm and vinasses, the residue from the distillation of the “wine”. The phlegm, main distillation product, is an

Distillation – Advances from Modeling to Applications
160
impure hydroalcoholic mixture, and its content depends on the type of equipment used (Mutton & Mutton, 2005).
2. Distillation system and practices Cachaças can be produced by two very different systems: “continuous” and “by batches”. In the traditional continuous system the distillation column used is continuously fed with the “wine”, while in the “by batches” system, typical of alembics, the whole wine volume to be distilled is transferred to a pan before the distillation starts (Bruno, 2006).
The different distillation systems are frequently used to distinguish the type of cachaça and the production method. Therefore, industrial cachaça would be the one produced from distillation columns of any size, through a continuous process, and alembic cachaça, the one prepared in copper alembics, with a limited volume. Among the practices that do not fit in the description of the last process, we can mention the sugar cane burning and the use of chemical adjuncts in the fermentation (Tonéis & Cia, 2005; Ampaq, 2006).
As the distillation process is modified, samples of the same “wines”, distilled in the same type of equipment, produced distillates with different quality. A slower distillation results in higher yield and in an increase of the aromatic compounds content, such as of aromatic esters. A fast distillation reduces the yield and produces distillates that are more acidic and contain an excess of higher alcohols (Almeida Lima, 2001; Mutton and Mutton, 2005 ).
Reche et al, (2007), use Principal component analysis (PCA), linear discriminant analysis (LDA) and ethanal, ethyl carbamate, dimethyl sulfide, isobutyl alcohol, n-propanal, copper, ethyl acetate,and phenylmethanal as chemical descriptors, to develop a model that showed 95.1% accuracy in distinguishing between cachaças distilled in copper pot stills and cachaças distilled in stainless steel columns. First, an exploratory analysis was carried out by PCA using analytical data for 82 samples (55 samples of cachaças distilled in copper pot stills and 27 samples distilled in stainless steel columns) to verify group formation and data structure. Afterwards, LDA was used for classification purposes. The training set used in the LDA was composed of the 82 samples used in the PCA. The self-consistency of the LDA model was examined by cross-validation using 33 unknown samples. During cross-validation, one sample at a time (of n samples) is left out, and the prediction ability is tested on the sample omitted. This procedure is repeated n times, resulting in n models, and will give an estimate of the average prediction ability for the n models.
2.1 Distillation by batch or intermittent: Alembics
As seen in Figure 1, the common alembic has only one pan, usually made of copper or stainless steel, in which the “wine” is heated to boiling then distilled. This equipment, also called distillation apparatus, can include columns with various external geometric characteristics and internal rectifiers (use of plates or trays, bubble traps, etc.), various extension tubes and cooling systems (Bruno, 2006; Maia, 2000; Pinto, 1986).
The distillation kettle (or pan) heating process may be direct or by steam. This process should be slow and gradual, since abrupt heating of the “wine” may cause the apparatus to overflow.
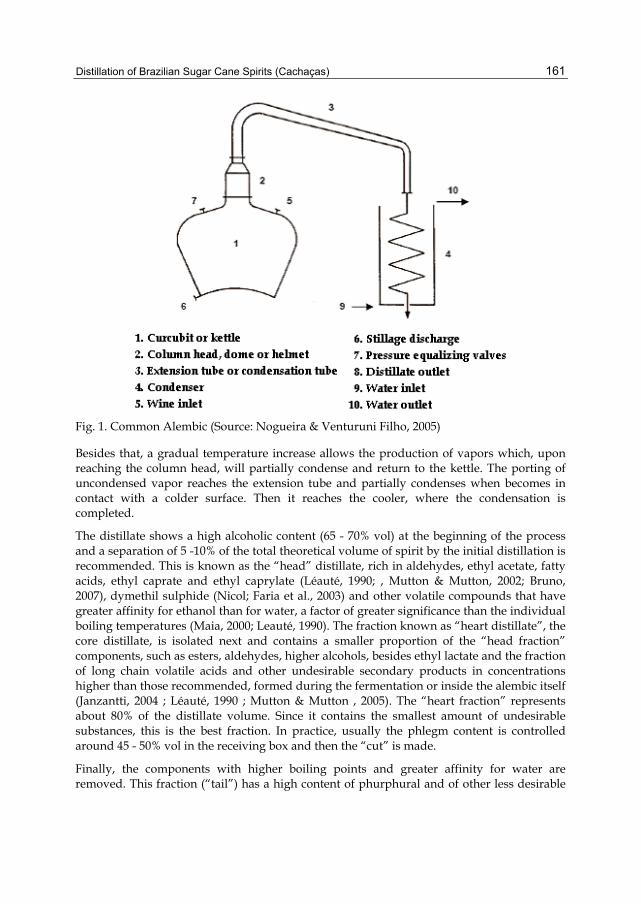
Distillation of Brazilian Sugar Cane Spirits (Cachaças)
161
Fig. 1. Common Alembic (Source: Nogueira & Venturuni Filho, 2005)
Besides that, a gradual temperature increase allows the production of vapors which, upon reaching the column head, will partially condense and return to the kettle. The porting of uncondensed vapor reaches the extension tube and partially condenses when becomes in contact with a colder surface. Then it reaches the cooler, where the condensation is completed.
The distillate shows a high alcoholic content (65 - 70% vol) at the beginning of the process and a separation of 5 -10% of the total theoretical volume of spirit by the initial distillation is recommended. This is known as the “head” distillate, rich in aldehydes, ethyl acetate, fatty acids, ethyl caprate and ethyl caprylate (Léauté, 1990; , Mutton & Mutton, 2002; Bruno, 2007), dymethil sulphide (Nicol; Faria et al., 2003) and other volatile compounds that have greater affinity for ethanol than for water, a factor of greater significance than the individual boiling temperatures (Maia, 2000; Leauté, 1990). The fraction known as “heart distillate”, the core distillate, is isolated next and contains a smaller proportion of the “head fraction” components, such as esters, aldehydes, higher alcohols, besides ethyl lactate and the fraction of long chain volatile acids and other undesirable secondary products in concentrations higher than those recommended, formed during the fermentation or inside the alembic itself (Janzantti, 2004 ; Léauté, 1990 ; Mutton & Mutton , 2005). The “heart fraction” represents about 80% of the distillate volume. Since it contains the smallest amount of undesirable substances, this is the best fraction. In practice, usually the phlegm content is controlled around 45 - 50% vol in the receiving box and then the “cut” is made.
Finally, the components with higher boiling points and greater affinity for water are removed. This fraction (“tail”) has a high content of phurphural and of other less desirable
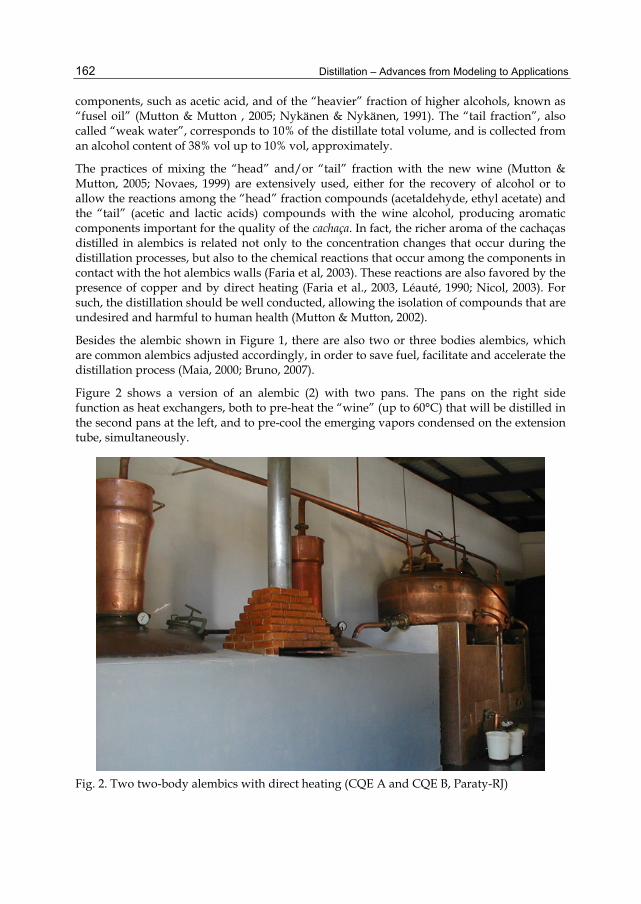
Distillation – Advances from Modeling to Applications
162
components, such as acetic acid, and of the “heavier” fraction of higher alcohols, known as “fusel oil” (Mutton & Mutton , 2005; Nykänen & Nykänen, 1991). The “tail fraction”, also called “weak water”, corresponds to 10% of the distillate total volume, and is collected from an alcohol content of 38% vol up to 10% vol, approximately.
The practices of mixing the “head” and/or “tail” fraction with the new wine (Mutton & Mutton, 2005; Novaes, 1999) are extensively used, either for the recovery of alcohol or to allow the reactions among the “head” fraction compounds (acetaldehyde, ethyl acetate) and the “tail” (acetic and lactic acids) compounds with the wine alcohol, producing aromatic components important for the quality of the cachaça. In fact, the richer aroma of the cachaças distilled in alembics is related not only to the concentration changes that occur during the distillation processes, but also to the chemical reactions that occur among the components in contact with the hot alembics walls (Faria et al, 2003). These reactions are also favored by the presence of copper and by direct heating (Faria et al., 2003, Léauté, 1990; Nicol, 2003). For such, the distillation should be well conducted, allowing the isolation of compounds that are undesired and harmful to human health (Mutton & Mutton, 2002).
Besides the alembic shown in Figure 1, there are also two or three bodies alembics, which are common alembics adjusted accordingly, in order to save fuel, facilitate and accelerate the distillation process (Maia, 2000; Bruno, 2007).
Figure 2 shows a version of an alembic (2) with two pans. The pans on the right side function as heat exchangers, both to pre-heat the “wine” (up to 60°C) that will be distilled in the second pans at the left, and to pre-cool the emerging vapors condensed on the extension tube, simultaneously.
Fig. 2. Two two-body alembics with direct heating (CQE A and CQE B, Paraty-RJ)
Distillation of Brazilian Sugar Cane Spirits (Cachaças)
163
The system may also include one more kettle or pan, making a three-body alembic, as shown in Figure 3. The upper pan works as a heat exchanger, such as in the two-body alembic. The apparatus is fed through the “wine” heater (1). The three bodies are interconnected by pipelines and valves and are at different levels, the “wine” falls by gravity and accumulates in the lowest body, either the exhaustion pan or kettle (2). When the working level is reached (75% of the total volume), the wine starts to accumulate in the distillation pan (3). Once the operative load is completed (75%), the “wine” heater is equally loaded.
Fig. 3. Three-body alembic (Source: Mutton & Mutton, 2005)
When the valves of the three bodies are closed, the wine in the exhaustion pan is heated by steam or direct heat. The hydroalcoholic vapors containing the most volatile components produced during the progressive heating are, then, injected into the “wine” in the central pan. This enriched and heated wine will produce hydroalcoholic vapors, whose alcohol composition is richer than in those vapors received in the exhaustion kettle (Novaes, 1999). Part of the vapors, richer in water, condenses in the column and returns to the “wine” from where it came, while the fraction richer in alcohol passes through this condensation zone as vapor, reaching the serpentine coil in the “wine” heater, where it condenses. The recently condensed distillate then goes to the cooler serpentine coil (4), and is collected in the reception box (5).
When the alcohol content of the distillate collected in the reception box reaches values between 45 to 48% vol, the heat source and the distillation cycle are interrupted. The vinasses in the third body, which will not contain alcohol anymore, runs out and it will be completed with the distillation kettle “wine”. The kettle is filled with the pre-heater “wine”, which will then be fed with the new “wine”. A new distillation cycle starts with the introduction of steam in the exhaustion kettle (Novaes, 1999 ; Bruno, 2006).
As the distillation progresses, both the uncondensed gases and the future “head” fraction resulting from the “wine” contained in the heater may be removed. Therefore, it will not be necessary to remove them in the next cycle. The “tail” fraction does not have to be removed
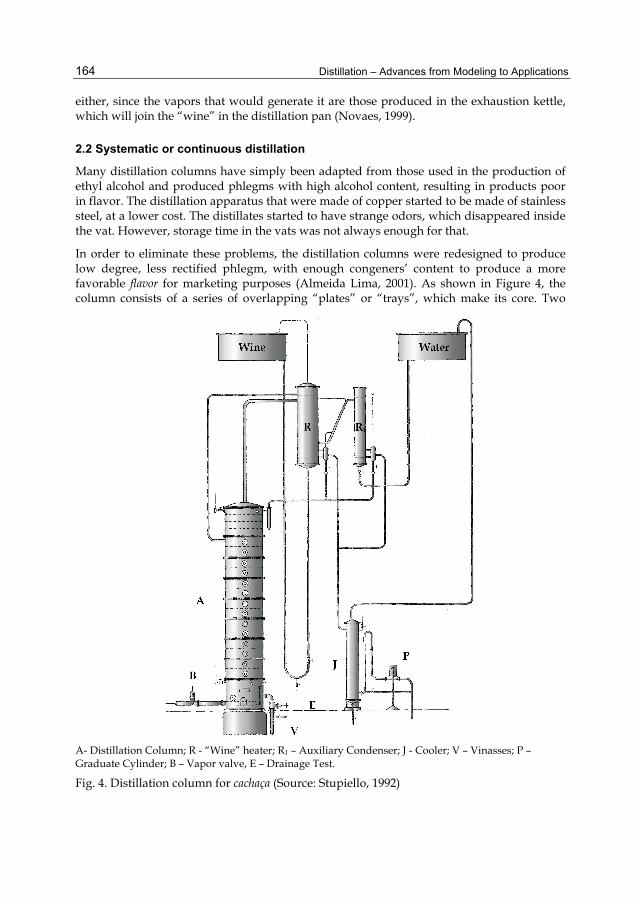
Distillation – Advances from Modeling to Applications
164
either, since the vapors that would generate it are those produced in the exhaustion kettle, which will join the “wine” in the distillation pan (Novaes, 1999).
2.2 Systematic or continuous distillation
Many distillation columns have simply been adapted from those used in the production of ethyl alcohol and produced phlegms with high alcohol content, resulting in products poor in flavor. The distillation apparatus that were made of copper started to be made of stainless steel, at a lower cost. The distillates started to have strange odors, which disappeared inside the vat. However, storage time in the vats was not always enough for that.
In order to eliminate these problems, the distillation columns were redesigned to produce low degree, less rectified phlegm, with enough congeners’ content to produce a more favorable flavor for marketing purposes (Almeida Lima, 2001). As shown in Figure 4, the column consists of a series of overlapping “plates” or “trays”, which make its core. Two
A- Distillation Column; R - “Wine” heater; R1 – Auxiliary Condenser; J - Cooler; V – Vinasses; P – Graduate Cylinder; B – Vapor valve, E – Drainage Test.
Fig. 4. Distillation column for cachaça (Source: Stupiello, 1992)

Distillation of Brazilian Sugar Cane Spirits (Cachaças)
165
plates together results in a “segment”. The two trays communicate through a syphon. According to Figure 5, the upper part of this siphon is prominent and conditions the formation of a layer of liquid over the upper tray.
Fig. 5. Scheme of two trays stacked in a distillation column (Source: Novaes, 1993)
Besides the siphon, the tray has a certain number of chimneys stacks with side windows or hatches over which the caps or hats are. The edge of these caps stay immersed in the liquid, offering resistance to the steam passage through the siphon.
The “wine” is introduced in the column (15 to 20 plates) through the upper segment and the steam serpentine coil, for heating purposed, is introduced from the lower segment. To start the process, the “wine” is introduced in the column until it reaches the desired level at the lower segment. The system is cooled with water and the steam is introduced in the serpentine coil. The vapor formed in the lower plate reaches the chimneys of the plate immediately above it and is accumulated in their caps.
Once the pressure increases, vapor starts to bubble in the liquid in the plate, heating and enriching the “wine” on this plate. After some time, the “wine” on the plate above also starts to boil and heats the next plate, and then the “wine” in there and so on until the last plate is reached.
As the phlegm is removed, there is a depletion of the alcoholic content on the plates, with a subsequent increase of the upper plate temperature. When the temperature reaches 92°C, the column starts to be fed again with the new “wine”, setting a continuous flow. The vapor formed in this plate will then be condensed.
System stability is maintained by controlling the vapor inlet, the “wine” flow and the vinasses removal. The use of low alcoholic content “wine” can be worked out efficiently by controlling the condensers downgrading and determining the most adequate selective condition for the final condenser, in order to obtain a better quality cachaça. Some compact
Distillation – Advances from Modeling to Applications
166
distillation columns with a “wine” heater installed at the top of the column make it harder to control the selectivity, and cause the “wine” to be carried to the distillate (Novaes, 1993; Bruno, 2006).
2.3 Bidestillation or double distillation
Bidistillation was effectively introduced in Brazil in 1991, by Novaes (1994), with the purpose of suppressing the ethyl carbamate in the cachaça produced at a plant in city of Nova Friburgo (Rio de Janeiro state, Brazil).
The double distillation process in cachaça is based on the processes used in the production of whisky and cognac, through the distillation in copper alembics (Novaes, 1994). The first step ends when the distillate inside the collecting box reaches 27% vol, similar to the “weak water”. The vinasses is discarded. This “wine” distillation will be done three or four times until the total “weak water” volume obtained is equal to that of the work load of the alembic.
All fractions from these distillates with low alcoholic content are stored in a flask that has at least the volume of the alembic load, and stay there until the next distillation.
At the end of the last “wine” distillation, the alembic will receive the “weak water” to be distilled. The sample should be heated slowly and, initially, the undesirable gases that do not condense will be released through channeling in the cooler and will be lost into the air. Right after that, a distillate with 77% vol will be collected when the cooling water valve is opened, and kept like that until the end of the process.
Three fractions will be obtained from this distillation: “head”, 1.5% of the “weak water” volume distilled (72 to 75% vol); “heart”, collected in another flask until the alcoholic content reached 66-68% vol; and “tail”, produced until its volume in the collecting box was equal to 30% of the initial “weak water” load.
“Head” and “tail” fractions will be mixed and the volume divided in three parts. Each part will be mixed with a new “wine” load, and so on. The “heart” fraction will be stored in flask according to the type of beverage desired. It can be aged, left to “rest” in adequate vats for a certain period of time, or, simply be consumed in natura.
Ethyl carbamate is not too volatile in alcoholic solutions, due to its affinity with water and alcohol. Since it is formed by the distillation process, when a new distillation is done, the product obtained will be poor in ethyl carbamate. Most of the ethyl carbamate will remain in the residue from the first distillation (Riffkin et al., 1989; Novaes, 1994). Similarly, the amount of compounds responsible for carrying copper from inside the serpentine coils (organic acids) is very small, which also results in the production of cachaças with low levels of copper and of volatile acidity (Bizelli et al., 2000).
3. Reflux, reflux rate, column geometry and the effect over the cachaça composition Distillation efficiency is controlled by the appropriate column design. The column design is a determining factor for the reflux adjustment, which consists on successive recondensation and revaporization occurring throughout the alembic column. Each time the vapors

Distillation of Brazilian Sugar Cane Spirits (Cachaças)
167
condense, a liquid with higher alcoholic content is generated and this liquid is capable of producing new vapors, even richer in ethanol.
At sea level, water boils at 100°C and ethanol at 78.5°C. The boiling temperature for a mixture of these liquids will be closer to 100°C as the ethanol concentration decreases and closer to 78.5°C as the ethanol content increases. A “wine” containing 8% v/v of ethanol starts to boil at a temperature around 94°C and, since ethanol is more volatile than water, the vapors formed will be richer in ethanol (45% v/v) than the mixture that produced them, according to the ethanol-water phase diagram shown in Figure 6. Once the vapors return to liquid state, the ethanol rate will be the same (45% v/v), but the temperature required to vaporize it again will decrease to about 83.5°C.
Fig. 6. Phase diagram for the ethanol-water system (Source: Evaporation & Life Science, 2002)
This phenomenon allows the vapors condensed in the column to return to gas phase, even if they stay at a position in the column in which the temperature is permanently lower than that of the liquid in the pan. This is the useful reflux. If the vapors condensed in the column return to the pan, the reflux would have been useless: it will only delay the distillation (Maia, 2000).
The efficiency of the still is a function of its design and of the operation of the column as well as of the reflux apparatus associated with the still head (Maia, 2000). This part of the still divides the condensate so that a portion (D) is taken off as a fresh distillate (P) and
Distillation – Advances from Modeling to Applications
168
the remainder (L) is returned to the column as a reflux liquid. The ratio L/P is called the reflux ratio. In addition to other factors, the columns give better performance at lower throughputs (Peters et al., 1974) and higher temperature gradients. Under these conditions, the residence time in the column is longer, which results in an equilibrium improvement, distillations with lower temperatures for the ethanol-water vapor phase, which is richer in ethanol than the liquid phase, and in an increased reflux rate (Maia, 2000; Peters et al., 1974).
In the distillation in alembic, the reflux reflects the combined effect of various factors: a) temperature of vapors, from the moment they reach boiling temperature until they reach the access to the extension tube (temperature gradient); b) column geometry and length; c) number and geometry of column plates (Maia, 2000 , Claus & Berglund, 2005; Tham, 2006); d) type of bubble traps (Tham, 2006); e) presence and geometry of cooling system on the top of the column (dephlegmator or hood); f) diameter and geometry of extension tube; g) conduction of process (Maia, 2000).
The efficiency of a distillation column separation includes a set of variables, whose complexity makes the appropriate process control less accessible to most of the average cachaça producers. Very high vapor or liquid rates can cause problems such as: liquid entrainment, flooding, formation of vapor cones or excess of foaming, among others (Kalid, 2002; Tham, 2006).
The vapor inlet flow (Vin) is generated in the exhaustion section. It is possible to manipulate the reflux rate, equivalent to L, to control the quality of the distillate, because with an increase in reflux, the distillate becomes richer in the lighter products. Likewise, the bottom product composition may become richer in heavier substances, if the rate of heating fluid (water vapor) increases. However, the rate of reflux is a manipulated variable that controls the quality of the distillate (controlled variable), while Vin is another manipulated variable associated to the quality of the bottom product. Yet, making measurement in the mixture line is a complex and expensive task. Alternatively, temperature is used to infer the composition. In this case, the controlled variable is the temperature or the temperature difference between two column plates (Kalid, 2002).
4. Influence of distillation systems and processes on the ethyl carbamate content in cachaças Distillated beverages containing cyanogenic glycosides, characteristic of the raw material used, are those in which ethyl carbamate (EC) contents reach the highest values, such as in brandies of stone fruits (peach, plum, cherry, etc.) (Schehl, 2005), and tiquira (Cagnon et al., 2002), a manioc spirit. The control of the distillation processes for these beverages is not enough to reduce the EC contents to acceptable levels, due to the large cyanide concentration formed. Cyanide is the immediate precursor of EC and this large cyanide concentration cannot be suppressed in the distillate, avoiding the precursors less volatile than cyanides from transferring to the distillates (Bruno, 2006; Lachenmeier et al., 2005). Although sugar cane is considered a cyanogenic plant, cyanide formation in cachaças is not very well defined. This is also true for other nitrogen-based EC precursors. However, the main role of the cyanate formed from the oxidation of cyanide, no matter its source (aminoacids, urea, cyanide or carbamylic compounds), has been suggested since the

Distillation of Brazilian Sugar Cane Spirits (Cachaças)
169
beginning of the last decade and supported by recent studies and reports (Bruno, 2006; Aresta et al., 2001, Riffkin et al.,1999).
One chemical pathway proposed for the EC formation involves the oxidation of cyanide (CN-) to cyanate (NCO-) catalyzed by Cu (II) ions (Aresta et al., 2001; Beattie & Polyblank,1995; Mackenzie et al., 1990) followed by reaction with ethanol (Aresta et al., 2001; Taki et al., 1992) according to the reaction scheme below:
2Cu(II) + 4 CN- → 2Cu(CN)2
2Cu(CN)2 → 2CuCN + C2N2
C2N2 + 2 OH- → NCO- + CN- + H2O
NCO- + C2H5OH → C2H5OCONH2
Another possible mechanism involves the formation of isocyanic acid, which is released directly from the thermal decomposition of urea present in the wort. Aresta et al., (2001), have reported other possible mechanisms, most of them involving cyanide, copper and cyanate.
According to Riffkin et al., (1989), who used an experimental copper alembic to produce whisky “low wines”, the amount of EC formed in the first two hours after distillation, in the presence of 0.8 mg/L of copper, represents about 20% of the EC’s final concentration. Approximately 80% of EC were formed within 48 hours in the fresh distillate. By using an Amberlite IRC ion exchange resin a complete inhibition of the EC formation was also verified in fresh distillates when copper ions were suppressed.
Double distillation has been the most common procedure for removing ECs from distilled spirits. Nevertheless, this procedure generally leads to losses in ethanol yield and aroma. Boscolo, (2001), analyzed 84 samples of cachaças from various Brazilian regions, with EC levels varying from of 42 to 5689 μg/L and an average value of 904 μg/L. Only 13% presented EC levels below the maximum international limit established (150 μg/L). Those authors reported the occurrence of smaller amounts of EC in Brazilian sugar cane spirits obtained from distillation systems in which the descendent parts (end part of adapter and serpentine coil) are made of stainless steel. However, these systems produce spirits with sensorial defects, mainly due to the presence of sulfur compounds (Faria et al., 2003; Andrade-Sobrinho et al., 2002)., In alembics made entirely of copper, these off-odors usually react more effectively with this metal producing an odorless salt (Andrade-Sobrinho et al., 2002).
A preventive action commonly reported for the reduction of the EC levels in distilled spirits consists in fitting the upper portion of the columns with either a bubble cap tray or a section packed with copper rings (Bujake, 1992) or other copper devices (Andrade-Sobrinho et al., 2002). However, Andrade-Sobrinho et al. (2002) reported the presence of high levels of EC when the distillation system has a small area made of copper in the ascendant parts. They used 126 samples of commercial cachaças from several states and reported an average value of 770 µg/L. The average value of the cachaça samples produced using distillation columns was of 930 µg/L, whereas those from alembics showed an average of 630 µg/L.

Distillation – Advances from Modeling to Applications
170
Bruno et al., (2007), studied the influence of the distillation systems and of the distillation process on the EC levels. They analyzed 34 sugar cane spirit samples from 28 main producers (total of 30 different distillation systems) from various regions of the Rio de Janeiro State, Brazil. The first 17 samples consisted of freshly distilled fractions collected in glass flasks from 13 different distillation systems (2 producers have 2 alembics) and four (4) samples of them were recollected afterwards. Samples from alembics were collected from the heart fractions. Seventeen (17) samples were bottled cachaças acquired directly at the distilleries. The selection criteria of the 28 producing locations were their different distillation systems, their legal condition, economic importance and the quality of the facilities. These systems were divided in 7 continuous distillation columns (DC); 16 alembics made entirely of copper (CA, pot still); 5 stainless steel alembics with a copper serpentine coil (SSC); 1 alembic made entirely of stainless steel (SSS); and 1 double distillation copper alembic (DDC).
As shown in Table 1, only one out of the seven medium sized continuous distillation columns produced EC levels below the maximum limit of 150 μg/L. Ten out of the 16 copper alembics complied with this limit. The results also show that the average of EC levels in the cachaças from alembics was lower than the average for cachaças from distillation columns (Figure 7).
Fig. 7. EC concentration averages for each type of distillation system used for cachaças (± confidence intervals; P = 0.05). *One sample; **non parametric distribution (Source: Bruno et al., 2007)
The results are partially in agreement with those reported by Andrade-Sobrinho et al., (2002), for cachaças from various states in Brazil. However, the average for cachaças from Rio de Janeiro was 5 to 6 times lower than that described by Boscolo, (2001) and Andrade-
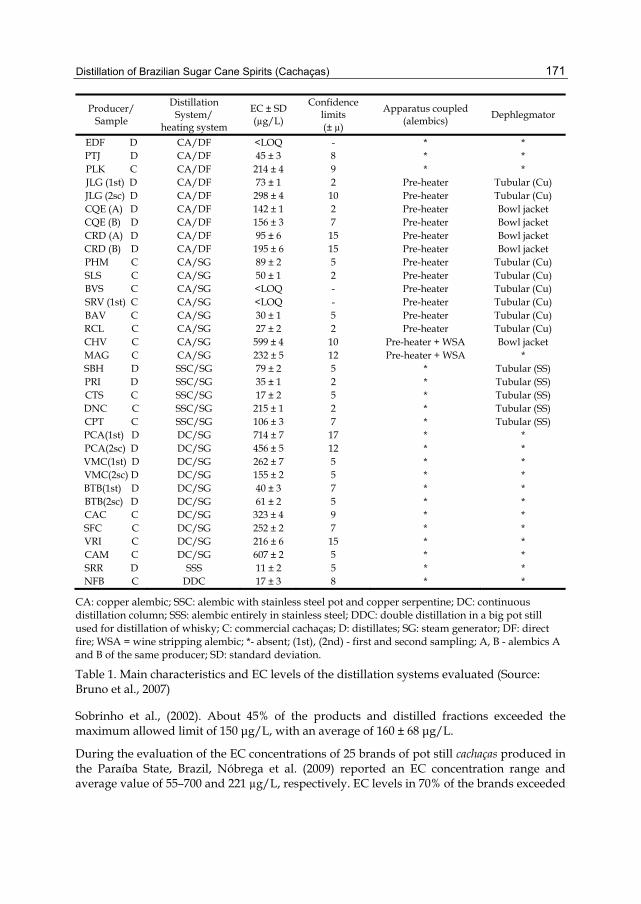
Distillation of Brazilian Sugar Cane Spirits (Cachaças)
171
Producer/ Sample
Distillation System/
heating system
EC ± SD (µg/L)
Confidence limits (± µ)
Apparatus coupled (alembics) Dephlegmator
EDF D CA/DF <LOQ - * * PTJ D CA/DF 45 ± 3 8 * * PLK C CA/DF 214 ± 4 9 * * JLG (1st) D CA/DF 73 ± 1 2 Pre-heater Tubular (Cu) JLG (2sc) D CA/DF 298 ± 4 10 Pre-heater Tubular (Cu) CQE (A) D CA/DF 142 ± 1 2 Pre-heater Bowl jacket CQE (B) D CA/DF 156 ± 3 7 Pre-heater Bowl jacket CRD (A) D CA/DF 95 ± 6 15 Pre-heater Bowl jacket CRD (B) D CA/DF 195 ± 6 15 Pre-heater Bowl jacket PHM C CA/SG 89 ± 2 5 Pre-heater Tubular (Cu) SLS C CA/SG 50 ± 1 2 Pre-heater Tubular (Cu) BVS C CA/SG <LOQ - Pre-heater Tubular (Cu) SRV (1st) C CA/SG <LOQ - Pre-heater Tubular (Cu) BAV C CA/SG 30 ± 1 5 Pre-heater Tubular (Cu) RCL C CA/SG 27 ± 2 2 Pre-heater Tubular (Cu) CHV C CA/SG 599 ± 4 10 Pre-heater + WSA Bowl jacket MAG C CA/SG 232 ± 5 12 Pre-heater + WSA * SBH D SSC/SG 79 ± 2 5 * Tubular (SS) PRI D SSC/SG 35 ± 1 2 * Tubular (SS) CTS C SSC/SG 17 ± 2 5 * Tubular (SS) DNC C SSC/SG 215 ± 1 2 * Tubular (SS) CPT C SSC/SG 106 ± 3 7 * Tubular (SS) PCA(1st) D DC/SG 714 ± 7 17 * * PCA(2sc) D DC/SG 456 ± 5 12 * * VMC(1st) D DC/SG 262 ± 7 5 * * VMC(2sc) D DC/SG 155 ± 2 5 * * BTB(1st) D DC/SG 40 ± 3 7 * * BTB(2sc) D DC/SG 61 ± 2 5 * * CAC C DC/SG 323 ± 4 9 * * SFC C DC/SG 252 ± 2 7 * * VRI C DC/SG 216 ± 6 15 * * CAM C DC/SG 607 ± 2 5 * * SRR D SSS 11 ± 2 5 * * NFB C DDC 17 ± 3 8 * *
CA: copper alembic; SSC: alembic with stainless steel pot and copper serpentine; DC: continuous distillation column; SSS: alembic entirely in stainless steel; DDC: double distillation in a big pot still used for distillation of whisky; C: commercial cachaças; D: distillates; SG: steam generator; DF: direct fire; WSA = wine stripping alembic; *- absent; (1st), (2nd) - first and second sampling; A, B - alembics A and B of the same producer; SD: standard deviation.
Table 1. Main characteristics and EC levels of the distillation systems evaluated (Source: Bruno et al., 2007)
Sobrinho et al., (2002). About 45% of the products and distilled fractions exceeded the maximum allowed limit of 150 μg/L, with an average of 160 ± 68 μg/L.
During the evaluation of the EC concentrations of 25 brands of pot still cachaças produced in the Paraíba State, Brazil, Nóbrega et al. (2009) reported an EC concentration range and average value of 55–700 and 221 µg/L, respectively. EC levels in 70% of the brands exceeded

Distillation – Advances from Modeling to Applications
172
the international limit for spirits (150 µg/L).The average EC levels found in pot still cachaças from Paraíba State are considerably lower than the mean values reported previously for 34 samples of pot still cachaças from different parts of Brazil (630 µg/L, Andrade-Sobrinho et al., 2002) and for several commercial cachaças produced in Minas Gerais State (1206 µg/L ,Baffa Júnior et al., 2007; 893 µg/L, Labanca et al., 2004). Although not clearly stated, the samples investigated by Baffa Júnior et al. (2007) and Labanca et al. (2004) are likely to be pot still types, because Minas Gerais State, in Southeastern Brazil, is the national leader in pot still production of cachaça.
However, the average level reported here are higher than the values reported for 13 commercial samples of pot still cachaças produced in Rio de Janeiro State (123 µg/L, Bruno et al., 2007).
At first, the lower EC levels found in pot still alembics could be explained by the reactions of cyanide with copper in the ascending parts, which produce non-volatile complexes (Andrade-Sobrinho et al., 2002; Aresta et al., 2001; Boscolo, 2001). However, 2 alembics, without any copper-made part or device inside the columns, produced low EC levels (< 10 and 45 μg/L). These alembics are characterized by a distillation process with low flow rates and temperatures, and suggest that they are favored by their appropriate design (Bruno et al., 2007).
For pot still systems, as the alcoholic content decreases, the temperature of the wine increases. However, it is possible to keep the vapor temperature lower than 80C in the dephlegmator by increasing the water flow rate inside it during the distillation process. Figures 8.A and 8.B show that it was possible to drastically reduce the EC levels in the freshly distillate fractions from a copper alembic labeled as JLG through this control method. On the other hand, the other 5 alembics that produced lower EC levels (< LQ to 50 μg/L), with the same copper tubular dephlegmator inside the column head of JLG, have two lower sections with stainless steel or copper bubble cap trays (Figure 5 and 9), which leads to high separation efficiencies.
Aiming at reducing the levels of EC in alembic cachaças, today, many distillation systems in Brazil are already made with those two lower sections. Therefore, alembic SRV stands out as the one with greater chance of rectification, with three plates with four bubble traps in each plate, made of stainless steel, and a reasonable reflux control system in the dephlegmator. In this system, EC formation was not detected either (< LQ), even when two samples of different batches were analyzed (see Table ), which indicated the absence of nitrogenated precursors in more rectifier systems.
In the alembics with a condensing bowl jacket around the still top, it is not possible to properly control the reflux, which, sometimes, can result in distillation temperatures higher than 90C and accelerate the distillation process. This is the case for the CQE (Figure 2), CRD (Figure 12), and CHV (Figure 13) alembics. The highest EC level among all alembics was found in the CHV unit (595 μg/L), which has in the bottom a wine stripping alembic producing alcohol vapors which will warm it up through the bowl jacket and make the final distillation fraction.
Bruno et al. (2007) also observed that the presence of cloudiness was very common when the temperatures in the column head were above 80-82°C. As a result of entrainment (Tham, 2006; APV,1998), there is an enrichment of less volatile components, such as nitrogenous compounds, into the lower parts of the distillation system (serpentine coil, etc.), which in the
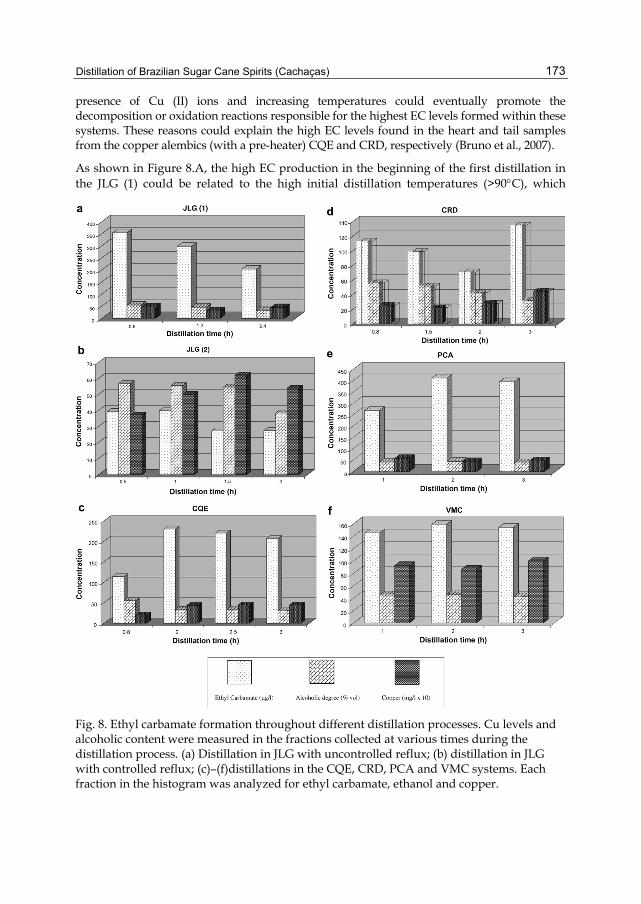
Distillation of Brazilian Sugar Cane Spirits (Cachaças)
173
presence of Cu (II) ions and increasing temperatures could eventually promote the decomposition or oxidation reactions responsible for the highest EC levels formed within these systems. These reasons could explain the high EC levels found in the heart and tail samples from the copper alembics (with a pre-heater) CQE and CRD, respectively (Bruno et al., 2007).
As shown in Figure 8.A, the high EC production in the beginning of the first distillation in the JLG (1) could be related to the high initial distillation temperatures (>90C), which
Fig. 8. Ethyl carbamate formation throughout different distillation processes. Cu levels and alcoholic content were measured in the fractions collected at various times during the distillation process. (a) Distillation in JLG with uncontrolled reflux; (b) distillation in JLG with controlled reflux; (c)–(f)distillations in the CQE, CRD, PCA and VMC systems. Each fraction in the histogram was analyzed for ethyl carbamate, ethanol and copper.
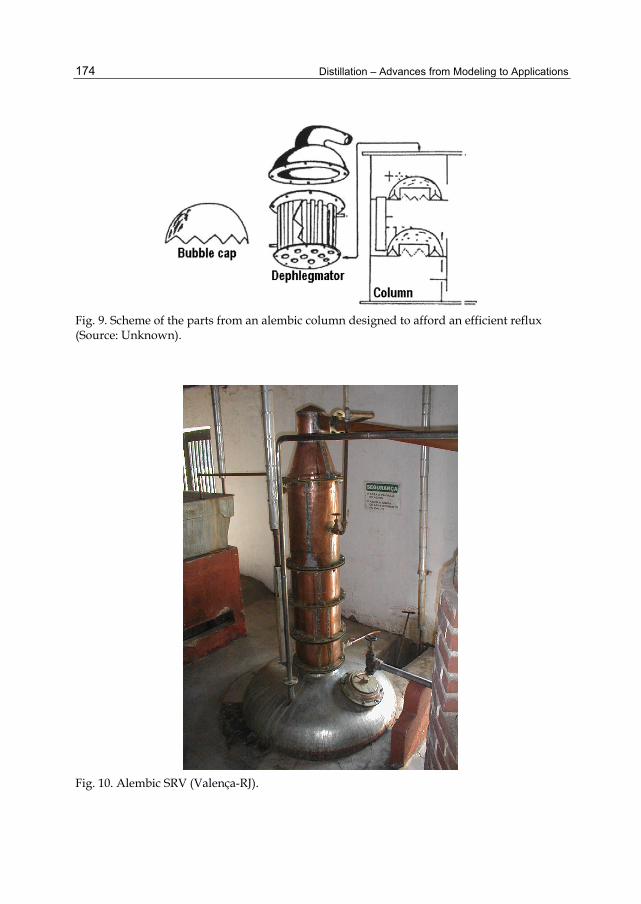
Distillation – Advances from Modeling to Applications
174
Fig. 9. Scheme of the parts from an alembic column designed to afford an efficient reflux (Source: Unknown).
Fig. 10. Alembic SRV (Valença-RJ).
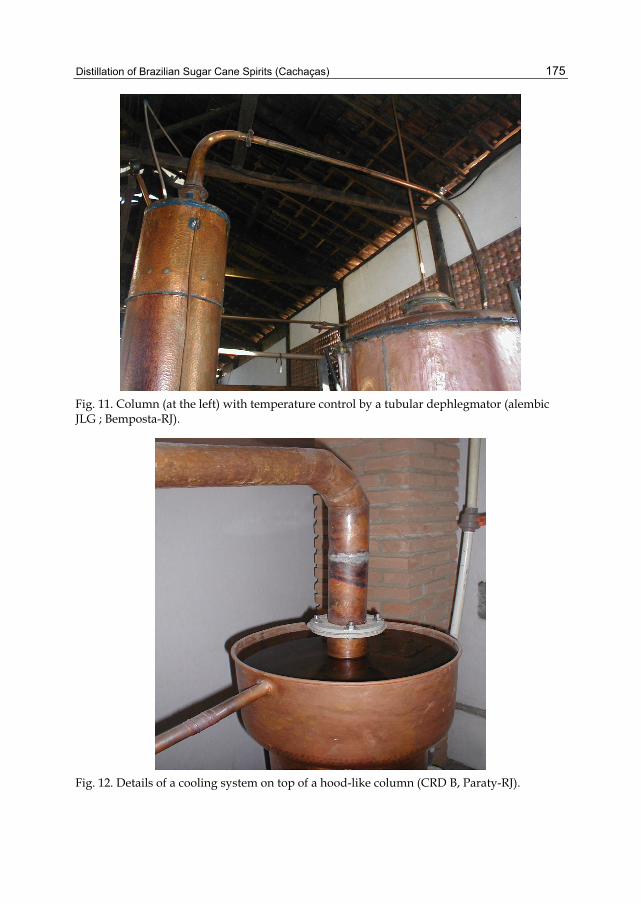
Distillation of Brazilian Sugar Cane Spirits (Cachaças)
175
Fig. 11. Column (at the left) with temperature control by a tubular dephlegmator (alembic JLG ; Bemposta-RJ).
Fig. 12. Details of a cooling system on top of a hood-like column (CRD B, Paraty-RJ).
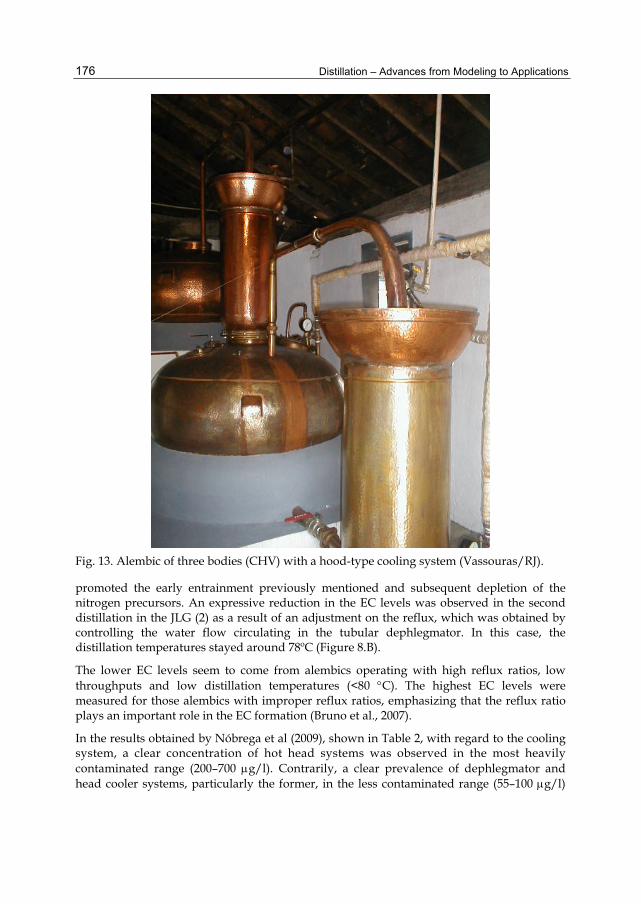
Distillation – Advances from Modeling to Applications
176
Fig. 13. Alembic of three bodies (CHV) with a hood-type cooling system (Vassouras/RJ).
promoted the early entrainment previously mentioned and subsequent depletion of the nitrogen precursors. An expressive reduction in the EC levels was observed in the second distillation in the JLG (2) as a result of an adjustment on the reflux, which was obtained by controlling the water flow circulating in the tubular dephlegmator. In this case, the distillation temperatures stayed around 78ºC (Figure 8.B).
The lower EC levels seem to come from alembics operating with high reflux ratios, low throughputs and low distillation temperatures (<80 C). The highest EC levels were measured for those alembics with improper reflux ratios, emphasizing that the reflux ratio plays an important role in the EC formation (Bruno et al., 2007).
In the results obtained by Nóbrega et al (2009), shown in Table 2, with regard to the cooling system, a clear concentration of hot head systems was observed in the most heavily contaminated range (200–700 g/l). Contrarily, a clear prevalence of dephlegmator and head cooler systems, particularly the former, in the less contaminated range (55–100 g/l)

Distillation of Brazilian Sugar Cane Spirits (Cachaças)
177
Distillery Branda ECb (µg/l) Profile of copper pot still distillationc
Distillation scaled Heating systeme
Kettle shapef
Cooling systemg (pot still column)
B 02 55 M SS O TD C 03 60 S SS O TD D 04 75 M SS O TD E 05 90 S DF O HC F 06 100 S SS O HC M 14 200 S DF C HH N 15 220 S DF C HH O 16 225 S DF C HH G 18 235 S SS O HH R 24 430 L SS B HH S 25 700 M DF O HH
aBrands of white single-distiled cachaças, according to Table 1. bEthyl carbamate levels (in increasing order) of cachaça brands. cDistillation profile was obtained via data collection during visits to distilleries. dDistillation scale, according to total kettle volume of distillery: small (S), 1.000–3.000 l; medium (M), 3.000–9.000 l; large (L), >9.000 l. eKettle heating system via internal steam serpentine (SS) or external fire with direct combustion of dried cane bagasse (DF). fKettle shape, according to Fig. 1: onion (O), conic (C), and boiler (B). gCooling system of pot still column (ascending parts), according to Fig. 2: tubular dephlegmator (TD), head cooler (HC), and hot head (HH).
Table 2. Ethyl carbamate (EC) levels in brands of white single-distilled cachaças and their corresponding distillation profile (Source: Nóbrega et al., 2009).
was observed. These observations are in line with those of Bruno et al. (2007), who also found a close connection between low levels of EC in cachaças and distillation in alembics using high reflux rates.
The values for the only alembic made entirely of stainless steel agree with those reported by Boscolo, (2001), emphasizing the importance of copper for the EC formation. As expected, the double distilled cachaça sample analyzed, produced in a large alembic imported from Scotland, also showed a low EC level. Copper levels in those two systems were 0.01 mg/L and 0.02 mg/L, respectively.
Striking differences in the EC levels measured were also observed for the different continuous distillation columns. Poorly conducted rectification, usually due to the excess of vapor and of wine feeding into the columns (Belincanta et al., 2006; Kalid, 2002) could explain the high EC levels found in most of these systems. In those cases, flooding (in the trays) and entrainment can occur at the same time (Kalid, 2002, Tham, 2006; APV, 1998).
Although there is also a significant variation on the EC levels from different distillation columns, few changes occurred during the distillation processes within these systems (continuous processes) when the temperature did not vary significantly.
4.1 Influence of copper contents on the formation of ethyl carbamate
The EC levels measured as a function of an increase in copper content in the experiment are shown in Figure 1. The initial value of 150 μg/L (in the y axis) was determined from other experiments with various sugar cane freshly distilled samples from other producers, for

Distillation – Advances from Modeling to Applications
178
Fig. 14. Alembic with stainless steel pan and serpentine coil (Resende-RJ).
Fig. 15. Distillation Column VMC (Bom Jesus do Itabapoana/RJ)

Distillation of Brazilian Sugar Cane Spirits (Cachaças)
179
which an average reduction of 65% was obtained and copper levels were reduced to less than 0.01 mg/L (Bruno et al., 2007). In the previous experiment, using another PCA freshly distillate, a maximum reduction of 67% in the EC levels was observed, when the concentration of copper was reduced to 0.16 mg/L. Therefore, in order to achieve a more complete reduction of EC, the copper concentration in the distillates should be around 0.15 mg/L.
About 0.7- 0.8 mg/L was enough to promote a complete EC formation and higher concentrations of copper did not promote any additional catalytic effect.
Fig. 16. EC levels as a function of copper concentration in PCA freshly distilled, eluted on Dowex Marathon C resin beds with increasing depths. The error bars show the standard deviations of EC measurements (n=3). ( Source: Bruno et al., 2007)
5. Conclusion Some studies on the distillation of cachaças and how it affects the quality of these sugar cane spirits have been published and have contributed to the development of this area. However, there is still a great need for more research on the distillation processes of cachaça in order to continuously improve the quality of these products.
6. Acknowledgment The author would like to thank his wife, Jovina, and sons, Saulo and Sergio Vitor for their patience, love and support. Also, thanks to Dr. Isabel Vasconcelos and Prof. Dr. Delmo Vaitsman for their continuous support during the time devoted to the studies and projects related to cachaça.
7. References Almeida Lima, U. (2001) Aguardentes. In: Aquarone et al., Biotecnologia na Produção de
Alimentos, Série Biotecnologia Industrial, 1. ed., Vol. IV, São Paulo: Edgar Blucher, pp.145-177.

Distillation – Advances from Modeling to Applications
180
Ampaq. Etapas para produção da cachaça de Minas Gerais, 21/02 2006, Available from <http://www.ampaq.com.br/arquivos/etapas_para_producao.pdf>.
Andrade-Sobrinho L. G. : Boscolo, M. ; Lima-Neto, B. S. & Franco, D. W. (2002). Carbamato de etila em bebidas alcoólicas (cachaça, tiquira, úisque e grapa). Química Nova, Vol. 25, No 6B, pp. 1074-1077. ISSN 0100-4042.
APV. Distillation handbook ‘98., 4th ed., APV Crepaco Inc. 12.07.2011, Available from http://userpages.umbc.edu/~dfrey1/ench445/apv_distill.pdf Aresta, M., Boscolo, M. & Franco, D. W. (2001). Copper(II) catalysis incyanide conversion
into ethyl carbamate in spirits and relevant reactions. Journal of Agricultural and Food Chemistry, Vol. 49, pp. 2819–2824. ISSN 0021-8561.
Baffa Júnior, J. C.; Soares, N. F. F.; Pereira, J. M. A. T. K. & MELO, N. R. (2007). Ocorrência de Carbamato de Etila em Cachaças Comerciais da Região da Zona da Mata Mineira - MG, Alim. Nutr., Araraquara, Vol. 18, No . 4, pp. 371-373. ISSN 0103-4235.
Beattie, J. K. & Polyblank, G.A. (1995). Copper-catalyzed oxidation of cyanide by peroxide in alkaline aqueous solution. Australian Journal of Chemistry, v. 48 n. 4, pp. 861 – 868. ISSN 0004-9425.
Belincanta, J., Kakuta Ravagnani, T. M. & Pereira, J. A. F. (2006). Hydrodynamic and tray efficiency behavior in parastillation column. Brazilian Journal of Chemical Engineering, Vol. 23, No 1, pp.135–146. ISSN 0104-6632
Bizelli, L. C.; Ribeiro; C. A. F. & Novaes F. V. (2000). Dupla destilação da aguardente de cana: teores de acidez total e decobre. Scientia Agricola, São Paulo, Vol. 57, No. 4, pp. 623-627.
Boscolo, M. Ph.D. Thesis. Caramelo e carbamato de etila em aguardente de cana. Ocorrência e quantificação. 2001. USP, Instituto de Química de São Carlos, São Paulo.
Boza, Y. & Horii, J. (1988). Influência da destilação sobre composição e a qualidade sensorial da aguardente de cana-de-açúcar. Ciênc. Tecnol. Alim., Vol. 18, No 4, pp. 391-396
Brasil. Ministry of Agriculture - MAPA. Normative Instruction Nº 13 of June 29, 2005. Regulamento técnico para fixação dos padrões de identidade e qualidade para aguardente de cana e para cachaça. Diário Oficial da República Federativa do Brasil Nº 124, of June 30, 2005, section 1, f. 3-4 (Brazilian Official Gazette)
Bruno, S. N. F. - Doctorate thesis in Food Sciences - Adequação dos Processos de Destilação e de Troca Iônica na Redução dos Teores de Carbamato de Etila em Cachaças Produzidas no Estado do Rio de Janeiro. –2006238 f. : il. – Universidade Federal do Rio de Janeiro, Chemistry Institute, Graduate Program in Food Science, Rio de Janeiro, 2006. References : f. 202 -219
Bruno, S.N.F., D.S. Vaitsman, C.N. Kunigami & Brasil, M.G. (2007). Influence of the distillation processes from Rio de Janeiro in the ethyl carbamate formation in Brazilian sugar cane spirits, Food Chemistry. Vol. 104, Issue 4, pp. 1345-1352. ISSN 03088146.
Bujake, J. E. (1992). Beverage spirits, distilled, In: Kirk-Othmer Encyclopedia Of Chemical Technology, Vol. 4, 4. ed., USA : John Wiley e Sons, Inc.
Cagnon, J.R., Cereda, M.P. & Pantarroto, S. (2002). Glicosídeos cianogênicos da mandioca: biossíntese, distribuição, destoxificação e métodos de dosagem. In: Cereda, M.P. Coord.). Agricultura: Culturas de Tuberosas Amiláceas Latino Americanas, SérieTuberosas Amiláceas Latino Americanas. Vol. 2, Cap. 5, pp. 83-89.
Claus, M. J.& Berglund, K.A. (2005). Fruit brandy production by batch column distillation with reflux. Journal of Food Process Engineering, Vol. 28, pp. 53-67. ISSN 0145-8876
Evaporation & Life Science. Rectification of a two component mixture of solvents using a rotary evaporator. Informative Bulletin, 2002. 15.10 2005. Available from <http://www.suntex.com.tw/images/e_learning/7.pdf >
Distillation of Brazilian Sugar Cane Spirits (Cachaças)
181
Faria, J. B., Loyola, E., Lópe Faria, J. B., Loyola, E., Lopes, M. G., & Dufour, J. P. (2003). Cachaça, Pisco and Tequila. In A.G.H. Lea, J.R. Piggott (Org.). Fermented Beverage Production (2nd. ed.), New York: Kluwer Academic/PleniumPublishers, pp. 335–363.
Janzantti, N.S. Compostos voláteis e qualidade de sabor da cachaça. 2004. 179 f. Thesis (Doctor Degree in Food Sciences). Faculdade de Engenharia de Alimentos,Universidade Estadual de Campinas, São Paulo.
Kalid,R.A. (2002). Controle de coluna de destilação. Laboratório de Controle e Otimização Industrial – Chemical Engineering Dept., MAEQ, UFBA. Available from
<www.lacoi.ufba.br/imagens_Lacoi/docs_pdf/Controle%20de%20Coluna%20de%20Destilacao.pdf>.
Labanca, R.A. (2004). Teores de carbamato de etila, cobre e grau alcoólico em aguardentes produzidas em Minas Gerais. 2004. 62 f. Thesis (Masters in Food Sciences) Universidade Federal de Minas Gerais, MG, Brasil.
Lachenmeier, D. W. , B. ; Kuballa, T; Frank, W & Senn, T.(2005). Retrospective trends andcurrent status of ethyl carbamate in German stone-fruit spirits. Food Additives and Contaminants. Taylor & Francis , Vol. 22, No. 5, p.p. 397-405.
Léauté, R. (1990). Distillation in alembic. Am. J. Enol. Viticult., Vol. 41, pp. 90-103, Mackenzie, W. M.; Clyne A. H. & Mcdonald L. S. (1990). Ethyl carbamate formation in grain
based spirits. Part II. The identification and determination of cyaniderelated species involved in ethyl carbamate formation in Scotch whisky. J. Inst Brew. , Vol. 96, pp. 223-232.
Maia, A. B. (1994). Componentes secundários da aguardente. STAB, Belo Horizonte, v. 12, n. 6, pp. 29-33.
Maia, A. B. (2000). Tópicos especiais em destilação e envelhecimento Curso de Tecnologia daCachaça. Módulo III. Amarantina, MG: [s.n.], 22 p.,. In: Doctorate Thesis by Bruno, S.N.F. Adequação dos Processos Destilação e de Troca Iônica na Redução dos Teores de Carbamato de Etila em Cachaças Produzidas no Estado do Rio de Janeiro. –2006238 f. : il. Universidade Federal do Rio de Janeiro, Rio de Janeiro, 2006. References: 202 -219.
Mutton, M. J. R. & Mutton, M. A. (2005). Aguardente. In: Tecnologia De Bebidas. Matéria-Prima, Processamento. BPF/APPCC, Legislação e Mercado. São Paulo: Edgar Blücher, 1st. ed., pp. 485-524.
Mutton, M. J. R. & Mutton, M. A. (2002). Cachaça: orientações técnicas para produção (CD). ABRABE -APEX –PBDAC Workshop. São Paulo, SP, BRASIL, 2002. p. 113-115. In: Bruno, S. N. F. - Doctorate thesis in Food Sciences - Adequação dos Processos de Destilação e deTroca Iônica na Redução dos Teores de Carbamato de Etila em Cachaças Produzidas no Estado do Rio de Janeiro. – Universidade Federal do Rio de Janeiro, Chemistry Institute, Graduate Program in Food Science, Rio de Janeiro, 2006. references : f. 202 -219
Nascimento, R.F.; Cerroni, J. L.; Cardoso, D. R., Lima-Neto, B.S. & Franco, D. W. (1998). Comparação dos métodos oficiais de análise e cromatográficos para a determinação dos teores de aldeídos e ácidos em bebidas alcoólicas. Ciência e Tecnologia e Alimentos, Campinas, Aug/Oct., Vol. 18, No. 3, ISSN 0101-2061, pp. 350 - 355,
Nascimento, R.F. ; Cardoso, D. R., Lima-Neto, B.S. & Franco, D. W. (1998). Determination of acids in brazilian sugar cane spirits and other alcoholic beverages by HRGC-SPE. Chromatographia, Vol. 48, No. 11/12, pp. 751-757, DOI: 10.1007/BF02467643,

Distillation – Advances from Modeling to Applications
182
Nicol , D. A. (2003). Batch distillation. Chapter 5. In: Whisky Technology, Production and Marketing. Elsevier Ltd. I. Russell, G. Stewart,., Bamforth, C., & I Russell, (Eds.), pp 163- 167, ISBN 978-0-12-669202-0, Canada.
Nóbrega, I.C.C., Pereira, J., Paiva J. & Lachenmeier, D.W. (2009). Ethyl carbamate in pot still cachaças (Brazilian sugar cane spirits): Influence of distillation and storage conditions Food Chemistry Vol. 117, No. 4 , pp. 693-697. ISSN 0308-8146.
Nogueira , M.P & Venturini Filho W.G.(2005). Aguardente de cana. UNESP, Botucatu, SP, 12.12.2005, Available from
http://www.fca.unesp.br/intranet/arquivos/waldemar/Aguardente%20de%20Cana%20-Completo.pdf>.
Novaes, F. V. (1993) Produção de aguardente de cana. Curso de Tecnologia de Aguardente de Cana. Delegacia Federal de Agricultura de Minas Gerais. . In: Bruno, S. N. F. - Doctorate thesis in Food Sciences - Adequação dos Processos de Destilação e de Troca Iônica na Redução dos Teores de Carbamato de Etila em Cachaças Produzidas no Estado do Rio de Janeiro. – Universidade Federal do Rio de Janeiro,Chemistry Institute, Graduate Program in Food Science, Rio de Janeiro, 2006.
Novaes, F. V. (1994). Noções básicas sobre a teoria da destilação. Piracicaba: ESALQ/Departamento de Ciência e Tecnologia Agroindustrial, 1994. 22p.
Novaes, F. V. (1999). Produção de aguardente de cana de alembic. In: Programa de Fortalecimento do Setorde Aguardente de Cana de Açúcar e seus Derivados do Estado do Rio de Janeiro. pub. SEBRAE- FAERJ-APACERJ, 45 p.
Nykänen, L. & Nykänen, (1991). Distilled beverages. In: Volatile compounds in foods and beverages. Marcel Dekker, Inc., Maarse, H. (Ed.), New York, pp. 548-576,
Peters, D. G., Hayes, J. M. & Hieftje, G. M. (1974). Chemical separations and measurements (1st ed.). Theory and practice of analytical chemistry. USA: WB Saunders Company, pp. 471–482.
Pinto, G. L. Fabricação de aguardente. Technical Report. Year 7, No 57, Universidade Federal de Viçosa, Nov.1986.
Reche, R.V.; Neto, AF; Silva, A.A. Galinaro C.A., Osti R.Z. & Franco, D.W. (2007). Influence of Type of Distillation Apparatus on Chemical Profiles of Brazilian Cachaças. J. Agric. Food Chem., 55, p.p. 6603-6608. ISSN 00218561.
Riffkin, H. L. , Bringhurst, T.A., McDonald, A.M.L. & Howlett, S.P. (1989) . Ethyl carbamate formation in the production of pot still whisky. J. Inst. Brew., Edinburgh, v. 95, pp.115-119.
Riffkin, H. L.; Wilson, R. & Bringhurst, T.A. (1999). The possible involvement of Cu II peptide/ protein complexes in the formation of ethyl carbamate. J. Inst. Brew., Vol. 95, pp. 121-122. ISSN 0046-9750
Schehl, B. (2005). Development of a genetically defined diploid yeast strainfor the application in spirit production. Doctor Thesis, University of Hohenheim, Stuttgart. Universidade de Hohenheim, Stuttgart, Alemanha. Retrieved from
<http//:www.unihohenheim.de/ub/opus/volltexte/2005/119/pdf/Dissertation_Schehl_ B.pdf>.
Stupiello, J. P. (1992). Destilação do vinho. In: Mutton, M. J. R.; Mutton, M. A. Aguardente De Cana: Produção E Qualidade. Jaboticabal, São Paulo: FUNESP/ UNESP (Ed.), p. 67-78.,
Taki, N. et al. (1992) Cyanate as a precursor of ethyl carbamate in alcoholic beverages. Jpn. J.Toxicol. Environ. Health, Vol. 38, No 6, pp. 498-505. ISSN 0013-273X.
Tham, M.T. (nd) Distillation, an introduction. 22.10. 2006. Available from <http://lorien.ncl.ac.uk/ ming/distil/distil0.htm> Tonéis & Cia (nd) . Cachaça: aguardentes industriais e artesanais. 11.10.2005. Available from
http://toneis.com.br/modules.php?name=News&file=article&sid=105
8
Spirits and Liqueurs from Melon Fruits (Cucumis melo L.)
Ana Briones, Juan Ubeda-Iranzo and Luis Hernández-Gómez Laboratory of Yeast Biotechnology,
University of Castilla La Mancha, Ciudad Real Spain
1. Introduction Melon fruits, Cucumis melo L, are perishable and must be brought to market very quickly, which leads to saturation of the market and a surplus of melons. Increasing melon production has brought a serious marketing problem. Its fermentation and distillation could represent a potential solution to the problem. A review of the literature and other information sources failed to turn up prior experience with transformation of melon by means of alcoholic fermentation, making it necessary to develop a research protocol for investigating the suitability of melon juice, paste without or with skins and seeds as a fermentation substrate and behaviour of the resulting melon wine during distillation, with a view to obtaining a melon spirit or liqueur with appropriate flavour and aroma attributes.
Distillation of fermented fruit wines has been used in some countries for many years to obtain palatable beverages with high alcohol contents. The most important distilled spirits are elaborated from diverse raw material as grapes (Brandy, Grappa, Orujo), malt (Whiskey), cane sugar (Rum), etc. Other distilled beverages come from the distillation of fermented fruits, named in some zones “wine fruits” , such as cherries, apples or pears. Several countries produce spirits obtained by steam distillation of the anaerobically fermented grape pomace, left over after grapes have been crushed during wine-making. These spirits contain 30-45 % (v/v) alcohol and are highly appreciated, especially after gourmetmeals.
In Spain, the distillation of the grape wine and its by-products is frequent, but is unusual the distillation of “wine fruits”. Actually, the maceration of agricultural products, generally fruits, or the addition of artificial essences and aromas to wine spirits is made to elaborate different kinds of liquors, though natural cherry or pear spirits have been developed years ago.
Most commercially available spirits (grappa, orujo, bagaceira, kirsch, plum, brandy) are filtered, bottled, and sold without maceration. However, on occasion fruits, seeds, and leaves are used as substrates to modify the product and improve its sensory qualities diversifying their range and attributes. This process is used in Spain to make a number of drinks, such as “pacharán” (maceration of sloe, Prunus spinosa, berries) or “anisette” (maceration of anise, Pimpinella anisum, seeds). During maceration, aromatic substances are
Distillation – Advances from Modeling to Applications
184
leached out of the fruit into the spirit, which may then be redistilled or bottled as the finished product. Maceration time is a key factor both for component extraction and for achieving the right sugar content and colour of the spirit. The amount and the parts of the fruit used in maceration are two other aspects to be considered. For fleshy fruits like pears, apples, raspberries, strawberries, and cherries, pieces of fresh fruit may be used, or the seeds or nuts (blackthorn, hazelnuts, almonds) may be employed. Substrate conditioning is also an important factor, and may include pieces of fruit of different sizes, seeds, placenta, or skins depending on the type of product being manufactured.
Melons are a major crop in the La Mancha region (Spain) and the large crop size results in high levels of surplus production which must be commercialised in a very short period of time. The fermentation of melons and its distillation to produce genuine spirits could be a solution to the problem of the saturation of the market that would prevent wastage. The process of developing a new product has to be undertaken step by step, and for that reason trials to examine fruit processing, clarification, fermentation, column and alembic distillations were performed at laboratory and pilot scale (Briones, et al., 2002; Hernández Gómez, et al., 2003). Chemical and sensory analyses were carried out to assess the quality of the spirits and liqueurs produced comparing the results with those in other commercially available spirits.
2. Fruit processing Healthy melons, Cucumis melo L, of the varieties “Piel de sapo”, “Ruidera” and “Sancho” coming from cultivars of La Mancha region in Spain were processed. Melons were washed and divided into three sets and processed in different ways to obtain three substrate types ready for their fermentation:
* Juice: The melons were hand-peeled, cut up into pieces manually, after that crushed and peeled in a horizontal des-temmer with rollers to produce a paste that was then pressed in a pneumatic vertical press
* Paste without skin ("pws"): The melons were processed as described above, but not pressed.
* Paste: The unpeeled melons were cut up into pieces directly and then crushed to form a paste that included the skins.
The yield of an industrial process must be calculated carefully since it is of great economic importance as well as conventional fermentation parameters such as ºBrix, reducing sugars, volatile acidity, pH and alcohol degree. The yield (w/w) of the processed fruits depended on the substrate assayed. Therefore in the case of the paste it can reach 100%, 70% (30% of skin) for the pws and only 50% for the juice. This was mainly caused by the percentage of melon removed as skin in the case of the “pws” and by difficulties in filtering the melon paste to produce the “juice”. Juice extraction yields of up to 75 % have been attained for other fermented products, such as grape because of the small weight of the skins. These yields were improved and an increase of 10 % were recorded for the juice and pws substrates, perhaps thanks to optimization of procedures. By-product yields were 21 % (w/w) of skins for the pws substrate and 40 % (w/w) skins and pressed pulp for the juice substrate (Hernández-Gómez et al, 2005a).
Spirits and Liqueurs from Melon Fruits (Cucumis melo L.)
185
The initial pH of the different substrates varied between 4.4 and 5.2. and this supposes a problem for the easy growing of lactic and acetic acid bacteria; for that, pH was adjusted or not before the fermentation by adding citric acid to reach values around 4 in order to inhibit these bacteria.
3. Characterisation of fermented from melon fruits Fermentation of the juice, pws and paste was carried out at 20 °C. The substrates were inoculated with a commercial yeast (Saccharomyces cerevisiae UCLM 325) up to a concentration of approximately 106 cells/mL. The process was monitored daily by measuring residual sugars, and the end of fermentation was determined on the basis of the sugar consumption (OIV, 1969). The initial assimilable nitrogen was measured using the NitroGenius® kit.
Judging from the initial ºBrix, between 10,0-10,2 an alcohol degree of 5% (v/v) could be expected. Nonetheless, experimental data showed that the ethanol yield was acceptable only in juice and pws (4.2 % v/v), being very low (3.4 %) in the case of the paste, possibly due to the complexity of the structure of the fermentation media.
The fermented paste showed the highest values of acetic acid possibly as a consequence of a contamination by acetic bacteria. Adjusting the pH, successfully bacterial growth in all three melon wines produced was diminished. Under unadjusted pH conditions, the bacterial populations increased in the pws and paste substrates but decreased in the juice. This may be attributable to a higher level of contamination from the melon skins or to sluggish fermentation in a complex media like paste substratum.
In this kind of alcoholic beverages, concentrations of the volatiles has to be refereed to the ethanol content. Otherwise, the volatile composition is closely related to the type of substratum, the conditions of the fermentation and the yeast strain used. Respecting the major volatiles, acetaldehyde ranged widely from 243 to 1196 mg/L of ethanol, being highest in the pH-unadjusted substrates, possibly due to the action of spoilage microorganism (Silva et al., 2000). Methanol is not a direct product of fermentation (Ribéreau-Gayon et al., 2000). Two types of fruit enzymes are able to act upon pectins to release methanol: polygalacturonases, by cleavage of the glycosidic bonds on the chains; and pectin-Methylesterases, by catalyzing hydrolysis of the esterified chemical function (Hernández Gómez et al., 2003). The presence of high amounts of methanol in the wine fruit produced from the paste at both pH levels may be the result of the action of these enzymes in the skin.
In general the higher alcohols (HAs) quantified [1-Propanol, isoAmyl alcohols , 1-Butanol, and 2-Methyl-1-Propanol] were higher with pH adjusted, especially in the case of the wine made from the pws. 1-Butanol and 2-Butanol were not detected, a highly positive finding, because these two substances adversely affect the final aroma of the distillate. Total esters were higher in the pH-unadjusted wine made from paste than in the rest of the wines. Ethyl lactate was the main contributor to this high value and probably depends on the initial count of lactic acid bacteria, present in this kind of substratum (Briones et al. 2002).
When ANOVA statistical analysis was applied it was noticed that except for Ethyl acetate, there were differences in the volatiles for all the melon wine types, especially between the wines made from the paste and the rest.

Distillation – Advances from Modeling to Applications
186
4. Distillation procedure and analysis of spirits Upon completion of alcoholic fermentation, the fermented were immediately distilled with yeast lees in two ways in previous assays: in rectifying glass column and in French type copper pot. In the first case, a glass column of 50 cm of length and filled up to 50% with Raschig rings and a round bottomed 10 L flask were used. The flask was filled with 5 L of every type of fermented fruit. To ensure a homogenous heat distribution during the distillation process, boiling stones were added and the flow rate was adjusted at 10mL min-1. In the second case, a 30 L French type copper pot filled with 15 L of fermented fruit was used and the flow rate was adjusted at 25 mL min-1. In both cases the fermented were double distilled. The first distillation was stopped when the alcohol degree was lower than the fermented fruit, obtaining a distillate around 17-20% (v/v). In the second distillation, the first phase was the collection of 0.8% of distillate (heads) which was discarded. This distillation was stopped at around 30% (v/v), so the final distillate (heart fraction) reached an alcohol concentration around 55% (v/v). The tails were formed adding the fractions ranging from 30 % (v/v) to 5 % (v/v). The distillate was collected in fractions of different volums depending of the equipment used. In these kind of processes and in order to avoid the loss of aromas all the fractions were collected on ice and kept at 4ºC until their analysis. The percentage alcohol content in all of them was determined by electronic densimetry in all the fractions (European Union, 2000). The heart fraction alcohol degree values are shown in Table 1. In both distillations (copper pot and column) the alcohol degree of the paste was lower because the initial degree of the fermented was also inferior.
Alcohol degree (% v/v)
1st fraction 2nd fraction 3th fraction Average value
Copper pot Juice 68.6 61.5 44.2 58.1 Pws 65.6 52.1 27.9 48.5 Paste 69.8 62.8 44.6 59.1
Column Juice 79.5 60.5 12.3 50.8 Pws 80.0 61.3 11.2 50.8 Paste 75.0 54.0 10.6 46.5
Table 1. Alcohol degree of second distillation for different fractions collected in the copper pot and in the glass column
Respecting the chemical analysis of major volatiles, the glass column samples possessed higher concentrations of Propanol, 2-Methyl 1-Propanol and 3-Methyl 1-Butanol. Moreover, the sensory analysis of the first batch of distillates offered conclusive results so as to the distillation type. 100% tasters preferred the samples distilled in the copper pot due to its aroma intensity while the other ones coming from glass column were rejected on basis of their pungent and /or “not sufficiently intensive” aroma.
With regard the type of substrate, even though the “paste” type offered a better yield in the process, it does not seem to be the ideal substrate due to the sluggish of fermentation, a high methanol content and the negative sensory characteristics. Juice distillate was more appreciated due to its aroma intensity (Hernández-Gómez et al., 2008).
To compare the results with those from previous years using a glass column, and thus narrow down the production processes, a pilot-plant copper pot, alquitara, was used. At the
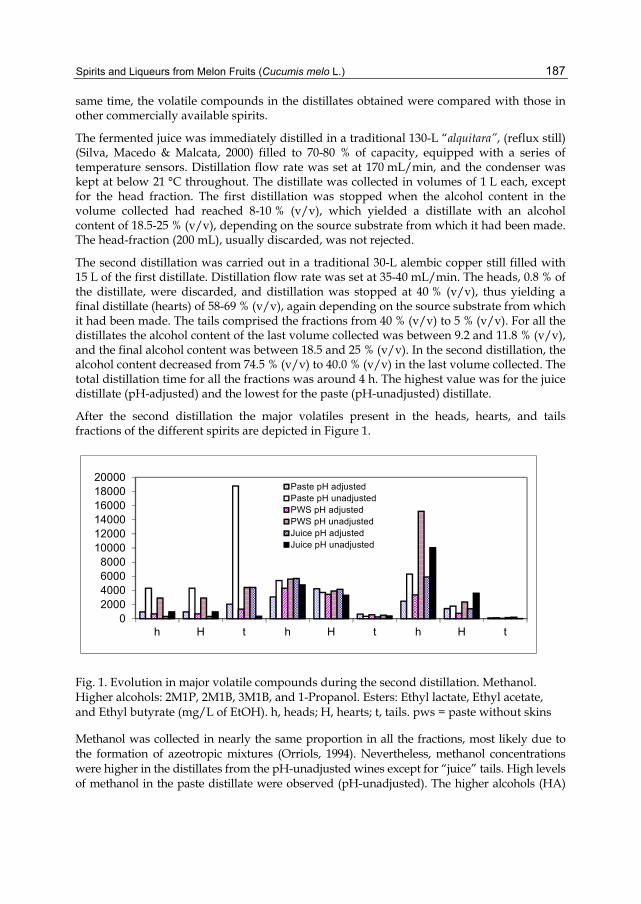
Spirits and Liqueurs from Melon Fruits (Cucumis melo L.)
187
same time, the volatile compounds in the distillates obtained were compared with those in other commercially available spirits.
The fermented juice was immediately distilled in a traditional 130-L “alquitara”, (reflux still) (Silva, Macedo & Malcata, 2000) filled to 70-80 % of capacity, equipped with a series of temperature sensors. Distillation flow rate was set at 170 mL/min, and the condenser was kept at below 21 °C throughout. The distillate was collected in volumes of 1 L each, except for the head fraction. The first distillation was stopped when the alcohol content in the volume collected had reached 8-10 % (v/v), which yielded a distillate with an alcohol content of 18.5-25 % (v/v), depending on the source substrate from which it had been made. The head-fraction (200 mL), usually discarded, was not rejected.
The second distillation was carried out in a traditional 30-L alembic copper still filled with 15 L of the first distillate. Distillation flow rate was set at 35-40 mL/min. The heads, 0.8 % of the distillate, were discarded, and distillation was stopped at 40 % (v/v), thus yielding a final distillate (hearts) of 58-69 % (v/v), again depending on the source substrate from which it had been made. The tails comprised the fractions from 40 % (v/v) to 5 % (v/v). For all the distillates the alcohol content of the last volume collected was between 9.2 and 11.8 % (v/v), and the final alcohol content was between 18.5 and 25 % (v/v). In the second distillation, the alcohol content decreased from 74.5 % (v/v) to 40.0 % (v/v) in the last volume collected. The total distillation time for all the fractions was around 4 h. The highest value was for the juice distillate (pH-adjusted) and the lowest for the paste (pH-unadjusted) distillate.
After the second distillation the major volatiles present in the heads, hearts, and tails fractions of the different spirits are depicted in Figure 1.
02000400060008000
100001200014000160001800020000
h H t h H t h H t
Paste pH adjustedPaste pH unadjustedPWS pH adjustedPWS pH unadjustedJuice pH adjustedJuice pH unadjusted
Fig. 1. Evolution in major volatile compounds during the second distillation. Methanol. Higher alcohols: 2M1P, 2M1B, 3M1B, and 1-Propanol. Esters: Ethyl lactate, Ethyl acetate, and Ethyl butyrate (mg/L of EtOH). h, heads; H, hearts; t, tails. pws = paste without skins
Methanol was collected in nearly the same proportion in all the fractions, most likely due to the formation of azeotropic mixtures (Orriols, 1994). Nevertheless, methanol concentrations were higher in the distillates from the pH-unadjusted wines except for “juice” tails. High levels of methanol in the paste distillate were observed (pH-unadjusted). The higher alcohols (HA)
Distillation – Advances from Modeling to Applications
188
content was higher in the heads and hearts than in the tails. All the distillates displayed the same behaviour, with no considerable differences among them. In addition, the HA content was not related to the fermentation pH and substrate types. The ester content (Ethyl acetate, Ethyl lactate, and Ethyl butyrate) was higher in the heads, decreasing in the hearts and the tails. Fermentation pH had a pronounced influence on the ester content.
Respecting the concentrations of the volatiles in the final spirits, high amounts of methanol and 2-Butanol were noticed. They can make spirits hazardous to consumers health. Moreover, methanol imparts a cooked cabbage odour, with a threshold of 1200 mg/L (Ribéreau-Gayon, et al., 2000). The methanol content was higher in the distillates made from the pH-unadjusted in all substrates. The paste distillates exhibited the highest levels, probably owing to the action of certain pectinases on the substantial amount of melon skins present (Cortés Diéguez, et al, 2000). However, in no case did the levels exceed the limits for fruit spirits set by the legislation currently in force (European Union, 1989).
Higher alcohols are responsible for imparting complex sensory attributes to spirits (Silva et al., 2000). The Amyl alcohols and 2-Methyl 1-Propanol contribute positive to the sensory characteristics (Bertrand, 1975; Orriols, 1992, 1994). They are detectable organoleptically at concentrations below 15 mg/L of ethanol (Tourliere, 1977). 1-Propanol has a pleasant, sweetish odour, but excessive concentrations will introduce solvent notes that mask all the positive notes in distillates (Fundira, Blom, Pretorius, & van Rensburg, 2002). The highest 1-Propanol contents were recorded in the distillates made from the pH-adjusted fermentation substrates, in contrast, 2M1P was lower in the pH-adjusted distillates at levels similar to those reported in previous years. Amyl alcohol contents were very similar in all cases. 1-Butanol has a heavy, penetrating odour, and 2-Butanol is associated with low-quality raw materials (Orriols & Bertrand, 1990; Cortes Dieguez et al., 2000). 1-Butanol concentrations were higher in the pH-adjusted distillates. Conversely, 2-Butanol was not detected in any of the distillates produced. 2-Phenylethanol imparts a very clinging, rose-like aroma (Nykänen & Suomalainen, 1983), and was not influenced by pH, except in the juice distillates. 1-Hexanol, cis-3-Hexen-1-ol, and 3-Methyl-3-buten-1-ol impart strong herbaceous aromas. Hexanol and cis-3-Hexen-1-ol perception thresholds in spirits are 20 mg/L and 3.5 mg/L, respectively (Jouret & Cantagrel, 2000), and the concentrations did not exceed those values. Smoked or burnt wood aroma is conferred by 4-Methyl-guaiacol (Dubois & Dekimpe, 1982), and it was present in all distillates except the pH-adjusted juice. Benzyl alcohol is related to the quantity of benzaldehyde, the latter being important because it imparts a bitter almond aroma to wines at levels above 2-3 mg/L (Blaise, 1986). In the melon spirits, concentrations were nowhere near that perception threshold reported for wines.
Otherwise, Acetaldehyde is 90 % of the total aldehyde content in distillates (Versini, Monetti, dalla Serra & Inama, 1990, Orriols, 1991; Silva, Malcata, & Hogg, 1995). More than 1200 mg/L of ethanol is evidence of oxidation of the ethanol during alcoholic fermentation or a enzymatic pyruvic acid decarboxylation (Baro & Quiros-Carrasco, 1977; Cantagrel, Lablanquie, Snakker, & Vidal, 1993). Its importance derives from its pungent odour and its chemical reactivity (Silva et al., 2000). pH had no effect in juice and pws substrates, in contrast, it was doubled in pH-adjusted paste distillate. Furfural may be formed as a result of oxidation of ascorbic acid (Bayonove, Baumes, Crouzet, & Günata, 2000). A slightly higher furfural content in the distillates from the pH-unadjusted substrates was observed.

Spirits and Liqueurs from Melon Fruits (Cucumis melo L.)
189
Esters are associated with pleasant odours. This is particularly true of Ethyl acetate, which contributes to aroma complexity and has a positive impact at very low levels (50-80 mg/L) (Steger & Lambrechts, 2000). Ethyl acetate was higher in the distillates pH-unadjusted. Ethyl lactate contributes intense, long-lasting aromas (Tourliere, 1977). The content in distillates is linked to lactic fermentation, in general it was lower in pH-adjusted distillates (Briones et al., 2002). Ethyl butyrate adversely influence the organoleptic quality of distillates (Soufleros, 1978,1987). Paste distillates at both pH had the highest concentrations. Concentrations of the minor esters, other than Ethyl lactate and Ethyl acetate, were higher in the pH-adjusted distillates, due principally to Ethyl caprylate, Ethyl palmitate, Ethyl caproate, Ethyl laurate and Ethyl decanoate.
Respecting carboxylic acids, short-chain (C4-C12) fatty acids produce unpleasant odours, and high concentrations are an indicator of poor quality (Orriols, 1992,1994). Decanoic and octanoic acids were the most abundant fatty acids and were present at higher concentrations in the pH-adjusted distillates.
4.1 Comparison with commercial spirits
The major volatile compounds of melon spirit were compared with other commercial spirits such grappa, orujo, and other fruit distillates from cherry, raspberry and pear (Hernández Gómez et al, 2005a) . In general, 1-Propanol was higher in melon distillates, being similar to those in grappa and cherry spirit. In like fashion, Ethyl acetate was much higher in the juice distillate with a concentration nearly three times more than in the other spirits. Acetaldehyde and Ethyl lactate were present in similar amounts in most of the spirits considered, with the exception of much higher concentration of Ethyl lactate found out in the cherry spirit, most probably as a result of the lengthy maceration time. 2-Methyl 1-Propanol and Amyl alcohols were somewhat higher in the melon distillates, pear spirit, and grappa. The melon distillates had appreciably lower methanol contents than the rest of the spirits considered, particularly as compared to the pear spirit (11216 mg / L of ethanol), most likely because of the high pectin content of pears. 1-Butanol was detectable in the pear spirit and, to a lesser extent, in the melon distillates. 2-Butanol and Ethyl butyrate were not present in detectable amounts in any of the spirits analysed.
Sensory analysis was performed in a standard tasting room [Spanish standard 87004:1979 (Aenor, 1977). Distillates were diluted with distilled water to alcohol strength of 28 % (v/v) and served at a temperature of 15 ºC. Evaluations were carried out at daily sessions between 10:00 a.m. and 12:00 noon to prevent taster fatigue.
There were significant differences between juice distillates and pws and conversely, there were no significant differences between the paste distillates. The tasters preferred pws or juice distillates, but there was no preference between them. The expert tasters from a distilling company likewise expressed no preferences, possibly because the spirits being tested were new to them and had an unfamiliar flavour.
5. Maceration for improving melon spirit The effect of maceration in increasing and improving aroma intensity in a melon (Cucumis melo L.) spirit was studied.

Distillation – Advances from Modeling to Applications
190
Double-distilled melon spirit (alcohol content 56 % v/v) was macerated using different melon parts (pieces of melon flesh, skinned and then sliced (MF) (72.5 % w/v), and seeds+placenta (MSP) (23.5 % w/v). Contact times were 8 days, 18 days, and one year. The solid percentage was selected based on literature data (Xandri, 1958) and personal communications. After steeping, the distillate was chilled and filtered and the solids pressed and 0.3 g/L bentonite was added for clarification.
Sugar levels in the double-distilled spirit macerated with sliced melon flesh (MF) were four to five times higher than in the spirit macerated with the seeds+placenta (MSP), possibly due to the higher solids content (72.5 % in the MF batches compared with 23.5 % in the MSP batches). Total sugar levels stayed practically constant throughout maceration, though after maceration for one year saccharose levels fell while glucose and fructose levels rose by 80 and 60 %, respectively, perhaps because of hydrolysis of the disaccharide.
Dry matter (DM) was much lower (0.10 g/L) in the unmacerated control batch (C) than in the macerated spirit. The spirit macerated with sliced melon flesh for one year (MF1Y) had the highest values (26.95 g/L), compared with the spirit macerated with the melon seeds+placenta also for one year (MSP1Y), (21.53 g/L), because of the larger amount of macerated solids.
The alcohol content (% v/v) decreased in the macerated double-distilled spirit, the decrease being more pronounced in the macerates made with the sliced melon flesh, possibly attributable to absorption by the melon tissue and the release of larger amounts of water from the pieces of melon flesh.
Respect to the major volatiles, Methanol levels decreased with maceration but in all cases were within the limits set by the legislation currently in force (European Union, 1989) The higher alcohols (HAs), namely, 1-Propanol, 2-Methyl-1-Propanol, 2-Methyl-1-Butanol, and 3-Methyl-1-Butanol, and the esters Ethyl lactate and Ethyl acetate fell appreciably during maceration. These decreases were much more pronounced in the spirit macerated with the sliced melon flesh (MF8 and MF18) than in the spirit macerated with the seeds+placenta (MSP8 and MSP18). Ethyl butyrate was not detected. 1-Butanol, which has a very pungent and heavy aroma (Nykänen & Suomalainen, 1983), was present in lower concentrations in the macerated spirits, and theirs decrease could have a positive influence on the aroma of the final spirit.
Levels of Benzyl alcohol, 1-Hexanol, t-3-nonenol, c-3-Hexen-1-ol, 2-Phenylethanol, and geraniol were higher in the batches macerated with the sliced melon flesh and the seeds+placenta. 2-Phenylethanol imparts an aroma of roses (Nykänen & Suomalainen, 1983), and the concentration of this compound was three to four times higher than in the control spirit. At high levels 1-Hexanol and c-Hexen-1-ol may contribute herbaceous aromas, while at low levels they may exert a positive influence (Bertrand, 1975, Orriols, 1992, 1994).
On the whole, the ester content in the macerated spirits were lower than in the control spirit, with substantial decreases in Ethyl caproate, Ethyl caprylate, Ethyl decanoate, and Ethyl laurate. At the same time, Ethyl palmitate decreased in the spirit macerated with the sliced melon flesh but remained constant in the spirit macerated with the seeds+placenta because of the quantities that leached out of the melon seed (Al-Khalifa, 1996) . Ethyl linoleate and Ethyl linoleoate were also related to the seeds and increased considerably in the spirit macerated with the seeds+placenta.
Spirits and Liqueurs from Melon Fruits (Cucumis melo L.)
191
The concentration of total acids was lower in the macerated spirit, especially because of pronounced decreases in hexanoic acid, octanoic acid, and decanoic acid. Lauric acid levels increased considerably following maceration with both the sliced melon flesh and the seeds+placenta, possibly as a result of hydrolysis of Ethyl laurate.
Furfural is produced by acid hydrolysis or during the heating of polysaccharides containing hexose or pentose fragments, the highest concentrations being found in alcoholic beverages (1-33 mg/kg). This compound is currently allowed, since it is naturally present in fruits and other foodstuffs (European Union, 2002). Furfural and hydroxyMethyl furfural increased substantially in the spirit macerated with the sliced melon flesh as compared to the control spirit, but values were still within allowable limits.
The concentration of phenolic compounds was higher in the macerated spirit. This was particularly true for 4-Methyl-guaiacol, which increased appreciably in the spirit macerated with the sliced melon flesh. In wine this compound has a negative impact on aroma at levels higher than 4 mg/L but a positive impact at concentrations between 1.2 and 2.4 mg/L (Etiévant, et al., 1989).
Benzaldehyde, a carbonyl compound, decreased in the macerated spirit. Concentrations of this substance higher than 2-3 g/L are related to a bitter almond flavour in wines (Blaise & Bruns, 1986) .
Increased levels of acetoin (3-hydroxy-2-butanone) act as an indicator of oxidation of 2-3 butanediol during ageing (Jouret & Cantagrel, 2000). The increase was higher in the spirit macerated with the sliced melon flesh.
In the colour attribute determinations, the tristimulus values, to derive the rectangular (L*, a*, b*), cylindrical (L*, C*, h*) and the chromaticity (x, y, z) coordinates were used (CIE, 1986). The coordinates a*, b*, h*, and C* yielded the two-dimensional (CIELAB) colour space, where h* is the angle formed with the a* axis and C* is the distance to the origin. Sample MSP1Y had the highest colour intensity (C*) values, and in terms of chromaticity values, and MSP18 was similar to sample MF1Y. Variation in the angle (h*) was minimal, with angles in the range of 90.14 to 94.46. All the samples fell in the region pale, with macerated sample MSP1Y exhibiting the highest colour intensity and thus falling closer to the region of lightness. Thus, maceration affected both lightness (L*) and colour intensity (C*), with the unmacerated spirit and the spirit macerated with the sliced melon flesh being paler than the spirit macerated with the seeds+placenta.
Figure 2 represents the differences in colour (E*) between the macerated spirit and the control spirit and also lists the gradations in visual perception according to Schmidhofer, et al., (1994). The longest maceration time (1 year) exhibited higher E* values than the shorter maceration times, and the three macerations carried out with the seeds+placenta exhibited higher E* values than the macerations carried out with the sliced melon flesh.
The results of sensorial analysis thus indicate that maceration did have an influence on the final product and that the panelists perceived distinct differences between the samples.The distillate macerated for 11 days (MF11) and the unmacerated control batch were significant at the 99.9-% level.
The preference tests failed to yield any preference for either the macerate spirit or the control sample. This result is ascribable; on the one hand, to the diverse make-up of the taste

Distillation – Advances from Modeling to Applications
192
MSP8: seed+placente 8 days macerate; MSP18: seed+placente 18 days macerate; MSP1Y: seed+placente 1 year macerate; MF8: flesh 8 days macerate; MF18: flesh 18 days macerate; MF1Y: flesh 1 year macerate
Fig. 2. Colour differences (ΔE*) between the macerated double-distilled spirit samples and the unmacerated control spirit (C) and perception levels as per Schmidhofer (1994).
panel and, on the other, to the fact that some panelists preferred a "flatter" spirit with traditional distillation aromas, while others preferred a spirit with an intensely “fruity” melon aroma.
5.1 Optimization of maceration process
A trial run at industrial scale is the final step in new product development. Maceration time and substrate are important factors, and the latter may include pieces of fruit of different sizes, seeds, placenta, or skins depending on the type of product being manufactured. For that preliminary trial macerations using melon (Hernandez-Gomez et al., 2005b) yielded positive results in terms of extraction of colour and typical melon aromas, suggesting that macerated spirit could be used to produce an authentic liqueur reminiscent of the fruit employed in production.
Different proportions of fruit were tested based on the results of previous maceration trials, taking unmacerated distillate and adding:
- Melon seeds + placenta in a proportion of 0.18 kg/L [MSPl1], 0.23 kg/L [MSPl2], and 0.28 kg/L [MSPl3]
- Melon pieces + seeds + placenta in a proportion of 0.40 kg/L melon pieces + 0.10 kg/L seeds + placenta (MPSPl1) and 0.30 kg/L melon pieces + 0.20 kg/L seeds + placenta (MPSPl2)
Maceration time was 16 d, and the sugar content was measured at 0, 4, 8, 12, and 16 days of maceration.
Respect to total sugars (fructose, glucose, and saccharose) at the end of the maceration period, the total sugar content in the macerated with melon pieces and seeds+placenta was double that of the batches macerated with seeds+placenta only basically as a result of
Spirits and Liqueurs from Melon Fruits (Cucumis melo L.)
193
diffusion out of the melon pieces and the larger proportion of macerated substrate. Analysis of each of the sugars separately revealed that due to hydrolysis of the disaccharide by the fruit enzymes, the saccharose content gradually decreased from day 8 on, while the glucose and fructose contents rose.
According to main volatile components concentrations of esters and higher alcohols, of great organoleptic importance (Baro & Quiros-Carrasco , 1977), were higher in the batches macerated with seeds and placenta and with melon pieces + seeds and placenta. Neither n-Butanol nor Ethyl butyrate were detected in any of the batches, a highly positive finding in that these compounds are deemed to produce off flavours when they are present in distillates.
For the colour measurements, the value of L* ranges from 0 for black to 100 for white and was extremely high for the spirits considered here, between 91.9 and 95.5, the highest value being recorded for the unmacerated distillate, which also had the lowest Chromaticity (C*). C* values increased with substrate content and maceration time, while lightness (L*) decreased with maceration time and was unrelated to the amount of macerated substrate.
All the batches can be grouped close together in the greenish yellow quadrant, though in the region closer to yellow. The macerated with melon pieces were greenish in colour and those with seeds+placenta were yellow-orange in colour because of the higher proportion of carotenoids..
Finally, the results of the preference test carried out on all the macerated batches as part of the sensory analysis indicated a slight though non-significant preference by panelists for the kirsch over the raspberry and melon spirits.
6. Melon liqueur At the same time, production of an authentic melon liqueur was addressed. Three melon liqueurs were prepared (Hernández-Gómez et al., 2009). The alcohol content was adjusted to 280 ml/L (28% v/v), and the saccharose content was 100 g/L (CAE, 1997).
The resulting liqueurs were thus:
- “Melon juice liqueur”: distillate + 200ml/L melon juice - “Melon spirit liqueur”: distillate + saccharose and distilled water to the corresponding
alcohol content - “Macerated liqueur“: macerated spirit + saccharose
Sensory analysis of the three liqueurs was based on preference tests in the same conditions as the sensory analyses described above. Nevertheless, none of the liqueurs was statistically preferred at the 95 % significance level, though the macerated melon liqueur received the highest scores. The product was novel and unrelated to the panelists' prior experience, and as a result while some of the panelists preferred the unmacerated distillate on account of its "clean" aroma, others preferred the macerated melon liqueur on account of its fruity aroma and melon flavour.
7. Conclusion Melon in the form of juice or paste without skin, constitutes an appropriate fermentation substrate, the sugars being consumed during fermentation to produce alcohol yields in

Distillation – Advances from Modeling to Applications
194
accordance with expectations. The paste substrate offers a better yield in the process, but it does not seem to be an ideal substrate.
Differences were observed in the contents of the major volatiles in the different melon wines. The fermentation pH brought about perceptible differences based on both the chemical and the sensory analysis. Adjusting the pH brought about substantial decreases in the acetaldehyde and methanol contents, a facet that will have to be borne in mind in the case of methanol in view of the maximum limits set by regulations. Nevertheless, the tasters expressed no preference between paste without skin and juice according to fermentation pH.
From an industrial standpoint, the paste without skin substrate can be regarded as preferable, because it produces less waste with a lower environmental impact and it is no necessary press the paste to obtain it.
Since no preferences were observed for any of the samples of first distillate macerated in between the two distillations, this procedure would not seem to be warranted to improve distillate quality, while conversely it would increase production costs by requiring higher melon consumption during maceration, greater investment in equipment (maceration tanks, presses, and screens), longer production times, and more processing steps.
In contrast, maceration of the final double-distilled spirit did enhance the colour and aroma attributes of the final product, hence further research will be needed to focus on achieving the right sugar levels, aroma intensity, and colour.
On the basis of the results obtained in the present study, maceration is considered unsuitable in that it is too costly for industrial purposes, would yield too much production waste requiring alternative uses, and failed to attain the golden colour of the spirits with melon pieces +seeds+placenta and with melon seeds+placenta.
From a sensory standpoint the taste panelists did not evince any preference between the two spirits, and consequently we would recommend melon seeds+placenta spirit for production on account of its deeper colour, its suitability for filtration, and its typical melon aroma, as well as its lower production costs.
Lastly, comparing the melon liqueur to other commercially available fruit spirits indicated that the acceptability of this product was similar to that of the other liqueurs tasted.
Consequently, it may be concluded that using fruits for spirit production may offer a viable industrial alternative that will help keep fruit output from going to waste.
8. References AENOR [Asociación Española de Normalización] (1977). Análisis Sensorial, vol. 1,
Recopilación de Normas UNE. Ed. AENOR Al-Khalifa, A.S. (1996). Physicochemical characteristics, fatty acid composition, and
lipoxygenase activity of crude pumpkin and melon seed oils. Journal of Agricultural and Food Chemistry, 44, 964-966.
Bayonove, C., Baumes, R., Crouzet, J., & Günata, Z. (2000). Aromas. In: Enología Fundamentos Científicos y Tecnológicos (pp. 137-176) Claude Flanzy, AMV, Mundi Prensa: Madrid

Spirits and Liqueurs from Melon Fruits (Cucumis melo L.)
195
Baro A.L. & Quiros-Carrasco, J.A. (1977). Les conditions de formation des aldéhydes dans les vins. Bulletin OIV 554, 253-264.
Bertrand, A. (1975). Recherches sur l'analyse des vins par chromatographie en phase gaseuze. Sc.D. Thesis, University of Bordeaux II, Bordeaux, France.
Blaise, A. & Bruns, S. (1986). Un phénomene enzymatique à L’origine du gout d’amande amére dans le vins. CR Acad. Agric Fr, 72 :2, 73-77
Briones, A.I., Hernández, L.F. & Úbeda, J.F. (2002). Elaboración de aguardiente de melón. Alimentación Equipos y Tecnología, 171, 47-52
C.A.E. (Código Alimentario Español) [Spanish Food Code]. Manufacture of fruit juice liqueur 330.28. 3rd Ed. Tecnos S.A. (1997).
Cantagrel, R., Lablanquie, O., Snakker, G., & Vidal, J.P. (1993). Caracteristiques analytiques d’eaux de vie nouvelles de Cognac de différentes récoltes. Relation analyse chimique-analyse sensorielle. Conaissance aromatique des cépages et qualité des vins. Revue Française d’Oenologie 5, 383-391.
CIE (Commission Internationale de l’Éclairage) (1986). Technical report. Colorimetry. 2nd Edition. CIE 15.2. Vienna.
Cortés Diéguez, S.M., Gil de la Peña, M.L. & Fernández Gómez, E. (2000). Influencia del nivel de prensado y del estado de conservación del bagazo en el contenido en metanol, acetato de etilo, 2-butanol y alcohol alílico de aguardiente de orujo. Alimentaria Octubre, 133-137.
Dubois, P. & Dekimpe, J. (1982). Constituans volatils odorants des vins de Bourgogne éleves en fûts de chêne neufs. Rev Fr Oenol, 88, 51-53.
Etiévant, P.X., Issanchou, S., Marie, S., Ducruet, V. & Flancy, C. (1989). Sensory impact of volatile phenols on red wine aroma: influence of carbonic maceration and time of storage. Science Alimentation 9, 19-33
European Union (1989), Council Regulation (EEC) No 1576/89 of 29 May 1989 laying down general rules on the definition, description and presentation of spirit drinks.
European Union (2002). Scientific Committee on Food. Working Group on Flavouring. SCF/CS/FLAV/FLAVOUR/11ADD1. Opinion of the Scientific Committee on Food on furfural and furfural diethylacetal.
Fundira, M., Blom, M., Pretorius, I.S., & van Rensburg. (2002). The selection of yeast Starter Culture Strains for the Production of Marula Fruit wines and Distillates. Journal of Agricultural and Food Chemistry 50, 1535-1542
Hernández Gómez, L.F., Úbeda, J.F. & Briones A.I. (2003). Melon fruit distillates: comparison of different distillation methods. Food Chemistry, 82, 539-543.
Hernández-Gómez L.F., Úbeda-Iranzo J, García-Romero E., Briones-Pérez A.I. (2005a). Comparative production of different melon distillates: chemical and sensory analyses. Food Chemistry 90, 115-125 .
Hernández Gómez, L.F., Úbeda, J.F., & Briones, A.I. (2005b). Role of maceration in improving melon spirit. European Food Research and Technology, 220, 55-62.
Hernández-Gómez L.F., Úbeda-Iranzo J, Briones-Pérez A.I. (2008). Characterisation of wines and distilled spirits from melon (Cucumis melo L.) International Journal of Food Science and Technology, 43, 644-650
Hernández-Gómez L.F., Úbeda-Iranzo J, Arévalo-Villena, M., Briones-Pérez A.I. (2009). Novel alcoholic beverages: production of spirits and liqueurs using maceration of melon fruits in melon distillates. Jounal of Science Food and Agricultural, 89, 1018-1022
Distillation – Advances from Modeling to Applications
196
Jouret, C., & Cantagrel, R. (2000). Aguardientes de origen vitivinícola. In Enología Fundamentos Científicos y Tecnológicos (pp. 659-676) Claude Flanzy, AMV, Mundi Prensa: Madrid.
Nykänen, L. & Suomalainen, H. (1983). Aroma of beer and distilled alcoholic beverages. D. Riedel Publishing Company, Boston
OIV [Office International de la Vigne et du Vin] (1969). Recueil des Méthodes Internationales d´Analyse des Vins [Compendium of International Methods of Analysis of Wine and Musts].
Orriols, I. (1991) Los aguardientes de orujo gallegos. Diferentes sistemas de elaboración; Componentes volátiles característicos. Vitivinicultura 7, 58-63.
Orriols, I. (1992). Importancia del control de las diferentes etapas de la destilación para la obtención de un aguardiente de calidad. In: Proceedings I Jornada Técnica sobre a Aguardente. Ourense, Galicia, Spain. pp. 85-95.
Orriols, I. (1994) Tecnología de la destilación en los aguardientes de orujo. In: Proceedings I Congreso Internacional de la Vitivinicultura Atlántica. Pontevedra, (pp. 291-324), Spain
Orriols, I., & Bertrand, A. (1990). Los aguardientes tradicionales gallegos. Estudio de sus componentes volátiles y de la incidencia del estado de conservación sobre ellos. Vitivinicultura 3, 52-58.
Ribéreau-Gayon, P., Glories, Y., Maujean, A. & Dubordieu, D. (2000). The chemistry of wine, stabilisation and treatments. In: Handbook of Enology; John Wiley and Sons, New York.; Vol. 2, 41-54
Schmidhofer, T. (1994). Métodos analíticos. In: Prandl, O., Fischer, A., Schmidhofer, T. & Shinell, H.J. Tecnología e higiene de la carne. Parte E. 723-803. Acribia, S.A. Zaragoza. Spain.
Silva, M.L., Malcata, F.X. & Hogg, T.A. (1995). How do processing conditions affect the microflora of grape pomace? Food Science Technoloyi International 1, 129-136
Silva, M.L., Macedo, A.C. & Malcata, F.X. (2000). Review: steam distilled spirits from fermented grape pomace. Food Science and Technology 6, 285-300.
Soufleros, E. (1978). Les levures de la région viticole de Naoussa (Grèce). Identification et classification, etudes des produits volatides formés au cours de la fermentation. Sc.D. Thesis, University of Bordeaux II, Bordeaux, France.
Soufleros, E. (1987). Étude sur le Tsipouro, eaux-de-vie de marc traditionelle de Grèce, précurseur del'Ouzo. Conn Vigne Vin 21, 93-111
Steger, C., & Lambrechts, M.G. (2000). The selection of yeast strains for the production of premium quality South African brandy base products. Journal Industrial. Microbiology Biotechnoly 24, 431-440
Tourliere, S. (1977). Commentaires sur la presence d'un certain nombre du composés accompagnat l’alcool dans les distillants spiritueux rectifiés et les eaux-de-vie. Industries Alimentaires et Agricoles 94: 565-574.
Versini, G., Monetti A., dalla Serra A. & Inama S. (1990). Analytical and statistical characterization of grappa of different Italian regions. In: Bertrand A. (ed.), Proceedings I Symposium International sur les Eaux-de-vie Traditionnelles d’Origine Viticole. Paris, France: Lavoisier. pp 137-150.
Xandri Tagüeña, J.M. (1958). Elaboración de aguardientes simples, compuestos y licores. Primera Edición. Salvat Editores, S.A. Barcelona.

Part 3
New Applications and Improvements


9
Separation of Odor Constituents by Microscale Fractional Bulb-To-Bulb Distillation
Toshio Hasegawa Saitama University
Japan
1. Introduction An important task in natural products chemistry is finding new compounds with novel properties and structures. Moreover, in fragrance chemistry, the odors of constituents are evaluated and key compounds are identified that contribute to the scent profiles of fragrance materials. Figure 1 shows the general investigative process for achieving these goals of fragrance chemistry.
Fig. 1. General investigative process for identifying new odor compounds with novel properties and structures in fragrance organic chemistry.
Extraction of odor plants gives oils containing many compounds. A popular and useful method for analyzing the composition is gas chromatography/mass spectrometry (GC-MS),
Distillation – Advances from Modeling to Applications
200
which provides important information about the scent profiles of fragrant plants. The analytical advances in the latest GC-MS technology are remarkable. In testing for the presence of a particular compound, detection of trace amounts of the substance has become possible. Recently, the olfactometry (O) functionality was incorporated into the GC-MS method. That analytical method, GC-MS-O, enables the odors of each constituent in a mixture to be precisely evaluated. These advances in analytical technology are associated with the discovery of natural products with important properties, for instance, a unique flavor. However, because the level of analysis is extremely detailed, the number of components in the characteristic scent of a plant can become huge. For this reason, indentifying the important scent components out of the many components is nontrivial. As a solution, a method for measuring the relative strength of each constituent’s scent has recently been developed, and key findings have been reported. However, this method has the following problems.
1. As the number of components increases, the effort required for analysis becomes greater.
2. In a mixture of multiple components with similarly strong scents, the essential components are difficult to identify.
Such difficulties arise in elucidating the key fragrance constituents of essential oils obtained from fragrance materials, such as sandalwood and vetiver, which are currently used as base notes.
We found that the fragrances of these scent materials can be expressed by combining groups of scent components. These groups consist of several organic compounds that have similar structures and thus similar odor. The interaction between these constituents is vital to the odor. From an oil, it is important to separate the minimum odorant groups necessary to retain the characteristic fragrance of the scent material.
In this chapter, I will explain how to divide the odor oils from fragrant plants into groups with similar properties (structure, odor, etc.). I will also present the results of experiments conducted in my laboratory, which used popular and important scent materials.
Sandalwood (Santalum album, L.), vetiver (Vetiveria zizanioides), patchouli (Pogostemon patchouli), and frankincense (Boswellia papyrifera) are typical materials in traditional Japanese incense, and the essential oils obtained from these materials possess unique and valuable features such as providing the base notes for perfume. Although many studies on the constituents of these materials have been reported, the key compounds of their scent profiles remain unknown. Determining these scent profiles is a prerequisite to elucidating the key components of the characteristic odors of these materials.
In attempting such a determination, however, the following main issues must be overcome. Firstly, the fragrances of the scent materials are not formed by a mere superposition of individual scents. Secondly, the scent components of these materials have weak odors. Almost all researchers have recognized these issues, but previously developed methods have not been suitable for clarifying the odor characteristics. In our work, we reconsidered and revised previous methods and were able to successfully evaluate the scent profiles of these materials

Separation of Odor Constituents by Microscale Fractional Bulb-To-Bulb Distillation
201
2. Microscale fractional bulb-to-bulb distillation 2.1 General procedure of microscale fractional bulb-to-bulb distillation
Commercially available, a bulb-to-bulb distillation apparatus (see Fig. 2) is usually used to purify a small amount of organic material (10-500 mg) by distillation under vacuum. Glass bulbs of about 3-3.5 cm in diameter are connected in series. The joint between bulbs, for example, between bulb A and bulb B, is made of ground glass. The general procedure for performing a distillation on this apparatus is given below.
Fig. 2. Sketch of bulb-to-bulb distillation apparatus.
1. Oily sample is placed in bulb A. 2. The apparatus is evacuated. 3. Bulbs A, B, and C are placed into an oven and heated slowly. While the other bulbs are
being heated, bulb D is placed in a cooling bath (e.g., ice or water). 4. The first fraction is collected from bulb D. 5. Next, bulb C is removed from the oven and becomes a collection bulb. After cooling to
room temperature, bulb C, along with bulb D, is placed in a cooling bath. Then, bulbs A and B are heated.
6. Finally, bulb A is heated and bulbs B, C, and D are cooled.
Cooling all the bulbs outside the oven is a critical part of this procedure. Failure to do so will result in low recovery and poor separation.
Using this method, we can perform separations on small amounts of material (down to 10 mg) to obtain fractions with different boiling points.
2.2 Separation of odor constituents of representative incense by bulb-to-bulb distillation technique
We used fractional bulb-to-bulb distillation to evaluate the odors of oils obtained from incense materials (sandalwood, frankincense, etc.). We extracted the essential oils of the incense first with hexane and then with methanol. We compared the odors of the hexane-extracted essential oils to the original base materials. We found that the odors of the extracted oils were similar to the odors of the base materials. We performed the following fractional distillations to obtain the minimum odorant groups constituting the fragrances of
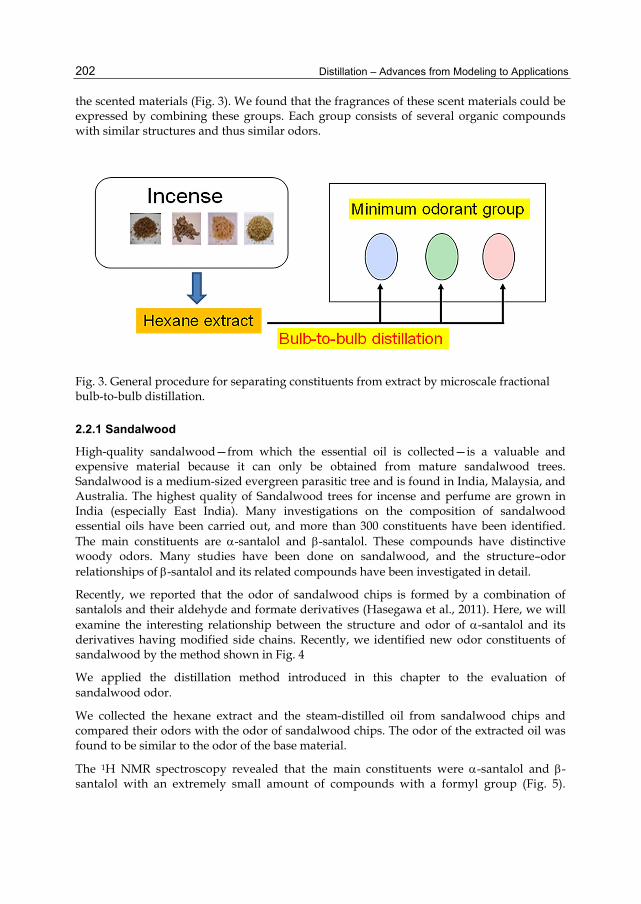
Distillation – Advances from Modeling to Applications
202
the scented materials (Fig. 3). We found that the fragrances of these scent materials could be expressed by combining these groups. Each group consists of several organic compounds with similar structures and thus similar odors.
Fig. 3. General procedure for separating constituents from extract by microscale fractional bulb-to-bulb distillation.
2.2.1 Sandalwood
High-quality sandalwood—from which the essential oil is collected—is a valuable and expensive material because it can only be obtained from mature sandalwood trees. Sandalwood is a medium-sized evergreen parasitic tree and is found in India, Malaysia, and Australia. The highest quality of Sandalwood trees for incense and perfume are grown in India (especially East India). Many investigations on the composition of sandalwood essential oils have been carried out, and more than 300 constituents have been identified. The main constituents are -santalol and -santalol. These compounds have distinctive woody odors. Many studies have been done on sandalwood, and the structure–odor relationships of -santalol and its related compounds have been investigated in detail.
Recently, we reported that the odor of sandalwood chips is formed by a combination of santalols and their aldehyde and formate derivatives (Hasegawa et al., 2011). Here, we will examine the interesting relationship between the structure and odor of -santalol and its derivatives having modified side chains. Recently, we identified new odor constituents of sandalwood by the method shown in Fig. 4
We applied the distillation method introduced in this chapter to the evaluation of sandalwood odor.
We collected the hexane extract and the steam-distilled oil from sandalwood chips and compared their odors with the odor of sandalwood chips. The odor of the extracted oil was found to be similar to the odor of the base material.
The 1H NMR spectroscopy revealed that the main constituents were -santalol and -santalol with an extremely small amount of compounds with a formyl group (Fig. 5).
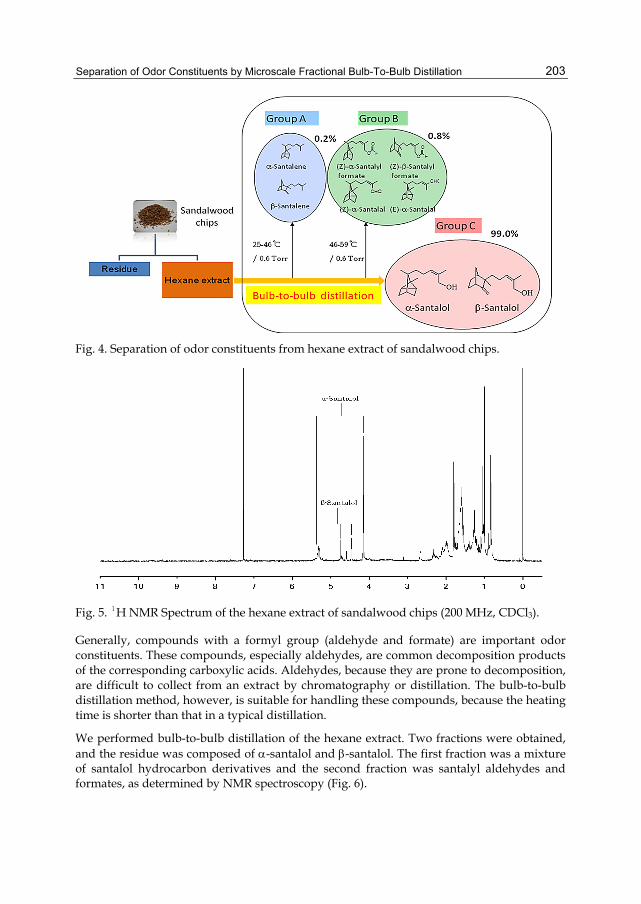
Separation of Odor Constituents by Microscale Fractional Bulb-To-Bulb Distillation
203
Fig. 4. Separation of odor constituents from hexane extract of sandalwood chips.
Fig. 5. 1H NMR Spectrum of the hexane extract of sandalwood chips (200 MHz, CDCl3).
Generally, compounds with a formyl group (aldehyde and formate) are important odor constituents. These compounds, especially aldehydes, are common decomposition products of the corresponding carboxylic acids. Aldehydes, because they are prone to decomposition, are difficult to collect from an extract by chromatography or distillation. The bulb-to-bulb distillation method, however, is suitable for handling these compounds, because the heating time is shorter than that in a typical distillation.
We performed bulb-to-bulb distillation of the hexane extract. Two fractions were obtained, and the residue was composed of -santalol and -santalol. The first fraction was a mixture of santalol hydrocarbon derivatives and the second fraction was santalyl aldehydes and formates, as determined by NMR spectroscopy (Fig. 6).

Distillation – Advances from Modeling to Applications
204
Fig. 6. 1H NMR spectrum of group B obtained from hexane extract by bulb-to-bulb distillation (200 MHz, CDCl3).
The obtained fractions were analyzed, and santalol derivatives with a formyl group (Group B) were found to play an important role in the odor of sandalwood chips. The diagram (Fig. 4) indicates the scent profile of sandalwood obtained by this method. -Santaol has been reported to be the principal constituent of sandalwood odor. In contrast, -santalol has been reported to be only a supporting component of sandalwood odor because -santalol has a weaker odor than does -santalol. However, we found that both -santalol and -santalol derivatives with a formyl group were important constituents of sandalwood odor.
This result demonstrates that bulb-to-bulb distillation is useful for collecting very small fractions from a mixture.
2.2.2 Patchouli
The unique woody aroma of patchouli is one of the four major woody notes derived from essential oils, and serves as an indispensable scent in modern fragrance. Although many studies have been performed, the key components that constitute this odor have not been successfully identified (Nabeta et al., 1993; Singh et al., 2002). Suitably appraising patchouli fragrance is crucial in order to produce potentially useful synthetic compounds.
Despite being a topic of investigation for many years, the complete odor profile of patchouli remains elusive for three reasons: first, the scents of individual compounds are weak; second, the compounds are structurally diverse and complex; and third, the aroma changes over time. To overcome these obstacles, we performed bulb-to-bulb distillation of the patchouli hexane extract, which had a similar odor as the base material.
The composition of the hexane extract of patchouli leaves was analyzed by 1H and 13C NMR spectroscopy. One constituent of the extract was found to be patchoulol, but its content was low and the other constituents were unidentified. We presumed that the
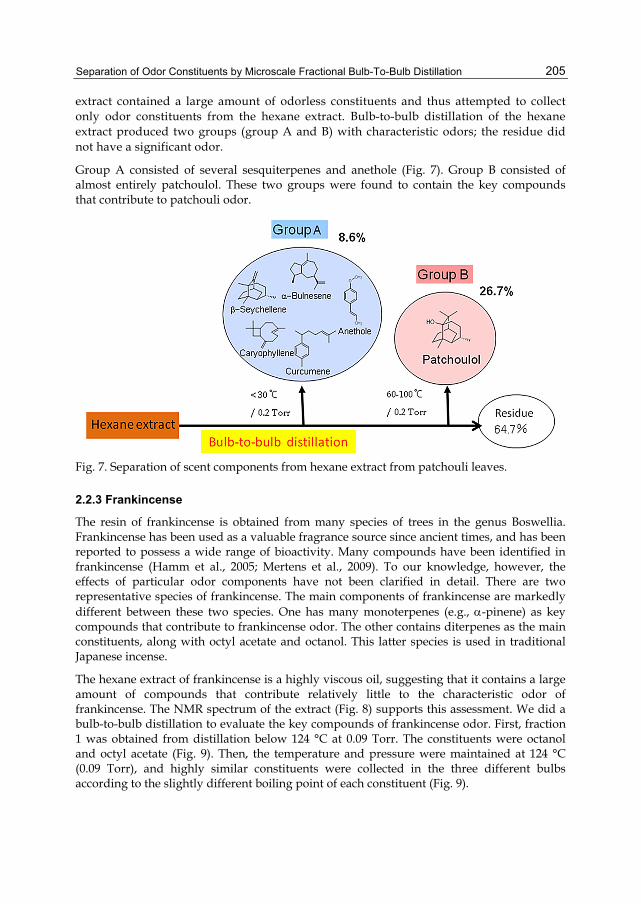
Separation of Odor Constituents by Microscale Fractional Bulb-To-Bulb Distillation
205
extract contained a large amount of odorless constituents and thus attempted to collect only odor constituents from the hexane extract. Bulb-to-bulb distillation of the hexane extract produced two groups (group A and B) with characteristic odors; the residue did not have a significant odor.
Group A consisted of several sesquiterpenes and anethole (Fig. 7). Group B consisted of almost entirely patchoulol. These two groups were found to contain the key compounds that contribute to patchouli odor.
Fig. 7. Separation of scent components from hexane extract from patchouli leaves.
2.2.3 Frankincense
The resin of frankincense is obtained from many species of trees in the genus Boswellia. Frankincense has been used as a valuable fragrance source since ancient times, and has been reported to possess a wide range of bioactivity. Many compounds have been identified in frankincense (Hamm et al., 2005; Mertens et al., 2009). To our knowledge, however, the effects of particular odor components have not been clarified in detail. There are two representative species of frankincense. The main components of frankincense are markedly different between these two species. One has many monoterpenes (e.g., -pinene) as key compounds that contribute to frankincense odor. The other contains diterpenes as the main constituents, along with octyl acetate and octanol. This latter species is used in traditional Japanese incense.
The hexane extract of frankincense is a highly viscous oil, suggesting that it contains a large amount of compounds that contribute relatively little to the characteristic odor of frankincense. The NMR spectrum of the extract (Fig. 8) supports this assessment. We did a bulb-to-bulb distillation to evaluate the key compounds of frankincense odor. First, fraction 1 was obtained from distillation below 124 °C at 0.09 Torr. The constituents were octanol and octyl acetate (Fig. 9). Then, the temperature and pressure were maintained at 124 °C (0.09 Torr), and highly similar constituents were collected in the three different bulbs according to the slightly different boiling point of each constituent (Fig. 9).
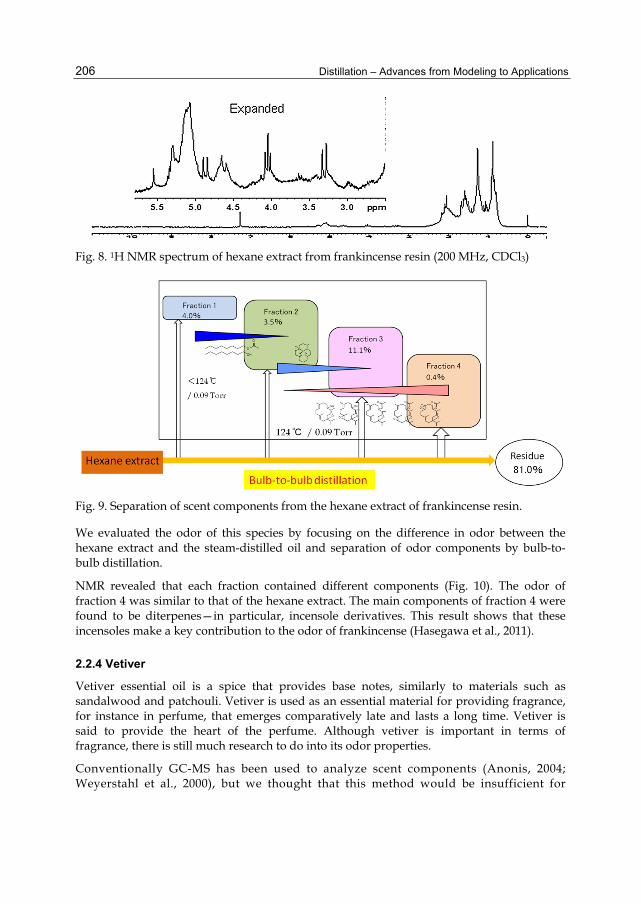
Distillation – Advances from Modeling to Applications
206
Fig. 8. 1H NMR spectrum of hexane extract from frankincense resin (200 MHz, CDCl3)
Fig. 9. Separation of scent components from the hexane extract of frankincense resin.
We evaluated the odor of this species by focusing on the difference in odor between the hexane extract and the steam-distilled oil and separation of odor components by bulb-to-bulb distillation.
NMR revealed that each fraction contained different components (Fig. 10). The odor of fraction 4 was similar to that of the hexane extract. The main components of fraction 4 were found to be diterpenes—in particular, incensole derivatives. This result shows that these incensoles make a key contribution to the odor of frankincense (Hasegawa et al., 2011).
2.2.4 Vetiver
Vetiver essential oil is a spice that provides base notes, similarly to materials such as sandalwood and patchouli. Vetiver is used as an essential material for providing fragrance, for instance in perfume, that emerges comparatively late and lasts a long time. Vetiver is said to provide the heart of the perfume. Although vetiver is important in terms of fragrance, there is still much research to do into its odor properties.
Conventionally GC-MS has been used to analyze scent components (Anonis, 2004; Weyerstahl et al., 2000), but we thought that this method would be insufficient for
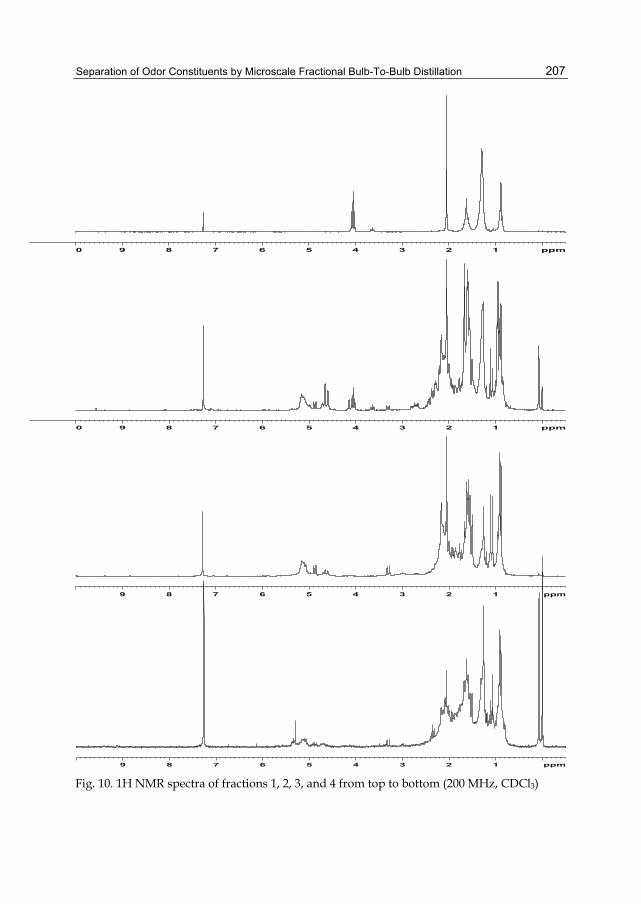
Separation of Odor Constituents by Microscale Fractional Bulb-To-Bulb Distillation
207
0 9 8 7 6 5 4 3 2 1 ppm
0 9 8 7 6 5 4 3 2 1 ppm
9 8 7 6 5 4 3 2 1 ppm
9 8 7 6 5 4 3 2 1 ppm Fig. 10. 1H NMR spectra of fractions 1, 2, 3, and 4 from top to bottom (200 MHz, CDCl3)
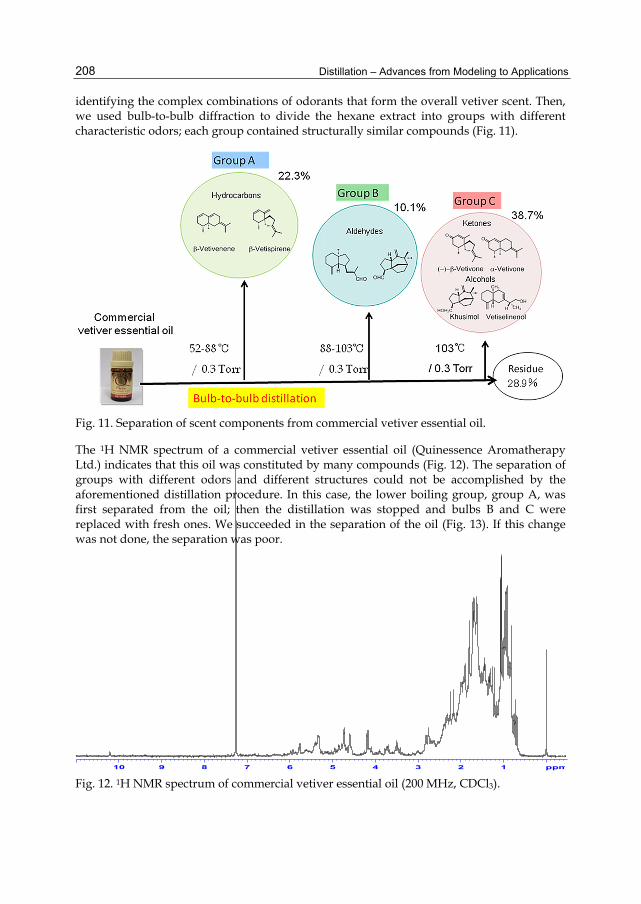
Distillation – Advances from Modeling to Applications
208
identifying the complex combinations of odorants that form the overall vetiver scent. Then, we used bulb-to-bulb diffraction to divide the hexane extract into groups with different characteristic odors; each group contained structurally similar compounds (Fig. 11).
Fig. 11. Separation of scent components from commercial vetiver essential oil.
The 1H NMR spectrum of a commercial vetiver essential oil (Quinessence Aromatherapy Ltd.) indicates that this oil was constituted by many compounds (Fig. 12). The separation of groups with different odors and different structures could not be accomplished by the aforementioned distillation procedure. In this case, the lower boiling group, group A, was first separated from the oil; then the distillation was stopped and bulbs B and C were replaced with fresh ones. We succeeded in the separation of the oil (Fig. 13). If this change was not done, the separation was poor.
10 9 8 7 6 5 4 3 2 1 ppm Fig. 12. 1H NMR spectrum of commercial vetiver essential oil (200 MHz, CDCl3).
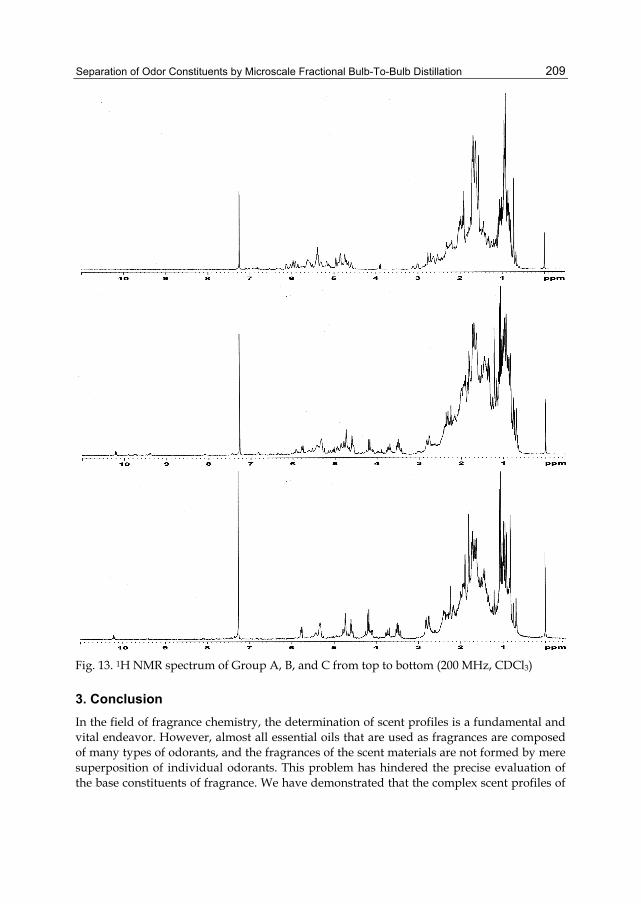
Separation of Odor Constituents by Microscale Fractional Bulb-To-Bulb Distillation
209
Fig. 13. 1H NMR spectrum of Group A, B, and C from top to bottom (200 MHz, CDCl3)
3. Conclusion In the field of fragrance chemistry, the determination of scent profiles is a fundamental and vital endeavor. However, almost all essential oils that are used as fragrances are composed of many types of odorants, and the fragrances of the scent materials are not formed by mere superposition of individual odorants. This problem has hindered the precise evaluation of the base constituents of fragrance. We have demonstrated that the complex scent profiles of
Distillation – Advances from Modeling to Applications
210
materials can be clarified by microscale fractional bulb-to-bulb distillation. To determine important components in natural materials with complex compositions, the method presented in this chapter is useful not only for perfumery chemicals but for many substances in natural products chemistry.
4. Acknowledgments I would like to thank Hideo Yamada at Yamada-matsu Co., Ltd., for providing plant specimens and contributing to sensory evaluations and fruitful discussions. I also would like to thank Shohei Tamada for work in early experiments on vetiver.
5. References Anonis, D. P. (2004) Perfumer & Flavorist, Vol. 29, pp. 30-36, ISSN 0272-2666. Hamm, S; Bleton, J; Connan, J.; Tchapla A. (2005) Phytochemistry, pp. 1499-1514, ISSN 0031-
9422. Hasegawa, T.; Kikuchi, A.; Yamada, H. (2011) The Journal of Essential Oil Research, 2011 ISEO
Abstracts, p. 8, ISSN 1041-2905. Hasegawa, T.; Toriyama, T.; Ohshima, N.; Tajima, Y.; Mimura, I.; Hirota, K.; Nagasaki, Y.;
Yamada, H. (2011) Flavour and Fragrance Journal, Vol.26, pp. 98-100, ISSN 0882-5734. Mertens, M.; Buettner, A.; Kirchhoff, E. (2009) Flavour and Fragrance Journal Vol. 24, pp. 279-
300, ISSN 0882-5734. Nabeta, K.; Kawauchi, J.; Sakurai, M. (1993) Development in Food Science, Vol. 32, pp. 577-589,
ISSN 0167-4501. Singh, M.; Sharma, S.; Ramesh, S. (2002) Industrial Crops and Products, Vol. 16, pp. 101-107,
ISSN 0926-6690. Weyerstahl, P.; Marschall, H.; Splittgerber, U.; Wolf, D.; Surburg, H. (2000) Flavour and
Fragrance Journal Vol. 15, pp. 395-412, ISSN 0882-5734.
10
Mass Transport Improvement by PEF – Applications in the
Area of Extraction and Distillation Claudia Siemer, Stefan Toepfl and Volker Heinz
German Institute of Food Technologies Germany
1. Introduction Mass transport processes in the food industry are mostly based on the diffusion of soluble products out of food tissue. The main barrier for the diffusion is the biological membrane separating the inner cellular material from the outside. A rupture of the membrane results in an enhanced diffusion rate resulting in a higher yield of the product located in the cell. Most methods used for disintegration of cellular material are mechanical, chemical or thermal based treatments. A new promising technique for cell rupture is the application of pulsed electric fields (PEF). The product is treated with pulses of microseconds at a high electric field strength. The electric field affects the cell membrane of the biological tissue in order to increase the permeability resulting in pore formation. Pore formation facilitates the diffusion process. Moderate PEF settings are used to achieve a disintegration of the cellular material. Some researchers define a moderate PEF treatment by applying a field strength of 0,5 to 1,0 kV/cm and treatment times in a range of 100 and 10.000 µs. The same effects were obtained by other researchers using electric field strengths of 1 to 10 kV/cm and shorter treatment times in the range of 5 to 100 µs (Schilling et al., 2007; Corrales et al., 2008; López et al., 2009).
It has been reported that PEF induces an increase of the mass transfer process resulting in a higher extraction of different intracellular materials, such as sucrose from sugar beet, betalains from red beetroot or polyphenols from grapes during the wine production. An increase in the extraction yield of juices from different fruits and vegetables has also been noted. The drying process can also be improved by PEF application. The reduction in the drying time yields a better end product quality. For example an accelerated osmotic dehydration and drying was reported for different fruits and vegetables, such as potatoes and pepper. An improvement of the distillation processes by PEF, for example distillation of rose oil was also reported.
The following chapter describes in detail the effect of PEF on the mass transfer and the related application fields.
2. Principle of action of cell disintegration using PEF technology The application of PEF using short pulses of a high voltage affects the membrane of a cell resulting in a permeabilisation of the biological membranes.
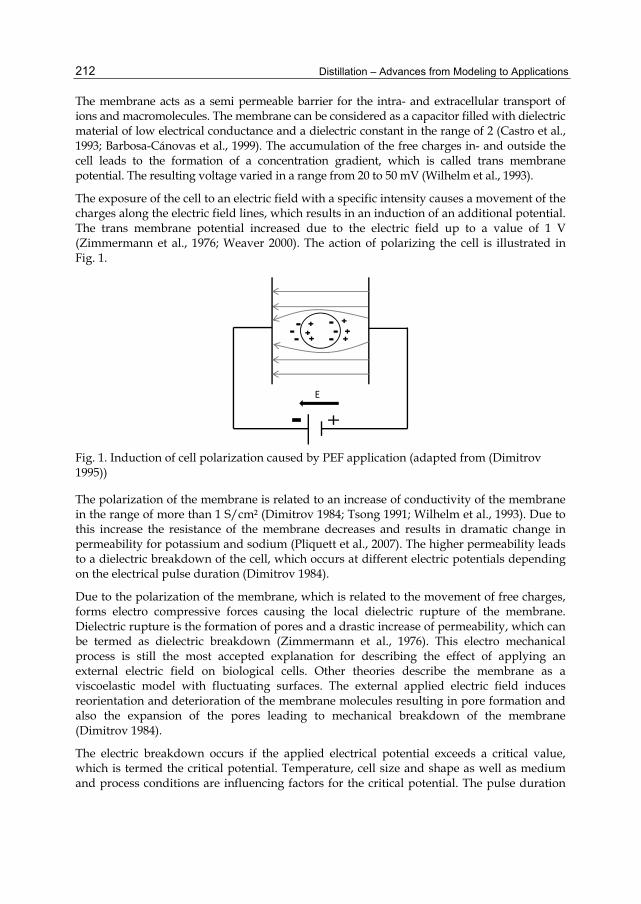
Distillation – Advances from Modeling to Applications 212
The membrane acts as a semi permeable barrier for the intra- and extracellular transport of ions and macromolecules. The membrane can be considered as a capacitor filled with dielectric material of low electrical conductance and a dielectric constant in the range of 2 (Castro et al., 1993; Barbosa-Cánovas et al., 1999). The accumulation of the free charges in- and outside the cell leads to the formation of a concentration gradient, which is called trans membrane potential. The resulting voltage varied in a range from 20 to 50 mV (Wilhelm et al., 1993).
The exposure of the cell to an electric field with a specific intensity causes a movement of the charges along the electric field lines, which results in an induction of an additional potential. The trans membrane potential increased due to the electric field up to a value of 1 V (Zimmermann et al., 1976; Weaver 2000). The action of polarizing the cell is illustrated in Fig. 1.
Fig. 1. Induction of cell polarization caused by PEF application (adapted from (Dimitrov 1995))
The polarization of the membrane is related to an increase of conductivity of the membrane in the range of more than 1 S/cm² (Dimitrov 1984; Tsong 1991; Wilhelm et al., 1993). Due to this increase the resistance of the membrane decreases and results in dramatic change in permeability for potassium and sodium (Pliquett et al., 2007). The higher permeability leads to a dielectric breakdown of the cell, which occurs at different electric potentials depending on the electrical pulse duration (Dimitrov 1984).
Due to the polarization of the membrane, which is related to the movement of free charges, forms electro compressive forces causing the local dielectric rupture of the membrane. Dielectric rupture is the formation of pores and a drastic increase of permeability, which can be termed as dielectric breakdown (Zimmermann et al., 1976). This electro mechanical process is still the most accepted explanation for describing the effect of applying an external electric field on biological cells. Other theories describe the membrane as a viscoelastic model with fluctuating surfaces. The external applied electric field induces reorientation and deterioration of the membrane molecules resulting in pore formation and also the expansion of the pores leading to mechanical breakdown of the membrane (Dimitrov 1984).
The electric breakdown occurs if the applied electrical potential exceeds a critical value, which is termed the critical potential. Temperature, cell size and shape as well as medium and process conditions are influencing factors for the critical potential. The pulse duration
Mass Transport Improvement by PEF – Applications in the Area of Extraction and Distillation 213
as a process condition leads to a lower critical potential if long pulse durations are applied (Dimitrov 1984).
The induced pore formation by the external electric field leads to an increase of the permeability of the membrane. Due to the intensity of the pulses reversible and irreversible pores can be formed. Reversible pores are formed, applying less energy than the critical potential. Using that intensity of the electric pulses stress reactions in plant cells can be induced and the production of secondary metabolites can be stimulated (Schilling et al., 2007). If the intensity of the electric pulses exceeds the critical potential irreversible pores are formed, which causes lethal cell damages. This potential can be applied to inactivate pathogen and non-pathogenic microorganisms or to facilitate the mass transfer and to improve the diffusion of intra- and extracellular liquids. The result of a facilitated mass transfer and improved diffusion is a facilitated distillation process due to the disintegration of cellular material by PEF (Dobreva et al., 2010).
Consequently applying PEF using intensities higher than the critical value two different effects can be observed. On the one hand inactivation of microorganisms (Heinz et al., 2001; Toepfl et al., 2007) and on the other hand the cell disintegration (Angersbach&Heinz 1997; Angersbach et al., 2000). The difference between these two effects is the applied intensity of the electric field and the specific energy, which represents two of the main process parameters of a PEF treatment. The electric field strength is defined as the electric potential difference (U) for two given electrodes in space divided by the distance (d) between them, separated by a non-conductive material (Zhang et al., 1995). The specific energy describes the intensity of the treatment with high intensity pulses and is expressed in kJ/kg. Because of the small size of the microorganisms and the composition of their membranes, a high energy input is required for a successful inactivation (Glaser et al., 1988).
For a microbiological inactivation of different vegetative microorganisms, which has been widely demonstrated by various researchers (Álvarez et al., 2000; Toepfl et al., 2007) an electric field strength of 15 to 20 kV/cm and a specific energy of 40 to 1000 kJ/kg is required. In contrast for a disintegration of cellular material lower values for electric field strength (range of 0,7 to 3 kV/cm) and a specific energy (range of 1 to 20 kJ/kg) is required (Corrales et al., 2008). The comparison of the values shows less energy is required for cell disintegration.
3. Determination of cell disintegration index The application of PEF induces a polarization of the cellular membrane resulting in an increased trans membrane potential. The increase leads to a rapid electrical breakdown and to local structural changes in the membrane. The result of the applied external electric field is the formation of pores related to an increase of permeability of the membrane. A permeabilisation influences the diffusion processes, for example increasing the extraction yield and shortening the distillation time. To make the best use of the permeabilisation, a maximum of cell disintegration is required. But it has to be noted that cell permeabilisation by PEF leads to a softer structure. An optimum for the PEF settings (process parameters) has to be defined as for some liquid solid separation techniques a too soft texture may be limiting. Up to now different methods are available to measure the permeability of membranes. Microscopic methods can be

Distillation – Advances from Modeling to Applications 214
used when the analysed tissue was stained. It is also possible to measure the content of the extracted material (sugar, ions) (Angersbach&Heinz 1997). Mostly these two methods are not exact enough to determine the disintegration of biological membranes. A better method for determining the cell disintegration is the electrical method based on measuring the frequency dependent conductivity.
An external electric field induces a polarization of the membranes. A result of the polarization is an increase of the membrane current and a simultaneously decrease of the resistance of the membrane, which corresponds to an increase of the conductivity (Angersbach et al., 2000). The increase of the conductivity up to 5 mS in less than 5 µs (Angersbach et al., 2000) can be measured and be set in relation to the conductivity of intact membrane. Consequently analyzing the frequency dependent conductivity offers the possibility to estimate the amount of intact cellular material. The relation of the conductivity of the intact and the disintegrated cells is termed as the cell disintegration index Zp. The cell disintegration index allows an exact definition of the amount of ruptured cellular material. If there is no difference between the conductivity of the untreated and PEF treated cell membrane, the Zp value is 0 and the cell can be defined as an intact cell. In contrast to that a Zp value of 1 indicates the maximum of cell disintegration due to the PEF treatment (Angersbach&Heinz 1997).
The frequency dependent conductivity allows a detection of product properties. Fig. 2. illustrates an example of conductivity of various treated and untreated tissues at different frequencies.
Fig. 2. Measured conductivity at different frequencies (Knorr&Angersbach 1998)
As it can be seen in Fig. 2. the conductivity changes with increasing frequency. At low frequency ranges the conductivity of PEF treated cell material and intact tissue is different, because of the capacitive properties of intact tissue. The highest value for conductivity relates to mechanically ruptured cells. From the graph it can also be seen that as the frequency increases, the conductivity of all cellular material reaches the same conductivity value. The reason being the relationship between conductivity and the frequency. At high frequency ranges (5-10 MHz) the cell membranes, whether damaged or not, are not resistant to the electric current (Angersbach&Heinz 1997; Knorr&Angersbach 1998).

Mass Transport Improvement by PEF – Applications in the Area of Extraction and Distillation 215
Besides the relation between the conductivity and the frequency, the Fig. 2. also displays the impact of pulse number on the effect of the permeabilisation of cellular material. A higher number of applied pulses leads to a higher conductivity, which shows a higher permeabilisation of the membrane (Knorr&Angersbach 1998). Not only does the number of pulses affect the efficiency of the PEF treatment, the applied electric field strength amplitude also plays a part. Higher electric field strength causes a more rapid dynamics of pore formation and a faster initiation of conductive channels (Angersbach et al., 2000). To compare the relation between number of pulses and electric field strength; typically a lower number of pulses is necessary to reach a high disintegration of cellular material when high electric field strength is applied (Knorr&Angersbach 1998; Angersbach et al., 2000). The effect of the electric field strength in relation to the permeability of the membrane is illustrated in Fig. 3.
Fig. 3. Relation between the electric field strength amplitude and the relative permeability (Angersbach et al.,2000)
Using low field strength amplitudes no significant differences between the samples were observed, because the electric field strength did not reach the critical value and no electrical breakdown is induced. This phenomenon occurs if the applied field strength is higher than the critical field strength. With increasing electric field strength the relative permeability of the membrane increases up to the maximum, where all cells are disintegrated.
Fig. 3. also displays the dependence of the applied electric field amplitude to the type of product. Four different tissue types (potato-, apple- and fish tissue and potato cell culture) were tested and different values of electric field strength were necessary for a disintegration of these tissues. The reason for this is based on dependence of the membrane to rupture on the trans membrane voltage and the cell size distribution (Angersbach et al., 2000).
By measuring the conductivity the optimum electric field strength can be determined. The aim is to reach a maximum cell disintegration. Lebovka et al. 2002 (Lebovka et al., 2002) detected an electric field strength of 400 V/cm for maximum of cell disintegration of apple-, carrot and potato tissue. Comparing these tissues treated with 400 V/cm different treatment times are necessary to reach a high cell disintegration. Apple tissue required the highest treatment time and consequently the highest energy consumption in contrast to potato, which has the lowest energy consumption (Lebovka et al., 2002).
In conclusion, by measuring the conductivity changes induced by PEF treatment it is possible to determine the amount of disintegrated cells.

Distillation – Advances from Modeling to Applications 216
4. Influence of PEF on mass transfer The application of pulsed electric fields allows a disintegration of cellular material. The result of disintegrated cells is an improved mass transfer, which affects the following processes:
- Dehydration/Freezing - Extraction - Distillation
The drying process can be described as a preservation method removing water from food. Water removal, lowers the water activity and increases the shelf life of the products. It can be used as a pre-treatment to improve nutritional, organoleptic and functional properties of the food products (Torreggiani 1993). An important parameter for the drying process is the mass transfer of water. A high mass transfer rate results in a better quality of dried product due to the shortening of the drying time and a reduction in the drying temperature. The drying process can be regarded as a complex process step including momentum, heat and mass transfer. The moisture in food can be classified in two main groups. First the “immobilized” water, which is retained in fine capillaries and is adsorbed at the surface, and second the “free” water, which retains in voids in foods. The drying process is based on the equilibrium of moisture content. The food looses or gains moisture over a period of time to attain a new equilibrium status (Sharma et al., 2000). For drying of heat sensitive products the osmotic dehydration (OD) can be used as a pre-treatment in order to reduce the drying time. Other pre-treatments, like microwave or conventional thermal heating, lead to a thermal destruction of the nutrients and organoleptic quality of the food (Ade-Omowaye et al., 2001).
For this process, food is placed in an osmotic solution resulting in the formation of a water and a solubility gradient across the cell membrane. The cell membrane separates cell content, mostly water, and the osmotic solution. Consequently two fluxes are formed; the water out of the cell and the osmotic solution into the cell. This flux is a mass transfer process and is a function of the difference in chemical potential. Because of the composition of the cell membrane and the better permeability to water, more water is removed from the cell than less solute goes into the cell. The following Figure (Fig. 4.) represents the flux of water and solute in and out the cell (Torreggiani 1993; Sharma et al., 2000).
The OD process depends on different parameters, like concentration of osmotic solution, contact time and process temperature as well as the exposed surface area. The most widespread problem is the simultaneous solute transfer in the food countercurrent to the water flow. This influences the product quality in a negative way resulting in a candy or salty taste of the product, as well as an altered sugar-to-acid ratio. Different kinds of osmotic solutions can be used. The choice depends on parameters, like organoleptic quality, preservative effect and the product taste. Mostly a sucrose solution is used, because it is very effective and convenient. But because of the sweetness the application is limited to vegetables and fruits. The second most used substance for osmotic solutions is sodium chloride.
In comparison to convection drying the OD process uses less energy, because a lower temperature can be used. Due to the reduced temperature, less heat damage is found on the

Mass Transport Improvement by PEF – Applications in the Area of Extraction and Distillation 217
Fig. 4. Mass transfer during OD process (Torreggiani 1993)
product and the high concentration of the osmotic solution prevents discoloration (Torreggiani 1993).
As the OD process is directly dependent on the mass transfer, a PEF treatment can enhance OD. The first time facilitated mass transfer during OD using PEF was reported by Rastogi et al. (Rastogi et al., 1999). Because of the structural changes of the cell membrane due to PEF application, the mass transfer is facilitated (Ade-Omowaye et al., 2001). Consequently a facilitated, fast exit of the water in the osmotic solution is possible, but no solid uptake, because of the selective permeabilisation of the cell membrane (Taiwo et al., 2003). Using PEF before the OD process the drying time can be significantly reduced and a better structural food quality can be obtained.
Different product types were treated with PEF before OD. For example, the pre-treatment of red pepper with PEF shows a facilitated moisture removal and an improvement of the quality of the dried products. Using OD in combination with PEF a preserved color quality of the red pepper could be obtained (Ade-Omowaye 2003). Carrots can also be pre treated with PEF resulting in an increased diffusion coefficient and a reduction of the OD time from 4 h to 2 h (Rastogi et al., 1999). The PEF induced enhanced mass transfer depends on the electric field strength and the applied number of pulses (Rastogi et al., 1999). The same reduction in OD was reported (Rastogi et al., 1999; Amami et al., 2007a; Amami et al., 2007b) for the treatment of apple tissue (Amami et al., 2006).
In addition to drying process the freezing process can be regarded as a mass transport dependent preservation method. Suitable products for this type of treatment are fruits (strawberries and raspberries), vegetables (peas, green beans) as well as fish and meat products (Sharma et al., 2000). The process is based on a decrease of temperature under the freezing point and combines the effect of low temperature with the conversion of water into ice (Delgado&Sun 2001). The advantage of the freezing process is the reduced chemical reactions and the delay of cellular metabolic reactions (Delgado&Sun 2001).
In general the freezing process can be separated into three main phases. The first phase is called the pre-cooling or chilling phase, where the product is cooled down to the freezing
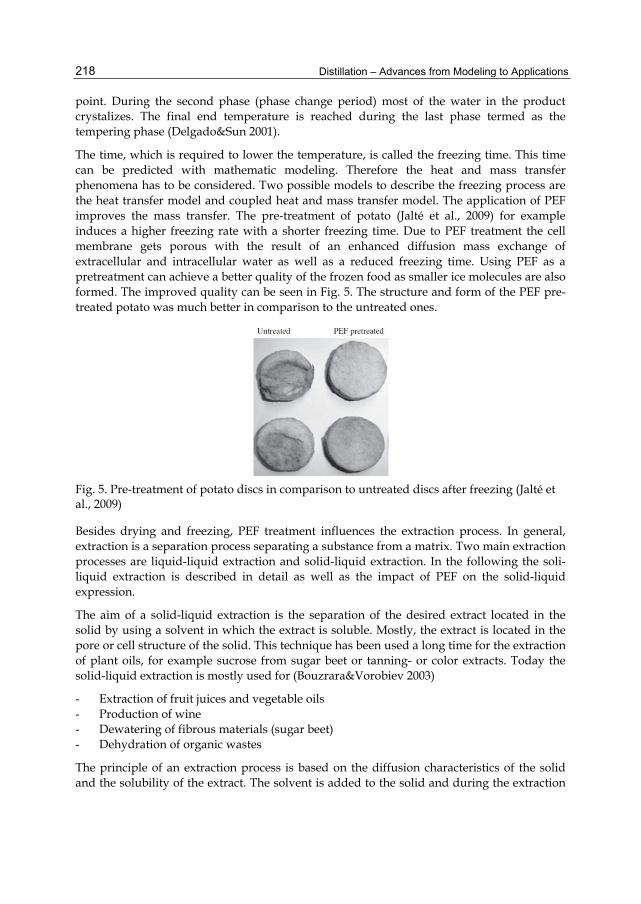
Distillation – Advances from Modeling to Applications 218
point. During the second phase (phase change period) most of the water in the product crystalizes. The final end temperature is reached during the last phase termed as the tempering phase (Delgado&Sun 2001).
The time, which is required to lower the temperature, is called the freezing time. This time can be predicted with mathematic modeling. Therefore the heat and mass transfer phenomena has to be considered. Two possible models to describe the freezing process are the heat transfer model and coupled heat and mass transfer model. The application of PEF improves the mass transfer. The pre-treatment of potato (Jalté et al., 2009) for example induces a higher freezing rate with a shorter freezing time. Due to PEF treatment the cell membrane gets porous with the result of an enhanced diffusion mass exchange of extracellular and intracellular water as well as a reduced freezing time. Using PEF as a pretreatment can achieve a better quality of the frozen food as smaller ice molecules are also formed. The improved quality can be seen in Fig. 5. The structure and form of the PEF pre-treated potato was much better in comparison to the untreated ones.
Fig. 5. Pre-treatment of potato discs in comparison to untreated discs after freezing (Jalté et al., 2009)
Besides drying and freezing, PEF treatment influences the extraction process. In general, extraction is a separation process separating a substance from a matrix. Two main extraction processes are liquid-liquid extraction and solid-liquid extraction. In the following the soli-liquid extraction is described in detail as well as the impact of PEF on the solid-liquid expression.
The aim of a solid-liquid extraction is the separation of the desired extract located in the solid by using a solvent in which the extract is soluble. Mostly, the extract is located in the pore or cell structure of the solid. This technique has been used a long time for the extraction of plant oils, for example sucrose from sugar beet or tanning- or color extracts. Today the solid-liquid extraction is mostly used for (Bouzrara&Vorobiev 2003)
- Extraction of fruit juices and vegetable oils - Production of wine - Dewatering of fibrous materials (sugar beet) - Dehydration of organic wastes
The principle of an extraction process is based on the diffusion characteristics of the solid and the solubility of the extract. The solvent is added to the solid and during the extraction

Mass Transport Improvement by PEF – Applications in the Area of Extraction and Distillation 219
the extract diffuses from the solid in the solvent. This mass transport from the solid in the solvent follows the diffusion law. After this process a mechanical separation of the solid and liquid is required as well as a separation of the extract and the extraction agent. A facilitated extraction can be reached by chopping or mashing the solid with the result of an increased surface area and shorter capillary ways. Another possibility to increase the extraction velocity is an increase of the concentration gradient. This can be achieved by using a high volume of solvent (Vauck&Mueller 2000).
As described before the principle of the extraction process is based on the mass transfer of the extract from the solid in solvent. The extract is mostly located in cells, which are surrounded by membranes. Consequently, the amount of compounds released to the solvent depends on the degree of the damaged cellular material. The effect of PEF can be defined as electroporation resulting in a disintegration of cellular material and an improved mass transfer. Regarding the extraction process a facilitated extraction is possible using PEF as a pre-treatment, because the extract can easily diffuse into the solvent. There is no force required to open the cellular material. Using PEF as a pre-treatment, the extraction time can be reduced. The extraction yield can be increased and important quality ingredients can be easily extracted.
PEF can be used for an improved extraction process in different application fields. One example is the extraction of calcium from bones (Yin&He 2008). There are different methods used for the extraction of calcium from bones, for example boiling or microwave treatment, often leads to negative effects on the product and the extracted concentration is low. Using PEF, the temperature can be reduced and the calcium concentration increased (Yin&He 2008).
Another example for a solid-liquid expression assisted by PEF treatment is sugar beet. Using PEF as a pre-treatment the extraction time and temperature can be lowered (López et al., 2009) as well as a higher sucrose yield can be obtained (Eshtiaghi&Knorr 2002; El-Belghiti&Vorobiev 2004) resulting in more efficient sugar production with lower energy requirements (Lebovka et al., 2007; Loginova et al., 2011). Due to the lower extraction temperature the PEF process offers the possibility to improve the extraction of colorants from red beet root in order to increase the extraction yield and a better stability of the colorants (Fincan et al., 2004; Loginova et al., 2011). An increased juice yield plays an important role in juice industry. In general mechanical, enzymatic or temperature based methods were used to rupture the apple cells for a facilitated extracting, but mostly they lead to a degradation of important juice components as well as a high energy consumption (Toepfl 2006). A PEF treatment of the apples increases the yield from 1,7 to 7,7 % in comparison to an enzymatic treatment (4,2 %) (Schilling et al., 2007) and reduces the energy consumption. Additional the pomace can be used after the treatment for pectin extraction.
Another process limited by mass transfer is the distillation process. In this process a high temperature is applied to the product for a defined time in order to separate two components with different boiling points. The high temperature denatures the cellular material and facilitates the extraction of the product. The high heat load degrades the heat sensitive ingredients minimizing the quality of the product. The membrane of the cells represents a semipermeable barrier through which the desired extract cannot diffuse because of the size. After the cells are ruptured the extract can easily diffuse along the

Distillation – Advances from Modeling to Applications 220
concentration gradient. To rupture the cells, PEF can be used. Using PEF a disintegration of the cells could be observed at moderate temperatures. Consequently, the heat load could be minimized and no change of quality of the extract could be detected. In addition to that, the extraction yield could also be increased. In summary, the result of using pulsed electric fields instead of high temperature treatment is a reduced temperature and distillation time. A possible application being the treatment of roses to gain a higher yield of rose oil while reducing the distillation time (Dobreva et al., 2010).
5. Application 5.1 Extraction
A facilitated extraction of valuable components, like sucrose from sugar beet, red colorants from red beet roots and polyphenols from wine as well as juice from fruits, can be achieved by using PEF as a pre treatment.
The traditional sucrose extraction process is a thermal one treating the cossettes at 70 to 75 °C for 1 to 1,5 h. The heating process permits a denaturation of the sugar beet cells and facilitates the sugar extraction. This process uses a significant amount of energy and water and assists the growth of spoilage microorganisms. Lopez et al. (López et al., 2009) studied the influence of PEF on the extraction yield dependent on the electric field strength and pulse number as well as temperature. As a result applying 20 pulses with a field strength of 7 kV/cm allows a temperature reduction from 70 °C to 40 °C in a 60 min extraction process with yield of 80 %. The related thermal energy consumption is lowered by more than 50 %. In addition the extraction is dependant on the field strength, specific energy as well as temperature and independent from pulse shape and pulse duration (López et al., 2009). Agitation during extraction leads to an increase of the sucrose yield (El-Belghiti&Vorobiev 2004). In this study the sugar beets were treated with 0,9 kV/cm and 250 pulses in a cylindrical batch treatment chamber. For an extraction yield of 30 %, an extraction time of 120 min with 100 rpm agitation is required in comparison to 500 min extraction time without agitation. The sugar extraction process assisted by PEF can be improved by additional agitation, as well as by applying pressure. Using a pressure of 30 MPa during the extraction process the extraction yield can be increased by 20 % (Eshtiaghi&Knorr 2002).
Besides the yield of the PEF assisted extraction process, the quality of the sucrose was analysed. The treatment of sugar beets with an electric field strength of 0,6 kV/cm and 500 pulses with a pulse duration of 100 µs at 30 °C leads to comparable results of thermal process at 70 °C (Loginova et al., 2011).
The thermal treatment at 70 °C leads to a sucrose content of 14 % and a purity of more than 90 %. Equal values have been reached using a PEF treatment at 30 °C. The energy consumption required by PEF treatment is 5,4 kWh/t versus 46,7 kWh/t for the thermal treatment. In conclusion, the application of PEF lowers the energy consumption without influencing the sucrose content or the purity of the extracted sucrose solution (Loginova et al., 2011). Increasing the temperature of the PEF treatment leads to a reduction of the required electric field strength without decreasing the important quality parameters. Another study of Loginova et al. (Loginova et al., 2011) shows an increased sucrose content and °Brix values of extracted product assisted by PEF in a parallel stainless steel electrode with a gap of 7 cm applying 0,6 kV/cm at 50 °C. The end result is a higher purity and
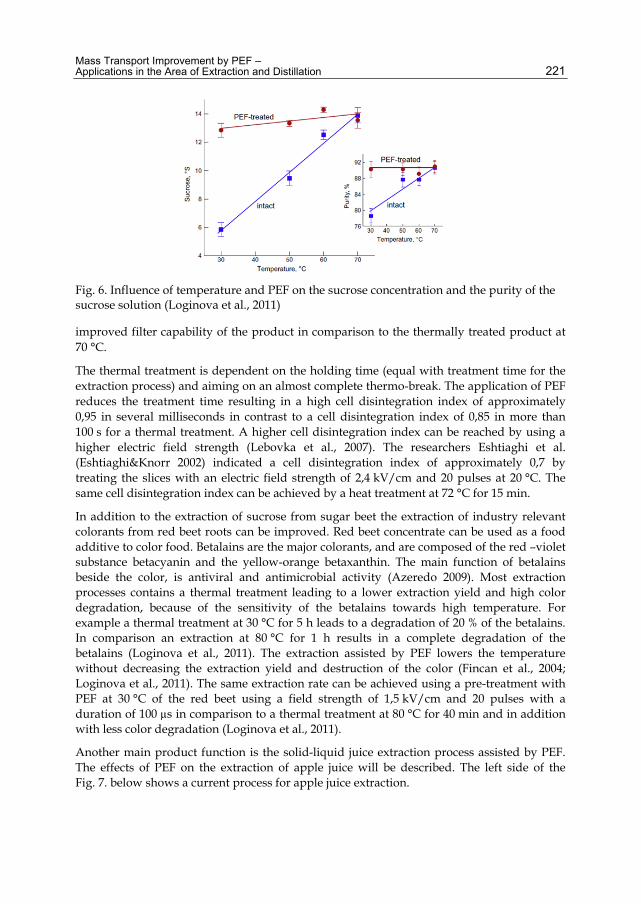
Mass Transport Improvement by PEF – Applications in the Area of Extraction and Distillation 221
Fig. 6. Influence of temperature and PEF on the sucrose concentration and the purity of the sucrose solution (Loginova et al., 2011)
improved filter capability of the product in comparison to the thermally treated product at 70 °C.
The thermal treatment is dependent on the holding time (equal with treatment time for the extraction process) and aiming on an almost complete thermo-break. The application of PEF reduces the treatment time resulting in a high cell disintegration index of approximately 0,95 in several milliseconds in contrast to a cell disintegration index of 0,85 in more than 100 s for a thermal treatment. A higher cell disintegration index can be reached by using a higher electric field strength (Lebovka et al., 2007). The researchers Eshtiaghi et al. (Eshtiaghi&Knorr 2002) indicated a cell disintegration index of approximately 0,7 by treating the slices with an electric field strength of 2,4 kV/cm and 20 pulses at 20 °C. The same cell disintegration index can be achieved by a heat treatment at 72 °C for 15 min.
In addition to the extraction of sucrose from sugar beet the extraction of industry relevant colorants from red beet roots can be improved. Red beet concentrate can be used as a food additive to color food. Betalains are the major colorants, and are composed of the red –violet substance betacyanin and the yellow-orange betaxanthin. The main function of betalains beside the color, is antiviral and antimicrobial activity (Azeredo 2009). Most extraction processes contains a thermal treatment leading to a lower extraction yield and high color degradation, because of the sensitivity of the betalains towards high temperature. For example a thermal treatment at 30 °C for 5 h leads to a degradation of 20 % of the betalains. In comparison an extraction at 80 °C for 1 h results in a complete degradation of the betalains (Loginova et al., 2011). The extraction assisted by PEF lowers the temperature without decreasing the extraction yield and destruction of the color (Fincan et al., 2004; Loginova et al., 2011). The same extraction rate can be achieved using a pre-treatment with PEF at 30 °C of the red beet using a field strength of 1,5 kV/cm and 20 pulses with a duration of 100 µs in comparison to a thermal treatment at 80 °C for 40 min and in addition with less color degradation (Loginova et al., 2011).
Another main product function is the solid-liquid juice extraction process assisted by PEF. The effects of PEF on the extraction of apple juice will be described. The left side of the Fig. 7. below shows a current process for apple juice extraction.

Distillation – Advances from Modeling to Applications 222
Fig. 7. Left side the traditional apple juice process, right side the process using PEF (adapted from (Toepfl 2006))
The current extraction process contains an enzymatic treatment to rupture the apple cells. This step can be replaced by a PEF treatment (see right side of Fig. 7.) in order to increase the extraction yield without a destruction of the juice quality (Bazhal&Vorobiev 2000; Bazhal et al., 2001; Toepfl&Heinz 2011). The extraction yield can be increased to 1,7-7,7 % using field strengths of 1 and 5 kV/cm and 1 to 30 kJ/kg using a decanter centrifuge. In comparison, an increased extraction yield of 4,2 % can be achieved using enzyme treatment (Schilling et al., 2007). For the enzymatic treatment the apples were treated with a pectolytic enzyme for 1 h at 30 °C , the pectin is degraded using an enzymatic treatment for increasing the extraction yield. After the PEF treatment, native pectin can be produced from the pomace. An increase of the nutrient content of the juice was not observed (Schilling et al., 2007). Grimi et al. (Grimi et al., 2011) studied the extraction yield, clarity, polyphenol content and the antioxidant activity of the pre-treated apples. Additionally they differ between the treatment of whole apples and sliced apples. Treatment of sliced apples with a field strength of 0,4 kV/cm and a treatment time of 0,1 s, resulted in a higher extraction yield than the treatment of whole apples using the same conditions. The cell disintegration index, clarity of the juice, polyphenol content and the antioxidant activity showed no difference between the two different apple type treatments.
The studies of Grimi et al. (Grimi et al., 2011) show an increase of the polyphenol content in apple juice in comparison to the non PEF treated sample. Similar results were reported by Puertolas et al. and Corrales et al. (Corrales et al., 2008; Puertolas et al., 2010) studying the extraction of polyphenols from red wine grapes. The polyphenols are the most important components for the color and the quality of the red wine. A rupture of the grape skin, where the polyphenols are located, leads to a release of the polyphenols resulting in a facilitated extraction. A PEF induced cell disintegration using an electric field strength of 3 kV/cm and 10 kJ/kg results in an increase of the phenolic compounds as well as a higher antioxidant content (7841 µmolTE g-1DM in comparison to 187 µmolTE g-1DM thermal treatment at 70 °C for 1 h) (Corrales et al., 2008).
Mass Transport Improvement by PEF – Applications in the Area of Extraction and Distillation 223
The oil extraction process also contains a solid-liquid extraction step, which can be improved by PEF application. Guderjan et al. (Guderjan et al., 2005) studied the effect of PEF on the oil yield of maize and olives. Pulsing the maize with an electric field strength of 0,6 kV/cm and a specific energy of 0,62 kJ/kg at 20 °C yields an extraction of 43,7 % in comparison to a yield of 23,2 % of the untreated maize. The same effect of increased extraction yield is observed when treating olives with 1,3 kV/cm and 100 pulses. An increase of 7,4% with PEF in contrast to an increase of 5,3 % for a heat treatment (50 °C for 30 min) was determined (Guderjan et al., 2005). Beside olive and maize, rape seed can be treated to enhance the extraction yield and the quality of the oil. In that case, an improved oil yield was observed as well as an increase of the polyphenol-, phytosterol and tocopherol content. The rape seeds were pulsed with field strength of 7 kV/cm and 120 pulses (Guderjan et al., 2007).
5.2 Distillation
Distillation is a separation process, where the product is exposed to a defined temperature for a specific time. Because of the different boiling point of the components, a separation of these substances is possible.
The traditional rose oil distillation process is characterized by exposing a product to a high temperature for a defined time. The temperature causes a denaturation of the cell membrane and substances diffuse out of the cells. Due to the temperature sensitivity of the rose oil during the distillation process, the critical threshold should not be exceeded as the quality of the rose oil will be reduced. A lower temperature results in reduced disintegration of the rose cells and in a low extraction yield. To improve the rupture of the cell membrane, the cells can be exposed to pulsed electric fields. The electric field induces a polarization with a resulting breakdown of the cell membrane and an increased permeability. The process can be used for the rose oil production. Dobreva et al. (Dobreva et al., 2010) studied different PEF treatment conditions varying the specific energy and different distillation times. The aim was to detect the influence of PEF on the extraction yield and distillation time.
The PEF treatment was performed in parallel treatment chamber with a gap of 5 cm. The white oil-bearing roses (Rosa alba L.) were pulsed with an electric field strength of 4 kV/cm and a specific energy of 10 and 20 kJ/kg at room temperature. The distillation time using high temperature for cell rupture was 2,5 h. For the analysis the oil yield was determined after 0,5, 1, 1,5 and 2,5 h (Fig. 8.).
After a distillation time of 1 h equivalent oil yields for the PEF and control samples were found. An increase of energy input from 10 to 20 kJ/kg causes an increase of oil yield of 20 %. Treating the roses with a specific energy of 10 kJ/kg, the yield was increased by 35 % compared to the control. In conclusion, using PEF as a pre-treatment the distillation time can be reduced resulting in lower energy consumption and a higher productivity of the distillation process. A higher yield can be achieved by treating the roses with PEF and a specific energy of 10 kJ/kg and a distillation time of 2,5 h.
Besides the improvement of yield and the distillation time, the quality of the oil analysis also showed no undesirable changes of any of the essential components in comparison to the reference extraction method.

Distillation – Advances from Modeling to Applications 224
Fig. 8. Oil yield after a PEF pre-treatment of the roses in comparison to untreated after different distillation times (Dobreva et al., 2010)
5.3 Drying/Freezing
Drying is regarded to be an important preservation step. Temperature, relative humidity and time are the most important processing paramters. The drying process can be separated into three main parts. The first describes the evaporation from free surface, which is mostly influenced by heat and mass transfer. The second part includes the liquid flow from the capillaries and the third the diffusion of liquid or vapour (Sharma et al., 2000). The mass transfer, which is important for the first step of drying, is determined by the structure of the cellular material. By influencing the structure for example a disintegration of the cells, a facilitated mass transfer can be obtained. A cell disintegration of biological cell membranes can be induced by exposing the material to an electric field. The application of pulsed electric fields induces structural changes that leads to a rapid cellular breakdown and an increased permeability resulting in an enhanced mass transfer. The idea to use the PEF process in order to facilitate the drying process is described by several researchers and food products.
One product example using PEF as a pre-treatment before drying is red pepper. Ade-Omowaye et al. (Ade-Omowaye et al., 2000) investigated an increased water loss using the PEF process. For drying, a fluidized bed was used with a temperature of 60 °C for 6 h. The researchers examined the influence of the electric field strength and pulse number on the efficiency of the drying process. After 1,5 h drying the moisture content of the untreated red pepper sample was 2,06 kg/kg, of the sample treated with 1 kV/cm it was 1,45 kg/kg and the moisture content of the red pepper sample treated with 2 kV/cm it was 1,09 kg/kg. That corresponds to a decrease of moisture of 47 % at the same drying time. In summary an increasing electric field strength leads to a higher reduction of moisture content. In comparison to that shows the pulse number not that high influence so that a high pulse number has only a minimal effect on the electro permeabilisation (Ade-Omowaye et al., 2003). The same effect is reported by Knorr 1998 (Knorr&Angersbach 1998). Regarding the distillation time, after 3 h drying the drying rate was not higher as compared to the rate at 1,5 h. The reason for that is based on the fact, that nearly all water was evaporated at that time and the driving force was reduced.
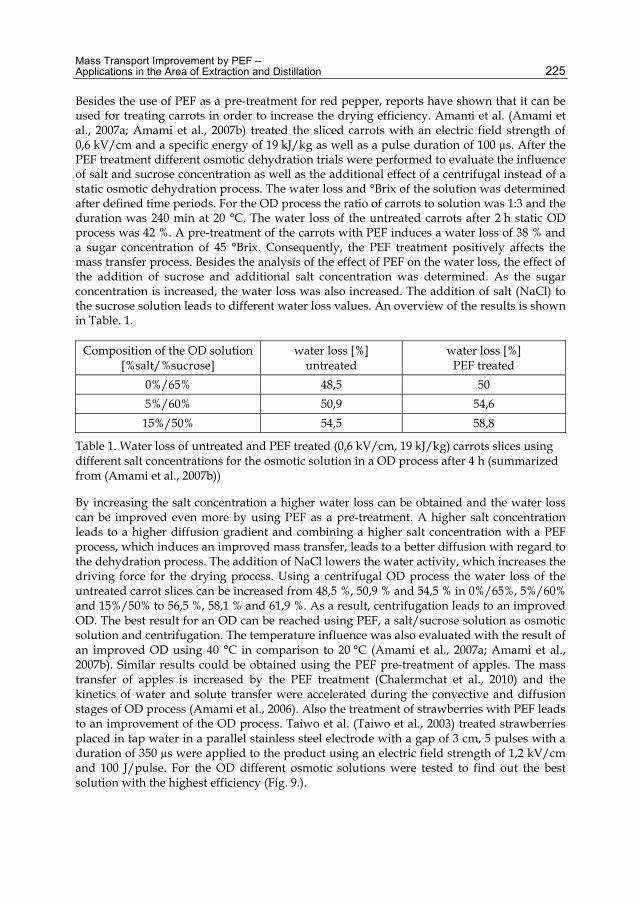
Mass Transport Improvement by PEF – Applications in the Area of Extraction and Distillation 225
Besides the use of PEF as a pre-treatment for red pepper, reports have shown that it can be used for treating carrots in order to increase the drying efficiency. Amami et al. (Amami et al., 2007a; Amami et al., 2007b) treated the sliced carrots with an electric field strength of 0,6 kV/cm and a specific energy of 19 kJ/kg as well as a pulse duration of 100 µs. After the PEF treatment different osmotic dehydration trials were performed to evaluate the influence of salt and sucrose concentration as well as the additional effect of a centrifugal instead of a static osmotic dehydration process. The water loss and °Brix of the solution was determined after defined time periods. For the OD process the ratio of carrots to solution was 1:3 and the duration was 240 min at 20 °C. The water loss of the untreated carrots after 2 h static OD process was 42 %. A pre-treatment of the carrots with PEF induces a water loss of 38 % and a sugar concentration of 45 °Brix. Consequently, the PEF treatment positively affects the mass transfer process. Besides the analysis of the effect of PEF on the water loss, the effect of the addition of sucrose and additional salt concentration was determined. As the sugar concentration is increased, the water loss was also increased. The addition of salt (NaCl) to the sucrose solution leads to different water loss values. An overview of the results is shown in Table. 1.
Composition of the OD solution [%salt/%sucrose]
water loss [%] untreated
water loss [%] PEF treated
0%/65% 48,5 50 5%/60% 50,9 54,6 15%/50% 54,5 58,8
Table 1. Water loss of untreated and PEF treated (0,6 kV/cm, 19 kJ/kg) carrots slices using different salt concentrations for the osmotic solution in a OD process after 4 h (summarized from (Amami et al., 2007b))
By increasing the salt concentration a higher water loss can be obtained and the water loss can be improved even more by using PEF as a pre-treatment. A higher salt concentration leads to a higher diffusion gradient and combining a higher salt concentration with a PEF process, which induces an improved mass transfer, leads to a better diffusion with regard to the dehydration process. The addition of NaCl lowers the water activity, which increases the driving force for the drying process. Using a centrifugal OD process the water loss of the untreated carrot slices can be increased from 48,5 %, 50,9 % and 54,5 % in 0%/65%, 5%/60% and 15%/50% to 56,5 %, 58,1 % and 61,9 %. As a result, centrifugation leads to an improved OD. The best result for an OD can be reached using PEF, a salt/sucrose solution as osmotic solution and centrifugation. The temperature influence was also evaluated with the result of an improved OD using 40 °C in comparison to 20 °C (Amami et al., 2007a; Amami et al., 2007b). Similar results could be obtained using the PEF pre-treatment of apples. The mass transfer of apples is increased by the PEF treatment (Chalermchat et al., 2010) and the kinetics of water and solute transfer were accelerated during the convective and diffusion stages of OD process (Amami et al., 2006). Also the treatment of strawberries with PEF leads to an improvement of the OD process. Taiwo et al. (Taiwo et al., 2003) treated strawberries placed in tap water in a parallel stainless steel electrode with a gap of 3 cm, 5 pulses with a duration of 350 µs were applied to the product using an electric field strength of 1,2 kV/cm and 100 J/pulse. For the OD different osmotic solutions were tested to find out the best solution with the highest efficiency (Fig. 9.).
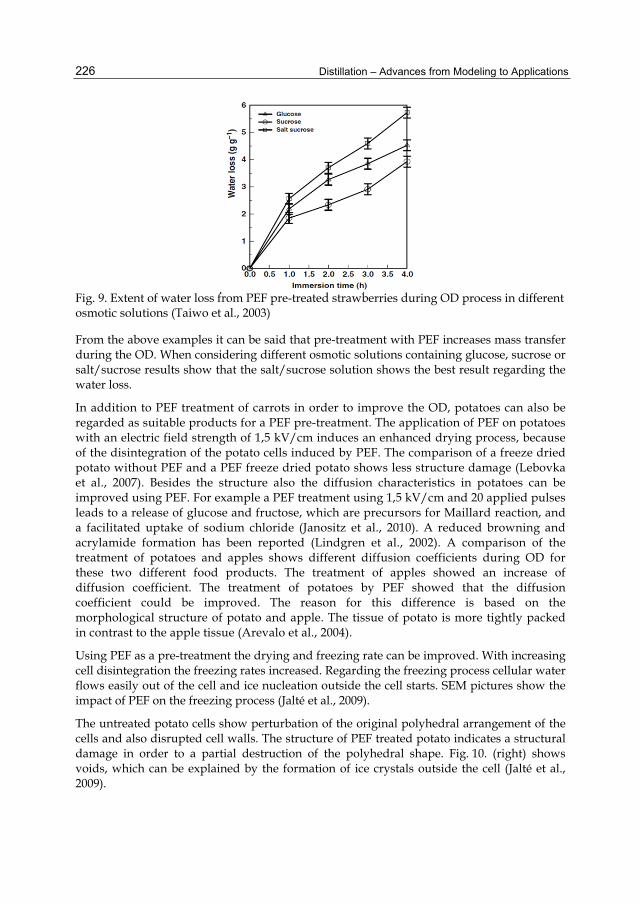
Distillation – Advances from Modeling to Applications 226
Fig. 9. Extent of water loss from PEF pre-treated strawberries during OD process in different osmotic solutions (Taiwo et al., 2003)
From the above examples it can be said that pre-treatment with PEF increases mass transfer during the OD. When considering different osmotic solutions containing glucose, sucrose or salt/sucrose results show that the salt/sucrose solution shows the best result regarding the water loss.
In addition to PEF treatment of carrots in order to improve the OD, potatoes can also be regarded as suitable products for a PEF pre-treatment. The application of PEF on potatoes with an electric field strength of 1,5 kV/cm induces an enhanced drying process, because of the disintegration of the potato cells induced by PEF. The comparison of a freeze dried potato without PEF and a PEF freeze dried potato shows less structure damage (Lebovka et al., 2007). Besides the structure also the diffusion characteristics in potatoes can be improved using PEF. For example a PEF treatment using 1,5 kV/cm and 20 applied pulses leads to a release of glucose and fructose, which are precursors for Maillard reaction, and a facilitated uptake of sodium chloride (Janositz et al., 2010). A reduced browning and acrylamide formation has been reported (Lindgren et al., 2002). A comparison of the treatment of potatoes and apples shows different diffusion coefficients during OD for these two different food products. The treatment of apples showed an increase of diffusion coefficient. The treatment of potatoes by PEF showed that the diffusion coefficient could be improved. The reason for this difference is based on the morphological structure of potato and apple. The tissue of potato is more tightly packed in contrast to the apple tissue (Arevalo et al., 2004).
Using PEF as a pre-treatment the drying and freezing rate can be improved. With increasing cell disintegration the freezing rates increased. Regarding the freezing process cellular water flows easily out of the cell and ice nucleation outside the cell starts. SEM pictures show the impact of PEF on the freezing process (Jalté et al., 2009).
The untreated potato cells show perturbation of the original polyhedral arrangement of the cells and also disrupted cell walls. The structure of PEF treated potato indicates a structural damage in order to a partial destruction of the polyhedral shape. Fig. 10. (right) shows voids, which can be explained by the formation of ice crystals outside the cell (Jalté et al., 2009).

Mass Transport Improvement by PEF – Applications in the Area of Extraction and Distillation 227
Fig. 10. Cellular structure of a untreated (a) and a PEF treated (b) potato after freeze and thaw process (Jalté et al., 2009)
5.4 Process and equipment design
Most of the PEF applications described as a pre-treatment in order to increase the extraction yield, to decrease the distillation time and/or process temperature, were performed with discontinuous PEF systems using a parallel or cylindrical electrode configurations for the treatment chambers. A parallel electrode configuration of the treatment chamber allows a homogenous electric field distribution. All tests with the different food types and systems were performed on a lab-scale. Toepfl et al. (Toepfl&Heinz 2011) studied a scale up from pilot plant to production scale for the apple juice production. They showed nearly the same increase of juice yield compared to the lab scale trials without influencing the taste or nutritional content. An increase of total acids, glucose, fructose and saccharose as well as total polyphenols was observed. Because of the high quality of the juice and the accordance of all quality parameters within the Europrean Code of Practice for Fruit Juices (AIJN 1996), the production including the PEF process step is equal to the common used process without PEF (Schilling et al., 2007; Toepfl&Heinz 2011).
A continuous treatment up to an industrial scale has been realized by DIL. At the moment three different systems are available for laboratory scale, semi-industrial scale and industrial scale. The 5 kW system has a maximum voltage of 30 kV and maximum current of 200 A. The pipe diameter ranges from 10 to 30 mm. Due to the small pipe diameter it is not possible to treat tubers or whole fruits. An increased pipe diameter can be used in 30 kW systems with a maximum voltage of 30 kV and a maximum current of 700 A. The pipe diameter can be increased up to 100 mm and for the application cell disintegration the capacity is 10.000 kg/h. A further increase of capacity up to 50.000 kg/h can be realized using the 80 kW systems with a maximum voltage of 60 kV and a maximum current of 5.000 A. The pipe diameter of these systems is in range of 200 mm, as an alternative belt type chambers can be used. At a belt width of 1 m the processing capacity can be up to 50.000 kg/h.
The 30 kW system and the belt system and a PEF system with a pipe diameter of 50 mm are shown in Fig. 11.
The PEF treatment consumes less energy compared to for example thermal treatments. For the treatment of sliced apples, the energy consumption is 12,5 ±0,5 kJ/kg and for whole apples 7,9±0,4 kJ/kg (Grimi et al., 2011). The typical energy requirement is in a range of

Distillation – Advances from Modeling to Applications 228
Fig. 11. (a) 30 kW belt system for the treatment of tubers or whole fruits, (b) PEF system with a pipe diameter of 50 mm
3 kWh/ton for a complete tissue disintegration. Compared to other cell disruption methods (mechanical: 20-40 kJ/kg; enzymatic: 60-100 kJ/kg; heating, freezing/thawing: >100 kJ/kg) the energy consumption is very low (Toepfl 2006). For tissue softening, where a lower extent of cell disintegration is required, the typical specific energy input for a PEF treatment is in a range of 1 kJ/kg. The same effect can be observed during the sugar extraction process. More than 50 % of the thermal energy can be saved using a PEF treatment (temperature: 40 °C) instead of a thermal treatment (70 °C) in 60 min extraction process with a yield of 80 % (López et al., 2009).
In conclusion the application of PEF offers the possibility to decrease the energy consumption and a continuous scale up is possible.
6. Conclusion Food processing is a wide field containing many different process steps and techniques based on the principles of process engineering. The industry is searching for new and innovative techniques to improve the quality of the food and to introduce new products with a simultaneous cost reduction. One of the most promising new novel food processing techniques is the application of pulsed electric fields (PEF). This non-thermal treatment is based on the application of pulses with a certain voltage and short duration times (µs) to the product located between two electrodes. The product is located between the electrodes and is exposed to the electric field. The cells and the microorganisms in the product are affected by PEF. Membranes of the cells are destroyed.
For some food processing steps, especially extraction, dehydration and distillation, a rupture of the tissue is required. Many different cell rupturing techniques are available based on mechanical, chemical or thermal treatments, but they often induce a quality loss of the product or the rupture is not sufficient resulting in a low product yield. Using PEF a more efficient rupture of the cells can be achieved. PEF leads to a poration of the cell membrane resulting in a facilitated diffusion out of the cell. The application field has a very wide range such as the extraction yield of juices, oils, sugar and the reduction of drying time
(a) (b)
Mass Transport Improvement by PEF – Applications in the Area of Extraction and Distillation 229
and distillation time. Industrial scale PEF systems are available and can be implemented in the industry.
Other products as described in the chapter can be analysed as well. Many different studies showed an increased extraction yield, cost reduction and improvement of product quality. Consequently, the PEF process can be used for other product fields, like the extraction of essential oils from plants. Besides products mentioned in that chapter, many other raw materials are eligible for a PEF treatment.
7. References Ade-Omowaye, B. I. O., A. Angersbach, N. M. Eshtiaghi and D. Knorr (2000). Impact of high
intensity electric field pulses on cell permeabilisation and as pre-processing step in coconut processing. Innovative Food Science & Emerging Technologies Vol.1, No.3, pp. 203-209.
Ade-Omowaye, B. I. O., A. Angersbach, K. A. Taiwo and D. Knorr (2001). Use of pulsed electric field pre-treatment to improve dehydration characteristics of plant based foods. Trends in Food Science & Technology Vol.12, No.8, pp. 285-295.
Ade-Omowaye, B. I. O., N. K. Rastogi, A. Angersbach and D. Knorr (2003). Combined effects of pulsed electric field pre-treatment and partial osmotic dehydration on air drying behaviour of red bell pepper. Journal of Food Engineering Vol.60, No.1, pp. 89-98.
Álvarez, I., J. Raso, A. Palop and F. J. Sala (2000). Influence of different factors on the inactivation of Salmonella senftenberg by pulsed electric fields. International Journal of Food Microbiology Vol.55, No.1-3, pp. 143-146.
Amami, E., A. Fersi, L. Khezami, E. Vorobiev and N. Kechaou (2007a). Centrifugal osmotic dehydration and rehydration of carrot tissue pre-treated by pulsed electric field. LWT - Food Science and Technology Vol.40, No.7, pp. 1156-1166.
Amami, E., A. Fersi, E. Vorobiev and N. Kechaou (2007b). Osmotic dehydration of carrot tissue enhanced by pulsed electric field, salt and centrifugal force. Journal of Food Engineering Vol.83, No.4, pp. 605-613.
Amami, E., E. Vorobiev and N. Kechaou (2006). Modelling of mass transfer during osmotic dehydration of apple tissue pre-treated by pulsed electric field. LWT - Food Science and Technology Vol.39, No.9, pp. 1014-1021.
Angersbach, A. and V. Heinz (1997). Elektrische Leitfähigkeit als Maß des Zellaufschlussgrades von zellulären Materialien durch Verarbeitungsprozesse. Lebensmittelverfahrenstechnik Vol.42, pp. 195-200.
Angersbach, A., V. Heinz and D. Knorr (2000). Effects of pulsed electric fields on cell membranes in real food systems. Innovative Food Science & Emerging Technologies Vol.1, No.2, pp. 135-149.
Arevalo, P, Ngadi, O. M, Bazhal, I. M, Raghavan and V. G. S (2004). Impact of pulsed electric fields on the dehydration and physical properties of apple and potato slices. Philadelphia, PA, ETATS-UNIS, Taylor & Francis.
Azeredo, H. M. C. (2009). Betalains: properties, sources, applications, and stability - a review. International Journal of Food Science & Technology Vol.44, pp. 2365-2376.
Distillation – Advances from Modeling to Applications 230
Barbosa-Cánovas, G. V., M. M. Góngora-Nieto, U. R. Pothakamury and B. G. Swanson (1999). Biological Principles for Microbial Inactivation in Electric Fields. Preservation of Foods with Pulsed Electric Fields. San Diego, Academic Press: pp. 47-75.
Bazhal, M. and E. Vorobiev (2000). Electrical treatment of apple cossettes for intensifying juice pressing. Journal of the Science of Food and Agriculture Vol.80, No.11, pp. 1668-1674.
Bazhal, M. I., N. I. Lebovka and E. Vorobiev (2001). Pulsed electric field treatment of apple tissue during compression for juice extraction. Journal of Food Engineering Vol.50, No.3, pp. 129-139.
Bouzrara, H. and E. Vorobiev (2003). Solid/liquid expression of cellular materials enhanced by pulsed electric field. Chemical Engineering and Processing: Process Intensification Vol.42, No.4, pp. 249-257.
Castro, A. J., G. V. Barbosa-Canovas and B. G. Swanson (1993). Microbial Inactivation of Foods by Pulsed Electric Fields. Journal of Food Processing and Preservation Vol.17, pp. 47-73.
Chalermchat, Y., L. Malangone and P. Dejmek (2010). Electropermeabilization of apple tissue: Effect of cell size, cell size distribution and cell orientation. Biosystems Engineering Vol.1 0 5 pp. 357-366.
Corrales, M., S. Toepfl, P. Butz, D. Knorr and B. Tauscher (2008). Extraction of anthocyanins from grape by-products assisted by ultrasonics, high hydrostatic pressure or pulsed electric fields: A comparison. Innovative Food Science & Emerging Technologies Vol.9, No.1, pp. 85-91.
Delgado, A. E. and D.-W. Sun (2001). Heat and mass transfer models for predicting freezing processes - a review. Journal of Food Engineering Vol.47, No.3, pp. 157-174.
Dimitrov, D. S. (1984). Electric Field-Induced Breakdown of Lipid Bilayers and Cell Membranes: A Thin Viscoelastic Film Model. No.78, pp. 53-60.
Dimitrov, D. S. (1995). Electroporation and Electrofusion of Membranes. Handbook of Biological Physics, Elsevier Science B. V. Vol.1: pp.851-900
Dobreva, A., F. Tintchev, V. Heinz, H. Schulz and S. Toepfl (2010). Effect of pulsed electric fields (PEF) on oil yield and quality during destillation of white oil-bearing rose (Rosa alba L.). Zeitschrift für Arznei- und Gewürzpflanzen Vol.15, No.3, pp. 127-131.
El-Belghiti, K. and E. Vorobiev (2004). Mass transfer of sugar from beets enhanced by Pulsed electric field. Food and Bioprocess Technology Vol.82, No.C2, pp. 226-230.
Eshtiaghi, M. N. and D. Knorr (2002). High electric field pulse pretreatment: potential for sugar beet processing. Journal of Food Engineering Vol.52, No.3, pp. 265-272.
Fincan, M., F. DeVito and P. Dejmek (2004). Pulsed electric field treatment for solid-liquid extraction of red beetroot pigment. Journal of Food Engineering Vol.64, No.3, pp. 381-388.
Glaser, R. W., S. L. Leikin, L. V. Chernomordik, V. F. Pastushenko and A. I. Sokirko (1988). Reversible electrical breakdown of lipid bilayers: formation and evolution of pores. Biochimica et Biophysica Acta (BBA) - Biomembranes Vol.940, No.2, pp. 275-287.
Grimi, N., F. Mamouni, N. Lebovka, E. Vorobiev and J. Vaxelaire (2011). Impact of apple processing modes on extracted juice quality: Pressing assisted by pulsed electric fields. Journal of Food Engineering Vol.103, No.1, pp. 52-61.

Mass Transport Improvement by PEF – Applications in the Area of Extraction and Distillation 231
Guderjan, M., P. Elez-Martinez and D. Knorr (2007). Application of pulsed electric fields at oil yield and content of functional food ingredients at the production of rapeseed oil. Innovative Food Science & Emerging Technologies Vol.8, No.1, pp. 55-62.
Guderjan, M., S. Toepfl, A. Angersbach and D. Knorr (2005). Impact of pulsed electric field treatment on the recovery and quality of plant oils. Journal of Food Engineering Vol.67, No.3, pp. 281-287.
Heinz, V., I. Alvarez, A. Angersbach and D. Knorr (2001). Preservation of liquid foods by high intensity pulsed electric fields--basic concepts for process design. Trends in Food Science & Technology Vol.12, No.3-4, pp. 103-111.
Jalté, M., J.-L. Lanoisellé, N. I. Lebovka and E. Vorobiev (2009). Freezing of potato tissue pre-treated by pulsed electric fields. LWT - Food Science and Technology Vol.42, No.2, pp. 576-580.
Janositz, A., A. K. Noack and D. Knorr (2010). Pulsed Electric Fields and their impact on the diffusion characteristics of potato slices. LWT - Food Science and Technology Vol.In Press, Accepted Manuscript, pp.
Knorr, D. and A. Angersbach (1998). Impact of high-intensity electric field pulses on plant membrane permeabilization. Trends in Food Science & Technology Vol.9, No.5, pp. 185-191.
Lebovka, N. I., M. I. Bazhal and E. Vorobiev (2002). Estimation of characteristic damage time of food materials in pulsed-electric fields. Journal of Food Engineering, No.54, pp. 337?346.
Lebovka, N. I., M. V. Shynkaryk, K. El-Belghiti, H. Benjelloun and E. Vorobiev (2007). Plasmolysis of sugarbeet: Pulsed electric fields and thermal treatment. Journal of Food Engineering Vol.80, No.2, pp. 639-644.
Lebovka, N. I., N. V. Shynkaryk and E. Vorobiev (2007). Pulsed electric field enhanced drying of potato tissue. Journal of Food Engineering Vol.78, No.2, pp. 606-613.
Lindgren, M., K. Aronsson, S. Galt and T. Ohlsson (2002). Simulation of the temperature increase in pulsed electric field (PEF) continuous flow treatment chambers. Innovative Food Science and Emerging Technologies Vol.3, No.3, pp. 233-245.
Loginova, K. V., N. I. Lebovka and E. Vorobiev (2011). Pulsed electric field assisted aqueous extraction of colorants from red beet. Journal of Food Engineering Vol.106, No.2, pp. 127-133.
Loginova, K. V., E. Vorobiev, O. Bals and N. I. Lebovka (2011). Pilot study of countercurrent cold and mild heat extraction of sugar from sugar beets, assisted by pulsed electric fields. Journal of Food Engineering Vol.102, No.4, pp. 340-347.
López, N., E. Puértolas, S. Condón, J. Raso and I. Alvarez (2009). Enhancement of the extraction of betanine from red beetroot by pulsed electric fields. Journal of Food Engineering Vol.90, No.1, pp. 60-66.
Pliquett, U., R. P. Joshi, V. Sridhara and K. H. Schoenbach (2007). High electrical field effects on cell membranes. Bioelectrochemistry Vol.70, No.2, pp. 275-282.
Puertolas, E., N. Lopez, S. Condón, I. Alvarez and J. Raso (2010). Potential applications of PEF to improve red wine quality. Trends in Food Science & Technology Vol.21, No.5, pp. 247-255.
Rastogi, N. K., M. N. Eshtiagi and D. Knorr (1999). Accelerated Mass Transfer During Osmotic Dehydration of High Intensity Electrical Field Pulse Pretreated Carrots. Journal of Food Science Vol.64, No.6, pp. 1020-1023.

Distillation – Advances from Modeling to Applications 232
Schilling, S., T. Alber, S. Toepfl, S. Neidhart, D. Knorr, A. Schieber and R. Carle (2007). Effects of pulsed electric field treatment of apple mash on juice yield and quality attributes of apple juices. Innovative Food Science & Emerging Technologies Vol.8, No.1, pp. 127-134.
Sharma, S. K., S. J. Mulvaney and S. S. H. Rizvi (2000). Food Process Engineering - Theory and Laboratory Experiments. Canada, John Wiley & Sons.
Taiwo, K. A., M. N. Eshtiaghi, B. I. O. Ade-Omowaye and D. Knorr (2003). Osmotic dehydration of strawberry halves: influence of osmotic agents and pretreatment methods on mass transfer and product characteristics. International Journal of Food Science & Technology Vol.38, No.6, pp. 693-707.
Toepfl, S. (2006). Pulsed Electric Fields (PEF) for Permeabilization of Cell Membranes in Food- and Bioprocessing - Applications, Process and Equipment Design and Cost Analysis. Fakultät III - Prozesswissenschaften der Technischen Universität Berlin. Berlin. PhD.
Toepfl, S. and V. Heinz (2011). Pulsed Electric Field Assisted Extraction - A Case Study. Nonthermal processing Technologies for Food. H. Q. Zhang, G. V. Barbosa-Cánovas, V. M. Balasubramaniamet al, Blackwell Publishing Ltd. : pp. 190-200.
Toepfl, S., V. Heinz and D. Knorr (2007). High intensity pulsed electric fields applied for food preservation. Chemical Engineering and Processing Vol.46, No.6, pp. 537-546.
Torreggiani, D. (1993). Osmotic dehydration in fruit and vegetable processing. Food Research International Vol.26, pp. 59-68.
Tsong, T. Y. (1991). Electroporation of cell membranes. Biophysical Journal Vol.60, No.2, pp. 297-306.
Vauck, W. R. A. and H. A. Mueller (2000). Grundoperationen Chemischer Verfahrenstechnik. Stuttgart, Deutscher Verlag für Grundstoffindustrie.
Weaver, J. C. (2000). Electroporation of Cells and Tissues. No.28, pp. 24-33. Wilhelm, C., M. Winterhalter, U. Zimmermann and R. Benz (1993). Kinetics of pore size
during irreversible electrical breakdown of lipid bilayer membranes. Biophysical Journal Vol.64, No.1, pp. 121-128.
Yin, Y. and G. He (2008). A fast high-intensity pulsed electric fields (PEF)-assisted extraction of dissoluble calcium from bone. Separation and Purification Technology Vol.61, No.2, pp. 148-152.
Zhang, Q., G. V. Barbosa-Cánovas and B. G. Swanson (1995). Engineering Aspects of Pulsed Electric Field Pasteurization. Joumal of Food Engineering Vol.25, pp. 261-281.
Zimmermann, U., G. Pilwat, F. Beckers and F. Riemann (1976). Effects of external electrical fields on cell membranes. Bioelectrochemistry and Bioenergetics Vol.3, No.1, pp. 58-83.

11
Membrane Distillation: Principle, Advances, Limitations
and Future Prospects in Food Industry Pelin Onsekizoglu
Trakya University Department of Food Engineering, Edirne Turkey
1. Introduction Membrane separation processes have become one of the emerging technologies in the last few decades especially in the separation technology field. They offer a number of advantages over conventional separation methods in a wide variety of applications such as distillation and evaporation. Membrane processes can be easily scaled up due to their compact and modular design; they are able to transfer specific components selectively; they are energy efficient systems operating under moderate temperature conditions ensuring gentle product treatment.
Microfiltration (MF), ultrafiltration (UF), nanofiltration (NF), reverse osmosis (RO), pervaporation and electrodialysis are conventional membrane processes that have already gained wide acceptance in food processing (Bazinet et al., 2009; Couto et al., 2011; Gomes et al., 2011; Mello et al., 2010; Quoc et al., 2011; Santana et al., 2011). Membrane distillation (MD) is an emerging thermally driven membrane process in which a hydrophobic microporous membrane separates a heated feed solution and a cooled receiving phase. The temperature difference across the membrane results a water vapour pressure gradient, causing water vapour transfer through the pores from high vapour pressure side to the low one. Some of the key advantages of membrane distillation processes over conventional separation technologies are: relatively lower energy costs as compared to distillation, reverse osmosis, and pervaporation; a considerable rejection of dissolved, non-volatile species; much lower membrane fouling as compared with microfiltration, ultrafiltration, and reverse osmosis; reduced vapour space as compared to conventional distillation; lower operating pressure than pressure-driven membrane processes and lower operating temperature as compared with conventional evaporation (Bazinet et al., 2009; Couto et al., 2011; Gomes et al., 2011; Lawson & Lloyd, 1996b; Mello et al., 2010; Quoc et al., 2011; Santana et al., 2011).
Dewatering aqueous solutions is one of the key unit operations encountered in food processing, particularly in the processing of beverages, fruit juice, milk, whey, vegetable extracts, etc. The initial soluble solid contents are increased by concentration process, reducing the volume with consequent reduction of transport, storage and packaging costs. In addition, the concentrates are more resistant to microbial and chemical deterioration as a result of water activity reduction.
Distillation – Advances from Modeling to Applications
234
Today, multistage vacuum evaporation is the predominant method used for liquid concentration in food industry. The main drawbacks of this system are high energy consumption and heat induced deterioration of sensory (color changes, off-flavor formation) and nutritional characteristics (Ibarz et al., 2011; Kadakal et al., 2002; Simsek et al., 2007; Toribio & Lozano, 1986; Varming et al., 2004). Recently, technological advances related to the development of new membrane processes including membrane distillation have been proved to overcome this limitation (Bagger-Jorgensen et al., 2011; Cassano & Drioli, 2007; Hongvaleerat et al., 2008; Kozak et al., 2009; Onsekizoglu et al., 2010b; Valdes et al., 2009).
This chapter will cover the process features, theoretical aspects and the relevant mathematics related to water transport mechanism in membrane distillation. The most basic concepts of osmotic distillation, a membrane distillation variant operating at lower temperature will be also discussed. The suggestions for membrane selection taking into account the membrane material and module configuration together with contact angle and membrane wettability will be presented in detail. The process parameters affecting the transmembrane flux and the most promising applications for enhancement of flux will be highlighted. Applications in food industry and long term performance of membrane distillation systems will be evaluated. The possibility of integrating membrane distillation with other existing processes and suggestions for future work will be presented.
2. Process fundamentals MD is a thermally driven process, in which water vapour transport occurs through a non-wetted porous hydrophobic membrane. The term MD comes from the similarity between conventional distillation process and its membrane variant as both technologies are based on the vapour-liquid equilibrium for separation and both of them require the latent heat of evaporation for the phase change from liquid to vapour which is achieved by heating the feed solution. The driving force for MD process is given by the vapour pressure gradient which is generated by a temperature difference across the membrane. As the driving force is not a pure thermal driving force, membrane distillation can be held at a much lower temperature than conventional thermal distillation. The hydrophobic nature of the membrane prevents penetration of the pores by aqueous solutions due to surface tensions, unless a transmembrane pressure higher than the membrane liquid entry pressure (LEP) is applied. Therefore, liquid/vapour interfaces are formed at the entrances of each pore. The water transport through the membrane can be summarized in three steps: (1) formation of a vapour gap at the hot feed solution–membrane interface; (2) transport of the vapour phase through the microporous system; (3) condensation of the vapour at the cold side membrane–permeate solution interface (Jiao et al., 2004; Peinemann et al., 2010).
Various MD configurations can be used to drive flux (El-Bourawi et al., 2006; Khayet, 2011; Lawson & Lloyd, 1997; Susanto, 2011; Zhigang et al., 2005). The difference among these configurations is the way in which the vapour is condensed in the permeate side. Figure 1 illustrates the four commonly used configurations of MD described as follows:
1. In direct contact membrane distillation (DCMD), water having lower temperature than liquid in feed side is used as condensing fluid in permeate side. In this configuration, the liquid in both sides of the membrane is in direct contact with the hydrophobic microporous membrane. DCMD is the most commonly used configuration due to its

Membrane Distillation: Principle, Advances, Limitations and Future Prospects in Food Industry
235
Fig. 1. Schematic representation of MD configurations
Distillation – Advances from Modeling to Applications
236
convenience to set up in laboratory. However, direct contact of the membrane with the cooling side and poor conductivity of the polymeric material results heat losses throughout the membrane. Therefore, in DCMD the thermal efficiency which is defined as the fraction of heat energy used only for evaporation, is relatively smaller than the other three configurations.
2. In air gap membrane distillation (AGMD), water vapour is condensed on a cold surface that has been separated from the membrane via an air gap. The heat losses are reduced in this configuration by addition of a stagnant air gap between membrane and condensation surface.
3. In sweeping gas membrane distillation (SGMD), a cold inert gas is used in permeate side for sweeping and carrying the vapour molecules to outside the membrane module where the condensation takes place. Despite the advantages of a relatively low conductive heat loss with a reduced mass transfer resistance, due to the operational costs of the external condensation system, SGMD is the least used configuration.
4. In vacuum membrane distillation (VMD), the driving force is maintained by applying vacuum at the permeate side. The applied vacuum pressure is lower than the equilibrium vapour pressure. Therefore, condensation takes place outside of the membrane module.
Each of the MD configurations has its own advantages and disadvantages for a given application.
3. Osmotic distillation Osmotic distillation (OD) is a non-thermal membrane distillation variant, in which a microporous hydrophobic membrane separates two aqueous solutions at different solute concentrations. The OD process can be operated at atmospheric pressure and ambient temperature. The driving force is the vapour pressure gradient across the membrane which is obtained by using a hypertonic salt solution on permeate side. The hydrophobic nature of the membrane prevents penetration of the pores by aqueous solutions, creating vapour/liquid interfaces at the entrance of the pores. Under these conditions, a net water flux from the high vapour pressure side to the low one occurs resulting in the concentration of feed and dilution of hypertonic salt solution. The water transport through the membrane can be summarized in three steps: (1) evaporation of water at the dilute vapour–liquid interface; (2) diffusional or convective vapour transport through the membrane pore; (3) condensation of water vapour at the membrane/brine interface (Jiao et al., 2004; Peinemann et al., 2010). In the literature the OD technique is also termed as isothermal membrane distillation, osmotic membrane distillation, osmotic evaporation and gas membrane extraction (Gryta, 2005b).
The basic requirements of osmotic agent are to be non-volatile, to have high osmotic activity in order to maintain a lower vapour pressure and to maximize the driving force and to be thermally stable to allow reconcentration of diluted stripping solution by evaporation. Other factors that should be taken into consideration are solubility, toxicity, corrosivity and cost. Although NaCl or CaCl2 have chosen as osmotic agent in most of the reported studies, both of these salts have the disadvantage of being corrosive to ferrous alloys (Celere & Gostoli, 2004; Shin & Johnson, 2007). MgCl2, MgSO4, K2HPO4, and KH2PO4 are some other commonly used osmotic agents in OD. Potassium salts of ortho- and pyrophosphoric acid

Membrane Distillation: Principle, Advances, Limitations and Future Prospects in Food Industry
237
offer several advantages, including low-equivalent weight, high water solubility, steep positive temperature coefficients of solubility and safety in foods and pharmaceuticals (Jiao et al., 2004; Nagaraj et al., 2006a; Shin & Johnson, 2007)
4. Membrane characteristics The selection of the membrane is the most crucial factor in MD separation performance. As stated earlier, the membrane used for MD process must be hydrophobic and porous. There are various types of membranes meeting these expectations; however the efficiency of a given MD application depends largely on additional factors such as resistance to mass transfer, thermal stability, thermal conductivity, wetting phenomena and module characterization. Membrane and module related characteristics affecting selection of the appropriate membrane are summarized in this section.
4.1 Membrane materials
A large variety of membranes including both polymeric and inorganic membranes of hydrophobic nature can be used in MD process; however polymeric membranes have attracted much more attention due to their possibility to modulate the intrinsic properties. Polytetrafluoroethylene (PTFE), polypropylene (PP) and polyvinylidenefluoride (PVDF) are the most commonly used polymeric membranes due to their low surface tension values (Table 1). Hydrophobic porous membranes can be prepared by different techniques like sintering, stretching, phase inversion or thermally induced phase separation depending on the properties of the materials to be used. The useful materials should be selected according to criteria that include compatibility with the liquids involved, cost, ease of fabrication and assembly, useful operating temperatures, and thermal conductivity (Li et al., 2008; Liu et al., 2011). Among them, PTFE membranes are the most hydrophobic ones showing outstanding thermal stability and chemical resistance properties (they are low soluble in practically all common solvents). The main disadvantage of PTFE membranes is the difficulty of processing. PTFE membranes are generally prepared by sintering or stretching. PP exhibits
Polymer Surface tension (Dynes/cm)
Polytetrafluoroethylene (PTFE) 19 Polyvinylidenefluoride (PVDF) 25 Polypropylene (PP) 29 Polyethylene (PE) 31 Polypropylene (PP) 34 Polyvinyl alcohol (PVA) 37 Polysulfone (PS) 41 Polycarbonate (PC) 45 Polyurethane (PU) 45
Table 1. Critical surface tension values of some polymers (Adapted from Oliver, 2004; Pabby et al., 2009)
Distillation – Advances from Modeling to Applications
238
excellent solvent resistant properties and high crystallinity. PP membranes are generally manufactured by stretching and thermal phase inversion. PVDF membranes exhibit good thermal and chemical resistance; however this polymer easily dissolves at room temperature in a variety of solvents including dimethylformamide (DMF) and triethylphosphate (TEP). PVDF membranes are generally prepared by phase inversion (Curcio and Drioli, 2005).
There are some additional criteria that should be taken into consideration for selection of the appropriate membrane for a given MD application such as pore size, tortuosity, porosity, membrane thickness and thermal conductivity. The relationship between the transmembrane flux and the different membrane characteristic related parameters is given by (Lawson & Lloyd, 1997)
rN
(1)
where N is the molar flux, <rα> is the mean pore size of the membrane pores where α equals 1 for Knudsen diffusion and equals 2 for viscous flux, ε is the membrane porosity, τ is the membrane tortousity and δ is the membrane thickness.
Membrane pore size: Membranes with pore sizes ranging from 10 nm to l µm can be used in MD (Pabby et al., 2009). The permeate flux increases with the increase in pore size as determined by Knudsen model. However, in order to avoid wettability, small pore size should be choosen (El-Bourawi et al., 2006; Khayet, 2011). Thus, an optimum value for pore size has to be determined for each MD application depending on the type of the feed solution.
Membrane porosity: Membrane porosity is determined as the ratio between the volume of the pores and the total volume of the membrane. Evaporation surface area increases with the increase in porosity level of the membrane, resulting in higher permeate fluxes (Huo et al., 2011; Susanto, 2011). Membrane porosity also affects the amount of heat loss by conduction (Lawson & Lloyd, 1996b):
hm m mQ T (2)
(1 )m mg msh h h (3)
where ε is the membrane porosity, hmg is the conductive heat transfer coefficient of the gases entrapped in the membrane pores; hms is the conductive heat transfer coefficient of the hydrophobic membrane material.
Conductive heat loss can be reduced by increasing porosity of the membrane, since hmg is generally an order of magnitude smaller than hms. In general, the porosity of the membranes used in MD operations lines in the range of 65%-85%.
Pore tortuosity: Tortuosity is the average length of the pores compared to membrane thickness. The membrane pores do not go straight across the membrane and the diffusing molecules must move along tortuous paths, leading a decrease in MD flux. Therefore, permeate flux increases with the decrease in tortuosity. It must be pointed out that this value is frequently used as a correction factor for prediction of transmembrane flux due to
Membrane Distillation: Principle, Advances, Limitations and Future Prospects in Food Industry
239
the difficulties in measuring its real value for the membranes used in MD. In general a value of 2 is frequently assumed for tortuosity factor. (El-Bourawi et al., 2006; Khayet et al., 2004a; Phattaranawik et al., 2003a)
Membrane thickness: Permeate flux is inversely proportional to the membrane thickness in MD. Therefore, membrane must be as thin as possible to achieve high permeate flux. Thickness also plays an important role in the amount of conductive heat loss though the membrane. In order to reduce heat resistances, it should be as thick as possible leading to a conflict with the requirement of higher permeate flux. Hence membrane thickness should be optimized in order to obtain optimum permeate flux and heat efficiency. The optimum thickness for MD has been estimated within the range of 30–60 µm (Lagana et al., 2000).
Pore size distribution: Pore size distribution affects uniformity of vapour permeation mechanism. In general, uniform pore size is preferable rather than distributed pore size (Susanto, 2011).
Thermal conductivity: Thermal conductivity of the membrane should be small in order to reduce the heat loss through the membrane from feed to the permeate side. Conductive heat loss is inversely proportional to the membrane thickness. However selection of a thicker membrane decreases both the flux and permeability. One promising approach may be selection of a membrane with higher porosity since thermal conductivity of polymer membrane is significantly higher than thermal conductivity of water vapour in the membrane pores (Khayet et al., 2006). The thermal conductivities of polymers used in MD generally varies in the range of 0.15–0.45 W m-1K-1 depending upon temperature and the degree of crystallinity (Alklaibi & Lior, 2005).
Table 2 summarizes the commercial membranes commonly used by various researchers up to date together with their principal characteristics. In fact, there is a lack of commercially available MD units and most of the MD researches use modules actually designed for other membrane operations (i.e. microfiltration) rather than MD. Design of novel membranes fabricated especially for MD purposes have been recommended by MD investigators since commercially available membranes does not meet all the requirements listed above. Novel hydrophobic membranes for MD applications can be manufactured either by hydrophobic polymers or by surface modification of hydrophilic membranes. Various surface modification applications including coating, grafting and plasma polymerization (Brodard et al., 2003; Bryjak et al., 2000; Chanachai et al., 2010; Huo et al., 2010; Kong et al., 1992; Krajewski et al., 2006; Lai et al., 2011; Li & Sirkar, 2004; Vargas-Garcia et al., 2011; Wu et al., 1992; Yang et al., 2011b) have been attempted until now. However, there is very limited number of studies on the design of MD membranes (Khayet, 2011; Khayet et al., 2010; Phattaranawik et al., 2009; Wang et al., 2009; Yang et al., 2011a). Therefore, new generation of membranes promising required features should be developed for MD applications.
4.2 Membrane modules
Choice and arrangement of the membrane module in a MD application is based on economic considerations with the correct engineering parameters being employed. Plate and frame, spiral wound, tubular, capillary and hollow fiber membrane modules are commonly used by MD researchers.
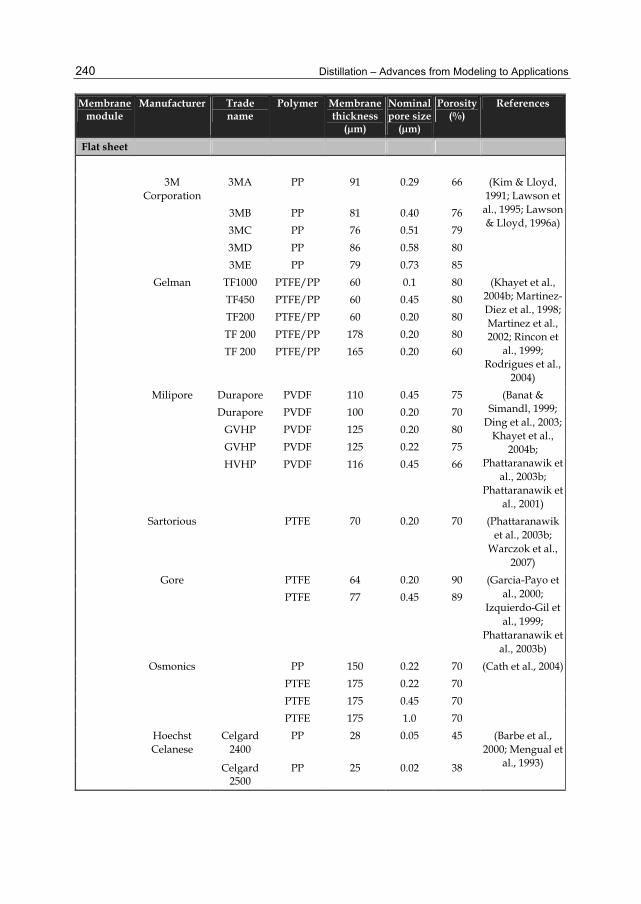
Distillation – Advances from Modeling to Applications
240
Membrane module
Manufacturer Trade name
Polymer Membranethickness
(µm)
Nominalpore size
(µm)
Porosity(%)
References
Flat sheet
3M
Corporation 3MA PP 91 0.29 66 (Kim & Lloyd,
1991; Lawson et al., 1995; Lawson & Lloyd, 1996a)
3MB PP 81 0.40 76 3MC PP 76 0.51 79 3MD PP 86 0.58 80 3ME PP 79 0.73 85 Gelman TF1000 PTFE/PP 60 0.1 80 (Khayet et al.,
2004b; Martinez-Diez et al., 1998; Martinez et al., 2002; Rincon et
al., 1999; Rodrigues et al.,
2004)
TF450 PTFE/PP 60 0.45 80 TF200 PTFE/PP 60 0.20 80 TF 200 PTFE/PP 178 0.20 80 TF 200 PTFE/PP 165 0.20 60
Milipore Durapore PVDF 110 0.45 75 (Banat & Simandl, 1999;
Ding et al., 2003; Khayet et al.,
2004b; Phattaranawik et
al., 2003b; Phattaranawik et
al., 2001)
Durapore PVDF 100 0.20 70 GVHP PVDF 125 0.20 80 GVHP PVDF 125 0.22 75 HVHP PVDF 116 0.45 66
Sartorious PTFE 70 0.20 70 (Phattaranawik et al., 2003b;
Warczok et al., 2007)
Gore PTFE 64 0.20 90 (Garcia-Payo et al., 2000;
Izquierdo-Gil et al., 1999;
Phattaranawik et al., 2003b)
PTFE 77 0.45 89
Osmonics PP 150 0.22 70 (Cath et al., 2004) PTFE 175 0.22 70 PTFE 175 0.45 70 PTFE 175 1.0 70 Hoechst
Celanese Celgard
2400 PP 28 0.05 45 (Barbe et al.,
2000; Mengual et al., 1993) Celgard
2500 PP 25 0.02 38
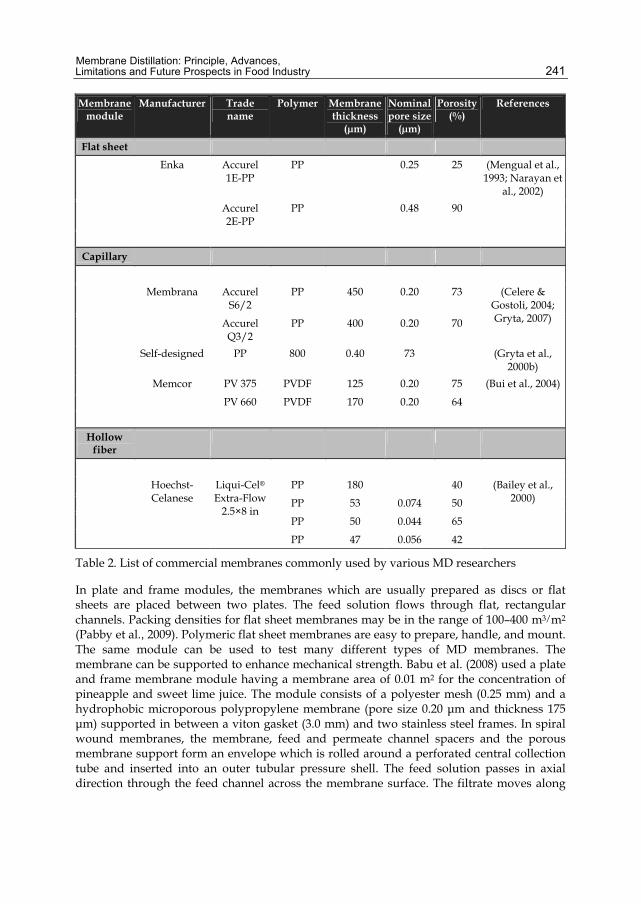
Membrane Distillation: Principle, Advances, Limitations and Future Prospects in Food Industry
241
Membrane module
Manufacturer Trade name
Polymer Membranethickness
(µm)
Nominalpore size
(µm)
Porosity(%)
References
Flat sheet Enka Accurel
1E-PP PP 0.25 25 (Mengual et al.,
1993; Narayan et al., 2002)
Accurel 2E-PP
PP 0.48 90
Capillary
Membrana Accurel
S6/2 PP 450 0.20 73 (Celere &
Gostoli, 2004; Gryta, 2007) Accurel
Q3/2 PP 400 0.20 70
Self-designed PP 800 0.40 73 (Gryta et al., 2000b)
Memcor PV 375 PVDF 125 0.20 75 (Bui et al., 2004)
PV 660 PVDF 170 0.20 64
Hollow fiber
Hoechst-
Celanese Liqui-Cel® Extra-Flow
2.5×8 in
PP 180 40 (Bailey et al., 2000) PP 53 0.074 50
PP 50 0.044 65
PP 47 0.056 42
Table 2. List of commercial membranes commonly used by various MD researchers
In plate and frame modules, the membranes which are usually prepared as discs or flat sheets are placed between two plates. The feed solution flows through flat, rectangular channels. Packing densities for flat sheet membranes may be in the range of 100–400 m3/m2
(Pabby et al., 2009). Polymeric flat sheet membranes are easy to prepare, handle, and mount. The same module can be used to test many different types of MD membranes. The membrane can be supported to enhance mechanical strength. Babu et al. (2008) used a plate and frame membrane module having a membrane area of 0.01 m2 for the concentration of pineapple and sweet lime juice. The module consists of a polyester mesh (0.25 mm) and a hydrophobic microporous polypropylene membrane (pore size 0.20 μm and thickness 175 μm) supported in between a viton gasket (3.0 mm) and two stainless steel frames. In spiral wound membranes, the membrane, feed and permeate channel spacers and the porous membrane support form an envelope which is rolled around a perforated central collection tube and inserted into an outer tubular pressure shell. The feed solution passes in axial direction through the feed channel across the membrane surface. The filtrate moves along
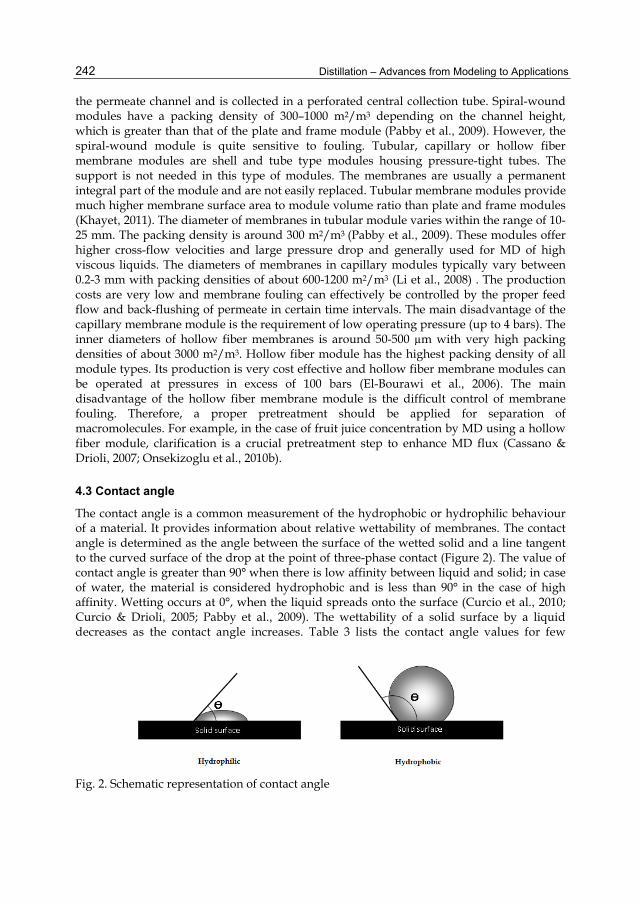
Distillation – Advances from Modeling to Applications
242
the permeate channel and is collected in a perforated central collection tube. Spiral-wound modules have a packing density of 300–1000 m2/m3 depending on the channel height, which is greater than that of the plate and frame module (Pabby et al., 2009). However, the spiral-wound module is quite sensitive to fouling. Tubular, capillary or hollow fiber membrane modules are shell and tube type modules housing pressure-tight tubes. The support is not needed in this type of modules. The membranes are usually a permanent integral part of the module and are not easily replaced. Tubular membrane modules provide much higher membrane surface area to module volume ratio than plate and frame modules (Khayet, 2011). The diameter of membranes in tubular module varies within the range of 10-25 mm. The packing density is around 300 m2/m3 (Pabby et al., 2009). These modules offer higher cross-flow velocities and large pressure drop and generally used for MD of high viscous liquids. The diameters of membranes in capillary modules typically vary between 0.2-3 mm with packing densities of about 600-1200 m2/m3 (Li et al., 2008) . The production costs are very low and membrane fouling can effectively be controlled by the proper feed flow and back-flushing of permeate in certain time intervals. The main disadvantage of the capillary membrane module is the requirement of low operating pressure (up to 4 bars). The inner diameters of hollow fiber membranes is around 50-500 µm with very high packing densities of about 3000 m2/m3. Hollow fiber module has the highest packing density of all module types. Its production is very cost effective and hollow fiber membrane modules can be operated at pressures in excess of 100 bars (El-Bourawi et al., 2006). The main disadvantage of the hollow fiber membrane module is the difficult control of membrane fouling. Therefore, a proper pretreatment should be applied for separation of macromolecules. For example, in the case of fruit juice concentration by MD using a hollow fiber module, clarification is a crucial pretreatment step to enhance MD flux (Cassano & Drioli, 2007; Onsekizoglu et al., 2010b).
4.3 Contact angle
The contact angle is a common measurement of the hydrophobic or hydrophilic behaviour of a material. It provides information about relative wettability of membranes. The contact angle is determined as the angle between the surface of the wetted solid and a line tangent to the curved surface of the drop at the point of three-phase contact (Figure 2). The value of contact angle is greater than 90° when there is low affinity between liquid and solid; in case of water, the material is considered hydrophobic and is less than 90° in the case of high affinity. Wetting occurs at 0°, when the liquid spreads onto the surface (Curcio et al., 2010; Curcio & Drioli, 2005; Pabby et al., 2009). The wettability of a solid surface by a liquid decreases as the contact angle increases. Table 3 lists the contact angle values for few
Fig. 2. Schematic representation of contact angle

Membrane Distillation: Principle, Advances, Limitations and Future Prospects in Food Industry
243
Material Contact Angle, ° Ordinary glass 20 Polycarbonate 70 Polyamide 69 Polyethersulphone 54 Polyethylene 96 Polypropylene 100 PTFE 123 PVDF 111 Teflon 112
Table 3. Contact angle values of water on some materials at ambient temperature (Khayet & Matsuura, 2011; Sigurdsson & Shishoo, 1997)
different materials in water at ambient temperature. For example, the parameter measured on PTFE or PVDF membrane surface was 108° or 107°, respectively (Curcio et al., 2010; Hwang et al., 2011; Tomaszewska, 2000).
4.4 Liquid entry pressure and wetting phenomena
The hydrophobic nature of membranes used in membrane distillation prevents penetration of the aqueous solutions into the pores unless a critical penetration pressure is exceeded, as stated earlier. Liquid entry pressure (LEP) is the minimum transmembrane hydrostatic pressure that must be applied before liquid solutions penetrate into the membrane pores. LEP can be calculated using the Laplace-Young equation (Burgoyne & Vahdati, 2000; Lawson & Lloyd, 1997).
2 LF D
m
CosP P P
r
(4)
where FP and DP are the hydraulic pressure of the feed and distillate side, is the geometric pore coefficient (equals 1 for cylindrical pores), L is the surface tension of the liquid, is the contact angle and mr is the maximum pore size.
LEP depends on membrane characteristics and prevents wetting of the membrane pores during MD experiments. LEP increases with a decrease in maximum pore size at the surface and an increase at the hydrophobicity (i.e., large water contact angle) of the membrane material. The presence of strong surfactants or organic solvents can greatly reduce the liquid surface tension therefore causing membrane wetting. Therefore, care must be taken to prevent contamination of process solutions with detergents or other surfacting agents.
5. Transport mechanisms and polarization phenomena 5.1 Theory of heat transfer
Heat transfer in the MD includes three main steps:
i. Heat transfer through the feed side boundary layer
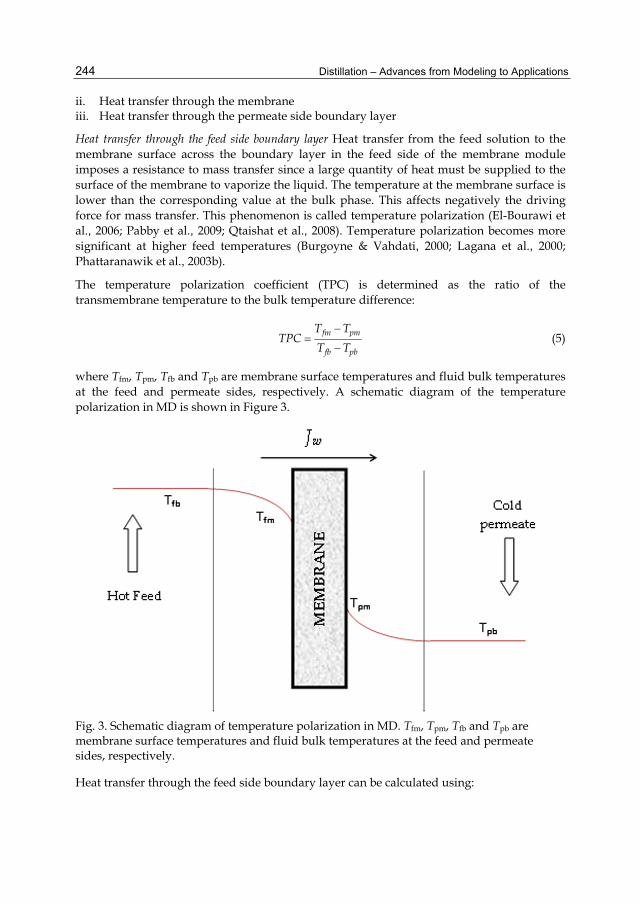
Distillation – Advances from Modeling to Applications
244
ii. Heat transfer through the membrane iii. Heat transfer through the permeate side boundary layer
Heat transfer through the feed side boundary layer Heat transfer from the feed solution to the membrane surface across the boundary layer in the feed side of the membrane module imposes a resistance to mass transfer since a large quantity of heat must be supplied to the surface of the membrane to vaporize the liquid. The temperature at the membrane surface is lower than the corresponding value at the bulk phase. This affects negatively the driving force for mass transfer. This phenomenon is called temperature polarization (El-Bourawi et al., 2006; Pabby et al., 2009; Qtaishat et al., 2008). Temperature polarization becomes more significant at higher feed temperatures (Burgoyne & Vahdati, 2000; Lagana et al., 2000; Phattaranawik et al., 2003b).
The temperature polarization coefficient (TPC) is determined as the ratio of the transmembrane temperature to the bulk temperature difference:
fm pm
fb pb
T TTPC
T T
(5)
where Tfm, Tpm, Tfb and Tpb are membrane surface temperatures and fluid bulk temperatures at the feed and permeate sides, respectively. A schematic diagram of the temperature polarization in MD is shown in Figure 3.
Fig. 3. Schematic diagram of temperature polarization in MD. Tfm, Tpm, Tfb and Tpb are membrane surface temperatures and fluid bulk temperatures at the feed and permeate sides, respectively.
Heat transfer through the feed side boundary layer can be calculated using:

Membrane Distillation: Principle, Advances, Limitations and Future Prospects in Food Industry
245
f f fb fmQ h T T (6)
where hf is the heat transfer coefficient of the feed side boundary layer.
Heat transfer through the membrane: Heat transfer through the membrane appears as a combination of latent heat of vaporization ( VQ ) and conductive heat transfer across both the membrane matrix and the gas filled membrane pores ( CQ ). The corresponding values can be estimated by following equations:
V VQ J H (7)
mC fm pm
kQ T T
(8)
Therefore, the heat flux can be estimated by the following expression (El-Bourawi et al., 2006; Khayet & Matsuura, 2011; Lawson & Lloyd, 1997; Phattaranawik & Jiraratananon, 2001; Schofield et al., 1990a)
m V CQ Q Q (9)
mm fm pm V
kQ T T J H
(10)
where km is the thermal conductivity of the membrane, δ is the membrane thickness, J is the permeate water vapour flux and VH is the latent heat of vaporization.
Various models have been proposed for estimation of km in Equation [10]. Two of the most preferred ones are given below;
1m g sk k k (11)
1
1m
g s
kk k
(12)
Heat transfer through the permeate side boundary layer: Heat transfer from the membrane surface to the bulk permeate side across the boundary layer is also related with the temperature polarization phenomenon. The temperature of membrane surface at the permeate side is higher than that of bulk permeate due to the temperature polarization effect.
Heat transfer through the permeate side boundary layer is given as:
p p pm pbQ h T T (13)
where hp is the heat transfer coefficient of the permeate side boundary layer.
Both feed and permeate side boundary layers are function of fluid properties and operating conditions, as well as the hydrodynamic conditions. There are some convenient approaches in the literature to reduce the temperature polarization effects like mixing thoroughly, working at
Distillation – Advances from Modeling to Applications
246
high flow rates or using turbulence promoters (Cath et al., 2004; Chernyshov et al., 2005; El-Bourawi et al., 2006; Lawson & Lloyd, 1996a; Martinez & Rodriguez-Maroto, 2006).
5.2 Theory of mass transfer
As mentioned above, the mass transfer in MD is driven by the vapour pressure gradient imposed between two sides of the membrane. Mass transfer in membrane distillation consists of three consecutive steps:
i. Evaporation of water at the liquid/gas interface on the membrane surface of the feed side ii. Water vapour transfer through the membrane pores iii. Condensation of water vapour at the gas/liquid interface on the membrane surface of
the permeate side
The mass flux (J) can be expressed as (Close & Sorensen, 2010; Zhang et al., 2010):
J K P (14)
where K is the overall mass transfer coefficient which is the reciprocal of an overall mass transfer resistance. This overall resistance is the sum of three individual resistances:
1
1 1 1
f m p
KK K K
(15)
where Kf, Km and Kp are the mass transfer coefficients of feed layer, membrane and permeate layer, respectively.
Mass transfer trough feed side boundary layer: In membrane distillation, only water vapour transport is allowed due to the hydrophobic character of the membrane. Therefore the concentration of solute(s) in feed solution becomes higher at the liquid/gas interface than that at the bulk feed as mass transfer proceeds. This phenomenon is called concentration polarization and results in reduction of the transmembrane flux by depressing the driving force for water transport. Concentration polarization coefficient (CPC) is determined as the ratio of the solute concentration at the membrane surface (Cfm) to that at the bulk feed solution (Cfb):
fm
fb
CCPC
C (16)
The concentration gradient between the liquid/gas interface and the bulk feed results a diffusive transfer of solutes from the surface of the membrane to the bulk solution. At steady state, the rate of convective solute transfer to the membrane surface is balanced by diffusion of solute to the bulk feed.
The molar flux is expressed as follows (El-Bourawi et al., 2006; Khayet & Matsuura, 2011):
ln fms
fb
CJ k
C
(17)
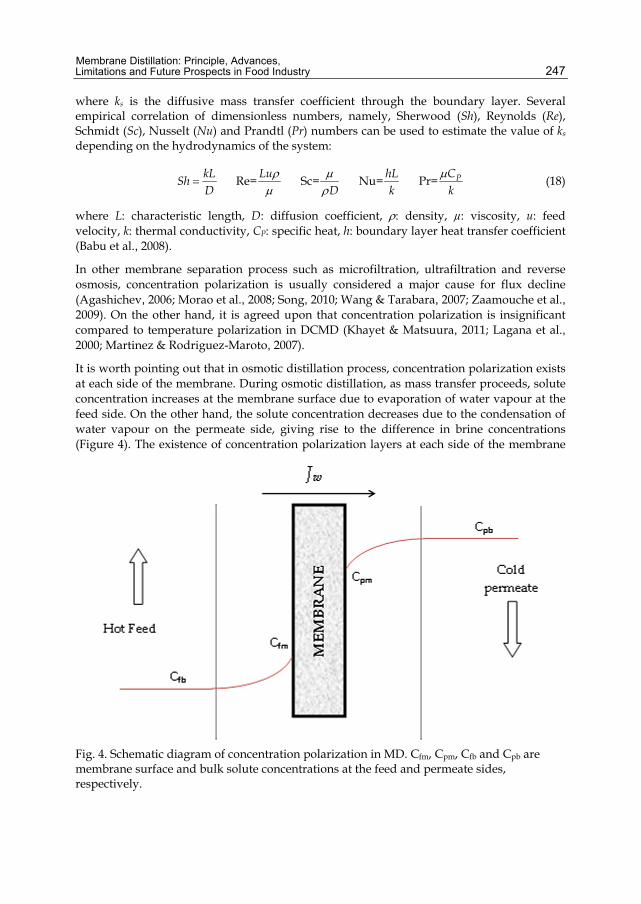
Membrane Distillation: Principle, Advances, Limitations and Future Prospects in Food Industry
247
where ks is the diffusive mass transfer coefficient through the boundary layer. Several empirical correlation of dimensionless numbers, namely, Sherwood (Sh), Reynolds (Re), Schmidt (Sc), Nusselt (Nu) and Prandtl (Pr) numbers can be used to estimate the value of ks depending on the hydrodynamics of the system:
Re= Sc= Nu= Pr= PkL Lu hL CSh
D D k k
(18)
where L: characteristic length, D: diffusion coefficient, : density, µ: viscosity, u: feed velocity, k: thermal conductivity, CP: specific heat, h: boundary layer heat transfer coefficient (Babu et al., 2008).
In other membrane separation process such as microfiltration, ultrafiltration and reverse osmosis, concentration polarization is usually considered a major cause for flux decline (Agashichev, 2006; Morao et al., 2008; Song, 2010; Wang & Tarabara, 2007; Zaamouche et al., 2009). On the other hand, it is agreed upon that concentration polarization is insignificant compared to temperature polarization in DCMD (Khayet & Matsuura, 2011; Lagana et al., 2000; Martinez & Rodriguez-Maroto, 2007).
It is worth pointing out that in osmotic distillation process, concentration polarization exists at each side of the membrane. During osmotic distillation, as mass transfer proceeds, solute concentration increases at the membrane surface due to evaporation of water vapour at the feed side. On the other hand, the solute concentration decreases due to the condensation of water vapour on the permeate side, giving rise to the difference in brine concentrations (Figure 4). The existence of concentration polarization layers at each side of the membrane
Fig. 4. Schematic diagram of concentration polarization in MD. Cfm, Cpm, Cfb and Cpb are membrane surface and bulk solute concentrations at the feed and permeate sides, respectively.

Distillation – Advances from Modeling to Applications
248
results in the reduction of driving force for water vapour transport leading a decrease in transmembrane flux (Babu et al., 2006; Babu et al., 2008; Nagaraj et al., 2006b).
Mass transfer through the membrane pores: The main mass transfer mechanisms through the membrane in MD are Knudsen diffusion and molecular diffusion (Figure 5). Knudsen diffusion model is responsible for mass transfer through the membrane pore if the mean free path of the water molecules is much greater than the pore size of the membrane and hence, the molecules tend to collide more frequently with the pore wall (Li et al., 2008; Nagaraj et al., 2006b; Pabby et al., 2009; Srisurichan et al., 2006).
Fig. 5. Mass transfer mechanism involved in water vapour transport through membrane pores of MD module.
In this case, the membrane diffusion coefficient is calculated using equation:
0.5
1.064mr M
KRT
(19)
where ε is the fractional void volume, δ is the membrane thickness, τ is the tortuosity, M is the molecular weight of water, R is the gas constant and T is the absolute temperature.
On the other hand, when the pore size is relatively large, the molecule–molecule collisions are more frequent and molecular diffusion is responsible for mass transfer through the membrane pores (Khayet & Matsuura, 2011).
ln
1m
D MK
Y RT
(20)
where Yln is the log mean of mole fraction of air and D is the diffusion coefficient.
Both models were successfully applied for predicting the mass transfer through the membrane in DCMD systems (Babu et al., 2006; Bandini & Sarti, 1999; Chen et al., 2009; Lawson & Lloyd, 1996b; Nagaraj et al., 2006b; Srisurichan et al., 2006).
Membrane Distillation: Principle, Advances, Limitations and Future Prospects in Food Industry
249
6. Process parameters Feed concentration
Permeate flux decreases with an increase in feed concentration. This phenomenon can be attributed to the reduction of the driving force due to decrease of the vapour pressure of the feed solution and exponential increase of viscosity of the feed with increasing concentration. The contribution of concentration polarization effects is also known, nevertheless, this is very small in comparison with temperature polarization effects (Lagana et al., 2000; Pabby et al., 2009). As it is well known, MD can handle feed solutions at high concentrations without suffering the large drop in permeability observed in other pressure-driven membrane processes and can be preferentially employed whenever elevated permeate recovery factors or high retentate concentrations are requested (i.e. concentration of fruit juices) (Curcio & Drioli, 2005; Li & Sirkar, 2005; Schofield et al., 1990b).
Feed temperature
Various investigations have been carried out on the effect of the feed temperature on permeate flux in MD. In general, it is agreed upon that there is an exponential increase of the MD flux with the increase of the feed temperature. As the driving force for membrane distillation is the difference in vapour pressure across the membrane, the increase in temperature increases the vapour pressure of the feed solution, thus results an increase in the transmembrane vapour pressure difference.
It is worth quoting that working under high feed temperatures was offered by various MD researches, since the internal evaporation efficiency (the ratio of the heat that contributes to evaporation) and the total heat exchanged from the feed to the permeate side is high. Nevertheless, the increase in quality losses and formation of unfavorable compounds (i.e. hydroxymethyl furfural and furan) in fruit juices due to high operation temperatures restricts the temperature levels (Ciesarova & Vranova, 2009; Crews & Castle, 2007; Onsekizoglu et al., 2010b). Temperature polarization effect also increases with the increase in feed temperature (Moon et al., 2011).
Feed flow rate & stirring
In MD, the increase in flow and/or stirring rate of feed increases the permeate flux. The shearing forces generated at high flow rate and/or stirring reduces the hydrodynamic boundary layer thickness and thus reduce polarization effects. Therefore, the temperature and concentration at the liquid-vapour interface becomes closer to the corresponding values at the bulk feed solution (Winter et al., 2011). Onsekizoglu et al. (2010a) studied the effects of various operating parameters on permeate flux and soluble solid content of apple juice during concentration through osmotic distillation (OD) and membrane distillation (MD) processes. They observed that the effect of feed flow rate on transmembrane flux was less than half of the influence of temperature difference across the membrane.
The effect of flow rate on MD flux becomes more noticeable at higher temperatures especially associated with higher temperature drop across the membrane (Walton et al., 2004). Consequently, higher productivity can be achieved by operating under a turbulent flow regime. On the other hand, the liquid entry pressure of feed solution (LEP) must be taken into account in order to avoid membrane pore wetting when optimizing feed flow rate (Hwang et al., 2011; Khayet et al., 2006).

Distillation – Advances from Modeling to Applications
250
Permeate temperature
The increase in permeate temperature results in lower MD flux due to the decrease of the transmembrane vapour pressure difference as soon as the feed temperature kept constant. It is generally agreed upon that the temperature of cold water on the permeate side has smaller effect on the flux than that of the feed solution for the same temperature difference. This is because the vapour pressure increases exponentially with feed temperature (Alklaibi & Lior, 2005; El-Bourawi et al., 2006).
Permeate flow rate
The increase in permeate flow and/or stirring rate reduces the temperature polarization effect. Consequently, the temperature at the gas/liquid interface approaches to the bulk temperature at the permeate side. This will tend to increase driving force across the membrane; resulting an increase in MD flux (Courel et al., 2000; Hongvaleerat et al., 2008). It is important to note that as the permeate used in the MD is distilled water and in the OD is hypertonic salt solution; the extent of the effect of flow rate is more prominent in the latter configuration. This is because of the contribution of concentration polarization effects on permeate side in OD.
7. Flux enhancement approaches The MD process has some significant advantages over conventional processes, however beside the lack of commercially available MD modules, one of the major technical drawbacks for the use of MD in industrial applications is the low transmembrane flux in comparison with RO. Numerous studies have been performed to reduce polarization effects and to enhance transmembrane flux including cooperation of MD with other membrane processes as well as novel MD module design approaches. Some of mentioned attempts are discussed here.
The combination of MD with other membrane systems such as RO, UF, MF, NF and OD have been well-studied by MD researchers in order to improve transmembrane flux, recovery factors and final product quality (Cabral et al., 2011; Calabro & Drioli, 1997; Cath et al., 2005; Cisse et al., 2011; Conidi et al., 2011; Gomes et al., 2011; Gryta, 2005b; Hogan et al., 1998; Mericq et al., 2009; Wang et al., 2011). Each process is unique and contributes particular advantages to the integrated system design.
UF is a powerful method for removing natural polymers (polysaccharides, proteins) that could increase the viscosity of the feed stream through the MD process. For example, pretreatment of grape juice by UF has been shown to result in an increased flux during subsequent concentration of permeate by OD. The flux increase has been attributed to the reduction in the viscosity of the concentrated juice membrane boundary layer due to protein removal (Bailey et al., 2000). Lukanin et al. (2003) have evaluated the use of an enzymatic pretreatment step before UF of apple juices. The protein level which tend to deposit on the hydrophobic surface during subsequent OD process, have been shown to decrease significantly. Such a deposition improves membrane wetting and can eventually result in a convective flow of liquid through the membrane, which is not allowable in the MD process. Onsekizoglu et al. (2010b) have proposed the use of membrane processes for the production of clarified apple juice concentrate. The efficiency of UF was improved by an additional enzymatic pretreatment and
Membrane Distillation: Principle, Advances, Limitations and Future Prospects in Food Industry
251
flocculation step using fining agents such as gelatine and bentonite. Hongvaleerat et al. (2008) obtained flux values of about 7-10 kg/m2h in pineapple juice concentrate production by OD which were higher than those obtained with single-strength juice.
RO or forward osmosis (FO) processes have been proposed as a pre-concentration step before OD or MD promising reduction of processing costs. High quality fruit juice concentrates can be produced economically in this manner. Therefore, an integrated process involving preconcentration of the feed by RO followed by further concentration by OD or MD should yield a high-solids product concentrate of quality comparable to that achieved by OD alone but at significant reduction in processing cost (Martinetti et al., 2009; Nayak & Rastogi, 2010; Wang et al., 2011). The combination of RO and OD processes was evaluated by Cabra et al. (2011) for concentration of Acerola juice, by Kozak et al. (2009) for concentration of Black currant juice, by Galaverna et al. (2008) for concentration of blood orange juice, by Cassano et al. (2003) for concentration of citrus and carrot juices. It is worth mentioning that in all the previously mentioned studies, a clarification pretreatment step (i.e. ultrafiltration of microfiltration) is involved in order to improve both RO and OD flux.
Criscuoli & Drioli (1999) presented a detailed energetic and exergetic analysis of both RO–MD and NF–RO–MD integrated systems. They observed an improvement in the performance of the integrated system by introducing NF as water pretreatment for the RO–MD system with almost the same energy.
The coupled operation of MD and OD processes is another promising approach to improve transmembrane flux. In this case, osmotic solution is cooled and the feed solution is slightly heated in order to provide additional driving force. Belafi-Bako & Koroknai (2006) compared MD, OD and coupled operation of OD and MD in terms of flux and final soluble solid concentration in sucrose model solutions and apple juice. Higher water flux and SSC values were achieved with coupled operation confirming an increase in driving force. More recently, Onsekizoglu (2011), have proposed the use of a coupled membrane process capable of concentrating pomegranate juice under very mild conditions. The pomegranate juice was clarified by ultrafiltration in a cross-flow membrane filtration unit (MWCO: 100 kDa). The clarified juice then concentrated by coupled operation of OD and MD, in which the feed solution is gently heated (30.0±2.0°C) and the osmotic solution (CaCl2.H2O) is slightly cooled (10.0±1.0°C). The final step yielded a concentration of the clarified juice (with an initial total soluble solid content of (TSS) 17°Brix) up to 60-62°Brix. The experiments have proven that the driving forces were added in coupled operation, which resulted in enhanced water flux during the operation, thus the coupled process was proposed to be more effective.
Several strategies for reducing temperature polarization through membrane arrangement in MD have been proposed. Some authors have considered the use of spacer-filled channels (Chernyshov et al., 2003; Cipollina et al., 2011; Phattaranawik et al., 2001; Teoh et al., 2008; Wang, 2011). The spacers can improve the flow characteristics at the membrane surface and by promoting regions of turbulence due to the formation of eddies and wakes. Therefore, the temperature polarization can be reduced by improved boundary layer heat transfer. Various surface modification techniques including coating, grafting and plasma polymerization to reduce temperature polarization effect though improvement of membrane surface characteristics have been employed. For example, a novel hollow fiber membrane was proposed by Li & Sirkar (2005) which were commercial porous PP hollow fibres coated with a variety of ultrathin microporous silicone-fluoropolymer layer on surface
Distillation – Advances from Modeling to Applications
252
by plasma polymerization. The coated fibres were arranged in a rectangular cross-flow module design, permitting the hot feed solution to flow over the outside surface of the fibres with a higher Reynolds value. Therefore, reduced temperature polarization inducing higher permeate fluxes have been reported. The reason for applying the coating layer was to provide an additional porous layer having higher hydrophobicity than PP, which itself is one of the polymeric materials with very low surface energy (Li et al., 2008). In recent years, a novel multiple-layered composite membrane have been proposed by Qtaishat et al. (2009) comprising a thin hydrophobic microporous layer and a thin hydrophilic layer. The hydrophobic side of the membrane was maintained adjacent to the hot feed, whereas the hydrophilic layer of the membrane was kept adjacent to cold water, which penetrates into the pores of the hydrophilic layer. Such membranes were found to be promising as they combine the low resistance to mass flux, achieved by the diminution of the water vapour transport path length through the hydrophobic thin top layer and a low conductive heat loss through the membrane, obtained by using a thicker hydrophilic sublayer.
8. Long-term performance Membrane fouling & Cleaning procedures
Membrane fouling refers to the loss of membrane performance due to deposition of suspended or dissolved substances on the membrane surface and/or within its pores. There are several types of fouling in the membrane systems including inorganic fouling or scaling, particulate/colloidal fouling, organic fouling and biological fouling (biofouling) (Gryta, 2008). Inorganic fouling or scaling is caused by the accumulation of inorganic precipitates, such as calcium salts (CaCO3, CaSO4), and magnesium carbonates on membrane surface or within pore structure. Precipitates are formed when the concentration of these sparingly soluble salts exceeds their saturation concentrations. Particulate/colloidal fouling is mainly associated with accumulation of biologically inert particles and colloids on the membrane surface. Organic fouling is related with the deposition or adsorption of organic matters on the pores of the membrane surface. Microbial fouling however is formed due to the formation of biofilms on membrane surfaces. Such films (bacterial, algal, or fungal) grow and release biopolymers (polysaccharides, proteins, and amino sugars) as a result of microbial activity (Pabby et al., 2009).
Even though the general agreement is that the fouling phenomena is significantly lower than those encountered in other pressure-driven membrane separation processes, it is one of the major drawbacks in membrane distillation (Gryta, 2005b). The extensive research on membrane fouling has revealed that the efficiency of MD installation can be reduced by more than 50 percent after 50–100 h of process operation due to the presence of fouling effects. In fact, all of the known types of fouling have been determined to occur practically in MD operations (Gryta, 2008).
Kullab & Martin (2011) pointed out that fouling and scaling may result pore clogging in MD membranes, leading to a decrease in effective membrane area, and therefore the permeate flux. Moreover, the flow channel area may be reduced resulting higher temperature polarization due to the pressure drop across the membrane. The increased deposition of the foulant species at the membrane surface would eventually lead to an increase in the pressure drop to levels that the hydrostatic pressure may exceed the LEP of the feed or

Membrane Distillation: Principle, Advances, Limitations and Future Prospects in Food Industry
253
permeate solution into the membrane pores. Therefore the hydrophobic surface of membrane can be partially wetted due to very small nature of the flow channels in MD modules (especially in hollow fiber membrane modules) (El-Bourawi et al., 2006).
It should be emphasized here that although the importance of understanding the fouling phenomena in MD has been pointed out, very few studies have paid attention to long term performance. Most of the performed fouling studies so far examined fouling and scaling in seawater desalination or wastewater treatment applications.
Gryta (2005a) presented the results of the over 3 years’ time research on the direct contact membrane distillation applied for production of the demineralised water using commercial capillary PP membranes. It was found that the membrane was thermally stable, maintaining its morphology and its good separation characteristics throughout the 3 years of DCMD operation. When using permeate of the RO system as DCMD feed solution, membrane pore wetting was not observed; and the DCMD flux was found to be similar to the initial permeate flux. However, precipitation of CaCO3 on the membrane surface was observed when tap water was used directly as a feed. A partial wetting of the membrane was found in this case resulting in a decrease of the permeate flux from 700 to 550 L/m2day. However, the formed deposit was removed every 40–80 h by rinsing the module with a 2–5 wt% HCl solution, permitting the recovery of the initial process efficiency. On the other hand, authors reported that a multiple repetition of this operation resulted in a gradual decline of the maximum flux of permeate.
Ding et al. (2008) investigated the fouling resistance in concentrating traditional Chinese medicine (TCM) extract by DCMD. The observed permeate flux decline was attributed to membrane fouling introducing additional thermal resistance in the boundary layer. No considerable membrane wetting due to TCM deposition on the membrane surface was detected.
The membranes used in MD require regular periodic membrane cleaning to remove membrane fouling and keep the permeability loss within a given range. Durham & Nguyen (1994) evaluated the effectiveness of several cleaning agents for OD membranes fouled by tomato paste. The microporous PTFE and cross-linked acrylic-fluoroethane copolymer membranes were used in the study. The cleaning regime was determined by the membrane surface tension. The most effective cleaner for membranes with a surface tension greater than 23 mN/m was determined as 1% NaOH; however, hydrophobic integrity of these membranes was destroyed during repeated fouling/cleaning trials. On the other hand, P3 Ultrasil 56 was the most effective one for membranes with a surface tension less than 23 mN/m. Water vapour flux was maintained and no salt leakage during repeated fouling/cleaning trials were determined.
Bubbling seems to be an obvious strategy to induce flow and improve shear stress at the membrane surface to control polarization and fouling. Ding et al. (2011) successfully employed the intermittent gas bubbling method to reduce fouling layer formed in concentrating TCM extract through DCMD. To limit membrane fouling or flux decline during concentrating process, intermittent gas bubbling was introduced to the feed side of membrane module. It was confirmed by experimental results that membrane fouling was effectively controlled in the way of removing deposited foulants from membrane surface by created two phase flow.

Distillation – Advances from Modeling to Applications
254
As can be concluded from the expressed results, there is a lack of data and understanding in fouling phenomena in MD especially in the food processing field. However, the risk of fouling and wetting of membrane pores compromises the durability of the membranes limiting their applications in food industry. The long term MD performance needs to be extensively studied so as to make the MD process more challenging in food industry.
9. Applications in food industry The main food-related applications of membrane distillation are the desalination and production of high purity water from brackish water and seawater. The major advantage of MD in desalination is the ability to achieve high rejection factors which cannot be accomplished by RO at high permeate fluxes. Production of high purity water is well-established with rejection factors of almost 100% of non-volatile compounds (Khayet & Matsuura, 2011). The MD process has been successfully studied for purification of waste waters of pharmaceutical (Ding et al., 2011) and textile (Criscuoli et al., 2008) industries as well as underground waters contaminated with heavy metals (Zolotarev et al., 1994) and sulfuric acid solutions (Tomaszewska, 2000). Very recently, the feasibility of applying membrane distillation process for recovering potable water from arsenic, uranium and fluoride contaminated brackish waters has been proposed (Yarlagadda et al., 2011). A high quality permeate with dissolved solids concentrations less than 20 ppm (>99% rejection of salts) along with arsenic, fluoride and uranium contaminant reductions in the range of 96.5–99.9% were reported. Ke He et al. (2011) reported a flux value of 14.36 L/m2h over one month DCMD operation of sea water at the following conditions: hot side inlet temperature of 60 °C, cold side inlet temperature of 20 °C, and hot and cold side flow rate of 0.6 L/min for PTFE pore size 0.22 μm membranes. The electrical conductivity values of permeate were determined below 8 μS/cm. Gryta (2010) evaluated the desalination of water containing up to 12 g/L of soluble salts MD for 250 h by using PP membranes. Electrical conductivity values of produced water were in the range of 3.4–4.1 μS/cm despite a ten-fold increase of salt concentration. The permeate flux during MD process lasting 250 h decreased slightly from 543 to 498 L/m2h. Thermal water pretreatment was used to prevent scaling which was formed due to decomposition of bicarbonates dissolved in water. On the other hand, the operation was found to be beneficial only for underground waters with high hardness.
One of the main advantages of MD in water purification is the lower energy consumption. Like any other distillation process MD also requires energy for evaporation of water, as stated earlier. However, MD process can effectively operate at low temperatures, which makes it possible to utilize low-grade waste and/or alternative energy sources, such as solar and geothermal energy.
MD and OD are proposed as very challenging technologies for concentration of fruit juice allowing to overcome the drawbacks of conventional thermal evaporation encountered by application of high temperatures (Ali et al., 2003; Bui & Nguyen, 2005; Cisse et al., 2005; Pabby et al., 2009; Shaw et al., 2002; Vaillant et al., 2001). The preliminary study of effective concentration of orange juice by MD was presented by Calabro et al. (1994) using a microporous PVDF membrane. Alves & Coelhoso (2006) compared MD and OD in terms of water flux and aroma retention in model orange juice. A higher retention per amount of water removal was observed with OD together with higher flux values. Very recently, Jorgensen et al. (2011) evaluated the potential of SGMD and VMD configurations for

Membrane Distillation: Principle, Advances, Limitations and Future Prospects in Food Industry
255
recovery of black currant and cherry juice aroma compounds. The influence of the sweeping gas flow rate (SGMD only), feed temperature and feed flow rate on the permeate flux and the concentrations factors of 12 selected aroma compounds were examined on an aroma model solution and on black currant juice in a laboratory scale set-up. At 45 °C the most volatile and hydrophobic aroma compounds was obtained with the highest concentration factors: 12.1–9.3 (black currant juice) and 17.2–12.8 (model solution). A volume reduction of 13.7% (vol.%) at 45 °C, 400 L/h, resulted in an aroma recovery of 73–84 vol.% for the most volatile compounds in black currant juice.
In concentration of fruit juices containing oily constituents (such as limonene in orange juice), membrane wetting may occur due to high affinity of hydrophobic membrane material with such compounds. Coating of membrane with hydrophilic polymers such as polyvinyl alcohol (PVA) (Mansouri & Fane, 1999) and alginate (Xu et al., 2004) has been proposed to overcome this problem. Recently, Chanachai et al. (2010) studied the coating of hydrophobic membrane PVDF with chitosan, a highly hydrophilic polymer, for protection against wetting by oils from fruit juice. The results indicated that the coated membrane well protected the membrane against wetting-out and could maintain stable flux. Coated membranes used to concentrate the oil solution (limonene 2%, v/v) for 5 h were not wetted out during flux measurement and no visual damage was observed indicating the stability on the base membrane.
It has been well-established that the combination of MD with other membrane technologies offers important benefits over stand alone use of MD in the concentration of various types of juices including grape juice (Rektor et al., 2007), pineapple juice (Hongvaleerat et al., 2008), kiwi fruit juice (Cassano & Drioli, 2007), camu-camu juice (Rodrigues et al., 2004), sugar-cane juice (Nene et al., 2004) and cactus pear juice (Cassano et al., 2007). The integration of MD with other membrane operations such as MF, UF, NF, RO and OD permits advantage of achieving high quality fruit juice concentrates with higher economic feasibility. The use of integrated membrane processes for clarification and concentration of citrus (orange and lemon) and carrot juices have been proposed by Cassano et al. (2003). A limpid phase has been produced by ultrafiltration pilot unit. The clarified permeate coming from UF has been concentrated up to 15-20 °Brix by RO with a laboratory scale unit. Finally, OD step was applied to yield 60-63°Brix concentrate with a transmembrane flux of 1kg/m2h. A slight decrease in the total antioxidant activity has been reported during RO treatment, whereas no significant change was observed during OD treatment. Kozak et. al (2009) investigated an integrated approach for black currant juice concentration. The juice samples were prefiltered by MF and preconcentrated to 22°Brix by RO. A further concentration of the retentate coming from RO was obtained by MD and black currant concentrate with 58.2 °Brix was produced. Onsekizoglu et al. (2010b) have proposed the use of membrane processes for the production of clarified apple juice concentrate. The efficiency of UF was improved by an additional enzymatic pretreatment and flocculation step using fining agents such as gelatine and bentonite. The permeate coming from the UF with initial TSS contents of ca. 12 °Brix were subsequently concentrated up to TSS contents of 65 °Brix by MD, OD and coupled operation of MD & OD processes. The effect of clarification and concentration processes on formation of 5-hydroxymethylfurfural (HMF), retention of bioactive compounds (phenolic compounds, organic acids, glucose, fructose and sucrose) and their efficiency in preserving natural color and aroma (trans-2-hexenal, the most relevant compound in apple juice aroma) were evaluated in order to maintain a high quality product. The new membrane based
Distillation – Advances from Modeling to Applications
256
concentration techniques have been reported to be very efficient since the concentrated juice presented nutritional and sensorial quality very similar to that of the original juice especially regarding the retention of bright natural color and pleasant aroma, which were considerably lost during thermal evaporation. Further analysis have shown that the subsequent concentration treatments by MD, OD and coupled operation of MD & OD processes did not induce any significant changes in phenolic compounds, organic acids and sugars independently on the final concentration achieved.
The MD process can be successfully applied to remove ethanol and the other volatile metabolites from the fermentation broth (Banat & Al-Shannag, 2000; Gryta, 2001; Gryta & Barancewicz, 2011; Gryta et al., 2000a; Tomaszewska & Bialonczyk, 2011). The fermentation of sugar with Saccharomyces cerevisiae proceeds with the formation of by-products, which tend to inhibit the yeast productivity. The removal of ethanol is usually carried out by distillation. The primary disadvantages of the conventional process of ethanol generation include high energy consumption and excessive amount of wastewater discharged from the distillation columns. The MD process provides an economical alternative to the existing distillation technique for continuous removal of fermented products. The removal of volatile metabolites from the fermentation broth by MD process enables reduction of the inhibitory effect of these compounds on microbial culture together with an increased rate of sugar conversion to ethanol and hence the cost of further concentration of alcohol can be reduced. The main advantage of MD over conventional distillation processes is that membrane distillation takes place at a temperature below the normal boiling point of broth solutions.
Other food-related applications of MD include concentration of natural food colorants (Nayak & Rastogi, 2010), dealcoholization of wine (Varavuth et al., 2009) and concentration of herbal and plant extracts (Cisse et al., 2011; Dornier et al., 2011; Johnson et al., 2002; Zhao et al., 2011).
10. Concluding remarks and future prospects As a promising alternative to replace other separation processes, MD has gained much interest for its lower energy requirement in comparison with conventional distillation, lower operating pressures and higher rejection factors than in pressure driven processes such as NF, and RO. Although MD has been known for more than 40 years, a number of problems exist when MD is considered for industrial implementation. Most of the conducted MD studies are still in the laboratory scale. In recent years, some pilot plant studies have been proposed for desalination (Blanco et al., 2011; Farmani et al., 2008; Song et al., 2008; Xu et al., 2006), however long term evaluations of pilot plant applications for the concentration and recovery of aqueous solutions containing volatile solutes especially in the food industry are still scarce. Therefore, achievement of high concentration levels in certain fruit juice samples taking into account the effects on mass and heat transfer mechanisms, membrane characteristics and the quality parameters together with a detailed economical analysis should be examined on a large scale.
On the other hand, there is a lack of commercially available MD units; practically all membrane modules are designed for other membrane operations (i.e. microfiltration) rather than MD. Novel membranes specifically designed for MD applications should be fabricated in an economically feasible way. Research on transmembrane flux enhancement (i.e. acoustic field) for large scale applications is required. More attention should be paid to the
Membrane Distillation: Principle, Advances, Limitations and Future Prospects in Food Industry
257
possibility of integrating MD to other separation techniques in order to improve the efficiency of the overall system and to make the process economically viable for industrial applications. For fruit juice concentration, coupled operation of MD and OD seems promising to overcome high temperature related problems (i.e. aroma and colour loss) encountered in MD. However, integration of MD with other MD variants as well as conventional distillation techniques has not yet been investigated. Hence more focus on such combinations is required. In recent years, coupling MD with solar energy systems has been well studied by various researchers for desalination of sea water.
The ability to effectively operate at low temperatures makes MD process possible to utilize low-grade waste and/or alternative energy sources. In recent years, coupling MD with solar, geothermal and waste energy systems has been proposed to decrease energy consumption in desalination systems. Such an approach may be crucial for food processing systems. For example, in the case of fruit juice concentration, much lower temperatures should be applied in order to obtain stable products able to retain as much possible the uniqueness of the fresh fruit, its original color, aroma, nutritional value and structural characteristics. Thus, the possibility of operating under very mild conditions enables MD to utilize various alternative energy sources, making it more promising for industrial application. Further efforts need to be concentrated in this field, especially in utilization of waste energy and/or other renewable energy sources in the view of industrial implementation.
11. References Agashichev, S. P. (2006) Modeling of the concentration polarization in a cylindrical channel
of an ultrafiltration module. Theoretical Foundations of Chemical Engineering, 40, 215-216.
Ali, F., Dornier, M., Duquenoy, A. & Reynes, M. (2003) Evaluating transfers of aroma compounds during the concentration of sucrose solutions by osmotic distillation in a batch-type pilot plant. Journal of Food Engineering, 60, 1-8.
Alklaibi, A. M. & Lior, N. (2005) Membrane-distillation desalination: status and potential. Desalination, 171, 111-131.
Alves, V. D. & Coelhoso, I. M. (2006) Orange juice concentration by osmotic evaporation and membrane distillation: A comparative study. Journal of Food Engineering, 74, 125-133.
Babu, B. R., Rastogi, N. K. & Raghavarao, K. S. M. S. (2006) Mass transfer in osmotic membrane distillation of phycocyanin colorant and sweet-lime juice. Journal of Membrane Science, 272, 58-69.
Babu, B. R., Rastogi, N. X. & Raghavarao, K. S. M. S. (2008) Concentration and temperature polarization effects during osmotic membrane distillation. Journal of Membrane Science, 322, 146-153.
Bagger-Jorgensen, R., Meyer, A. S., Pinelo, M., Varming, C. & Jonsson, G. (2011) Recovery of volatile fruit juice aroma compounds by membrane technology: Sweeping gas versus vacuum membrane distillation. Innovative Food Science & Emerging Technologies, 12, 388-397.
Bailey, A. F. G., Barbe, A. M., Hogan, P. A., Johnson, R. A. & Sheng, J. (2000) The effect of ultrafiltration on the subsequent concentration of grape juice by osmotic distillation. Journal of Membrane Science, 164, 195-204.
Distillation – Advances from Modeling to Applications
258
Banat, F. A. & Al-Shannag, M. (2000) Recovery of dilute acetone-butanol-ethanol (ABE) solvents from aqueous solutions via membrane distillation. Bioprocess Engineering, 23, 643-649.
Banat, F. A. & Simandl, J. (1999) Membrane distillation for dilute ethanol - Separation from aqueous streams. Journal of Membrane Science, 163, 333-348.
Bandini, S. & Sarti, G. C. (1999) Heat and mass transport resistances in vacuum membrane distillation per drop. Aiche Journal, 45, 1422-1433.
Barbe, A. M., Hogan, P. A. & Johnson, R. A. (2000) Surface morphology changes during initial usage of hydrophobic, microporous polypropylene membranes. Journal of Membrane Science, 172, 149-156.
Bazinet, L., Cossec, C., Gaudreau, H. & Desjardins, Y. (2009) Production of a Phenolic Antioxidant Enriched Cranberry Juice by Electrodialysis with Filtration Membrane. Journal of Agricultural and Food Chemistry, 57, 10245-10251.
Belafi-Bako, K. & Koroknai, B. (2006) Enhanced water flux in fruit juice concentration: Coupled operation of osmotic evaporation and membrane distillation. Journal of Membrane Science, 269, 187-193.
Blanco, J., Guillen-Burrieza, E., Zaragoza, G., Alarcon, D. C., Palenzuela, P., Ibarra, M. & Gernjak, W. (2011) Experimental analysis of an air gap membrane distillation solar desalination pilot system. Journal of Membrane Science, 379, 386-396.
Brodard, F., Romero, J., Belleville, M. P., Sanchez, J., Combe-James, C., Dornier, M. & Rios, G. M. (2003) New hydrophobic membranes for osmotic evaporation process. Separation and Purification Technology, 32, 3-7.
Bryjak, M., Gancarz, I. & Pozniak, G. (2000) Plasma-modified porous membranes. Chemical Papers-Chemicke Zvesti, 54, 496-501.
Bui, A. V. & Nguyen, H. M. (2005) Scaling Up of Osmotic Distillation from Laboratory to Pilot Plant for Concentration of Fruit Juices. International Journal of Food Engineering, 1, -.
Bui, V. A., Nguyen, M. H. & Muller, J. (2004) A laboratory study on glucose concentration by osmotic distillation in hollow fibre module. Journal of Food Engineering, 63, 237-245.
Burgoyne, A. & Vahdati, M. M. (2000) Direct contact membrane distillation. Separation Science and Technology, 35, 1257-1284.
Cabral, L. M. C., Pagani, M. M., Rocha-Leao, M. H., Couto, A. B. B., Pinto, J. P., Ribeiro, A. O. & Gomes, F. D. (2011) Concentration of acerola (Malpighia emarginata DC.) juice by integrated membrane separation process. Desalination and Water Treatment, 27, 130-134.
Calabro, V. & Drioli, E. (1997) Polarization phenomena in integrated reverse osmosis and membrane distillation for seawater desalination and waste water treatment. Desalination, 108, 81-82.
Calabro, V., Jiao, B. L. & Drioli, E. (1994) Theoretical and Experimental-Study on Membrane Distillation in the Concentration of Orange Juice. Industrial & Engineering Chemistry Research, 33, 1803-1808.
Cassano, A., Conidi, C., Timpone, R., D'Avella, M. & Drioli, E. (2007) A membrane-based process for the clarification and the concentration of the cactus pear juice. Journal of Food Engineering, 80, 914-921.
Cassano, A. & Drioli, E. (2007) Concentration of clarified kiwifruit juice by osmotic distillation. Journal of Food Engineering, 79, 1397-1404.
Cassano, A., Drioli, E., Galaverna, G., Marchelli, R., Di Silvestro, G. & Cagnasso, P. (2003) Clarification and concentration of citrus and carrot juices by integrated membrane processes. Journal of Food Engineering, 57, 153-163.

Membrane Distillation: Principle, Advances, Limitations and Future Prospects in Food Industry
259
Cath, T. Y., Adams, D. & Childress, A. E. (2005) Membrane contactor processes for wastewater reclamation in space II. Combined direct osmosis, osmotic distillation, and membrane distillation for treatment of metabolic wastewater. Journal of Membrane Science, 257, 111-119.
Cath, T. Y., Adams, V. D. & Childress, A. E. (2004) Experimental study of desalination using direct contact membrane distillation: a new approach to flux enhancement. Journal of Membrane Science, 228, 5-16.
Celere, M. & Gostoli, C. (2004) Osmotic distillation with propylene glycol, glycerol and glycerol-salt mixtures. Journal of Membrane Science, 229, 159-170.
Chanachai, A., Meksup, K. & Jiraratananon, R. (2010) Coating of hydrophobic hollow fiber PVDF membrane with chitosan for protection against wetting and flavor loss in osmotic distillation process. Separation and Purification Technology, 72, 217-224.
Chen, T. C., Ho, C. D. & Yeh, H. M. (2009) Theoretical modeling and experimental analysis of direct contact membrane distillation. Journal of Membrane Science, 330, 279-287.
Chernyshov, M. N., Meindersma, G. W. & de Haan, A. B. (2003) Modelling temperature and salt concentration distribution in membrane distillation feed channel. Desalination, 157, 315-324.
Chernyshov, M. N., Meindersma, G. W. & de Haan, A. B. (2005) Comparison of spacers for temperature polarization reduction in air gap membrane distillation. Desalination, 183, 363-374.
Ciesarova, Z. & Vranova, J. (2009) Furan in Food - a Review. Czech Journal of Food Sciences, 27, 1-10.
Cipollina, A., Micale, G. & Rizzuti, L. (2011) Membrane distillation heat transfer enhancement by CFD analysis of internal module geometry. Desalination and Water Treatment, 25, 195-209.
Cisse, M., Vaillant, F., Bouquet, S., Pallet, D., Lutin, F., Reynes, M. & Dornier, M. (2011) Athermal concentration by osmotic evaporation of roselle extract, apple and grape juices and impact on quality. Innovative Food Science & Emerging Technologies, 12, 352-360.
Cisse, M., Vaillant, F., Perez, A., Dornier, M. & Reynes, M. (2005) The quality of orange juice processed by coupling crossflow microfiltration and osmotic evaporation. International Journal of Food Science and Technology, 40, 105-116.
Close, E. & Sorensen, E. (2010) Modelling of Direct Contact Membrane Distillation for Desalination. 20th European Symposium on Computer Aided Process Engineering, 28, 649-654.
Conidi, C., Cassano, A. & Drioli, E. (2011) A membrane-based study for the recovery of polyphenols from bergamot juice. Journal of Membrane Science, 375, 182-190.
Courel, M., Dornier, M., Herry, J. M., Rios, G. M. & Reynes, M. (2000) Effect of operating conditions on water transport during the concentration of sucrose solutions by osmotic distillation. Journal of Membrane Science, 170, 281-289.
Couto, D. S., Dornier, M., Pallet, D., Reynes, M., Dijoux, D., Freitas, S. P. & Cabral, L. M. C. (2011) Evaluation of nanofiltration membranes for the retention of anthocyanins of acai (Euterpe oleracea Mart.) juice. Desalination and Water Treatment, 27, 108-113.
Crews, C. & Castle, L. (2007) A review of the occurrence, formation and analysis of furan in heat-processed foods. Trends in Food Science & Technology, 18, 365-372.
Criscuoli, A. & Drioli, E. (1999) Energetic and exergetic analysis of an integrated membrane desalination system. Desalination, 124, 243-249.
Distillation – Advances from Modeling to Applications
260
Criscuoli, A., Zhong, J., Figoli, A., Carnevale, M. C., Huang, R. & Drioli, E. (2008) Treatment of dye solutions by vacuum membrane distillation. Water Research, 42, 5031-5037.
Curcio, E., Di, P. G. & Enrico, D. (Eds.). (2010). Membrane distillation and osmotic distillation, Elsevier.
Curcio, E. & Drioli, E. (2005) Membrane distillation and related operations - A review. Separation and Purification Reviews, 34, 35-86.
Ding, Z. W., Liu, L. Y., Liu, Z. & Ma, R. Y. (2011) The use of intermittent gas bubbling to control membrane fouling in concentrating TCM extract by membrane distillation. Journal of Membrane Science, 372, 172-181.
Ding, Z. W., Liu, L. Y., Yu, H. F., Ma, R. Y. & Yang, Z. R. (2008) Concentrating the extract of traditional Chinese medicine by direct contact membrane distillation. Journal of Membrane Science, 310, 539-549.
Ding, Z. W., Ma, R. Y. & Fane, A. G. (2003) A new model for mass transfer in direct contact membrane distillation. Desalination, 151, 217-227.
Dornier, M., Cisse, M., Vaillant, F., Bouquet, S., Pallet, D., Lutin, F. & Reynes, M. (2011) Athermal concentration by osmotic evaporation of roselle extract, apple and grape juices and impact on quality. Innovative Food Science & Emerging Technologies, 12, 352-360.
Durham, R. J. & Nguyen, M. H. (1994) Hydrophobic Membrane Evaluation and Cleaning for Osmotic Distillation of Tomato Puree. Journal of Membrane Science, 87, 181-189.
El-Bourawi, M. S., Ding, Z., Ma, R. & Khayet, M. (2006) A framework for better understanding membrane distillation separation process. Journal of Membrane Science, 285, 4-29.
Farmani, B., Haddadekhodaparast, M. H., Hesari, J. & Aharizad, S. (2008) Determining Optimum Conditions for Sugarcane Juice Refinement by Pilot Plant Dead-end Ceramic Micro-filtration. Journal of Agricultural Science and Technology, 10, 351-357.
Galaverna, G., Di Silvestro, G., Cassano, A., Sforza, S., Dossena, A., Drioli, E. & Marchelli, R. (2008) A new integrated membrane process for the production of concentrated blood orange juice: Effect on bioactive compounds and antioxidant activity. Food Chemistry, 106, 1021-1030.
Garcia-Payo, M. C., Izquierdo-Gil, M. A. & Fernandez-Pineda, C. (2000) Air gap membrane distillation of aqueous alcohol solutions. Journal of Membrane Science, 169, 61-80.
Gomes, F. D., da Costa, P. A., de Campos, M. B. D., Couri, S. & Cabral, L. M. C. (2011) Concentration of watermelon juice by reverse osmosis process. Desalination and Water Treatment, 27, 120-122.
Gryta, M. (2001) The fermentation process integrated with membrane distillation. Separation and Purification Technology, 24, 283-296.
Gryta, M. (2005a) Long-term performance of membrane distillation process. Journal of Membrane Science, 265, 153-159.
Gryta, M. (2005b) Osmotic MD and other membrane distillation variants. Journal of Membrane Science, 246, 145-156.
Gryta, M. (2007) Influence of polypropylene membrane surface porosity on the performance of membrane distillation process. Journal of Membrane Science, 287, 67-78.
Gryta, M. (2008) Fouling in direct contact membrane distillation process. Journal of Membrane Science, 325, 383-394.
Gryta, M. (2010) Desalination of thermally softened water by membrane distillation process. Desalination, 257, 30-35.
Membrane Distillation: Principle, Advances, Limitations and Future Prospects in Food Industry
261
Gryta, M. & Barancewicz, M. (2011) Separation of volatile compounds from fermentation broth by membrane distillation. Polish Journal of Chemical Technology, 13, 56-60.
Gryta, M., Morawski, A. W. & Tomaszewska, M. (2000a) Ethanol production in membrane distillation bioreactor. Catalysis Today, 56, 159-165.
Gryta, M., Tomaszewska, M. & Morawski, A. W. (2000b) A capillary module for membrane distillation process. Chemical Papers, 54, 370-374.
He, K., Hwang, H. J., Woo, M. W. & Moon, I. S. (2011) Production of drinking water from saline water by direct contact membrane distillation (DCMD). Journal of Industrial and Engineering Chemistry, 17, 41-48.
Hogan, P. A., Canning, R. P., Peterson, P. A., Johnson, R. A. & Michaels, A. S. (1998) A new option: Osmotic distillation. Chemical Engineering Progress, 94, 49-61.
Hongvaleerat, C., Cabral, L. M. C., Dornier, M., Reynes, M. & Ningsanond, S. (2008) Concentration of pineapple juice by osmotic evaporation. Journal of Food Engineering, 88, 548-552.
Huo, R. T., Gu, Z. Y., Zuo, K. J. & Zhao, G. M. (2010) Preparation and Humic Acid Fouling Resistance of Poly(vinylidene fluoride)-Fabric Composite Membranes for Membrane Distillation. Journal of Applied Polymer Science, 117, 3651-3658.
Huo, R. T., Gu, Z. Y., Zuo, K. J. & Zhao, G. M. (2011) Fouling resistance of PVDF-fabric composite membrane in membrane distillation desalination. Advances in Composites, Pts 1 and 2, 150-151, 334-339.
Hwang, H. J., He, K., Gray, S., Zhang, J. H. & Moon, I. S. (2011) Direct contact membrane distillation (DCMD): Experimental study on the commercial PTFE membrane and modeling. Journal of Membrane Science, 371, 90-98.
Ibarz, A., Garza, S., Garvin, A. & Pagan, J. (2011) Degradation of mansarin juice concnetrates treated at high temperatures. Journal of Food Process Engineering, 34, 682-696.
Izquierdo-Gil, M. A., Garcia-Payo, M. C. & Fernandez-Pineda, C. (1999) Air gap membrane distillation of sucrose aqueous solutions. Journal of Membrane Science, 155, 291-307.
Jiao, B., Cassano, A. & Drioli, E. (2004) Recent advances on membrane processes for the concentration of fruit juices: a review. Journal of Food Engineering, 63, 303-324.
Johnson, R. A., Sun, J. C. & Sun, J. (2002) A pervaporation-microfiltration-osmotic distillation hybrid process for the concentration of ethanol-water extracts of the Echinacea plant. Journal of Membrane Science, 209, 221-232.
Kadakal, C., Sebahattin, N. & Poyrazoglu, E. S. (2002) Effect of commercial processing stages of apple juice on patulin, fumaric acid and hydroxymethylfurfural (HMF) levels. Journal of Food Quality, 25, 359-368.
Khayet, A., Matsuura, T., Mengual, J. I. & Qtaishat, M. (2006) Design of novel direct contact membrane distillation membranes. Desalination, 192, 105-111.
Khayet, M. (2011) Membranes and theoretical modeling of membrane distillation: A review. Advances in Colloid and Interface Science, 164, 56-88.
Khayet, M., Cojocaru, C. & Garcia-Payo, M. C. (2010) Experimental design and optimization of asymmetric flat-sheet membranes prepared for direct contact membrane distillation. Journal of Membrane Science, 351, 234-245.
Khayet, M., Khulbe, K. C. & Matsuura, T. (2004a) Characterization of membranes for membrane distillation by atomic force microscopy and estimation of their water vapor transfer coefficients in vacuum membrane distillation process. Journal of Membrane Science, 238, 199-211.
Distillation – Advances from Modeling to Applications
262
Khayet, M., Velazquez, A. & Mengual, J. I. (2004b) Direct contact membrane distillation of humic acid solutions. Journal of Membrane Science, 240, 123-128.
Khayet, M. S. & Matsuura, T. 2011. Membrane distillation: principles and applications. Elsevier. Kim, S. S. & Lloyd, D. R. (1991) Microporous membrane formation via thermally-induced
phase separation. 3. Effect of thermodynamic interactions on the structure of isotactic polypropylene membranes. Journal of Membrane Science, 64, 13-29.
Kong, Y., Lin, X., Wu, Y. L., Chen, J. & Xu, J. P. (1992) Plasma Polymerization of Octafluorocyclobutane and Hydrophobic Microporous Composite Membranes for Membrane Distillation. Journal of Applied Polymer Science, 46, 191-199.
Kozak, A., Bekassy-Molnar, E. & Vatai, G. (2009) Production of black-currant juice concentrate by using membrane distillation. Desalination, 241, 309-314.
Krajewski, S. R., Kujawski, W., Bukowska, M., Picard, C. & Larbot, A. (2006) Application of fluoroalkylsilanes (FAS) grafted ceramic membranes in membrane distillation process of NaCl solutions. Journal of Membrane Science, 281, 253-259.
Kullab, A. & Martin, A. (2011) Membrane distillation and applications for water purification in thermal cogeneration plants. Separation and Purification Technology, 76, 231-237.
Lagana, F., Barbieri, G. & Drioli, E. (2000) Direct contact membrane distillation: modelling and concentration experiments. Journal of Membrane Science, 166, 1-11.
Lai, C. L., Liou, R. M., Chen, S. H., Huang, G. W. & Lee, K. R. (2011) Preparation and characterization of plasma-modified PTFE membrane and its application in direct contact membrane distillation. Desalination, 267, 184-192.
Lawson, K. W., Hall, M. S. & Lloyd, D. R. (1995) Compaction of Microporous Membranes Used in Membrane Distillation .1. Effect on Gas-Permeability. Journal of Membrane Science, 101, 99-108.
Lawson, K. W. & Lloyd, D. R. (1996a) Membrane distillation .1. Module design and performance evaluation using vacuum membrane distillation. Journal of Membrane Science, 120, 111-121.
Lawson, K. W. & Lloyd, D. R. (1996b) Membrane distillation .2. Direct contact MD. Journal of Membrane Science, 120, 123-133.
Lawson, K. W. & Lloyd, D. R. (1997) Membrane distillation. Journal of Membrane Science, 124, 1-25.
Li, B. & Sirkar, K. K. (2004) Novel membrane and device for direct contact membrane distillation-based desalination process. Industrial & Engineering Chemistry Research, 43, 5300-5309.
Li, B. & Sirkar, K. K. (2005) Novel membrane and device for vacuum membrane distillation-based desalination process. Journal of Membrane Science, 257, 60-75.
Li, N. N., Fane, A. G., Ho, W. S. W. & Matsuura, T. (Eds.). (2008). Advanced Membrane Technology and Applications, John Wiley & Sons Inc., New Jersey.
Liu, F., Hashim, N. A., Liu, Y. T., Abed, M. R. M. & Li, K. (2011) Progress in the production and modification of PVDF membranes. Journal of Membrane Science, 375, 1-27.
Lukanin, E. S., Gunko, S. M., Bryk, M. T. & Nigmatullin, R. R. (2003) The effect of content of apple juice biopolymers on the concentration by membrane distillation. Journal of Food Engineering, 60, 275-280.
Mansouri, J. & Fane, A. G. (1999) Osmotic distillation of oily feeds. Journal of Membrane Science, 153, 103-120.
Membrane Distillation: Principle, Advances, Limitations and Future Prospects in Food Industry
263
Martinetti, C. R., Childress, A. E. & Cath, T. Y. (2009) High recovery of concentrated RO brines using forward osmosis and membrane distillation. Journal of Membrane Science, 331, 31-39.
Martinez-Diez, L., Vazquez-Gonzalez, M. I. & Florido-Diaz, F. J. (1998) Study of membrane distillation using channel spacers. Journal of Membrane Science, 144, 45-56.
Martinez, L., Florido-Diaz, F. J., Hernandez, A. & Pradanos, P. (2002) Characterisation of three hydrophobic porous membranes used in membrane distillation - Modelling and evaluation of their water vapour permeabilities. Journal of Membrane Science, 203, 15-27.
Martinez, L. & Rodriguez-Maroto, J. M. (2006) Characterization of membrane distillation modules and analysis of mass flux enhancement by channel spacers. Journal of Membrane Science, 274, 123-137.
Martinez, L. & Rodriguez-Maroto, J. M. (2007) On transport resistances in direct contact membrane distillation. Journal of Membrane Science, 295, 28-39.
Mello, B., Petrus, J. C. C. & Hubinger, M. D. (2010) Performance of nanofiltration concentration process in propolis extracts. Ciencia E Tecnologia De Alimentos, 30, 166-172.
Mengual, J. I., Dezarate, J. M. O., Pena, L. & Velazquez, A. (1993) Osmotic Distillation through Porous Hydrophobic Membranes. Journal of Membrane Science, 82, 129-140.
Mericq, J. P., Laborie, S. & Cabassud, C. (2009) Vacuum membrane distillation for an integrated seawater desalination process. Desalination and Water Treatment, 9, 287-296.
Meyer, A. S., Bagger-Jorgensen, R., Pinelo, M., Varming, C. & Jonsson, G. (2011) Recovery of volatile fruit juice aroma compounds by membrane technology: Sweeping gas versus vacuum membrane distillation. Innovative Food Science & Emerging Technologies, 12, 388-397.
Moon, I. S., Hwang, H. J., He, K., Gray, S. & Zhang, J. H. (2011) Direct contact membrane distillation (DCMD): Experimental study on the commercial PTFE membrane and modeling. Journal of Membrane Science, 371, 90-98.
Morao, A. I. C., Alves, A. M. B. & Geraldes, V. (2008) Concentration polarization in a reverse osmosis/nanofiltration plate-and-frame membrane module. Journal of Membrane Science, 325, 580-591.
Nagaraj, N., Patil, B. S. & Biradar, P. M. (2006a) Osmotic Membrane Distillation - A Brief Review. International Journal of Food Engineering, 2.
Nagaraj, N., Patil, G., Babu, B. R., Hebbar, U. H., Raghavarao, K. S. M. S. & Nene, S. (2006b) Mass transfer in osmotic membrane distillation. Journal of Membrane Science, 268, 48-56.
Narayan, A. V., Nagaraj, N., Hebbar, H. U., Chakkaravarthi, A., Raghavarao, K. S. M. S. & Nene, S. (2002) Acoustic field-assisted osmotic membrane distillation. Desalination, 147, 149-156.
Nayak, C. A. & Rastogi, N. K. (2010) Comparison of osmotic membrane distillation and forward osmosis membrane processes for concentration of anthocyanin. Desalination and Water Treatment, 16, 134-145.
Nene, S., Kaur, S., Sumod, K., Joshi, B. & Raghavarao, K. S. M. S. (2004) Membrane distillation for the concentration of raw cane-sugar syrup and membrane clarified sugarcane juice (vol 147, pg 157, 2002). Desalination, 161, 305-305.
Oliver, M. R. 2004. Chemical-mechanical planarization of semiconductor materials Springer.
Distillation – Advances from Modeling to Applications
264
Onsekizoglu, P., Bahceci, K. S. & Acar, J. (2010a) The use of factorial design for modeling membrane distillation. Journal of Membrane Science, 349, 225-230.
Onsekizoglu, P., Bahceci, K. S. & Acar, M. J. (2010b) Clarification and the concentration of apple juice using membrane processes: A comparative quality assessment. Journal of Membrane Science, 352, 160-165.
Onsekizoglu, P. (2011) A novel integrated membrane process for pomegranate juice concentration, Proceedings of Novel Approaches in Food Industry, Cesme, Izmir, Turkey, May 2011
Pabby, A. K., Rizvi, S. S. H. & Sastre, A. M. (Eds.). (2009). Handbook of Membrane Seperations, CRC Press, New York.
Peinemann, K.-V., Nunes, S. P. & Giorno, L. (Eds.). (2010). Membrane Technology: Volume 3: Membranes for Food Applications, Wiley-VCH Verlag GmbH & Co. KGaA, Germany.
Phattaranawik, J., Fane, A. G., Pasquier, A. C. S., Bing, W. & Wong, F. S. (2009) Experimental Study and Design of a Submerged Membrane Distillation Bioreactor. Chemical Engineering & Technology, 32, 38-44.
Phattaranawik, J. & Jiraratananon, R. (2001) Direct contact membrane distillation: effect of mass transfer on heat transfer. Journal of Membrane Science, 188, 137-143.
Phattaranawik, J., Jiraratananon, R. & Fane, A. G. (2003a) Effect of pore size distribution and air flux on mass transport in direct contact membrane distillation. Journal of Membrane Science, 215, 75-85.
Phattaranawik, J., Jiraratananon, R. & Fane, A. G. (2003b) Heat transport and membrane distillation coefficients in direct contact membrane distillation. Journal of Membrane Science, 212, 177-193.
Phattaranawik, J., Jiraratananon, R., Fane, A. G. & Halim, C. (2001) Mass flux enhancement using spacer filled channels in direct contact membrane distillation. Journal of Membrane Science, 187, 193-201.
Qtaishat, M., Khayet, M. & Matsuura, T. (2009) Guidelines for preparation of higher flux hydrophobic/hydrophilic composite membranes for membrane distillation. Journal of Membrane Science, 329, 193-200.
Qtaishat, M., Matsuura, T., Kruczek, B. & Khayet, A. (2008) Heat and mass transfer analysis in direct contact membrane distillation. Desalination, 219, 272-292.
Quoc, A. L., Mondor, M., Lamarche, F. & Makhlouf, J. (2011) Optimization of electrodialysis with bipolar membranes applied to cloudy apple juice: Minimization of malic acid and sugar losses. Innovative Food Science & Emerging Technologies, 12, 45-49.
Rektor, A., Kozak, A., Vatai, G. & Bekassy-Molnar, E. (2007) Pilot plant RO-filtration of grape juice. Separation and Purification Technology, 57, 473-475.
Rincon, C., de Zarate, J. M. O. & Mengual, J. I. (1999) Separation of water and glycols by direct contact membrane distillation. Journal of Membrane Science, 158, 155-165.
Rodrigues, R. B., Menezes, H. C., Cabral, L. M. C., Dornier, M., Rios, G. M. & Reynes, M. (2004) Evaluation of reverse osmosis and osmotic evaporation to concentrate camu-camu juice (Myrciaria dubia). Journal of Food Engineering, 63, 97-102.
Santana, I., Gurak, P. D., da Matta, V. M., Freitas, S. P. & Cabral, L. M. C. (2011) Concentration of grape juice (Vitis labrusca) by reverse osmosis process. Desalination and Water Treatment, 27, 103-107.
Schofield, R. W., Fane, A. G. & Fell, C. J. D. (1990a) Gas and Vapor Transport through Microporous Membranes .2. Membrane Distillation. Journal of Membrane Science, 53, 173-185.
Membrane Distillation: Principle, Advances, Limitations and Future Prospects in Food Industry
265
Schofield, R. W., Fane, A. G., Fell, C. J. D. & Macoun, R. (1990b) Factors Affecting Flux in Membrane Distillation. Desalination, 77, 279-294.
Shaw, P. E., Lebrun, M., Ducamp, M. N., Jordan, M. J. & Goodner, K. L. (2002) Pineapple juice concentrated by osmotic evaporation. Journal of Food Quality, 25, 39-49.
Shin, C. H. & Johnson, R. (2007) Identification of an appropriate osmotic agent for use in osmotic distillation. Journal of Industrial and Engineering Chemistry, 13, 926-931.
Sigurdsson, S. & Shishoo, R. (1997) Surface properties of polymers treated with tetrafluoromethane plasma. Journal of Applied Polymer Science, 66, 1591-1601.
Simsek, A., Poyrazoglu, E. S., Karacan, S. & Velioglu, Y. S. (2007) Response surface methodological study on HMF and fluorescent accumulation in red and white grape juices and concentrates. Food Chemistry, 101, 987-994.
Song, L. F. (2010) Concentration Polarization in a Narrow Reverse Osmosis Membrane Channel. Aiche Journal, 56, 143-149.
Song, L. M., Ma, Z. D., Liao, X. H., Kosaraju, P. B., Irish, J. R. & Sirkar, K. K. (2008) Pilot plant studies of novel membranes and devices for direct contact membrane distillation-based desalination. Journal of Membrane Science, 323, 257-270.
Srisurichan, S., Jiraratananon, R. & Fane, A. G. (2006) Mass transfer mechanisms and transport resistances in direct contact membrane distillation process. Journal of Membrane Science, 277, 186-194.
Susanto, H. (2011) Towards practical implementations of membrane distillation. Chemical Engineering and Processing, 50, 139-150.
Teoh, M. M., Bonyadi, S. & Chung, T. S. (2008) Investigation of different hollow fiber module designs for flux enhancement in the membrane distillation process. Journal of Membrane Science, 311, 371-379.
Tomaszewska, M. (2000) Membrane distillation - Examples of applications in technology and environmental protection. Polish Journal of Environmental Studies, 9, 27-36.
Tomaszewska, M. & Bialonczyk, L. (2011) The investigation of ethanol separation by the membrane distillation process. Polish Journal of Chemical Technology, 13, 66-69.
Toribio, J. L. & Lozano, J. E. (1986) Heat-induced browning of clarified apple juice at high temperatures. Journal of Food Science, 51, 172-&.
Vaillant, F., Jeanton, E., Dornier, M., O'Brien, G. M., Reynes, M. & Decloux, M. (2001) Concentration of passion fruit juice on an industrial pilot scale using osmotic evaporation. Journal of Food Engineering, 47, 195-202.
Valdes, H., Romero, J., Saavedra, A., Plaza, A. & Bubnovich, V. (2009) Concentration of noni juice by means of osmotic distillation. Journal of Membrane Science, 330, 205-213.
Varavuth, S., Jiraratananon, R. & Atchariyawut, S. (2009) Experimental study on dealcoholization of wine by osmotic distillation process. Separation and Purification Technology, 66, 313-321.
Vargas-Garcia, A., Torrestiana-Sanchez, B., Garcia-Borquez, A. & Aguilar-Uscanga, G. (2011) Effect of grafting on microstructure, composition and surface and transport properties of ceramic membranes for osmotic evaporation. Separation and Purification Technology, 80, 473-481.
Varming, C., Andersen, M. L. & Poll, L. (2004) Influence of thermal treatment on black currant (Ribes nigrum L.) juice aroma. Journal of Agricultural and Food Chemistry, 52, 7628-7636.
Walton, J., Lu, H., Turner, C., Solis, S. & Hein, H. 2004. Solar and waste heat desalination by membrane distillation. El Paso: College of Engineering University of Texas.
Distillation – Advances from Modeling to Applications
266
Wang, C. C. (2011) On the heat transfer correlation for membrane distillation. Energy Conversion and Management, 52, 1968-1973.
Wang, F. L. & Tarabara, V. V. (2007) Coupled effects of colloidal deposition and salt concentration polarization on reverse osmosis membrane performance. Journal of Membrane Science, 293, 111-123.
Wang, K. Y., Foo, S. W. & Chung, T. S. (2009) Mixed Matrix PVDF Hollow Fiber Membranes with Nanoscale Pores for Desalination through Direct Contact Membrane Distillation. Industrial & Engineering Chemistry Research, 48, 4474-4483.
Wang, K. Y., Teoh, M. M., Nugroho, A. & Chung, T. S. (2011) Integrated forward osmosis-membrane distillation (FO-MD) hybrid system for the concentration of protein solutions. Chemical Engineering Science, 66, 2421-2430.
Warczok, J., Gierszewska, M., Kujawski, W. & Gueell, C. (2007) Application of osmotic membrane distillation for reconcentration of sugar solutions from osmotic dehydration. Separation and Purification Technology, 57, 425-429.
Winter, D., Koschikowski, J. & Wieghaus, M. (2011) Desalination using membrane distillation: Experimental studies on full scale spiral wound modules. Journal of Membrane Science, 375, 104-112.
Wu, Y. L., Kong, Y., Lin, X., Liu, W. H. & Xu, J. P. (1992) Surface-Modified Hydrophilic Membranes in Membrane Distillation. Journal of Membrane Science, 72, 189-196.
Xu, J. B., Lange, S., Bartley, J. P. & Johnson, R. A. (2004) Alginate-coated microporous PTFE membranes for use in the osmotic distillation of oily feeds. Journal of Membrane Science, 240, 81-89.
Xu, Y., Zhu, B. K. & Xu, Y. Y. (2006) Pilot test of vacuum membrane distillation for seawater desalination on a ship. Desalination, 189, 165-169.
Yang, X., Wang, R. & Fane, A. G. (2011a) Novel designs for improving the performance of hollow fiber membrane distillation modules. Journal of Membrane Science, 384, 52-62.
Yang, X., Wang, R., Shi, L., Fane, A. G. & Debowski, M. (2011b) Performance improvement of PVDF hollow fiber-based membrane distillation process. Journal of Membrane Science, 369, 437-447.
Yarlagadda, S., Gude, V. G., Camacho, L. M., Pinappu, S. & Deng, S. G. (2011) Potable water recovery from As, U, and F contaminated ground waters by direct contact membrane distillation process. Journal of Hazardous Materials, 192, 1388-1394.
Yasuda, T., Okuno, T. & Yasuda, H. (1994) CONTACT-ANGLE OF WATER ON POLYMER SURFACES. Langmuir, 10, 2435-2439.
Zaamouche, R., Beicha, A. & Sulaiman, N. M. (2009) Cross-Flow Ultrafiltration Model Based on Concentration Polarization. Journal of Chemical Engineering of Japan, 42, 107-110.
Zhang, J. H., Dow, N., Duke, M., Ostarcevic, E., Li, J. D. & Gray, S. (2010) Identification of material and physical features of membrane distillation membranes for high performance desalination. Journal of Membrane Science, 349, 295-303.
Zhao, Z. P., Zhu, C. Y., Liu, D. Z. & Liu, W. F. (2011) Concentration of ginseng extracts aqueous solution by vacuum membrane distillation 2. Theory analysis of critical operating conditions and experimental confirmation. Desalination, 267, 147-153.
Zhigang, L., Biaohua, C. & Zhongwei, D. 2005. Special distillation processes. The Netherlands: Elsevier.
Zolotarev, P. P., Ugrozov, V. V., Volkina, I. B. & Nikulin, V. N. (1994) Treatment of Waste-Water for Removing Heavy-Metals by Membrane Distillation. Journal of Hazardous Materials, 37, 77-82.
12
The Separation of Tritium Radionuclide from Environmental Samples by Distillation Technique
Poppy Intan Tjahaja and Putu Sukmabuana Nuclear Technology Center for Materials and Radiometry,
National Nuclear Energy Agency of Indonesia, Bandung Indonesia
1. Introduction Tritium is an isotope of hydrogen which emit beta particles in energy range of 5 – 18,6 keV, and has relatively long half life of 12.3 years. In the environment, tiritum is originated both from the nature and human activities. Naturally, tritium is produced in the atmosphere by interaction of cosmic rays with the nuclei of atoms present in the air, and estimated to contribute the annual effective dose equivalent about 0.01 μSv (United Nation, 1988). The other natural sources of tritium are nuclear reactions in earth’s crust and environmental materials.
The sources of tritium in the environment relating to human activities, includes atmospheric nuclear testing, continuous tritium release from nuclear reactor under normal operation or accident, and incidental release from consumer products such as paint, watch materials, and other fluoresence goods (Glastone & Jordan, 1980; Puhankainen & Heikkinen, 2007). The food, drink and the use of such products can cause tritium contamination to the human body (Konig, 1990) and contribute the internal radiation doses to the tissues since tritium is distributed to the whole body (Trivedi et al., 2000).
As tritium in the environment possibly contaminates human, the measurement of tritium content in environmental materials as well as in human body samples is needed to be conducted to evaluate the tritium β radiation doses probably received by the body. Unfortunately, β radiation from tritium is not so simple to be determined without sample preparation for separating tritium from the sample bulk. Since tritium is a hydrogen isotope, it is possible to take tritium out from the samples as tritiated water molecule lead to an easy measurement using liquid scintillation counting (LSC) method.
Distillation technique has been choosen as a simplest technique to be used in tritium separation from the environmental samples. Some distillation techniques have been developed to take the tritium out from various environmental material including air, water, soil, plants, and biological materials such as human urine.
This chapter describes the developed distillation technique applied in environmental tritium analysis. The performance of the developed distillation techniques in tritium separation from the environmental samples are discussed based on the experimental test.
Distillation – Advances from Modeling to Applications
268
1.1 Environmental tritium
The majority of tritium in the environment, both naturally and anthropogenic, is present in the form of water molecule (named HTO), while the others are gas (named HT and CH3T) and organic molecules. As an isotope of hydrogen, tritium can easily enter various environmental materials containing hydrogen. In the environmental component tritium is bonded to water molecule, called free-water tritium (FWT) and also to the organic compound as organically bound tritium (OBT).
Tritium in the environmental material is possible to contaminate human body through the food chain. The drinking water, food, inhaled air, and skin absorption are the main sources of tritium for human body contamination. Tritium is uniformly distributed in the body liquid 2 until 4 hours after its inhalation, ingestion or absorption through the skin (Taylor, 2003). At the same time, some percents of tritium atoms reversibly replaced H in OH, NH and SH bonds of organic molecules in the body, while about 1% of the activity is incorporated into stable CH bonds. The physical and chemical properties of tritium are almost the same as that of hydrogen.
The biological half times of tritiated water (HTO) are 10 days (97%) and 40 days (3%), whereas for OBT are 10 days (50%) and 40 days (50%) (ICRP, 1997 & Taylor, 2003). A major part (>90%) of an OBT intake is oxidized and excreted as HTO, this tritium is called the exchangeable tritium fraction. The nonexchangeably bound tritium fraction is normally released only as a result of enzymatic breakdown of the molecules containing this carbon-tritium bound. The HTO is excreted in urine, feces, sweat, and breath in which about a half is excreted via urine.
The tritium toxicity in the human body is contributed by β particle emitted by tritium bonded in biochemical structure of the cells that leads to genetic mutation and oncogenic effect of the long live cells. Such as it was described previously, the existence of tritium in the environment possibly lead to the internally radiation effect to human body. Therefore, the existence of tritium in the environment should be monitored. The environmental tritium monitoring generally is carried out by taking environmental materials samples, such as air, water, soil, and plants for measurement using liquid scintillation technique.
1.2 Tritium analysis of environmental samples
1.2.1 Sample preparation
The tritium concentration in the water fraction as well as in the organic fraction of the sample is measured in the form of water molecule. Hence the sample preparation is needed in order to isolate the tritium from the samples bulk and convert to liquid form to be possible for LSC measurement. Distillation is one suitable technique to be applied in that purpose.
The sample is heated and the vapor is condensed to obtain the liquid form of free water tritium. In the case of OBT the sample needs to be combusted and the vapor released is condensed at low temperature (Tjahaja et al., 2004). Some modifications in distillation technique have been developed to facilitate the tritium samples preparation such as described in the following sections.
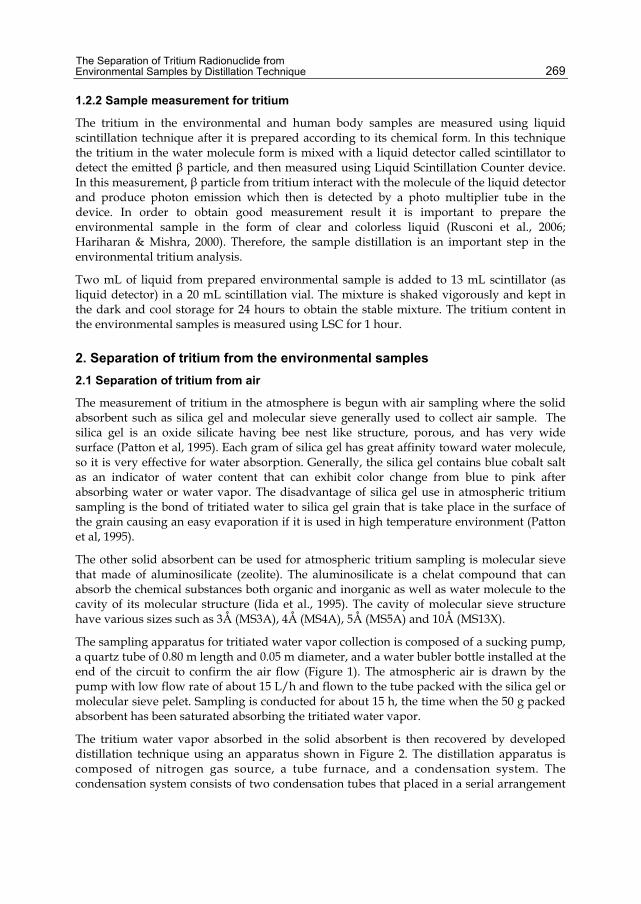
The Separation of Tritium Radionuclide from Environmental Samples by Distillation Technique
269
1.2.2 Sample measurement for tritium
The tritium in the environmental and human body samples are measured using liquid scintillation technique after it is prepared according to its chemical form. In this technique the tritium in the water molecule form is mixed with a liquid detector called scintillator to detect the emitted β particle, and then measured using Liquid Scintillation Counter device. In this measurement, β particle from tritium interact with the molecule of the liquid detector and produce photon emission which then is detected by a photo multiplier tube in the device. In order to obtain good measurement result it is important to prepare the environmental sample in the form of clear and colorless liquid (Rusconi et al., 2006; Hariharan & Mishra, 2000). Therefore, the sample distillation is an important step in the environmental tritium analysis.
Two mL of liquid from prepared environmental sample is added to 13 mL scintillator (as liquid detector) in a 20 mL scintillation vial. The mixture is shaked vigorously and kept in the dark and cool storage for 24 hours to obtain the stable mixture. The tritium content in the environmental samples is measured using LSC for 1 hour.
2. Separation of tritium from the environmental samples 2.1 Separation of tritium from air
The measurement of tritium in the atmosphere is begun with air sampling where the solid absorbent such as silica gel and molecular sieve generally used to collect air sample. The silica gel is an oxide silicate having bee nest like structure, porous, and has very wide surface (Patton et al, 1995). Each gram of silica gel has great affinity toward water molecule, so it is very effective for water absorption. Generally, the silica gel contains blue cobalt salt as an indicator of water content that can exhibit color change from blue to pink after absorbing water or water vapor. The disadvantage of silica gel use in atmospheric tritium sampling is the bond of tritiated water to silica gel grain that is take place in the surface of the grain causing an easy evaporation if it is used in high temperature environment (Patton et al, 1995).
The other solid absorbent can be used for atmospheric tritium sampling is molecular sieve that made of aluminosilicate (zeolite). The aluminosilicate is a chelat compound that can absorb the chemical substances both organic and inorganic as well as water molecule to the cavity of its molecular structure (Iida et al., 1995). The cavity of molecular sieve structure have various sizes such as 3Å (MS3A), 4Å (MS4A), 5Å (MS5A) and 10Å (MS13X).
The sampling apparatus for tritiated water vapor collection is composed of a sucking pump, a quartz tube of 0.80 m length and 0.05 m diameter, and a water bubler bottle installed at the end of the circuit to confirm the air flow (Figure 1). The atmospheric air is drawn by the pump with low flow rate of about 15 L/h and flown to the tube packed with the silica gel or molecular sieve pelet. Sampling is conducted for about 15 h, the time when the 50 g packed absorbent has been saturated absorbing the tritiated water vapor.
The tritium water vapor absorbed in the solid absorbent is then recovered by developed distillation technique using an apparatus shown in Figure 2. The distillation apparatus is composed of nitrogen gas source, a tube furnace, and a condensation system. The condensation system consists of two condensation tubes that placed in a serial arrangement
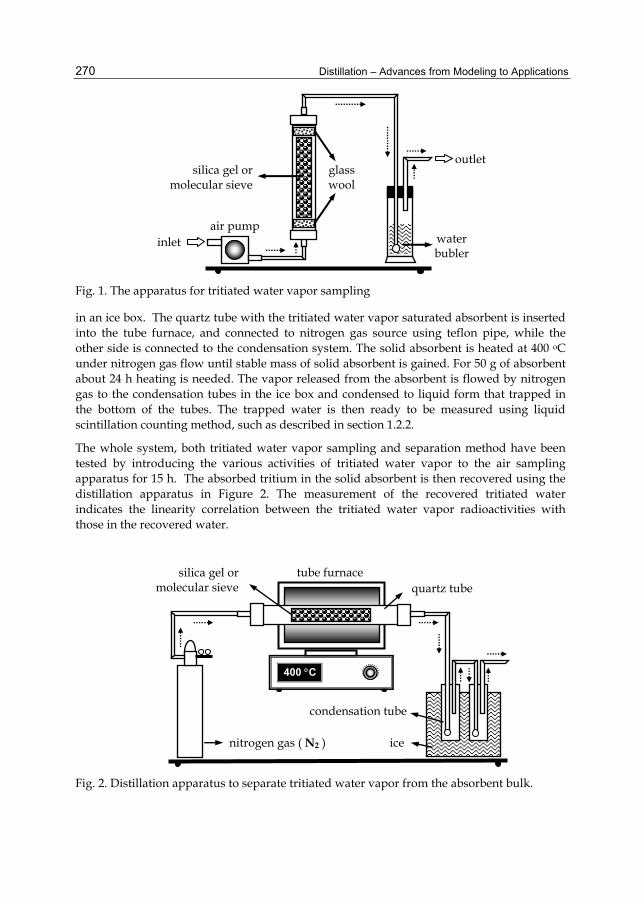
Distillation – Advances from Modeling to Applications
270
Fig. 1. The apparatus for tritiated water vapor sampling
in an ice box. The quartz tube with the tritiated water vapor saturated absorbent is inserted into the tube furnace, and connected to nitrogen gas source using teflon pipe, while the other side is connected to the condensation system. The solid absorbent is heated at 400 oC under nitrogen gas flow until stable mass of solid absorbent is gained. For 50 g of absorbent about 24 h heating is needed. The vapor released from the absorbent is flowed by nitrogen gas to the condensation tubes in the ice box and condensed to liquid form that trapped in the bottom of the tubes. The trapped water is then ready to be measured using liquid scintillation counting method, such as described in section 1.2.2.
The whole system, both tritiated water vapor sampling and separation method have been tested by introducing the various activities of tritiated water vapor to the air sampling apparatus for 15 h. The absorbed tritium in the solid absorbent is then recovered using the distillation apparatus in Figure 2. The measurement of the recovered tritiated water indicates the linearity correlation between the tritiated water vapor radioactivities with those in the recovered water.
Fig. 2. Distillation apparatus to separate tritiated water vapor from the absorbent bulk.
nitrogen gas ( N2 )
condensation tube
quartz tube
ice
silica gel or molecular sieve
400 C
tube furnace
water bubler
glass wool
air pump
silica gel or molecular sieve
inlet
outlet

The Separation of Tritium Radionuclide from Environmental Samples by Distillation Technique
271
Figure 3 and 4 show the linear relationship between the tritiated water radioactivity in the air with those recovered from the absorbent with the correlation coefficient of 0.985 and approximately 1 for silica gel and molecular sieve, respectively. The capacity of silica gel and molecular sieve in tritiated water vapor absorption has been tested gravimetrically, and the capacity of 48.6% and 43.6% were obtained for silica gel and molecular sieve, respectively.
Fig. 3. The linear relationship between the tritiated water activity in the air with those recovered from silica gel
Fig. 4. The linear relationship between the tritiated water activity in the air with those recovered from molecular sieve.
2.2 Separation of tritium from water
As stated in previous section, the tritium measurement using LSC method needs clear and colurless liquid, hence the environmental water sample with low organic matter can

Distillation – Advances from Modeling to Applications
272
directly prepared using simple water distillation. The distillation should be conducted in relatively low temperature of about 70 oC and the water have to be completely distilled to near dryness. The complete distillation is neccessary as tritium which has relatively higher atomic mass compared to its isotopes (hydrogen and deuterium) will be distributed in the bottom of the distillation flask and evaporated later. For the environmental water samples with high organic matter content, the distillation should be done with the addition of KMnO4 and activated carbon to decompose and absorb the organic impurities. The organic matter content in the water samples can be determined visually or using UV vis spectrophotometery method. The complete distillation is carried out at 70oC temperature.
The apparatus for environmental water sample distillation is shown in Figure 5. The apparatus is composed of round bottom flask for water samples, a glass water circulation condensor, a glass vessel with a valve in its end opening for collecting distillate, an adapter between the sample flask and the condensor that equipped with a thermometer. In the top end of the condensor vessel a glass vessel filled with silica gel absorbent is installed to avoid the laboratory atmospheric water vapour contaminates the distillate obtained. The sample heating is conducted using a mantle heater.
In order to obtain the clear and colourless ditillate, the distillation can be done once, but if the water samples contain high organic matter the distillation is conducted more than once until the clear and colurless distillate is gained.
Fig. 5. The distillation apparatus for environmental water samples preparation
mantle heater
silica gel
distillate
water coolant inlet
water coolant outlet
thermometer
sample

The Separation of Tritium Radionuclide from Environmental Samples by Distillation Technique
273
2.3 Separation of tritium from soil
Tritium in the soil is present as both free water tritium (FWT) and organically bound tritium (OBT). The soil tritium is separated from the soil bulk using modified distillation technique to obtain tritium samples as water to be possible for LSC measurement.
2.3.1 Free water tritium
The FWT sample from the soil represents tritium in the water molecule in soil particle surface and interstitial particles (Tjahaja et al., 1995). The FWT from soil sample is collected using distillation technique by heating the soil sample at 150 oC in a quartz tube and condensing the vapor released from the samples at low temperature of about 10 oC. The sample heating is conducted in a tube furnace. The distillation apparatus for soil FWT collection consists of oxygen and nitrogen gas flow system, tube furnace, and condensation system as shown in Figure 6. The condensation system consists of two condensation tubes in serial arrangement inside an ice box. A quartz tube packed with 250 g of soil samples is inserted into the furnace and connected to the gas source system in one side and to the condensation tube in another side. The soil sample is heated at 150 oC under the slow nitrogen gas flow and the vapor from the heated soil is transferred to the condensation tube to be condensed in liquid form. The distillation process of 250 g soil sample take about 30 h, nevertheless it depends on the soil water content. The FWT obtained from this process possibly contains organic material that is visually seen as unclear and yellow color liquid. In this condition, FWT distillation is necessary to remove the impurities of the FWT so clear and colorless water can be obtained.
Fig. 6. The apparatus for soil samples preparation
2.3.2 Organically bound tritium
The dried soil sample as the residue of the FWT distillation process is combusted in the same quartz tube by increasing the temperature of the furnace to 450 oC and applying the oxygen gas to the tube to obtain OBT as liquid form. The combustion results (H2O and CO2) is flowed to the condensation tubes where the H2O gas will be condensed as liquid while the
oxygen gas ( O2 )
condensation tube
quartz tube
nitrogen gas ( N2 ) ice
sample
450 C
tube furnace
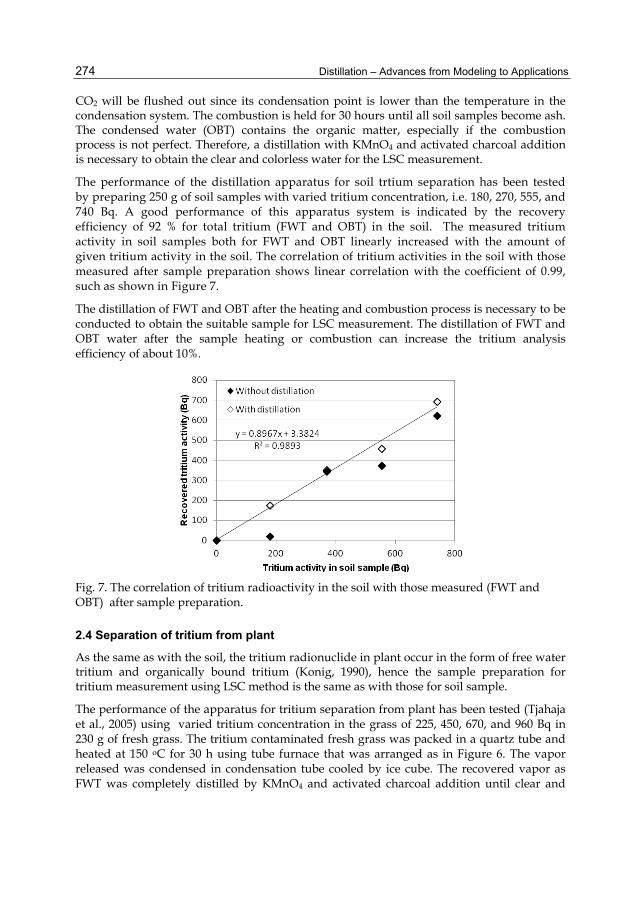
Distillation – Advances from Modeling to Applications
274
CO2 will be flushed out since its condensation point is lower than the temperature in the condensation system. The combustion is held for 30 hours until all soil samples become ash. The condensed water (OBT) contains the organic matter, especially if the combustion process is not perfect. Therefore, a distillation with KMnO4 and activated charcoal addition is necessary to obtain the clear and colorless water for the LSC measurement.
The performance of the distillation apparatus for soil trtium separation has been tested by preparing 250 g of soil samples with varied tritium concentration, i.e. 180, 270, 555, and 740 Bq. A good performance of this apparatus system is indicated by the recovery efficiency of 92 % for total tritium (FWT and OBT) in the soil. The measured tritium activity in soil samples both for FWT and OBT linearly increased with the amount of given tritium activity in the soil. The correlation of tritium activities in the soil with those measured after sample preparation shows linear correlation with the coefficient of 0.99, such as shown in Figure 7.
The distillation of FWT and OBT after the heating and combustion process is necessary to be conducted to obtain the suitable sample for LSC measurement. The distillation of FWT and OBT water after the sample heating or combustion can increase the tritium analysis efficiency of about 10%.
Fig. 7. The correlation of tritium radioactivity in the soil with those measured (FWT and OBT) after sample preparation.
2.4 Separation of tritium from plant
As the same as with the soil, the tritium radionuclide in plant occur in the form of free water tritium and organically bound tritium (Konig, 1990), hence the sample preparation for tritium measurement using LSC method is the same as with those for soil sample.
The performance of the apparatus for tritium separation from plant has been tested (Tjahaja et al., 2005) using varied tritium concentration in the grass of 225, 450, 670, and 960 Bq in 230 g of fresh grass. The tritium contaminated fresh grass was packed in a quartz tube and heated at 150 oC for 30 h using tube furnace that was arranged as in Figure 6. The vapor released was condensed in condensation tube cooled by ice cube. The recovered vapor as FWT was completely distilled by KMnO4 and activated charcoal addition until clear and

The Separation of Tritium Radionuclide from Environmental Samples by Distillation Technique
275
colorless distillate was obtained and could be measured using LSC technique. The dried grass sample in the quartz tube was then combusted at 450 oC under oxygen gas flow using tube furnace in the same apparatus. The gas released (H2O and CO2) from the combusted grass samples was flowed to the combustion tube and condensed at ice temperature. The condensed water representing the OBT of the grass as the same as the FWT was completely distilled and measured using LSC method.
The increase of tritium activity in the grass sample is followed with the increase of the recovered FWT and OBT. The correlation of tritium radioactivity in the grass with those measured after sample preparation shows linear correlation with the coefficient of 0.98, such as shown in Figure 8. A good performance of this apparatus system is indicated with the recovery efficiency of 80% for total tritium in the grass (FWT and OBT). The performance of the separation method for plant samples relatively low compared with those for soil samples relating to the complexity of organic compound in the grass leading to the incomplete combustion process in OBT recovery.
Fig. 8. The correlation of tritium radioactivity in the grass with those measured (FWT and OBT) after sample preparation.
2.5 Separation of tritium from human urine
The presence of tritium in the air, drinking water, foods, and other consumer products is the source of human contamination with tritium (Puhakainen et al., 2007 and Trivedi et al, 2000). The detection of tritium contamination in the human body can be carried out using urine samples measurement. Nevertheless, tritium measurement in urine has a limitation relating to the body metabolite content in the urine that signicantly affect the LSC measurement (Trivedi et al., 2000; Rusconi et al, 2006). The measurement of such urine possibly to increase counting rate of tritium in the LSC measurement because of chemical luminesence from samples impurities and from β radiation emmitted by 14C bounded in organic matter of body metabolite (Rusconi et al., 2006; Groning, 2004). Such a counting result cause over estimation of tritium concentration in the urine especially in low level tritium measurement (Groning, 2004; Momoshima et al., 1986). Therefore, urine sample
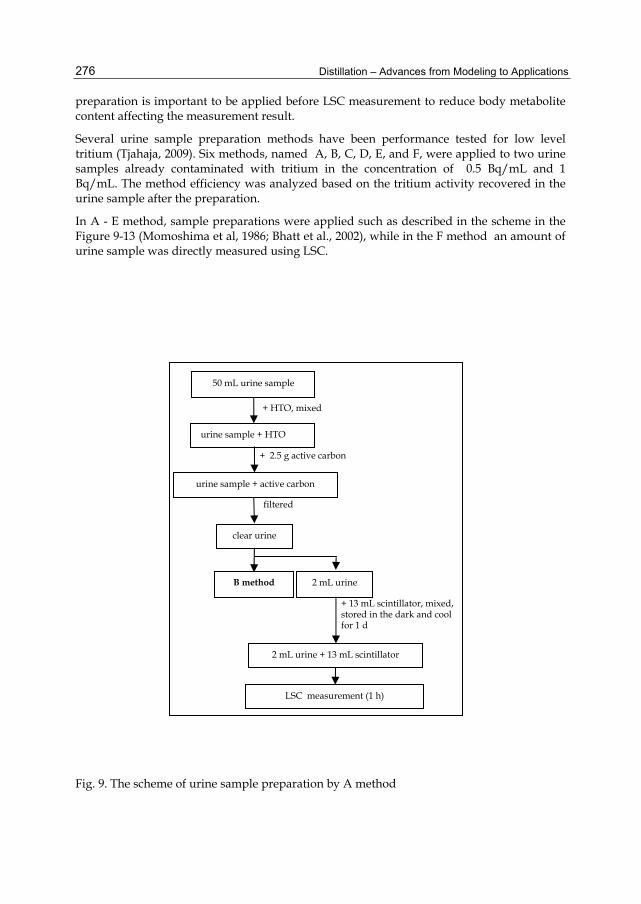
Distillation – Advances from Modeling to Applications
276
preparation is important to be applied before LSC measurement to reduce body metabolite content affecting the measurement result.
Several urine sample preparation methods have been performance tested for low level tritium (Tjahaja, 2009). Six methods, named A, B, C, D, E, and F, were applied to two urine samples already contaminated with tritium in the concentration of 0.5 Bq/mL and 1 Bq/mL. The method efficiency was analyzed based on the tritium activity recovered in the urine sample after the preparation.
In A - E method, sample preparations were applied such as described in the scheme in the Figure 9-13 (Momoshima et al, 1986; Bhatt et al., 2002), while in the F method an amount of urine sample was directly measured using LSC.
Fig. 9. The scheme of urine sample preparation by A method
+ 13 mL scintillator, mixed, stored in the dark and cool for 1 d
urine sample + HTO
clear urine
2 mL urine
+ 2.5 g active carbon
filtered
50 mL urine sample
+ HTO, mixed
B method
2 mL urine + 13 mL scintillator
LSC measurement (1 h)
urine sample + active carbon

The Separation of Tritium Radionuclide from Environmental Samples by Distillation Technique
277
Fig. 10. The scheme of urine sample preparation by B method
Fig. 11. The scheme of urine sample preparation by C method
Clear urine (from A method)
Urine distillate
+ 2.5 g active carbon Complete distillation at 70 oC
C method D method 2 mL urine
+ 13 mL scintillator, mixed, stored in the
dark and cool for 1 d
2 mL urine + 13 mL scintillator
LSC measurement (1 h)
Urine distillate (from B method)
+ 3 g KMnO4 +0.25 mL H2SO4 Complete distillation at 70 oC
Urine distillate
2 mL urine distillate
2 mL urine + 13 mL scintillator
+ 13 mL scintillator, mixed, stored in the dark and cool for 1 d
LSC measurement (1 h)
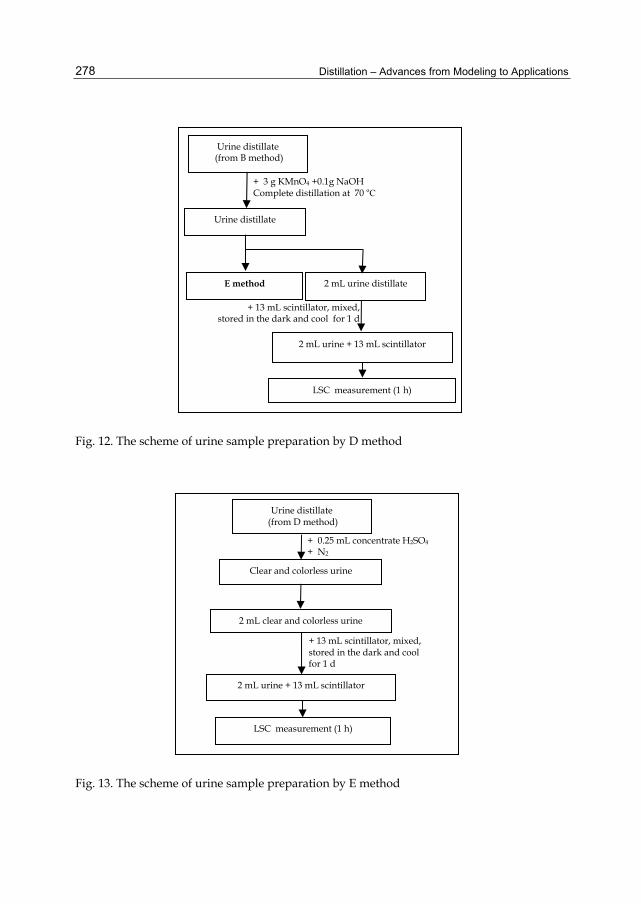
Distillation – Advances from Modeling to Applications
278
Fig. 12. The scheme of urine sample preparation by D method
Fig. 13. The scheme of urine sample preparation by E method
LSC measurement (1 h)
+ 3 g KMnO4 +0.1g NaOH Complete distillation at 70 oC
Urine distillate (from B method)
E method
Urine distillate
2 mL urine distillate
2 mL urine + 13 mL scintillator
+ 13 mL scintillator, mixed, stored in the dark and cool for 1 d
Clear and colorless urine
Urine distillate (from D method)
+ 0.25 mL concentrate H2SO4 + N2
2 mL clear and colorless urine
2 mL urine + 13 mL scintillator
+ 13 mL scintillator, mixed, stored in the dark and cool for 1 d
LSC measurement (1 h)
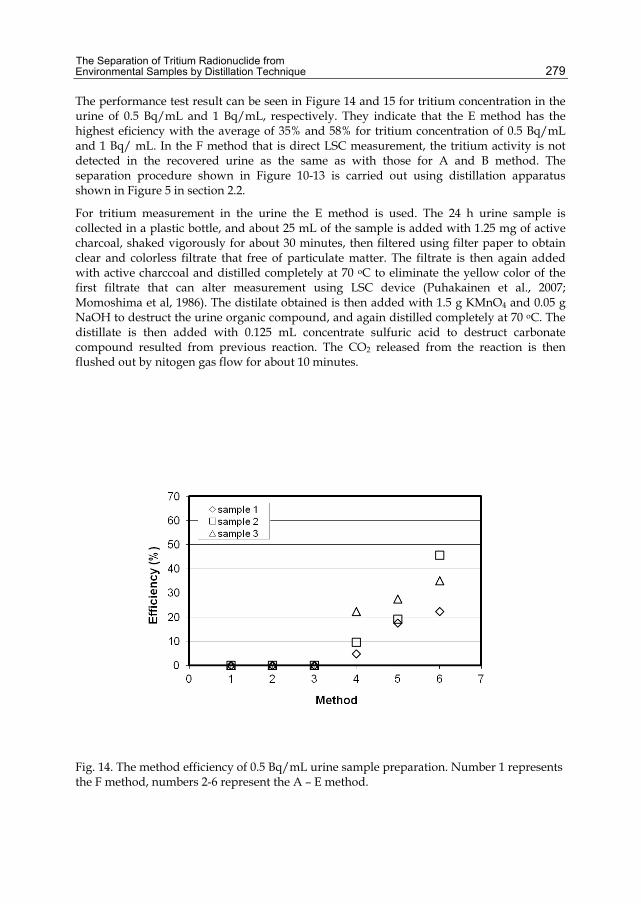
The Separation of Tritium Radionuclide from Environmental Samples by Distillation Technique
279
The performance test result can be seen in Figure 14 and 15 for tritium concentration in the urine of 0.5 Bq/mL and 1 Bq/mL, respectively. They indicate that the E method has the highest eficiency with the average of 35% and 58% for tritium concentration of 0.5 Bq/mL and 1 Bq/ mL. In the F method that is direct LSC measurement, the tritium activity is not detected in the recovered urine as the same as with those for A and B method. The separation procedure shown in Figure 10-13 is carried out using distillation apparatus shown in Figure 5 in section 2.2.
For tritium measurement in the urine the E method is used. The 24 h urine sample is collected in a plastic bottle, and about 25 mL of the sample is added with 1.25 mg of active charcoal, shaked vigorously for about 30 minutes, then filtered using filter paper to obtain clear and colorless filtrate that free of particulate matter. The filtrate is then again added with active charccoal and distilled completely at 70 oC to eliminate the yellow color of the first filtrate that can alter measurement using LSC device (Puhakainen et al., 2007; Momoshima et al, 1986). The distilate obtained is then added with 1.5 g KMnO4 and 0.05 g NaOH to destruct the urine organic compound, and again distilled completely at 70 oC. The distillate is then added with 0.125 mL concentrate sulfuric acid to destruct carbonate compound resulted from previous reaction. The CO2 released from the reaction is then flushed out by nitogen gas flow for about 10 minutes.
Fig. 14. The method efficiency of 0.5 Bq/mL urine sample preparation. Number 1 represents the F method, numbers 2-6 represent the A – E method.
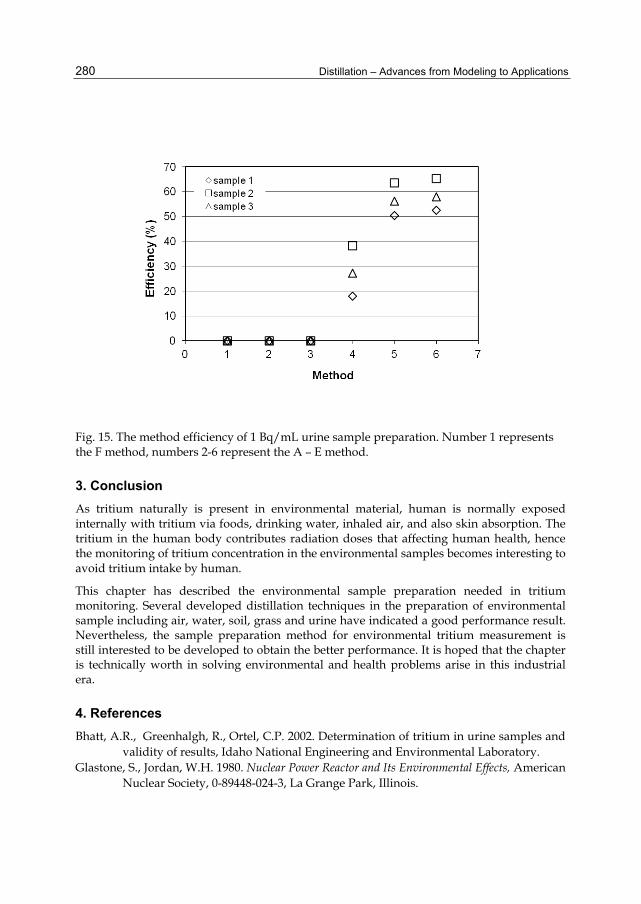
Distillation – Advances from Modeling to Applications
280
Fig. 15. The method efficiency of 1 Bq/mL urine sample preparation. Number 1 represents the F method, numbers 2-6 represent the A – E method.
3. Conclusion As tritium naturally is present in environmental material, human is normally exposed internally with tritium via foods, drinking water, inhaled air, and also skin absorption. The tritium in the human body contributes radiation doses that affecting human health, hence the monitoring of tritium concentration in the environmental samples becomes interesting to avoid tritium intake by human.
This chapter has described the environmental sample preparation needed in tritium monitoring. Several developed distillation techniques in the preparation of environmental sample including air, water, soil, grass and urine have indicated a good performance result. Nevertheless, the sample preparation method for environmental tritium measurement is still interested to be developed to obtain the better performance. It is hoped that the chapter is technically worth in solving environmental and health problems arise in this industrial era.
4. References Bhatt, A.R., Greenhalgh, R., Ortel, C.P. 2002. Determination of tritium in urine samples and
validity of results, Idaho National Engineering and Environmental Laboratory. Glastone, S., Jordan, W.H. 1980. Nuclear Power Reactor and Its Environmental Effects, American
Nuclear Society, 0-89448-024-3, La Grange Park, Illinois.

The Separation of Tritium Radionuclide from Environmental Samples by Distillation Technique
281
Groning, K.R.M. 2004. Quantifying uncertainties of Carbon-14 assay in water samples using benzene synthesis and liquid scintillation spectrometry, www.iaea.or.at/ programmes/ rial/ pci/ isotope hydrology/ docs/intercomparison/ Vienna/ 30-04-2004.
Iida, T., Yokoyama, S., Fukuda, H., and Ikebe, Y. 1995. A simple passive method of collecting water vapour for environmental tritium monitoring, Radiation Protection Dosimetry, 58, 1, pp 23-27.
Harihan, C., Mishra, A.K. 2000. Quenching of liquid scintillator fluorescence by chloroalkanes and chloroalkenes, Radiat. measurement, 32, pp. 113-121.
Harrison, J. D., Khursheed, A., Lambert, B. E. 2002. Uncertainties in dose coefficients for intakes of tritiated water and organically bounds forms of tritium by members of th public. Rad. Prot. Dos., 98, 3, pp. 299 - 311
Konig, L.A. 1990. Tritium in the food chain, Radiation Protection Dosimetry, 30 2, pp. 77-86. Momoshima, N., Nagasato, Y., Takashima, Y. 1986. A sensitive method for the
determination of tritium in urine. Environmental Tritium Measurement, Kyushu University, Fukuoka, pp. 78 – 84.
Patton, G.W., Cooper, A.T., and Tinker, M.R. 1995. Evaluation of an ambient air sampling system for tritium using silica gel adsorbent columns, Pacifics Northwest Laboratory Richland, Washington.
Puhakainen, M., Heikkinen, T. 2007. Tritium in the urine in Finnish people. Radiat. Prot. Dos. Advance Access, pp. 1-4.
Rusconi, R., Forete, M., Caresana, M., Bellinzona, S., Cazzaniga, M.T., Sgorbati, G. 2006. The evaluation of uncertainty in low-level LSC measurement of water samples. Appl. Radiat. and Isot., 64, pp. 1124-1129.
Taylor, D.M., A biokinetic model for predicting the retention of 3H in the human body after intakes od tritiated water, Rad. Prot. Dos., 105, 1-4, pp. 225-228.
Tjahaja, P.I. 1995. The distribution of organically bound tritium concentration in soil (in Indonesian), Proc. of National Seminar on Science and Nuclear Technology, ISSN 1858-3601, Research Center for Nuclear Technique of National Nuclear Energy Agency of Indonesia, Bandung, 1995
Tjahaja, P.I., Sukmabuana, P., Zulfakhri, Widanda, Zulaika, S. 2004. A 3H sampling method for soil sample using heating and combustion method (in Indonesian), Proc. Seminar on Basic Research and Nuclear Science Technology , ISSN 0216-3128, Yogyakarta Nuclear Research Center, Yogyakarta July, 2004.
Tjahaja, P.I. , Sukmabuana, P. 2005. The Method of Tritium Sampling from Grass (in Indonesian), Proc. of National Seminar on Science and Nuclear Technology, ISSN 1858-3601, Nuclear Technology Center for Materials and Radiometry of National Nuclear Energy Agency of Indonesia, Bandung, June, 2005.
Tjahaja, P.I, Sukmabuana, P. 2009. Method of sample preparation for low level tritium concentration in urine (in Indonesian), Proc. of National Seminar on Science and Nuclear Technology, ISSN 1858-3601, Research Center for Nuclear Technique of National Nuclear Energy Agency of Indonesia, Bandung, June, 2009.

Distillation – Advances from Modeling to Applications
282
Trivedi, A., Galeriu, D., Lamoth, E.S. 2000. Dose contribution from metabolized organically bound tritium after chronic tritiated water intakes in human. Health Phys., 78, pp. 2-7.
United Nations. 1988. Sources, effects and risks of ionizing radiation: United Nations Scientific Committee on the Effects of Atomic Radiation. Report to the General Assembly, with annexes. United Nations Publication, Sales No. E.88.IX.7. New York .
US Environmental Protection Agency, Radioactivity in drinking water, EPA Report 570/9-81-002 (Office of Drinking Water (WH-550), Washington DC), 1981.


