Distortion costs and effects of price liberalisation in Russian energy markets: A CGE analysis Leena Kerkelä 1 Abstract Russia’s economy is energy intense and wasteful of resources. This situation has arisen in part due to the country’s ample energy supplies and regulated privileges for domestic consumers. Recently enacted and proposed reforms intended to increase the efficiency of the energy sector by raising domestic energy prices also have implications for the export levels of Russian energy commodities. In this study, we estimate the costs of the subsidised energy system in an allocative sense and then analyse recent moves of the Duma to boost gas and electricity prices to bring them into line with market-based pricing. Our analysis uses a multi-region general equilibrium model (GTAP) modified to express the global dimensions of the subsidisation policy and suggested reforms. Preliminary results show that current subsidies extract over 6% of GDP and limit the potential benefits of Russia’s comparative advantage in energy commodities. Increases of 6% in electricity and 10% in the price of regulated gas improve efficiency by reducing distorting subsidies and distinctly shifting output from domestic markets to exports. Keywords: CGE modelling, energy market liberalisation, Russia JEL classification: D58, F17, H71, Q43, Q48. Venäjän suuret energiavarannot ja kotimaisen kulutuksen säädellyt edut ovat tehneet maasta energiaintensiivisen talouden, joka tuhlaa resurssejaan. Viimeaikaiset ehdotukset energiasektorin tehostamiseksi vaikuttavat energian kotimaiseen hintaan ja sitä kautta myös Venäjän energiahyödykkeiden vientiin. Tässä tutkimuksessa arvioidaan aluksi tuetun energiajärjestelmän kustannuksia tehokkaan allokaation näkökulmasta. Sen jälkeen analysoidaan ensimmäisiä toimia, jotka Duuma on hyväksynyt kaasun ja sähkön hinnan nostamiseksi lähemmäksi markkinaehtoista hinnoittelua. Analyysi on toteutettu usean alueen yleisen tasapainon mallilla (GTAP), joka tuo esiin tukipolitiikan ja ehdotettujen uudistusten globaalit vaikutukset. Alustavat tulokset osoittavat nykyisten tukien vievän yli 6 prosenttia BKT:sta jättäen Venäjän suhteellisen edun energiahyödykkeissä osittain hyödyntämättä. Säännöstellyn sähkön hinnan 6 prosentin ja kaasun hinnan 10 prosentin korotukset parantavat tehokkuutta vähentämällä vääristäviä tukia ja siirtäen tuotantoa selvästi kotimaisilta markkinoilta vientiin. Asiasanat: Venäjä, energia, YTP-mallit 1 Leena Kerkelä, Government Institute for Economic Research (VATT), Arkadiankatu 7, POB 1279, Helsinki, Finland, email: [email protected], phone: +358-9-703 2977. This paper was prepared during my stint as a visiting economist at BOFIT. I wish to thank the entire staff of BOFIT for their encouragement and support. In particular, I am grateful to Pertti Haaparanta, Jukka Pirttilä, Johanna Pohjola, Jouko Rautava and Risto Vaittinen for their insightful comments. I take full responsibility for any possible errors or omissions herein.
Transcript
Distortion costs and effects of price liberalisation in Russian energy markets: A CGE analysis
Leena Kerkelä1
Abstract Russia’s economy is energy intense and wasteful of resources. This situation has arisen in part due to the country’s ample energy supplies and regulated privileges for domestic consumers. Recently enacted and proposed reforms intended to increase the efficiency of the energy sector by raising domestic energy prices also have implications for the export levels of Russian energy commodities. In this study, we estimate the costs of the subsidised energy system in an allocative sense and then analyse recent moves of the Duma to boost gas and electricity prices to bring them into line with market-based pricing. Our analysis uses a multi-region general equilibrium model (GTAP) modified to express the global dimensions of the subsidisation policy and suggested reforms. Preliminary results show that current subsidies extract over 6% of GDP and limit the potential benefits of Russia’s comparative advantage in energy commodities. Increases of 6% in electricity and 10% in the price of regulated gas improve efficiency by reducing distorting subsidies and distinctly shifting output from domestic markets to exports. Keywords: CGE modelling, energy market liberalisation, Russia JEL classification: D58, F17, H71, Q43, Q48. Venäjän suuret energiavarannot ja kotimaisen kulutuksen säädellyt edut ovat tehneet maasta energiaintensiivisen talouden, joka tuhlaa resurssejaan. Viimeaikaiset ehdotukset energiasektorin tehostamiseksi vaikuttavat energian kotimaiseen hintaan ja sitä kautta myös Venäjän energiahyödykkeiden vientiin. Tässä tutkimuksessa arvioidaan aluksi tuetun energiajärjestelmän kustannuksia tehokkaan allokaation näkökulmasta. Sen jälkeen analysoidaan ensimmäisiä toimia, jotka Duuma on hyväksynyt kaasun ja sähkön hinnan nostamiseksi lähemmäksi markkinaehtoista hinnoittelua. Analyysi on toteutettu usean alueen yleisen tasapainon mallilla (GTAP), joka tuo esiin tukipolitiikan ja ehdotettujen uudistusten globaalit vaikutukset. Alustavat tulokset osoittavat nykyisten tukien vievän yli 6 prosenttia BKT:sta jättäen Venäjän suhteellisen edun energiahyödykkeissä osittain hyödyntämättä. Säännöstellyn sähkön hinnan 6 prosentin ja kaasun hinnan 10 prosentin korotukset parantavat tehokkuutta vähentämällä vääristäviä tukia ja siirtäen tuotantoa selvästi kotimaisilta markkinoilta vientiin. Asiasanat: Venäjä, energia, YTP-mallit 1 Leena Kerkelä, Government Institute for Economic Research (VATT), Arkadiankatu 7, POB 1279, Helsinki, Finland, email: [email protected], phone: +358-9-703 2977. This paper was prepared during my stint as a visiting economist at BOFIT. I wish to thank the entire staff of BOFIT for their encouragement and support. In particular, I am grateful to Pertti Haaparanta, Jukka Pirttilä, Johanna Pohjola, Jouko Rautava and Risto Vaittinen for their insightful comments. I take full responsibility for any possible errors or omissions herein.
1. Introduction Extensive energy resources in the absence of a functioning domestic market for energy products allowed the centrally planned Soviet Union to become an energy-intensive economy with excessive crude oil production and inefficient conversion of energy to secondary markets in power production. The lack of a price mechanism and state ownership of resources also allowed consumers and enterprises to exploit the country’s energy resources at prices far below those prevailing in market economies. Since the collapse of the Soviet Union, the energy-intensity of the Russian economy has continued to exceed the OECD average, while rates charged for fuel and electrical power remain below long-term supply costs and well below the levels in Western Europe and North America.2 This price structure is further distorted by the system of cross-subsidies from industry and business to residential customers found in all CIS countries (Kennedy 2003). In April 2003, the Russian government approved a long-term energy strategy that seeks to increase energy production and promote efficient energy use in Russia (BOFIT 2003a, No. 22). Greater energy efficiency will surely make Russia’s economy less energy intense and free up greater volumes of crude oil, gas and other energy products for export. Moreover, increasing energy exports are a channel for acceding to global commodity markets. On the other hand, a further boosting of exports of energy products will further narrow Russia’s export mix and could even threaten stable development to the extent that it increases budgetary dependence on trends in world energy prices. For the government, budget income from these resource rents is so vital that it well justifies the aims to increase production and exports. Price liberalisation in energy markets, especially power production, is crucial for the market mechanism to function and generate the revenue needed for necessary investment in the sector. Russia’s domestic price of gas is currently a quarter of the world market price and the price of oil on the domestic market is a third of the international price.3 The cross-subsidisation of residential power effectively raises rates charged to firms to about 1.8 times the rate charged for residential electricity and heat (EBRD 2001). Higher prices from domestic energy use are needed for sustainable business and for decreasing the energy-intensity of the economy. Efficient production frees resources for other uses and increases the costs of the energy use before the structural changes occur. Such changes, while improving the overall allocation of resources, would inevitably create winners and losers in the short run. This situation largely explains the lack of political enthusiasm for implementing such changes. In this paper, we analyse currently planned reforms Russia’s energy markets, focusing on their potential efficiency in resource allocation. Numerical simulations support the analyses, which are performed with a global database and a multi-region general equilibrium model (GTAP) provided with compatible data. In version 5.4, the most
2 For an overview of energy markets, see IEA 2003. 3 Information on the export price of natural gas and the relative oil prices in domestic and international markets comes from Russian economic trends, version 2002. The domestic price of natural gas in 2003 was about $23 per thousand cubic meters; the average price of exported gas in the last three years was about $98 per thousand cubic meters.
recently published version of the GTAP database,4 Russia is separated as a country of its own with a national input-output model. Bilateral trade flows with the rest of the world genuinely connect Russia to global trade flows. The database includes information on energy taxes, which we modify to include implicit subsidies for regulated prices. We further attempt to survey the current tax, subsidy and market structures in the Russian energy sector. The goals of this paper are twofold. First, we analyse the extent of Russian energy markets, especially the costs resulting from the current distortions in the tax and subsidy system. The analysis is performed by totally removing all taxes and subsidies in the Russian energy sector. The simulations produce results on aggregate-level effects and changes in the production and trading patterns. With somewhat realistic reforms currently on the agenda, we focus on what might happen with increases in regulated electricity and gas rates. Simulation results show that current taxes and subsidies exhaust over 6% of current resources and that this gap is mainly the outcome of subsidised gas prices for households and industry. In the price liberalisation reform, we focus on the trade-off between domestic and international markets required by the reform. We study the effect on global trade flows in gas, electricity and manufacturing industries that are sensitive to energy prices. We also consider the impact of such changes on Russia’s closest trading partners. In the section 2 of this paper, we show the importance of Russian energy markets for the domestic economy and for global energy markets. Section 3 provides an overview of the policy landscape for energy markets and what such policy implies in the domestic field and in global trade negotiations. Section 4 presents the model and simulations. In section 5, we analyse the costs of the distorted energy system, while in section 6 we examine the impact of price increases on domestic gas and electricity. Section 7 concludes.
2. The role of Russian energy in trade and the domestic economy For the purposes of this study, we make following restrictions on our analysis of energy sector: we focus solely on Russia,5 and we only consider primary energy production of oil and natural gas (coal, while treated as a separate sector, is not of primary interest for this discussion). Our database also treats the distribution of gas as a distinct sector. Gazprom’s monopoly on ownership and governance of pipelines should justify the distribution of gas as a separate industry. However, as all sectors behave symmetrically, monopoly power is unapparent in the sector. Our data do not make it possible to study separately the market structure in Russian oil markets, where extraction is partly privatised while pipelines are operated by a state-owned company. Regarding secondary energy markets, we treat electricity and heat as a single sector and analyse their subsidies and price reform. The technology of the energy sector is inferred from the input-output data for Russia and the production technology is mainly a nested CES function.6 In any case, we focus here on demand-based reactions
4 http://www.agecon.purdue.edu/gtap. 5 For a general overview of other CIS countries, see e.g. EBRD (2001). 6 GTAP Database 5.4. For a description of the GTAP model, see Hertel and Tsigas (1997).
to changes in relative prices, rather than technology choices in production. Our definition of the GDP produced by the energy sector includes the fuel industry (the first six industries listed in Table 2.1.) The size of the energy sector can be measured either as the value added produced by the sector as a share of total GDP or as the sectors’ output compared to total output. We take the EU for comparison in Table 2.1. Measured in terms of value added, the share of energy sector from GDP in Russia is 15.9% compared to the EU’s 1.7%. Measured in relation to total production, the share of energy sector in Russia is 19.7%, a share ten times larger than for the EU. The figures are modified from the original GTAP database to include subsidies for consumers in electricity and for firms and consumers in gas industries.7 Our corrected figures deviate somewhat from Wehrheim (2003), who reports the respective shares based on World Bank (1995) figures as 13.0% and 11.6%. Our figures are quite in line with Tabata (2002), who estimates the oil and gas industry produces 16.1% from GDP when transportation and trade margins are included in the estimation.8 Table 2.1 Sectoral composition of GDP in the Russian Federation and EU
Value Added Total ProductionRussia EU Russia EU
1 Electricity 0.5 1.1 4.1 1.32 Oil 6.3 0.2 5.9 0.23 Gas 9.1 0.1 6.4 0.14 Gas Distribution 1.0 0.1 0.8 0.15 Fuel Industry 0.3 0.1 3.3 0.76 Raw metals and coal 5.7 2.3 7 3.77 Chemicals 1.6 3.1 2.4 58 Mechanical industry, automobiles 4.2 7.5 5.2 10.89 Wood industries 1.4 2.6 1.7 3.410 Light manufacturing 2.1 4.3 2.4 611 Construction 8.5 5.7 7.9 6.712 Food industries 3.5 3.3 6 5.413 Agriculture 8.9 2.1 8.9 214 Trade and transport 14.5 18.3 13 16.615 Services 32.2 49.1 25 38.1Total 100.0 100.0 100 100Energy intensity 17.3 1.7 20.5 2.4Source: GTAP Database 5.4. For 1997 and author's calculations Russia is the world’s second largest producer and exporter of crude oil after Saudi Arabia. In natural gas, it is the world’s leading producer and exporter. Russia even exports over 7% of total world exports of petroleum products (IEA 2003). For the EU, the importance of Russia is huge. Of total imports of oil and gas to the EU, 10% and 43%, respectively, come from Russia (GTAP).
7 For the same data in the original GTAP data, see Appendix 2. 8 According to Tabata (2002), the share of GDP produced by the oil and gas industry varied between 15.8% and 24.3% during the period 1995-2000. Some estimation errors may result from domestic margins and whether they are included in the energy sector or trade and transport sectors.
Russia’s comparative advantage in natural resources can be seen in its trading patterns. Crude oil constitutes 15% of Russian exports, natural gas 17%, oil products 8%, and other minerals and extracted materials such as aluminium and nickel about 25%. The energy sector’s share of total exports is 43.4% (GTAP 2003). As the price of oil is volatile and greatly affects the world market prices of other commodities (including gas), Russia’s economy, as noted above, remains highly vulnerable to external shocks and attempts to diversify Russia’s production structure should be generally welcomed. Throughout our analysis, we only treat taxes and subsidies in the energy sector as distortionary tools that decrease the efficiency of the economy as a traditional dead-weight loss. The role of taxes as corrective policy devices in the case of externalities or limiting the use of non-renewable resources is beyond this approach. We also abstract from the budget revenue dimension of taxes or the fact that indirect subsidies in the form of regulated prices are not actually part of the government budget.9 International best practice dictates that multiple fiscal instruments should be employed in ways that keep distortion to a minimum as risks and returns change over time (EBRD 2001). For example, Russia’s hydrocarbon tax structure (EBRD 2001) includes royalties based on volume recovered varying from 6% to 16%, a 25% corporate profits tax, an excise tax based on volumes (66 roubles per metric tonne of oil, 30% for non-CIS gas exports), a 10% mineral depletion tax and a crude oil export tariff (€20 per tonne of oil). The export tariff varies with prevailing oil prices. GTAP Database 5.4 provides the following tax and subsidy structure for the energy products in the database (Table 2.2). Positive figures are taxes; negative figures are subsidies. All positive figures come from GTAP Database 5.4. We have modified the subsidy structure so that the data more accurately describe the structure of energy markets in Russia. In the simulations below, we refer to these tax figures and describe how we base the subsidies on information on real, regulated prices. Taxes in the GTAP database are based on estimations on the differences between domestic and world market values of energy production.
Table 2.2 Ad valorem tax rates and subsidies on Russian Energy Commodities Output tax Export tax Import duty Consumer subsidy Firm subsidy (average)1 Coal 2.0 2.8 0-5.0 5.2 2.72 Oil 22.9 10.0 0-5.0 0.0 2.43 Gas 16.1 9.6 0-5.0 -75.0 -75.04 Gas Distribution 16.1 4.9 0-5.0 -75.0 -75.05 Electricity 2.8 7.4 0-5.0 -56.0 0.26 Fuel Industry 2.1 9.5 0-5.0 17.6 4.3Source: GTAP 5.4. Database, EBRD (2001) and other sources A dominant feature is the low price of gas and oil in Russia’s domestic market. As mentioned, the domestic price of gas is about a quarter of the world market price and the price of oil at domestic markets is a third of the international price. The domestic price of gas in 2003 was about $23 per thousand cubic meters. The average export
9 The costs of these subsidies are largely borne by Russian energy-producing firms, which in turn have the possibility to operate with costs exceeding actual revenue. Treating the subsidies described here as a tax to the primary producer of gas or electricity offers provides possibilities to continue the work started here.
price over the period 2000-2002 was about $98 per thousand cubic meters (Russian Economic Trends 2002). The regulated gas price, which is well below actual cost as well as the prevailing world market price, constitutes a clear subsidy to all users of gas for power production or heating. Payment arrears, barter arrangements and non-payments in the energy sector further act to subsidise the energy markets. As estimating is real subsidy rate in the presence of other distortions is a non-trivial task, we begin our approach with rough estimates.10 The subsidy for consumers and firms for domestic gas is expressed as a 75% subsidy. This is inferred from a fact that currently firms and consumers pay about a quarter of the market value of gas. This assumption applies to both gas and gas distribution. Altertax software makes it possible to modify the data in this respect without altering the initial factor market shares between sectors. We also correct for the consumer subsidy in the electricity market. Electricity markets are highly regional and there is no clear international reference for electricity rates. Russia’s electricity markets have the unusual feature that residential rates for power are lower than industrial rates. According to the EBRD (2001), the ratio of industrial rates to residential rates for Russia in 2000 was 1.8. This is a form of cross-subsidisation of consumers at the expense of firms. If we treat the industrial rate in the electricity market as a market price, the lower residential rate implies a 56% subsidy to residential consumers. Although the domestic price of oil is well below the world market price, inferences on subsidies are not analogous for the gas market. Instead, the inadequate export capacity and the government’s willingness to restrict exports of oil have led to an over-supply and low prices in the domestic markets.
3. Elements of energy market reform in Russia Several factors suggest pressures on Russian energy markets to alter the shape of markets and price formation, but no single factor is so overriding as to assure such changes will actually happen. For this purpose, we list the main features of the reforms and explain some of the positions put forward by actors in the market. The Russian government’s most concrete signal of a desire for change was the long-term energy strategy announced in April 2003. The main goals of the strategy are to increase energy production and promote efficient energy use in Russia (BOFIT 2003a, No. 22), and thereby make the economy less energy intense and free up additional crude oil, gas and as other energy products for export. 3.1. Price liberalisation
10 Problems associated with Russian energy tax rates are acknowledged by those compiling the GTAP database (McDougall 2003).
Energy market reform and enhanced market competitiveness typically require a move from subsidised prices for gas and electricity to freely determined prices. Russian domestic prices of gas and electricity are administratively governed and the Duma must authorise any rate hikes. The domestic oil market is regulated by export restrictions and pipeline controls. Figure 3.1 sketches a dual-track partial price liberalisation resulting from domestic subsidised energy commodity prices.11 The world price is given as exogenous to the economy. The export level in a partial equilibrium framework is the difference between supply and demand with a price level pw. In regulated domestic markets, the price set by the government is pd. At that price, there is excess demand for the commodity and we assume the government will impose regulations for firms to fulfil this demand, even though the firms are making losses (shaded area under the supply curve). The supply curve also measures the marginal costs of production. With the regulated domestic price, the amount available for exports reduces to Qw – Qd, where Qw is the firms’ willingness to produce at price pw and Qd is the domestic demand at price pd. In a centrally planned economy, the profits from exports (shaded area above the supply curve) can be used to cover losses from domestic supply. Figure 3.1. Dual-track partial price liberalisation in energy markets.
The rise in the domestic price in Figure 3.1 can be analysed by increasing pd. Such an increase reduces domestic demand, increases export supply and decreases subsidies. 11 “Dual track” refers to a partial price liberalisation in the market where part of the market behaves competitively and part of the market is regulated to guarantee the domestic supply. The analysis here is a modified and simplified analysis of Roland (2000) where the dual-track price liberalisation refers especially to China’s experiences in agricultural markets.
The draft 2004 budget foresaw a 20% rise in the price of natural gas and a 16% rise in the price of electricity (BOFIT 2003b, No. 7-9). While the actual increases depend upon inflation, the budget act clearly seeks to raise the relative prices of energy commodities. Roughly estimating an inflation rate of 10%, results in 10% and 6% real increases in the relative prices of gas and electricity. The pressures to increase domestic prices stem partly from domestic forces when firms strive to become more competitive. Reforms are also part of Russia’s efforts to create a market economy. The EU has perhaps been the loudest foreign proponent of increasing Russian energy prices (see below). Such reforms will clearly affect consumers, the government revenue and international markets (not only in energy goods but also in manufacturing goods that use energy as an input). 3.2. Tax reform Price increases are assumed to be transmitted through tax reforms to the energy sector. Tariffs on the production and export of oil and natural gas presently constitute about 35% of total federal budget revenues, which means that the budget is highly sensitive to fluctuations in world market prices for energy (BOFIT 2003b, No. 9). In spring 2003, the Duma introduced several tax reforms affecting the energy sector. These included an increase in the oil extraction tax and introduction of a natural gas extraction tax. Another proposal would eliminate the excise tax on natural gas, while raising the export tax on gas to 20% (BOFIT 2003a, No. 26). Shifting the tax burden towards energy commodities is partly a response to the lowering of the value-added tax (VAT). In general, the government has attempted to boost its tax take on oil income, and, in particular, windfall profits of Russian producers from high international oil prices. Extraction of natural resources from easy-access, high-profit fields should also, according to the government, carry a heavier tax burden (BOFIT 2003b, No. 12). 3.3. Design of market structure To ensure restructuring to more efficient production after price liberalisation so that price increases do not end up as monopoly rents, supporting reforms are also expected to ensure competitive behaviour among firms. The main features of such reforms concern the design of the market structure and a gradual abortion of regulated prices for domestic energy commodities. Increased competition in energy markets, especially in electricity and gas production, is a main component in the reform plan. For gas production, however, the reform faces severe opposition from Gazprom, which is unwilling to share its pipelines with other companies. As a result, no plan for the reform in gas sector is likely to be implemented in the near future. The reform plan for UES, the national electricity monopoly, strives to break up the company into ten privately independent regional power generating companies serving the wholesale market. In addition, several regional power-generating companies will be separated from UES. The power grid would remain state-owned, while five
regional power transmission companies would be partly state-owned (BOFIT 2003a, No. 23). The plans are in concord with liberalisation schemes in the OECD and the EU. Economic theory says that when a natural monopoly exploits decreasing average costs is only useful to split it up in those areas that do not benefit from increasing returns to scale. For many monopolies, there are several areas that exhibit constant returns to scale. For Russia’s gas monopoly, for example, the pipelines may hold properties of natural monopoly. For electricity production, improvements in the competitive environment usually requires splitting up the ownership of power generation and the ownership of the grid, and this is also suggested in Russia’s case. The energy reform includes plans for increasing the extraction of oil for exports and building up new infrastructure for this purpose. The energy intensity of the economy and consumption of energy commodities would decrease. 3.4. Global interest for Russian energy reform The global interest in reforms in Russian energy sector stems partly from the general interest on how Russia moves from centrally planned economy to competitively working markets and integration with global markets. Russia’s reform measures in electricity and gas supply have much in common with those of OECD countries, and especially EU countries. The convergence in market design can be seen (IEA 2002). The EU has been highly vocal on Russia’s highly subsidised energy prices. The topic has been on the agenda at the ongoing WTO negotiations for Russia, as well as in bilateral negotiations between Russia and the EU. Because Europe depends on Russian energy, and will be even more dependent on Russian gas in the future, the EU insists that Russia’s domestic prices for energy resources must approach world prices and that Russia’s energy sector requires significant reform. Russia’s view has been that lower energy prices are due to its comparative advantage. Raising the domestic price of energy to world-market levels would also make Russian manufacturing uncompetitive. Critics earlier noted that Russia’s subsidised gas and electricity prices conferred significant competitive advantage on its domestic industries. This, in turn, raised the threat of retaliation with antidumping and other countervailing measures against Russian exports. With Russia’s pending WTO membership and acceptance as a market economy, Russia should gain more rights against antidumping penalties. Although energy reform should not remain a crucial question after Russia’s accession to the WTO, the energy reform must still be considered from the standpoint of global economic integration. The speed of reforms is interesting both from the standpoint of national effects and in terms of how the reforms effect export supply and thus the export price and quantity of gas and oil. Market conditions also form the basis for infrastructure investments in Russia, which impact, in turn, e.g. environmental protection measures and the investment climate in general. Russia’s successful development is very much dependent on the development of its energy sector.
4. Model framework We now analyse the distortions in Russian energy markets and proposed price liberalisation with the help of a multi-region general equilibrium model and a database supported by the model.12 In recent years, such models have become standard in evaluating trade policy-related issues.13 GTAP Database 5.4 includes an improved input-output table for Russia that allows study of Russian issues in a global context. We aggregate the 78 regions and 57 sectors into 15 commodities (see Table 2.1 above) and seven country groups (Appendix 1b). In the regional aggregation, we focus on Russia, the EU and former Soviet Union countries (Baltic States and other CIS countries). The rest of the regions are Central and Eastern European countries (EEA), Northern America (NAM) and the Rest of the World (ROW). The GTAP database includes input-output tables expressed in dollar value terms for all countries in the data. Several single-country CGE models have recently been built for Russia (e.g. Alekseev 2003, Wehrheim 2003). While under the GTAP framework single-country data can be used to derive a single-country model (CRUSOE),14 our goal here is to analyse Russia in the global context. While Russia is generally a minor player globally, its main export products are important in global trade and domestic measures affecting the energy sector are likely to have global implications. Studies to date on the Russian economy in the CGE framework typically relate to WTO membership or EU integration (Sulamaa and Widgren 2003, Alekseev 2003, Lejour 2001). Wehrheim (2003) also tackles changes in agricultural production. “Former Soviet Union” was an aggregate in the previous GTAP database and its synthetic input-output table was unrepresentative of Russia or any other FSU country. Riipinen (2003) analyses energy market liberalisation with the previous GTAP database using GTAP data as the only source for information on Russian energy market which for the above-mentioned reasons gives a wrong description relative to the real distortions. Clements, Jung and Gupta (2003) study the effects of petroleum price liberalisation in Indonesia with a CGE model. They find that increasing prices of petroleum products by 25% reduces the output in petroleum-using sectors and depresses household consumption. Consumption decreases more sharply than production and the utilities sector is most significantly affected by the reduction of the petroleum subsidy. 4.1. Main features of the GTAP model
12 Information on GTAP Project, the database and the model, as well as several applications, are posted on the project’s website at http://www.agecon.purdue.edu/gtap. Hertel and Tsigas (1997) describe the model. Dimaranan and McDougall et al. (2002) describe GTAP Database version 5. 13 See Francois and Reinert (1997) for a survey on the use of numerical models for evaluating trade policy. 14 Software available at the GEMPACK website http://www.monash.edu.au/policy/gempack.htm.
The standard GTAP model (Hertel and Tsigas, 1997) assumes a competitive environment, where firms and households take prices as given. On the demand side, the regional household consists of a representative consumer, who devotes a constant share of his income to public expenditures, consumes tradable commodities and saves part of his income. The production structure of the economy is based on input-output structure where imported or domestic intermediates are used for production of commodities. The nested production structure defines the behaviour of firms that minimise their costs and adapt their factor demand to changes in relative prices. Functional forms in the production structure define substitution possibilities for source countries for imports, as well as substitution between domestic and imported commodities and between intermediate and value-added products. Behavioural changes are based on current production and trading patterns and largely rest on the original data for 1997 in the current database. The magnitude of the responsive reactions is affected by behavioural parameters provided by the database. Armington elasticities are included in the behavioural parameters that define the demand response to changes in relative prices of domestic against imported commodities. Small elasticities would imply large market power even for small countries. We have increased the original elasticities for energy commodities in order to present a more realistic description of the homogenous nature of energy goods. The macroeconomic components of the model balance global savings to global investments. These savings are the outcome of the behaviour of the representative consumers. Investments are financed from the global savings pool based on their relative yield. The current account not need be balanced. Although the GTAP model includes is a detailed description of taxes, it does not consider the public sector as a separate agent. It is possible, however, to control the tax burden of the economy by changing certain variables from exogenous to endogenous, i.e. to modify the closure of the model. Usually the tax burden is an endogenous variable in the model. By keeping it fixed and letting the general consumer tax adapt, it is possible to make a scenario where extra tax revenue or savings from decreased subsidies are allocated back to consumers by increasing their welfare. We study this case below. In many other cases, GTAP model closures offer a large variety of possibilities to fix certain elements in the economy and let other variables adapt. We further modify the standard closure of the model by fixing the prices of energy commodities. The policy instruments of the model and data have been implemented by price wedges between different levels of prices. For example, the price wedge between the value of world market prices and market prices that domestic consumers and firms face is the power of tariffs in the economy. Similar wedges apply to prices between domestic producers (agents) and users. Russia’s energy sector features a price wedge between world market price and the price that oil and gas producing firms get for their products. This price wedge is described by both the output tax and the export tax. Any outcome of the model, e.g. an increase in GDP, is the result of an improved allocation of resources and relative price of domestic consumption against foreign countries. 4.2. Opening the black box – interpretation of the simulation results
Large general equilibrium models include thousands of equations that simultaneously determine the model outcome and the solutions to an experiment. In general equilibrium, all agents adapt their behaviour to external conditions. Thus, the solutions cannot be concluded on the basis of single equations. In general, the model outcome is dependent on the model, the data and the parameters that define the magnitude of responsive reactions. Depending on the application and the shock, different components have different emphasis. In many cases, results seem to appear from a “black box.” GEMPACK software includes several support programs to decompose and put in pieces the results of the model. This software is standard part of the GTAP model as well. In this study, we use the following add-on components for analysing the results: Welfare decomposition One model result is the money metric change for the increase in global welfare. Under the method developed for the GTAP framework by Huff and Hertel (2000), global welfare change can be decomposed to changes by regions. We ask how much of the welfare increase can be attributed to regions or commodities. The region-specific changes can further be decomposed to changes in allocative efficiency and terms-of-trade effects. The first arise from a decrease or increase in dead-weight losses within the economy and the latter from the relative prices between exportable and importable commodities. The other aggregate-scale effects to the regional welfare arise from the global investment module and the contribution of productivity effects when they are given as shocks to the model. We use the method below in analysing the aggregate effects of current distortions (Figure 5.3). Decomposing simulations in respect to exogenous shocks The results of policy simulations represent the compound of several exogenous shocks. In our application of the total removal of all taxes and subsidies they include shocks to output taxes, import duties, export taxes and subsidies, by commodities. To evaluate the relative significance of these different shocks is not a trivial question. In a general form, the relationship between the endogenous variable Z and the exogenous variables X1, X2, …,Xn is
Z = F(X1, X2, …,Xn). (1) The change in Z relative to the exogenous shocks X I is represented by
dZ = F1dX1 + F2dX2 + --- + FndXn, where Fi = ∂F/∂Xi. (2)
The magnitude of different partial derivatives is not general as different partial derivatives are evaluated around the reference point (the solution). Harrison et al. (2000) demonstrate how GEMPACK software can decompose the effects of several variables into their component parts in general situations. In Figures 5.1 and 5.2 below, we decompose the GDP and the terms-of-trade results with respect to changes in taxes and subsidies.15
15On applications of the method, see also Vaittinen (2003).
Systematic sensitivity analysis Often the model’s principal parameters are key to determining the simulation results. With a range of parameters, their effect on the key variables can be analysed (see Arndt and Pearson, 2000). This systematic sensitivity analysis resembles Monte Carlo analysis, where the value of variables giving rise to the uncertainty is selected at random and the reliability of the results in relation to the uncertainty is characterised using the mean values and standard deviations of the simulation results. In the method applied here, the discrete approximation for the distribution is defined to decrease the necessary steps in calculation. In the section 6, we study the sensitivity of exports in energy commodities to elasticity of substitution between imported and domestic commodities.
5. The costs of distorted energy markets The costs of the current tax and subsidy regime have been evaluated by simulating the total removal of output taxes, export and import taxes, as well as domestic subsidies and taxes in domestic use of energy and evaluating their relative importance. The extent of distortions was described in Table 2.2. The model solves an efficient allocation of resources when all these distortions have been removed. The purpose of the exercise is not to champion the total removal of the distortions, but rather estimate their relative importance. We show which components in the system, as described here, are most important for the dead-weight losses in the economy. We also look at their effects on industries and factor markets to see which industries and factors are favoured by the current regime.
Table 5.1 Aggregate results of the total removal of distortions in Russian energy sectorEU EEA BALT RUSSIA XSU NAM ROW
Real gdp 0.1 0.2 0.1 6.2 0.5 0.0 0.0Income 0.1 2.3 3.9 9.1 12.5 -0.2 -0.3Utility 0.2 1.5 2.6 4.1 6.9 0.0 -0.1Total exports 0.0 -2.5 -2.0 37.0 -0.3 0.2 0.1Total imports 0.3 1.7 2.9 26.0 24.4 -0.1 -0.3Terms of trade 0.4 2.0 2.0 -9.5 14.3 0.0 -0.3Welfare in Mio USD 780.3 251.1 13.3 290.3 246.3 7.2 -457.1Abbreviations: XSU (The rest of Former Soviet Union), NAM (USA and Canada), ROW (Rest of the World)
The current distortions account in real terms for 6.2% of GDP.16 Compared to the regional income the effect on GDP is smaller as the regional income increases by 9.1%. Apart from expenditures, the utility measure takes into account the increase in the price index for disposition of income by regional household, resulting in utility increase to be modest 4%. Distortions are transmitted to neighbouring countries, not only in price terms but also in real terms. We imagine that a more effective production structure would make the trading partners more effective as well, as more competitive imports replace some of current domestic production. Most of these efficiency costs have been drawn from other Former Soviet Union countries.
16 All results, if not reported separately, are expressed as percentage changes from the base value.
Removing the current taxes and subsidies would substantially increase international trade between Russia and the rest of the world. Domestic taxes and subsidies can thus be interpreted as a trade barrier. As the current distortions apply just to Russia’s export industries, removing taxes and subsidies from these industries would substantially increase supply. For increasing exports, the demand for imported commodities would increase as well. We can interpret the subsidy policy to be a way of restricting international trade with outside countries and keeping the conditions of trade better for Russia. Increasing exports from Russia and supplies of gas and oil would certainly decrease the world market prices of energy commodities and Russia’s terms of trade would deteriorate. To evaluate the importance of different tax means, we have decomposed the GDP and the terms-of-trade results with respect to exogenous variables (see method described above in 4.2). Figure 5.1. Decomposition of GDP results with respect to changes in taxes and subsidies.
0 %
20 %
40 %
60 %
80 %
100 %
EU EEA BALT RUS XSU NAM ROW
Firm subsidies
Consumption subsidiesImport duties
Export taxTax effects
Figure 5.2. Decomposition of terms-of-trade results with respect to changes in taxes and subsidies.
-100 %
-50 %
0 %
50 %
100 %
EU EEA BALT RUS XSU NAM ROW
Firm subsidies
Consumption subsidies
Import duties
Export tax
Tax effects
For Russia, removal of all distortions contributes positively to GDP. The most important factors are subsidies for firms in the gas industry, which covers over half of the GDP increase. Consumer subsidies for consumers are also important, while production and export taxes are of lesser importance. The simulation results show the importance of transit trade for the Baltic countries. Although the effect of aggregate distortions is only 0.1% of GDP, the effect on income is magnified, mainly from export taxes. Removing such taxes would likely result in greater oil and gas transit trade through Baltic countries. In the terms-of-trade movement for Russia, positive contributions come from removing taxes on gas and oil. For declining export prices, gas subsidies also play the leading role in keeping supply directed to domestic markets instead to foreign markets. Figure 5.3. Welfare decomposition.
-100 %-80 %-60 %-40 %-20 %
0 %20 %40 %60 %80 %
100 %
1 EU
2 EEA
3 BALT
4 RUS
5 XSU
6 NAM
7 ROW
Allocative efficiencyTerms of tradeOther effects
Welfare decomposition further reveals what was seen in the aggregate results. The total increase in welfare in Russia is positive, although dampened by the negative terms-of-trade effect. The other effects are seen mainly in Northern America (NAM), where relative yield from global investments increases as a result of removing distortions in Russia. The aggregate welfare effect for Northern America, however, is tiny (Table 5.1). Table 5.2 presents the effects on Russian output and commodity prices from completely removing all taxes and subsidies. Removing distortions increases the prices of most manufactured products and decreases output. The hardest hit are the energy-intensive fuel industry, metal industry and chemicals. Services increase most, which is also the outcome from the demand structure of the model. The large increase in GDP results in a structural change in demand towards services.17
Table 5.2. Effect of total removal of distortions on output and prices in Russia
The effects on output and prices of energy commodities are more diverse. Oil production increases due to the removal of current output and export taxes. Removal of the current subsidy structure is behind the decreases in gas production and gas prices. Gas distribution appears to be quite sensitive in simulations results, and the results for their part are not very convincing. The results can be also interpreted by asking which industries the current regime favours. Clearly, the manufacturing industries and utilities have been supported by cheap gas. The current regime also appears to restrict the potential of oil industries. The effects on factor prices reveal that the current regime particularly favours owners of natural resources at the expense of labour. The simulations decrease the rewards of natural resource by 1.5% and increase the earnings of skilled labour by 6.3% and unskilled labour by 4.3%.
17 The GTAP model’s demand system uses a non-homothetic constant elasticities in differences (CDE) structure that allows varying budget shares of commodities in consumption.
6. The impact of price increases on domestic gas and electricity As seen above, extensive implicit subsidies play a particularly significant role in distorting Russian energy markets. The prices of gas and electricity are regulated and the government sets the tariffs for them. Political realities dictate that price increases must take place incrementally. In 2004, the Duma plans to increase the price of natural gas 20% and the price of electricity 16%. If we include a plausible 10% inflation target, the relative prices of gas and electricity would rise 10% and 6%, respectively. Plans to double the gas price within a few years have been presented. We simulate the effects of these tariff hikes in energy with the previously set data where large subsidies are present for firms and consumers in gas and gas distribution and for consumers in electricity. More modified experiments are as follows: Table 6.1 Scenario plan
Identification Gas tariff hike Electricity tariff hikeOther assumptionsScenario 1 EG 10 % 6 %Scenario 2 EG-o 10 % 6 % Price of oil fixedScenario 3 EG-cb 10 % 6 % Constant tax share (see 4.1.)Scenario 4 EG-tax 10 % 6 % Tax increases The first three scenarios are similar except for assumptions related to the closure of the model. In Scenario 2, the price of oil is fixed to describe the regulated markets in oil. In Scenario 3 (EG-cb), we set the tax burden as fixed to simulate the situation where saved revenue would be allocated back to consumers. In Scenario 4, we have added tax increases recently suggest by the Duma to the price increases. The tax hikes include a 10% increase in the oil and gas output tax, an increase in the gas export tax to 20% from the current 10%. The last scenario serves not so much as a tax analysis, but as a means to elucidate the costs and benefits between taxes and removal of subsidies. Figure 6.1. Aggregate effects of price increases on Russia.
0.16
-0.36
0.07
1.33
-1.06
-0.53
-1.5
-1
-0.5
0
0.5
1
1.5
Real gdp Income Utility Totalexports
Totalimports
Terms oftrade
The aggregate results of the first experiment (EG) are presented in Figure 6.1. The price hikes raise GDP by 0.2%. The expenditures of households decrease by –0.36%, while the utility effect turns positive due to simultaneous decreases in the price index. Most of the effects happen in the external sector. Exports increase about 1.3% and imports decrease over 1%. Competitiveness in foreign markets deteriorates, and despite increasing exports, imports become less affordable. This is reflected in the declining terms of trade. The aggregate results for all countries from all the experiments appear in the Appendix Table 3. The aggregate effects for other countries remain modest. The assumption of fixing the oil price can be seen in the terms of trade effect. When increasing supply has no effect on export prices, the terms-of-trade deterioration is much smaller and the welfare effect is better. The assumption has no effect on GDP. The fixed budget assumption has a modest effect on total welfare through the household utility. This comes through the savings in the subsidies to regulated prices. In the final scenario (EG-tax), price increases are linked to tax increases and the effect on GDP is slightly negative. Unlike other cases, the terms of trade improve. The reason is obvious: raising taxes is a way to raise the market price of commodities. This last experiment has implications for both domestic and international markets. Raising domestic prices decreases domestic distortions and redirects production towards exports. Increasing supply to international markets reduces the price of exportable commodities. The economic effects of increasing prices thus depend on whether there exist subsidies or not. Recall that we had subsidies in electricity use only for consumers, not for firms. While raising the regulated price to consumers increases efficiency in the economy, on the firm side, inefficiencies increase.18 This dampens the positive effects from the price increases. We now examine the industry-level results closely, focusing on the marginal transfer from domestic supply to international markets. The reported results are from Scenario 1 (EG) in Table 6.2.
18 Technically, the price increases are implemented by setting prices fixed and respective tax variables endogenous and giving shocks to these prices.
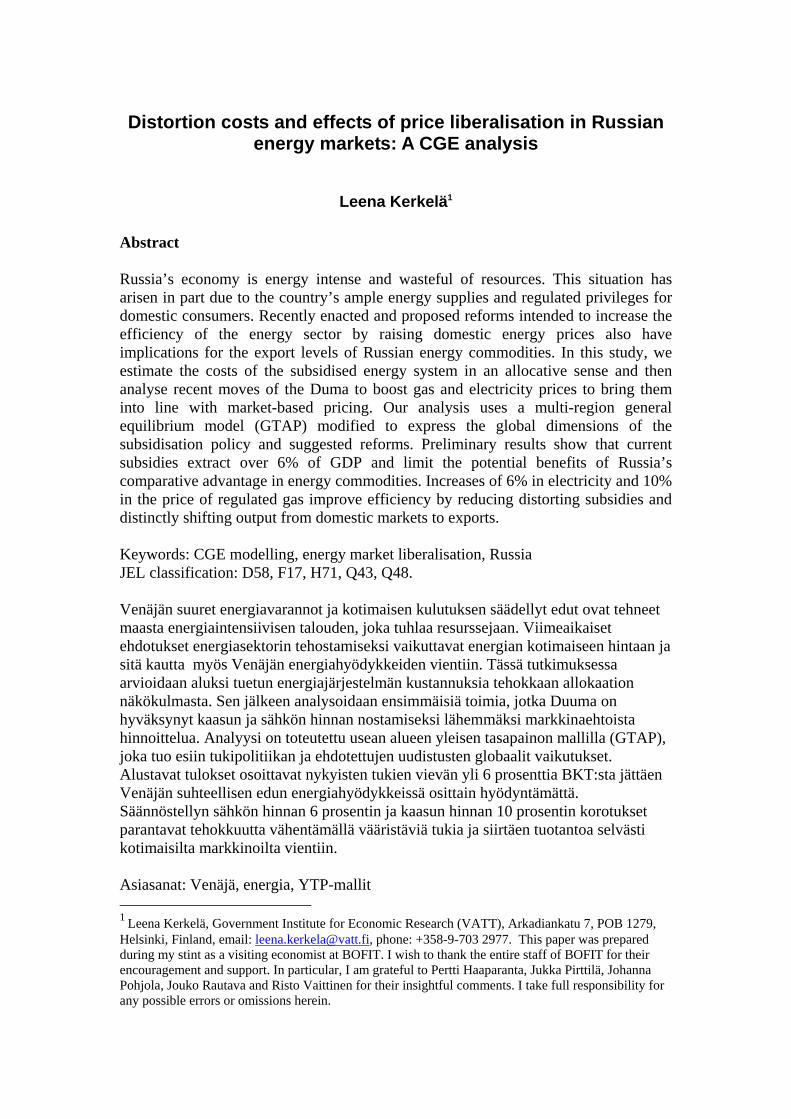
Table 6.2 Industry effects of price increase in gas and electricityOutput Market price Domestic sales Exports
COAL 0.0 -0.8 -0.6 23.2OIL 0.4 -0.2 -0.5 2.0GAS -0.5 -2.9 -2.9 5.9GASDISTR -1.8 -0.1 -1.9 -1.1ELECTRICITY -2.3 3.4 -1.4 -12.3FUELIND -0.5 -0.2 -0.9 0.6METAL -0.7 0.1 -0.7 -0.7CHEMICALS -0.3 0.2 -0.1 -0.7METAL IND 0.2 -0.4 -0.1 3.3WOOD 0.6 -0.4 0.3 1.7LIGHT 1.2 -0.6 0.9 4.0CONSTRUCTION -1.5 -0.6 -1.5 2.4FOOD 0.6 -0.6 0.5 2.8AGRICULTURE 0.3 -0.4 0.2 1.8TRADET 0.2 -0.7 0.0 2.0SERVICE 0.3 -0.8 0.3 3.1 Increasing regulated prices and reducing underlying subsidies decreases production of energy-intense commodities, gas and electricity. The other effects can be seen as secondary or adaptive effects. While output in energy-intensive industries decreases, however, it increases in non-energy-intensive sectors. This is partly due to the general-equilibrium nature of the model, whereby all resources are in full use. The outcome in market prices reflects the demand and supply responses to the original shocks. Notably, oil output increases while its market price falls. The higher output is clearly destined for export; domestic demand decreases. This happens even though the price of oil and its markets in principle only adapt to external shocks. The same also happens in the gas market with price regulation. Domestic demand decreases and exports clearly increase. We again ignore the analysis results for gas distribution. We have not analysed the results for consumer welfare here, because in energy commodities almost all direct production is exhausted by industry.19 With regard to direct consumption, the share is 10% for gas, 23% for electricity and 26% for the fuel industries. We can therefore interpret the consumer viewpoint by observing the development in the price of electricity and fuels, which in Russia together account for less than 3% of total expenditures in consumption. In the price of electricity, reforms produce the sharpest rise (3.4%). Table 6.3 presents the model results for the energy sector’s bilateral exports from Russia after reform. The increases in country-specific exports are substantial. The largest increases are in gas going to Northern America (51.6%), the Rest of the World (23.7%) and the EU (16.9%). The effects on other energy products are also significant, especially in coal and oil. In the rows below the simulation results, we also report the results from the systematic sensitivity analysis (smaller font, see section 4.2 above). As mentioned, the Armington elasticities, which describe the
19 Due to its basic assumption for the representative household, the standard GTAP model is less than ideal for analysing income distribution issues. Functional income distribution can be used to characterise income distribution.
elasticity of substitution between domestic and imported commodities, have been changed in the database to 20 from the original 2.8. To study the sensitivity of this parameter, we let the elasticity vary from 5 to 35 in gas and oil. We assume a discrete triangular distribution to the parameter so that gas and oil elasticities correlate. The means and standard deviations of the systematic sensitivity analysis are reported below the respective simulation result. Apparently exports other than gas are fairly insensitive to variations in elasticity. While exports from Russia to Russia seem very volatile, but the results are meaningless, as there is no internal exports in Russia in the database. There are larger deviations for gas exports (especially to NAM and ROW), but the results seem stable overall. Table 6.3. Exports of energy commodities from Russia, including SSA results. EU EEA BALT RUS XSU NAM ROW COAL 27.0 22.4 18.7 8.5 16.4 34.0 27.4
7. Conclusions The important economic role of Russia’s energy sector, both in absolute and relative terms, well justifies the examination of Russian energy markets in a general equilibrium framework. Changes in the circumstances of the energy sector have repercussions for other sectors of the economy and abroad. The foreign impact comes from the important role of Russian energy commodities in global trade. In particular, the vital role of Russian energy supplies to the EU can only be expected to grow. The reform in the Russian energy sector is part of sectoral reforms in Russia and other transition economies. The main goals of the energy strategy accepted by the Russian Duma are to increase energy production and promote efficient energy use in Russia. Implementation of the strategy will move Russia closer to a market economy and harmonise its energy policies with other OECD economies (IEA 2003). In this study, we have assessed Russia’s energy markets and the initial reforms envisioned by the government. To bring forth the global dimension of Russian energy
markets and the impending reforms, a quantitative analysis was performed using a global general equilibrium trade model (GTAP). First, we analysed the current tax structure in the form of output and production taxes and export taxes. In addition to taxes, regulated prices of energy commodities well below their real costs and world market prices constitute an equally important feature of the current regime. To evaluate the effects of the proposed reforms, both parts have to be considered in estimating their actual market effects. We first estimated the size of the distortionary system. Our calculations show it corresponds to 6.2% of GDP with subsidies making the greatest distorting contribution. The current tax structure, in contrast, works more to inhibit trade and exports, thus limiting the impact from any decrease in global prices of oil and gas. To provide practical policy insights, we analysed tariff increases for regulated prices of gas and electricity. Prices were raised 10% and 6%, respectively. The effect on GDP remains modest, but positive. The results confirm the goals of the energy strategy by clearly shifting sales from domestic markets to exports. Plans to reform the market design through increased competition has been left out of our quantitative analysis. Increasing competition in the gas and oil markets, and in particular, promoting a competitive environment for pipeline capacity, would increase production for export and depress the world market price. Moreover, efficiency improvements, which are vital for the development of the Russian energy sector, could be included to the analysis. These qualifications offer new possibilities to continue the work from here. Another area that we have not touched on at all is the Kyoto Protocol and its possible effects should Russia decide to ratify the agreement. Implementation of the Kyoto Protocol would effect global energy prices and change the effects of Russian domestic actions in the energy markets. The demand impulse from increasing gas demand would raise the price of gas and most certainly put pressure on Russian domestic prices.
References Alekseev Alexander (2003), “An Application of a Computable General Equilibrium Model for the Estimation of Effects of the European Union Enlargement on the Russian Economy,” New Economic School Working Paper 2003/070. Arndt, Channing and Ken R. Pearson (1998), “How to Carry Out Systematic Sensitivity Analysis via Gaussian Quadrature and GEMPACK,” GTAP Technical Paper No. 3, http://www.agecon.purdue.edu/gtap. BOFIT (2003a), Russian and Baltic Economies: The Week in Review, online weekly newsletter available at http://www.bof.fi/bofit. BOFIT (2003b), Russian Economy – The Month in Review 2003, online monthly newsletter available at http://www.bof.fi/bofit. Brockmeier, Martina (2001), A Graphical Exposition of the GTAP model,” GTAP Technical Paper No. 8, http://www.agecon.purdue.edu/gtap. Chowdhury, Abdur (2003), “WTO accession: What’s in it for Russia?” BOFIT Online Paper, No. 10, Helsinki. Clements, Benedict, Hong-Sang Jung and Sanjeev Gupta (2003), “Real and Distributive Effects of Petroleum Price Liberalization: The Case of Indonesia,” IMF Working Paper WP/03/204. Harrison, Will J., Mark Horridge and Ken.R. Pearson (2000), “Decomposing simulation results with respect to exogenous shocks,” Computational Economics, Vol. 15: 227-249. Huff, Karen M. and Thomas W. Hertel (2000), Decomposing Welfare Changes in the GTAP Model,” GTAP Technical Paper No. 5, http://www.agecon.purdue.edu/gtap. EIU (2003), “Country Forecast: Russia”, The Economist Intelligence Unit, UK. EBRD (2001), “Transition Report 2001: Energy in Transition,” European Bank for Reconstruction and Development. Hertel, Thomas W. and Marinos E. Tsigas (1997), “Structure of GTAP,” in Hertel, Thomas (ed.) Global Trade Analysis, Cambridge University Press. IEA (2003), Key World Energy Statistics, OECD/IEA, available at http://www.iea.org. IEA (2002), “Energy Policies of IEA Countries,” 2002 Review, OECD/IEA. IEA (1995), “Energy Policies of the Russian Federation,” International Energy Agency, 1995 Survey, OECD/IEA.
Jensen, Jesper, Rutherford Thomas and Tarr David (2002), “Economy-Wide Effects of Russia’s Accession to the WTO,” Draft prepared for SIDA-CEFIR Conference on Negotiating Russia’s WTO Accession, Moscow, Russia, June 24-25, 2002. Kennedy, David (2002), “Liberalisation of the Russian power sector,” EBRD Working Paper No. 69. Kennedy, David (2003), “Power sector regulatory reform in transition economies: Progress and lessons learned,” EBRD Working Paper No. 78. Kennedy, David (2002), “Regulatory reform and market development in power sectors of transition economies: The case of Kazakhstan,” Energy Policy, 30, 219-233. McDougall, Robert (2003), “Russian Energy Taxes for GTAP 5.3,” CGTA Research Memorandum, March 2003. Available at http://www.agecon.purdue.edu/gtap. Riipinen, Toni (2003), “Energy market liberalisation in the FSU – Simulations with the GTAP model,” Bank of Finland Discussion Papers, No. 12. Roland, Gérard (2000), Transition and Economics: Politics, Markets and Firms, The MIT Press. Sulamaa, Pekka and Mika Widgren (2003), “EU Enlargement and Beyond: A Simulation Study on EU and CIS Integration,” CEPR Discussion Paper No. 3768. Tabata, Shinichiro (2002), “Russian Revenues from Oil and Gas Exports: Flow and Taxation,” Eurasian Geography and Economics, 42, No. 8, 610-627. Vaittinen, Risto (2003), “Liberalisation of Agricultural Trade – Global Implications and What It Means for the EU,” VATT Discussion Papers, No. 303. Wehrheim, Peter (2003), Modeling Russia’s Economy in Transition, Ashgate Publishers, Aldershot UK.
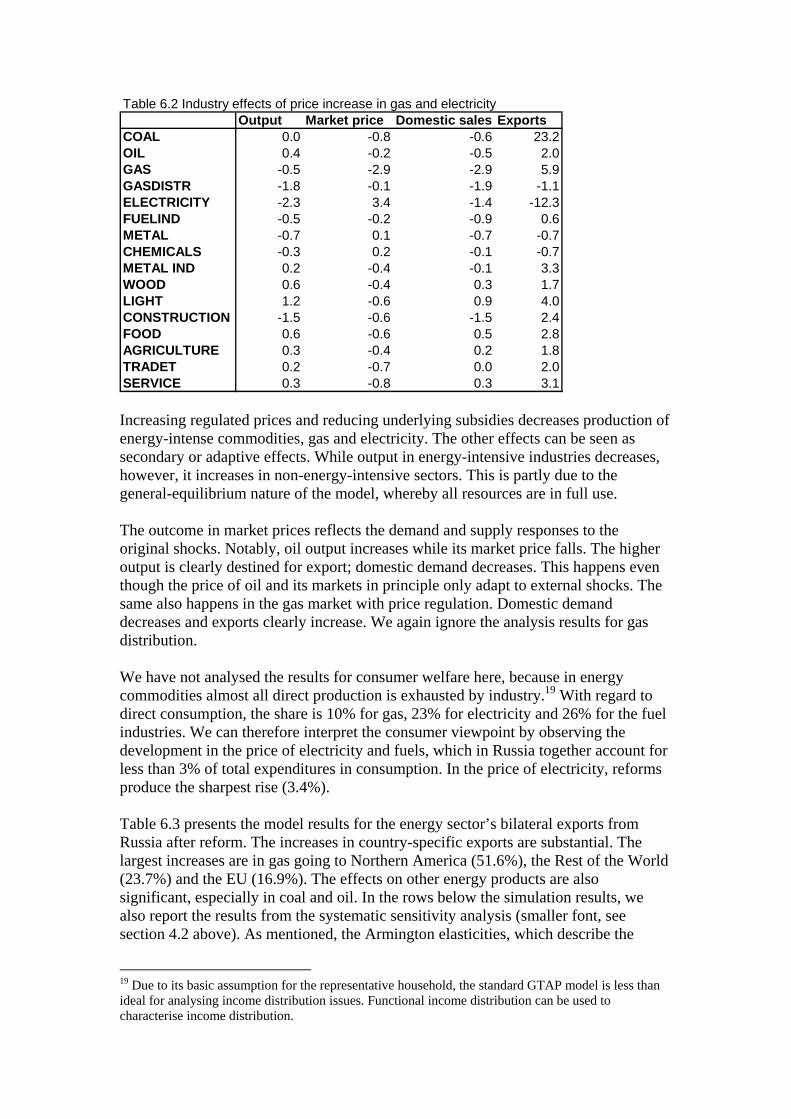
Appendices Appendix 1a. Regional aggregation in the study. Code Region Description 1 EU European Union Austria, Belgium, Denmark, Finland, France, Germany, United Kingdom,
Greece, Ireland, Italy, Luxembourg, Netherlands, Portugal, Spain, Sweden 2 EEA Eastern European
3 BALT Baltic countries Estonia, Latvia, Lithuania 4 RUS Russia Russian Federation 5 XSU Rest of Former Soviet
Union Rest of Former Soviet Union
6 NAM North America Canada, United States 7 ROW All other regions Australia, New Zealand, China, Hong Kong, Japan, Korea, Taiwan,
Indonesia, Malaysia, Philippines, Singapore, Thailand, Vietnam, Bangladesh, India, Sri Lanka, Rest of South Asia, Mexico, Central America, Caribbean, Colombia, Peru, Venezuela, Rest of Andean Pact, Argentina, Brazil, Chile, Uruguay, Rest of South America, Switzerland, Rest of European Free Trade Area, Cyprus, Turkey, Rest of Middle East, Morocco, Rest of North Africa, Botswana, Rest of South African Customs Union, Malawi, Mozambique, Tanzania, Zambia, Zimbabwe, Other Southern Africa, Uganda, Rest of Sub-Saharan Africa, Rest of World
Appendix 1b. Commodity aggregation in the study. Code Sector Description 1 COAL Coal 1 ELEC Electricity 2 OIL Oil 3 GAS Gas 4 GASDISTR Gas manufacture, distribution 5 FUELIND Petroleum, coal products 6 METAL Metals and minerals Minerals nec; Mineral products nec; Ferrous metals; Metals
nec 7 CHEMICALS Chemical, rubber, plastic products 8 MECHE Metal industry Metal products; Motor vehicles and parts; Transport
equipment nec; Machinery and equipment nec 9 WOOD Wood industry Forestry; Wood products; Paper products and publishing. 10 LIGHT Light manufacturing Textiles; Wearing apparel; Leather products; Electronic
equipment; Manufactures nec 11 CONSTRUCTION Construction 12 FOOD Meat (cattle, sheep, goats, horse); Meat products nec;
Vegetable oils and fats; Dairy products; Processed rice; Sugar; Food products nec; Beverages and tobacco products