+ All Categories
Home > Documents > Distressed Real Estate: Chapter 2 Real Estate.pdf · Appreciation Occurs Toward End of Recovery:...

Distressed Real Estate: Chapter 2 Real Estate.pdf · Appreciation Occurs Toward End of Recovery:...

Date post: 11-Apr-2020
Category:
Upload: others
View: 6 times
Download: 0 times
Share this document with a friend
15
#tmadic | eventmobi.com/dic13 #tmadic | eventmobi.com/dic13 Distressed Real Estate: Chapter 2 The next (and final?) phase… Matthew Bordwin, Moderator, GA Keen Realty Advisors Larry Grantham, Karlin Real Estate Jonathan Klein, Fortress Investment Group Jonathan Shenson, Shenson Law Group David Tobin, Mission Capital
Transcript

#tmadic | eventmobi.com/dic13 #tmadic | eventmobi.com/dic13

Distressed Real Estate:

Chapter 2

The next (and final?) phase…

Matthew Bordwin, Moderator, GA Keen Realty Advisors

Larry Grantham, Karlin Real Estate

Jonathan Klein, Fortress Investment Group

Jonathan Shenson, Shenson Law Group

David Tobin, Mission Capital

#tmadic | eventmobi.com/dic13

“Distressed Real Estate Chapter 2 - The next (and final?) phase...”

Now that the banks, servicers, advisors, and professionals have gone through four

years of workouts what lies ahead? Which geographic regions can see light at the

end of the tunnel and which ones still have danger looming ahead? This panel will

explore how the world has changed over the past four years – with insight from the

top minds in the real estate restructuring world. The panelists will touch on how deals

get completed in this phase of the cycle and how the capital markets views certain

situations and certain markets

• Market and supply of distressed deals

• Valuation of collateral

• Specific deal examples

• Big assets versus loan portfolios

Panel Overview

#tmadic | eventmobi.com/dic13

State of the Market – A Tepid Recovery

• CRE prices are stabilizing with modest gains over

2012

• 5.2% YoY returns

• Approaching 2007 highs

• Treasury rates remain low and are expected to

remain low for the foreseeable future

• Growth primarily found in gateway cities as

domestic and foreign investors continue to look

for Class-A properties with less volatile returns

• Europe remains a concern for many investors –

Europe officially in a recession as of 2Q12

• Goldman Sachs characterized Eurozone policy as

“incremental, reactive and inconsistent.”

Sovereign debt spreads have decreases but

underlying problems remain

10-Year US Treasury Yield

#tmadic | eventmobi.com/dic13

Economic Outlook

#tmadic | eventmobi.com/dic13

• Demand for CRE remains positive even as growth has slowed

• According to Reis Inc. office vacancy rate reported at 17.1 percent in

Q4 2012, down only 30 basis points YoY – Q4 job growth

approximately 453,000, down from 503,000 in Q3

• Asking and effective rents grew by .8 percent in Q4

• NREI expects industrial vacancy rates to decline from 10.1 percent in

4Q 2012 to 9.5 in 2013

– Lowest vacancy rates are in Orange County, California (4.3%);

Los Angeles (4.4%); and Miami (6.5%)

• NREI expects retail vacancy rates to decline from 10.8 percent in Q4

2012 to 10.6 percent in 4Q 2013

– Lowest vacancy rates found Sn Francico and Fairfiled County, Connecticut

(3.9%); Long Island, NY (5.1%; and Orange County, California (5.4%)

Overview – The CRE Market

#tmadic | eventmobi.com/dic13

FDIC Bank Closures

• Bank closures for 2012 totaled 51 – a 45% decrease from

2011

• Helped by fewer loan delinquencies

• Smaller community banks still being affected with assets

typically ranging from 100M – 1B

• FL, Palatka - Putnam State Bank -$37.4 million dollar

estimated FDIC cost.

• GA , Marietta -Security Exchange Bank -$34.3 million

dollar estimated FDIC DIF cost.

• TN , Lynchburg - Farmer's Bank of Lynchburg - $28.3

million dollar estimated FDIC DIF cost.

– FDIC Estimated cost significantly decreasing

• Bank failure costs are decreasing:

• 2011 ~ 7 billion

• 2012 ~ 2.5 billion

FDIC

#tmadic | eventmobi.com/dic13

• Trepp estimates the 1.73 trillion of commercial real estate debt

will come due between 2012 and 2016

• CMBS delinquency rate was unchanged from November to

December at 9.71% (projected to increase slightly in January

2013)

• CMBS delinquency rates appear to be stabilizing after a 6 month

period of increased delinquencies

– Trepp reporting CMBS delinquency rates in often troubled

Southern Florida region dropped to 8.2% in December from

9.4% in December 2011.

• What to look for: Seven year loans issued in 2007 mature in

2014

• Maturing loans still finding it difficult to refinance (tight credit

markets)

CMBS Delinquency Rates

Trepp December 2012 US CMBS Delinquency Report

#tmadic | eventmobi.com/dic13

CMBS Delinquency Rates by Property Type

Trepp December 2012 US CMBS Delinquency

Report

#tmadic | eventmobi.com/dic13

• CRE loan standards appear to be loosening

but dichotomy remains between gateway

cities and tertiary markets and then even

further between types of loans –

construction vs. Office and Multifamily,

(according to Federal Reserve’s 3Q12

Senior Loan Officer Opinion Survey)

• Improved fundamentals likely an

influencing factor: Commercial prices

increasing, unemployment creeping lower

• Banks finding lasting solutions to

distressed loans

• Between 2Q2011 and 2Q2012 78.5

percent of distress workouts were

resolutions

An End to Extend and Pretend?

Loan resolution vs. restructuring

#tmadic | eventmobi.com/dic13

Real Estate Loan Maturities

#tmadic | eventmobi.com/dic13 #tmadic | eventmobi.com/dic13

Secondary Market Overview

Commercial

Single Family Residential

Presented by David Tobin

Mission Capital Advisors

#tmadic | eventmobi.com/dic13

Collateral Market Backdrop Peak-to-Trough-to-Peak Valuation Cycle

/ Major-Minor Market Value Divergence

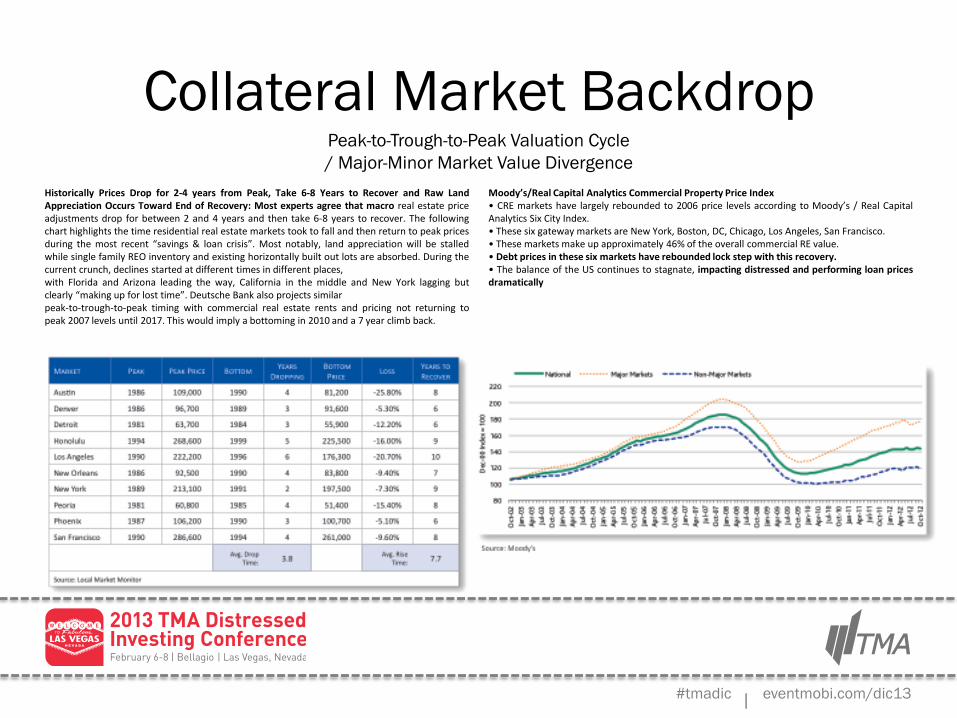
Historically Prices Drop for 2-4 years from Peak, Take 6-8 Years to Recover and Raw Land Appreciation Occurs Toward End of Recovery: Most experts agree that macro real estate price adjustments drop for between 2 and 4 years and then take 6-8 years to recover. The following chart highlights the time residential real estate markets took to fall and then return to peak prices during the most recent “savings & loan crisis”. Most notably, land appreciation will be stalled while single family REO inventory and existing horizontally built out lots are absorbed. During the current crunch, declines started at different times in different places, with Florida and Arizona leading the way, California in the middle and New York lagging but clearly “making up for lost time”. Deutsche Bank also projects similar peak-to-trough-to-peak timing with commercial real estate rents and pricing not returning to peak 2007 levels until 2017. This would imply a bottoming in 2010 and a 7 year climb back.

Moody’s/Real Capital Analytics Commercial Property Price Index • CRE markets have largely rebounded to 2006 price levels according to Moody’s / Real Capital Analytics Six City Index. • These six gateway markets are New York, Boston, DC, Chicago, Los Angeles, San Francisco. • These markets make up approximately 46% of the overall commercial RE value. • Debt prices in these six markets have rebounded lock step with this recovery. • The balance of the US continues to stagnate, impacting distressed and performing loan prices dramatically

#tmadic | eventmobi.com/dic13

Loan Sale Versus REO Sale NPV Analysis Generally Favors Loan Sales

Loan Sales allow Banks and Special Servicers the opportunity to generate the best NPV for performing or distressed assets, focus on new business and better allocate special asset resources. The advantages of this process include:

• Financing Still Challenging: Financing markets for the sale of small commercial properties sold

following foreclosure are still thin.

• Broader Universe of Buyers: A real estate broker may actively market a property to a select group of investors in a specific market or region but a Loan Sale accesses both local and nationally focused institutional investors with (a) a cheaper cost of funds and (b) lower yield hurdles.

• Competitive Due Diligence Process Ensures Fixed Timeline and Minimal Retrade Risk: REO sale standard practice is to market a property for a 30-90 day period, “pick a horse” and allow a 30-45 day due diligence period, leaving the seller susceptible to both “retrade” and financing risk. The loan sale process requires bidders to perform all due diligence in competition with multiple other bidders and close. In the current market environment having multiple investors complete final due diligence on a competitive basis, ensuring there are multiple, ready to close final bids, is essential to a successful sale on an expedited timeline. Delays caused by failed negotiated deals can materially impact assets with deteriorating collateral condition.

• Minimal Discounts for Loans Versus REO: Today’s sophisticated investor does not generally discount the cost to foreclose any further than a Seller’s expected cost.

• Better Pricing/Less Property Value Decline: According to Fitch Ratings, loan sales result in a higher net present value for the seller than many resolution strategies:

#tmadic | eventmobi.com/dic13

Overview of Recent & Historical Commercial Loan Sales

The 2012 loan sale market fell short of 2011 by a material measure. The following is an overview of commercial transactions as measured by CRENews.com and Mission Capital.

• Based on year-to-date sales, aggregate volume is projected to be between $20.24 billion came in at the low end of Mission Capital’s $20 billion to $25 billion 2012 projection.

• While this figure is below that of 2011, it should be noted that approximately $11.1 billion of sales emanated in 2011 from Ireland (Anglo Irish, Bank of Ireland), which would be considered a one time event.

• A dramatic increase in the number of transactions suggests a migration by banks to selling smaller-balance assets.

#tmadic | eventmobi.com/dic13

Securitization An Exit Strategy or a Joint Venture?

• Low rates and a revival in bank lending are helping to revive the securitization market for credit impacted and non-performing loans.

• Nonperforming loans don’t generally qualify as mortgages under federal Remic guidelines, so a “grantor trust” structure is used instead, resulting in a single-traunche deals.

• According to Commercial Mortgage Alert, $3 billion to $4 billion of issuance could come to market based on what has traded over the past several years.

• JP Morgan actively shopping the product to investors who routinely purchase non-performing loans.

• Mission views NPL securitizations as a financing vehicle that will drive pricing because investors can re-use capital and make better leveraged returns.

• Best not to “buy into it” but rather “sell into it”: let multiple investors, using this product, compete to buy loans versus entering into a JV with only one.


Recommended