Page 1
Distributed aperture synthesis
David Rabb*, Douglas Jameson, Andrew Stokes, and Jason Stafford
Air Force Research Laboratory – Sensors Directorate, AFRL/RYJM B622, 3109 Hobson Way, WPAFB, OH, 45433-
7700, USA
*[email protected]
Abstract: Distributed aperture synthesis is an exciting technique for
recovering high-resolution images from an array of small telescopes. Such a
system requires optical field values measured at individual apertures to be
phased together so that a single, high-resolution image can be synthesized.
This paper describes the application of sharpness metrics to the process of
phasing multiple coherent imaging systems into a single high-resolution
system. Furthermore, this paper will discuss hardware and present the
results of simulations and experiments which will illustrate how aperture
synthesis is performed.
OCIS codes: (090.1995) Digital Holography; (100.3010) Image Reconstruction Techniques.
References and links
1. J. C. Marron, and R. L. Kendrick, “Distributed Aperture Active Imaging,” Proc. SPIE 6550, 65500A (2007).
2. R. A. Muller, and A. Buffington, “Real-time correction of atmospherically degraded telescope images through
image sharpening,” J. Opt. Soc. Am. 64(9), 1200–1210 (1974).
3. J. R. Fienup, and J. J. Miller, “Aberration correction by maximizing generalized sharpness metrics,” J. Opt. Soc.
Am. A 20(4), 609–619 (2003).
4. R. L. Kendrick, and J. C. Marron, “Analytic Versus Adaptive Image Formation Using Optical Phased Arrays,”
Proc. SPIE 7468, 75680N (2009).
5. N. J. Miller, M. P. Dierking, and B. D. Duncan, “Optical sparse aperture imaging,” Appl. Opt. 46(23), 5933–
5943 (2007).
6. Q. Wu, L. Qian and W. Shen, “Image Recovering for Sparse-aperture Systems,” Proc. SPIE 5642, 478–486
(2005).
7. R. G. Paxman, and J. C. Marron, “Aberration Correction of Speckled Imagery with an Image Sharpness
Criterion,” Statistical Optics,” Proc. SPIE 976, 37–47 (1988).
8. S. T. Thurman, and J. R. Fienup, “Phase-error correction in digital holography,” J. Opt. Soc. Am. A 25(4), 983–
994 (2008).
9. J. C. Marron, R. L. Kendrick, N. Seldomridge, T. D. Grow, and T. A. Höft, “Atmospheric turbulence correction
using digital holographic detection: experimental results,” Opt. Express 17(14), 11638–11651 (2009).
1. Introduction
Coherent aperture synthesis is driven by a need for both high resolution imagery and small
sensor form-factors. These systems seek to replace large, monolithic optical apertures with
arrays of smaller sub-apertures as shown in Fig. 1.
Fig. 1. Aperture synthesis initially allows large monolithic apertures, (a), to be replaced with
dense-packed distributed arrays, (b). Over time, the array patterns will become sparser and
system depth can be minimized by utilizing pupil-plane imaging techniques, (c).
#124416 - $15.00 USD Received 18 Feb 2010; revised 14 Apr 2010; accepted 19 Apr 2010; published 4 May 2010(C) 2010 OSA 10 May 2010 / Vol. 18, No. 10 / OPTICS EXPRESS 10334
Page 2
Initially, a densely-packed array of sub- apertures can provide significant savings in system
volume by reducing the required focal length of the individual telescopes. Future systems
may further expand this technique and combine sparse arrays with conformal aperture
technology.
The architecture of coherent aperture synthesis, like most imaging systems, can be broken
down into hardware and software elements. However, unlike traditional imaging systems,
aperture synthesis relies heavily upon software algorithms to form a single high-resolution
image from the output of each of the sub-apertures. An illustration of an aperture synthesis
system is shown in Fig. 2. In this system, a laser is used as master oscillator and is the source
for the transmitter and for the local oscillator, LO, for each receiver. The transmitter
subsystem (TX) is used to flood illuminate the target, at right, with coherent laser light. The
receiver subsystems (RX1-3) record the holographic fringes created from the mixing of the
LO with the backscattered return from the target. The intensity values of the fringes are
passed on to the CPU, where the amplitude and phase of the backscattered field are recovered
for multiple coherent apertures using a Fast Fourier Transform (FFT).
Fig. 2. Illustration of coherent aperture synthesis architecture. The hardware consists of a
transmitter Tx, coherent receivers Rx1-Rx3 which capture holographic fringes across a camera
array, and a computer which forms images in software.
The hardware from Fig. 2 may utilize digital holography in the same manner as the
systems described by Marron and Kendrick [1]. Each of the field measurements is used to
populate a digital pupil plane, in which a series of algorithms is used to sharpen the image
produced by each sub-aperture, register their imagery and then simultaneously sharpen across
multiple sub-apertures. The former steps are sometimes referred to as “phasing” the apertures
and often utilize image sharpness metrics [2–4]. If speckle is ignored the imagery which
results from an ideal set of algorithms will have a resolution determined by the array
geometry [5,6].
Sharpening synthesized imagery is a difficult task due to the presence of speckle and poor
image SNR [7]. In particular, the inter-aperture piston sharpening algorithms are highly
sensitive to speckle noise, due to the piston largely affecting higher spatial frequencies where
speckle content may dominate image content. In this paper we will describe how image
sharpness metrics that incorporate speckle averaging are used to synthesize the field captured
at multiple apertures into a single high-resolution image.
2. Theory
2.1 Hardware
The hardware presented here utilizes digital holography to measure the backscattered target
field, as shown in Fig. 3. An afocal telescope is used to increase the relative size of the
aperture in order to capture more of the target’s angular spectrum as well as signal photons. A
tilted LO is introduced via a beam splitter and serves to separate reconstructed images from
#124416 - $15.00 USD Received 18 Feb 2010; revised 14 Apr 2010; accepted 19 Apr 2010; published 4 May 2010(C) 2010 OSA 10 May 2010 / Vol. 18, No. 10 / OPTICS EXPRESS 10335
Page 3
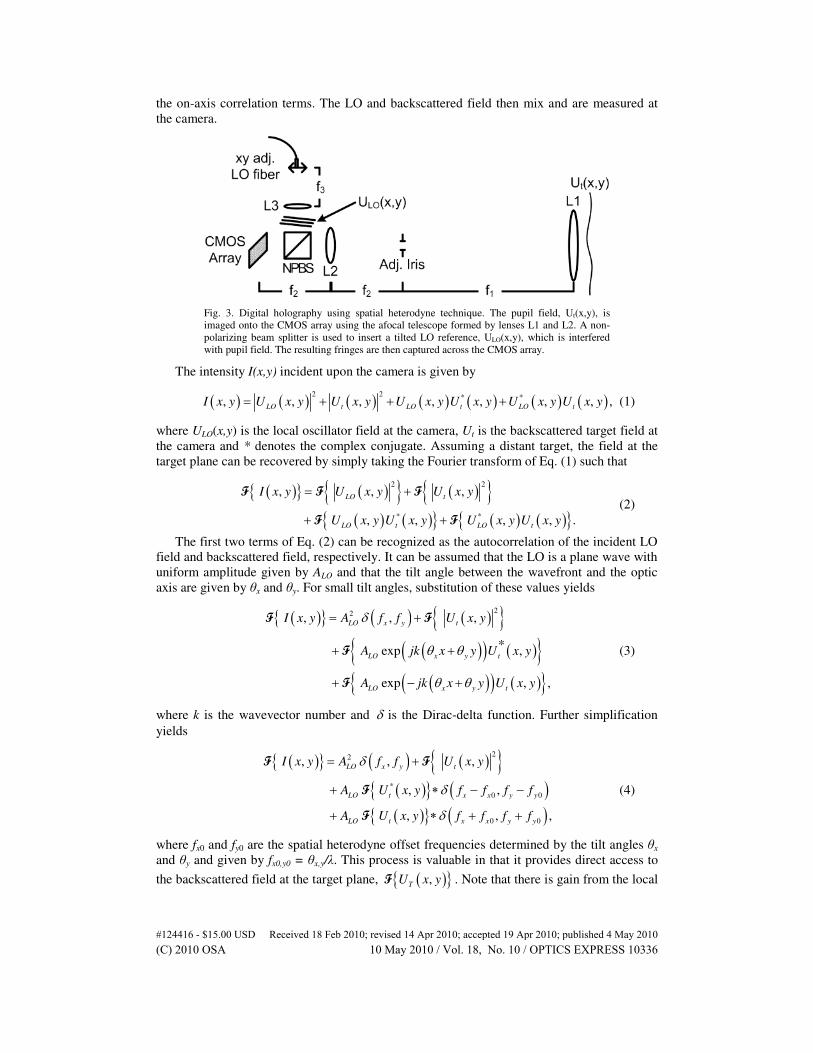
the on-axis correlation terms. The LO and backscattered field then mix and are measured at
the camera.
Fig. 3. Digital holography using spatial heterodyne technique. The pupil field, Ut(x,y), is
imaged onto the CMOS array using the afocal telescope formed by lenses L1 and L2. A non-
polarizing beam splitter is used to insert a tilted LO reference, ULO(x,y), which is interfered
with pupil field. The resulting fringes are then captured across the CMOS array.
The intensity I(x,y) incident upon the camera is given by
( ) ( ) ( ) ( ) ( ) ( ) ( )2 2 * *
, , , , , , , ,LO t LO t LO tI x y U x y U x y U x y U x y U x y U x y= + + + (1)
where ULO(x,y) is the local oscillator field at the camera, Ut is the backscattered target field at
the camera and * denotes the complex conjugate. Assuming a distant target, the field at the
target plane can be recovered by simply taking the Fourier transform of Eq. (1) such that
( ){ } ( ){ } ( ){ }
( ) ( ){ } ( ) ( ){ }
2 2
* *
, , ,
, , , , .
LO t
LO t LO t
I x y U x y U x y
U x y U x y U x y U x y
= +
+ +
F F F
F F
(2)
The first two terms of Eq. (2) can be recognized as the autocorrelation of the incident LO
field and backscattered field, respectively. It can be assumed that the LO is a plane wave with
uniform amplitude given by ALO and that the tilt angle between the wavefront and the optic
axis are given by θx and θy. For small tilt angles, substitution of these values yields
( ){ } ( ) ( ){ }( )( ) ( ){ }( )( ) ( ){ }
22, , ,
*exp ,
exp , ,
LO x y t
LO x y t
LO x y t
I x y A f f U x y
A jk x y U x y
A jk x y U x y
δ
θ θ
θ θ
= +
+ +
+ − +
F F
F
F
(3)
where k is the wavevector number and δ is the Dirac-delta function. Further simplification
yields
( ){ } ( ) ( ){ }( ){ } ( )( ){ } ( )
22
*
0 0
0 0
, , ,
, ,
, , ,
LO x y t
LO t x x y y
LO t x x y y
I x y A f f U x y
A U x y f f f f
A U x y f f f f
δ
δ
δ
= +
+ ∗ − −
+ ∗ + +
F F
F
F
(4)
where fx0 and fy0 are the spatial heterodyne offset frequencies determined by the tilt angles θx
and θy and given by fx0,y0 = θx,y/λ. This process is valuable in that it provides direct access to
the backscattered field at the target plane, ( ){ },TU x yF . Note that there is gain from the local
#124416 - $15.00 USD Received 18 Feb 2010; revised 14 Apr 2010; accepted 19 Apr 2010; published 4 May 2010(C) 2010 OSA 10 May 2010 / Vol. 18, No. 10 / OPTICS EXPRESS 10336
Page 4
oscillator present in the recovered image which is proportional to ALO, such that the
reconstructed image is stronger than the non-localized backscattered field autocorrelation
term.
2.2 Processing
The theory which drives the image synthesis algorithms relies on the fifth image sharpness
metric S described by Muller and Buffington as
( ), ,S I x y dxdyγ= ∫ (5)
where I(x,y) is the image intensity and the power term γ is defined so that γ > 2 [2]. The work
is later expanded into coherent imaging while attributing small γ values to enhancing the
darker pixels and larger values of γ to enhancing the brighter pixels [3,8]. Marron et al. apply
sharpness metrics to correct atmospheric aberrations through a single telescope utilizing pupil
plane architecture [9]. The current research applies these same techniques to coherent image
synthesis where multiple, corrected pupil fields have been recovered, but the relative phase
between the captured fields is unknown.
Unfortunately, speckle is present throughout the imaging process due to the surface
roughness of realistic targets. Speckle interferes with the ability of the sharpness metric to
accurately describe the synthesized images, especially when iterating on piston errors
between the apertures. The algorithm used to apply the sharpness metric to the captured
imagery must be improved to allow for speckle averaging so that the sharpness metric can be
applied to the speckle-averaged image. An algorithm containing two major steps is proposed.
The first step will sharpen the imagery taken at the individual apertures while the second step
will sharpen the synthesized imagery.
The first step of the improved algorithm operates on the imagery captured at the
individual sub-aperture. This step is largely an implementation of the work described by
Thurman and Fienup [8]. It is assumed here that field values are captured simultaneously at
the individual apertures and that speckle realizations are independent between sequential data
collects. The output from each of the sub-apertures is averaged across the total number of
speckle realizations to create an initial version of the speckle-averaged, single-aperture image.
The image sharpness metric of the incoherent speckle average SA can be written as
( )1
1, ,
N
A n
n
S dxdy I x yN
γ
=
= ∑∫ (6)
where N is the number of speckle realizations, n denotes an individual speckle realization and
In(x,y) is the target image intensity for realization n. At this point the algorithm focuses on
correcting the averaged sub-aperture pupil plane data by correcting the phase of the individual
pupil realizations using Zernike polynomials. The algorithm corrects an individual telescope
realization so that the final, averaged image reaches maximum sharpness and then iterates to
the next realization. This process is illustrated in Fig. 4. The algorithm will result in N
corrected pupil field values at each sub-aperture.
#124416 - $15.00 USD Received 18 Feb 2010; revised 14 Apr 2010; accepted 19 Apr 2010; published 4 May 2010(C) 2010 OSA 10 May 2010 / Vol. 18, No. 10 / OPTICS EXPRESS 10337
Page 5
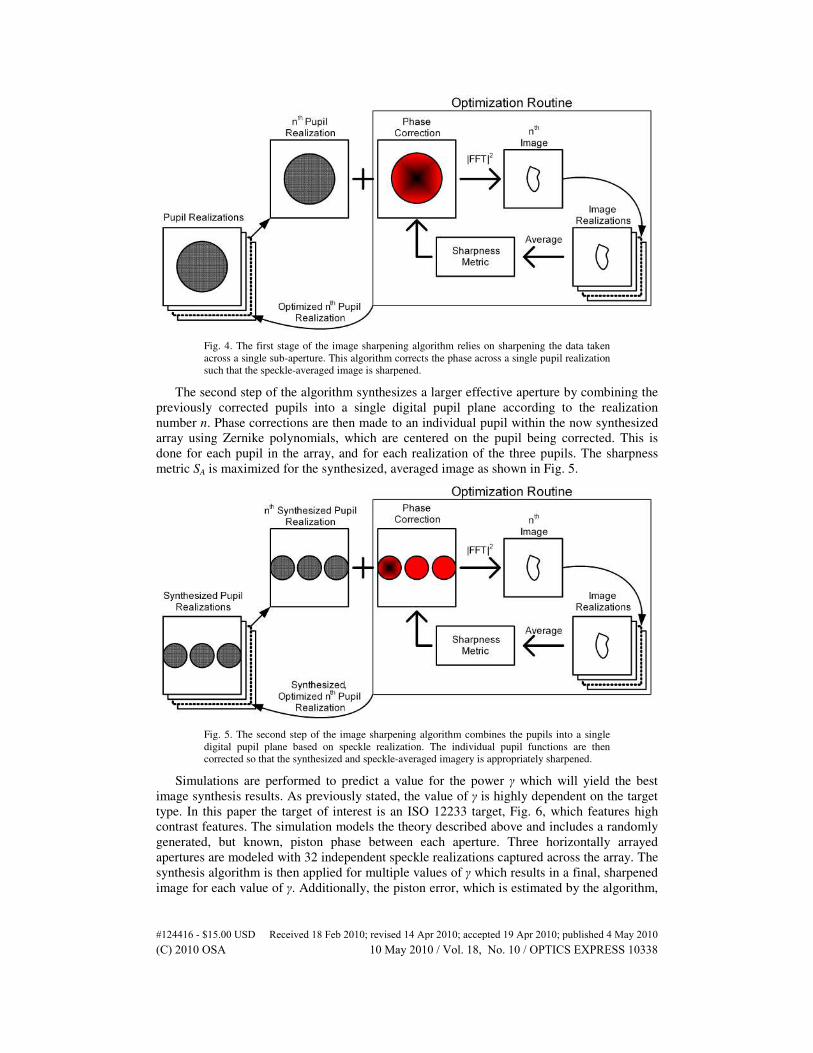
Fig. 4. The first stage of the image sharpening algorithm relies on sharpening the data taken
across a single sub-aperture. This algorithm corrects the phase across a single pupil realization
such that the speckle-averaged image is sharpened.
The second step of the algorithm synthesizes a larger effective aperture by combining the
previously corrected pupils into a single digital pupil plane according to the realization
number n. Phase corrections are then made to an individual pupil within the now synthesized
array using Zernike polynomials, which are centered on the pupil being corrected. This is
done for each pupil in the array, and for each realization of the three pupils. The sharpness
metric SA is maximized for the synthesized, averaged image as shown in Fig. 5.
Fig. 5. The second step of the image sharpening algorithm combines the pupils into a single
digital pupil plane based on speckle realization. The individual pupil functions are then
corrected so that the synthesized and speckle-averaged imagery is appropriately sharpened.
Simulations are performed to predict a value for the power γ which will yield the best
image synthesis results. As previously stated, the value of γ is highly dependent on the target
type. In this paper the target of interest is an ISO 12233 target, Fig. 6, which features high
contrast features. The simulation models the theory described above and includes a randomly
generated, but known, piston phase between each aperture. Three horizontally arrayed
apertures are modeled with 32 independent speckle realizations captured across the array. The
synthesis algorithm is then applied for multiple values of γ which results in a final, sharpened
image for each value of γ. Additionally, the piston error, which is estimated by the algorithm,
#124416 - $15.00 USD Received 18 Feb 2010; revised 14 Apr 2010; accepted 19 Apr 2010; published 4 May 2010(C) 2010 OSA 10 May 2010 / Vol. 18, No. 10 / OPTICS EXPRESS 10338
Page 6
is captured and compared to the original known piston error for each value of γ. This process
is repeated for 64 random piston realizations and the RMS error between the known piston
error and the synthesis algorithm’s predicted error is shown as a function of γ in Fig. 7.
Fig. 6. A portion of the ISO 12233 Target.
It can be seen in Fig. 7 that the RMS error in estimated piston reaches a minimum when
0.4 ≤ γ ≤ 0.5. This would tend to hold for generally bright images with high-contrast as is the
case with the ISO 12233 target shown in Fig. 6. Recall that Thurman and Fienup showed that
sharpness metrics less than 1 tend to make dark points darker and the ISO target is composed
of dark lines on a white background. For a different type of target the optimal value of γ used
for phasing may be different. Note that the dots in Fig. 7 are from the numerical simulation
and the solid line represents a fourth degree polynomial fit.
Fig. 7. The average RMS piston error for values of 0.025 ≤ γ ≤ 2 from simulated results are
shown as dots and the solid line represents a fourth degree polynomial fit.
3. Experiment
An experiment was designed to validate the predicted performance for the sharpness
algorithm described above. The experiment will show that the synthesis algorithm can
achieve improved resolutions based on the synthesized array geometry. The aperture
synthesis experiment consists of three afocal telescope systems, each with the same
configuration as seen in Fig. 3, which are arrayed horizontally. The horizontal aperture
pattern is chosen to maximize the synthesized resolution in the horizontal dimension while
maintaining sub-aperture limited resolution in the vertical dimension.
#124416 - $15.00 USD Received 18 Feb 2010; revised 14 Apr 2010; accepted 19 Apr 2010; published 4 May 2010(C) 2010 OSA 10 May 2010 / Vol. 18, No. 10 / OPTICS EXPRESS 10339
Page 7
3.1 Hardware
The laser source used in this experiment is a HeNe laser operating at the traditional 632.8 nm
line. The HeNe is fiber-coupled to a large area single mode fiber which is connected to a 95/5
fiber splitter which splits the power into transmit and LO paths, respectively. The transmitter
path illuminates the target using a bistatic architecture while the LO path is split into three
channels which are used to provide the tilted LO at each of the sub-apertures.
The aperture synthesis experiment consists of three horizontally arrayed receivers of the
type shown in Fig. 3. The cameras are Lumenera LU120M models, which are based on a
CMOS sensor and have 6.7 µm square pixels in a 1280x1024 format. This small pixel pitch,
while useful in a standard imaging situation, yields a relatively large effective FOV when
imaging the pupil plane. In other words, the pixel pitch allows the system to resolve high
frequency fringes that result from the interference of the LO and fields which are captured
from the edge of target space. An adjustable aperture stop located at the common focus of the
afocal telescope can be used to limit the FOV to an area of interest. The afocal telescope is
designed with a two-inch front lens and system magnification of 8X to ensure that the
entrance pupil of the telescope is imaged onto the CMOS array without vignetting. The sub-
aperture entrance pupil clear aperture is approximately 4.83 cm.
The target in this experiment is composed of a transmissive ISO 12233 chart with chrome
on glass. A diffuser was placed immediately behind the target such that when illuminated it
created a fully realized speckle pattern. The target was placed 10 meters from the imaging
optics and the diffuser was slightly rotated between frames to create multiple speckle
realizations.
3.2 Processing and results
The field is captured at each aperture through the use of the digital holography hardware
described in section 2.1. The field values captured at the individual apertures are corrected
utilizing the methods as described in the first step of our synthesis algorithm. This yields a
sets of three pupil fields for a particular instance of speckle. Multiple field values, with
independent instances of speckle, are collected to assist the algorithm by reducing speckle
noise. Results comparing an aberration-corrected, single-aperture image with 360 speckle
realizations to the same data using three coherently combined sub-apertures are shown in Fig.
8. The first step yields corrected single-aperture imagery which is averaged across 360
speckle realizations and shown in Fig. 8(b). The second step of the algorithm yields corrected
imagery from the coherently synthesized array of sub-apertures described as shown in Fig.
8(d). The theoretical image results of a single aperture with speckle noise equivalent to 360
speckle realizations and three coherently-combined apertures with speckle noise equivalent to
120 speckle realizations are shown in Fig. 8(a) and Fig. 8(c), respectively. Note that the
coherent synthesis is performed across a horizontal array of three apertures which yields a
resolution gain in only the horizontal direction as evident in Fig. 8(c) and Fig. 8(d).
#124416 - $15.00 USD Received 18 Feb 2010; revised 14 Apr 2010; accepted 19 Apr 2010; published 4 May 2010(C) 2010 OSA 10 May 2010 / Vol. 18, No. 10 / OPTICS EXPRESS 10340
Page 8
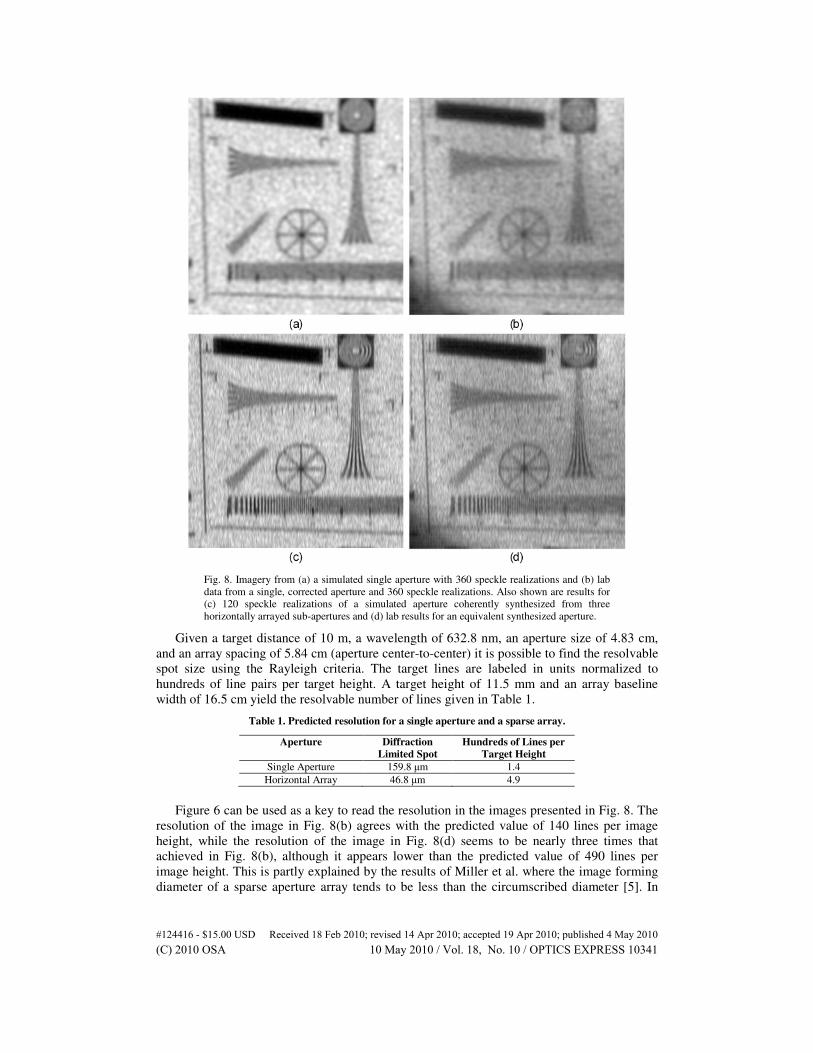
Fig. 8. Imagery from (a) a simulated single aperture with 360 speckle realizations and (b) lab
data from a single, corrected aperture and 360 speckle realizations. Also shown are results for
(c) 120 speckle realizations of a simulated aperture coherently synthesized from three
horizontally arrayed sub-apertures and (d) lab results for an equivalent synthesized aperture.
Given a target distance of 10 m, a wavelength of 632.8 nm, an aperture size of 4.83 cm,
and an array spacing of 5.84 cm (aperture center-to-center) it is possible to find the resolvable
spot size using the Rayleigh criteria. The target lines are labeled in units normalized to
hundreds of line pairs per target height. A target height of 11.5 mm and an array baseline
width of 16.5 cm yield the resolvable number of lines given in Table 1.
Table 1. Predicted resolution for a single aperture and a sparse array.
Aperture Diffraction
Limited Spot Hundreds of Lines per
Target Height Single Aperture 159.8 µm 1.4
Horizontal Array 46.8 µm 4.9
Figure 6 can be used as a key to read the resolution in the images presented in Fig. 8. The
resolution of the image in Fig. 8(b) agrees with the predicted value of 140 lines per image
height, while the resolution of the image in Fig. 8(d) seems to be nearly three times that
achieved in Fig. 8(b), although it appears lower than the predicted value of 490 lines per
image height. This is partly explained by the results of Miller et al. where the image forming
diameter of a sparse aperture array tends to be less than the circumscribed diameter [5]. In
#124416 - $15.00 USD Received 18 Feb 2010; revised 14 Apr 2010; accepted 19 Apr 2010; published 4 May 2010(C) 2010 OSA 10 May 2010 / Vol. 18, No. 10 / OPTICS EXPRESS 10341
Page 9
this case, long spatial frequency baselines across the imaging pupil are sampled less
frequently and thus have a greater susceptibility to noise.
4. Conclusions
Coherent aperture synthesis is a technique which promises to enable the use of smaller sub-
aperture systems to collect high-resolution images, significantly reducing the overall volume
of traditional monolithic aperture systems. Such systems can combine the use of traditional
hardware components and newly-developed software algorithms which utilize image
sharpness metrics to synthesize a large aperture via spatial heterodyne techniques.
An overview of the hardware was presented, including the utilization of an off-axis local
oscillator beam which allows for direct access to the return signal when using a digital
holography setup. Image sharpening algorithms were modified to include speckle averaging
because the presence of speckle greatly affects the convergence of the sharpening algorithms,
in particular when considering piston phase error between sub-apertures. Then, a numerical
simulation of the image sharpness metric power coefficient was performed as a function of
RMS piston phase error, which yielded a minimum error when 0.4 ≤ γ ≤ 0.5.
An experiment comprised of three horizontally arrayed afocal telescopes, each with its
own camera and local oscillator, was performed. Images were taken of an ISO 12233 target
with a diffuse scatter immediately behind it. Examples of the speckle-averaged, single-
aperture image, the three-aperture, coherently-synthesized image and a corresponding
theoretical image were presented and their resolution was evaluated. The aberration-
corrected, incoherently combined image matched its predicted 140 lines per target height of
resolution. The coherently combined image yielded an increase of resolution nearly 3X that of
the incoherent image, but had slightly lower resolution than the predicted 490 lines per target
height of resolution. This was attributed, in part, to theoretical system resolution being
defined by the noise cutoff in the MTF rather than the circumscribed array diameter.
Acknowledgments
The authors would like to thank Matt Dierking, Larry Barnes, and John Schmoll for technical
assistance.
#124416 - $15.00 USD Received 18 Feb 2010; revised 14 Apr 2010; accepted 19 Apr 2010; published 4 May 2010(C) 2010 OSA 10 May 2010 / Vol. 18, No. 10 / OPTICS EXPRESS 10342