A series of reinforcement bar and reinforced concrete specimens were instrumented with fiber optic cables to measure distributed strain profiles along the specimens. The strain due to shrinkage was measured at 3, 7, 21, and 28 days in three specimens to deter-mine the shrinkage strain profile. Reinforcement and reinforced concrete specimens were tested in axial tension and the distributed strain measurements enabled the tension stiffening effect in the reinforced concrete members to be quantified. Due to variations in the development of cracks, measurements on both sides of the rein-forcement bar were required to obtain the average strain behavior. The shrinkage strain measurements were also critical in terms of calculating the effect of tension stiffening. The average distributed strain measurements were compared to a proposed tension stiff-ening model and overall good agreement was seen, although the cracking load was often overestimated by the model.
INTRODUCTIONThe design and assessment of reinforced concrete struc-
tures is becoming an increasingly complex task due to the use of more complicated structural forms for new structures and deterioration of older structures. To perform accurate struc-tural evaluations of these structures, finite element models are often required, which in turn require accurate material models so that stiffness and load distribution can be deter-mined. Two aspects of reinforced concrete material behavior that can be difficult to measure and thus model accurately are tension stiffening and shrinkage. If a technology could be developed that allowed this behavior to be measured practi-cally in the field, structures could be designed and assessed less conservatively leading to reductions in material use and extended service lives.
Traditionally, shrinkage strain is measured using concrete specimens that are exposed to controlled climate conditions (ASTM C157/C157M 2014). The 100 x 100 x 285 mm (3.94 x 3.94 x 11.22 in.) specimens are measured using a compar-ator and the total change in length is reported as a percent shrinkage. However, these measurements are made on unre-inforced specimens that are not exposed to the varying condi-tions that the actual structure is. Additionally, because it is an overall measurement, it is not possible to determine if there are any localized changes in shrinkage behavior. Kim and Lee (1998) measured shrinkage strain using strain gauges embedded in the concrete at various depths and found that for thick specimens, non-uniform shrinkage could lead to surface cracks and thus should be accounted for in design. However, conventional strain gauges require wires for each
individual sensor and are also limited by individual sensor costs and data acquisition limitations.
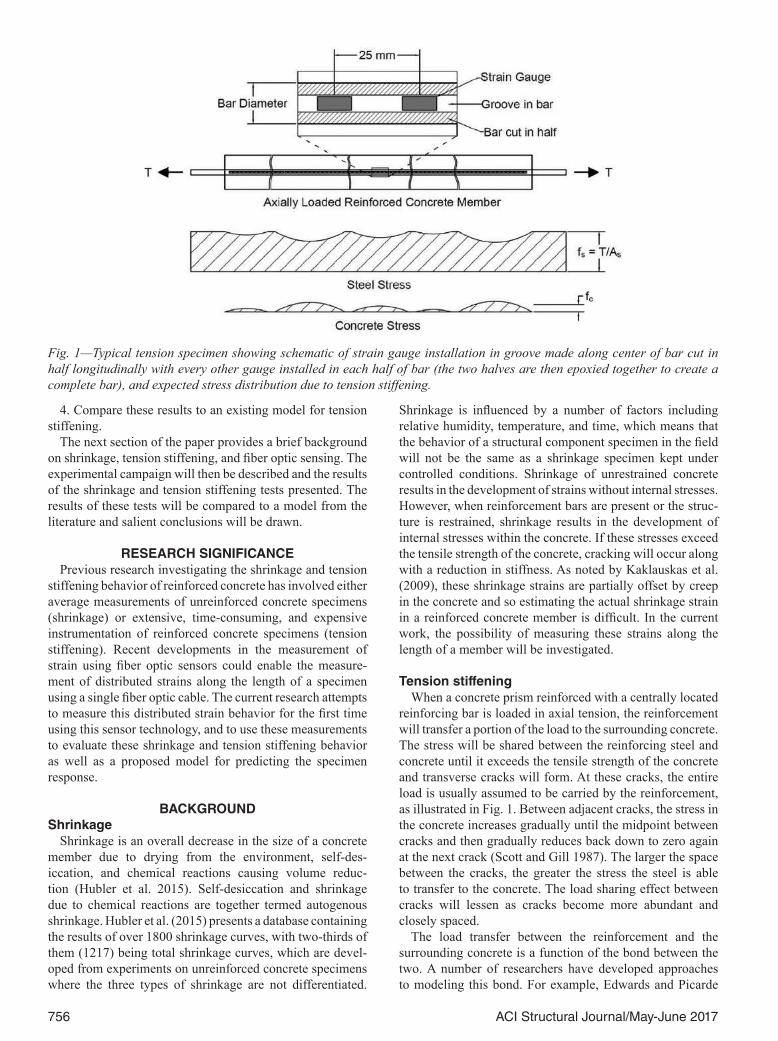
The tension stiffening behavior of reinforced concrete elements has been measured by a number of researchers. For example, Scott and Gill (1987) performed a series of tension tests on reinforced concrete specimens with a single reinforcement bar that was instrumented with conventional strain gauges. To install the strain gauges, they milled two reinforcement bars down to create two half-moon shaped bars. They then milled a groove into the center of each bar and affixed 84 strain gauges along the length of the two half-bars within the grooves, as illustrated in Fig. 1. The two halves of the bar were then glued together to form one bar for the specimens. Although this technique eliminated the potential debonding issues associated with having strain gauge wires running along the surface of the bar, it was nevertheless time consuming and expensive to instrument each bar for the tests. However, the data from each specimen did enable them to determine the strain in the reinforce-ment when cracks developed, as well as the bond behavior between the bar and surrounding concrete. This technique would be useful for evaluating the behavior of lab specimens and complex reinforced concrete structures but comes at too high a cost, both in terms of time and money, for it to be used for parametric lab studies or in the field.
Distributed fiber optic sensors (FOS) overcome the issues associated with conventional strain gauges while offering the potential to measure shrinkage and tension stiffening effects in both the lab and the field. FOS technologies based on measuring Rayleigh backscatter offer high strain resolu-tion (approximately 1 microstrain) over short gauge lengths (less than 1 mm [0.04 in.]) (Kreger et al. 2007). However, until now, they have not been used to monitor the shrinkage and tension stiffening behavior of reinforced concrete. Thus, an investigation was undertaken to:
1. Develop a method for measuring restrained shrinkage strains using distributed FOS;
2. Determine the variability in shrinkage strain over the length of a reinforced concrete element;
3. Measure the distributed reinforcement strain for a rein-forced concrete element loaded in tension and correct these results for shrinkage; and
Title No. 114-S61
Distributed Sensing for Shrinkage and Tension Stiffening Measurementby Matthew B. Davis, Neil A. Hoult, Sanchit Bajaj, and Evan C. Bentz
ACI Structural Journal, V. 114, No. 3, May-June 2017.MS No. S-2016-237, doi: 10.14359/51689463, received June 18, 2016, and reviewed
4. Compare these results to an existing model for tension stiffening.
The next section of the paper provides a brief background on shrinkage, tension stiffening, and fiber optic sensing. The experimental campaign will then be described and the results of the shrinkage and tension stiffening tests presented. The results of these tests will be compared to a model from the literature and salient conclusions will be drawn.
RESEARCH SIGNIFICANCEPrevious research investigating the shrinkage and tension
stiffening behavior of reinforced concrete has involved either average measurements of unreinforced concrete specimens (shrinkage) or extensive, time-consuming, and expensive instrumentation of reinforced concrete specimens (tension stiffening). Recent developments in the measurement of strain using fiber optic sensors could enable the measure-ment of distributed strains along the length of a specimen using a single fiber optic cable. The current research attempts to measure this distributed strain behavior for the first time using this sensor technology, and to use these measurements to evaluate these shrinkage and tension stiffening behavior as well as a proposed model for predicting the specimen response.
BACKGROUNDShrinkage
Shrinkage is an overall decrease in the size of a concrete member due to drying from the environment, self-des-iccation, and chemical reactions causing volume reduc-tion (Hubler et al. 2015). Self-desiccation and shrinkage due to chemical reactions are together termed autogenous shrinkage. Hubler et al. (2015) presents a database containing the results of over 1800 shrinkage curves, with two-thirds of them (1217) being total shrinkage curves, which are devel-oped from experiments on unreinforced concrete specimens where the three types of shrinkage are not differentiated.
Shrinkage is influenced by a number of factors including relative humidity, temperature, and time, which means that the behavior of a structural component specimen in the field will not be the same as a shrinkage specimen kept under controlled conditions. Shrinkage of unrestrained concrete results in the development of strains without internal stresses. However, when reinforcement bars are present or the struc-ture is restrained, shrinkage results in the development of internal stresses within the concrete. If these stresses exceed the tensile strength of the concrete, cracking will occur along with a reduction in stiffness. As noted by Kaklauskas et al. (2009), these shrinkage strains are partially offset by creep in the concrete and so estimating the actual shrinkage strain in a reinforced concrete member is difficult. In the current work, the possibility of measuring these strains along the length of a member will be investigated.
Tension stiffeningWhen a concrete prism reinforced with a centrally located
reinforcing bar is loaded in axial tension, the reinforcement will transfer a portion of the load to the surrounding concrete. The stress will be shared between the reinforcing steel and concrete until it exceeds the tensile strength of the concrete and transverse cracks will form. At these cracks, the entire load is usually assumed to be carried by the reinforcement, as illustrated in Fig. 1. Between adjacent cracks, the stress in the concrete increases gradually until the midpoint between cracks and then gradually reduces back down to zero again at the next crack (Scott and Gill 1987). The larger the space between the cracks, the greater the stress the steel is able to transfer to the concrete. The load sharing effect between cracks will lessen as cracks become more abundant and closely spaced.
The load transfer between the reinforcement and the surrounding concrete is a function of the bond between the two. A number of researchers have developed approaches to modeling this bond. For example, Edwards and Picarde
Fig. 1—Typical tension specimen showing schematic of strain gauge installation in groove made along center of bar cut in half longitudinally with every other gauge installed in each half of bar (the two halves are then epoxied together to create a complete bar), and expected stress distribution due to tension stiffening.
757ACI Structural Journal/May-June 2017
(1972) investigated the bond behavior and proposed a model to estimate crack width and spacing based on a bond-slip relationship that varied with reinforcement stress. Russo and Romano (1992) developed a cracking model for members in uniaxial tension that was based on a non-linear bond slip relationship. Russo et al. (2009) further extended this work by developing a bond model that considered asymmetry in terms of both geometry (different depths of concrete above and below the bar) and mechanics (changes in shear stress along the length of the bar).
This sharing of the tensile stresses between the reinforce-ment and surrounding concrete is known as tension stiff-ening. Although the strength contribution of concrete in tension is often considered negligible due to the develop-ment of tensile cracks, the concrete contributes to the overall stiffness of a structural member. The concrete between cracks plays an important role in reducing member deflec-tions at service load levels (Wu and Gilbert 2009).
Previous research into tension stiffening has employed conventional sensors to provide quantitative data on rein-forcing bar strains. One technique involves installing many electrical resistance strain gauges along a longitudinal groove within the reinforcement, as described earlier. This allowed for semi-distributed strain sensing of the entire rein-forcement bar. The first reported instance of this technique being used was the work of Mains (1951). As strain gauge technology and data acquisition systems improved, the technique was adopted by more researchers to gain insight into tension-stiffening effects and bond performance (for example, Scott and Gill 1987). However, the disadvantage of this technique is that it requires extensive machining and time to construct the specimens. For testing a larger sample size, or for monitoring of a structure, this technique is not feasible due to the time and expense involved.
A number of models exist in the literature to account for the effects of tension stiffening (for example, Collins and Mitchell [1997], CEB-FIP [1993], Belarbi and Hsu [1994], and Bentz [2005]). These models can be compared against the experimental strain measurements to determine the accu-racy of each model. In these models, the axial load is shared by the concrete and the reinforcing steel and the reduced stress in the concrete after cracking is accounted for by Fields and Bischoff (2004) with a bond factor, β. This bond factor relates the average tensile stress in the concrete, fc, to the cracking strength, fcr, as presented in Eq. (1).
β =ffc
cr
(1)
The β factor approach lends itself to non-linear analysis as the effect of tension stiffening can be accounted for as an average reduction in the tensile strength of the element. Fields and Bischoff (2004) propose a bond factor given in Eq. (2) based on a curve fit to their test data that uses the average concrete strain and the cracking strain. In this approach, the average concrete is calculated over a gauge length that includes multiple cracks. This value will be used to calculate the theoretical axial load using Eq. (3) and
compared against the experimentally measured axial loads and reinforcement strains from this study.
β ε ε= − −( )×e cf cr0 8 103. (2)
where εcf is the concrete strain; εcr is the elastic strain in the concrete at cracking (= fcr/Ec); and Ec is the elastic modulus of the concrete. This equation is used in a combined load model where the axial load, N, is calculated using Eq. (3)
N = Acfc + Asfs ≤ Asfy (3)
where Fields and Bischoff propose:
fEfcc cr
cr cr
=≤>
ε ε εβ ε ε
(4)
f fcr c= ′0 37. (5)
E fc c= ′4030 (6)
where Ac is the cross-sectional area of the concrete; As is the area of the reinforcement; fs is the stress in the steel; fy is the yield stress of the steel; and fc′ is the compressive strength of the concrete. Equations (5) and (6) are unit-dependent and are presented in SI units, where all terms are in MPa.
Combined effects of shrinkage and tension stiffening
As discussed previously, for a reinforced concrete member, the shrinkage effects would induce a compressive force in the steel reinforcement. Failure to account for this shrinkage strain can cause an apparent reduction in tension stiffening by up to 50% (Bischoff 2001). The member strain εm that accounts for the effects of shrinkage prior to cracking of the specimen can be derived from equilibrium as given in Eq. (7).
εερm
c c sh
c c
N E AE A n
=+
+( )1 (7)
In Eq. (7), n is the modular ratio (Es/Ec); and ρ is the rein-forcement ratio (As/Ac). The shrinkage strain, εsh, is due to both the effects of free shrinkage of the concrete, as well as creep strains due to the restraint provided by the reinforcement.
Fiber optic sensingA wide range of FOS technologies are available and are
used for various applications such as measuring strain, temperature, and pressure. For measuring strain, the two main types of FOS technologies available are discrete and distributed. Discrete sensing technologies are capable of recording strain measurements with accuracy similar to that of conventional sensors. Fiber-Bragg gratings (FBG) are an example of discrete sensing, but similar to electrical resis-tance strain-gauges, they can only provide measurements at
758 ACI Structural Journal/May-June 2017
a single location. Distributed sensing, on the other hand, can provide quasi-continuous distributed measurements along the length of the fibers. Research by Hoult et al. (2014) has shown that with proper installation techniques, it is possible to obtain electrical resistance strain gauge accuracy with distributed strain sensing.
In the current research, a technology that measures Rayleigh backscatter to obtain distributed strains is used. The technology has been used previously to measure external strains on reinforced concrete beams (Villalba and Casas 2013), for deterioration detection in reinforced concrete beams (Regier and Hoult 2014a), and to monitor a reinforced concrete bridge during a load test (Regier and Hoult 2014b). The technology works by sending a light pulse down a fiber optic cable and measuring and storing the initial Rayleigh backscatter signature as a reference. After a temperature or strain change is induced in the fiber, a second backscatter profile is measured. The spectral shift (change) between these two measurements is determined using a cross-correlation and then the strain or temperature change is calculated by multiplying the spectral shift value by a constant (Luna Technologies 2011).
An optical backscatter reflectometer that measures distrib-uted strain using Rayleigh backscatter (Luna Technologies 2011) was used in the current research. The gauge length and sensor spacing were both set to 10 mm (0.4 in.) in the current testing program. The optical backscatter reflectometer has been shown to have strain and temperature measurement accuracy of better than 1 microstrain and 0.1°C (0.18°F) at a spatial resolution of 5 mm (0.2 in.) (Gifford et al. 2007).
As with most strain measurement systems, the effects of temperature and strain are coupled. The optical backscatter reflectometer scanner is not configured to provide simul-taneous independent measurements of temperature and strain. It is important to isolate the effect of the change in temperature from strain changes during testing as both the temperature and strain are merely rescaled spectral shift values (changes in the backscatter light frequency) that are measured by the analyzer. In the absence of strain change due to stress, the strain change of the fiber due to tempera-ture during testing is calculated as 8 με/°C (4.44 με/°F) based on equations provided by the manufacturer (Luna Technologies 2011). This value is a combination of both the material-induced strain due to a temperature change in the glass core of the fiber and the impact of temperature change on the refractive properties of the core. To mitigate this, one could: i) undertake all testing at a constant temperature; or ii) use a length of fiber that does not experience strain due to mechanical loading to measure the strain due to temperature change and adjust the strain measurements accordingly. In this investigation, both techniques were used as the tension stiffening tests took place over a short duration of constant temperature while the shrinkage measurements took place over several weeks with initially varying temperatures.
EXPERIMENTAL METHODSThere were two phases to the research in the current
experimental program. In the first phase, three reinforced concrete specimens were cast and the distributed strains due
to shrinkage along the reinforcement were measured after casting at 3, 7, 14, 21, and 28 days. In the second phase of the research, bare steel reinforcement (reinforcing bar) and reinforced concrete specimens were loaded in axial tension to investigate bond performance and tension stiffening. The specimens were given an alphanumeric designation (refer to Table 1) where the letter indicates whether the specimen is a bare reinforcing bar specimen (R), a reinforced concrete specimen (C), or a shrinkage (S) specimen; the number after the letter indicates the bar diameter (10 is a 10M bar spec-imen while 15 is a 15M bar specimen); and the final number is the specimen number.
Fiber optic cableResearch by Hoult et al. (2014) and Regier and Hoult
(2014a) has shown that fibers with a nylon coating and a polyimide coating may be used to measure strain but have different advantages and disadvantages. The nylon-coated fiber has the advantages of being inexpensive (~$0.15/m [~$0.05/ft]), durable under normal handling, and can bridge cracks in fractured materials. The ability to remain unbroken across cracks is due to the fact that the nylon coating is a jacket with a friction fit rather than being bonded to the core. The jacket slides relative to the core once the coefficient of friction between the two is exceeded, so that the sensing core does not break when exposed to high strain gradients. However, the slip results in inaccurate strain readings at the peak strain locations. The polyimide coated fiber has the advantage of good strain transfer between the sensing core, the coating, and the substrate material being monitored resulting in more accurate measurements. The main down-sides are its poor durability during fabrication, its tendency to break across cracks when used on brittle materials, and its cost relative to the nylon-coated fibers (~$2.50/m [~$0.80/ ft]). In the current research, both fibers were used to determine which fiber was more appropriate for this applica-
Table 1–Test specimens
Specimen name Reinforcement Yield load, kN
R10-1 10M 44.0
R10-2 10M 43.9
R10-3 10M 43.8
R15-1 15M 86.0
R15-2 15M 89.5
S15-1 15M —
S15-2 15M —
S15-3 15M —
C10-1 10M 47.9
C10-2 10M 48.2
C10-3 10M 47.6
C15-1 15M 85.1
C15-2 15M 95.4
C15-3 15M 89.5
C15-4 15M 88.2
Note: 1 kN = 0.225 lb.
759ACI Structural Journal/May-June 2017
tion. Because the fibers, including the coating, have a diam-eter less than 1 mm (0.04 in.), their axial stiffness is orders of magnitude lower than the specimen stiffness and so they will not be expected to influence the measurement results.
Specimen preparationThe bare reinforcement specimens consisted of 10M (area
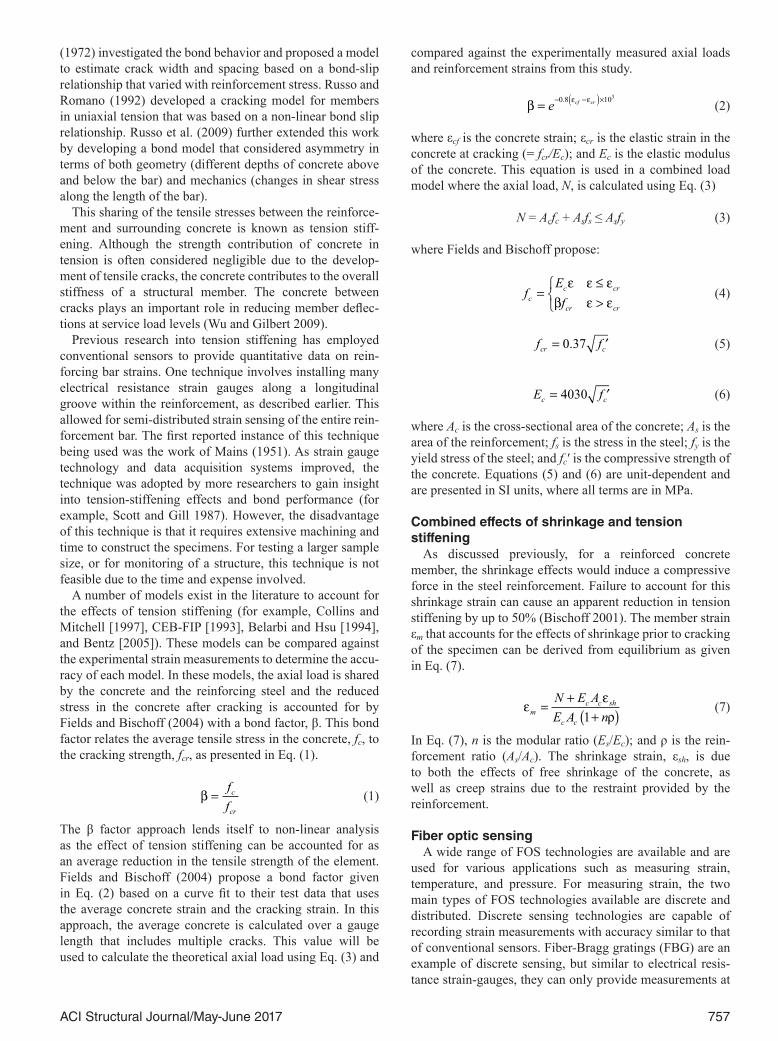
= 100 mm2 [0.155 in2]) and 15M bars (area = 200 mm2 [0.31 in2]), 1100 mm (43.3 in.) in length. The bars were cleaned with rubbing alcohol along the length where the fibers were to be installed. A polyimide fiber was then bonded to the bar with a cyanoacrylate along the longitu-dinal ridge of the central 800 mm (31.5 in.), as shown in Fig. 2(a) and (b). Some specimens had a nylon fiber bonded along the length of the reinforcing bar on the opposite side.
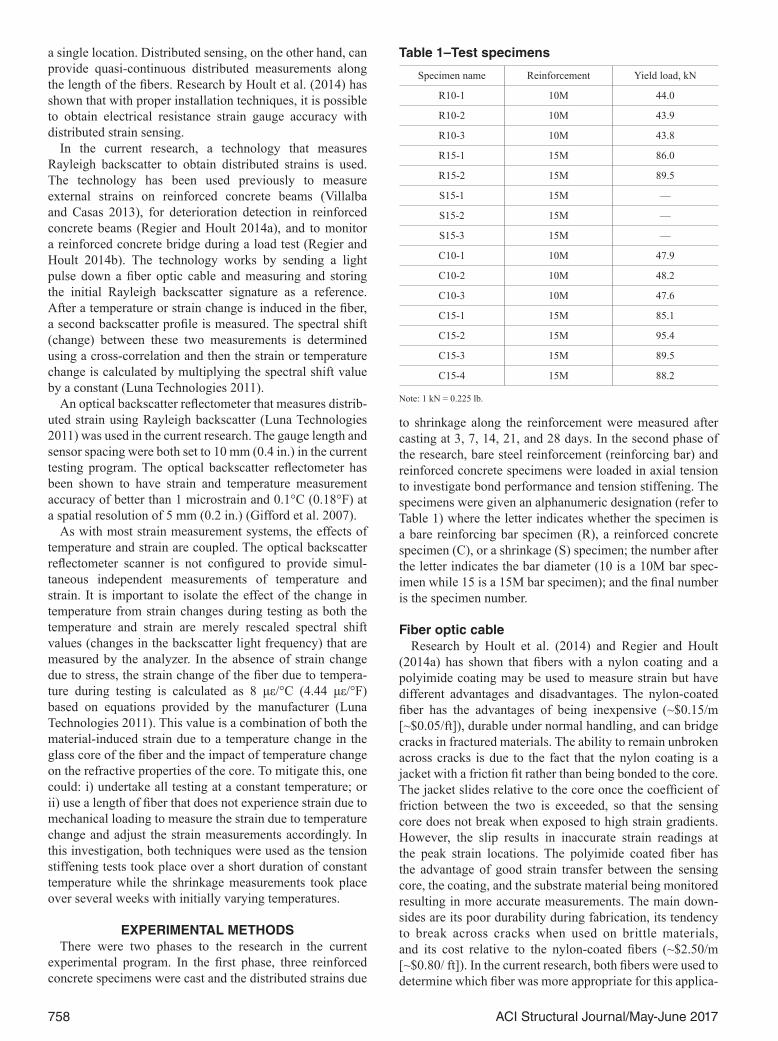
The reinforced concrete specimens for the shrinkage and tension stiffening experiments consisted of a single longitu-dinal reinforcement bar with additional transverse reinforce-ment bars embedded in concrete. The layout of the speci-mens is shown in Fig. 3. The transverse reinforcement were triangular shaped 6 mm (0.24 in.) diameter smooth steel bars with the ends bent into hooks to provide anchorage in the concrete. They were included in these specimens to be consistent with specimens in a separate corrosion study (Davis et al. 2016), where they were necessary to ensure the concrete did not split in two and spall off after developing a longitudinal crack due to corrosion of the reinforcement. The orientation of the transverse reinforcement in Fig. 3 was chosen to ensure simplicity of construction, and to prevent fiber optic damage as they could be kept in place using gravity and plastic zip-tied to the longitudinal reinforcement. There was a possibility that these transverse reinforcement elements could create weak points in the concrete causing cracks to form at these locations. This will be discussed in later sections. The dimensions of the concrete were 100 mm (3.94 in.) wide x 100 mm (3.94 in.) high x 900 mm (35.4 in.) long. The reinforcing bar extended from each end of the concrete by 100 mm (3.94 in.) to provide a gripping area for loading. Internal polyimide and nylon fibers were bonded
along approximately the central 800 mm (31.5 in.) of the reinforcing bar on opposite sides. They did not run the same length as the concrete prism, as the fibers required a radius of 50 mm (2 in.) to exit out of the side of the spec-imen within the formwork. The fibers were placed in a tube to protect them from the concrete, which resulted in them being debonded when not in contact with the reinforcement (refer to Fig. 3). Note that for the shrinkage specimens, the strains were zeroed prior to casting whereas for the tension stiffening specimens the strains were zeroed prior to loading.
The concrete mixture had a water-cement ratio of 0.45. The mixture consisted of 235 kg/m3 (396 lb/yd3) water, 518 kg/m3 (873 lb/yd3) portland cement, 1046 kg/m3 (1763 lb/yd3) coarse aggregate, 576 kg/m3 (971 lb/yd3) fine aggregate, and 24 kg/m3 (40 lb/yd3) sodium chloride (which was added as part of a separate corrosion study; refer to Davis et al. 2016). The mixture had an average 28-day compressive strength of 34 MPa (4900 psi), and the tests were performed at this time.
Test setupThe shrinkage specimens were cast in the summer and
left to cure under wet burlap and plastic in a non-tempera-ture-controlled concrete lab. The forms were removed three days after casting and the wet burlap and plastic was replaced. At 7 days, the burlap was removed and the specimens were moved to a temperature-controlled lab. Distributed strain readings were zeroed prior to casting and measurements were taken using the optical backscatter reflectometer at 3 days (before and after the forms were removed), 7, 14, 21, and 28 days. The shrinkage strain specimens were not restrained or loaded so that the effects of free shrinkage could be isolated.
Tests of the bare reinforcing bar and reinforced concrete tension stiffening specimens were carried out using a tensile testing frame. The reinforcing bar at each end of the spec-imens was gripped in the test frame and loaded in axial tension. A data acquisition system recorded load measure-ments at a rate of two scans per second. Strain measurements
Fig. 2—Bare reinforcement tension test specimens. (Note: 1 mm = 0.394 in.)
Fig. 3—Reinforced concrete specimens for shrinkage and tension stiffening experiments. (Note: 1 mm = 0.394 in.)
760 ACI Structural Journal/May-June 2017
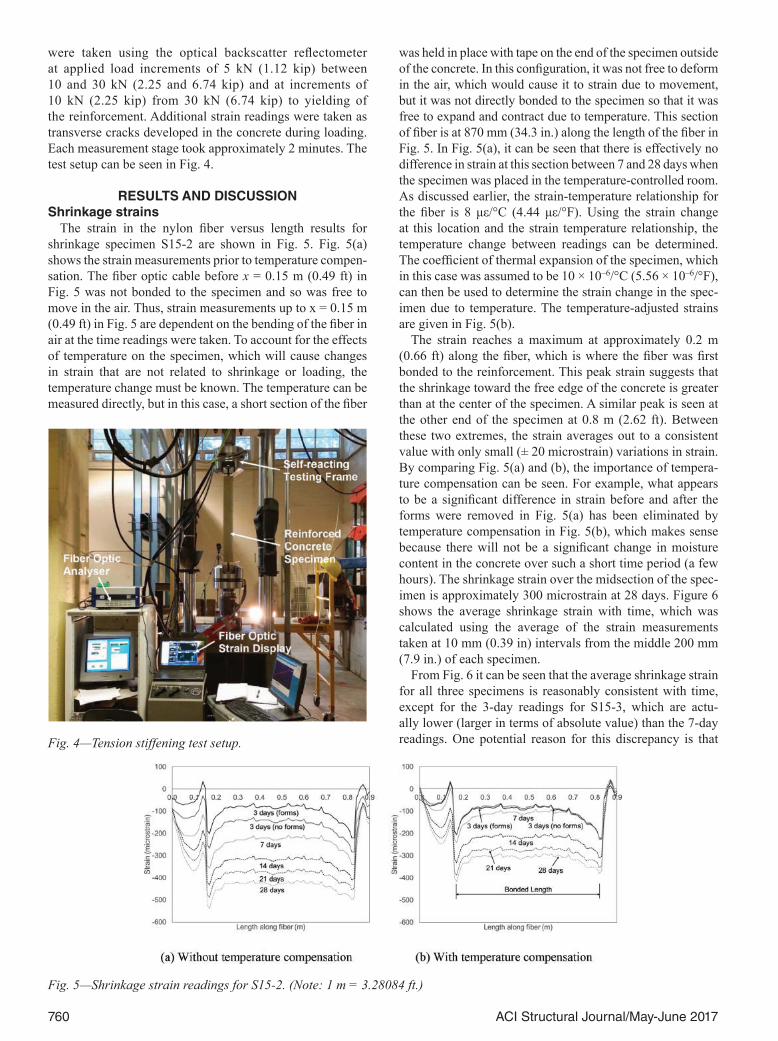
were taken using the optical backscatter reflecto meter at applied load increments of 5 kN (1.12 kip) between 10 and 30 kN (2.25 and 6.74 kip) and at increments of 10 kN (2.25 kip) from 30 kN (6.74 kip) to yielding of the reinforcement. Additional strain readings were taken as transverse cracks developed in the concrete during loading. Each measurement stage took approximately 2 minutes. The test setup can be seen in Fig. 4.
RESULTS AND DISCUSSIONShrinkage strains
The strain in the nylon fiber versus length results for shrinkage specimen S15-2 are shown in Fig. 5. Fig. 5(a) shows the strain measurements prior to temperature compen-sation. The fiber optic cable before x = 0.15 m (0.49 ft) in Fig. 5 was not bonded to the specimen and so was free to move in the air. Thus, strain measurements up to x = 0.15 m (0.49 ft) in Fig. 5 are dependent on the bending of the fiber in air at the time readings were taken. To account for the effects of temperature on the specimen, which will cause changes in strain that are not related to shrinkage or loading, the temperature change must be known. The temperature can be measured directly, but in this case, a short section of the fiber
was held in place with tape on the end of the specimen outside of the concrete. In this configuration, it was not free to deform in the air, which would cause it to strain due to movement, but it was not directly bonded to the specimen so that it was free to expand and contract due to temperature. This section of fiber is at 870 mm (34.3 in.) along the length of the fiber in Fig. 5. In Fig. 5(a), it can be seen that there is effectively no difference in strain at this section between 7 and 28 days when the specimen was placed in the temperature-controlled room. As discussed earlier, the strain-temperature relationship for the fiber is 8 με/°C (4.44 με/°F). Using the strain change at this location and the strain temperature relationship, the temperature change between readings can be determined. The coefficient of thermal expansion of the specimen, which in this case was assumed to be 10 × 10–6/°C (5.56 × 10⁻⁶/°F), can then be used to determine the strain change in the spec-imen due to temperature. The temperature-adjusted strains are given in Fig. 5(b).
The strain reaches a maximum at approximately 0.2 m (0.66 ft) along the fiber, which is where the fiber was first bonded to the reinforcement. This peak strain suggests that the shrinkage toward the free edge of the concrete is greater than at the center of the specimen. A similar peak is seen at the other end of the specimen at 0.8 m (2.62 ft). Between these two extremes, the strain averages out to a consistent value with only small (± 20 microstrain) variations in strain. By comparing Fig. 5(a) and (b), the importance of tempera-ture compensation can be seen. For example, what appears to be a significant difference in strain before and after the forms were removed in Fig. 5(a) has been eliminated by temperature compensation in Fig. 5(b), which makes sense because there will not be a significant change in moisture content in the concrete over such a short time period (a few hours). The shrinkage strain over the midsection of the spec-imen is approximately 300 microstrain at 28 days. Figure 6 shows the average shrinkage strain with time, which was calculated using the average of the strain measurements taken at 10 mm (0.39 in) intervals from the middle 200 mm (7.9 in.) of each specimen.
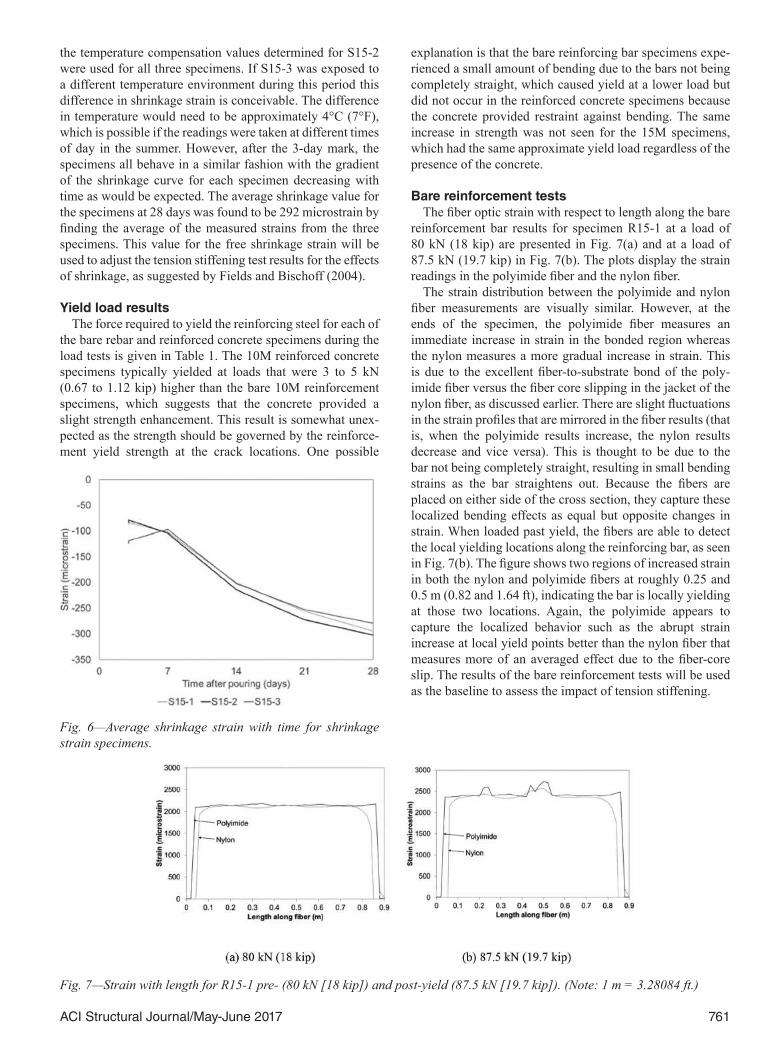
From Fig. 6 it can be seen that the average shrinkage strain for all three specimens is reasonably consistent with time, except for the 3-day readings for S15-3, which are actu-ally lower (larger in terms of absolute value) than the 7-day readings. One potential reason for this discrepancy is that Fig. 4—Tension stiffening test setup.
Fig. 5—Shrinkage strain readings for S15-2. (Note: 1 m = 3.28084 ft.)
761ACI Structural Journal/May-June 2017
the temperature compensation values determined for S15-2 were used for all three specimens. If S15-3 was exposed to a different temperature environment during this period this difference in shrinkage strain is conceivable. The difference in temperature would need to be approximately 4°C (7°F), which is possible if the readings were taken at different times of day in the summer. However, after the 3-day mark, the specimens all behave in a similar fashion with the gradient of the shrinkage curve for each specimen decreasing with time as would be expected. The average shrinkage value for the specimens at 28 days was found to be 292 microstrain by finding the average of the measured strains from the three specimens. This value for the free shrinkage strain will be used to adjust the tension stiffening test results for the effects of shrinkage, as suggested by Fields and Bischoff (2004).
Yield load resultsThe force required to yield the reinforcing steel for each of
the bare rebar and reinforced concrete specimens during the load tests is given in Table 1. The 10M reinforced concrete specimens typically yielded at loads that were 3 to 5 kN (0.67 to 1.12 kip) higher than the bare 10M reinforcement specimens, which suggests that the concrete provided a slight strength enhancement. This result is somewhat unex-pected as the strength should be governed by the reinforce-ment yield strength at the crack locations. One possible
explanation is that the bare reinforcing bar specimens expe-rienced a small amount of bending due to the bars not being completely straight, which caused yield at a lower load but did not occur in the reinforced concrete specimens because the concrete provided restraint against bending. The same increase in strength was not seen for the 15M specimens, which had the same approximate yield load regardless of the presence of the concrete.
Bare reinforcement testsThe fiber optic strain with respect to length along the bare
reinforcement bar results for specimen R15-1 at a load of 80 kN (18 kip) are presented in Fig. 7(a) and at a load of 87.5 kN (19.7 kip) in Fig. 7(b). The plots display the strain readings in the polyimide fiber and the nylon fiber.
The strain distribution between the polyimide and nylon fiber measurements are visually similar. However, at the ends of the specimen, the polyimide fiber measures an immediate increase in strain in the bonded region whereas the nylon measures a more gradual increase in strain. This is due to the excellent fiber-to-substrate bond of the poly-imide fiber versus the fiber core slipping in the jacket of the nylon fiber, as discussed earlier. There are slight fluctuations in the strain profiles that are mirrored in the fiber results (that is, when the polyimide results increase, the nylon results decrease and vice versa). This is thought to be due to the bar not being completely straight, resulting in small bending strains as the bar straightens out. Because the fibers are placed on either side of the cross section, they capture these localized bending effects as equal but opposite changes in strain. When loaded past yield, the fibers are able to detect the local yielding locations along the reinforcing bar, as seen in Fig. 7(b). The figure shows two regions of increased strain in both the nylon and polyimide fibers at roughly 0.25 and 0.5 m (0.82 and 1.64 ft), indicating the bar is locally yielding at those two locations. Again, the polyimide appears to capture the localized behavior such as the abrupt strain increase at local yield points better than the nylon fiber that measures more of an averaged effect due to the fiber-core slip. The results of the bare reinforcement tests will be used as the baseline to assess the impact of tension stiffening.
Fig. 6—Average shrinkage strain with time for shrinkage strain specimens.
Fig. 7—Strain with length for R15-1 pre- (80 kN [18 kip]) and post-yield (87.5 kN [19.7 kip]). (Note: 1 m = 3.28084 ft.)
762 ACI Structural Journal/May-June 2017
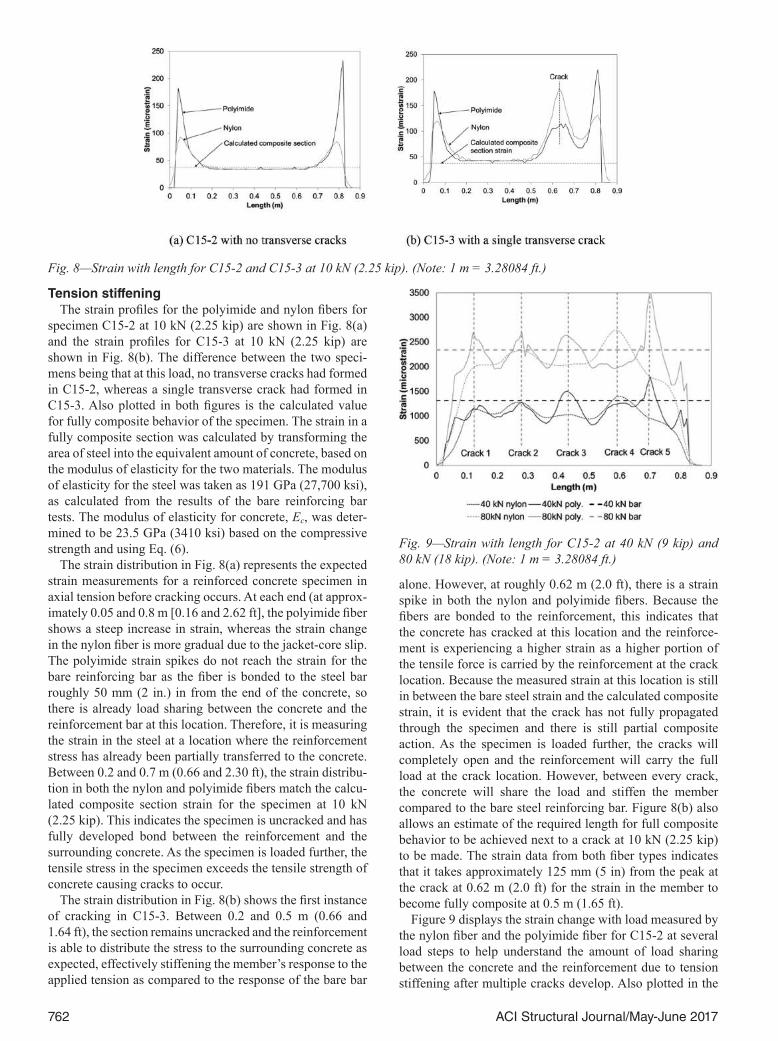
Tension stiffeningThe strain profiles for the polyimide and nylon fibers for
specimen C15-2 at 10 kN (2.25 kip) are shown in Fig. 8(a) and the strain profiles for C15-3 at 10 kN (2.25 kip) are shown in Fig. 8(b). The difference between the two speci-mens being that at this load, no transverse cracks had formed in C15-2, whereas a single transverse crack had formed in C15-3. Also plotted in both figures is the calculated value for fully composite behavior of the specimen. The strain in a fully composite section was calculated by transforming the area of steel into the equivalent amount of concrete, based on the modulus of elasticity for the two materials. The modulus of elasticity for the steel was taken as 191 GPa (27,700 ksi), as calculated from the results of the bare reinforcing bar tests. The modulus of elasticity for concrete, Ec, was deter-mined to be 23.5 GPa (3410 ksi) based on the compressive strength and using Eq. (6).
The strain distribution in Fig. 8(a) represents the expected strain measurements for a reinforced concrete specimen in axial tension before cracking occurs. At each end (at approx-imately 0.05 and 0.8 m [0.16 and 2.62 ft], the polyimide fiber shows a steep increase in strain, whereas the strain change in the nylon fiber is more gradual due to the jacket-core slip. The polyimide strain spikes do not reach the strain for the bare reinforcing bar as the fiber is bonded to the steel bar roughly 50 mm (2 in.) in from the end of the concrete, so there is already load sharing between the concrete and the reinforcement bar at this location. Therefore, it is measuring the strain in the steel at a location where the reinforcement stress has already been partially transferred to the concrete. Between 0.2 and 0.7 m (0.66 and 2.30 ft), the strain distribu-tion in both the nylon and polyimide fibers match the calcu-lated composite section strain for the specimen at 10 kN (2.25 kip). This indicates the specimen is uncracked and has fully developed bond between the reinforcement and the surrounding concrete. As the specimen is loaded further, the tensile stress in the specimen exceeds the tensile strength of concrete causing cracks to occur.
The strain distribution in Fig. 8(b) shows the first instance of cracking in C15-3. Between 0.2 and 0.5 m (0.66 and 1.64 ft), the section remains uncracked and the reinforcement is able to distribute the stress to the surrounding concrete as expected, effectively stiffening the member’s response to the applied tension as compared to the response of the bare bar
alone. However, at roughly 0.62 m (2.0 ft), there is a strain spike in both the nylon and polyimide fibers. Because the fibers are bonded to the reinforcement, this indicates that the concrete has cracked at this location and the reinforce-ment is experiencing a higher strain as a higher portion of the tensile force is carried by the reinforcement at the crack location. Because the measured strain at this location is still in between the bare steel strain and the calculated composite strain, it is evident that the crack has not fully propagated through the specimen and there is still partial composite action. As the specimen is loaded further, the cracks will completely open and the reinforcement will carry the full load at the crack location. However, between every crack, the concrete will share the load and stiffen the member compared to the bare steel reinforcing bar. Figure 8(b) also allows an estimate of the required length for full composite behavior to be achieved next to a crack at 10 kN (2.25 kip) to be made. The strain data from both fiber types indicates that it takes approximately 125 mm (5 in) from the peak at the crack at 0.62 m (2.0 ft) for the strain in the member to become fully composite at 0.5 m (1.65 ft).
Figure 9 displays the strain change with load measured by the nylon fiber and the polyimide fiber for C15-2 at several load steps to help understand the amount of load sharing between the concrete and the reinforcement due to tension stiffening after multiple cracks develop. Also plotted in the
Fig. 8—Strain with length for C15-2 and C15-3 at 10 kN (2.25 kip). (Note: 1 m = 3.28084 ft.)
Fig. 9—Strain with length for C15-2 at 40 kN (9 kip) and 80 kN (18 kip). (Note: 1 m = 3.28084 ft.)
763ACI Structural Journal/May-June 2017
figure is the expected strain in the bare reinforcement bar, which was calculated based on the force in the bar, the area of the bar, and the modulus of elasticity determined from the bare bar tension tests. However, the bar strain must also be adjusted for the effects of shrinkage. Fields and Bischoff (2004) suggest that the offset strain between the member strain and the bare bar strain is given by Eq. (8).
εε
ρm ish
n, =+1
(8)
Using the shrinkage strain of 292 microstrain deter-mined from the shrinkage experiments, the offset strain is 254 microstrain, which can either be used to decrease the member strains or increase the bare bar strains. In Fig. 9, the bare bar strains have been increased by this amount.
From Fig. 9, it can be seen that the crack spacing is approx-imately 150 mm (6 in.). Fields and Bischoff (2004) suggest that the crack spacing, s, can be estimated using Eq. (9) in SI units.
sdb=5ρ
(9)
Based on a ρ of 0.0204 for the 15M specimens (db = 16 mm [0.63 in.]), the predicted crack spacing would be 157 mm (6.2 in.), which is quite close to the measured crack spacing. It should be noted that 150 mm (6 in.) was also twice the transverse reinforcement spacing. Because the expected crack spacing and the transverse reinforcement spacing are similar, it is difficult to know whether the transverse rein-forcement acted as crack initiators. From Fig. 8(b), it was found that a distance of 125 mm (5 in.) was required for full composite action to be recovered on a crack spacing of 150 mm (6 in.), there is no point along the specimen at which this is achieved. However, it can also be seen that between each crack, the strain is lower than the bare bar strain, suggesting that there is load sharing between the reinforcement and the surrounding concrete. Additionally, the strain reduction (that is, the amount of tension stiffening) between most of the cracks remains relatively constant with increasing load. It is also clear that the polyimide and nylon fibers measurements
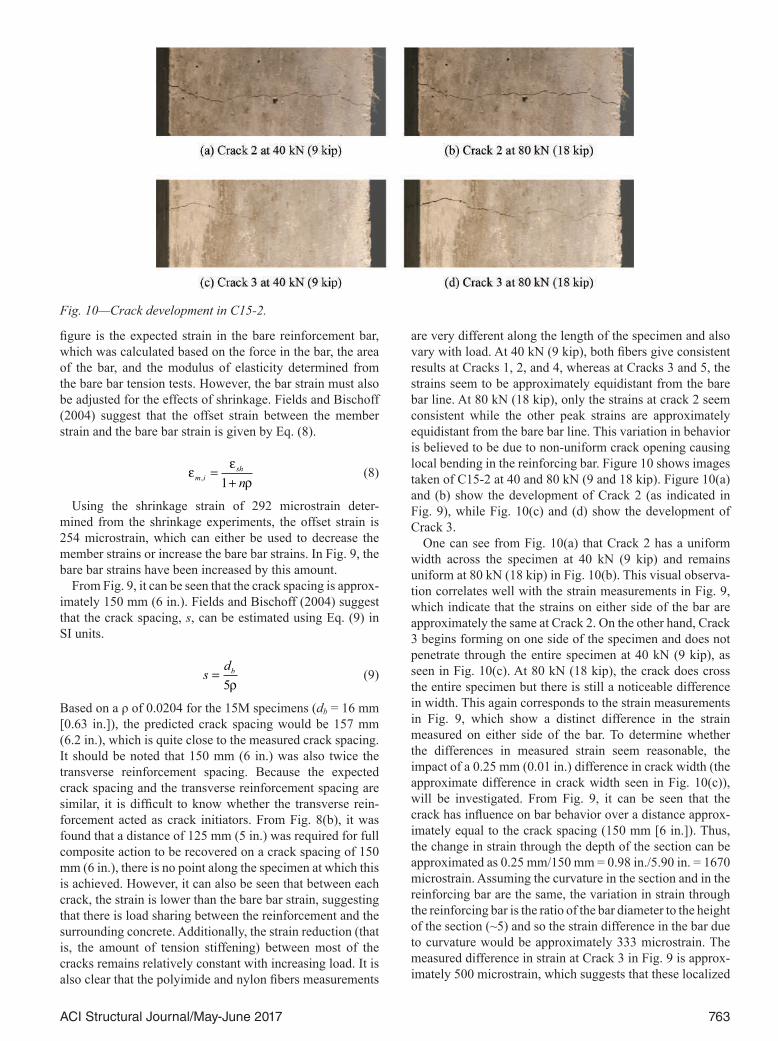
are very different along the length of the specimen and also vary with load. At 40 kN (9 kip), both fibers give consistent results at Cracks 1, 2, and 4, whereas at Cracks 3 and 5, the strains seem to be approximately equidistant from the bare bar line. At 80 kN (18 kip), only the strains at crack 2 seem consistent while the other peak strains are approximately equidistant from the bare bar line. This variation in behavior is believed to be due to non-uniform crack opening causing local bending in the reinforcing bar. Figure 10 shows images taken of C15-2 at 40 and 80 kN (9 and 18 kip). Figure 10(a) and (b) show the development of Crack 2 (as indicated in Fig. 9), while Fig. 10(c) and (d) show the development of Crack 3.
One can see from Fig. 10(a) that Crack 2 has a uniform width across the specimen at 40 kN (9 kip) and remains uniform at 80 kN (18 kip) in Fig. 10(b). This visual observa-tion correlates well with the strain measurements in Fig. 9, which indicate that the strains on either side of the bar are approximately the same at Crack 2. On the other hand, Crack 3 begins forming on one side of the specimen and does not penetrate through the entire specimen at 40 kN (9 kip), as seen in Fig. 10(c). At 80 kN (18 kip), the crack does cross the entire specimen but there is still a noticeable difference in width. This again corresponds to the strain measurements in Fig. 9, which show a distinct difference in the strain measured on either side of the bar. To determine whether the differences in measured strain seem reasonable, the impact of a 0.25 mm (0.01 in.) difference in crack width (the approximate difference in crack width seen in Fig. 10(c)), will be investigated. From Fig. 9, it can be seen that the crack has influence on bar behavior over a distance approx-imately equal to the crack spacing (150 mm [6 in.]). Thus, the change in strain through the depth of the section can be approximated as 0.25 mm/150 mm = 0.98 in./5.90 in. = 1670 microstrain. Assuming the curvature in the section and in the reinforcing bar are the same, the variation in strain through the reinforcing bar is the ratio of the bar diameter to the height of the section (~5) and so the strain difference in the bar due to curvature would be approximately 333 microstrain. The measured difference in strain at Crack 3 in Fig. 9 is approx-imately 500 microstrain, which suggests that these localized
Fig. 10—Crack development in C15-2.
764 ACI Structural Journal/May-June 2017
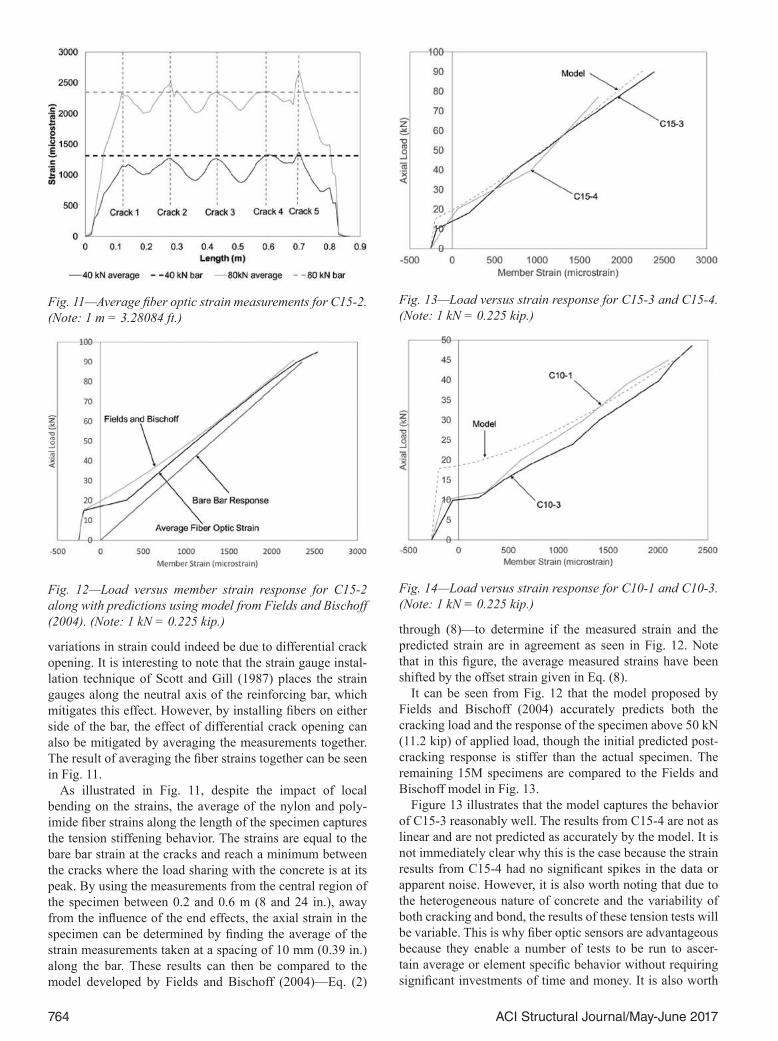
variations in strain could indeed be due to differential crack opening. It is interesting to note that the strain gauge instal-lation technique of Scott and Gill (1987) places the strain gauges along the neutral axis of the reinforcing bar, which mitigates this effect. However, by installing fibers on either side of the bar, the effect of differential crack opening can also be mitigated by averaging the measurements together. The result of averaging the fiber strains together can be seen in Fig. 11.
As illustrated in Fig. 11, despite the impact of local bending on the strains, the average of the nylon and poly-imide fiber strains along the length of the specimen captures the tension stiffening behavior. The strains are equal to the bare bar strain at the cracks and reach a minimum between the cracks where the load sharing with the concrete is at its peak. By using the measurements from the central region of the specimen between 0.2 and 0.6 m (8 and 24 in.), away from the influence of the end effects, the axial strain in the specimen can be determined by finding the average of the strain measurements taken at a spacing of 10 mm (0.39 in.) along the bar. These results can then be compared to the model developed by Fields and Bischoff (2004)—Eq. (2)
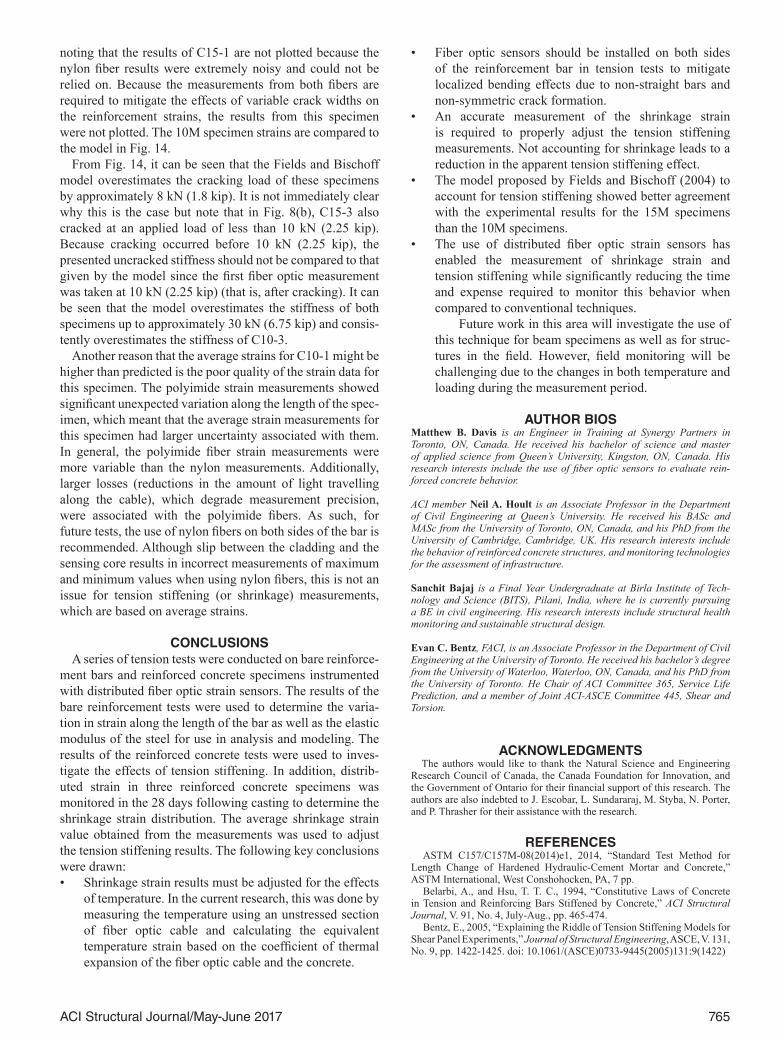
through (8)—to determine if the measured strain and the predicted strain are in agreement as seen in Fig. 12. Note that in this figure, the average measured strains have been shifted by the offset strain given in Eq. (8).
It can be seen from Fig. 12 that the model proposed by Fields and Bischoff (2004) accurately predicts both the cracking load and the response of the specimen above 50 kN (11.2 kip) of applied load, though the initial predicted post-cracking response is stiffer than the actual specimen. The remaining 15M specimens are compared to the Fields and Bischoff model in Fig. 13.
Figure 13 illustrates that the model captures the behavior of C15-3 reasonably well. The results from C15-4 are not as linear and are not predicted as accurately by the model. It is not immediately clear why this is the case because the strain results from C15-4 had no significant spikes in the data or apparent noise. However, it is also worth noting that due to the heterogeneous nature of concrete and the variability of both cracking and bond, the results of these tension tests will be variable. This is why fiber optic sensors are advantageous because they enable a number of tests to be run to ascer-tain average or element specific behavior without requiring significant investments of time and money. It is also worth
Fig. 11—Average fiber optic strain measurements for C15-2. (Note: 1 m = 3.28084 ft.)
Fig. 12—Load versus member strain response for C15-2 along with predictions using model from Fields and Bischoff (2004). (Note: 1 kN = 0.225 kip.)
Fig. 13—Load versus strain response for C15-3 and C15-4. (Note: 1 kN = 0.225 kip.)
Fig. 14—Load versus strain response for C10-1 and C10-3. (Note: 1 kN = 0.225 kip.)
765ACI Structural Journal/May-June 2017
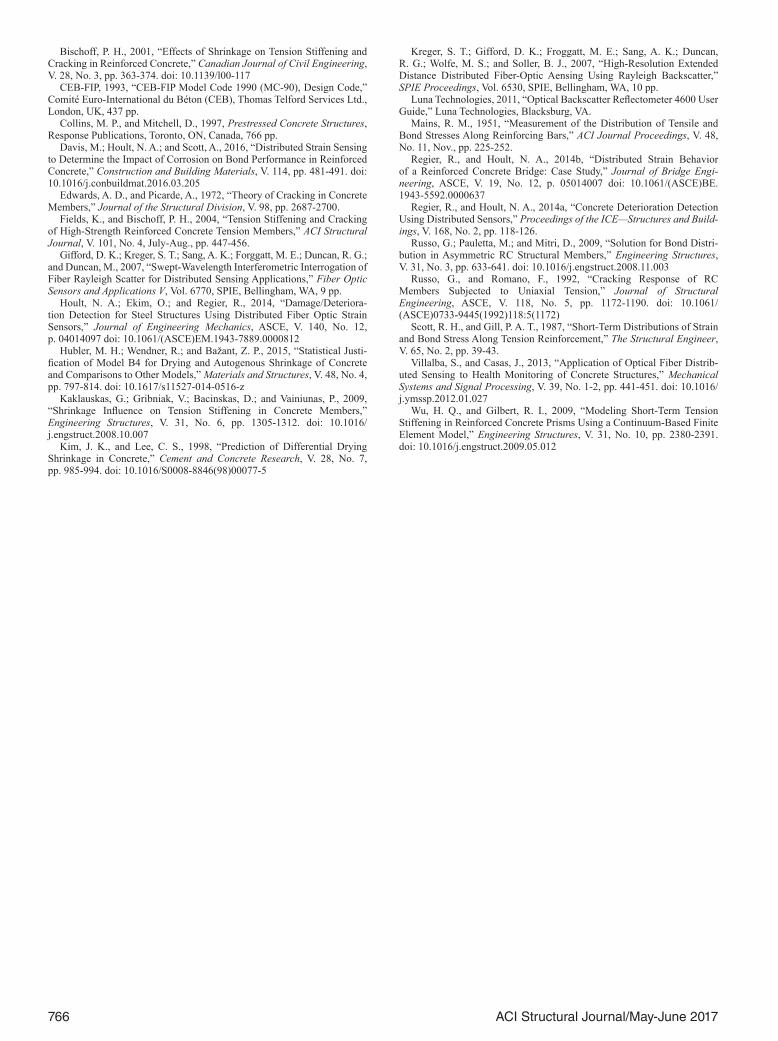
noting that the results of C15-1 are not plotted because the nylon fiber results were extremely noisy and could not be relied on. Because the measurements from both fibers are required to mitigate the effects of variable crack widths on the reinforcement strains, the results from this specimen were not plotted. The 10M specimen strains are compared to the model in Fig. 14.
From Fig. 14, it can be seen that the Fields and Bischoff model overestimates the cracking load of these specimens by approximately 8 kN (1.8 kip). It is not immediately clear why this is the case but note that in Fig. 8(b), C15-3 also cracked at an applied load of less than 10 kN (2.25 kip). Because cracking occurred before 10 kN (2.25 kip), the presented uncracked stiffness should not be compared to that given by the model since the first fiber optic measurement was taken at 10 kN (2.25 kip) (that is, after cracking). It can be seen that the model overestimates the stiffness of both specimens up to approximately 30 kN (6.75 kip) and consis-tently overestimates the stiffness of C10-3.
Another reason that the average strains for C10-1 might be higher than predicted is the poor quality of the strain data for this specimen. The polyimide strain measurements showed significant unexpected variation along the length of the spec-imen, which meant that the average strain measurements for this specimen had larger uncertainty associated with them. In general, the polyimide fiber strain measurements were more variable than the nylon measurements. Additionally, larger losses (reductions in the amount of light travelling along the cable), which degrade measurement precision, were associated with the polyimide fibers. As such, for future tests, the use of nylon fibers on both sides of the bar is recommended. Although slip between the cladding and the sensing core results in incorrect measurements of maximum and minimum values when using nylon fibers, this is not an issue for tension stiffening (or shrinkage) measurements, which are based on average strains.
CONCLUSIONSA series of tension tests were conducted on bare reinforce-
ment bars and reinforced concrete specimens instrumented with distributed fiber optic strain sensors. The results of the bare reinforcement tests were used to determine the varia-tion in strain along the length of the bar as well as the elastic modulus of the steel for use in analysis and modeling. The results of the reinforced concrete tests were used to inves-tigate the effects of tension stiffening. In addition, distrib-uted strain in three reinforced concrete specimens was monitored in the 28 days following casting to determine the shrinkage strain distribution. The average shrinkage strain value obtained from the measurements was used to adjust the tension stiffening results. The following key conclusions were drawn:• Shrinkage strain results must be adjusted for the effects
of temperature. In the current research, this was done by measuring the temperature using an unstressed section of fiber optic cable and calculating the equivalent temperature strain based on the coefficient of thermal expansion of the fiber optic cable and the concrete.
• Fiber optic sensors should be installed on both sides of the reinforcement bar in tension tests to mitigate localized bending effects due to non-straight bars and non-symmetric crack formation.
• An accurate measurement of the shrinkage strain is required to properly adjust the tension stiffening measurements. Not accounting for shrinkage leads to a reduction in the apparent tension stiffening effect.
• The model proposed by Fields and Bischoff (2004) to account for tension stiffening showed better agreement with the experimental results for the 15M specimens than the 10M specimens.
• The use of distributed fiber optic strain sensors has enabled the measurement of shrinkage strain and tension stiffening while significantly reducing the time and expense required to monitor this behavior when compared to conventional techniques. ◦ Future work in this area will investigate the use of this technique for beam specimens as well as for struc-tures in the field. However, field monitoring will be challenging due to the changes in both temperature and loading during the measurement period.
AUTHOR BIOSMatthew B. Davis is an Engineer in Training at Synergy Partners in Toronto, ON, Canada. He received his bachelor of science and master of applied science from Queen’s University, Kingston, ON, Canada. His research interests include the use of fiber optic sensors to evaluate rein-forced concrete behavior.
ACI member Neil A. Hoult is an Associate Professor in the Department of Civil Engineering at Queen’s University. He received his BASc and MASc from the University of Toronto, ON, Canada, and his PhD from the University of Cambridge, Cambridge, UK. His research interests include the behavior of reinforced concrete structures, and monitoring technologies for the assessment of infrastructure.
Sanchit Bajaj is a Final Year Undergraduate at Birla Institute of Tech-nology and Science (BITS), Pilani, India, where he is currently pursuing a BE in civil engineering. His research interests include structural health monitoring and sustainable structural design.
Evan C. Bentz, FACI, is an Associate Professor in the Department of Civil Engineering at the University of Toronto. He received his bachelor’s degree from the University of Waterloo, Waterloo, ON, Canada, and his PhD from the University of Toronto. He Chair of ACI Committee 365, Service Life Prediction, and a member of Joint ACI-ASCE Committee 445, Shear and Torsion.
ACKNOWLEDGMENTSThe authors would like to thank the Natural Science and Engineering
Research Council of Canada, the Canada Foundation for Innovation, and the Government of Ontario for their financial support of this research. The authors are also indebted to J. Escobar, L. Sundararaj, M. Styba, N. Porter, and P. Thrasher for their assistance with the research.
REFERENCESASTM C157/C157M-08(2014)e1, 2014, “Standard Test Method for
Length Change of Hardened Hydraulic-Cement Mortar and Concrete,” ASTM International, West Conshohocken, PA, 7 pp.
Belarbi, A., and Hsu, T. T. C., 1994, “Constitutive Laws of Concrete in Tension and Reinforcing Bars Stiffened by Concrete,” ACI Structural Journal, V. 91, No. 4, July-Aug., pp. 465-474.
Bentz, E., 2005, “Explaining the Riddle of Tension Stiffening Models for Shear Panel Experiments,” Journal of Structural Engineering, ASCE, V. 131, No. 9, pp. 1422-1425. doi: 10.1061/(ASCE)0733-9445(2005)131:9(1422)
766 ACI Structural Journal/May-June 2017
Bischoff, P. H., 2001, “Effects of Shrinkage on Tension Stiffening and Cracking in Reinforced Concrete,” Canadian Journal of Civil Engineering, V. 28, No. 3, pp. 363-374. doi: 10.1139/l00-117
CEB-FIP, 1993, “CEB-FIP Model Code 1990 (MC-90), Design Code,” Comité Euro-International du Béton (CEB), Thomas Telford Services Ltd., London, UK, 437 pp.
Collins, M. P., and Mitchell, D., 1997, Prestressed Concrete Structures, Response Publications, Toronto, ON, Canada, 766 pp.
Davis, M.; Hoult, N. A.; and Scott, A., 2016, “Distributed Strain Sensing to Determine the Impact of Corrosion on Bond Performance in Reinforced Concrete,” Construction and Building Materials, V. 114, pp. 481-491. doi: 10.1016/j.conbuildmat.2016.03.205
Edwards, A. D., and Picarde, A., 1972, “Theory of Cracking in Concrete Members,” Journal of the Structural Division, V. 98, pp. 2687-2700.
Fields, K., and Bischoff, P. H., 2004, “Tension Stiffening and Cracking of High-Strength Reinforced Concrete Tension Members,” ACI Structural Journal, V. 101, No. 4, July-Aug., pp. 447-456.
Gifford, D. K.; Kreger, S. T.; Sang, A. K.; Forggatt, M. E.; Duncan, R. G.; and Duncan, M., 2007, “Swept-Wavelength Interferometric Interrogation of Fiber Rayleigh Scatter for Distributed Sensing Applications,” Fiber Optic Sensors and Applications V, Vol. 6770, SPIE, Bellingham, WA, 9 pp.
Hoult, N. A.; Ekim, O.; and Regier, R., 2014, “Damage/Deteriora-tion Detection for Steel Structures Using Distributed Fiber Optic Strain Sensors,” Journal of Engineering Mechanics, ASCE, V. 140, No. 12, p. 04014097 doi: 10.1061/(ASCE)EM.1943-7889.0000812
Hubler, M. H.; Wendner, R.; and Bažant, Z. P., 2015, “Statistical Justi-fication of Model B4 for Drying and Autogenous Shrinkage of Concrete and Comparisons to Other Models,” Materials and Structures, V. 48, No. 4, pp. 797-814. doi: 10.1617/s11527-014-0516-z
Kaklauskas, G.; Gribniak, V.; Bacinskas, D.; and Vainiunas, P., 2009, “Shrinkage Influence on Tension Stiffening in Concrete Members,” Engineering Structures, V. 31, No. 6, pp. 1305-1312. doi: 10.1016/ j.engstruct.2008.10.007
Kim, J. K., and Lee, C. S., 1998, “Prediction of Differential Drying Shrinkage in Concrete,” Cement and Concrete Research, V. 28, No. 7, pp. 985-994. doi: 10.1016/S0008-8846(98)00077-5
Kreger, S. T.; Gifford, D. K.; Froggatt, M. E.; Sang, A. K.; Duncan, R. G.; Wolfe, M. S.; and Soller, B. J., 2007, “High-Resolution Extended Distance Distributed Fiber-Optic Aensing Using Rayleigh Backscatter,” SPIE Proceedings, Vol. 6530, SPIE, Bellingham, WA, 10 pp.
Luna Technologies, 2011, “Optical Backscatter Reflectometer 4600 User Guide,” Luna Technologies, Blacksburg, VA.
Mains, R. M., 1951, “Measurement of the Distribution of Tensile and Bond Stresses Along Reinforcing Bars,” ACI Journal Proceedings, V. 48, No. 11, Nov., pp. 225-252.
Regier, R., and Hoult, N. A., 2014b, “Distributed Strain Behavior of a Reinforced Concrete Bridge: Case Study,” Journal of Bridge Engi-neering, ASCE, V. 19, No. 12, p. 05014007 doi: 10.1061/(ASCE)BE. 1943-5592.0000637
Regier, R., and Hoult, N. A., 2014a, “Concrete Deterioration Detection Using Distributed Sensors,” Proceedings of the ICE—Structures and Build-ings, V. 168, No. 2, pp. 118-126.
Russo, G.; Pauletta, M.; and Mitri, D., 2009, “Solution for Bond Distri-bution in Asymmetric RC Structural Members,” Engineering Structures, V. 31, No. 3, pp. 633-641. doi: 10.1016/j.engstruct.2008.11.003
Russo, G., and Romano, F., 1992, “Cracking Response of RC Members Subjected to Uniaxial Tension,” Journal of Structural Engineering, ASCE, V. 118, No. 5, pp. 1172-1190. doi: 10.1061/(ASCE)0733-9445(1992)118:5(1172)
Scott, R. H., and Gill, P. A. T., 1987, “Short-Term Distributions of Strain and Bond Stress Along Tension Reinforcement,” The Structural Engineer, V. 65, No. 2, pp. 39-43.
Villalba, S., and Casas, J., 2013, “Application of Optical Fiber Distrib-uted Sensing to Health Monitoring of Concrete Structures,” Mechanical Systems and Signal Processing, V. 39, No. 1-2, pp. 441-451. doi: 10.1016/ j.ymssp.2012.01.027
Wu, H. Q., and Gilbert, R. I., 2009, “Modeling Short-Term Tension Stiffening in Reinforced Concrete Prisms Using a Continuum-Based Finite Element Model,” Engineering Structures, V. 31, No. 10, pp. 2380-2391. doi: 10.1016/j.engstruct.2009.05.012