23
Distributed Technologies: Part of the Problem or Part of the Solution? Tom Starrs Vice President, Market Strategy & Policy June 17, 2014
| Date post: | 26-Dec-2015 |
| Category: |
Documents |
| Upload: | moris-anderson |
| View: | 212 times |
| Download: | 0 times |
Distributed Technologies: Part of the Problem or Part of the Solution?
Tom Starrs
Vice President, Market Strategy & PolicyJune 17, 2014
2© 2014 SunPower Corporation. All Rights Reserved.
Safe Harbor Statement
This presentation contains “forward-looking statements” within the meaning of the Private Securities Litigation Reform Act of 1995, including, but not limited to, statements regarding (1) our plans and objectives for existing and future project development and construction; (2) our technological evolution and research and development activities; and (3) worldwide product demand and market forecasts. These forward-looking statements are based on our current assumptions, expectations and beliefs and involve substantial risks and uncertainties that may cause results, performance or achievement to materially differ from those expressed or implied by these forward-looking statements. Factors that could cause or contribute to such differences include, but are not limited to: (1) competition in the industry and downward pressure on average selling prices; (2) our liquidity, substantial indebtedness, and our ability to obtain additional financing for our projects and our customers; (3) our ability to meet our cost reduction targets; (4) regulatory changes and the availability of economic incentives promoting use of solar energy; (5) challenges inherent in constructing and maintaining certain of our large projects, such as the Solar Star projects; (6) the success of our ongoing research and development efforts and commercialization of new products and services; (7) fluctuations in our operating results; (8) manufacturing difficulties that could arise; and (9) challenges managing our joint ventures. A detailed discussion of these factors and other risks that affect our business is included in filings we make with the Securities and Exchange Commission (SEC) from time to time, including our most recent reports on Form 10-K and Form 10-Q, particularly under the heading “Risk Factors.” Copies of these filings are available online from the SEC or on the SEC Filings section of our Investor Relations website at investors.sunpowercorp.com. All forward-looking statements in this presentation are based on information currently available to us, and we assume no obligation to update these forward-looking statements in light of new information or future events.
3© 2014 SunPower Corporation. All Rights Reserved.
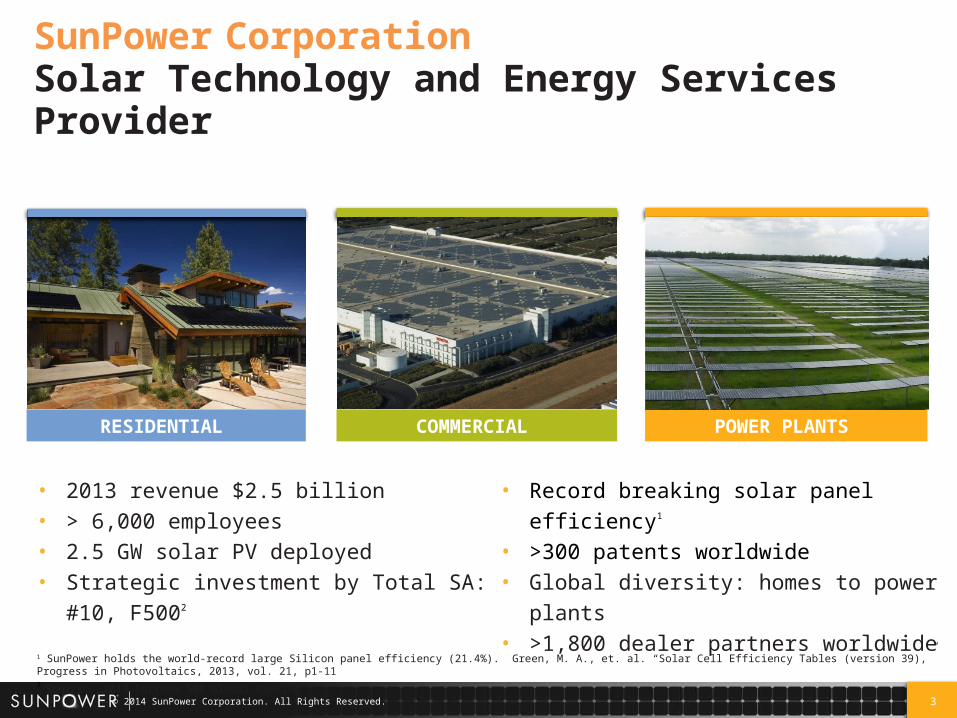
SunPower CorporationSolar Technology and Energy Services Provider
• 2013 revenue $2.5 billion• > 6,000 employees• 2.5 GW solar PV deployed • Strategic investment by Total SA: #10, F5002
• Record breaking solar panel efficiency1
• >300 patents worldwide• Global diversity: homes to power plants• >1,800 dealer partners worldwide
POWER PLANTSCOMMERCIALRESIDENTIAL
1 SunPower holds the world-record large Silicon panel efficiency (21.4%). Green, M. A., et. al. “Solar Cell Efficiency Tables (version 39),” Progress in Photovoltaics, 2013, vol. 21, p1-112
Source: 2013 Fortune 500 Global Ranking
.
4© 2014 SunPower Corporation
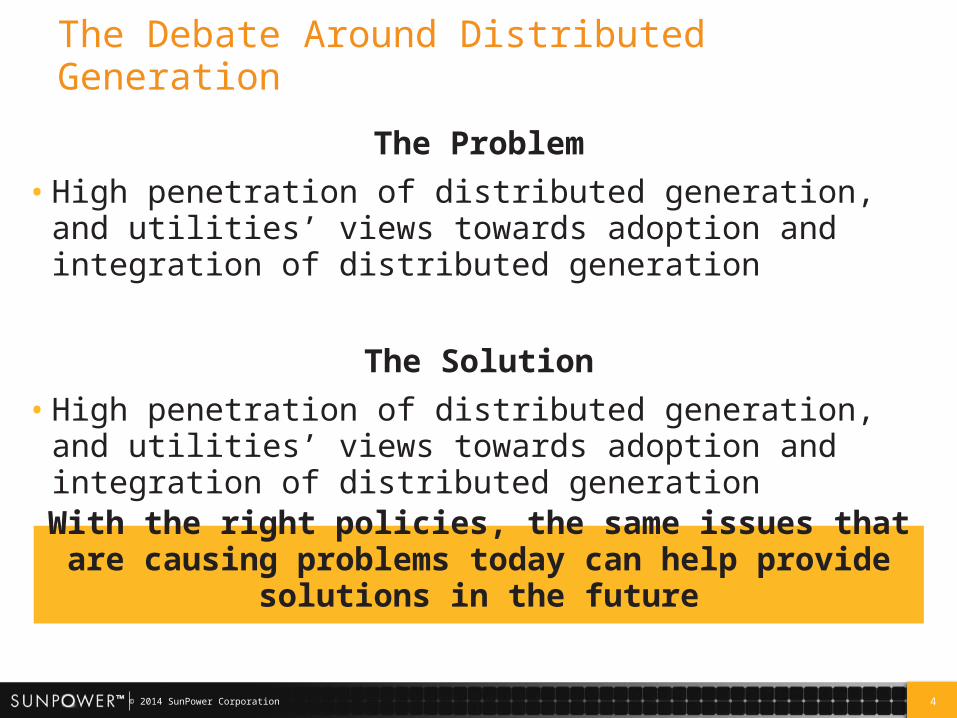
The Debate Around Distributed Generation
The Problem
• High penetration of distributed generation, and utilities’ views towards adoption and integration of distributed generation
The Solution
• High penetration of distributed generation, and utilities’ views towards adoption and integration of distributed generation
With the right policies, the same issues that are causing problems today can help provide solutions in the future
5© 2014 SunPower Corporation
Where We Are Today
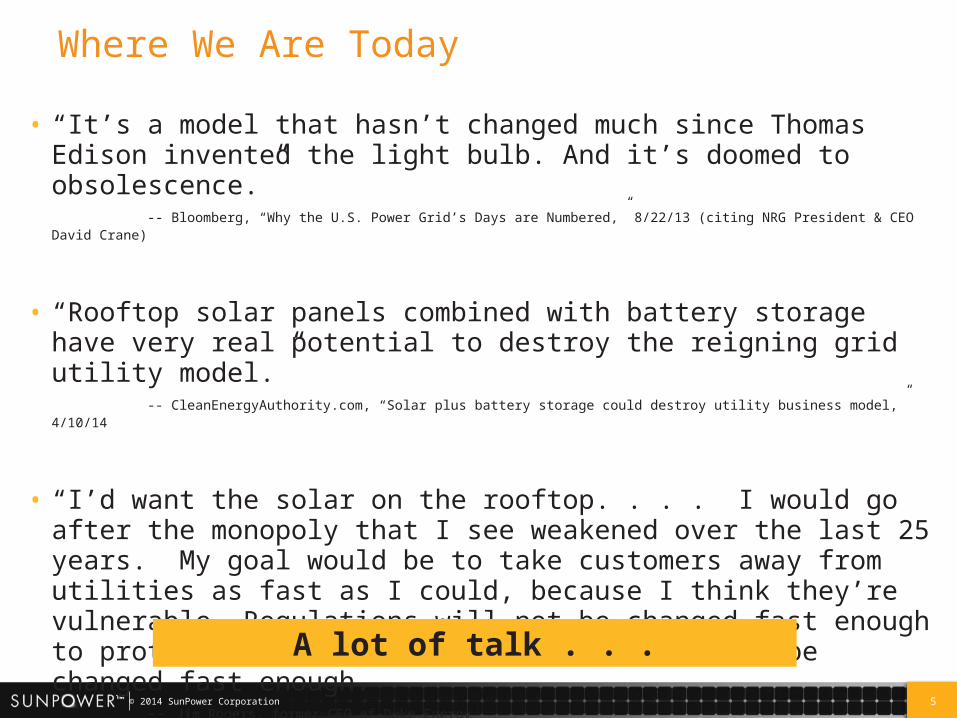
• “It’s a model that hasn’t changed much since Thomas Edison invented the light bulb. And it’s doomed to obsolescence.”
-- Bloomberg, “Why the U.S. Power Grid’s Days are Numbered,” 8/22/13 (citing NRG President & CEO David Crane)
• “Rooftop solar panels combined with battery storage have very real potential to destroy the reigning grid utility model.”
-- CleanEnergyAuthority.com, “Solar plus battery storage could destroy utility business model,” 4/10/14
• “I’d want the solar on the rooftop. . . . I would go after the monopoly that I see weakened over the last 25 years. My goal would be to take customers away from utilities as fast as I could, because I think they’re vulnerable. Regulations will not be changed fast enough to protect them. The business model will not be changed fast enough.”
-- Jim Rogers, former CEO of Duke Energy
A lot of talk . . .
6© 2014 SunPower Corporation
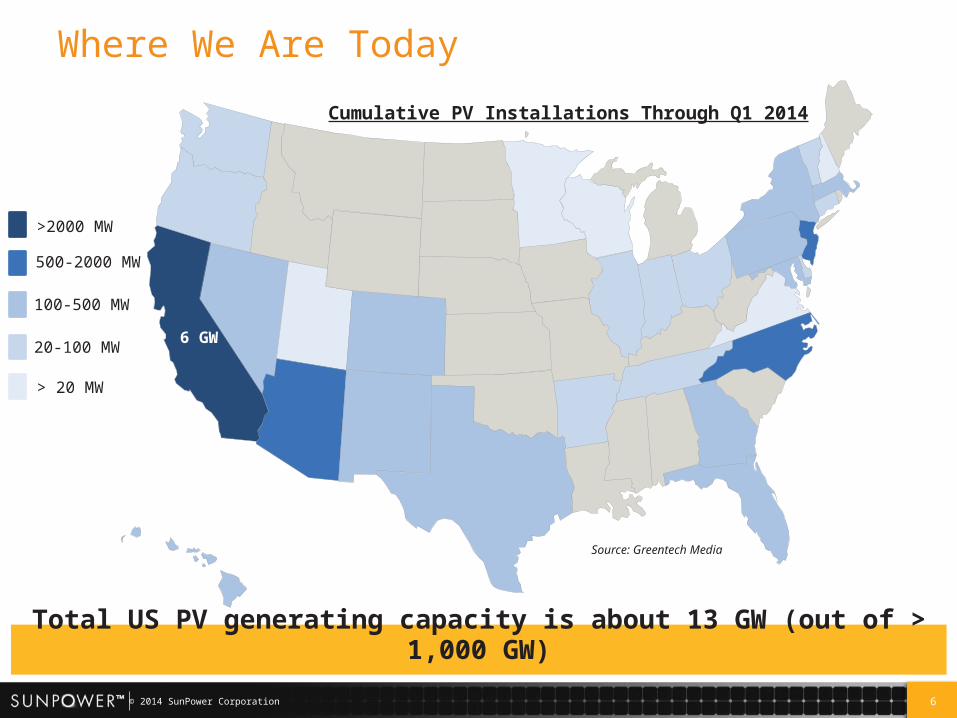
Where We Are Today
> 20 MW
Cumulative PV Installations Through Q1 2014
Total US PV generating capacity is about 13 GW (out of > 1,000 GW)
20-100 MW
100-500 MW
500-2000 MW
>2000 MW
6 GW
Source: Greentech Media
7© 2014 SunPower Corporation
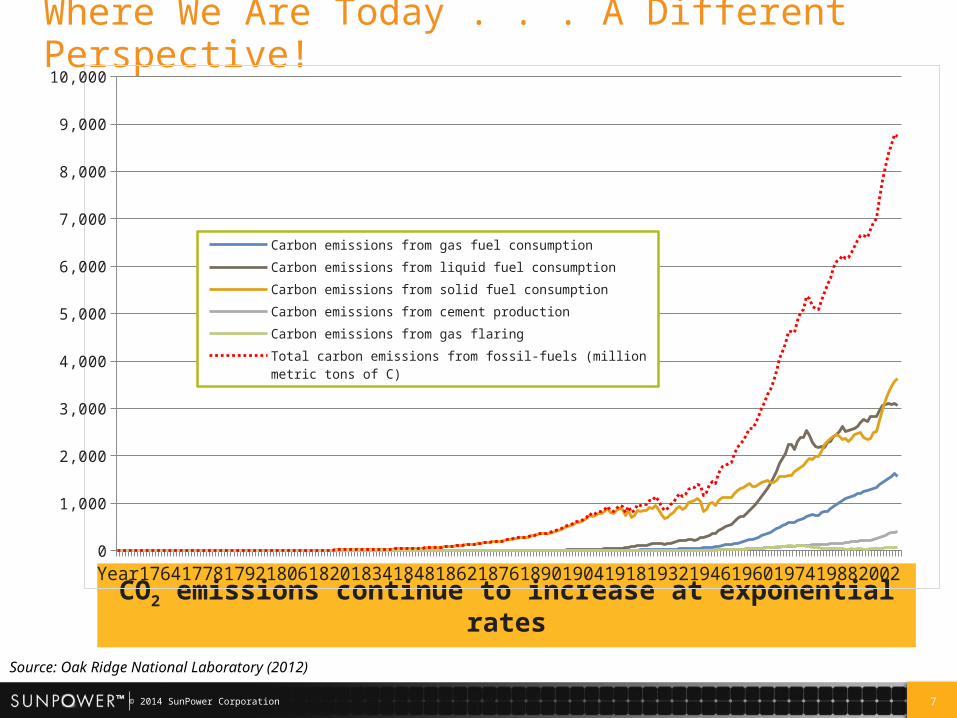
Where We Are Today . . . A Different Perspective!
CO2 emissions continue to increase at exponential rates
Year1764177817921806182018341848186218761890190419181932194619601974198820020
1,000
2,000
3,000
4,000
5,000
6,000
7,000
8,000
9,000
10,000
Carbon emissions from gas fuel consumption
Carbon emissions from liquid fuel consumption
Carbon emissions from solid fuel consumption
Carbon emissions from cement production
Carbon emissions from gas flaring
Total carbon emissions from fossil-fuels (million metric tons of C)
Source: Oak Ridge National Laboratory (2012)
8© 2014 SunPower Corporation© 2014 SunPower Corporation. All Rights Reserved.
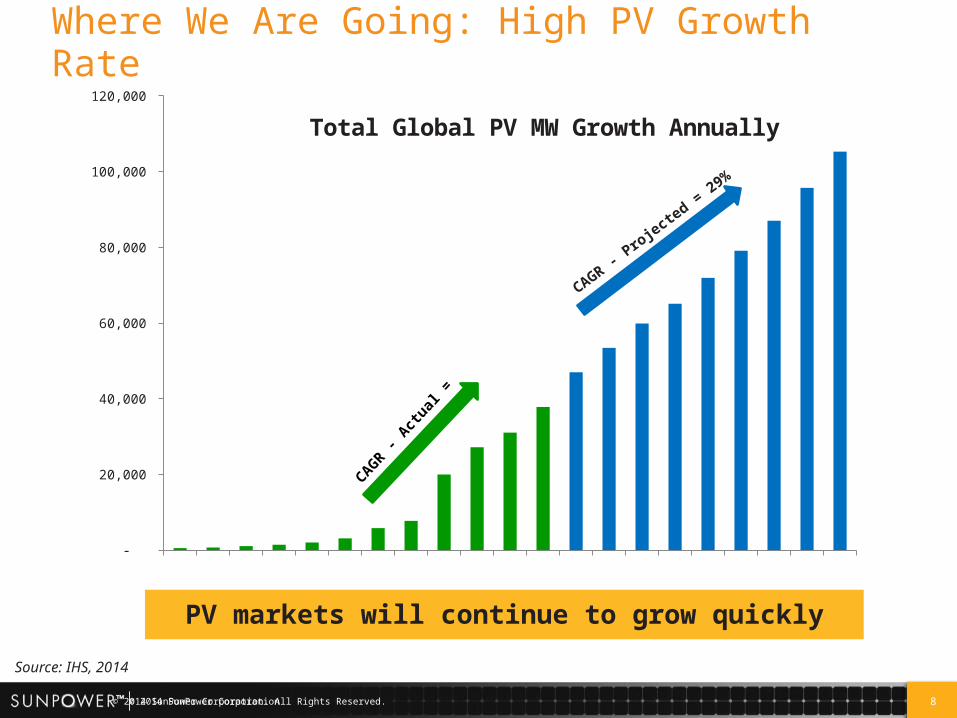
Where We Are Going: High PV Growth Rate
Source: IHS, 2014
PV markets will continue to grow quickly
2002 2003 2004 2005 2006 2007 2008 2009 2010 2011 2012 2013 2014 2015 2016 2017 2018 2019 2020 2021 2022 -
20,000
40,000
60,000
80,000
100,000
120,000
Total Global PV MW Growth Annually
CAGR -
Actua
l = 4
3%
CAGR - Pro
jected = 29%
9© 2014 SunPower Corporation© 2014 SunPower Corporation. All Rights Reserved.
Total capacity of renewables(As of Year End 2000)
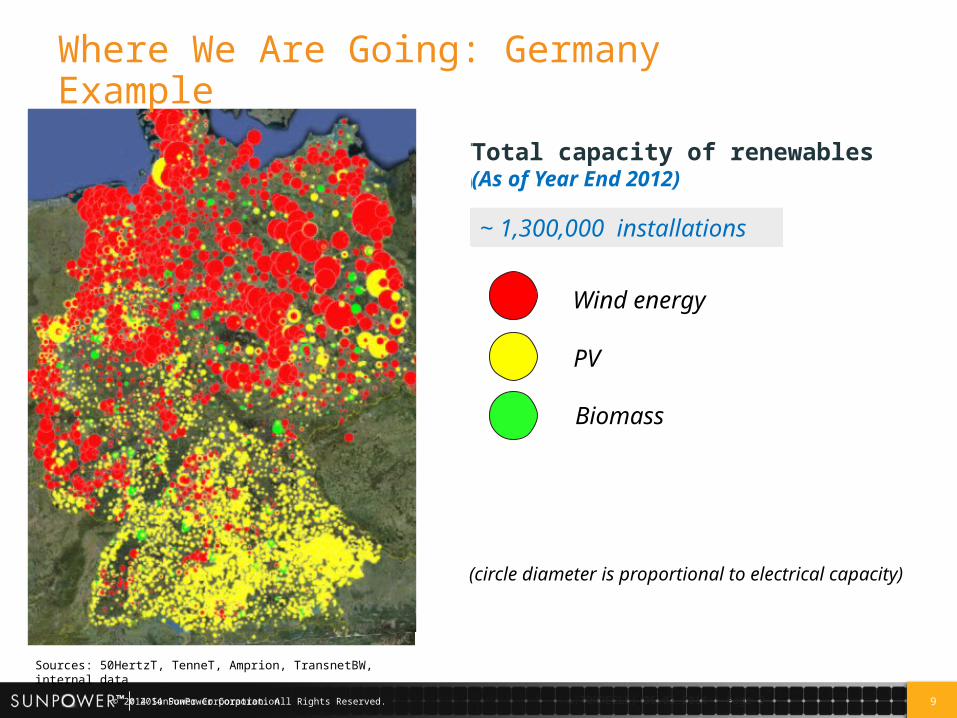
Wind energy
PV
Biomass
(circle diameter is proportional to electrical capacity)
~ 30,000 installations~ 221,000 installations
Total capacity of renewables(As of Year End 2005)
~ 750,000 installations
Total capacity of renewables(As of Year End 2010)
~ 1,300,000 installations
Total capacity of renewables(As of Year End 2012)
A.TORREELE| 05.02.2014 | Page 9
Where We Are Going: Germany Example
Sources: 50HertzT, TenneT, Amprion, TransnetBW, internal data
10© 2014 SunPower Corporation
The Solution: Technology & Policy
• Technology
– Storage
– Advanced metering infrastructure
– Home energy management systems (HEMS)
– And more…
• Policy
– Dynamic pricing (time-of-use or real-time pricing)
– Payments to DER owners for grid services they provide
– Minimum bills to ensure all customers contribute to cost of maintaining grid
– Preservation of the right to self-consume without penalty
Both technology and policy are key to integrating DER effectively
11© 2014 SunPower Corporation
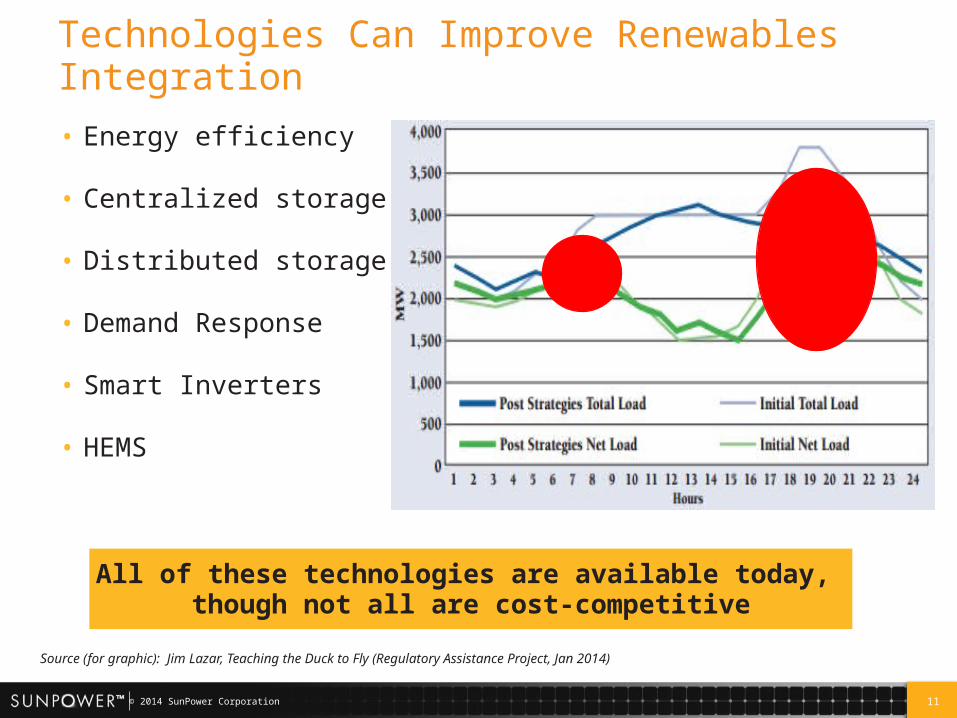
Technologies Can Improve Renewables Integration
• Energy efficiency
• Centralized storage
• Distributed storage
• Demand Response
• Smart Inverters
• HEMS
All of these technologies are available today, though not all are cost-competitive
Source (for graphic): Jim Lazar, Teaching the Duck to Fly (Regulatory Assistance Project, Jan 2014)

12© 2014 SunPower Corporation
Technology: The Benefits of Solar + Storage
Energy
Grid Services
Capacity
Financial
Security
Environmental
Social
Self consumption & avoided losses
Deferred capacity & arbitrage potential
Source of ancillary servicesEnables scheduling & forecasting
Hedging & price response opportunities
Provide reliability & resilience
Reduced emissions & pollutants
Economic development benefits
13© 2014 SunPower Corporation
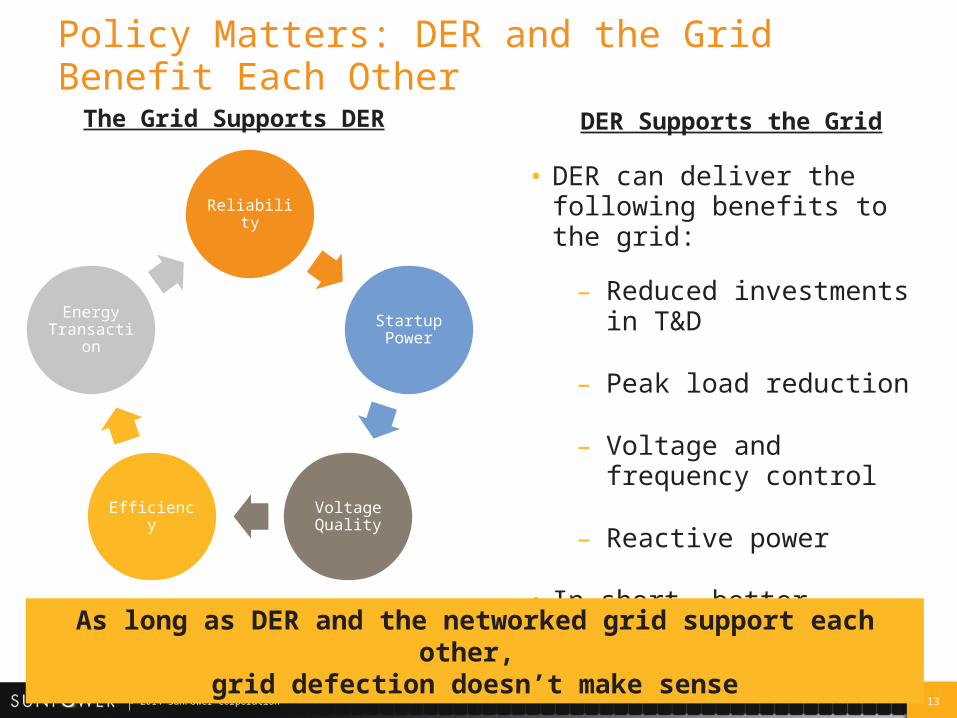
Policy Matters: DER and the Grid Benefit Each Other
Reliability
Startup Power
Voltage QualityEfficiency
Energy Transaction
The Grid Supports DER DER Supports the Grid
• DER can deliver the following benefits to the grid:
– Reduced investments in T&D
– Peak load reduction
– Voltage and frequency control
– Reactive power
• In short, better utilization of network sources!
As long as DER and the networked grid support each other, grid defection doesn’t make sense
14© 2014 SunPower Corporation
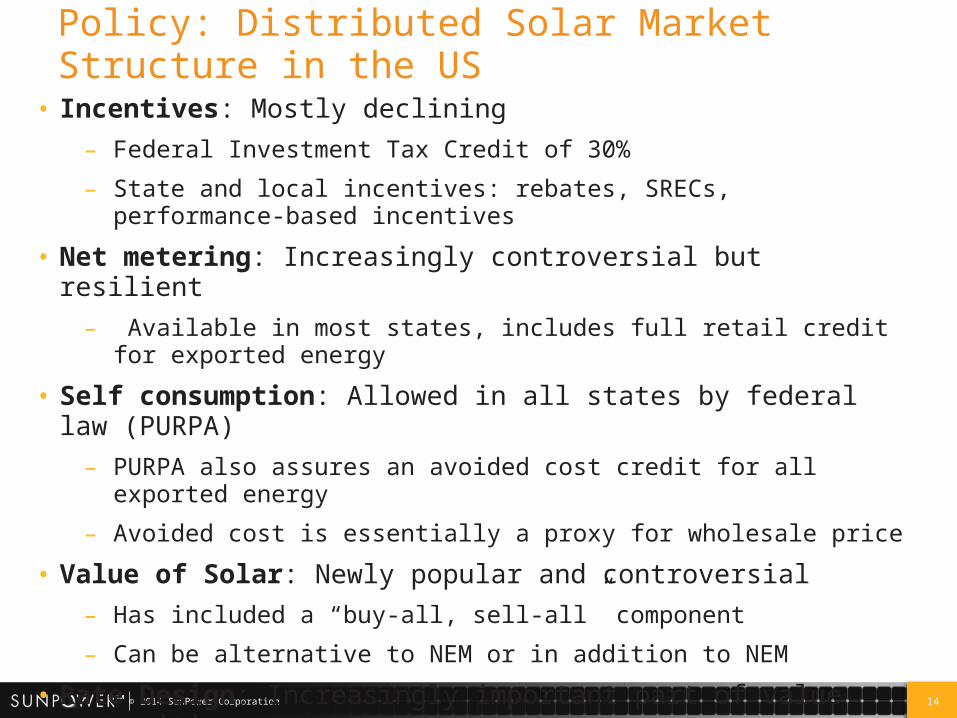
Policy: Distributed Solar Market Structure in the US
• Incentives: Mostly declining
– Federal Investment Tax Credit of 30%
– State and local incentives: rebates, SRECs, performance-based incentives
• Net metering: Increasingly controversial but resilient
– Available in most states, includes full retail credit for exported energy
• Self consumption: Allowed in all states by federal law (PURPA)
– PURPA also assures an avoided cost credit for all exported energy
– Avoided cost is essentially a proxy for wholesale price
• Value of Solar: Newly popular and controversial
– Has included a “buy-all, sell-all” component
– Can be alternative to NEM or in addition to NEM
• Rate Design: Increasingly important part of value proposition
– Some adoption of time-of-use rates, but far from universal
– Very few utilities have imposed charges specifically for DG customers
15© 2014 SunPower Corporation
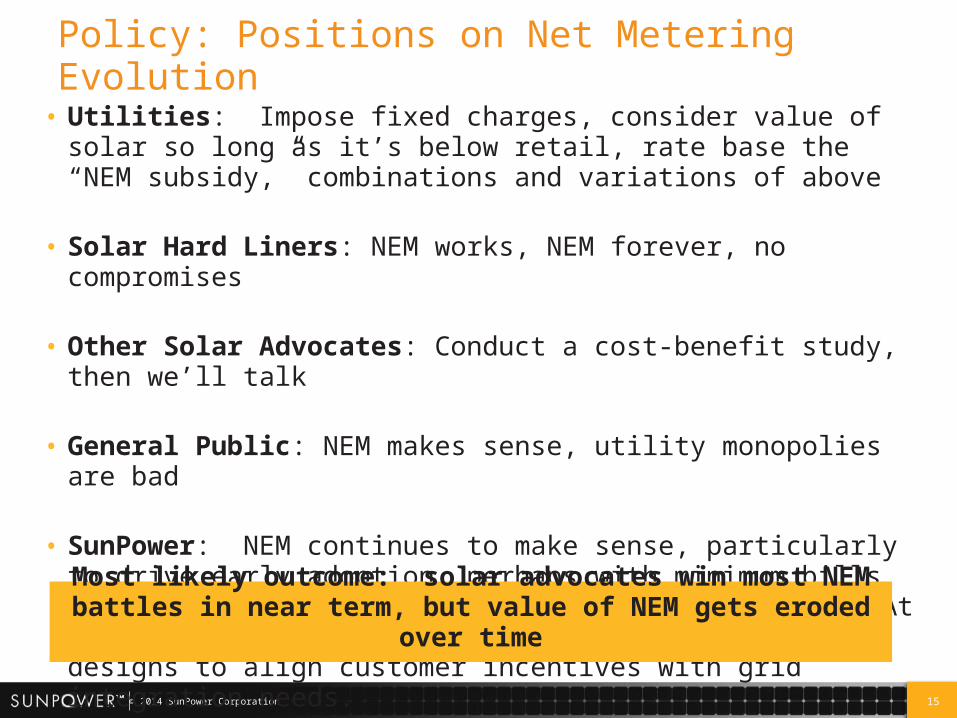
Policy: Positions on Net Metering Evolution
• Utilities: Impose fixed charges, consider value of solar so long as it’s below retail, rate base the “NEM subsidy,” combinations and variations of above
• Solar Hard Liners: NEM works, NEM forever, no compromises
• Other Solar Advocates: Conduct a cost-benefit study, then we’ll talk
• General Public: NEM makes sense, utility monopolies are bad
• SunPower: NEM continues to make sense, particularly to drive early adoption, perhaps with minimum bills to ensure customer contribution to cost recovery. At high market penetration, look to alternative rate designs to align customer incentives with grid integration needs.
Most likely outcome: solar advocates win most NEM battles in near term, but value of NEM gets eroded over time
16© 2014 SunPower Corporation
Policy: Basic Rate Design Principles for DER
• Customers have a right to use or not use electricity provided from the grid and on-site devices
• Customers own all benefits of on-site generation unless they contract those rights to others
• Customers choosing to reduce their energy consumption should be treated on a non-discriminatory basis
• Although it can be hard to value the benefits of exported power, many studies have suggested that net metering is a reasonable proxy for the value while DG penetration is low
17© 2014 SunPower Corporation
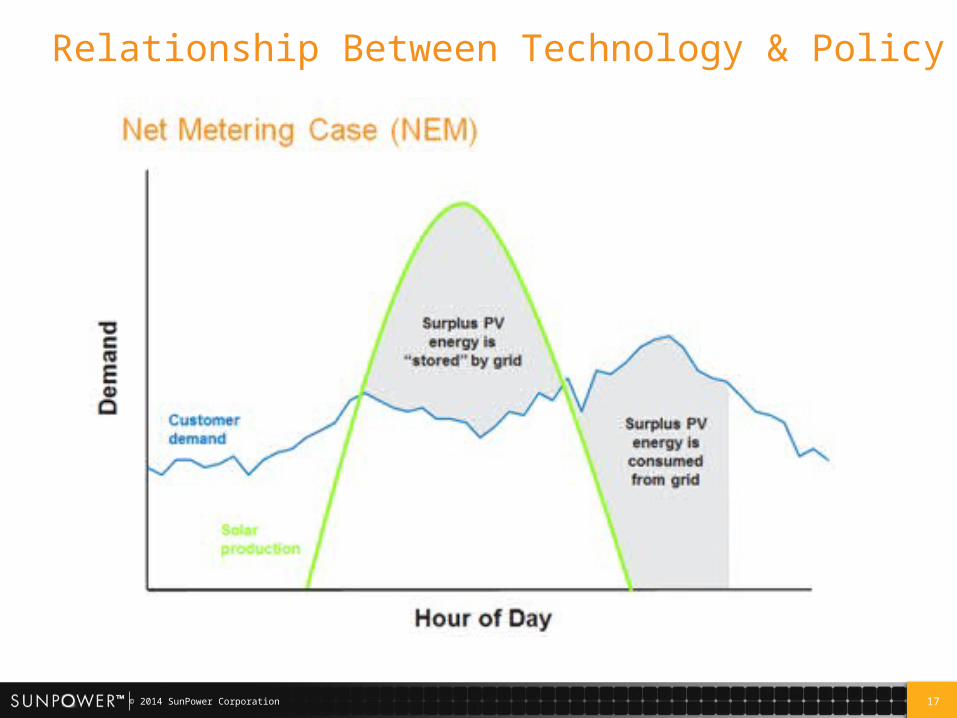
Relationship Between Technology & Policy
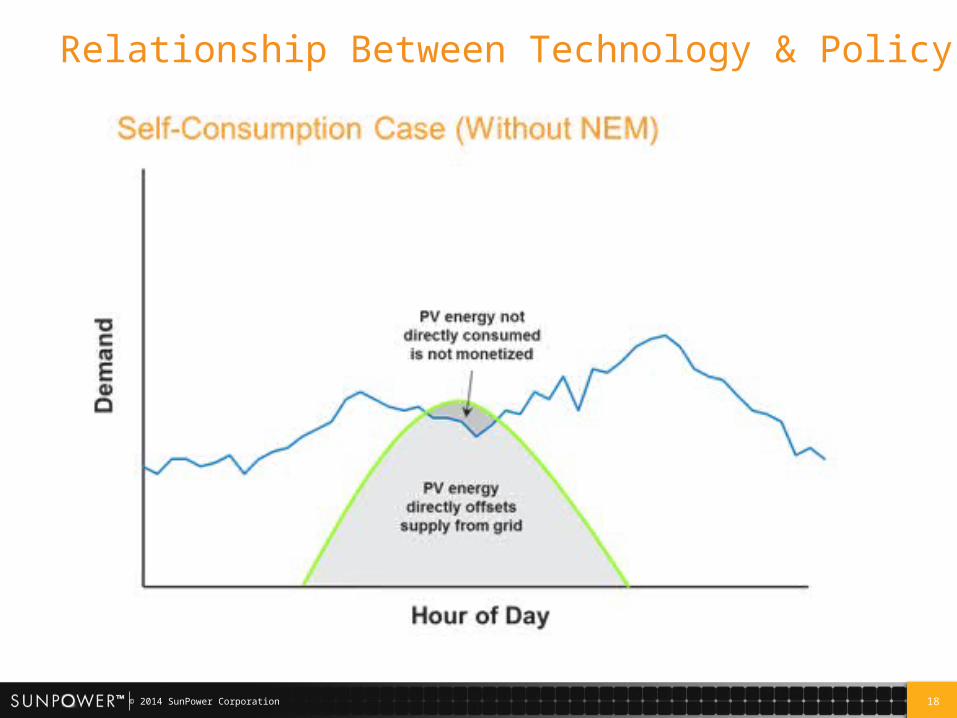
18© 2014 SunPower Corporation
Relationship Between Technology & Policy

19© 2014 SunPower Corporation
Relationship Between Technology & Policy
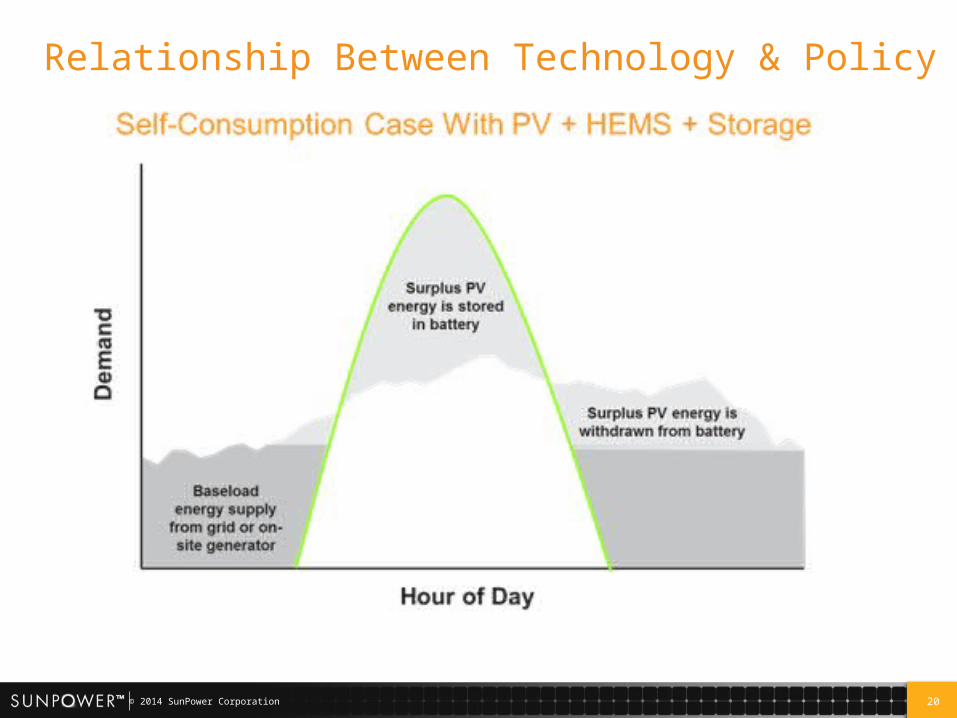
20© 2014 SunPower Corporation
Relationship Between Technology & Policy
21© 2014 SunPower Corporation
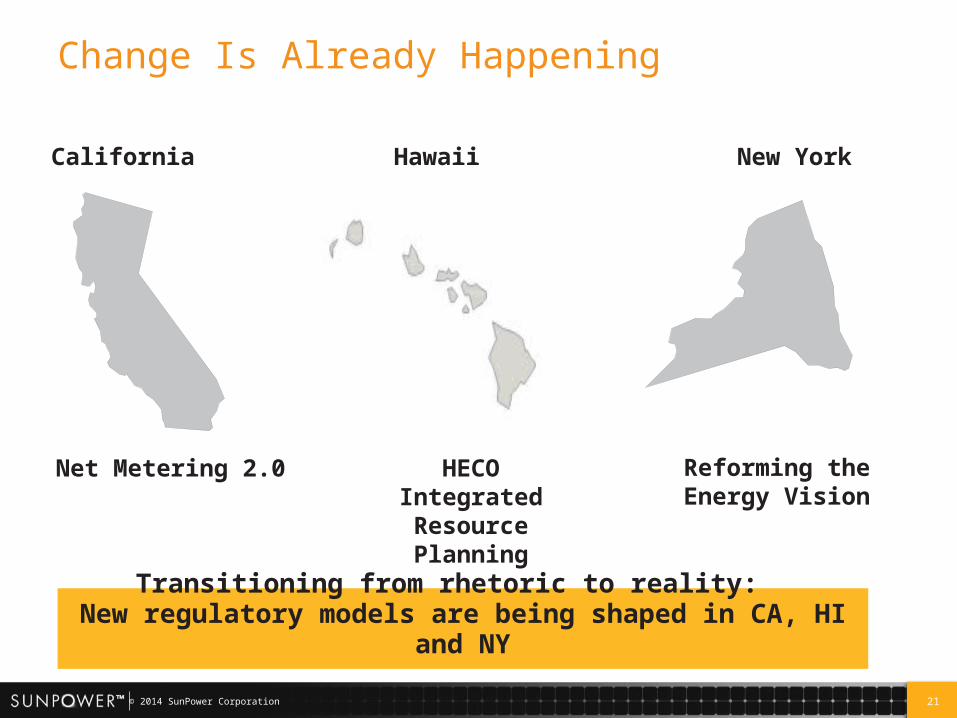
Change Is Already Happening
Transitioning from rhetoric to reality: New regulatory models are being shaped in CA, HI and NY
California Hawaii New York
Net Metering 2.0 HECO Integrated Resource Planning
Reforming the Energy Vision

22© 2014 SunPower Corporation
Thanks for listening!
Contact Information:Tom Starrs
©2014 SunPower Corporation. All rights reserved. SUNPOWER, the SUNPOWER logo, MAXEON, and MORE ENERGY. FOR LIFE. are trademarks or registered trademarks of SunPower Corporation in the U.S. and other countries as well. All other trademarks are the property of their respective owners.


