Statistics Canada Agriculture Division Agriculture and Rural Working Paper Series Working Paper No. 47 Distribution and Concentration of Canadian Livestock Prepared by Martin S. Beaulieu, MSc, Analyst Analysis and Development Section [email protected]Frédéric Bédard, MSc, Geomatics Specialist Spatial Analysis and Geomatics Application [email protected]Pierre Lanciault, PhD, Research Scientist Formerly with Spatial Analysis and Geomatics Application Statistics Canada, Agriculture Division Jean Talon Building, 12th floor Tunney’s Pasture Ottawa, Ontario K1A 0T6 April 2001 The responsibility of the analysis and interpretation of the results is that of the authors and not of Statistics Canada.
Transcript
StatisticsCanadaAgriculture Division
Agriculture and Rural Working Paper SeriesWorking Paper No. 47
Distribution and Concentrationof Canadian Livestock
Prepared byMartin S. Beaulieu, MSc, AnalystAnalysis and Development [email protected]
Frédéric Bédard, MSc, Geomatics SpecialistSpatial Analysis and Geomatics [email protected]
Pierre Lanciault, PhD, Research ScientistFormerly with Spatial Analysis and Geomatics Application
The responsibility of the analysis and interpretation of the results is that of the authors and not ofStatistics Canada.
StatisticsCanadaAgriculture Division
Agriculture and Rural Working Paper SeriesWorking Paper No. 47
Distribution and Concentrationof Canadian Livestock
Published by authority of the Minister responsible for Statistics Canada.
Minister of Industry, 2001.
All rights reserved. No part of this publication may be reproduced, stored in a retrievalsystem or transmitted in any form or by any means, electronic, mechanical, photocopying,recording or otherwise without prior written permission from Licence Services, MarketingDivision, Statistics Canada, Ottawa, Ontario, Canada K1A 0T6.
April 2001
Catalogue No. 21-601-MIE01047
Frequency: Occasional
Ottawa
La version française est disponible sur demande (no 21-601-MIF01047 au catalogue)
_____________________________________________________________________Note of appreciation: Canada owes the success of its statistical system to a longstandingpartnership between Statistics Canada and the citizens, businesses and governments ofCanada. Accurate and timely statistical information could not be produced without theircontinued co-operation and good will.
Catalogue no. 21-601-MIE01047
Highlights
The total number of livestock farms in Canada has shrunk over time. However, the number of largefarms is on the rise. With large farms come large concentrations of animals and manure in some areas.
This study gives a ‘snapshot’ of where the larger concentrations of livestock and poultry were at thetime of the Census of Agriculture in May 1996. Livestock concentrations (or densities) were analysed interms of the total livestock population, irrespective of the different types of animals raised.
The report shows the following:
• In May 1996, 20% of Canada’s livestock was found in areas with high concentrations of livestock(high-density areas).
• Provinces with the most livestock in high-density areas were Quebec, Ontario, Alberta and BritishColumbia.
• In Quebec, British Columbia and Ontario, over 30% of the livestock in each province was in high-density areas.
• The largest livestock populations found in high-density areas were beef cattle in Alberta, dairy cattleand hogs in Quebec, and dairy cattle in Ontario.
• Livestock concentration is not necessarily linked to large livestock populations. Several high-densityareas appeared to be due to a rather limited amount of livestock associated with an even smallerfarmland base.
More research, using farm-level data and characteristics, is required to determine which type of farmscontributed the most to a greater concentration of livestock in some areas. Further work is requiredbefore concluding whether or not the livestock concentration in certain regions has reached limits whereit could pose an ecological threat.
Catalogue no. 21-601-MIE01047 i
Table of contents
List of appendices ii
List of figures ii
List of tables ii
List of maps ii
Introduction and background 1
Concepts 3Animal units 3Livestock density on farmland area 3Census geographical component (CGC) 4Density classes 4Livestock operations 4
Methods, coverage and limitations 5Conversion to animal units 5GIS methods 5
Centroids 5Radius 7Interpolation 8
Data sources and coverage 9Limitations 10
Inventory versus flow 10Headquarters rule 10Census errors 10Terrain analysis 10
Findings 11Locations of high concentrations of livestock 11Types of livestock found in high-density areas 15
Conclusion 17
References 18
Appendices 21
Catalogue no. 21-601-MIE01047 ii
List of appendices
A: Definitions 21B: Regulations, codes of practice and municipal by-laws related to livestock manure management 22C: Animal unit coefficients 25D: Map of proportion of farmland to total land 26E: Difference between livestock densities based on 20-kilometre radius method and densities based on
enumeration area data 27F: Regional maps 28
List of figures
1: Distribution of livestock within each density class, by province, May 1996 112: Distribution of livestock, by province and density, May 1996 123: National distribution of livestock, by livestock type and density, May 1996 154: Proportion of livestock in high-density areas, by livestock type and province, May 1996 165: Numbers of livestock in high-density areas, by livestock type and province, May 1996 16
List of tables
1: Distribution of livestock, by province and density, May 1996 11 2: High livestock density areas, by sub-basin, May 1996 143: Livestock in high-density areas, by livestock type and province, May 1996 15
List of maps
1: Impact of irregular shapes and sizes of enumeration areas on livestock density measurement 62: Impact of selecting centroids inside a standard circle on livestock density measurement 73. Impact of the interpolation technique on livestock density display for irregular areas 94: Livestock density, Canada, May 1996 13D1: Map of proportion of farmland to total land 26F1: Livestock density on farmland, British Columbia 28F2: Livestock density on farmland, Alberta 29F3: Livestock density on farmland, Saskatchewan/Manitoba 30F4: Livestock density on farmland, Ontario 31F5: Livestock density on farmland, Quebec 32F6: Livestock density on farmland, Atlantic provinces 33
Catalogue no. 21-601-MIE01047 1
Introduction and background
Although the number of farm holdings in Canada is shrinking, the number of large farms is growing.The decreasing importance of small farms in terms of production and their position in the marketplace isa long-term trend observed in Canada and in most developed countries.1 Decreasing commodity pricesand cost efficiencies achieved through economies of scale and the adoption of new technologies havecontributed more than anything else to reshaping and redefining the structure of modern agriculture.
It is not yet clear how the industrialization of agriculture has affected Canada’s natural resources such assoil and water. The perception is that smaller family-run farms represent a lesser threat to human healthand the environment. However, smaller farms are often operating under tight margins, making thecapital investments required for sound environmental and manure management practices difficult. In thelivestock2 industry, large and intensive operations have become a nuisance for some and a symbol ofpride for others. Many people are concerned about the intensification of livestock farms and its possibleimpacts on the resource base, particularly on water and air quality.3
Large livestock operations produce large amounts of manure that must be carefully stored, moved andincorporated into the soil. Manure is a natural fertilizer whose benefits include adding nutrients andorganic matter to the soil and reducing the use of chemical fertilizers. Manure also improves the soilstructure, which in return reduces the risk of erosion, run-off and the infiltration of chemicals, organicsubstances or pathogens into surface and ground water. The agronomic and environmental contributionsof manure are well documented.4 However, high concentrations of livestock and the large amounts ofmanure they produce are leading many people to wonder whether we can get ‘too much of a good thing’and whether production systems based on large intensive operations are sustainable in the long term.Caldwell (1998) notes that the capacity of the soil, ground water and air in a given area to receivelivestock manure is at least partially related to the concentration of livestock in that area.5 However,these links have yet to be defined.
Some argue that manure management is a non-issue as long as manure is applied on a large land baseand its management is closely monitored. There appears to be a positive correlation between farm sizeand the ability to adhere to the recommended management practices—perhaps because large operationsalso have the financial resources required to allow them to stay up to date with more stringentenvironmental standards and manure management practices. On the other hand, these same larger farmstend to be more intensive and have higher concentrations of livestock than smaller farms.6
1. For examples of the increasing importance of large livestock farms worldwide, see Janzen et al. (1999), Glenn (1999),Caldwell (1998) and Fedkiw (1992). As a comparison closer to home, the 1995 Quebec provincial average was 996 pigs perpig farm, compared with 475 in Ontario, 516 in Denmark and 2,352 in North Carolina (MAPAQ 1999).2. For simplicity, the term ‘livestock’ is loosely used to include all animal farms, including poultry.3. For examples, see Toombs (1997, 1998), Fleming et al. (1997), Manitoba Agriculture (2000), Tessier (1998), Mallin(2000), Stone et al. (1998), Nikiforuk (2000) and Mitchell et al. (2000). Analyses of the risk of nitrogen and phosphoruscontamination are produced in MacDonald (2000a,b), Bolinder et al. (2000) and Eghball and Gilley (1999).4. For thorough reviews, see Eghball and Power (1994), Choudhary et al. (1996), Haynes and Naidu (1998) and Van Hornand Hall (1997).5. Caldwell (1998), p. 104.6. Schmitt et al. (1996).
Catalogue no. 21-601-MIE01047 2
The disposal of manure is an issue, given that manure hauling costs increase with distance. In manycases, manure must be transported some distance from the source in order to avoid applying it moreheavily than recommended. This can be a real concern in areas where animal populations and densitiesare high.7 Land near livestock operations may receive more manure than the soil and plants can use,while land further away receives none.8 Possible accidents or spills associated with large storage,hauling and spreading equipment also may present greater environmental risks. These potentialproblems could be amplified in areas where farmland adjoining the livestock operations is limited.
Using geographic information systems (GIS) to analyse the concentration of livestock productionexpressed in generic animal units, this report focusses on the locations of high concentrations oflivestock and the types of livestock found in these high-density areas. Most other studies have produceddensity information for specific types of livestock.9 This report provides maps and research that analyselivestock densities in terms of the total livestock population, irrespective of the different types ofanimals raised.10 Presenting the density of the total livestock population in a particular area is a goodway to evaluate its impact on the environment.
The analysis provides information that will benefit planners, investors, non-governmental organizations,rural communities and governments interested in expanding livestock production in a sustainable andresponsible manner.
7. Lauwers et al. (1998).8. Roka and Hoag (1994).9. For examples, see Marchand and McEwan (1997), Statistics Canada (1994, 1999a, 2000a,b) and CSALE (1996).10. For examples, see Bernard (1999), GREPA (2000) and Letson and Gollehon (1998).
Catalogue no. 21-601-MIE01047 3
Concepts
Animal unitsIn order to determine livestock density, we used the concept of ‘animal units’ to create equivalenceamong different types of livestock, regardless of type, age or end use. This concept is often used inregulations, codes of practice and municipal by-laws related to livestock production (see Appendix B).
This concept, originally developed in the United States in the 1960s, is based on the number of animalsthat would produce the 73 kilograms of nitrogen required to fertilize one acre of corn for one year. Thenumber of animals of a given kind—such as broiler chickens or beef steers—in one animal unit isexpressed as a coefficient. One cow, for example, equals approximately one animal unit, while foursows or 125 broiler chickens will be required for one unit. Because of genetic and nutritionalimprovements to livestock, these coefficients have been recalculated since they were first developed.
Two methods have been used to estimate the amount of nitrogen produced by animals in a 12-monthperiod: the Nitrogen Production Method,11 based on average live animal weights; and the FeedConsumption Method, based on the conversion of feed protein into excreted nitrogen. More recentresearch has calculated coefficients based on phosphorus excretion.12 For a number of reasons,coefficients vary across regions, provinces and countries. The coefficients used in Canada werereviewed and have proved to be very similar and consistent. (See Appendix C for the coefficients usedin this study.)
Livestock density on farmland areaLivestock density refers to the number of animal units per km2 (100 hectares) of farmland. Farmlandincludes all cropland, summerfallow, and improved and unimproved pasture. Land that was not inagriculture and areas of farms—such as barnyards, laneways, woodlots and marshes13— that were notsuitable for manure disposal were excluded from the calculation. Appendix D presents a map showingthe proportion of farmland to total land.
Livestock density was calculated using the farmland available for spreading manure within a 20-kilometre radius of the centre of each enumeration area, the smallest standard geographic area for whichcensus data are reported.14 The 20-kilometre radius was selected based on two assumptions: itrepresented the maximum distance manure could be hauled economically; and no quantity wastransported outside this circle. (For more detail, see Radius under GIS methods.)
To derive the livestock density within each circle, the number of animal units within 20 kilometres ofthe centre of each enumeration area was calculated and divided by the farmland area. (See GIS methodsfor further details.)
11. For details, see American Society of Agricultural Engineers (1993) and Midwest Plan Service (1985).12. In some regions, buildup of phosphorus in the soil has become a limiting factor in soil fertilization. See Simard et al.(1995, 1998, 1999), Bolinder et al. (2000) and Eghball et al. (1996). Because less can be applied, manure must be hauled to agreater distance (Fleming et al. 1998).13. Also excluded were farm buildings, gardens, greenhouses, idle land, tree windbreaks, bogs, sloughs, etc.14. For details, see Statistics Canada. (1999b), pp. 210–212.
Catalogue no. 21-601-MIE01047 4
A standard shape, such as the circle around the centre point of each enumeration area, does not appear todistort the results and the visual display of the values as much as the multitude of irregular shapesassociated with political, administrative or environmental boundaries do. (Map 1 illustrates howirregular shapes and sizes of the enumeration area could affect the measurement of density.) Moreover,livestock densities may have little to do with predefined administrative boundaries and areas sincegrazing or manure hauling may cross administrative or watershed boundaries, especially in regionsdivided into many small administrative areas.
Census geographical componentThe census geographical component (CGC) of each farming operation is the geographic area(s) wherethe operation is located. An enumeration area may contain several CGCs, depending on the number offarming operations reported within it.
Agricultural operations may comprise numerous parcels of land in a number of locations. Farmoperators were asked to report on the Census form the location (quarter, section, lot number, township,concession, meridian, parish and county) of all land owned or leased from others, starting with the farmheadquarters. However, there was no specific question about the exact location of livestock.
In general, livestock reported by a farm were assumed to be kept near the farm’s headquarters. Animalunits were assigned to the enumeration area of the headquarters. This allocation was done regardless ofthe location of land holdings in the farm unit. Exceptionally large operations, with land holdings locatedin more than one municipality or even province, were divided into parts corresponding to the differentenumeration areas they occupied. This way, we were able to assign the livestock a geographical locationthat more closely reflected reality. However, this adjustment affected less than 0.2% of all the livestock.
Density classesThe continuum of livestock density, which can range from 0 to more than 1,000 animal units per km2 offarmland, is classified into 10 categories.15 In addition to the 0 animal unit per km2 category, thisresearch has clustered the other nine categories into three broad classes of livestock density: low (0.1 to3 animal units per km2); medium (between 3 and 80 animal units per km2); and high (over 80 animalunits per km2).
Livestock operationsA livestock operation is a census farm (see definition in Appendix A) that produces at least one of thefollowing products intended for sale: cattle, pigs, sheep, horses, exotic animals, hens, chickens, turkeys,exotic birds, milk or cream, eggs, wool, furs and meat.
15. The values of the 10 density classes can be seen in the legends of the maps in Appendix F. The divisions were madebased on statistical distribution. Thresholds for the high-density classes were reported in a number of studies indicating atwhich level there is potential risk to the environment. See Paquette (1998) and Schreier and Berka (1999).
Catalogue no. 21-601-MIE01047 5
Methods, coverage and limitations
Conversion to animal units
The animal inventory reported by farmers was converted to a common basis, animal units, bymultiplying the inventory for each type and age of livestock by specific coefficients (see Appendix C).
Individual totals were calculated at the enumeration area level for total livestock, cattle (beef and dairy),pigs, poultry and other livestock. Poultry included birds such as broilers, pullets and pullet chicks, layinghens and turkeys. Less common birds (such as geese and ducks) and exotic birds (such as ostriches,game birds and emus) were included in the ‘other’ category.
On the 1996 Census of Agriculture questionnaire, it was not possible to indicate whether calves, heifersand bulls were beef or dairy. They were allocated as dairy or beef cattle based on historical patterns,farm types, ratios and provincial supply and disposition tables. This breakdown could be useful in futurestudies, as beef and dairy cattle excrete different amounts of nutrient and pathogens.
In the case of turkeys, inventories were reported together without distinction for age or type ofproduction. Turkey animal unit coefficients were adjusted at the provincial level to compensate for thepredominance of one type of bird, such as broilers versus heavy-weight broilers.
GIS methods
Centroids: In order to build a map, data had to be transformed into a layer of geographic points,expressed in terms of longitude and latitude (X, Y) co-ordinates. Since the geographical referencescollected or assigned to census farms were the addresses of the headquarters, mapping using these co-ordinates would raise the issue of confidentiality. Also, the exact location of the field used for pasture ormanure disposal or the barn in which the animals were housed did not necessarily match the location ofthe headquarters.
To deal with these issues, different farms were aggregated together inside the boundary of ageographical area or unit. A few key variables influenced the decision to select a specific geographicallevel: if too small, data would need to be suppressed, aggregated to a higher level or merged with closeneighbouring units to protect confidentiality; if too large, the map would lose precision. The scale of themaps also influenced this decision.
In this study, the enumeration area was chosen as the indicator of the livestock location mainly becauseit is the smallest standard geographic area for which census data are reported and it is available for thewhole country.
Enumeration area boundary and size are primarily based on human geography and rivers. It representsthe geographic area canvassed by one census representative. It can cover as much as 440 dwellings inlarge urban areas to a minimum of 125 in rural areas. In low population density areas, enumeration areasare likely to cover more land than in highly populated areas.
Catalogue no. 21-601-MIE01047 6
A conventional way to measure livestock density is to take the sum of all animal units inside a particularenumeration area divided by that enumeration area’s farmland area. This approach has severallimitations associated with the irregularity of the enumeration area shapes and sizes. Unrepresentativehot spots (high livestock density areas) and cold spots (low livestock density areas) may be inducedsimply from the substantial differences in the size of individual enumeration areas.
Artificial hot spots could be produced for farm headquarters located directly beside or near a small town(which would delineate a small enumeration area). Conversely, artificial cold spots could be created bythe diluting effect on intensive livestock operations of being located in a large enumeration area.
The approach also produces a mosaic display that could be visually very difficult to interpret. As well,the farming activities of the farm headquarters located inside a particular enumeration area are likely totranscend the enumeration area boundaries (Map 1).
Map 1: Impact of irregular shapes and sizes of enumeration areas on livestock density measurement
Number of animal units in eachenumeration area Density (animal units/km2 of farmland)
Note: Colour changes from light green to dark red as livestock density increases.Source: Statistics Canada, derived from the 1996 Census of Agriculture.
The first step to reduce this effect was to determine the centroid (centre) of each enumeration area. Thecentroid is always located inside the polygon and is usually the centre point of a polygon’s boundingbox (see examples A and B). However, for irregular shapes where the point falls outside the polygon, itis moved in the shortest horizontal direction required to put it inside the polygon (example C).
Catalogue no. 21-601-MIE01047 7
((
BC
A
Radius: Dealing with the smallest geographical level available also raised the issue of confidentiality.The solution to this issue, and to the issue related to irregular shapes and sizes, was to impose a standardgeometric shape—a circle with a 20-kilometre radius—around each centroid. The assumption was thatthe loss in precision resulting from this normalization would be offset by the removal of artificial hotspots or cold spots. Also, since there were more data points inside a circle with a 20-kilometre radiusthan inside an individual enumeration area, fewer data would need to be suppressed to protect theirconfidentiality.
The density within each circle was then calculated by dividing the total number of animal units for allcentroids falling within the circle by the farmland area within the circle (1,257 km2 for the whole circlemultiplied by the percentage of farmland within it). The calculation was then repeated for each centroid.Instead of calculating a density value for the enumeration area itself, this approach raised a weightedaverage for all centroids that fell inside the same 20-kilometre circle (Map 2 and Appendix E).
Map 2: Impact of selecting centroids inside a standard circle on livestock density measurement
Densities of selected centroids before Densities after
Note: Densities are in animal units/km2 of farmland.Source: Statistics Canada, derived from the 1996 Census of Agriculture.
Catalogue no. 21-601-MIE01047 8
A 20-kilometre radius was selected because a number of studies suggested that 20 kilometres was thefarthest that manure could be economically hauled. Farm operators had little incentive to haul manurebeyond the point where transportation was economically viable.16 However, there is no simple methodto calculate the break-even point for transporting manure. It is uneconomical to haul some types ofmanure even 4 kilometres. “The two most important factors that determine the net benefit of manure tofarming are the distance the manure has to be hauled and the nutrient content of the manure.”17 Returnsto the livestock operation, input costs such as fuel and fertilizer, crop requirements, landscape, soilcomposition and the nutrient content of the manure all influence the maximum distance manure istransported. Farmers, like other business owners, generally want to maximize profits and consequentlytry to minimize their manure handling and transportation costs. The distances that they are prepared totransport manure may, therefore, not always conform to manure management recommendations.
Interpolation: The interpolation technique18 allows the creation of a continuous map with a set ofgeographic references (enumeration area centroids). With this technique, new density boundaries appearbetween centroids as the relative densities influence each other. A very dense enumeration area impactsless dense neighbouring enumeration areas; this effect decreases with distance (Map 3).
16. Much of the research cited in the literature refers to work done by Freeze and Sommerfeld (1985) and Roka and Hoag(1994, 1996). In theory, the break-even point and the transportation distance can be higher, but they may change based on thenutrient and moisture content of the manure. Composted manure can be transported greater distances but not much farmmanure is composted (Janzen 1999). Transport distances can also be greater if there is a regional structure such as the ManureManagement Organization in Quebec to export manure from surplus regions. He and Shi (1998) estimated the maximumdistance to be 4 kilometres with their manure transport model for Michigan.17. Fleming et al. (1998).18. Using the inverse distance weighted (IDW) technique (one of several types of interpolation), the value or colour of eachof the pixels in an image (i.e. the points that compose the image) is influenced by each of its surrounding points—aninfluence that decreases with distance. A fixed radius of 20 kilometres and an exponent of 2 were used to limit the influenceof surrounding points on the value given to an analysed pixel. For example, a point A located at mid-distance between a pointB and pixel C had four times more weight ([1/(1/2)2]=4) on the final value of pixel C than the point B did. For details, seeArcView (1996).
Catalogue no. 21-601-MIE01047 9
Map 3: Impact of the interpolation technique on livestock density displayfor irregular areas
Map without interpolation Map with interpolation
Note: Colour changes from light green to dark red as livestock density increases.Source: Statistics Canada, derived from the 1996 Census of Agriculture.
As the livestock population is not evenly distributed across Canada, a major advantage of the choseninterpolation technique was to assign a value of zero where there was no animal reported inside a 20-kilometre circle. In other words, white spots in the maps mean ‘no animals within a 20-kilometre radiusof the centroid’—not a lack of data.
Data sources and coverage
This research uses a data set of Canadian census farms reporting livestock on the 1996 Census ofAgriculture. Farm operators were asked to report inventories of all livestock, including cattle, pigs,poultry, horses, sheep and lambs, and more exotic animals such as emus, ostriches, elk, deer, bison andwild boars.
Initially, 184,000 farms were identified. Some records that could not be linked to any areas classified asagricultural (see the ‘headquarters rule’) were excluded, as were records on farms that did not reportsignificant numbers of livestock and other records where confidentiality might be compromised if thedata were included. Overall, however, less than 1% of all animal units were excluded from the study.The data set used for analysis represented 175,000 farms.
Catalogue no. 21-601-MIE01047 10
Limitations
Inventory versus flow: Livestock inventories in mid-May, as reported by farmers on the Census ofAgriculture, do not represent the number of animals that were on the farm during the whole year. Thecapacity of the barns, pens or pastures in mid-May is unknown since this information was not elicited onthe 1996 Census of Agriculture questionnaire. No adjustment was made to estimate the average size ofthe herd, the total livestock production during the year or the number of livestock in confinement (inpens, for example) for the whole year or part of the year. The calculated livestock densities referspecifically to the situation on May 14, 1996.
Headquarters rule: Although the Census of Agriculture data were used at the CGC level, the barns andlivestock may not be as accurately located as they would have been had geographic co-ordinates beenreported on the census questionnaire.
Census errors: Data originating from a project as large and complex as the Census of Agriculture aresubject to error despite extensive efforts deployed at census time to correct detected undercoverage,misreporting and data capture errors. The most common types of errors were related to coverage,missing responses, response errors, and processing errors that were not identified by subsequent checks.However, the Census of Agriculture had a high response rate and the data were of very good quality.
Terrain analysis: With limited resources available, it was almost impossible to validate the results ofnational-level census coverage with field observations. However, to make sure the results weredisplayed within a reasonable level of accuracy at the selected scale level, a few maps were validated atthe provincial level with the assistance and local knowledge of provincial agricultural statisticians.
No attempts were made to make adjustment to the spatial distribution of livestock based on physicalgeology, geomorphology, hydrology, meteorology, or human settlement patterns and transportation andcommunication networks.
Catalogue no. 21-601-MIE01047 11
Findings
Locations of high concentrations of livestock
The livestock inventories reported in the 1996 Census of Agriculture were converted into a commonmeasure, animal units, and mapped to display the spatial distribution and concentration of Canadianlivestock production.
In May 1996, there were 13.4 million animal units in Canada. Alberta had the greatest share of thenational livestock population (34.1%), followed by Ontario (18.7%), Saskatchewan (15.2%), Quebec(13.8%) and Manitoba (9.5%). The size and location of the cattle industry largely determined thesedistributions.
Eight out of 10 farm animals—10.9 million animal units held on 147,000 livestock operations—werelocated in medium-density areas, where the concentration of livestock was between 3 and 80 animalunits per km2 of farmland. Two-thirds of this livestock was located in the three Prairie provinces.
Less than one-fifth of all livestock was located in high-density areas, where there was a concentration ofmore than 80 animal units per km2 of farmland. Most of the livestock located in high-density areas wasin Quebec, followed by Ontario, Alberta and British Columbia. (Table 1).
Table 1: Distribution of livestock, by province and density, May 1996B.C. Alberta Saskatchewan Manitoba Ontario Quebec Atlantic prov. Canada
Notes:-- too small to be expressed1. Provincial share of each density class.2. National share of each density class.3. No density recorded. Excluded from the map to hide data that could be confidential.Due to rounding, figures may not add up to totals.Source: Statistics Canada, derived from the 1996 Census of Agriculture.
Quebec (35.0%) and Ontario (30.9%) together held two-thirds of the livestock in high-density areas.Alberta (20.7%) had the third largest share (Figure 1).
Figure 1: Distribution of livestock within each density class, by province, May 1996
B.C. Alberta Saskatchewan Manitoba Ontario Quebec Atlantic prov.0
10
20
30
40
50
60
70
80
of
each
den
sity
cla
ssP
rovi
nci
al s
har
e (%
) High (over 80 AU/km2)Medium (3-80 AU/km2)Low (less 3 AU/km2)
Livestock density
Source: Statistics Canada, derived from the 1996 Census of Agriculture.
Catalogue no. 21-601-MIE01047 12
Within each province, over 50% of all the livestock was located in medium-density areas. However,nearly half the livestock in Quebec and around one-third of the livestock in British Columbia andOntario was in high-density areas. These areas were predominant where there was a high population oflivestock and/or a relatively low proportion of farmland to total land. (Figure 2).
Figure 2: Distribution of livestock, by province and density, May 1996
1% 0% 3% 0% 0% 0% 0%
64%
89%
97%
98%
70%
54%
92%35%11%
0% 2%
30% 46%
7%
B.C. Alberta Saskatchewan Manitoba Ontario Quebec Atlantic prov.0
500
1,000
1,500
2,000
2,500
3,000
3,500
4,000
4,500
An
imal
un
its
('000
) High (over 80 AU/km2)Medium (3-80 AU/km2)Low (less 3 AU/km2)
Livestock density% of
provincialtotal
Source: Statistics Canada, derived from the 1996 Census of Agriculture.
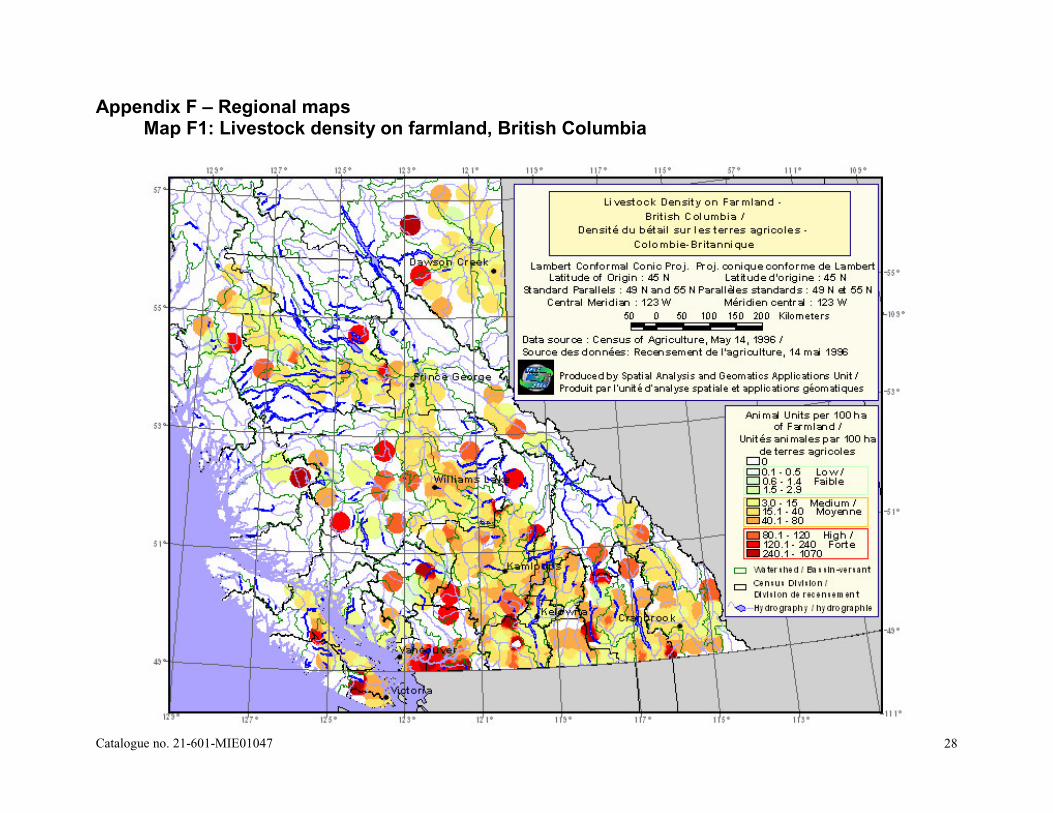
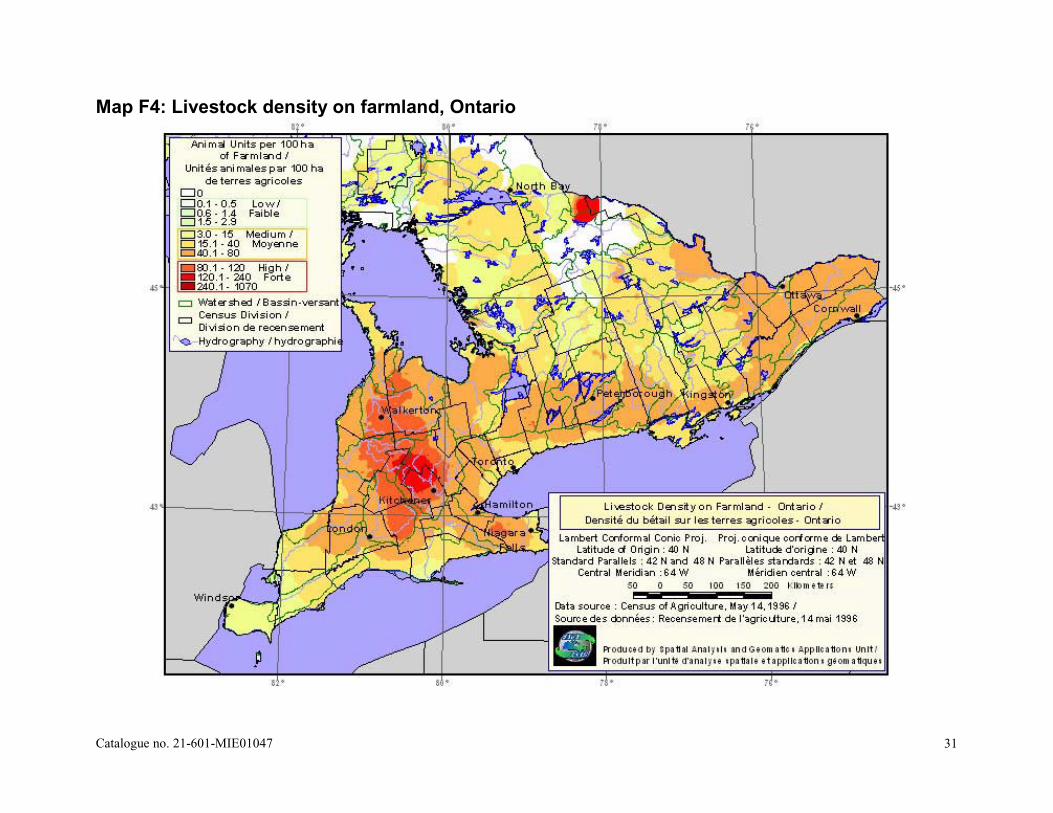
From west to east on Map 4, pockets of higher concentration of livestock can be seen in the followingregions: south of the Fraser River in British Columbia; Lethbridge and Newell counties in Alberta; nearWinnipeg in Manitoba; the area north of Waterloo Regional Municipality and parts of Perth, Wellington,Bruce and Grey counties in southwestern Ontario; and Chutes-de-la-Chaudière, Nouvelle-Beauce, Actonand Haute-Yamaska in Quebec. (See Appendix F for detailed regional maps.)
Catalogue no. 21-601-MIE01047 13
Map 4: Livestock density, Canada, May 1996
Catalogue no. 21-601-MIE01047 14
Within each province, some clusters or groups of enumeration areas had high densities of livestock.Sub-provincial livestock concentration was analysed using sub-drainage basin boundaries.19 Table 2summarizes the data at the sub-basin level for enumeration areas with a high concentration of livestock.The sub-basins were sorted by decreasing number of total livestock in high-density areas. For example,the Central St. Lawrence sub-basin contained 5,510 farms, 419 enumeration areas,20 535,592 animalunits, 270,347 animal units of cattle, 170,570 animal units of pigs and 78,463 animal units of poultry, alllocated in areas of high livestock density. The highest count in a single enumeration area was 14,700animal units. The highest number of livestock in a 20-kilometre radius circle around the centroid of oneenumeration area was 115,738 animal units. And the circle with the highest density in this particularsub-basin had 212.6 animal units per km2.
This table reveals that some hot spots were not necessarily the result of a large number of livestock.In some areas, a small number of farms with limited livestock may also have high livestock density insituations where there is a limited amount of farmland available.
Table 2: High livestock density areas, by sub-basin, May 1996Within an Within aenumation 20-kilometre radiusarea (EA)
In high livestock density areas Livestock DensityTotal Cattle Pigs Poultry Farms EAs animal units (AU) (AU/km2)
Note: Includes only enumeration areas with livestock density greater than 80 animal units/km2.Source: Statistics Canada, derived from the 1996 Census of Agriculture.
The measurements of livestock densities reported here are understated because the method used makesthe assumption that all farmland could be used to spread the manure. In practice, not all farmland can befertilized with manure. As well, a farm operator may decide to spread manure on only a portion of the
19. Sub-basins are subsets within river basins or watersheds. Their boundaries follow heights of land and delineate watersurface drainage areas. These physical boundaries, which transcend administrative, political and other types of boundaries,are more relevant for assessing the potential environmental impact of livestock concentration.20. A high number of enumeration areas can be expected in highly populated areas.
Catalogue no. 21-601-MIE01047 15
farmland, depending on the cropping system, the hauling distance and the minimum distance fromneighbours or bodies of water. Consequently, the livestock densities reported here might very well behigher, but it was not possible in this study to identify the area and location of farmland actually used formanure spreading. Nevertheless, the maps and tables in this report that show animal densities onfarmland are still unique because they provide a good image of the spatial concentration of all farmanimals, regardless of their types.
Types of livestock found in high-density areas
At the national level, in May 1996, almost two-thirds of all livestock was beef cattle (62.6%), followedby dairy cattle (17.8%), hogs (8.5%), other livestock (6.2%) and poultry (4.9%). Livestock and poultryare expressed in animal units.
Beef cattle were predominant in Alberta, Saskatchewan and Ontario. As expected, dairy cattle werepredominant in Quebec and Ontario. Hog inventories were largest in Quebec, followed by Ontario,Manitoba and Alberta. Most poultry stocks were in Ontario and Quebec. Production of ‘other livestockand poultry,’ including sheep, horses and exotic animals, was predominant in the Prairie provinces(Table 3).
Table 3: Livestock in high-density areas, by livestock type and province, May 1996B.C. Alberta Saskatchewan Manitoba Ontario Quebec Atlantic prov. Canada
Notes:1. Provincial share of each livestock type.2. National share of each livestock type.Due to rounding, figures may not add up to totals.Source: Statistics Canada, derived from the 1996 Census of Agriculture.
Figure 3 shows, for each livestock type, that a larger share of poultry, hog and dairy animals was foundin high-density areas than in medium-density areas. Hog and poultry production and, to a lesser extent,dairy production have been associated with enterprises that purchased their feed grains, thus requiring arelatively small amount of land to operate. Such operations predominate in Central Canada whereproportionately less farmland is available.
Figure 3: National distribution of livestock, by livestock type and density, May 1996
88%
70%
60%
58%
87%
11%
30%
40%
41%
12%
Beef cattle
Dairy cattle
Hog
Poultry
Other
High (over 80 AU/km2) Medium (3-80 AU/km2)Livestock Density
Source: Statistics Canada, derived from the 1996 Census of Agriculture.
Catalogue no. 21-601-MIE01047 16
Figure 4 shows the intensity of hog, poultry and dairy production in British Columbia, Quebec andOntario, compared with the Prairie provinces and the Atlantic provinces. In British Columbia, more thanthree-quarters of the provincial hog and poultry inventories and well over half of all dairy cattle wereconcentrated in high-density areas. Quebec and Ontario also had significant proportions of their hog,poultry and dairy stocks in high-density areas.
Figure 4: Proportion of livestock in high-density areas, by livestock type and province,May 1996
B.C. Alberta Saskatchewan Manitoba Ontario Quebec Atlantic prov.0
10
20
30
40
50
60
70
80
90
for
each
live
sto
ck t
ype
% o
f p
rovi
nci
al t
ota
l
Beef cattleDairy cattleHogPoultryOther
Source: Statistics Canada, derived from the 1996 Census of Agriculture.
Figure 5 presents the inventories (in animal units) of different types of livestock located in high-densityareas and their distribution within each province. The largest livestock populations found in high-densityareas were beef cattle in Alberta, dairy cattle and hogs in Quebec, and beef and dairy cattle in Ontario.
Figure 5: Numbers of livestock in high-density areas, by livestock type and province,May 1996
B.C. Alberta Saskatchewan Manitoba Ontario Quebec Atlantic prov.0
50
100
150
200
250
300
350
400
450
500
An
imal
un
its
('000
)
Beef cattleDairy cattleHogPoultryOther
Source: Statistics Canada, derived from the 1996 Census of Agriculture.
Catalogue no. 21-601-MIE01047 17
Conclusion
The number of livestock farms in Canada is shrinking. However, farming operations are getting largerand more intensive. With large farms come large concentrations of animals and manure. A first reactionwould be to think that environmental regulations and codes of practices should focus their attention onlarge livestock operations.
In order to better understand where the larger concentrations of all livestock and poultry were,inventories reported in the 1996 Census of Agriculture were converted into a common measure, animalunits, and mapped to display generically the distribution and concentration of Canadian livestock.Presenting the density of the total livestock and poultry population in a particular area is a good start toevaluate its impact on the environment. It is the cumulative effect of all types of livestock productionthat may affect the environment.
Findings indicate that livestock concentration is not necessarily linked to large livestock populations.Some high-density areas appeared to be due to a rather limited amount of livestock associated with aneven smaller farmland base. Certainly this situation is a factor limiting production expansion. Analysingconcentrations of all livestock present on all farms, regardless of the size of the farm and the type ofanimals, is the best way to get the whole picture.
This study cannot conclude whether or not large livestock farms contributed the most to a greaterconcentration of livestock in some areas. Exploring this would require further work to link livestockdensities with farm level data and characteristics—such as type of farm, operating arrangements andfarm size.
Additional research would be required before concluding whether or not the livestock concentration incertain regions had reached limits where it could pose an ecological threat. It would require establishinglocal or regional nutrient budgets based on amount of manure produced, farmland available for manuredisposal, soil characteristics, crop requirements, and use of chemical fertilizer and municipal sewagesludge. This could help identify areas where the environment might be at risk from a lack of sufficientland to recycle animal waste.
Catalogue no. 21-601-MIE01047 18
References
ArcView. 1996. Spatial Analyst (software documentation).American Society of Agricultural Engineers (ASAE). 1993. ASAE Standards Manure Production and
Characteristics. ASAE Data: ASAE D384.1.Bernard, L.A. 1999. Portrait agroenvironnemental du bassin de la Yamaska.
<http://www.agr.gouv.qc.ca/dgpar/sites/r16e/gta/mars99/art12.htm>. (Accessed March 2001)Bolinder, M.A., R.R. Simard, S. Beauchemin and K.B. MacDonald. 2000. “Risk of water contamination
by phosphorus.” Environmental Sustainability of Canadian Agriculture. Report of the Agri-Environmental Indicator Project. Ottawa: Agriculture and Agri-Food Canada (Catalogue no.A22-201/2000E). Chapter 13.
Caldwell, W.J. 1998. “Land-use planning, the environment, and siting intensive livestock facilities in the21st century.” Journal of Soil and Water Conservation. 53, 2: 102–104.
Centre for Studies in Agriculture, Law and the Environment (CSALE), University of Saskatchewan.1996. Expanding Intensive Livestock Operations in Saskatchewan: Legal and EnvironmentalConcerns. <http://www.ag.usask.ca/centres/csale/Pubs/occpap/occ3/pocc3/pocc3.htm>.(Accessed February 2001)
Choudhary, M., L.D. Bailey and C.A. Grant. 1996. “Review of the use of swine manure in cropproduction: Effects on yield and composition and on soil and water quality.” Waste Managementand Research. 14, 6: 581–595.
Eghball, B., G.D. Binford and David D.D. Baltensperger. 1996. “Phosphorus movement and adsorptionin a soil receiving long-term manure and fertilizer application.” Journal of EnvironmentalQuality. 25, 6: 1339–1344.
Eghball, B. and J.E. Gilley. 1999. “Surface water quality—phosphorus and nitrogen in runoff followingbeef cattle manure or compost application.” Journal of Environmental Quality. 28, 4: 1201–1210.
Eghball, B. and J.F. Power. 1994. “Beef cattle feedlot manure management.” Journal of Soil and WaterConservation. 2: 113–121.
Fedkiw, J. 1992. Progress and status of livestock and poultry waste management to protect the nation’swater. USDA cited in Eghball and Power (1994).
Fleming, R.A., B.A. Babcock and E. Wang. 1998. “Resource or waste? The economics of swine manurestorage and management.” Review of Agricultural Economics. 20, 1: 96–113.
Fleming R., J. McLellan, D. Alves, D. Hilborn, K. Pintar and M. MacAlpine. 1997. Cryptosporidium inLivestock, Manure Storages, and Surface Waters in Ontario. Report prepared for the OntarioFarm Environment Coalition, OMAFRA, and Agriculture and Agri-Food Canada.<http://res2.agr.ca/london/gp/download/fleming_efp.pdf>. (Accessed March 2001)
Freeze, B.S. and T.G. Sommerfeldt. 1985. “Breakeven haul distances for beef feedlot manure insouthern Alberta.” Canadian Journal of Soil Science. 65: 687–693.
Glenn, J. 1999. “More animals, fewer farms: Regulators tackle manure management.” Journal ofComposting and Recycling. 40, 6: 44–47.
Groupe de recherche en économie et politique agricoles (GREPA). 2000. Le portraitagroenvironnemental des fermes du Québec. Summary report prepared by BPR Groupe-conseil.<http://www.upa.qc.ca/agroenv_resultats.html>. (Accessed March 2001)
Haynes, R.J. and R. Naidu. 1998. “Influence of lime, fertilizer and manure applications on soil organicmatter content and soil physical conditions: A review.” Nutrient Cycling in Agroecosystems. 51,2: 123–137.
Catalogue no. 21-601-MIE01047 19
He, C. and C. Shi. 1998. “A preliminary analysis of animal manure distribution in Michigan for nutrientutilization.” Journal of the American Water Resources Association. 34, 6: 1341–1354.
Hoag, D.L. and F.M. Roka. 1995. “Environmental policy and swine manure management: waste not orwant not?” American Journal of Alternative Agriculture. 10,4:163-166.
Janzen, R.A., W.B. McGill, J.J. Leonard and S.R. Jeffrey. 1999. “Manure as a resource—ecological andeconomic considerations in balance.” Transactions of the American Society of AgriculturalEngineers (ASAE). 42, 5: 1261–1273.
Lauwers, L., G.Van Huylenbroeck and L. Martens. 1998. “A systems approach to analyse the effects ofFlemish manure policy on structural changes and cost abatement in pig farming.” AgriculturalSystems. 56, 2: 167–181.
Letson, D. and N. Gollehon. 1998. “Spatial economics of targeting manure policy.” Journal of theAmerican Water Resources Association. 34, 1: 185–192.
MacDonald, K.B. 2000a. “Risk of water contamination by nitrogen.” Environmental Sustainability ofCanadian Agriculture. Report of the Agri-Environmental Indicator Project. Ottawa: Agricultureand Agri-Food Canada (Catalogue no. A22-201/2000E). Chapter 12.
______. 2000b. “Residual nitrogen.” Environmental Sustainability of Canadian Agriculture. Report ofthe Agri-Environmental Indicator Project. Ottawa: Agriculture and Agri-Food Canada(Catalogue no. A22-201/2000E). Chapter 16.
Mallin, M.A. 2000. “Impacts of industrial animal production on rivers and estuaries—Animal-wastelagoons and sprayfields may severely degrade water quality.” American Scientist. 2000. 88, 1:26–37.
Manitoba Agriculture. 2000. Public Concerns with Livestock Production (Health & EnvironmentalConsiderations). <http://www.gov.mb.ca/agriculture/livestock/publicconcerns/cwa01s00.html>.(Accessed March 2001)
Marchand L. and K. McEwan. 1997. The Impact of Township Zoning By-laws on Ontario Swine Farms.Ridgetown College, University of Guelph.
Midwest Plan Service. 1985. Livestock Waste Facilities Handbook. MWPS–18.Ministère de l’agriculture et des pêches du Québec (MAPAQ). 1999. Table filière porcine.
Mitchell, A., J. Guay and R. Séguin. 2000. “Fear of farming.” The Globe and Mail, June 3.Nikiforuk, A. 2000. “When water kills.” Maclean’s, June 12.Paquette, M. 1998. Les unités animales par hectare, un outil de travail intéressant.
<http://www.agr.gouv.qc.ca/dgpar/sites/r16e/gta/oct98/art4.htm>. (Accessed March 2001)Roka, F.M. and D.L. Hoag. 1994. “Manure value and live weight swine decisions.” Journal of
Agricultural and Applied Economics. 28,1:193-202.Simard R.R. 1999. Nutrient management on agricultural land base in eastern Canada. Agriculture and
Simard, R.R., G. Barnett, I. Royer and M.J. Garand. 1998. “Manure Phosphorus in Soil and Water.”New Directions In Animal Production Systems. Proceedings of the Canadian Society of AnimalScience. R. Blair et al. (eds). Vancouver: July 5–8. 99–119.
Simard, R.R., D. Cluis, G. Gangbazo and S. Beauchemin. 1995. “Phosphorus Status of Forest andAgricultural Soils from a Watershed of High Animal Density.” Journal of Environment Quality.24: 1010–1017.
Catalogue no. 21-601-MIE01047 20
Schreier, H. and C. Berka, 1999. Land Use–Surface Water Quality Relationship in the Sumas RiverWatershed, Abbotsford, B.C. <http://www.ire.ubc.ca/ecoresearch/sumas.html>. (Accessed March2001)
Schmitt, M.A., D.R. Schmidt and L.D. Jacobson. 1996. “A manure management survey of Minnesotaswine producers: effect of farm size on manure application.” Applied Engineering in Agriculture.12, 5: 595–599.
Statistics Canada. 1994. Canadian Agriculture at a Glance (Catalogue no. 96-301). Ottawa: Ministerresponsible for Statistics Canada.
______. 1997. Historical Overview of Canadian Agriculture (Catalogue no. 93-358-XPB). Ottawa:Minister responsible for Statistics Canada.
______. 1999a. Canadian Agriculture at a Glance (Catalogue no. 96-325-XPB). Ottawa: Ministerresponsible for Statistics Canada.
______. 1999b. 1996 Census Dictionary (Catalogue 92-351-UPE). Ottawa: Minister responsible forStatistics Canada.
______. 2000b. Human Activity and the Environment (Catalogue no. 11-509-XPB). Cattle density mapin Ecograph package. Ottawa: Minister responsible for Statistics Canada.
Stone, K.C., P.G. Hunt, F.J. Humenik and M.H. Johnson. 1998. “Impact of swine waste application onground and stream water quality in an eastern Coastal Plain watershed.” PublicationTransactions of the ASAE—American Society of Agricultural Engineers. 41, 6: 1665–1670.
Tessier, S. 1998. Manure Handling Strategies for Minimising Environmental Impacts. ManitobaAgriculture and Food, Animal Industry Branch.<http://www.gov.mb.ca/agriculture/livestock/pork/swine/ bab10s08.html>. (Accessed March2001)
Toombs, M. 1997. “The Rising Concern in Rural Ontario Regarding Swine Production.” Living WithYour Neighbours. Proceedings of Swine Production and the Environment Seminar. OntarioMinistry of Agriculture, Food and Rural Affairs. Shakespeare, Ontario: March 26.<http://www.gov.on.ca/OMAFRA/english/livestock/swine/facts/concern.htm>. (Accessed March2001)
______. 1998. OMAFRA Perspective on Large Livestock Barns, Community Issues and the Role ofMunicipality. Ontario Ministry of Agriculture, Food and Rural Affairs. <http://www.gov.on.ca/OMAFRA/english/landuse/facts/info_largelivestock.htm>. (Accessed March 2001)
Van Horn, H.H. and M.B. Hall. 1997. “Agricultural and Environmental Issues in the Management ofCattle Manure.” American Chemical Society Symposium Series. 668: 91–109.
Catalogue no. 21-601-MIE01047 21
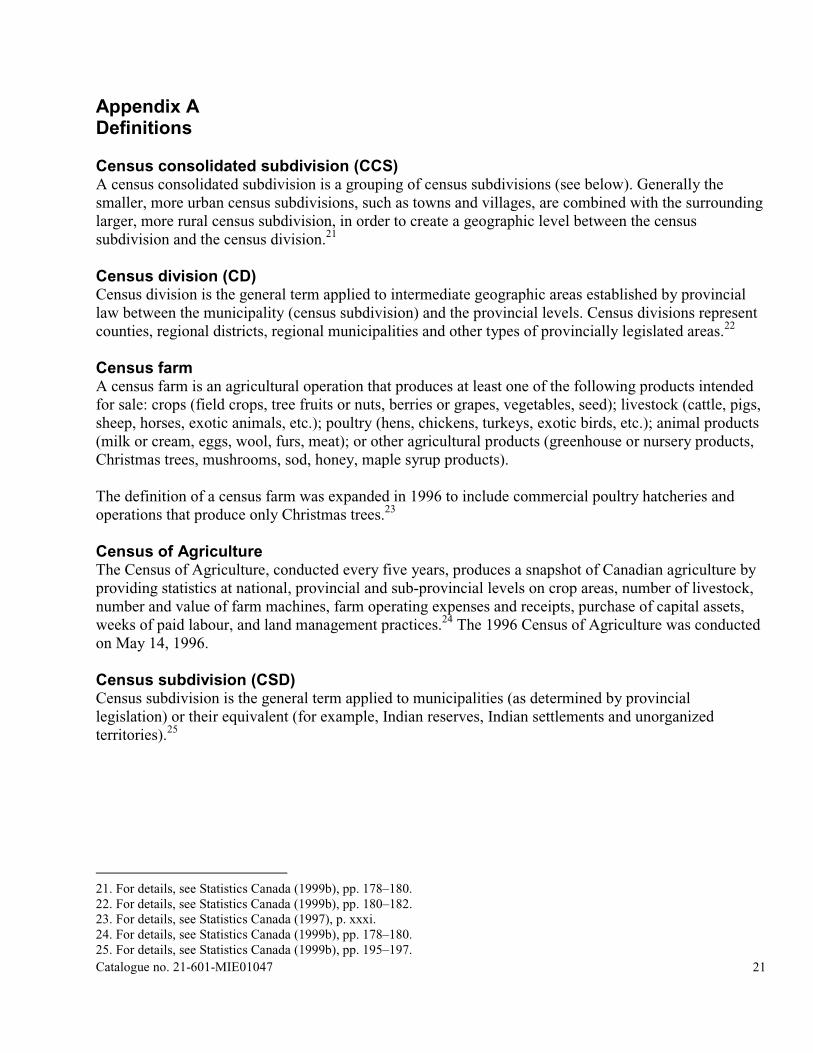
Appendix ADefinitions
Census consolidated subdivision (CCS)A census consolidated subdivision is a grouping of census subdivisions (see below). Generally thesmaller, more urban census subdivisions, such as towns and villages, are combined with the surroundinglarger, more rural census subdivision, in order to create a geographic level between the censussubdivision and the census division.21
Census division (CD)Census division is the general term applied to intermediate geographic areas established by provinciallaw between the municipality (census subdivision) and the provincial levels. Census divisions representcounties, regional districts, regional municipalities and other types of provincially legislated areas.22
Census farmA census farm is an agricultural operation that produces at least one of the following products intendedfor sale: crops (field crops, tree fruits or nuts, berries or grapes, vegetables, seed); livestock (cattle, pigs,sheep, horses, exotic animals, etc.); poultry (hens, chickens, turkeys, exotic birds, etc.); animal products(milk or cream, eggs, wool, furs, meat); or other agricultural products (greenhouse or nursery products,Christmas trees, mushrooms, sod, honey, maple syrup products).
The definition of a census farm was expanded in 1996 to include commercial poultry hatcheries andoperations that produce only Christmas trees.23
Census of AgricultureThe Census of Agriculture, conducted every five years, produces a snapshot of Canadian agriculture byproviding statistics at national, provincial and sub-provincial levels on crop areas, number of livestock,number and value of farm machines, farm operating expenses and receipts, purchase of capital assets,weeks of paid labour, and land management practices.24 The 1996 Census of Agriculture was conductedon May 14, 1996.
Census subdivision (CSD)Census subdivision is the general term applied to municipalities (as determined by provinciallegislation) or their equivalent (for example, Indian reserves, Indian settlements and unorganizedterritories).25
21. For details, see Statistics Canada (1999b), pp. 178–180.22. For details, see Statistics Canada (1999b), pp. 180–182.23. For details, see Statistics Canada (1997), p. xxxi.24. For details, see Statistics Canada (1999b), pp. 178–180.25. For details, see Statistics Canada (1999b), pp. 195–197.
Catalogue no. 21-601-MIE01047 22
ConfidentialityThe Statistics Act requires that all census information be kept confidential. No person or institutionoutside Statistics Canada (including other government departments and agencies, the courts and theRCMP) can access census information provided by individual respondents. For this study, all tabulateddata and maps were subject to confidentiality restrictions. A series of computerized checks wasperformed to suppress data that could result in the disclosure of information concerning a particularagricultural operation or individual. Any area with a 20-kilometre radius that contained very few farmswas not displayed separately, but was simply suppressed from the maps.
Enumeration areaAn enumeration area is the geographic area canvassed by one census representative. It is the smalleststandard geographic area for which census data are reported. Canada’s entire surface area is divided intoenumeration areas.26
26. For details, see Statistics Canada (1999b), pp. 210-212.
Catalogue no. 21-601-MIE01047 23
Appendix BRegulations, codes of practice and municipal by-laws related to livestockmanure management27
Nova Scotia Department of Agriculture and Marketing, Nova Scotia Department of the Environment.1997. Environmental Regulations Handbook for Nova Scotia Agriculture.<http://agri.gov.ns.ca/rs/envman/educate/handbook.htm#sheet8>. (Accessed March 2001)
Nova Scotia, examples of land use by-laws:• Eastern Antigonish County Planning Area. 1994.<http://www.munisource.org/antigonish/lub-east.htm>. (Accessed March 2001)• Rural Cape Breton District Planning Commission, Isle Madame, Cape Breton, County of
Richmond. 1998. <http://www.rcbplan.ns.ca/isle_madamelub.htm>. (Accessed March 2001)
New Brunswick. 1999. New Livestock Operations Act proclaimed.<http://www.gnb.ca/cnbnews/afa/1999e0585ag.htm>. (Accessed March 2001)
New Brunswick Agriculture and Rural Development. 1997. Manure Management Guidelines for NewBrunswick. <http://www.gnb.ca/afa-apa/20/10/2010005e.htm>. (Accessed March 2001)
Quebec Ministry of the Environment. 1998. Reduction of pollution from agricultural sources.<http://www.menv.gouv.qc.ca/sol/agricole-en/>. (Accessed March 2001)
Ontario Ministry of Agriculture, Food and Rural Affairs (OMAFRA). 1996. Land Application of LiquidManure in an Environmentally Responsible Manner. Fact Sheet (Don Hilborn.)<http://www.gov.on.ca/OMAFRA/english/livestock/dairy/facts/92-164.htm>.(Accessed March 2001)
_______. 2000. Proposed Standards for Agricultural Operations In Ontario.<http://www.gov.on.ca/OMAFRA/english/agops/index.html>. (Accessed March 2001)
Ontario, examples of nutrient management by-laws:• Oxford County. 1999.
• The Corporation of the Township of West Nissouri, Middlesex County. 1999.<http://www.twp.west-nissouri.on.ca/Bylaw17-99.htm>. (Accessed September 2000)
• County of Brant. <http://www.county.brant.on.ca/bylaws/bl00-121.htm>. (Accessed March2001)
27. This is not a complete list.
Catalogue no. 21-601-MIE01047 24
Ontario Federation of Agriculture. The Ontario Farm Environmental Coalition’s Nutrient ManagementPlanning Strategy.<http://www.ofa.on.ca/aglibrary/Research/Nutrient%20Management%20Planning%20Strategy/default.htm>. (Accessed March 2001)
Manitoba Regulations and Approval Processes.• Manitoba Regulations and Guidelines.
• Regulatory Approaches Throughout North America.<http://www.gov.mb.ca/agriculture/news/lsteward/stewardship8.html>. (Accessed March
2001)• Manitoba Livestock Manure and Mortalities Management Regulation under theEnvironment Act. <http://www.gov.mb.ca/chc/statpub/free/pdf/e125.pdf>.(Accessed March 2001)• Farm Practices Guidelines for Hog Producers in Manitoba.
Saskatchewan. 1995. The Agricultural Operations Act.<http://www.qp.gov.sk.ca/orphan/legislation/a12-1.htm>. (Accessed March 2001)
Saskatchewan Agriculture and Food.• Intensive Livestock Operations Guide of Recommended Practice.• Managing Manure as a Fertilizer for Prairie Agriculture.
<http://www.agr.gov.sk.ca/DOCS/livestock/pork/manure_management/managingmanure.asp>. (Accessed March 2001)
Alberta Agriculture, Food and Rural Development.• Regulatory Options for Livestock Operations.
<http://www.agric.gov.ab.ca/archive/ilo/index.html>. (Accessed March 2001)• Regulation of Intensive Livestock Elsewhere in North America.
<http://www.agric.gov.ab.ca/archive/ilo/section4d.html>. (Accessed March 2001)• 2000 Code of Practice for Responsible Livestock Development and Manure Management.
<http://www.agric.gov.ab.ca/agdex/400/400_27-2.html>. (Accessed March 2001)• Proposed Act for Intensive Livestock Operations.
<http://www.agric.gov.ab.ca/economic/policy/ilo/ilo_act.html>. (Accessed March 2001)
British Columbia. 1992. Agricultural Waste Control Regulation Waste Management Act, Health Act.<http://www.qp.gov.bc.ca/stat_reg/regs/elp/r131_92.htm>. (Accessed March 2001)
CattleDairy cow s 0.75 1 a 0.8 1 1 a 0.5 b 0.75Dairy heifers 1 2 2 1Dairy calves 3.3 40 b 5 3-6 3.3Dairy bulls 0.75 1 0.75Beef cow s 1 1 a 1.1 1 1 0.83 1 1Beef heifers 1.4 2 b 1.7 2 2 1.25-2.2 2 1.3-1.6Beef Bulls 1 1 1 1 1Beef steers 1.3 2 b 1.7 2 2 1.5 1.3Beef calves 4.4 5 4 4.4
PigsBoars 5 3 5 5.5 3 5Sow s 5 4 a 5.1 4 5 3-4 3 5Other over 45 lbs. 8 15 b 6.5 5 4 7 4-6 5-11Other under 45 lbs. 30 23 25 20 50 20 30
Sheep & lambsRams 7 5 7 7Ew es & w ethers 5 4 a 4.6 a 4 4 a 5 b 7 7Lambs 16 12-25 10 10 14 16
OtherHorses 0.75 1 1 1 a 0.75 1 0.75 aGoats 7 4.6 6 4-10 7 7Rabbits 40 40 a 40 40 40 aMink 80 100 a 80 100 80 aFoxes 40 40 40 40 aBisons 1 1 1 1Deers 8 8 8LlamasOstriches 7 3 7Emus 16 10 5 16Wild boars 4 5 4Elks 5 5 1.9Notes:a. Includes offspring, calf, litter, kits or associated males.b. Marketed during a year.Sources:1. Nova Scotia Department of Agriculture and Marketing, Nova Scotia Department of the Environment, 1997, Environmental Regulations
Handbook for Nova Scotia Agriculture.2. Number of animals to produce 110 kg N/ha. New Brunswick Agriculture and Rural Development, 1997 Manure Management Guidelines
for New Brunswick.3. GREPA, 2000. Le portrait agroenvironnemental des fermes du Québec.4. Based on OMAFRA standards include in many municipal by-laws. Also in Ontario Federation of Agriculture. 1998. The Ontario Farm
Environmental Coalition’s Nutrient Management Planning Strategy.5. Manitoba Agriculture and Food, Appendix 1 in Farm Practices Guidelines for Hog Producers in Manitoba.6. Saskatchewan Agriculture and Food, Guidelines for Establishing and Managing Livestock Operations.7. Alberta Agriculture, Food and Rural Development , Proposed Regulations for Intensive Livestock Operations.8. Combination of livestock equivalent to 455 kg. B.C. Agricultural Waste Control Regulation Waste Management Act.
Catalogue no. 21-601-MIE01047 26
Appendix D Map D1: Proportion of farmland over total land
Catalogue no. 21-601-MIE01047 27
Appendix EFigure E1: Difference between livestock densities based on 20-kilometre radius method and densities based on enumeration areadata
Notes:
Excludes extreme values (differences above 1000 or less than –1000 animal units/km2).Overall, the 20 kilometre-radius method lowered density values (lower mean compared with mean value of densities calculated withenumeration area data).
Catalogue no. 21-601-MIE01047 28
Appendix F – Regional mapsMap F1: Livestock density on farmland, British Columbia
Catalogue no. 21-601-MIE01047 29
Map F2: Livestock density on farmland, Alberta
Catalogue no. 21-601-MIE01047 30
Map F3: Livestock density on farmland, Manitoba and Saskatchewan
Catalogue no. 21-601-MIE01047 31
Map F4: Livestock density on farmland, Ontario
Catalogue no. 21-601-MIE01047 32
Map F5: Livestock density on farmland, Quebec
Catalogue no. 21-601-MIE01047 33
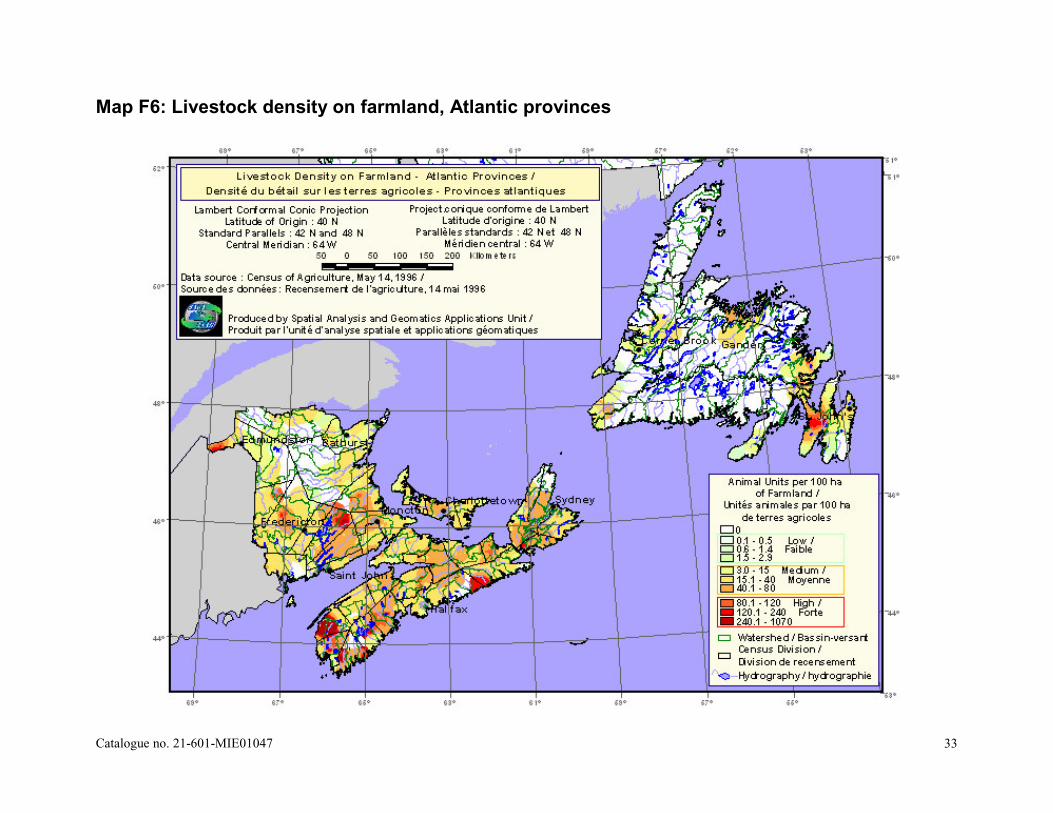
Map F6: Livestock density on farmland, Atlantic provinces