ICARUS 135, 537–548 (1998) ARTICLE NO. IS985959 Distribution and Evolution of Water Ice in the Solar Nebula: Implications for Solar System Body Formation Kimberly E. Cyr LPL/Department of Planetary Sciences, University of Arizona, 1629 East University Boulevard, Tucson, Arizona 85721 E-mail: [email protected]William D. Sears Computer Sciences Corp., Astronomy Programs, 100A Aerospace Road, Lanham-Seabrook, Maryland 20706 and Jonathan I. Lunine LPL/Department of Planetary Sciences, University of Arizona, 1629 East University Boulevard, Tucson, Arizona 85721 Received April 30, 1997; revised April 17, 1998 1. INTRODUCTION Water is important in the solar nebula both because it is To date, the evolution and spatial distribution of water in extremely abundant and because it condenses out at 5 AU, the solar nebula have not been the focus of many detailed allowing all three phases of H 2 O to play a role in the composition investigations even though water can play an important and evolution of the Solar System. In this paper, we undertake a thorough examination of and model the inward radial drift and complex role. Nebular water is important for two main of ice particles from 5 AU. We then link the drift results to reasons: it is the most abundant condensable because oxy- the outward diffusion of vapor, in one overall model based on gen is cosmochemically the third most abundant element the two-dimensional diffusion equation, and numerically evolve after hydrogen and helium, and it condenses out at p5 the global model over the lifetime of the nebula. We find that AU, allowing ice to become a major constituent of outer while the inner nebula is generally depleted in water vapor, Solar System bodies. The nebular water distribution can there is a zone in which the vapor is enhanced by 20–100%, impact nebular structure and evolution in a variety of ways. depending on the choice of ice grain growth mechanisms and Sufficiently large changes in the nebular water ice grain rates. This enhancement peaks in the region from 0.1 to 2 AU distribution, for instance, will affect the disk opacity, and and gradually drops off out to 5 AU. Since this result is some- thus the nebular thermal structure and transport processes. what sensitive to the choice of nebular temperature profile, we Additionally, the distribution of water ice over the nebula’s examine representative hot (early) and cool (later) conditions lifetime will influence timescales of planetesimal growth during the quiescent phase of nebular evolution. Variations in the pattern of vapor depletion and enhancement due to the by accretion, an important consideration for modeling the differing temperature profiles vary only slightly from that given formation of the outer planets. Moreover, the late nebular above. Such a pattern of vapor enhancement and depletion in water distribution will directly impact the composition of the nebula is consistent with the observed radial dependence subsequent Solar System bodies, both icy bodies and rocky of water of hydration bands in asteroid spectra and the general objects containing water of hydration, as well as possibly trend of asteroid surface darkening. This pattern of water vapor affecting the supply of water to terrestrial planet surfaces. abundance will also cause variations in the C : O ratio, shifting Here we examine the transport of water vapor and conden- the ratio more in favor of C in zones of relative depletion, sation in the nebula, in order to consider the chemical, affecting local and perhaps even global nebular chemistry, the compositional, and dynamical implications for the distribu- latter through quenching and radial mixing processes. 1998 tion of water in Solar System bodies (Fig. 1). Academic Press An early consideration of the overall transport of solid Key Words: solar nebula; ices; chemistry; models. and gaseous species in the nebula was that of Morfill and 537 0019-1035/98 $25.00 Copyright 1998 by Academic Press All rights of reproduction in any form reserved.
Transcript
ICARUS 135, 537–548 (1998)ARTICLE NO. IS985959
Distribution and Evolution of Water Ice in the Solar Nebula:Implications for Solar System Body Formation
Kimberly E. Cyr
LPL/Department of Planetary Sciences, University of Arizona, 1629 East University Boulevard, Tucson, Arizona 85721E-mail: [email protected]
LPL/Department of Planetary Sciences, University of Arizona, 1629 East University Boulevard, Tucson, Arizona 85721
Received April 30, 1997; revised April 17, 1998
1. INTRODUCTIONWater is important in the solar nebula both because it is
To date, the evolution and spatial distribution of water inextremely abundant and because it condenses out at 5 AU,the solar nebula have not been the focus of many detailedallowing all three phases of H2O to play a role in the compositioninvestigations even though water can play an importantand evolution of the Solar System. In this paper, we undertake
a thorough examination of and model the inward radial drift and complex role. Nebular water is important for two mainof ice particles from 5 AU. We then link the drift results to reasons: it is the most abundant condensable because oxy-the outward diffusion of vapor, in one overall model based on gen is cosmochemically the third most abundant elementthe two-dimensional diffusion equation, and numerically evolve after hydrogen and helium, and it condenses out at p5the global model over the lifetime of the nebula. We find that AU, allowing ice to become a major constituent of outerwhile the inner nebula is generally depleted in water vapor, Solar System bodies. The nebular water distribution canthere is a zone in which the vapor is enhanced by 20–100%,
impact nebular structure and evolution in a variety of ways.depending on the choice of ice grain growth mechanisms andSufficiently large changes in the nebular water ice grainrates. This enhancement peaks in the region from 0.1 to 2 AUdistribution, for instance, will affect the disk opacity, andand gradually drops off out to 5 AU. Since this result is some-thus the nebular thermal structure and transport processes.what sensitive to the choice of nebular temperature profile, weAdditionally, the distribution of water ice over the nebula’sexamine representative hot (early) and cool (later) conditionslifetime will influence timescales of planetesimal growthduring the quiescent phase of nebular evolution. Variations in
the pattern of vapor depletion and enhancement due to the by accretion, an important consideration for modeling thediffering temperature profiles vary only slightly from that given formation of the outer planets. Moreover, the late nebularabove. Such a pattern of vapor enhancement and depletion in water distribution will directly impact the composition ofthe nebula is consistent with the observed radial dependence subsequent Solar System bodies, both icy bodies and rockyof water of hydration bands in asteroid spectra and the general objects containing water of hydration, as well as possiblytrend of asteroid surface darkening. This pattern of water vapor affecting the supply of water to terrestrial planet surfaces.abundance will also cause variations in the C : O ratio, shifting Here we examine the transport of water vapor and conden-the ratio more in favor of C in zones of relative depletion,
sation in the nebula, in order to consider the chemical,affecting local and perhaps even global nebular chemistry, thecompositional, and dynamical implications for the distribu-latter through quenching and radial mixing processes. 1998tion of water in Solar System bodies (Fig. 1).Academic Press
An early consideration of the overall transport of solidKey Words: solar nebula; ices; chemistry; models.and gaseous species in the nebula was that of Morfill and
5370019-1035/98 $25.00
Copyright 1998 by Academic PressAll rights of reproduction in any form reserved.
538 CYR, SEARS, AND LUNINE
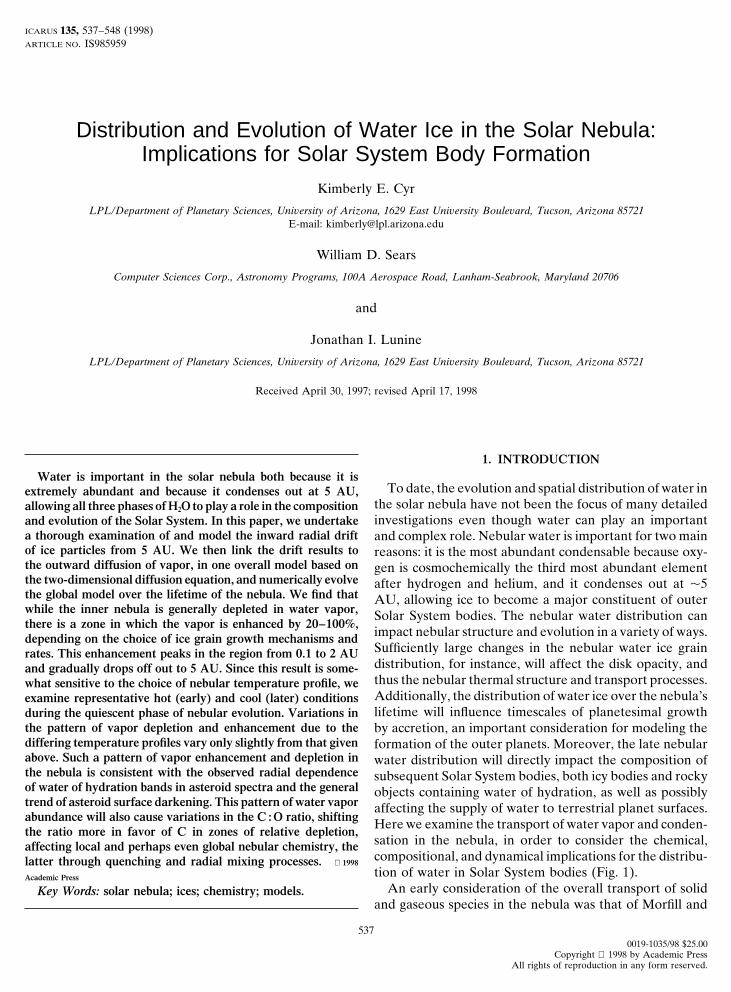
FIG. 1. A schematic of the overall system under consideration: the protosun surrounded by the nebular disk. The focus for the majority of thispaper will be on the ‘‘inner solar nebula,’’ i.e., the region 1–5 AU; this includes the chemically active zone and the water condensation front(‘‘snowline’’). The two main processes affecting the distribution of nebular H2O we examine are the diffusion of water vapor out past the condensationfront, initially at 5 AU, where the vapor condenses into ice particles, and the radial drift back inward of the ice. In all subsequent discussion, thecoordinate R represents the radial distance measured outward from the central axis of the nebula.
Volk (1984). They described average conditions of trans- venson and Lunine (1988) had underestimated the magni-tude of aerodynamic gas drag and that drag would indeedport of dust, gas, and vapor in a turbulent protosolar nebula
by deriving analytical solutions from their model in the cause larger ice bodies to drift inward significant distances,on relatively short timescales. An updated version of thelimit of small particle sizes. Their general conclusions im-
plied that material is reprocessed thermally and can be Stevenson and Lunine examination of the radial transportof water through the solar nebula incorporating both in-chemically fractionated extensively and that there is a sig-
nificant enhancement of solid particles just outside their ward ice drift and outward vapor diffusion is thus requiredand presented here. The solar nebula framework for thesublimation zones in the nebula which could help speed
planetesimal formation in that area. water transport model is discussed in Section 2 of thispaper, the gas drag–radial drift model is discussed in Sec-In later work, Stevenson and Lunine (1988) considered
the diffusive redistribution and condensation of water in tion 3, the diffusion model expanded from Stevenson andLunine (1988) to include both drift and diffusion processesthe nebula with the goal of facilitating the rapid formation
of Jupiter. They modeled the outward diffusion of water is discussed in Section 4, implications for Solar Systembody chemistry and formation are considered in Sectionvapor in the nebula by assuming a ‘‘cold finger’’ solution—
i.e., they solved the diffusion equation in the limit that the 5, and conclusions are summarized in Section 6.sink of water vapor is condensation within a narrow radialzone, located p5 AU from the nebular center. They also 2. THE SOLAR NEBULAassumed that the condensate decoupled from the nebulargas rapidly and suffered little effect from gas drag so that Understanding Solar System body formation requires
an understanding of the chemical and dynamical historysmall ice grains would not be carried back inward of 5 AUdue to nebular drag forces, and would grow unmolested of the solar nebula. In particular, modeling water transport
in the solar nebula setting requires an understanding ofinto larger ice bodies which remain in the condensationzone. Given these conditions, their model predicted that both global nebular evolution as well as specific nebular
processes that could affect such transport. Both the overallthe inner 5 AU of the nebula would become severely de-pleted in water vapor in as little as 105 years and that the and several specific processes will be described briefly here,
so that the water transport model results (Section 5) cansurface density of ice in the condensation zone would beenhanced by up to a factor of 75. This would be sufficient be interpreted within their context.
The generally accepted scenario for Solar System forma-enhancement to trigger formation of Jupiter’s heavy ele-ment core and thus of Jupiter itself, on a reasonable tion starts with the self-gravitational collapse of a rotating
interstellar cloud into a protostar surrounded by a dustytimescale.However, subsequent reconsideration of gas drag effects disk. Material raining in from the cloud has too much
angular momentum to fall directly onto the protostar, andon the ice condensate by Sears (1993) suggested that Ste-
SOLAR NEBULA VAPOR/ICE DISTRIBUTION 539
so instead falls onto the disk. However, the Sun contains still exists at that time, such giant planets could clear apath through the nebula, sweeping up material out to 2–3p99.9% of the Solar System’s mass but only 2% of the
Solar System’s angular momentum (Boss et al. 1989); this AU around them as they migrate. Thus, the timing ofplanetesimal and planetary formation is important; how-implies that a significant redistribution of angular momen-
tum outward and mass inward had to occur throughout ever, it is not well constrained. Most modelers assume,based on meteoritic evidence (Macpherson et al. 1995),the nebular disk by the end of its lifetime. The bulk of the
mass is ultimately transported through the disk and fed that planetesimal formation occurred slowly during thelater, quiescent phase of nebular evolution (see Woodonto the protostar, while only a relatively small amount
of matter left behind in the disk forms Solar System bodies (1996) for an alternate view). If planets did form duringthe early chaotic stage, it is also possible that they did(Weidenschilling 1977b). The nebula is ultimately dis-
persed when winds from the young star blow the residual not survive into the quiescent stage either because theymigrated in onto the protostar or were ejected from thegas and dust away.
Nebular evolution is currently understood to have oc- nebula. Further, Liou and Malhotra (1997) modeled thedynamical gap in the asteroid belt via the migration ofcurred in two major phases. The first is the collapse phase
which lasts as long as cloud material is raining down on Jupiter; parameters of some of their models require theformation of Jupiter to be complete and the migration tothe disk, and the second is the less active, quiescent phase
after infall of cloud material has ceased. The collapse phase initiate at nearly 107 years, the end of the nebular lifetime.Thus it would not be inconsistent to assume late formationis believed to last on the order of 106 years, which is the
time it takes to collapse a one solar mass cloud at 10 K of planetesimals and planets.For the purposes of this paper, we will investigate water(Cassen 1994); this time is also consistent with observa-
tional evidence for ages of T Tauri stars believed to be and ice transport from the start of the quiescent phase,i.e., at the very end of the collapse phase after the lastactively accreting material (Beckwith et al. 1990). Evidence
indicates that the quiescent phase lasted an order of magni- transient and chaotic event has ceased, and then through-out quiescent evolution of the disk. We will assume thattude longer: observations show that nebular disks persist
around T Tauri stars for up to 107 years (Strom et al. 1993) planetesimals either did not form in or did not survive theearly chaotic stage of nebular evolution and that giantand there is also meteoritical evidence suggesting that ther-
mal processing of nebular material occurred over a 107- planet migration occurred, if at all, at the end of the nebu-lar lifetime.year period (Podosek and Cassen 1994).
During the collapse phase, it is believed that the nebula3. RADIAL DRIFT MODELwas very active, chaotic, and potentially punctuated by
a number of transient, disruptive and poorly understood3.1. Model
phenomena. For instance, during mass accretion onto thedisk, density inhomogeneities may have occurred, causing The radial drift model is a modified and updated version
of Sears’s (1993) numerical model which computes gasthe disk to become gravitationally unstable and possiblynonaxisymmetric (Boss 1989); nebular gas and fine dust drag on ice particles in the solar nebula, based on the
Weidenschilling (1977a) aerodynamic gas drag formalism.entrained in the gas were being relatively rapidly trans-ported, primarily radially inward and onto the protostar Gas drag occurs because the rotational velocity of gas in
the nebula is less than the Keplerian velocity due to gas(Cassen 1994); the protostar may have undergone episodicFU Orionis-type luminosity bursts, i.e., large, long-lived pressure support. Small particles move with the gas, feel
the residual inward gravitational acceleration due to gasincreases in protostellar magnitude (Hartmann et al. 1993,Bell and Lin 1994); and the nebula may have periodically pressure support, and thus drift inward at terminal velocity.
Large particles move with Keplerian velocity, plowinggenerated lightning under special circumstances, e.g., avery dusty disk, more consistent with early stages of nebula through the gas. The resultant ‘‘headwind’’ causes drag-
induced energy loss and the particles spiral inward towardevolution (Gibbard et al. 1997, Pilipp et al. 1998).Conditions are believed to be more stable during the the Sun. The maximum possible drift velocity is the differ-
ence between the Keplerian and gas velocities, which inquiescent phase: mass infall from the cloud has ceased solittle to no new material is being accreted by the disk, the model is 2 3 104 cm s21 at 5 AU.
Figure 2 plots radial drift velocities due to gas drag vsnebular gas motions are very small, and most likely nodisruptive phenomena, with the possible exception of giant particle size. It shows that particles 1–103 cm in size will
drift significantly inward, with 10- to 100-cm-sized particlesplanet migration, occurred. In recent work, Trilling et al.(1998) showed that it was possible for Jupiter-sized planets moving the fastest through several AUs over 104–5 years.
The smallest sized particle that will decouple from the gasto migrate radially inward to small heliocentric distances,#0.1 AU, because of torques arising from the nebular disk, and drift inward can be estimated under the assumption
of a turbulent nebula. Turbulent motions will have a char-protostar, and planetary mass-loss. Assuming the nebula
540 CYR, SEARS, AND LUNINE
two profiles, we use the Cassen profile as a plausible upperlimit on the temperature corresponding to the start of thequiescent phase of nebular evolution. Cassen’s thermalstructure migrates radially inward over time; we use tem-perature profiles at early (hot) and late (cool) stages ofevolution in order to provide ‘‘snapshots’’ of water trans-port results at various times during quiescent nebula evolu-tion, thus tracking the changes in water transport duringthe nebula’s late history.
Lastly, the full drift model incorporates not only theWeidenschilling drag formalism and the Cassen nebularmodel, but also sublimation after Lichtenegger and Komle(1991) and Lunine et al. (1991), condensation time scalesafter Stevenson and Lunine (1988), and a numerical inte-gration routine based on Stoer and Bulirsch (1980). Iceparticles are assumed to be spherical with r p 1 g cm23,and particles are always assumed to be at the same temper-
FIG. 2. Radial drift velocities caused by gas drag vs particle size.ature as the gas. Sublimation is modeled simply and isThe solid line represents velocities of particles at 5 AU while the dottedbased on the vapor pressure above a solid surface at a givenline plots particle velocities at 1 AU, showing an increase in velocity
inward assuming a constant particle size. The shape of the plots recreates temperature. The model assumes growth by condensationthat of Weidenschilling (1977a), reflecting the various drag laws—Stokes, preceding grain growth by coagulation where ballistic colli-Epstein—in effect for large and small particle sizes, respectively. The sions of H2O molecules are the grain growth mechanismplot shows that 10- to 100-cm-sized particles will be the fastest moving
and the ability of the resultant snowflake to transfer colli-and that 1- to 103-cm-sized particles will undergo significant drift oversional heat to the H2 gas is the growth limiting mechanism.the 107-year nebular lifetime.
The numerical drift model starts with a given sized iceparticle moving with Keplerian velocity at a given radialdistance from the Sun. The particle is then subjected to
acteristic velocity, vturb . A particle decouples if its terminal solar gravity and gas drag, and the model tracks the parti-velocity, vterm , is less than vturb . To estimate a typical mini- cle’s subsequent orbital motion and mass changes throughmum decoupling radius, set sublimation and condensation. The program ends when
the particle either becomes small enough to couple to thevterm 5 vturb p D/H p n/H, (1) gas, sublimates away completely, spirals into the Sun, or
the presumed nebular lifetime of 107 years (Cassen 1994)has elapsed.where D is the diffusion coefficient set equal to the eddy
viscosity n, and H is the scale height of the disk obtained After modifying and updating the drift model, wetracked various sized ice particles, initially at 5 and 7 AU,from the nebular model (Wood and Morfill 1988) as
3–4 3 1013 cm at 5 AU. For this order of magnitude calcula- for crystalline and amorphous ice, respectively. Crystallineice will condense at P p 1026 bar and T p 160 K at approxi-tion, n is estimated as p1015 cm2 s21, a typical value, after
Stevenson and Lunine (1988) whose model provides the mately 5 AU, while amorphous ice condenses at T # 145 K,farther out in the nebula. Therefore, crystalline ice I, thebasis for our calculations, discussed in Section 4. This yields
a drift velocity of p30 cm s21 and thus a decoupling radius, stable phase formed by condensation at 5 AU was assumed.Amorphous ice was also investigated in order to determineread from Fig. 2, of p0.3 cm.
In addition to drag physics, the drift model also incorpo- if ices resident in the outermost nebula, preserved molecu-lar cloud grains, might play a role in the inner nebula. Therates the semi-analytical Cassen (1994) nebular model.
Cassen derives a thermal profile for conditions at the end primary focus of the investigation, however, has been onthe vapor–ice interplay for crystalline ice and r # 5 AU.of the collapse phase, the hottest stage in the nebula, which
we take as indicative of conditions just before the start ofthe quiescent phase. Using different modeling methods,
3.2. ResultsBoss (1996) numerically derives a nebular thermal profilesimilar to Cassen’s. The Boss profile is somewhat cooler Just after cloud collapse, the quiescent phase of nebular
evolution starts. To represent conditions near the begin-in the outer regions of the nebula, though Boss did notincorporate any viscous heating; thus his temperature pro- ning of the quiescent stage, we use the Cassen (1994) tem-
perature profile in which the ice condensation front hasfile serves more as a lower limit for nebular temperatures.Because of this and the general agreement between the migrated in to 5 AU. This occurs shortly after the end
SOLAR NEBULA VAPOR/ICE DISTRIBUTION 541
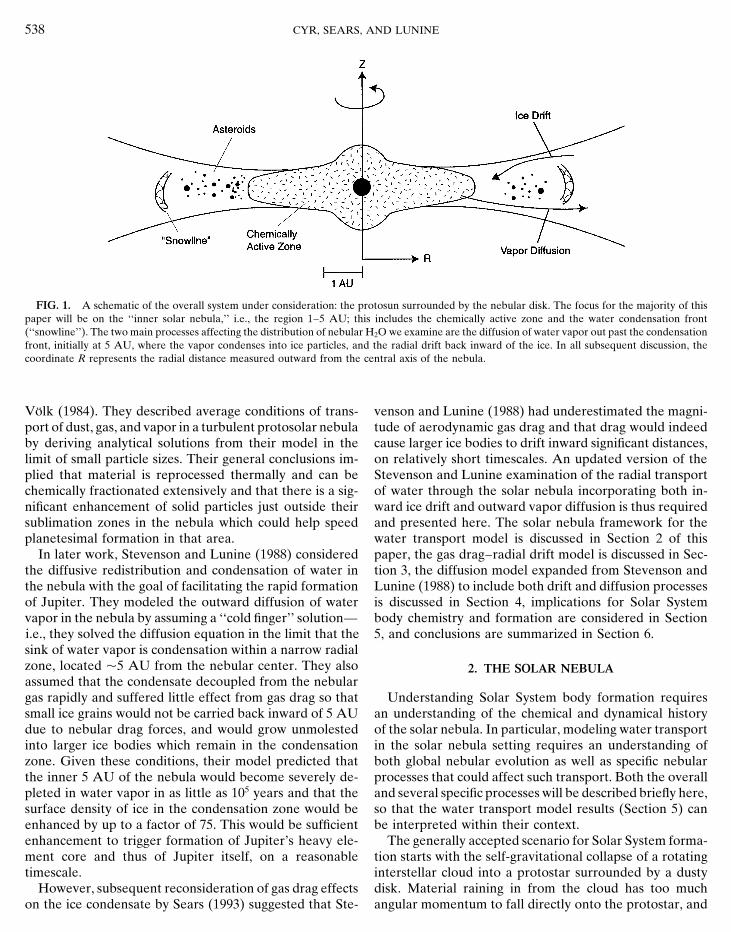
FIG. 4. Particle size vs radial distance for a range of sizes, initiallyFIG. 3. Particle size vs time for particles of a range of sizes, initiallyreleased at 5 AU, drifting inward. The Cassen (1994) nebular model was released at 5 AU, drifting inward (right to left in the plot) due to gas
drag. The Cassen (1994) nebular model for the start of the quiescentused at a time just after the collapse phase of the nebula had ended andthe quiescent phase had begun. At this stage peak midplane temperatures phase of nebular evolution was used. The plot indicates the range of
radial distance over which particles sublimate, 2.46–3.32 AU. It alsoare p1500 K out to about 1 AU, and the midplane ice condensationfront is at 5 AU. The plot indicates the length of time it takes for particles shows that larger particles drift further inward before completely subli-
mating and that larger particles sublimate over a broader radial zone.to drift inward and sublimate away; the fastest moving particles, 100-cm-sized, take only a little over 102 years, while the slowest, 104-cm, takejust over 105 years. Also indicated is that 5- to 104-cm particles will driftinward well within the nebular lifetime of 107 years.
the same radial distance in the nebula spend more timedrifting through the cooler nebula before sublimating.Also, in a cool nebula drifting particles sublimate later onof collapse and presumably after all the transitory andtheir path inward; this shifts the location of the sublimationdisruptive phenomena characteristic of the collapse phasezone further radially inward, by p1 AU over roughly thehave ended. Under these hot quiescent nebular conditions,
5- to 1000-cm-sized ice particles will drift back into theinner Solar System in less than 4 3 104 years (Fig. 3), wellwithin the nebular lifetime, with 100-cm particles beingthe fastest moving, as predicted in Fig. 2. The particlesremain intact for the bulk of their journey inward, subli-mating over a relatively narrow radial zone, 2.46–3.32 AU(Fig. 4). This suggests that the gas drag mechanism trans-ports ice into the inner nebular, causes a pulse of watervapor over 2.5–3.3 AU, and litters the region from 3 to5 AU with drifting ice particles.
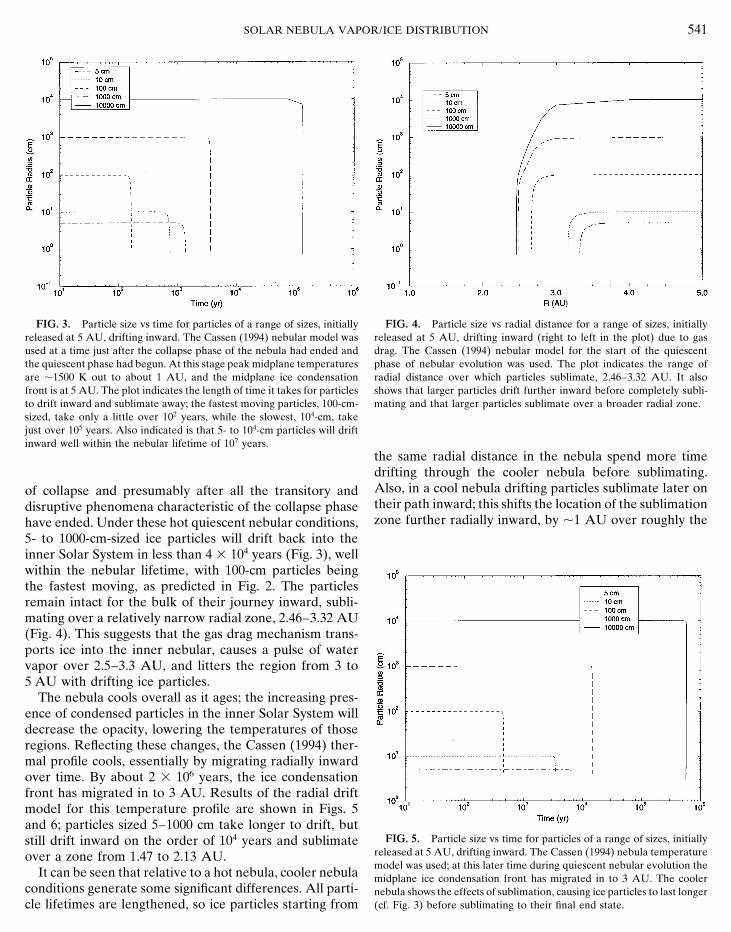
The nebula cools overall as it ages; the increasing pres-ence of condensed particles in the inner Solar System willdecrease the opacity, lowering the temperatures of thoseregions. Reflecting these changes, the Cassen (1994) ther-mal profile cools, essentially by migrating radially inwardover time. By about 2 3 106 years, the ice condensationfront has migrated in to 3 AU. Results of the radial driftmodel for this temperature profile are shown in Figs. 5and 6; particles sized 5–1000 cm take longer to drift, but
FIG. 5. Particle size vs time for particles of a range of sizes, initiallystill drift inward on the order of 104 years and sublimatereleased at 5 AU, drifting inward. The Cassen (1994) nebula temperatureover a zone from 1.47 to 2.13 AU.model was used; at this later time during quiescent nebular evolution the
It can be seen that relative to a hot nebula, cooler nebula midplane ice condensation front has migrated in to 3 AU. The coolerconditions generate some significant differences. All parti- nebula shows the effects of sublimation, causing ice particles to last longer
(cf. Fig. 3) before sublimating to their final end state.cle lifetimes are lengthened, so ice particles starting from
542 CYR, SEARS, AND LUNINE
fore it reaches 5 AU and therefore would only augmentthe crystalline ice population at 5 AU. The crystalline icedrift results would remain the same. Figure 7, though, doesserve to show that varying the vapor pressure relation ofinward-drifting icy particles can modify drift model results,primarily by changing the width of the sublimation zone.
4. DIFFUSION MODEL
4.1. Model
During the collapse phase in nebular evolution, radialmotion of nebular gas is most likely dominated by theredistribution of mass and angular momentum as gasstreams through the nebular disk and ultimately is accretedonto the protostar (Cassen 1994). However, during thequiescent phase radial motion of the gas due to protostellaraccretion may have been insignificant; most of the gasFIG. 6. Particle size vs radial distance for a range of sizes, initiallyremaining in the quiescent nebula is thought to have beenreleased at 5 AU, drifting inward due to gas drag. As in Fig. 5, the cooler,dispersed back into interstellar space at the end of theolder Cassen (1994) nebula temperature profile was used. The cooler
temperature profile causes particles to sublimate over a narrower radial nebular lifetime rather than transported onto the protostarzone and about 1 AU farther in, 1.47–2.13 AU, than in the hotter, younger (Shu et al. 1993). Thus diffusion, rather than being a smallnebula (Fig. 4). perturbation on vapor motion as it likely was during the
collapse phase, may have been a significant mode of vaportransport during the bulk of the nebula’s lifetime. Though
first 2 3 106 years of the quiescent phase. Last, the lifetimes there are indications that advective motions in the mid-of different sized particles are lengthened to different de- plane may have also affected vapor transport (Cuzzi et al.grees. In general, the smaller particles, 5–10 cm, are notas well buffered against hotter nebula conditions by theirmass as the larger 103–4-cm particles; thus the smallestparticles are more sensitive to temperature changes andbenefit the most from cooler conditions, traveling propor-tionally farther inward before significantly sublimating.This dispersion in lifetime lengthening reduces the widthof the sublimation zone, by about 0.2 AU, in the coolernebula. In general, as the nebula quiescently evolves weexpect the sublimation zone to shift radially inward andshrink.
The initial, simplistic amorphous ice results from thedrift model showed that this kind of ice, formed by con-densing farther out in the nebula by direct infall from thesurrounding molecular cloud, travels farther and fasterthan crystalline ice, presumably due to its different struc-ture and different vapor pressure relation. Figure 7 showsthat in the cool nebula 5- to 103-cm-sized particles impactthe inner Solar System, sublimating over a slightly broaderradial range of 0.6–2.2 AU (cf. Fig. 5). However, further
FIG. 7. Particle size vs radial distance for a range of sizes of amor-consideration indicates that taking into account the phase phous ice particles, initially released at 7 AU. The cool Cassen (1994)transition of amorphous to crystalline ice at T . 145 K nebular model was used. The plot indicates that outer nebula ice can
drift into the inner nebula regions and sublimate over a broader zone,would eliminate this effect. The phase transition is exother-0.6–2.2 AU, than crystalline ice (cf. Fig. 6) by the end of the nebularmic as the ice structure transits to a more organized, lowerlifetime. However, when phase changes of the ice (e.g., amorphous toenergy state. If the heat given off is sufficient to vaporizecrystalline) are taken into account, this effect is eliminated. The plot still
the ice in whole or part, the vapor would then recondense serves to show how different vapor pressure relations of icy particlesinto crystalline ice, as the rest of the ice reorganized into can affect drift model results, primarily by changing the width of the
1993), see Section 6 for further discussion, for the purposes in units of concentration of water vapor per time, describesof this parameter study we assume a simple diffusive the rate of the resupply of vapor from the drifting icenebula. particles, at various radial distances throughout the inner
The radial drift results of the previous section suggest nebula. Drift model runs were performed to determine athat water vapor is reintroduced into the inner nebula over variety of source terms (rates of resupply of vapor) atapproximately a 1-AU-wide zone. In addition to the fact various radial distances and times, creating in effect a tablethat this vapor will in turn rediffuse outward toward 5 of values for S(R) that the program reads in at appropriateAU, is the possibility that, time scales permitting, ice will time and distance intervals. No other sources, such as outercontinuously condense and drift inward, sublimate, and nebula amorphous ice contributions (other than our onethe resultant vapor diffuse outward. Numerous repetitions amorphous ice run) or sinks of H2O were assumed, so theof this vapor-diffusion, ice-drift cycle are thus possible by total H2O budget present as ice plus vapor always remainedthe end of the nebular lifetime. It is necessary, then, to constant. Thus, all water vapor no longer present in thetrack the continuous diffusion–drift cycle throughout the inner Solar System, lost due to diffusion, is assumed toevolution of the nebula in order to determine whether have condensed into ice either residing at 5 AU or driftingwater vapor in the inner nebula survives and, if so, what inward. Most of the ice was assumed to be in the fastestbreadth and amplitude the final vapor zone has. moving sizes, 10–100 cm, though a small amount, #5%,
In order to track the diffusion–drift cycle, we expanded was assumed to be in the largest 103–4 cm sizes, in orderthe Stevenson and Lunine (1988) nebular vapor diffusion to study the impact of large inward-drifting ice bodies.model. The Stevenson and Lunine cold-finger model tracks Inherent in the diffusion–drift model are various time-the diffusion of water vapor in the solar nebula over the scales which ultimately control whether the diffusion ornebula’s lifetime, and solves the diffusion equation in the the drift process dominates. Relevant timescales includelimit that water vapor condenses within a narrow radial the nebular lifetime of 107 years as well as drift, sublima-zone at the snowline, initially p5 AU from the nebula tion, diffusion, and grain growth timescales. Drift timescenter. Stevenson and Lunine assumed no other sources (Figs. 3, 5) vary, but range from 102 to 103 years for theor sinks of vapor; in contrast, we incorporate the ice drift fastest (smaller) moving particles and from 104 to 106 yearsresults through the addition of source terms of varying for the larger particles. Significant particle sublimation,magnitude. The expanded diffusion model numerically e.g., particle radius dropping to 60% or less of original,solves the two-dimensional diffusion equation in cylindri- occurs over # the last 4% of the particle’s lifetime for allcal coordinates with azimuthal symmetry, after Stevenson particle sizes considered and for all choices of nebularand Lunine (1988) and Barrer (1970), temperature profile. Thus sublimation occurs effectively
instantaneously and timescales over which sublimation oc-dc/dt 2 (2D/R) dc/dR 2 Dd2c/dR2 1 S(R) 5 0, (2) curs are negligible. Diffusion timescales can be taken from
Stevenson and Lunine (1988) or Fig. 8, which reproduceswhere c is the concentration of H2O molecules, D is the their results. Significant diffusion, e.g., total nebular vapordiffusion coefficient set equal to the eddy viscosity of the content from 1 to 5 AU dropping to 60% of original, startsturbulent nebula (which we numerically choose to be 1015 at p104 years. Unlike the foregoing timescales, however,cm2 s21), R is the radial distance from the nebular center, grain growth rates are less well constrained and can vary byand S(R) is the source term. Boundary conditions are orders of magnitude depending on the mechanism invoked.
For instance, the Stevenson and Lunine (1988) model ofsimple condensation and coagulation yields a 1-cm particlec 5 solar abundance for R , 5 AU, t 5 0in 105 years, but with the caveat of the possibility of growthc 5 0 for R 5 5 AU, all t,to 104 cm in 104 years due to collisional processes (Naka-gawa et al. 1981), which were not included in their model.indicating that at the start of the calculation the concentra-Due to the uncertainties in grain growth rates, a range oftion of water vapor is constant across the inner nebularates, 103–105 years, were investigated reflecting some to(0.1–5 AU) and is that which results from a solar composi-no collisional growth of ice grains. In physical terms, graintion gas, while the concentration of vapor is zero at (andgrowth rates directly limit the time before ice populationsbeyond) 5 AU, at all times, because vapor condenses outcan start to drift inward and thus constrain the amount ofas ice at and beyond that point. The explicit, forward timeice that can drift at any given time. Given that it is notcentered space (FTCS) differencing method (Press et al.unreasonable to expect some amount of collisional pro-1992) was used to numerically evolve and solve the systemcessing of ice grains in the nebula, and thus a relativelyover the nebular lifetime.efficient grain growth rate, we would expect the short driftThrough the source term, S(R), drift model results are
incorporated into the diffusion equation. S(R), expressed time scales of the fastest particles to dominate, preserving
544 CYR, SEARS, AND LUNINE
some amount of vapor in the inner nebula by the end of Diffusion–drift results at later, cooler times in the nebulanebular evolution. are similar to those in Fig. 9. At cooler times (Fig. 10),
the enhancement spreads over a smaller zone, 0.1–2 AU4.2. Diffusion Results before tapering off out through 5 AU, and the peak en-
hancements are less (p40%) than during hotter conditionsFigure 8 shows the result of the diffusion–drift modelin the nebula. The differences in the hotter nebula condi-when no sources are present; i.e., no significant inward icetions relative to the cool nebula are due primarily to theparticle drift occurs. This is equivalent to, and reproduces,location and to a lesser extent to the increased breadth ofthe Stevenson and Lunine (1988) results. Each curve repre-the sublimation zone. Because the sublimation zone hassents a different moment in time, with the area under anyshifted radially outward, the enhancements are also gener-curve representing the amount of vapor present over 1–5ally shifted outward. Moreover, because vapor is resup-AU. Figure 8 shows the nebula inward of 5 AU clearedplied closer to the condensation front and because diffusionof water vapor by 2 3 105 years. The diffusion processaffects vapor closer to this front first, more of the newlyalone will result in a drier inner nebula, where the drynessinjected vapor and less of the original nebula vapor diffusesis both relative to initial assumptions of solar abundanceoutward. Thus, in the hot nebula case, the sublimationconcentrations and absolute, in that little to no water vaporzone acts as a better buffer against diffusion, preservingis present. Other results of the simple diffusion case tomore of the original nebula vapor inward of the zone.note are that in the absence of inward ice drift or other
The other end member case of very slow grain growth,mechanisms the inner nebula is also devoid of ice particles,growth of 10- to 100-cm particles in p105–6 years, yieldsthat the inner nebula is uniformly depleted in water vaporan even more extreme distribution of water that is effec-across 1–5 AU—i.e., there is no radial dependence to thetively a step function: vapor enhancement 10 times solardepletion, and that since in this case all vapor that diffusesabundance released over 1.5–2.0 AU, negligible amountsout to 5 AU condenses into ice and remains in the conden-of vapor elsewhere. Though it is perhaps possible that suchsation zone, there is a large enhancement in the concentra-slow grain growth rates may have predominated through-tion of ice located at p5 AU.out nebular evolution, we expect that the more efficientFigure 9 shows the results of our diffusion–drift model,grain growth rates yielding 10- to 100-cm particles in 103–4at the beginning of the quiescent phase of evolution, foryears and which incorporate some amount of collisionalthe relatively efficient grain growth rate in which the fastestprocessing, are more likely to have occurred. These moresized particles, 10–100 cm, grow in p103 years. The 1-efficient grain growth rates all generate the same qualita-to 5-AU region still experiences something of a generaltive diffusion–drift plot behavior, with vapor enhance-depletion in water vapor relative to solar abundance con-ments of 20–100% over the no source case from 0.1–2 AU,centrations. However, for this the hottest stage of quiescenttapering off through 4–5 AU.evolution there is also a significant local vapor enhance-
As the nebula evolves, we would expect more and morement from 0.1 to 2.5 AU of p60% over the no-sourcesof the original nebula vapor to be thermally cycled acrosscase (Fig. 8), which drops off gradually out to 5 AU. Thisthe condensation front, the outer edge of the zone of peaksuggests that while there is still some tendency towardvapor enhancement to shrink inward from 2.5 to less thanoverall drying of the inner nebula relative to solar values,1.8 AU, the peak level of vapor enhancement to decrease,there is additionally a local ‘‘wet’’ zone of relative vaporand the vapor enhancement to taper off out to 5 AU overenhancement which diminishes with radial distance until
it disappears near 5 AU. a correspondingly larger radial zone.
FIG. 8. Diffusion model assuming no significant radial drift. This plots the simple diffusion of water vapor out to 5 AU, where it condensesout as ice, assuming no sources of vapor, i.e., no radial drift and subsequent sublimation of ice particles. Each curve represents the water vapordistribution at a different time during the nebula’s evolution. The plot reproduces the Stevenson and Lunine (1988) model result, and shows thatthe inner nebula becomes effectively completely devoid of water vapor by the end of the nebular lifetime for this limiting case.
FIG. 9. Diffusion model with radial drift. Diffusion of water vapor out to the 5 AU condensation front is modeled as in Fig. 8, but alsoincorporates the inward drift and subsequent sublimation of ice particles. A relatively efficient grain growth rate of 10- to 100-cm-sized particlesforming in 103 years was used, as was the hot Cassen (1994) temperature profile corresponding to the start of the quiescent phase of nebularevolution. Relative to Fig. 8, the case in which drift effects were not incorporated, this plot shows that by 105 years, there is a significant enhancementof water vapor from 1 to 2.5 AU with the vapor enhancement falling off out through 5 AU. Maximum enhancement, from 0.1 to 2.5 AU, is p60%relative to the no-sources case.
FIG. 10. Diffusion model with radial drift, all parameters as in Fig. 9, but based on the cooler Cassen temperature profile corresponding to alater stage of quiescent nebula evolution in which the condensation front has migrated inward to 3 AU. The qualitative results are the same as inFig. 9; however, the breadth of the zone of enhancement is narrower (0.1–1.8 AU) and the amount of enhancement is less; maximum enhancementis now 40% relative to the no-sources case (Fig. 8).
SOLAR NEBULA VAPOR/ICE DISTRIBUTION 545
5. IMPLICATIONS the location of the condensate as the condensation frontmigrates inward. This might lead to a slower formation
The major conclusion of Stevenson and Lunine (1988) time for Jupiter’s heavy element core than that suggestedwas that the diffusion process facilitated the rapid forma- by Stevenson and Lunine (1988). However, if radial migra-tion of Jupiter by concentrating a greater abundance of tion of giant planets is significant before bodies accreteice at p5 AU. Our results indicate that relatively efficient one Jupiter mass, something not yet studied, accretion ofgrain growth rates coupled with the inward drift of ice material during migration could offset the drift-inducedparticles will serve to deplete the feeding zone for Jupiter losses.
In the relatively recent past there have been a series ofby converting some of the ice to vapor and spreading out
546 CYR, SEARS, AND LUNINE
intriguing detections of hydration features (Lebofsky et al. chemical calculations (in process) will quantify the impor-tance of this effect.1981, A’Hearn and Feldman 1992) and/or ammonia fea-
Further, the general drying of the inner nebula by diffu-tures (King et al. 1992) in asteroid spectra as well as othersive processes is potentially consistent with the oxidationcircumstantial evidence that asteroid Ceres may have oncestate of the enstatite chondrites (Hutson 1996), with thehad significant amounts of free water in its interior (Fanalecaveat that other meteorite types with higher oxidationand Salvail 1989). The number of asteroids with detectedstates must be understood in the context of this model ashydration features is correlated with heliocentric distancewell. The overall problem of wide variation in oxidationR, with fewer detections near 2 and 4 AU and more detec-state of the environments of various meteorite types re-tions near 3 AU. Jones (1988) has interpreted these andmains a daunting one, and local environments created byother data as suggesting that C-class asteroids may haveparent bodies with liquid water and heat sources remainsinitially accreted from an unequilibrated mix of anhydrousone poorly constrained explanation for the chemistry.high temperature minerals, organic material, and water ice
Last, other implications of the model include changesand then were subjected to a heliocentric heating event.in the predicted CO/CH4 ratio produced by nebular gasThe heating event would have vaporized the ice of nearerphase chemistry in the inner 1 AU of the solar nebula.asteroids, melted the ice of mid-range asteroids, but notRemoval of oxygen would tend to favor higher CH4 abun-have affected the ice in asteroids farther out. Inner anddances relative to the predictions assuming solar composi-outer asteroids would have no detectable hydration fea-tion, such as those summarized in Prinn and Fegley (1989).tures either because the ice was vaporized and blown off,The implications for the outer solar nebula, and objectsor because the ice never melted and thus did not reactformed there, depend critically on the efficiency of radialwith the minerals allowing detection. Mid-range asteroidsmixing of the nebula. Our solar nebula model, in whichwould have undergone sufficient melting such that chemi-tubulent diffusion is the principal mechanism for mixingcal alteration of silicates would occur and be detectable.matter, would argue against significant transfer of materialThe diffusion-drift model results provide a direct meansbetween the outermost disk (beyond 10 AU) and the chem-for causing hydration features in asteroids and an alterna-ically active zone at 1 AU, based on the work of Stevensontive to other mechanisms. The enhancement in water vapor(1990). However, other types of advective motions couldout to 3 AU or so would have increased the amount ofproduce more efficient mixing (Prinn 1990, Cuzzi et al.aqueous alteration of minerals incorporated into asteroidal1993), and our more reducing inner nebula could supplybodies; the drop off of vapor enhancement out to 5 AUsome of the methane seen in outer Solar System objectswould have limited the amount of aqueous alteration incor-such as Triton, Pluto, and some comets. While we stillporated in asteroids further out. Heating events may stillfavor the source of methane as the nascent molecular cloud
have occurred and given that ice particles drifting inward(Lunine et al. 1995), a more reducing inner nebula may
would have been present from 3 to 5 AU and thus incorpo- be relevant in preserving some of this material againstrated in asteroids, the mechanism posited by Jones is not oxidation into CO.completely precluded by our model—both may havebeen operative.
6. CONCLUSIONSIn terms of nebular chemistry, the diffusion–drift mecha-nisms produce an overall decrease of water vapor from 2 We have constructed a model of the evolution of waterto 5 AU coupled with the decreasing amount of vapor with in the inner portion of the solar nebula, i.e., inward of thedistance over that region, due to the tail-off of local vapor condensation front located at a midplane distance of 5 AU.enhancement. A decrease in H2O implies a decrease in We have gone beyond the diffusional cold finger model ofoxygen abundance, which will shift the C : O ratio in favor Stevenson and Lunine (1988) by including the growth andof carbon over that region. This could cause more carbon- radial drift of snowballs inward of the condensation frontrich molecules to form, their relative abundance increasing and their eventual sublimation. We have found an overallout to 5 AU. There is a general trend of observed darkening drying of the inner portion of the nebula associated withof asteroids with radial distance from the Sun; Jones (1988) outward diffusion and trapping of water vapor, as in Ste-and others have interpreted the darkness as being due to venson and Lunine (1988) but a relative, local enhance-increasing thicknesses of organic materials coating asteroid ment of the water vapor abundance appears around thesurfaces. The gradual decrease in water vapor with radial midplane region at 0.1–2 AU for a cool nebula or 0.1–3distance and thus the gradually increasing reducing nature AU for a hot nebula. This relative enhancement may haveof the nebula could explain the asteroidal darkening. Previ- its signature in the radial dependence of water of hydrationous diffusion models, like Stevenson and Lunine (1988), bands seen in asteroids. Conversely, the gradual relativewhich resulted in a flat radial vapor distribution are not depletion of water vapor from 2 or 3 to 5 AU may have
its signature in the radial dependence of observed darken-easily able to reproduce such darkening. More detailed
SOLAR NEBULA VAPOR/ICE DISTRIBUTION 547
ing of asteroids as well as possibly playing a role in the Fanale, F. P., and J. R. Salvail 1989. The water regime of asteroid (1)Ceres. Icarus 82, 97–110.oxidation states of enstatite meteorites.
Gibbard, S. G., E. H. Levy, and G. E. Morfill 1997. On the possibilityA quiescent nebula with advective motions in additionof lightning in the protosolar nebula. Icarus 130, 517–533.to turbulent diffusion would display a different time-de-
Hartmann, L., S. Kenyon, and P. Hartigan 1993. Young stars: Episodicpendent radial profile of water vapor than shown here. Inphenomena, activity and variability. In Protostars and Planets III (E. H.particular, the advective nebular models of Cuzzi et al.Levy and J. I. Lunine, Eds.), pp. 497–518. Univ. of Arizona Press,
(1993) produce a systematic flow of warm gas outward Tucson.across condensation fronts, such as that of water ice. Their Hutson, M. L. 1996. Chemical Studies of Enstatite Chondrites. Ph.D. thesis,findings pertain to a thin midplane layer within which radial University of Arizona.advection occurs. The amount of material advected across King, T. V., R. N. Clark, W. M. Calvin, D. M. Sherman, and R. H. Brownthe water ice boundary over nebular lifetimes was found 1992. Evidence for ammonium-bearing minerals on Ceres. Science
255, 1551–1553.to be significant relative to water budgets in the giantLebofsky, L. A., M. A. Feierberg, A. T. Tokunaga, H. P. Larson, andplanets. However, Cuzzi et al. (1993) did not evaluate the
J. R. Johnson 1981. The 1.7- to 4.2-em spectrum of asteroid 1 Ceres:results of the advection in terms of depletion of the waterEvidence for structural water in clay minerals. Icarus 48, 453–459.vapor inward of the condensation zone; nor did they explic-
Lichtenegger, H. I. M., and N. I. Komle 1991. Heating and evaporationitly model the transport of condensible water including theof icy particles in the vicinity of comets. Icarus 90, 319–325.
effects of inward drift of growing icy particles. Incorpora-Liou, J.-C., and R. Malhotra 1997. Depletion of the outer asteroid belt.
tion of such flows into a time-dependent history of nebular Science 275, 375–377.water is a worthy next step, as is explicit consideration of Lunine, J. I., W. Dai, and F. Ebrahim 1995. Solar System formation andthe nebular temperature dependence in the vertical direc- the distribution of volatile species. In Proceedings of the Conferencetion. Because of water’s large overall abundance, and its on Deep Earth and Planetary Volatiles (K. Farley, Ed.), pp. 117–122.
AIP Press, New York.ability to condense at a key place in the nebula, trackingLunine, J. I., S. Engel, B. Rizk, and M. Horanyi 1991. Sublimation andits history is crucial to understanding how the solar nebula
reformation of icy grains in the primitive solar nebula. Icarus 94,evolved into the planetary system we witness today.333–344.
MacPherson, G. J., A. M. Davis, and E. K. Zinner 1995. The distributionof aluminum-26 in the early Solar System—A reappraisal. Meteoritics
ACKNOWLEDGMENTS Planet. Sci. 30, 365–386.
Morfill, G. E., and H. J. Volk 1984. Transport of dust and vapor andThis work was supported in part by NASA GSRP Grants NGT-51127
chemical fractionation in the early protosolar cloud. Astrophys. J.and NGT-51646, and the NASA Origins program. Special thanks go to
287, 371–395.Andrew Rivkin for his discussion of asteroid hydration-feature spectraPilipp, W., T. W. Hartquist, G. E. Morfill, and E. H. Levy 1998. Chondruleand to referees J. Wood and M. Podolak for their helpful comments.
formation by lightning in the protosolar nebula. Astron. Astrophys.331, 121–146.
Podosek, F., and P. Cassen 1994. Theoretical, observational and isotopicREFERENCES estimates of the lifetime of the solar nebula. Meteoritics Planet. Sci.
29, 6–25.A’Hearn, M. F., and P. D. Feldman 1992. Water vaporization on Ceres.
Press, W. H., S. A. Teukolsky, W. T. Vetterling, and B. P. Flannery 1992.Icarus 98, 54–60.Numerical Recipes in FORTRAN: The Art of Scientific Computing, pp.
Barrer, R. M. 1970. Diffusion in and Through Solids. Cambridge Univ.838–842. Cambridge Univ. Press, New York.
Press, Cambridge.Prinn, R. G. 1990. On neglect of nonlinear momentum terms in solar
Beckwith, S., A. I. Sargent, R. S. Chini, and R. Gusten 1990. A survey fornebula accretion disk models. Astrophys. J. 348, 725–729.circumstellar disks around young stellar objects. Astron. J. 99, 924–925.
Prinn, R. G., and B. Fegley, Jr. 1989. Solar nebula chemistry: Origins ofBell, K. R., and D. N. C. Lin 1994. Using FU Orionis outbursts to constrainplanetary, satellite and cometary volatiles. In Origin and Evolution ofself-regulated protostellar disk models. Astrophys. J. 427, 987–1004.Planetary and Satellite Atmospheres (S. K. Atreya, J. B. Pollack, and
Boss, A. P. 1989. Evolution of the solar nebula. I. Nonaxisymmetric M. S. Matthews, Eds.), pp. 78–136. Univ. of Arizona Press, Tucson.structure during formation. Astrophys. J. 345, 554–571.
Nakagawa, Y., K. Nakazawa, and C. Hayashi 1981. Growth andBoss, A. P. 1996. Evolution of the solar nebula. III. Protoplanetary disks
sedimentation of dust grains in the primordial solar nebula. Icarusundergoing mass accretion. Astrophys. J. 469, 906–920.45, 517–528.
Boss, A. P., G. E. Morfill, and W. M. Tscharnuter 1989. Models of theSears, W. D. 1993. Diffusive redistribution of water vapor in the solarformation and evolution of the solar nebula. In Origin and Evolution of
nebula revisited. Proc. Lunar Planet. Sci. Conf. 24(3), 1271–1272.Planetary and Satellite Atmospheres (J. F. Kerridge and M. S. Matthews,Shu, F. H., D. Johnstone, and D. Hollenbach 1993. PhotoevaporationEds.), pp. 35–77. Univ. of Arizona Press, Tucson.
of the solar nebula and the formation of the giant planets. IcarusCassen, P. 1994. Utilitarian models of the solar nebula. Icarus 112,106, 91–101.405–429.
Stevenson, D. J. 1990. Chemical heterogeneity and imperfect mixing inCuzzi, J. N., A. R. Dobrovolskis, and J. M. Champney 1993. Particle–gasthe solar nebula. Astrophys. J. 348, 730–737.dynamics in the midplane of a protoplanetary nebula. Icarus 106,
102–134. Stevenson, D. J., and J. I. Lunine 1988. Rapid formation of Jupiter by
548 CYR, SEARS, AND LUNINE
diffusive redistribution of water vapor in the solar nebula. Icarus 75, Weidenschilling, S. J. 1977a. Aerodynamics of solid bodies in the solar146–155. nebula. Mon. Not. R. Astron. Soc. 180, 57–70.
Stoer and Bulirsch 1980. Introduction to Numerical Analysis. Springer Weidenschilling, S. J. 1977b. The distribution of mass in the planetaryVerlag, New York. system and the solar nebula. Astrophys. Space Sci. 51, 153–158.
Strom, S. E., S. Edwards, and M. F. Strutskie 1993. Evolutionary timeWood, J. A. 1996. Processing of chondritic and planetary material inscales for circumstellar disks associated with intermediate- and solar-
spiral density waves in the nebula. Meteoritics Planet. Sci. 31, 641–645.type stars. In Protostars and Planets III (E. H. Levy and J. I. Lunine,Wood, J. A., and G. E. Morfill 1988. A review of solar nebula models.Eds.), pp. 837–866. Univ. of Arizona Press, Tucson.
In Meteorites and the Early Solar System (J. F. Kerridge and MildredTrilling, D. T., W. Benz, T. Guillot, J. I. Lunine, W. B. Hubbard, andShapely Matthews, Eds.), pp. 329–347. Univ. of Arizona Press,A. Burrows 1998. Orbital evolution and migration of giant planets:
Modeling extrasolar planets. Astrophys. J. 500, 428–439. Tucson.