THE AERONAUTICAL JOURNAL APRIL 2020 VOLUME 124 NO 1274 447 pp447–471. c The Author(s) 2020. This is an Open Access article, distributed under the terms of the Creative Commons Attribution licence (http://creativecommons.org/licenses/by/4.0/), which permits unrestricted re-use, distribution, and reproduction in any medium, provided the original work is properly cited. doi:10.1017/aer.2019.160 Evaluating the impact of new aircraft separation minima on available airspace capacity and arrival time delay E. Itoh [email protected]Air Traffic Management Department National Institute of Maritime, Port and Aviation Technology Electronic Navigation Research Institute Tokyo Japan M. Mitici Faculty of Aerospace Engineering Delft University of Technology Delft The Netherlands ABSTRACT Although the application of new, reduced aircraft separation minima can directly increase runway throughput, the impact thereof on the traffic flow of aircraft arriving at the destination airport has not been discussed yet. This paper proposes a data-driven and queue-based mod- eling approach and presents an analysis of the impact on the delay time of arriving aircraft in the airspace within a radius of 100 nautical miles around an airport. The parameters of our queuing model were estimated by analysing the data contained in the radar tracks and flight plans for flights that arrived at Tokyo International Airport during the 2 years of 2016 and 2017. The results clarified the best arrival strategy according to the distance from the arrival airport: The combination of airspace capacity control and reduction of the flight time and separation variance is the most powerful solution to mitigate delays experienced by arriving traffic while also allowing an increase in the amount of arrival traffic. The application of new wake vortex categories would enable us to increase the arrival traffic to 120%. In addition, the arrival delay time could be minimised by implementing the proposed arrival traffic strategies together with automation support for air traffic controllers. Received 19 August 2019; revised 2 December 2019; accepted 3 December 2019.
Transcript
THE AERONAUTICAL JOURNAL APRIL 2020 VOLUME 124 NO 1274 447
Evaluating the impact of newaircraft separation minima onavailable airspace capacity andarrival time delayE. [email protected] Traffic Management DepartmentNational Institute of Maritime, Port and Aviation TechnologyElectronic Navigation Research InstituteTokyoJapan
M. MiticiFaculty of Aerospace EngineeringDelft University of TechnologyDelftThe Netherlands
ABSTRACTAlthough the application of new, reduced aircraft separation minima can directly increaserunway throughput, the impact thereof on the traffic flow of aircraft arriving at the destinationairport has not been discussed yet. This paper proposes a data-driven and queue-based mod-eling approach and presents an analysis of the impact on the delay time of arriving aircraft inthe airspace within a radius of 100 nautical miles around an airport. The parameters of ourqueuing model were estimated by analysing the data contained in the radar tracks and flightplans for flights that arrived at Tokyo International Airport during the 2 years of 2016 and2017. The results clarified the best arrival strategy according to the distance from the arrivalairport: The combination of airspace capacity control and reduction of the flight time andseparation variance is the most powerful solution to mitigate delays experienced by arrivingtraffic while also allowing an increase in the amount of arrival traffic. The application of newwake vortex categories would enable us to increase the arrival traffic to 120%. In addition, thearrival delay time could be minimised by implementing the proposed arrival traffic strategiestogether with automation support for air traffic controllers.
Received 19 August 2019; revised 2 December 2019; accepted 3 December 2019.
Keywords: queuing theory; data analysis; data-driven air transport; arrival management;wake vortex categories
NOMENCLATURE
AMAN arrival management
ATM air traffic management
CAi coefficient of variation of aircraft inter-arrival times in airspace area i
CBi coefficient of variation of aircraft service times in airspace area i
ci number of servers in airspace area i
Di delay an aircraft experiences in airspace area i
E-AMAN extended arrival management
FCFS first come first served
GIM-S ground-based interval management spacing
IAT inter-aircraft time
i number of airspace area
ICAO international civil aviation organization
IM interval management
LRATFM long range air traffic flow management
MTOM maximum take-off mass
NM nautical mile
RECAT wake turbulence re-categorization
STD standard deviation
TBFM time-based flow management
TMA traffic management advisory
TRACON terminal radar approach control
TSAS terminal sequencing and spacing
tIAT IAT in seconds
WS wind span
Greek SymbolE[Ai] mean of aircraft inter-arrival times in seconds
E[Bi] mean of aircraft service times in seconds
E[DG/G/ci ] expected total airborne delay of a G/G/c queuing model in airspace area i in
seconds
E[DM/M/ci ] expected total airborne delay of a M/M/c queuing model in airspace area i in
seconds
E[tmin] mean of the minimum time separation in seconds
λi arrival rate (number of arrival aircraft per hour) at airspace area i
λRW22 arrival rate (number of arrival aircraft per hour) at Runway 22
μi service ratio at airspace area i
ITOH AND MITICI EVALUATING THE IMPACT OF NEW AIRCRAFT SEPARATION MINIMA... 449
ρi parameter to estimate queue-stability at airspace area i
σAi variance of aircraft inter-arrival times in seconds
σBi variance of aircraft service times in seconds
1.0 INTRODUCTIONIncreasing the runway throughput is one of the most promising solutions to accommo-date future air traffic growth. In this regard, the application of new wake vortex cate-gories that lower the separation minima between arriving aircraft have been considered(1-3).Consequently, this affects aircraft arrival flows in that these separation minima lead to a reduc-tion in the aircraft inter-arrival time, or, equivalently, they allow an increased aircraft arrivalrate at an airport. An analysis is required to clarify whether the use of these new separationminima standards contributes to efficiently controlled arrival traffic, particularly for increased,future air traffic volumes. Further, it would be of interest to analyse the impact of these newminima separation standards on the airspace surrounding the destination airport, given theavailable airspace capacity, while ensuring reasonable delays in arrival times. To clarify this,we propose a new approach based on data-driven queuing models to analyse the impact ofnew aircraft separation minima on the traffic flow of arrival aircraft. For our analysis, we con-sider the airspace within a radius of 100 nautical miles (NM) from the destination airport. Wedemonstrate the effectiveness of our models with a case study at Tokyo International Airport,the fifth busiest airport in the world(4).
The management of aircraft arrivals at airports is central to airport operations. In the UnitedStates, the Traffic Management Advisory (TMA)(5) was deployed in air traffic control centersin the 1990s. The enhanced version thereof, Time-Based Flow Management (TBFM)(6) andTerminal Sequencing and Spacing (TSAS)(7), considers future airborne-based operations(8).These systems contribute to sequencing and time spacing the arrival traffic consistently inen-route and terminal airspace areas. In Europe, the on-going SESAR project has facilitatedcollaboration among European countries and contributed to the development of ‘Enhanced’Arrival Management (AMAN), which coordinates the arrival time-schedules covering widerranges of airspace than in the case of conventional operations(9). In the Asia-Pacific region,strategic air traffic flow management is achieved by using Long Range Air Traffic FlowManagement (LRATFM), which has been devised to provide a basis for research into appli-cations beyond the time-frames of the current system(10). On-going Japanese research anddevelopment on an ‘Extended’ AMAN (E-AMAN) aims to ensure the efficiency of the traf-fic flow arriving at Tokyo International Airport(11). In the E-AMAN scheme, arrival trafficflow control, which is designed to coordinate the traffic volume by considering the limitedairspace capacity and runway throughput, shifts to time-based operations close to the des-tination airports, which ensures minimum time-spacing between arrivals. One of the mostimportant requirements E-AMAN is designed to comply with, is to schedule the arrival timeto accommodate an increasing arrival ratio, while reducing the arrival time delay.
Several studies have analysed the aircraft arrival process at airports by means of queu-ing theory. For example, the aircraft arrival delay was analysed(12-15) by employing queuingmodels focused especially on runway-related delay and capacity constraints. Bauerle et al(12)
determined the expected waiting time for aircraft arriving at a single runway using anM/SM/1 queuing model. Simple bounds for the expected waiting time were determinedin comparison to M/G/1 and M/D/1 models. However, in their case study, the authorsdid not make use of operational data or compare their results against actual data. Rue
450 THE AERONAUTICAL JOURNAL APRIL 2020
and Rosenshine(14) modeled the arrival of aircraft at Pittsburgh International Airport as anM/M/1 and M/Ek/1 queue. The authors determined, using Semi-Markov decision pro-cesses, the maximum number of aircraft allowed to land at the airport during peak hours.Bolender and Slater(15) estimated the expected aircraft arrival delay by means of M/D/nqueues, which yielded reasonable results when compared with numerical simulation data.Again, no comparative analysis with actual flight data was conducted. Long et al.(13) modeledthe National Airspace System in the United States as a network of aircraft arriving, taxi-ing, and departing queues, with the TRACON sectors modeled as an M/E3/n queue. Thestudy provided a macroscopic view of the impact of ATM technologies and costs. Our previ-ous paper(16) presented an analysis of the arrival delay at an airport using a G/G/c queuingmodel. In this study, we considered extending the arrival airspace, while considering currentminimum separation standards and airspace capacity. In another study(17) we evaluated dif-ferent tactical control strategies for arrivals at an airport using a M/G/c/K queuing model.In this paper, we present an evaluation of the impact of new separation minima standards onarrival delay. We model the traffic flow of aircraft arriving from within a radius of 100NMfrom the destination airport by means of a G/G/c queue, and provide a microscopic view ofthe analysis to clarify the optimal balance between increasing the arrival rate considering theairspace capacity, with the ultimate aim of minimising the delay in arrival time.
This remainder of the paper is organised as follows. Section 2 introduces air traffic opera-tions at Tokyo International Airport and characterises the arrival traffic data recorded in 2016and 2017. This data analysis supports the models that are subsequently presented. Section 3compares the potential increase in the runway throughput by applying new wake vortex cat-egories, RECAT-Dubai, EU, US 1.5, with a current standard. The expected future arrivalratio is estimated by combining these categories and safety margins depending on the lev-els of automation support that were introduced for air traffic controllers. Section 4 proposes aqueue-based modeling approach in which the aircraft arrival process is formulated as a G/G/cqueuing model. Based on the data-driven analysis, the probability distributions of the inter-arrival time and service time are estimated. The number of virtual service counters, whichdirectly translates into capacities of the assigned airspace, is also estimated based on the traf-fic data. In Section 5, the G/G/c queuing model is applied to estimate the aircraft arrivaldelay time as a function of the distance from the destination airport by increasing the radiusof the airspace centered at the arrival airport from 10 to 100NM in increments of 10NM. Weanalyse the positive impact of reducing the inter-arrival time within the arrival traffic flowon the airspace capacity. In this context, the aircraft delay time is estimated by means of theproposed queue-based approach. Section 6 discusses the impact of new aircraft separationminima on the traffic flow of aircraft arriving at the airport. Furthermore, the optimal arrivalstrategy, which meets the key requirements of the E-AMAN design, is suggested. This strat-egy mitigates the arrival delay time while increasing the arrival traffic ratio. Finally, Section 7provides the conclusions and outlines our plans for future work.
2.0 CASE STUDY DATA DESCRIPTION – TOKYOINTERNATIONAL AIRPORT
2.1 Aircraft arrival operationsIn this section we describe the aircraft arrival operations at Tokyo International Airport. TokyoInternational Airport is the fifth busiest airport in the world with respect to passenger traffic,
ITOH AND MITICI EVALUATING THE IMPACT OF NEW AIRCRAFT SEPARATION MINIMA... 451
Figure 1. Departure and arrival operations depending on wind direction.
processing a total of 83,189,933 passengers in 2017. An increase of 4.32% in the number ofpassengers was registered in 2017 relative to 2016(4). The maximum number of departuresand arrivals accommodated per year is 447,000, with a maximum of 80 operations per hour.Over 60% of the domestic flights in Japan are concentrated at this airport. The airport makesuse of four runways on a daily basis, with the choice of runway configuration depending onthe wind direction (see Fig. 1). For operations at times of a northerly wind, runway 34L is usedfor arrivals from the south-west direction, whereas runway 34R is used for arrivals from thenorth. Runway 34R is also used for departure traffic. For operations when a southerly windprevails, runway 22 is used for arrivals from the south-west, and runway 23 for arrivals fromthe north.
In this study we consider flight plans and track data for a period of 71 days, which arerandomly selected from the odd months of 2016 and 2017. In 2016, there were a total averageof 608 arrivals per day, of which 530 flights were domestic and 78 flights international. In2017, eight additional international flights were accommodated every day compared to 2016.Thus, in 2017, there were a total average of 614 arrivals per day, of which 530 flights weredomestic and 84 flights were international. The total number of arrivals between 8:00AMand 11:00PM is slightly below the maximum allowed daily traffic threshold, and the mostcongested period is between 5:00PM and 10:00PM.
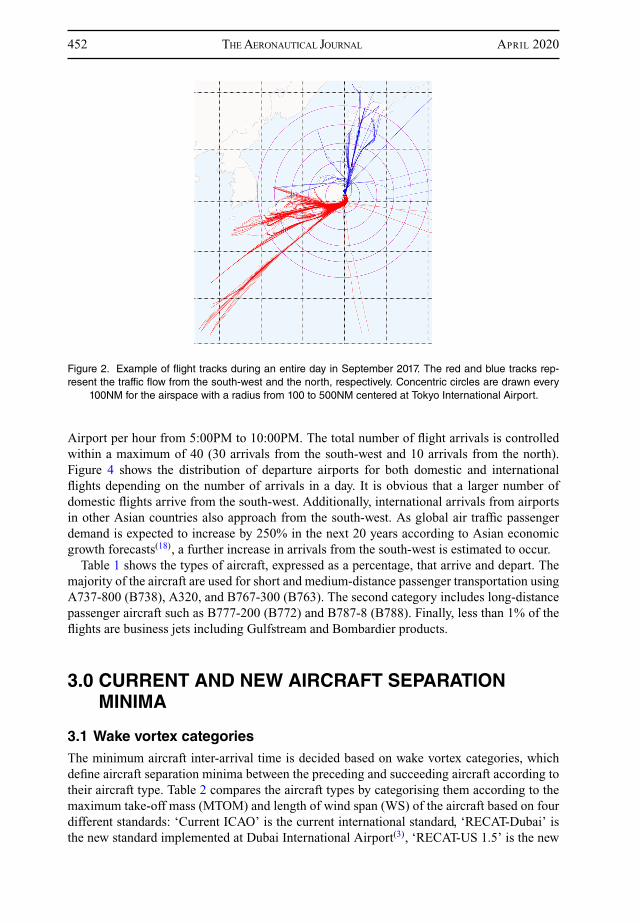
2.2 Data-driven analysis of the aircraft arrival flowsOne of the features of the arrival traffic flow at Tokyo International Airport is that thearrivals are clustered either in the northern or the southwestern part of the airport. The period8:00AM–11:00PM has a total of 569 arrivals, of which 422 flights arrive from the south-west,and 147 flights arrive from the north. Figure 2 shows the flight track data for one day of oper-ation in September 2017. The flight tracks of arrivals that use runway 22 are drawn in red,whereas arrivals at runway 23 are drawn in blue.
Air traffic flow in Japan is strategically controlled with a central focus on arrivals at TokyoInternational Airport. Figure 3 shows the number of arrival flights crossing the concentriccircles with radii ranging from 10 to 100NM every 10NM centered at Tokyo International
452 THE AERONAUTICAL JOURNAL APRIL 2020
Figure 2. Example of flight tracks during an entire day in September 2017. The red and blue tracks rep-resent the traffic flow from the south-west and the north, respectively. Concentric circles are drawn every
100NM for the airspace with a radius from 100 to 500NM centered at Tokyo International Airport.
Airport per hour from 5:00PM to 10:00PM. The total number of flight arrivals is controlledwithin a maximum of 40 (30 arrivals from the south-west and 10 arrivals from the north).Figure 4 shows the distribution of departure airports for both domestic and internationalflights depending on the number of arrivals in a day. It is obvious that a larger number ofdomestic flights arrive from the south-west. Additionally, international arrivals from airportsin other Asian countries also approach from the south-west. As global air traffic passengerdemand is expected to increase by 250% in the next 20 years according to Asian economicgrowth forecasts(18), a further increase in arrivals from the south-west is estimated to occur.
Table 1 shows the types of aircraft, expressed as a percentage, that arrive and depart. Themajority of the aircraft are used for short and medium-distance passenger transportation usingA737-800 (B738), A320, and B767-300 (B763). The second category includes long-distancepassenger aircraft such as B777-200 (B772) and B787-8 (B788). Finally, less than 1% of theflights are business jets including Gulfstream and Bombardier products.
3.0 CURRENT AND NEW AIRCRAFT SEPARATIONMINIMA
3.1 Wake vortex categoriesThe minimum aircraft inter-arrival time is decided based on wake vortex categories, whichdefine aircraft separation minima between the preceding and succeeding aircraft according totheir aircraft type. Table 2 compares the aircraft types by categorising them according to themaximum take-off mass (MTOM) and length of wind span (WS) of the aircraft based on fourdifferent standards: ‘Current ICAO’ is the current international standard, ‘RECAT-Dubai’ isthe new standard implemented at Dubai International Airport(3), ‘RECAT-US 1.5’ is the new
ITOH AND MITICI EVALUATING THE IMPACT OF NEW AIRCRAFT SEPARATION MINIMA... 453
Table
1Aircrafttypes
asaperce
ntageofthetotaln
umber
ofaircraftarriva
ls
Typ
esB
738
B76
3B
772
A32
0B
788
B77
3B
77W
B78
9A
321
B73
7A
333
E17
0A
332
B74
4B
734
Oth
ers
(%)
3418
1410
63
32
22
21
0.6
0.5
0.4
0.8
454 THE AERONAUTICAL JOURNAL APRIL 2020
Figure 3. Number of aircraft arriving per hour during the hours 5:00PM–10:00PM in 2016 and 2017.(a) Traffic flow from the north. (b) Traffic flow from the south.
US standard(2), and ‘RECAT-EU’ is the new EU standard(1). In these standards(1-3), the mini-mum distance separation is decided using combinations of preceding and succeeding aircrafttypes. Specifically, ‘RECAT-Dubai’ employs the combination of low separation minima in‘RECAT-US1.5’ and ‘RECAT-EU,’ and is proposed as the new ICAO standard. Thus, the air-craft types arriving at a destination airport (see Table 1) determine the runway throughputfollowing these separation standards.
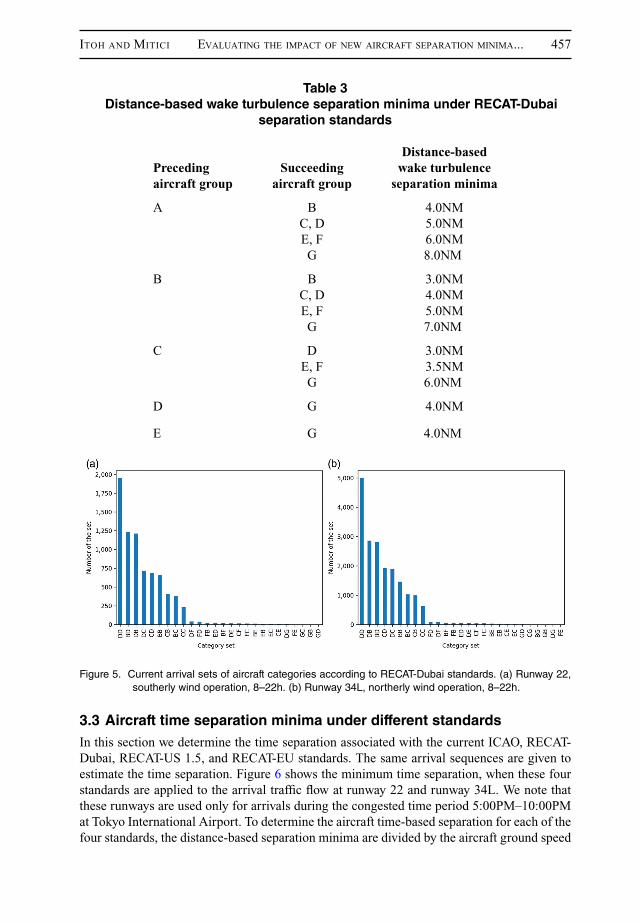
3.2 Distance separation minima under RECAT-DubaiTable 3 summarises the distance-based wake turbulence separation minima based on theRECAT-Dubai standards(3). The radar separation minimum (3NM in Japan) is applied forcategory sets not included in the table. Figure 5 shows the frequency of a specific type of
ITOH AND MITICI EVALUATING THE IMPACT OF NEW AIRCRAFT SEPARATION MINIMA... 455
Table
2Wak
evo
rtex
categories
dep
endingonmax
imum
certified
take
-offmas
s(M
TOM)an
dwingsp
an(W
S)
Cur
rent
ICA
Ost
anda
rdR
EC
AT-
Dub
aiR
EC
AT-
US
1.5
RE
CA
T-E
U
SUP
ER
(J)
AA
AA
380
136,
000k
g≤
MT
OM
136,
000k
g≤
MT
OM
100,
000k
g≤
MT
OM
74.6
8m<
WS
74.6
8m<
WS
72m
<W
S
HE
AV
Y(H
)B
BB
136,
000k
g≤
MT
OM
136,
000k
g≤
MT
OM
136,
000k
g≤
MT
OM
100,
000k
g≤
MT
OM
53.3
4m<
WS
≤74
.68m
53.3
4m<
WS
≤74
.68m
60m
<W
S≤
72m
CC
C13
6,00
0kg
≤M
TO
M13
6,00
0kg
≤M
TO
M10
0,00
0kg
≤M
TO
M38
.10m
<W
S≤
53.3
4m38
.10m
<W
S≤
53.3
4mW
S<
52.0
m
ME
DIU
M(M
)D
DD
7,00
0kg
<M
TO
M<
136,
000k
g18
,600
kg<
MT
OM
<13
6.00
0kg
MT
OM
<13
6,00
0kg
15,0
00kg
<M
TO
M<
100,
000k
g32
m<
WS
38.1
m<
53.3
4m32
m<
WS
Eor
E18
,600
kg<
MT
OM
≤13
6,00
0kg
18,6
00kg
<M
TO
M15
,000
kg<
MT
OM
≤10
0.00
0kg
27.4
3m<
WS
≤32
.0m
27.4
3m<
WS
≤38
.1m
32.0
m<
WS
FE
18,6
00kg
<M
TO
M<
136.
000k
g18
,600
kg<
MT
OM
WS
≤27
.43m
19.8
1m<
WS
≤27
.43m
LIG
HT
(L)
GF
FM
TO
M≤
7,00
0kg
MT
OM
≤18
,600
kgM
TO
M≤
18,6
00kg
MT
OM
≤15
,000
kgW
S≤
38.1
mor
MT
OM
<7,
000k
g
456 THE AERONAUTICAL JOURNAL APRIL 2020
Figure 4. Distributions of departure airports depending on the numbers of arrivals in a day. (a) Departureairports of domestic flights. (b) Departure airports of international flights.
preceding-succeeding aircraft set when the RECAT-Dubai standard is applied to current traf-fic flow arriving at Runways 22 and 34L between 8:00AM and 10:00PM. Arrival sequencingis determined by the radar data. The majority of aircraft (see Table 1) arriving at TokyoInternational Airport are of types D, B, and C with a ratio of approximately 5:3:2. Whenarrival sequencing is optimised by means of, for instance position shifting, one or two addi-tional aircraft arrivals per hour are accommodated, relative to the current first come first served(FCFS) sequencing. However, these position-shifting operations are not necessarily equitablefrom the airlines’ point of view. Furthermore, it is not clear how such optimisation opera-tions can be achieved without increasing the workload of air traffic controllers and/or withoutany automation support for the air traffic controllers. Equally important, these optimisationoperations may also propagate traffic congestion to succeeding and/or surrounding aircrafttraffic. For these reasons, the optimisation of arrival sequencing was not addressed in thestudy presented in this paper.
ITOH AND MITICI EVALUATING THE IMPACT OF NEW AIRCRAFT SEPARATION MINIMA... 457
Table 3Distance-based wake turbulence separation minima under RECAT-Dubai
separation standards
Distance-basedPreceding Succeeding wake turbulenceaircraft group aircraft group separation minima
A B 4.0NMC, D 5.0NME, F 6.0NMG 8.0NM
B B 3.0NMC, D 4.0NME, F 5.0NMG 7.0NM
C D 3.0NME, F 3.5NMG 6.0NM
D G 4.0NM
E G 4.0NM
Figure 5. Current arrival sets of aircraft categories according to RECAT-Dubai standards. (a) Runway 22,southerly wind operation, 8–22h. (b) Runway 34L, northerly wind operation, 8–22h.
3.3 Aircraft time separation minima under different standardsIn this section we determine the time separation associated with the current ICAO, RECAT-Dubai, RECAT-US 1.5, and RECAT-EU standards. The same arrival sequences are given toestimate the time separation. Figure 6 shows the minimum time separation, when these fourstandards are applied to the arrival traffic flow at runway 22 and runway 34L. We note thatthese runways are used only for arrivals during the congested time period 5:00PM–10:00PMat Tokyo International Airport. To determine the aircraft time-based separation for each of thefour standards, the distance-based separation minima are divided by the aircraft ground speed
458 THE AERONAUTICAL JOURNAL APRIL 2020
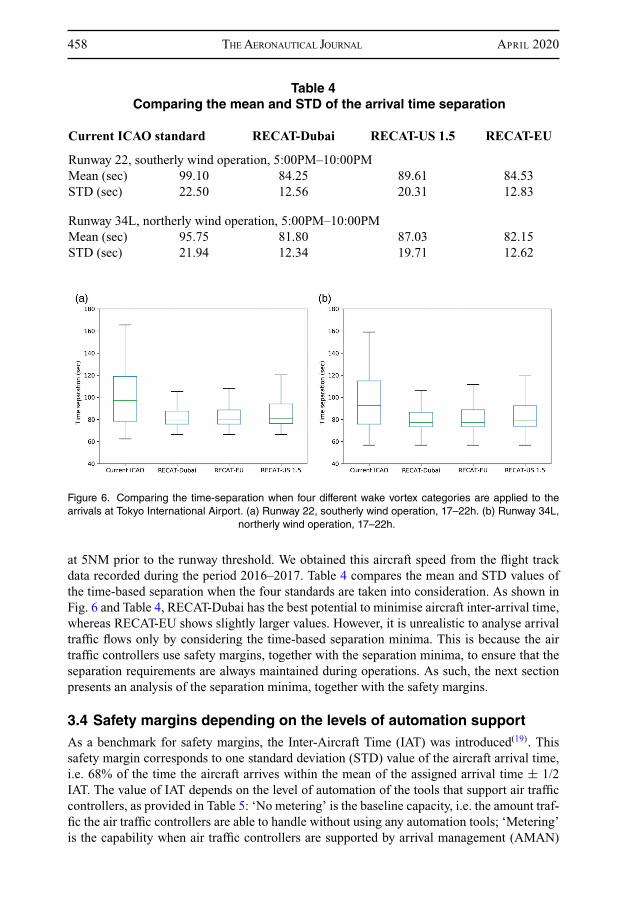
Table 4Comparing the mean and STD of the arrival time separation
Current ICAO standard RECAT-Dubai RECAT-US 1.5 RECAT-EU
Figure 6. Comparing the time-separation when four different wake vortex categories are applied to thearrivals at Tokyo International Airport. (a) Runway 22, southerly wind operation, 17–22h. (b) Runway 34L,
northerly wind operation, 17–22h.
at 5NM prior to the runway threshold. We obtained this aircraft speed from the flight trackdata recorded during the period 2016–2017. Table 4 compares the mean and STD values ofthe time-based separation when the four standards are taken into consideration. As shown inFig. 6 and Table 4, RECAT-Dubai has the best potential to minimise aircraft inter-arrival time,whereas RECAT-EU shows slightly larger values. However, it is unrealistic to analyse arrivaltraffic flows only by considering the time-based separation minima. This is because the airtraffic controllers use safety margins, together with the separation minima, to ensure that theseparation requirements are always maintained during operations. As such, the next sectionpresents an analysis of the separation minima, together with the safety margins.
3.4 Safety margins depending on the levels of automation supportAs a benchmark for safety margins, the Inter-Aircraft Time (IAT) was introduced(19). Thissafety margin corresponds to one standard deviation (STD) value of the aircraft arrival time,i.e. 68% of the time the aircraft arrives within the mean of the assigned arrival time ± 1/2IAT. The value of IAT depends on the level of automation of the tools that support air trafficcontrollers, as provided in Table 5: ‘No metering’ is the baseline capacity, i.e. the amount traf-fic the air traffic controllers are able to handle without using any automation tools; ‘Metering’is the capability when air traffic controllers are supported by arrival management (AMAN)
ITOH AND MITICI EVALUATING THE IMPACT OF NEW AIRCRAFT SEPARATION MINIMA... 459
Table 5Inter-Aircraft Time (IAT) when applying different levels of automation(19)
Capacity IAT (sec)
No metering (baseline) 18.0Metering 16.5GIM-S, TSAS 12.0IM 5.0
Figure 7. Estimation of arrival rates according to combinations of wake vortex categories and automationlevels.
systems, which automatically suggest the ideal arrival time schedules; ‘GIM-S, TSAS’ is thecapability supported by advanced levels of AMAN (refer to Ref. (7)); and ‘IM’ is its combi-nation with aircraft self-separation (refer to Ref. (8)). In general, as the level of automationsupport increases, the values of IAT decrease. Therefore, a higher level of automation supportcan accommodate an increased aircraft arrival rate.
3.5 Estimating the arrival rate at Runway 22 under various separationstandards and safety margins resulting from automation
Figure 7 shows the arrival rate (number of arrival aircraft per hour) at Runway 22 λRW22,under the four separation standards and considering the safety margins for different levels ofautomation. We determine this arrival rate as follows:
λRW22 = 3600.0
E[tmin] + tIAT, · · · (1)
where E[tmin] is the mean of the minimum time separation (sec) at Runway 22 for southerlywind operation during the period 5:00–10:00PM, corresponding to each wake vortex categoryin Table 8, and tIAT is IAT in seconds corresponding to each automation level in Table 5.
460 THE AERONAUTICAL JOURNAL APRIL 2020
Figure 7 shows that the introduction of the RECAT categories has the potential to supportan increase in the aircraft arrival rate up to 133% (40 arrivals per hour) with the highestautomation support ‘IM,’ when compared with the current arrival rate of 30 arrivals per hourfrom the south-west (see Fig. 3(b)). When considering the highest level of automation support‘IM,’ the current ICAO standard supports an increase in the arrival rate of up to 116% (35arrivals per hour). Without any automation support, the current ICAO standard supports anincrease in the arrival rate up to 103% (31 arrivals per hour). However, RECAT-Dubai andRECAT-EU lead to an increase in up to 116% (35 arrivals per hour) relative to the currentarrival rate (30 arrivals per hour). In the case of ‘metering’ automation support, RECAT-Dubai and RECAT-EU increase the arrival rate up to 120% (36 arrivals per hour), comparedto the current ICAO standards that allow the arrival rate to increase to a maximum rate of103% (31 arrivals per hour).
4.0 MODELING THE FLOW OF ARRIVAL AIR TRAFFICUNDER CURRENT OPERATIONAL STANDARDS
4.1 Modeling the flow of arrival air traffic using a G /G / c queuing modelWe propose a queuing model for traffic arriving from the south-west at Tokyo InternationalAirport between 5:00PM and 10:00PM, which represents the most congested arrival period.We specify our queuing model using the arrival flow, service time, and the number of serversas follows. The aircraft arrive in a given airspace according to an hourly rate, i.e. a specifiednumber of arrivals per hour, referring to Figs 3(b) and 7. The time between two consecutivearrivals in an airspace area is termed the aircraft inter-arrival time. Upon arrival, the aircraftreceives a service time, i.e. the time the aircraft spends flying in the given airspace. We con-sider a multi-server queuing model, in which the number of servers indicates the number ofaircraft that are allowed to be present at any time in the given airspace, i.e. the capacity ofthe given airspace. We apply this model to nine disjoint airspace areas, defined as concentriccircles centered at the airport and with radii increasing in increments of 10NM (see Fig. 8).
We formulate this aircraft arrival process by means of a G/G/c queuing model as follows.We consider the circular airspace with a radius of 100NM centered at the airport. We partitionthis area using concentric circles (see Fig. 8) centered at the airport, with radii at incrementsof 10NM. This partitioning defines nine airspace areas 1, 2, . . . , 9, where area 1 is the airspacearea centered at the airport within the circular rings with radii of 10 and 20NM, area 2 is theairspace area centered at the airport within the circular rings with radii of 20 and 30NM radii,and so on. An aircraft arriving at area 1 crosses the circle with radius of 20NM, whereas anaircraft arriving at area 2 crosses the circle with radius of 30NM, and so on.
The G/G/c queuing model allows us to estimate potential aircraft delay time under theassumption that both service time and inter-arrival time follows general distributions. Thispaper applies the G/G/c model because this model fits the data characteristics of the bothdistributions of service time and inter-arrival time. An airborne delay would occur when theaircraft is requested to fly a longer route, i.e. vectoring/metering/speed adjustments.
Let Di denote the delay an aircraft experiences in airspace area i, 1 ≤ i ≤ 9 because of thelack of capacity in area i − 1. Then we approximate the total airborne delay in airspace area ias follows(20-23):
E[DG/G/ci ] �E[DM/M/c
i ]C2
Ai+ C2
Bi
2, · · · (2)
ITOH AND MITICI EVALUATING THE IMPACT OF NEW AIRCRAFT SEPARATION MINIMA... 461
Figure 8. Illustration of the service time and inter-arrival time in the airspace divided into nine areas.
where CAi =√
σ [Ai]E[Ai]
is the coefficient of variation of the aircraft inter-arrival time in airspace
area i and CBi =√
σ [Bi]E[Bi]
is the coefficient of variation of the aircraft service time in airspacearea i. Here E[Ai] and σ [Ai] are the mean and variance of aircraft inter-arrival time, and E[Bi]and σ [Bi] are the mean and variance of aircraft service time in the airspace area i.
In Equation (2), E[DM/M/ci ] denotes the expected aircraft delay time in airspace area i
when a M/M/c queuing model is considered, which is well known(16,17,24,25). This meansthat the arrival process is considered a Poisson process with a parameter λi, with servicetimes are assumed to follow an exponential distribution with a parameter μi and there is afixed number of parallel servers ci. Identical servers is well-known and determined, followingRefs. (24) and (25).
Moreover, for stability, we have that
ρi = λi
ci · μi< 1. · · · (3)
If ρi is not less than 1, then the queue becomes unstable and the estimated delay time forincoming aircraft tends to become extraordinarily long.
4.2 Parameter estimation for the G /G / c queuing model based on flighttrack data analysis
We estimate the parameter of the G/G/c queuing model as follows. For each airspace area i ∈{1, 2, . . . , 9}, we estimate the values of ci to be the number of aircraft present at the sametime in this area, as recorded in the historical flight track data. Figure 9 shows the num-ber of aircraft present in airspace area i ∈ {1, 2, . . . , 9} every 10min during the time period5:00PM–10:00PM during the 2 years (2016–2017) of flight track data. An analysis of the his-torical flight data shows that the highest mean number of aircraft in airspace i, i ∈ {1, 2, . . . , 9}is at most two. Thus, we choose c = 2 to represent the current capacity for airspace i, i ∈{1, 2, . . . , 9}.
The value c = 2 is also relevant from the perspective of safety requirements and mini-mum aircraft separation standards because the inter-arrival aircraft distance is approximately
462 THE AERONAUTICAL JOURNAL APRIL 2020
Table 6Parameters of exmpirical distributions of the inter-arrival time and service
time in seconds and squared seconds, for the G/G/c model
Figure 9. Data-driven estimates of the number of servers, c, for the G/G/c model.
5NM (i.e. two aircraft within a 10NM range in-trail), which is exactly the minimum aircraftseparation currently required for radar separation in the en-route airspace.
The mean and variance of the inter-arrival time, E[Ai] and σ [Ai], are estimated from thedata distribution of the time-separation between the preceding and succeeding aircraft whenentering airspace area i ∈ {1, 2, . . . , 9}. The mean and variance of the service time, E[Bi] andσ [Bi], are estimated from the data distribution of the flight time in each airspace area i. Table 6lists the values of these parameters with ρi when c = 2 is given. As shown in Table 6, all valuesof ρi satisfy the stability condition in Equation (3).
5 ANALYSING THE IMPACT OF NEW AIRCRAFTSEPARATION STANDARDS ON ARRIVALOPERATIONS
5.1 Estimating the minimum required airspace capacityAs discussed in Section 4.1, Equation (3) shows the condition for queue stability. In thissection we estimate the minimum required airspace capacity while ensuring that the queueremains stable, i.e. that ρ < 1.
ITOH AND MITICI EVALUATING THE IMPACT OF NEW AIRCRAFT SEPARATION MINIMA... 463
Figure 10. Comparison of maximum arrival rate satisfying ρ < 1.
Figure 10 shows the estimation of the maximum arrival rate λi, i ∈ {1, 2, . . . , 9}, under afixed service rate E[Bi] (see Table 6) and airspace capacity ci ∈ {1, 2, 3}, such that ρ → 1.As shown in Fig. 10, increasing the airspace capacity ci allows for higher arrival rates forall airspace i ∈ {1, . . . , 9}. For c = 1, 32 arrivals per hour is not allowed because the queuestability condition for airspace i ∈ {1, 2, . . . , 5} no longer holds. When c = 2, the maximumarrival rate allowed in airspace i = 1 is 32 arrivals, while 40 arrivals are not allowed in airspacei = 3. If c = 3, then for all airspace i ∈ {1, 2, . . . , 9} it is possible to have 40 arrivals per hour.Thus, for airspace i = 1, we need to ensure a capacity of at least c1 = 2 to be able to handle32 arrivals per hour, while c1 = 3 is required to be able to handle 40 arrivals per hour.
Table 7 summarises the minimum ci values to stabilise the G/G/c queuing model forairspace i, i ∈ {1, 2, . . . , 9}. Table 7 shows that the airspace closer to the airport requires morecapacity (larges values for ci), especially in the airspace i ∈ {1, 3}. This is because close tothe destination airport, i.e. airspace i = 1, the aircraft slow down. Thus, the mean service rateis reduced. In the airspace i = 3 and 4, especially i = 3, the inter-aircraft arrival time is con-trolled by using vectoring operations. As a result, in this airspace the aircraft change theirheading direction and adjust the spacing between succeeding aircraft. Therefore, the servicerate μi is reduced in the airspace i = 1, 3, 4. In i = 2, the aircraft inter-arrival time is alreadycontrolled, and most arriving aircraft follow in-trail because the airspeed is faster than in thei = 1 airspace.
5.2 Impact on aircraft arrival delay when increasing airspace capacityIn this section we estimate the arrival delay time in airspace i ∈ {1, 2, 3, 4}, where the max-imum arrival rate is limited in comparison with the airspace i, i ∈ {5, . . . , 9} (see Fig. 10).As shown in Fig. 11, we consider five combinations of arrival rates and airspace capacities,which satisfy the minimum ci in Table 7, to estimate the arrival time delay. First, for thecurrent arrival rate of 30 arrivals per hour, the capacity c = 2 results in an increased arrivaltime delay in comparison with the cases when c = 3. Thus, increasing the airspace capacity toci = 3, i ∈ {1, 2, 3, 4}, is an efficient solution for mitigating arrival delay. However, even when
464 THE AERONAUTICAL JOURNAL APRIL 2020
Table 7Minimum ci values that enable the arrival rates of 32, 36, and 40 arrivals per
hour, respectively, to be handled in airspace i, i ∈ {1, 2, . . . , 9}
Figure 11. Comparison of arrival delay time in airspace i ∈ {1, 2, 3, 4}.
considering ci = 3, for high arrival rates of 40 aircraft per hour, the arrival delay time remainshigh, especially in the case of airspace i = 1.
5.3 Aircraft arrival delay for various values of the variance of the servicetime and the variance of the inter-arrival time
Generally, reducing the variance of the service time and inter-arrival time are options to miti-gate the delay in the arrival time in each airspace i ∈ {1, 2, . . . , 9}. In this section we determinethe arrival delay for various values of the variance of the service time and the inter-arrival
ITOH AND MITICI EVALUATING THE IMPACT OF NEW AIRCRAFT SEPARATION MINIMA... 465
Figure 12. Aircraft arrival delay for various values of the variance of the inter-arrival time and servicetime – airspace i=1. (a) c1 = 2, 32 arrivals per hour. (b) c1 = 3, 32 arrivals per hour. (c) c1 = 3, 36 arrivals
per hour.
Figure 13. Arrival delay under various values for the variance of the inter-arrival time and service time –ci =2, 32 arrivals per hour, at airspace i ∈ {2, 3, 4, 5}. (a) i=2. (b) i=3. (c) i=4. (d) i=5.
time, respectively. We consider different aircraft arrival rates and airspace capacities ci suchthat the requirements in Table 7 are satisfied.
Figure 12 shows the arrival delay for various values of the airspace capacity c1 and aircraftarrival rates. Figure 12(a) indicates that, when c1 = 2, the arrival delay dramatically increaseseven though the variance decreases. Thus, c1 = 3 is necessary at airspace i = 1 to enable 32arrivals per hour to be handled (see Fig. 12(b)). Increasing the variance of the service timeis critical for the arrival delay, especially when considering higher arrival rates, e.g. 32 or36 arrivals per hour. In general, the variance of the service time at airspace i = 1 is largerthan that in the other airspace i, i ∈ {2, 3, . . . , 9} (see also Table 6) because in this area thearriving aircraft slow down before landing, and they are also affected by the wind velocityand wind direction associated with the used runway configuration. Because of this, in airspacei = 1, significant traffic control is necessary to ensure that the arrival delay is limited to theminimum.
Figures 13-15 show the arrival delay by varying the variance of the service time and inter-arrival time, respectively, at airspace i ∈ {2, 3, 4, 5}. We consider the case when ci ∈ {2, 3} andan arrival rate of 32 and 36 aircraft arriving per hour. The lowest service rate (the service timewith the highest mean) is in airspace i = 3 among the airspace i ∈ {2, 3, 4, 5} (see Table 6),and the second lowest service rate is in airspace i = 4 (see Table 6). This can be explained bythe fact that currently, in these two areas, the air traffic controllers space the arriving aircraft.Thus, in the airspace i = 3, 4, when ci = 2, the arrival delay time increases even for smallvalues of the service and inter-arrival variance, as shown in Figs 13 and 14. Increasing theairspace capacity ci = 3 is the most realistic solution to mitigate the arrival delay time, ratherthan minimising the variance of the service time and the inter-arrival time (see Fig. 15).
466 THE AERONAUTICAL JOURNAL APRIL 2020
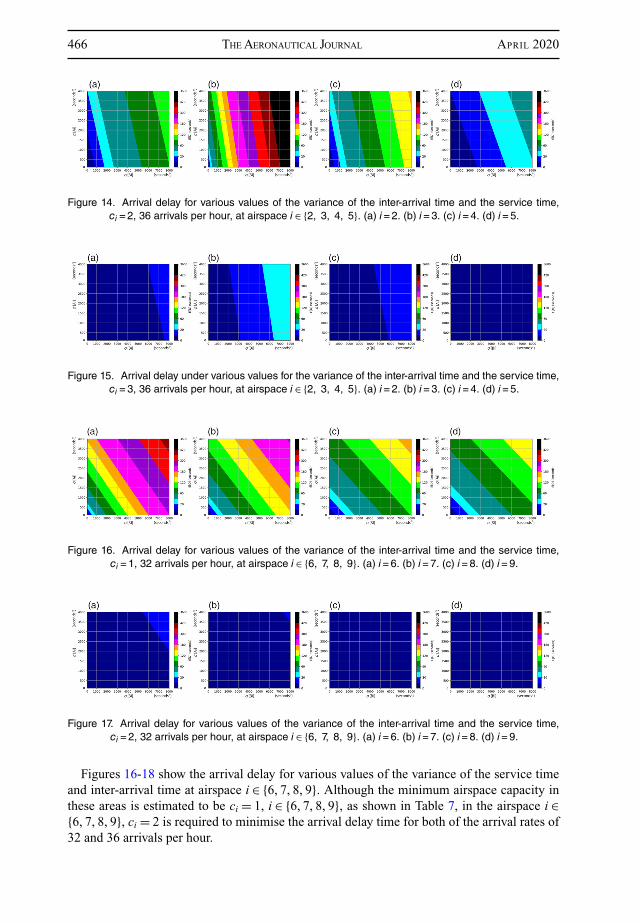
Figure 14. Arrival delay for various values of the variance of the inter-arrival time and the service time,ci =2, 36 arrivals per hour, at airspace i ∈ {2, 3, 4, 5}. (a) i=2. (b) i=3. (c) i=4. (d) i=5.
Figure 15. Arrival delay under various values for the variance of the inter-arrival time and the service time,ci =3, 36 arrivals per hour, at airspace i ∈ {2, 3, 4, 5}. (a) i=2. (b) i=3. (c) i=4. (d) i=5.
Figure 16. Arrival delay for various values of the variance of the inter-arrival time and the service time,ci =1, 32 arrivals per hour, at airspace i ∈ {6, 7, 8, 9}. (a) i=6. (b) i=7. (c) i=8. (d) i=9.
Figure 17. Arrival delay for various values of the variance of the inter-arrival time and the service time,ci =2, 32 arrivals per hour, at airspace i ∈ {6, 7, 8, 9}. (a) i=6. (b) i=7. (c) i=8. (d) i=9.
Figures 16-18 show the arrival delay for various values of the variance of the service timeand inter-arrival time at airspace i ∈ {6, 7, 8, 9}. Although the minimum airspace capacity inthese areas is estimated to be ci = 1, i ∈ {6, 7, 8, 9}, as shown in Table 7, in the airspace i ∈{6, 7, 8, 9}, ci = 2 is required to minimise the arrival delay time for both of the arrival rates of32 and 36 arrivals per hour.
ITOH AND MITICI EVALUATING THE IMPACT OF NEW AIRCRAFT SEPARATION MINIMA... 467
Figure 18. Arrival delay under various values of the variance of the inter-arrival time and the service time,ci =2, 36 arrivals per hour, at airspace i ∈ {6, 7, 8, 9}. (a) i=6. (b) i=7. (c) i=8. (d) i=9.
Figure 19. Estimation of service time E[B].
These results clarify that increasing the airspace capacity is a higher-priority strategy thanthe effort of minimising the variance of the service time, except for the case of airspace i = 5.Figure 14(d) shows that, for the current inter-arrival time with a variance of 3,488 sec2 (seeTable 6) the arrival delay time is large. This shows that for airspace i = 5, to limit the arrivaldelay we have two possible strategies when considering an arrival rate of 36 arrivals per hour:(1) increase the airspace capacity c5 = 3 (see Fig. 15(d)) or, (2) maintain c5 = 2 and limit theinter-arrival time variance (see Fig. 14(d)).
5.4 Service time envelopes estimating the arrival delayOptimising the service time in each airspace i is the other potential solution for mitigating thearrival delay time while increasing the arrival rate. Figure 19 shows the estimated envelope ofthe maximum service time satisfying the condition ρ < 0.85. Figure 19 shows that an increasein the arrival rate reduces the service time at the same capacity c. At a larger capacity c, theservice time is increased.
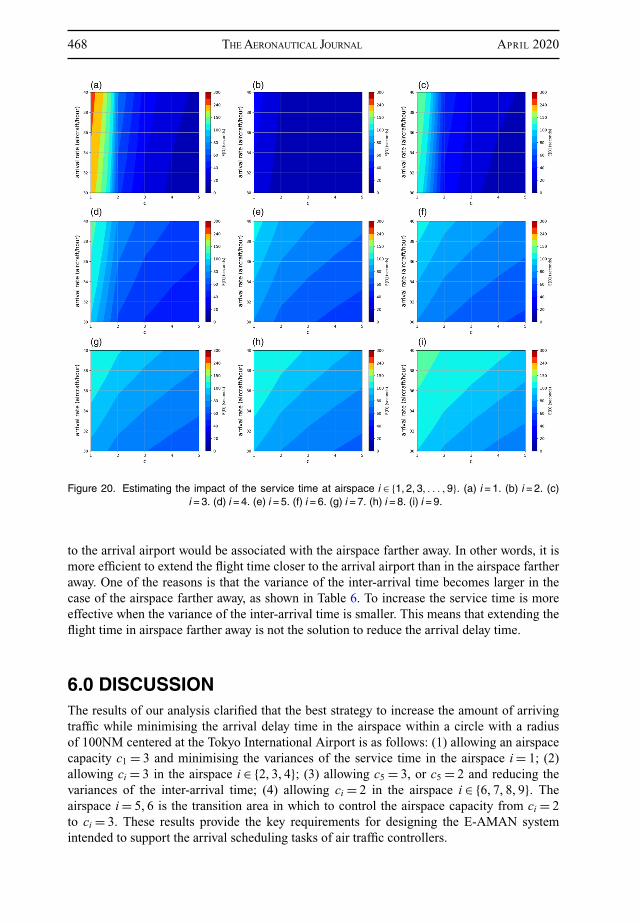
The estimated service time shown in Fig. 19 is given to airspace i ∈ {1, 2, . . . , 9} for esti-mating the arrival time delay corresponding to airspace capacity ci and the arrival rate asshown in Fig. 20. One of the features clarifies that the arrival time delay increases while iincreases if the same amount of service time is allowed. This means that the delay in thearrival time increases if the same amount of flight time associated with the airspace closer
468 THE AERONAUTICAL JOURNAL APRIL 2020
Figure 20. Estimating the impact of the service time at airspace i ∈ {1, 2, 3, . . . , 9}. (a) i=1. (b) i=2. (c)i=3. (d) i=4. (e) i=5. (f) i=6. (g) i=7. (h) i=8. (i) i=9.
to the arrival airport would be associated with the airspace farther away. In other words, it ismore efficient to extend the flight time closer to the arrival airport than in the airspace fartheraway. One of the reasons is that the variance of the inter-arrival time becomes larger in thecase of the airspace farther away, as shown in Table 6. To increase the service time is moreeffective when the variance of the inter-arrival time is smaller. This means that extending theflight time in airspace farther away is not the solution to reduce the arrival delay time.
6.0 DISCUSSIONThe results of our analysis clarified that the best strategy to increase the amount of arrivingtraffic while minimising the arrival delay time in the airspace within a circle with a radiusof 100NM centered at the Tokyo International Airport is as follows: (1) allowing an airspacecapacity c1 = 3 and minimising the variances of the service time in the airspace i = 1; (2)allowing ci = 3 in the airspace i ∈ {2, 3, 4}; (3) allowing c5 = 3, or c5 = 2 and reducing thevariances of the inter-arrival time; (4) allowing ci = 2 in the airspace i ∈ {6, 7, 8, 9}. Theairspace i = 5, 6 is the transition area in which to control the airspace capacity from ci = 2to ci = 3. These results provide the key requirements for designing the E-AMAN systemintended to support the arrival scheduling tasks of air traffic controllers.
ITOH AND MITICI EVALUATING THE IMPACT OF NEW AIRCRAFT SEPARATION MINIMA... 469
Figure 21. Comparison of the distance separation with the safety margin for the metering condition ofdifferent standards.
Satisfying 2 < ci ≤ 3 means that in-trail arrival aircraft achieve an approximate distance-separation of between 3.3 and 5NM. Considering the queue of preceding arrival aircraft, thepreferred distance-separation should be closer to 3.3NM. Figure 21 and Table 8 comparethe mean and STD of the distance-separation each of the wake vortex categories achieves atRunway 22 with the safety margin of the metering operation (see Table 5). A comparison ofthe mean values of the distance-separation indicates that all four standards satisfy 2 < ci ≤3. However, 36 arrivals per hour would be achievable only by applying RECAT-Dubai andRECAT-EU at Runway 22 (see Fig. 7).
In the current operation, radar separation minima is 3NM in the terminal area, and 5NM inthe en-route sectors. Currently, the boundary between the terminal and en-route area for thesouth-west traffic is located at around 60–80NM away from the Tokyo International Airport.Therefore, the recommendations above satisfy the current operational constraints.
Shifting the arrival delay time to airspace farther away from the arrival airport is not anoption to mitigate the arrival delay time because the variances of the inter-arrival time increaseas the distance from the arrival airport becomes longer. Extending the mean of the servicetime (flight time) only has a powerful effect when the aircraft inter-arrival time is controlled tominimise the variance. Thus, arrival strategies to extend the aircraft flight time, i.e. vectoringand point-merge, are effective in the airspace close to the airport where the variance of theinter-arrival time is controlled.
7.0 CONCLUSIONThis study has analysed arrival strategies to minimise the delay in aircraft arrival while allow-ing future growth in the amount of arrival traffic. A data-driven queuing model was proposedto analyse the impacts of applying new wake vortex minima, which reduces the aircraft inter-arrival time, on the traffic flow of aircraft arriving within a circle with a radius of 100NMcentered at the arrival airport. Two years of data consisting of radar tracks and flight plans ofair traffic arriving at Tokyo International Airport were analysed as a case study. The volumeof future arrival traffic was estimated by using both the new time-separation standards and
470 THE AERONAUTICAL JOURNAL APRIL 2020
the level of automation support. Based on the data-driven analysis and the estimation of thefuture traffic volume, a queue-based model was proposed to analyse the impact on the delayin arrival time of potential future arrival strategies. Based on the analysis, the best arrivalstrategy was suggested based on the distance from the arrival airport.
Based on the proposed requirements for future arrival scheduling, the next step would bethe engineering design of the E-AMAN system. Human-in-the-loop simulation, which evalu-ates the operational feasibility of air traffic controllers and pilot operation, will be conductedto clarify the effectiveness of the proposed design requirements in the real operation.
In this study, the volume of traffic arriving in future has been estimated by only consideringaircraft separation standards and the performance of automation support for arrival manage-ment. However, this estimation would be more precise if we were to consider constraints onthe departure and airport management, i.e. runway occupancy time. In future, we plan toextend the proposed approach not only to arrival traffic, but also departure traffic and theairport surface movements.
ACKNOWLEDGEMENTSThis research was conducted under CARATS initiatives supported by the Japan Civil AviationBureau (JCAB), Ministry of Land, Infrastructure, Transport and Tourism (MLIT) as the‘Studies on the Extended Arrival Management.’ This research was also supported by theMinistry of Education, Culture, Sports, Science and Technology (MEXT) as the ‘Post-K Computer Exploratory Challenge’ (Exploratory Challenge 2: Construction of Modelsfor Interaction Among Multiple Socioeconomic Phenomena, Model Development and itsApplications for Enabling Robust and Optimized Social Transportation Systems, Project ID:hp180188). The authors are grateful to JCAB for providing air traffic data, and Ms. MayumiOhnuki for assisting data preparation and figure corrections. The authors would like to thankEnago (www.enago.jp) for the English language review.
REFERENCES1. ROOSELEER, F. and TREVE, V. RECAT-EU European wake turbulence categorisation and separation
minima on approach and departure. Eurocontrol, 2015. https://www.eurocontrol.int/publication/european-wake-turbulence-categorisation-and-separation-minima-approach-and-departure
2. Federal Aviation Administration (FAA). Wake turbulence recategorization, Air TrafficOrganization Policy, Order: JO 7110.659B, 2015.
3. General Civil Aviation Authority. OMDB – Dubai/international – implementation of Dubai re-categorisation (RECAT) wake turbulence separation scheme within Dubai CTA, AIP Supplement– United Arab Emirates, 2019.
4. Passenger traffic 2016 final (annual), Airports Council International (ACI), 1st January, 2018.5. ERZBERGER, H. and ITOH, E. Design principles and algorithms for air traffic arrival scheduling,
NASA/TP-2014-218302, 2014.6. Federal Aviation Administration. Nextgen portfolio – time based flow management, 2017.7. THIPPHAVONG, J., JUNG, J., SWENSON, H., MARTIN, L., LIN, M. and NGUYEN, J. Evaluation of the termi-
nal sequencing and spacing system for performance-based navigation arrivals, 2013 IEEE/AIAA32nd Digital Avionics Systems Conference (DASC), 2013.
8. VAN TULD, P. Flight deck interval management flight test final report, NASA/CR-2017-219626,June 2017, 2017.
9. EUROPEAN COMMISSION. Cross border SESAR trials for enhanced arrival management: periodicreporting for period 1 – PJ25 XSTREAM, 2017.
ITOH AND MITICI EVALUATING THE IMPACT OF NEW AIRCRAFT SEPARATION MINIMA... 471
10. International Civil Aviation Organization. Long range ATFM concept trials, The 8th Meeting ofthe ICAO Asia/Pacific Air Traffic Flow Management Steering Group (ATFMSG/8), May 2018,2018.
11. ITOH, E., BROWN, M., SENOGUCHI, A., WICKRAMASINGHE, N. and FUKUSHIMA, S. Future arrival man-agement collaborating with trajectory-based operations. In Air Traffic Management and SystemsII , pp 137–156, Springer, Japan, 2017.
12. BÄUERLE, N., ENGELHARDT-FUNK, O. and KOLONKO, M. On the waiting time of arriving aircrafts andthe capacity of airports with one or two runways, Eur J Oper Res, 2007, 177, (2), pp 1180–1196.
13. LONG, D., JOHNSON, J., GAIER, E.M. and KOSTIUK, P.F. Modeling air traffic management technologieswith a queuing network model of the national airspace system, NASA Langley Technical ReportServer, 1999.
14. RUE, R.C. and ROSENSHINE, M. The application of semi-Markov decision processes to queuing ofaircraft for landing at an airport, Transp Sci, 1985, 19, (2), pp 154–172.
15. BOLENDER, M.A. and SLATER, G.L. Evaluation of scheduling methods for multiple runways, J Aircr,2000, 37, (3), pp 410–416.
16. ITOH, E. and MITICI, M. Queue-based modeling of the aircraft arrival process at a single airport,Aerospace, 2019, 6, (10), 103. https://doi.org/10.3390/aerospace6100103.
17. ITOH, E. and MITICI, M. Analyzing tactical control strategies for aircraft arrivals at an airport usingqueue-based modeling, Under Review, 2019.
18. International Civil Aviation Organization. Long-term traffic forecasts passenger and cargo, totalpassenger traffic: history and forecasts, p 10, 2016.
19. ARBUCKLE, D. Interval management application, ICAO Aircraft Surveillance ApplicationsWorkshop, March 2017.
20. WHITT, W. The queuing network analyzer, Bell Syst Tech J , 1983, 62, (9), pp 2779–2815.21. WHITT, W. Approximations for the GI/G/m queue, Prod Oper Manage, 1993, 2, (2), pp 114–161.22. KIMURA, T. A two-moment approximation for the mean waiting time in the GI/G/s queue, Manage
Sci, 1986, 32, (6), pp 751–763.23. KINGMAN, J.F.C. The single server queue in heavy traffic, In Mathematical Proceedings of the
Cambridge Philosophical Society, vol 57, pp 902–904, Cambridge University Press, UK, 1961.24. HILLIER, F. Introduction to Operations Research, Tata McGraw-Hill Education, US, 2012.25. ADAN, I. and RESING, J. Queuing systems, Eindhoven University, 2015.