Department of Science and Technology Institutionen för teknik och naturvetenskap Linköpings Universitet Linköpings Universitet SE-601 74 Norrköping, Sweden 601 74 Norrköping Examensarbete LITH-ITN-KTS-EX--06/002--SE Distribution models for Chicago Pneumatic Division (CPD) Sophie Mörch 2006-01-27
Transcript
Department of Science and Technology Institutionen för teknik och naturvetenskap Linköpings Universitet Linköpings Universitet SE-601 74 Norrköping, Sweden 601 74 Norrköping
ExamensarbeteLITH-ITN-KTS-EX--06/002--SE
Distribution models forChicago Pneumatic Division
(CPD)Sophie Mörch
2006-01-27
LITH-ITN-KTS-EX--06/002--SE
Distribution models forChicago Pneumatic Division
(CPD)Examensarbete utfört i kommunikation- och transportsystem
vid Linköpings Tekniska Högskola, CampusNorrköping
Sophie Mörch
Handledare Thomas DahlgrenExaminator Martin Rudberg
Norrköping 2006-01-27
RapporttypReport category
Examensarbete B-uppsats C-uppsats D-uppsats
_ ________________
SpråkLanguage
Svenska/Swedish Engelska/English
_ ________________
TitelTitle
FörfattareAuthor
SammanfattningAbstract
ISBN_____________________________________________________ISRN_________________________________________________________________Serietitel och serienummer ISSNTitle of series, numbering ___________________________________
NyckelordKeyword
DatumDate
URL för elektronisk version
Avdelning, InstitutionDivision, Department
Institutionen för teknik och naturvetenskap
Department of Science and Technology
2006-01-27
x
x
LITH-ITN-KTS-EX--06/002--SE
Distribution models for Chicago Pneumatic Division (CPD)
Sophie Mörch
Chicago Pneumatic Division is a division in the Atlas Copco Group consisting of five acquisitions nowoperating together. Due to the number of recent acquisitions by Chicago Pneumatic Division, thenumber of distribution centres has increased, making its structure more complex. The main questionstudied are how many distribution centres the division should operate and how the product companiesbest will supply the distribution centres. Four distribution models are created, with consideration togoods flow as well as financial and environmental aspects, both in present and future situation. Thethesis also includes bench-marking with Atlas Copco Tools and Assembly Systems, Electrolux and Dell.The analysis showed that the division should operate three distribution centres, carrying inventory ofproducts from all production companies. This model is also sustainable environmentally and brings thebenefit of one consolidated shipment to the customers.
distribution models, Atlas Copco,Supply Chain Management, Logistics, Total Cost Analysis
Upphovsrätt
Detta dokument hålls tillgängligt på Internet – eller dess framtida ersättare –under en längre tid från publiceringsdatum under förutsättning att inga extra-ordinära omständigheter uppstår.
Tillgång till dokumentet innebär tillstånd för var och en att läsa, ladda ner,skriva ut enstaka kopior för enskilt bruk och att använda det oförändrat förickekommersiell forskning och för undervisning. Överföring av upphovsrättenvid en senare tidpunkt kan inte upphäva detta tillstånd. All annan användning avdokumentet kräver upphovsmannens medgivande. För att garantera äktheten,säkerheten och tillgängligheten finns det lösningar av teknisk och administrativart.
Upphovsmannens ideella rätt innefattar rätt att bli nämnd som upphovsman iden omfattning som god sed kräver vid användning av dokumentet på ovanbeskrivna sätt samt skydd mot att dokumentet ändras eller presenteras i sådanform eller i sådant sammanhang som är kränkande för upphovsmannens litteräraeller konstnärliga anseende eller egenart.
För ytterligare information om Linköping University Electronic Press seförlagets hemsida http://www.ep.liu.se/
Copyright
The publishers will keep this document online on the Internet - or its possiblereplacement - for a considerable time from the date of publication barringexceptional circumstances.
The online availability of the document implies a permanent permission foranyone to read, to download, to print out single copies for your own use and touse it unchanged for any non-commercial research and educational purpose.Subsequent transfers of copyright cannot revoke this permission. All other usesof the document are conditional on the consent of the copyright owner. Thepublisher has taken technical and administrative measures to assure authenticity,security and accessibility.
According to intellectual property law the author has the right to bementioned when his/her work is accessed as described above and to be protectedagainst infringement.
For additional information about the Linköping University Electronic Pressand its procedures for publication and for assurance of document integrity,please refer to its WWW home page: http://www.ep.liu.se/
Distribution Models for Chicago Pneumatic Division (CPD)
Master’s thesis written at Department of Science and Technology (ITN), Linkoping University
by Sophie Morch
Supervisors Thomas Dahlgren (CPD) and Martin Rudberg (ITN)
Norrkoping January 27 2006
Summary Chicago Pneumatic Division is a division in the Atlas Copco Group consisting of five acquisitions now operating together. Due to the number of recent acquisitions by Chicago Pneumatic Division, the number of distribution centres has increased, making its structure more complex. The main question studied were how many distribution centres the division should operate and how the production companies best will supply the distribution centres, today as well as in the future circumstances. The three distribution centres analysed were Power Tools Distribution in Belgium, Rock Hill in USA and Qianshao in China. At the outset, the objectives of this thesis were:
o Map the current Chicago Pneumatic Division distribution network including a total cost analysis of the structure
o Bench-mark the current Chicago Pneumatic Division structure with successful distribution/logistic companies
o Develop two separate distribution models, with consideration to goods flow as well as financial and environmental aspects both in present and future situation.
A complimentary objective is to safeguard the support of SAP of the suggested models. The mapping of the present distribution network showed a complex system, where different strategies were applied by the distribution centres. All logistic costs in the distribution centres were put together in a total cost analysis, in order to compare the costs between the distribution centres but also between the present and the new distribution models Bench-marking studies showed prerequisites for different distribution strategies, which are not fully in place in Chicago Pneumatic Division today and limit the possibilities to have a different distribution structure. Four models were created to examine all possible range of distribution, from centralised structure to a decentralised. The inbound transport to a distribution centre is by surface in all models, while the outbound transport to customers in other continents is by air; since it is the only transportation mode fast enough to meet the required customer lead time. Model 1: Centralising all distribution activities to Power Tools Distribution. All production companies and suppliers of finished goods ship to Power Tools Distribution and the products are distributed from there to customers worldwide. Model 2: Two distribution centres, Qianshao and Power Tools Distribution. Qianshao and Power Tools Distribution are still managing their own products, but all products manufactured by the Rock Hill suppliers in Asia (85% of total weight from Rock Hill) are managed by Qianshao distribution centre. Products manufactured by Rock Hill itself (15% of total weight) are shipped and distributed from Power Tools Distribution. Model 3a: Three distribution centres with inventory of products from all production companies. The customers will only receive one consolidated shipment per order from its local distribution centre. Model 3b: Three distribution centres, where each product is available in only one site. This means that each centre distributes to customers world wide and that customers do not receive one consolidated shipment per order.
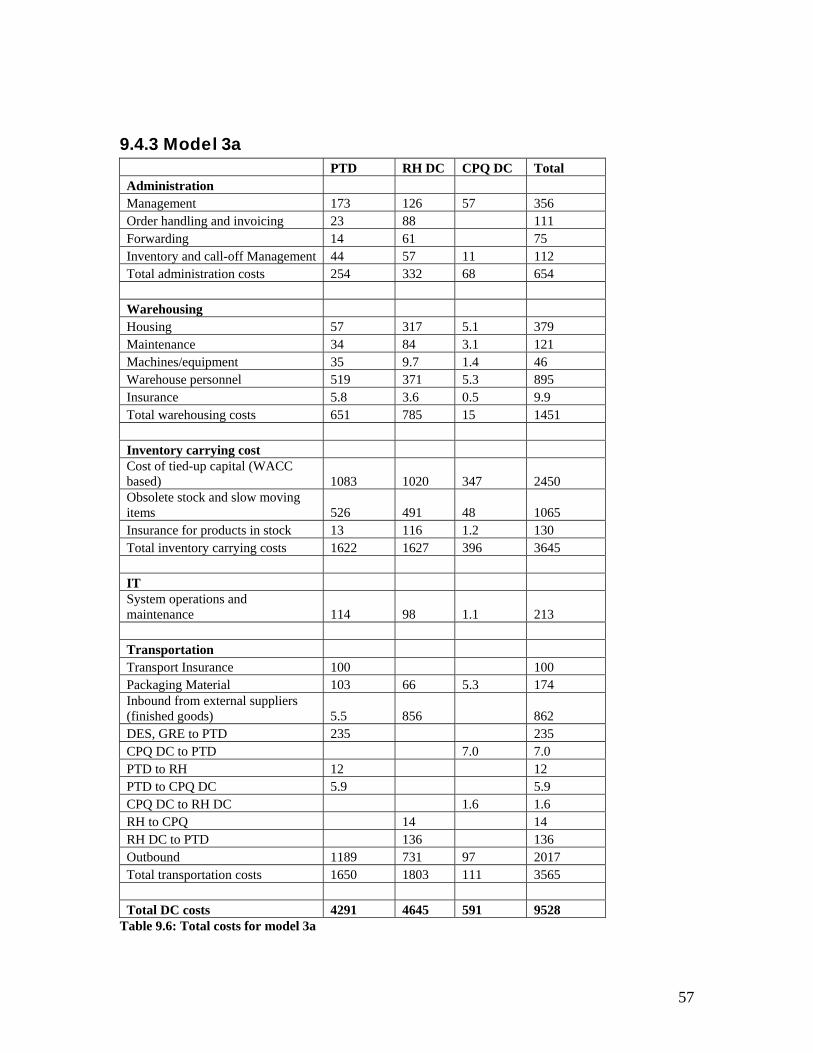
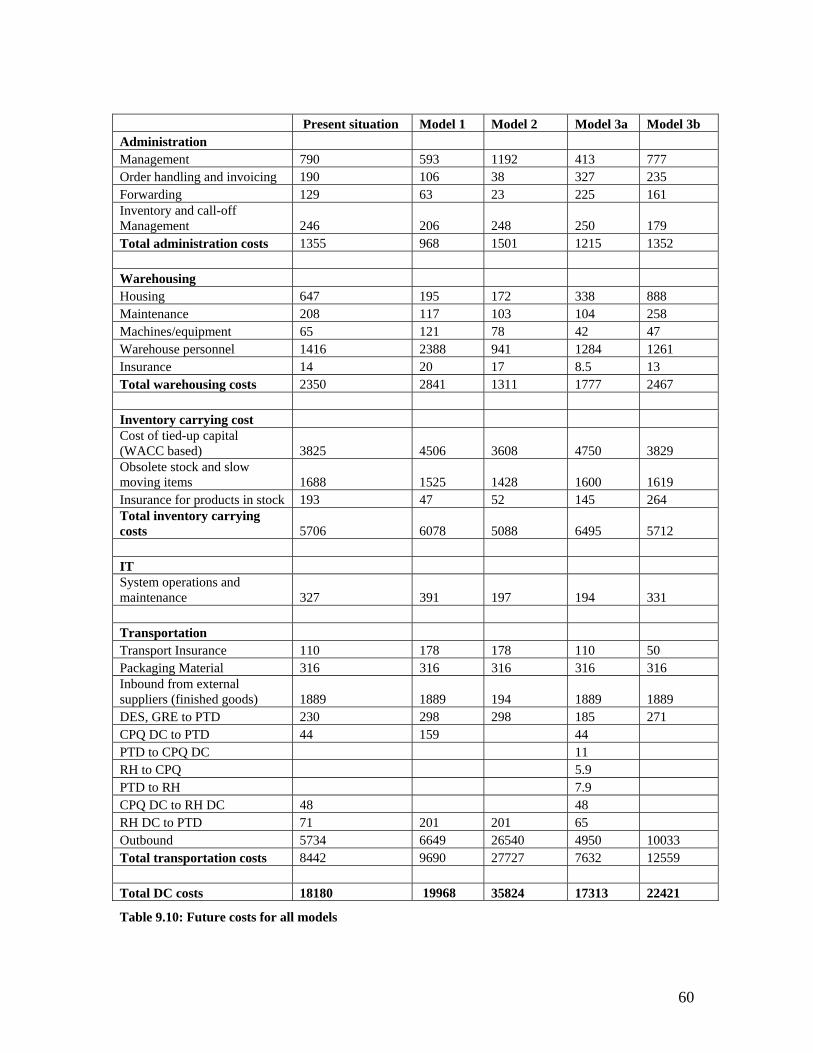
A total cost analysis where done for all models. The most important factors that are dependent on the network structure are the freight costs, operating costs and inventory levels in the distribution centres. The freight costs are dependent on the weight, destinations and transportation mode, while the operating costs are based on the capacity in the different distribution centres. The two major impacts on the inventory level is the reduction in the safety stock when centralising and the longer lead time for sea freight that must be compensated by an increase in inventory in order to maintain the required service level. A part of the project was to evaluate the models for future estimated demands in different markets. The major change in the future is that products from the production companies are sold in more markets than before. A total cost analysis for the future scenario of all four models was done. After compiling the current and future data in the four models, it is evident that model 2 does not bring any cost savings due to the large volume of goods that must be air freighted from Qianshao to America. Model 3b does not result in any cost savings with the present volumes, but turns out even more expensive when calculating with the future volumes, since more products are sold and air freighted to different continents. To centralise the distribution, as in model 1, has been a trend lately, but in order to gain the possible advantages of this structure it demands another kind of production location, which does not exist in Chicago Pneumatic Division today. If the production structure is changed by new acquisitions or consolidation, model 1 can be interesting to analyse again. Model 3a is the only model that provides cost savings today and in the future. It also brings the benefits of a consolidated shipment to all customers. This model is also sustainable environmentally, since it results in less transportation and use of air freight. This model will be recommended for the company to analyse further, since it brings financial, environmentally and customer advantages.
2 ABOUT ATLAS COPCO AND CHICAGO PNEUMATIC DIVISION .............................................. 3 2.1 ATLAS COPCO....................................................................................................................................... 3 2.2 CHICAGO PNEUMATIC DIVISION ........................................................................................................... 3 2.3 ORGANISATION..................................................................................................................................... 8
3 METHODOLOGY.................................................................................................................................... 9 3.1 RESEARCH PROCEDURE AND DATA COLLECTION ................................................................................. 9
4.5.1 Push/Pull-based Supply Chains ................................................................................................. 18 4.5.2 Make to order versus make to stock........................................................................................... 18 4.5.3 Leagile ....................................................................................................................................... 18 4.5.4 Nuanced lead time...................................................................................................................... 19 4.5.5 Centralised versus decentralised distribution system ................................................................ 19
4.6 DISTRIBUTION TECHNIQUES ............................................................................................................... 21 4.6.1 Direct shipment.......................................................................................................................... 21 4.6.2 Warehousing .............................................................................................................................. 21 4.6.3 Cross-Docking ........................................................................................................................... 22
5.1.1 Desoutter.................................................................................................................................... 23 5.1.2 Tech-Motive and Georges Renault............................................................................................. 23 5.1.3 Chicago Pneumatic .................................................................................................................... 23 5.1.4 Qianshao.................................................................................................................................... 24 5.1.5 Purchased finished goods to PCs............................................................................................... 24
5.2 DISTRIBUTION CENTRES ..................................................................................................................... 24 5.2.1 Transfer Price ............................................................................................................................ 25 5.2.2 Point-of-Sales data and Production Planning ........................................................................... 25
5.3 DISTRIBUTION TO END-USER............................................................................................................... 25 5.4 GLOBAL DISTRIBUTION NETWORK ...................................................................................................... 27
5.4.1 Georges Renault and Desoutter Production Companies ........................................................... 28 5.4.2 Tech-Motive Distribution Centre ............................................................................................... 28 5.4.3 Chicago Pneumatic Distribution Centre.................................................................................... 28 5.4.4 Qianshao Distribution Centre.................................................................................................... 29 5.4.5 Power Tools Distribution........................................................................................................... 29
5.5 TOTAL COST ANALYSIS ....................................................................................................................... 30
1
5.5.1 Delimitations for cost analysis................................................................................................... 30 5.5.2 Costs in the distribution centres................................................................................................. 31 5.5.3 Explanation to costs ................................................................................................................... 33 5.5.4 Efficiencies in the distribution centres ....................................................................................... 33
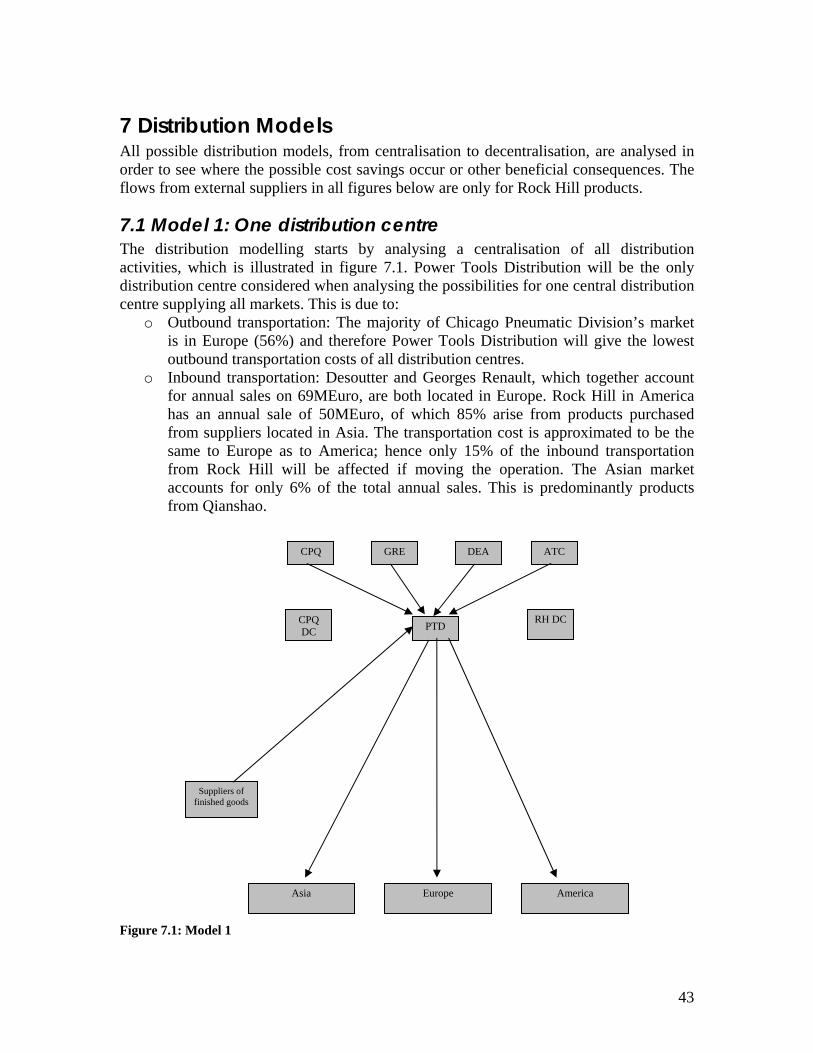
7 DISTRIBUTION MODELS ................................................................................................................... 43 7.1 MODEL 1: ONE DISTRIBUTION CENTRE ............................................................................................... 43 7.2 MODEL 2: TWO DISTRIBUTION CENTRES ............................................................................................. 44 7.3 MODEL 3: THREE DISTRIBUTION CENTRES .......................................................................................... 45
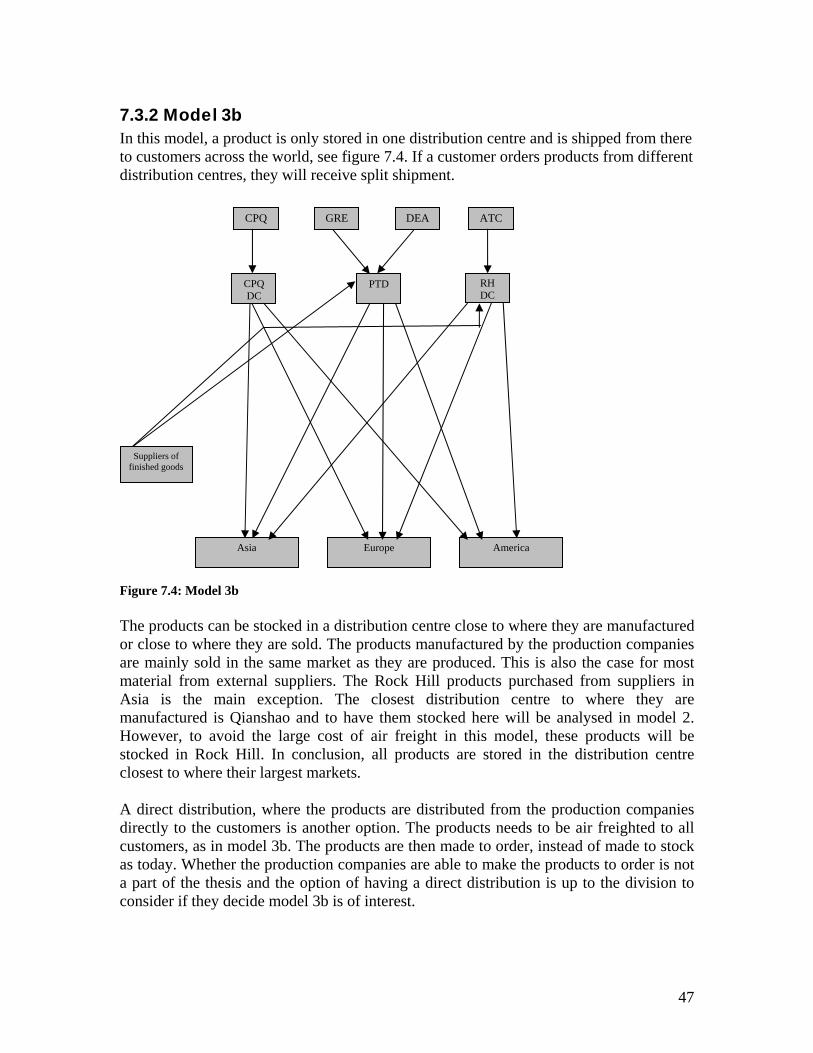
7.3.1 Model 3a .................................................................................................................................... 46 7.3.2 Model 3b .................................................................................................................................... 47
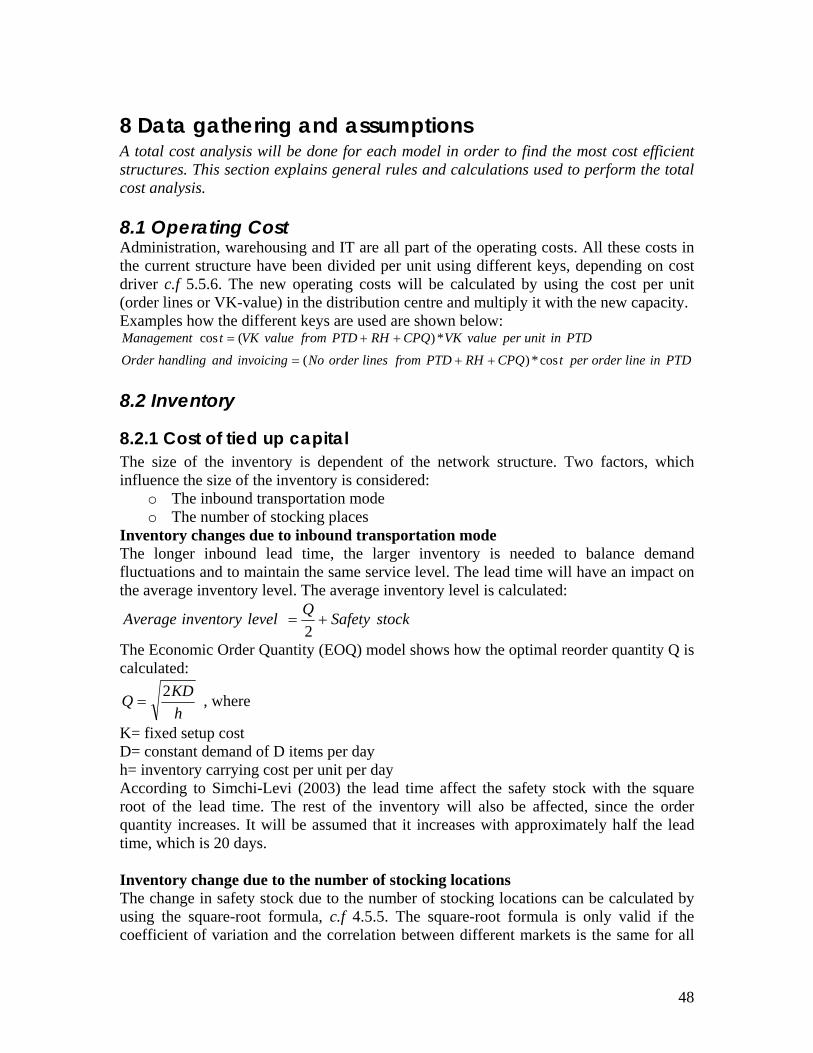
8 DATA GATHERING AND ASSUMPTIONS....................................................................................... 48 8.1 OPERATING COST ............................................................................................................................... 48 8.2 INVENTORY......................................................................................................................................... 48
8.2.1 Cost of tied up capital ................................................................................................................ 48 8.2.2 Obsolete stock and insurance..................................................................................................... 49
9.4.1 Model 1 ...................................................................................................................................... 55 9.4.2 Model 2 ...................................................................................................................................... 56 9.4.3 Model 3a .................................................................................................................................... 57 9.4.4 Model 3b .................................................................................................................................... 58
9.5 FUTURE .............................................................................................................................................. 59 9.6 SELECTION OF TWO MODELS FOR FURTHER ANALYSIS ........................................................................ 61
10 OTHER MODELLING ASPECTS...................................................................................................... 62 10.1 LEAD TIME........................................................................................................................................ 62 10.2 ENVIRONMENTAL ASPECTS ............................................................................................................... 62 10.3 SAP.................................................................................................................................................. 63
11 CONCLUSIONS AND RECOMMENDATIONS............................................................................... 64 11.1 RECOMMENDATIONS......................................................................................................................... 64
11.1.1 Model 1 .................................................................................................................................... 64 11.1.2 Model 3a .................................................................................................................................. 65
LIST OF APPENDIXES............................................................................................................................ 70 APPENDIX 1: ABBREVIATIONS ................................................................................................................. 70 APPENDIX 2: FREIGHT RATES ................................................................................................................... 70 APPENDIX 3: WEIGHT PER 40’ CONTAINER ............................................................................................... 73
List of figures and tables 2 Table 2. 1: The relationship between the business areas and divisions 3 Figure 2. 1: The product range from Chicago Pneumatic Division 4 Figure 2. 2: Revenue for Chicago Pneumatic Division 1999-2005 5 Figure 2.3: ROCE for Chicago Pneumatic Division 1999-2005 6 Figure 2. 4: EBIT for Chicago Pneumatic Division 1997-2000 6 Figure 2. 5: Organisational Chart for Operations 8 3 Figure 3.1: Inputs in the analysis 9 Figure 3.2: Modelling procedure 11 4 Figure 4. 1: Logistics impact on ROI (Christopher, 2005) 13 Figure 4.2: Logistics decisions that affect the environment (Wu & Dunn, 1995) 15 Figure 4.3: Logistical cost trade-off (McKinnon, 2003) 19 Figure 4.4: Stock reduction when centralising 20 5 Table 5.1: Purchased finished goods in percentage of total number of SKUs from each PC 24 Figure 5. 1: Distribution to end-users 26 Figure 5. 2: CPD global distribution network 28 Figure 5.3: Distribution network to be analysed 30 Table 5.2: Logistics cost in CPD distribution centres in T Euro 32 Table 5.4: Number of tools, spares and accessories sold each year from each DC 34 Table 5.5: Cost per order line and VK-value 34 6 Figure 6.1: Material flow for Dell 40 7 Figure 7.1: Model 1 43 Figure 7.2: Model 2 45 Figure 7.3: Model 3a 46 Figure 7.4: Model 3b 47 8 Table 8.1: Value of the present inventory in T Euro 49 Table 8.2: Average safety stocks and stock turns in number of days 49 Table 8.3: Value of the safety stocks in T Euro 49 Table 8.4: Market share in percentage of total weight from each production company 51 Table 8.5: Outbound weight from the distribution centres 51 9 Table 9.1: Operating cost in all models 52 Table 9.2: Inventory costs in all models 52 Table 9.3: Transportation costs in all models 53 Table 9.4: Total costs for model 1 55 Table 9.5: Total costs for model 2 56 Table 9.6: Total costs for model 3a 57 Table 9.7: Total costs for model 3b 58 Table 9.8: Future market share in percentage of total weight from each production company 59 Table 9. 9: Future VK-value and order lines in the distribution centres 59 Table 9.10: Future costs for all models 60 Tabel 9.11: Weight from each production company to the different continents 62 Table 9. 12: Tonne km and transportation mode for present situation and selected models 62
1
1 Introduction
1.1 Problem Background Chicago Pneumatic Division (CPD) is a division in the Atlas Copco Group consisting of five acquisitions now operating together. The acquisitions are Desoutter in UK, Georges Renault in France, Chicago Pneumatic US, Tech-Motive in US and Qianshao in China. The Atlas Copco model for operating divisions is to run Product Company, Distribution Centre and Customer Centre. There is also Application Centres, where larger customer specific solutions are made. Atlas Copco is normally operating its divisions with very few and centralised distribution centres. Due to the number of recent acquisitions by Chicago Pneumatic Division, the number of distribution centres has increased, making its structure more complex leading to a number of logistics related consequences. A faster delivery from the local DC to the local customer is now possible, but a higher stock is needed to maintain targeted availability of the products. Not all products are available in all distribution centres, delivery of customer orders in America, containing products from several distribution centres, can arrive in split shipments to the customer. Another problem is to collect the Point-of-Sales (POS) information back to the production companies from different distribution centres. Also, new acquisitions will make the structure even more complex when it comes to material flows and gathering of POS-data. In order to attract new customers and to maintain the old customer base, a larger variety of new products are introduced by the division. As much as 25 % of the annual sales today arise from products introduced within the last three years and this number is expected to increase in the future. However, the large assortment variation increases the inventory and related costs in the warehouses. Chicago Pneumatic Division is currently in the middle of a SAP implementation project for three of the PC's (Georges Renault, DEA and Chicago Pneumatic). A number of validation stages are to be executed. The go-live dates are January 2. The main questions are:
o How many distribution centres should Chicago Pneumatic Division operate? o If more than one; how will the production companies best supply the distribution
centres? Through a o One-to-one relation or o Each production company to several distribution centres?
o How will future markets needs fit the selected distribution solution?
1.2 Objectives The purpose is to study the current distribution network of Chicago Pneumatic Division and to develop new improved distribution models, aiming at lower total cost for distribution while maintaining targeted service levels. The work is further divided in three separate and clear objectives:
2
1. Map the current Chicago Pneumatic Division distribution network including a total cost analysis of the structure
2. Bench-mark the current Chicago Pneumatic Division structure with successful distribution/logistic companies
3. Develop two separate distribution models, with consideration to goods flow as well as financial and environmental aspects both in present and future situation.
A complimentary objective is to safeguard the support of SAP of the suggested models.
1.3 Delimitations Due to the scope, the following delimitations have been made in order to fulfil the purpose within the time frames of this project:
o Consideration to SAP will be taken but no further demands on IT/IS systems will be set.
o The analysis will only be for finished goods made to stock. This leads to: • The flow from Tech-Motive will be excluded, since they only make to
order. • The flow from Machine Tools Builders and Application Centres will
also be excluded, since all their production is made to order. o Finished goods purchased from external suppliers to the production company in
France (Georges Renault) will not be a part of the analysis, c.f. 5.6. o The flows through branch offices in China will not be considered o When modelling the distribution network, following delimitations are stated:
• Infinitive capacity in the distribution centres assumed • There will be no calculations of costs of restructuring the distribution
network and pay back time • No analysis of different country specific conditions, such as tax
regulations or other restrictions, will be done in this thesis. • There will only be a smaller survey about customer aspects on lead
time, c.f 5.6.1.
3
2 About Atlas Copco and Chicago Pneumatic Division
2.1 Atlas Copco The information about Atlas Copco Group is based on the Annual Report (2004) and oral references (c.f. list of references). Atlas Copco Group consists of several industrial groups located in 16 countries with over 26 000 employees. The revenue 2004 was 48 654 MSEK. Atlas Copco Group is organised into four separate but yet integrated business areas, which are operating through a number of divisions. The business areas develop, implement and follow up the group's strategies and goals. The divisions are business owner and conduct their business through Product Companies, Customer Centres, Application Centres and Distribution Centres. Products from Atlas Copco can be sold under different brands, depending on type of product and business. Table 2.1 shows the relationship between the business areas and divisions. It briefly describes products from the different business areas and the distribution of the Group’s revenue. Business Area Share of Group
Revenue (2004) Divisions Examples of products
Compressor Technique 36% Airtec, Industrial Air, Oil-free Air, Portable Air, Gas and Process
Air compressors, gas and process compressors, turbo expanders
Rental Service 21% Rental Service Cooperation Construction equipment rental, used equipment sales, tools and supplies
Industrial Technique 22% Atlas Copco Tools and Assembly Systems (ACTA), Chicago Pneumatic (CPD)
Power tools, assembly systems, aftermarket products
Construction and Mining Technique
21% Underground Rock Excavation, Surface Drilling Equipment, Rocktec, Drilling Solutions, Secoroc, Construction Tools, Craelius
Rock drills, surface drilling equipment, construction and demolition tools
Table 2. 2: The relationship between the business areas and divisions
2.2 Chicago Pneumatic Division The information about Chicago Pneumatic Division (CPD) is based on oral references and information material from the division. Chicago Pneumatic Division has 1000 employees operating across the world. They are mainly selling pneumatic tools, electric tools and assembly systems, used by professionals. The pneumatic (air-driven) products are screw-drivers, impacts and ratchets, riveting hammers and drills. Core electric tools are screw-drivers, screw feeders, battery tools and impact and ratchets. Figure 2.1 shows the entire range of products produced by Chicago Pneumatic Division.
4
Figure 2. 2: The product range from Chicago Pneumatic Division
The assembly systems are make to order, while the pneumatic and electric tools are mainly make to stock. The aftermarket, such as spare parts, service and guidance, contributes to about 15% of the revenue. The Atlas Copco brand stands for the highest quality tools in the market, while Chicago Pneumatic Division offers products branded CP in the categories good-better-best where “best” is on par with the Atlas Copco brand. Since the division consists of several acquisitions, the old brand names are today used together with CP, but will be transferred into only CP in the future. Chicago Pneumatic Division's mission is to become world leader for power tools in the following markets:
o Vehicle Service (Tire shops, General repair and service, Body shops) o Land Transportation (Motor Vehicle Industry Component, Motor Vehicle
Industry, Truck and Bus, Motorcycle, Train, Bicycle) o Air and Spacecraft (Final Assembly, Sub-contractors, Maintenance) o Light Assembly (White goods, Brown goods, Furniture) o General Industry (Agriculture, Heavy equipment, Foundry, Machine tool builders,
Window and door, Marine)
5
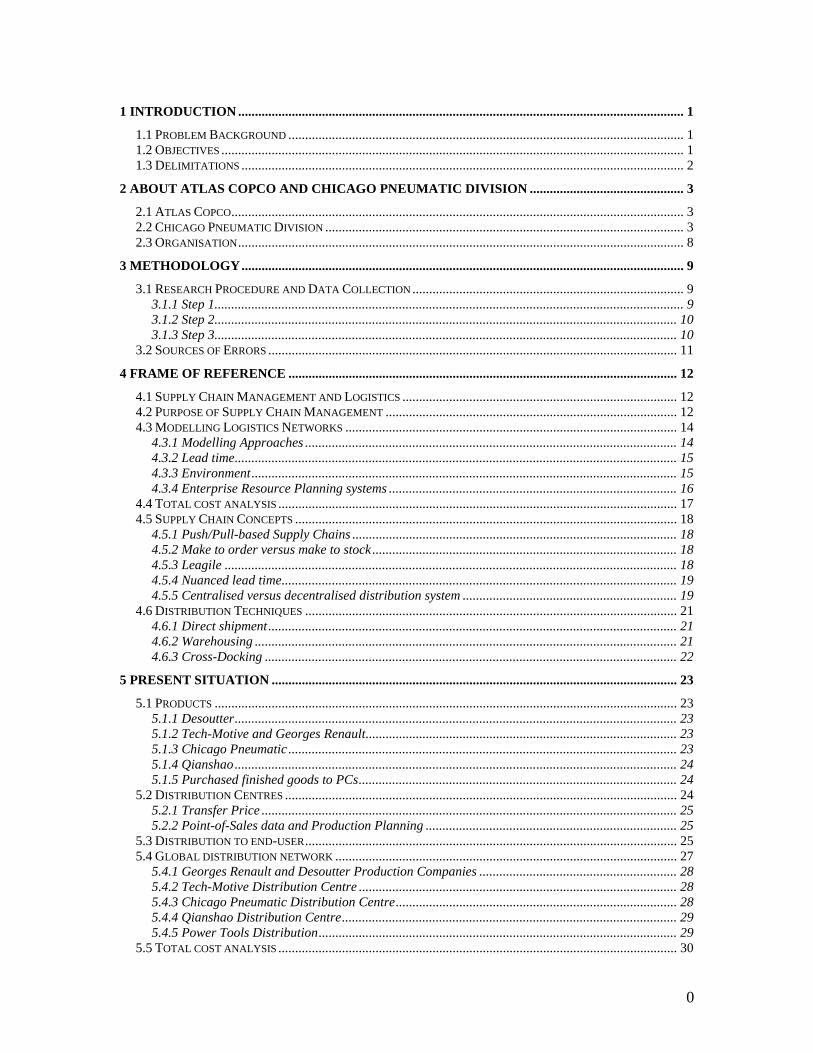
The division has a global market share of 8%. The competitors are ACTA (Atlas Copco), Ingersoll-Rand, Stanley, Cooper, Matco, Bosch and Uryu. The percentage of orders received in the different regions is: EU: 53% Other Europe: 3% Africa and Middle East: 4% Asia: 6% Australia: 1% North America: 31% South America: 1% All information above is according to Charlie Robison’s presentation about Chicago Pneumatic Division. To get a deeper understanding for the division, graphs showing NIS (Net Invoiced Sales), ROCE (Return Of Capital Employed) and EBIT (Earnings Before Interests and Tax) and over the last years are shown in Figures 2.2-2.4.
Figure 2. 2: Revenue for Chicago Pneumatic Division 1999-2005
OR Growth % Growth % Target 5-mth Trend OI 12M FOI T/G 12M OR 12M Rev OI 3M F
6
Figure 2.3: ROCE for Chicago Pneumatic Division 1999-2005
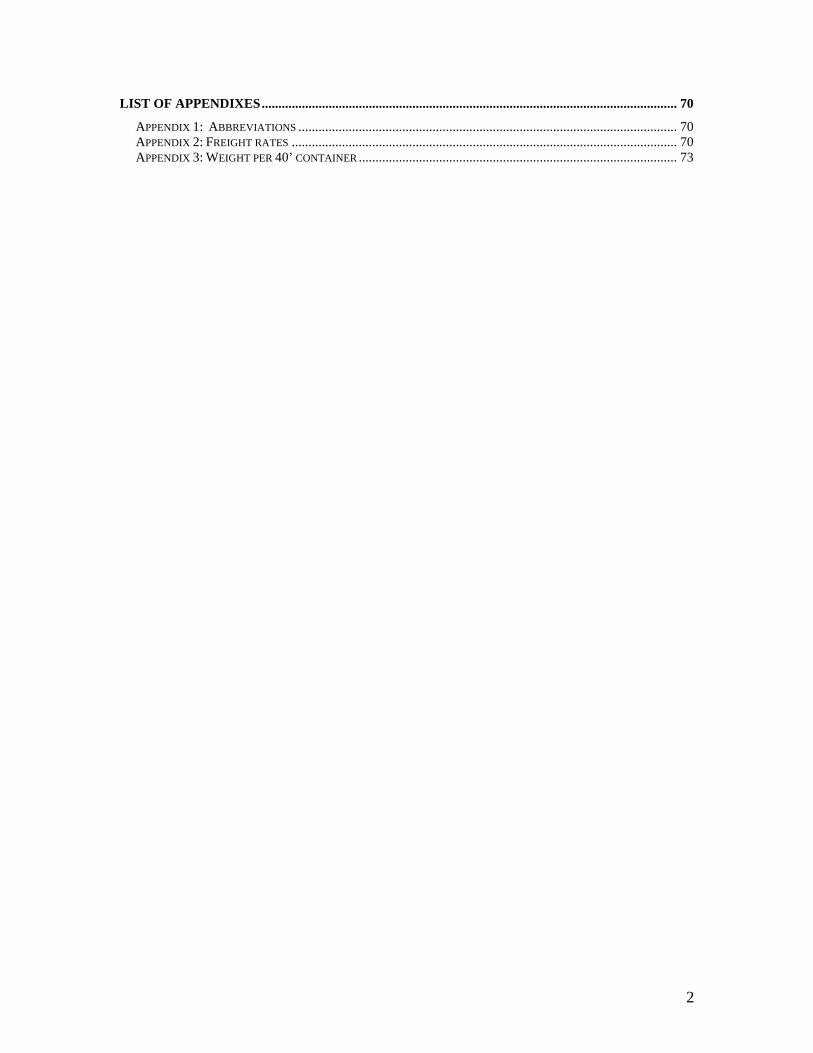
Figure 2. 4: EBIT for Chicago Pneumatic Division 1997-2005
Explanation to graphs: OR= Orders Received OI T/G= Orders Invoiced Target 12 M OR= Rolling 12 months Orders Received 12M Rev= Rolling 12 month Net Invoiced Sales
Operating Capital
-20.0%
-10.0%
0.0%
10.0%
20.0%
30.0%
40.0%99
1200
0300
0600
0900
1201
0301
0601
0901
1202
0302
0602
0902
1203
0303
0603
0903
1204
0304
0604
0904
1205
0305
0605
0905
1206
0306
0606
09G
oal 0.0
0.51.01.52.02.53.03.54.0
Turn
over
OCT 12M OTC T/G 12M ROCE%ROCE % T/G WACC %
7
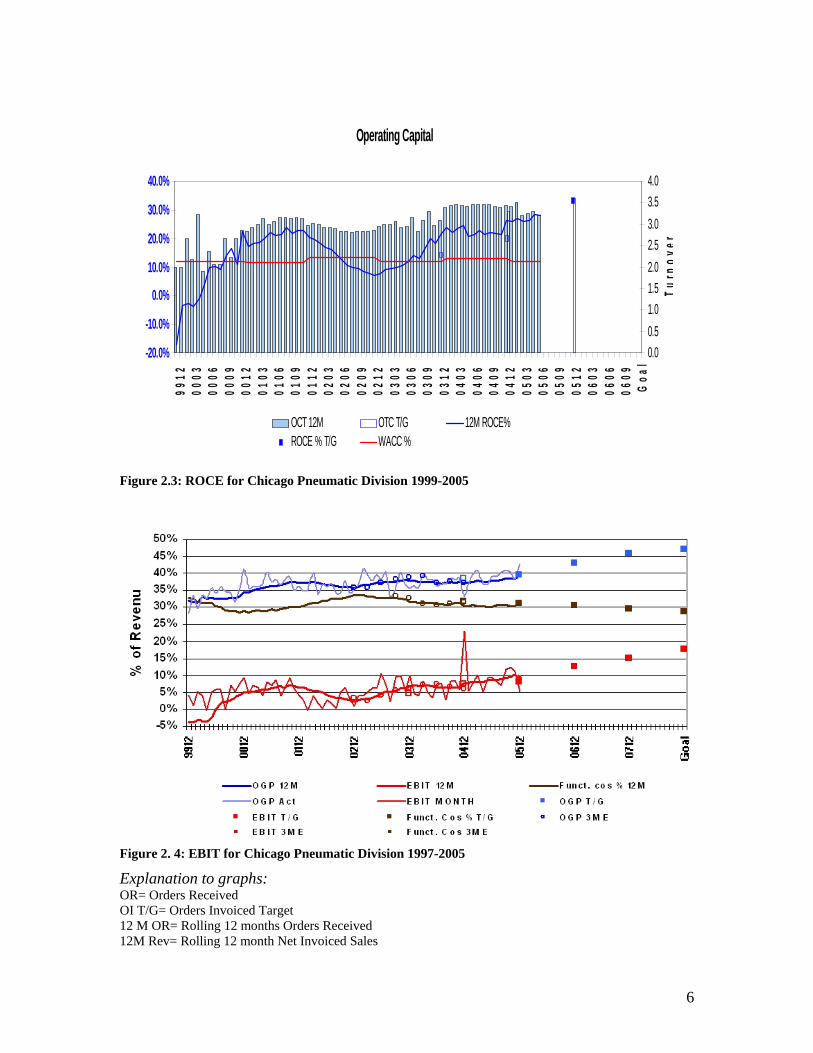
OI 12 M F= Orders Invoiced Rolling 12 month forecast OCT = Operating Capital OTC T/G= Operating Capital Target ROCE % T/G= Rate Of Captial Employed target in percentage 12M ROCE %= Rolling 12 months Rate of Capital Employed in percentage WACC= Weighted Average Cost of Capital EBIT 12 M F= Earnings Before Interest and Taxes 12 month Forecast OGP= Operating Gross Profit OGP Act= Actual Operating Gross Profit FUNC. COST 3ME= functional cost 3 Months Estimate Production Companies (PC) The product companies are responsible for development, production, logistics and central marketing. Chicago Pneumatic Division consists of five production company sites: Chicago Pneumatic (ATC), which was the first acquisition made in 1987, followed by Georges Renault (GRE) 1989, Desoutter (DEA) 1990, Qianshao (CPQ) 2004 and Tech-Motive (CPT) 2005. Distribution Centres (DC) The distribution centres' functions are: receiving orders, coordinate the both incoming as well as outgoing material, do minor customisation and handle surplus returns. The division runs four Distribution Centres of which three, Rock Hill (RH DC), Qianshao (CPQ DC) and Tech-Motive (CPT DC) are totally controlled by the division and one, Power Tools Distribution (PTD) in Belgium is jointly controlled with three other divisions in the Atlas Copco Group. Customer Centres (CC) The customer centres are accountable for local marketing, sales, service and customer satisfaction. The division has 19 Customer Centres: 10 in Europe, 1 in South Africa, 4 in America and 4 in Asia. There are also eight Branch Offices in China. Application Centres (AC) Products made in the application centres are customer specific and make to order. Today only for threaded fastener applications, and therefore called "assembly systems".
8
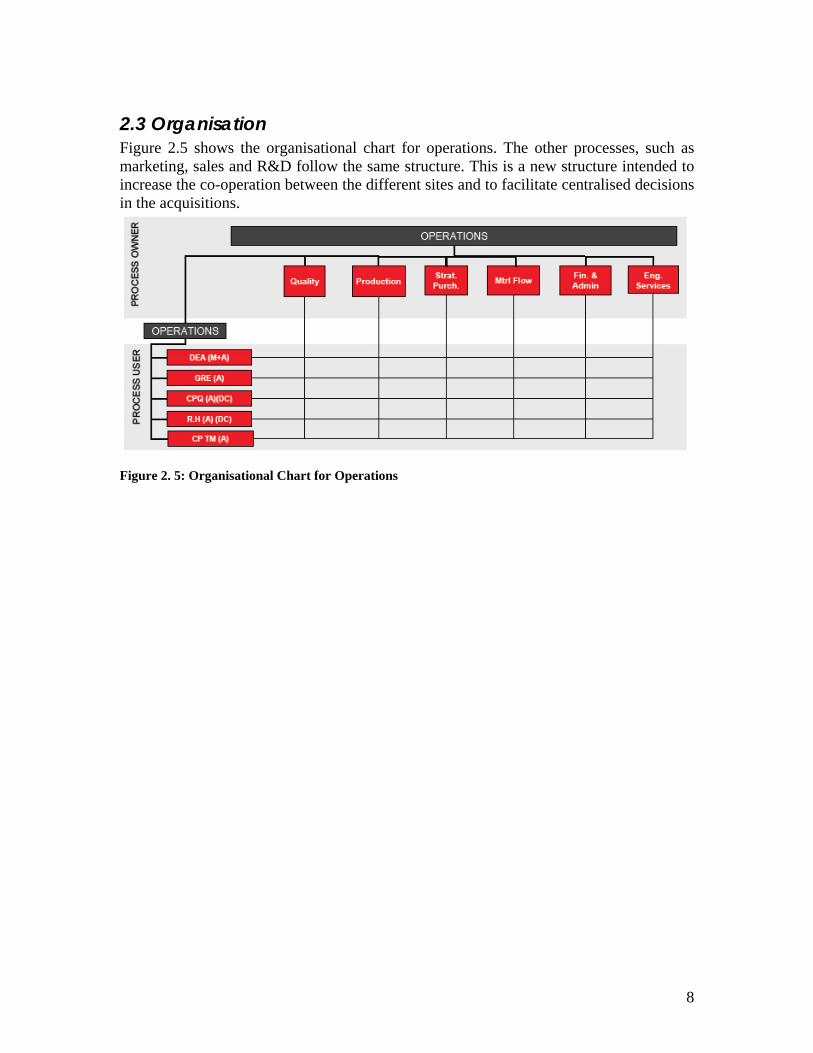
2.3 Organisation Figure 2.5 shows the organisational chart for operations. The other processes, such as marketing, sales and R&D follow the same structure. This is a new structure intended to increase the co-operation between the different sites and to facilitate centralised decisions in the acquisitions.
Figure 2. 5: Organisational Chart for Operations
9
3 Methodology
3.1 Research Procedure and Data Collection According to the objectives the thesis includes three steps:
o Map the current Chicago Pneumatic Division distribution network including a total cost analysis of the structure
o Bench-mark the current Chicago Pneumatic Division structure with successful distribution/logistic companies
o Develop two separate distribution models, with consideration to goods flow as well as financial and environmental aspects both in present and future situation.
Figure 4.1 shows the steps and the input in each step.
Figure 3.1: Inputs in the analysis
3.1.1 Step 1 The first step is an overview of the division from supervisor Thomas Dahlgren. After a brief understanding of the organisation and structure, more interviews are scheduled. What persons to be interviewed are decided by the supervisor and student. The thesis is written at the production company Desoutter, due to nearness to supervisor and other key persons. Interviews are held at customer centre in Desoutter. Information is gathered about order procedure, markets and different customers and products. Power Tools Distribution, Belgium, is visited in order to see the internal administration in a distribution centre, get a deeper understanding for the flows and map inventory-related costs. A tour in the production company Desoutter is given, to get a deeper understanding of the products made.
Map present structure
Develop new structures
Customer visits
Visit to internal plants Interviews Interviews
Bench-mark
On-line material
Visit to external plants
Internal material
Cost compilations
Interviews/ Discussion
Time
Inputs
Theory
Theory Theory
10
The customer centre, distribution centre and production company in Rock Hill are also visited and similar information gathered. Interviews with the same key persons as for Desoutter and Power Tools Distribution take place in Rock Hill. To be able to create new distribution model and find possible cost reductions, the costs in the old structure are collected and analysed. The costs are gathered from controllers and operating/distribution managers. Logistics books are also used as a reference of how to map costs. Both larger and smaller customers are interviewed in order to get a broader picture of the company. The questions discussed are lead time, service and other issues that arise from customers. Since there is beyond the scope and time availability of this thesis to get a complete understanding of the customers, customer surveys, done by external market research companies, are studied.
3.1.2 Step 2 This phase intends to increase the understanding of what makes a distribution network successful. For an effective bench-marking, parameters to study are carefully decided in advance. The bench-marking is focusing on the design of present distribution network, but also lead time to customers is also studied as well as measurements for distribution efficiency. Consideration of business and other conditions will be taken before using the information from the bench-marking. The data collection will be made by visits, tours and interviews at other companies. The first company to bench-mark is Atlas Copco Tools and Assembly Systems (ACTA), a sister division to CPD, which produces similar products and administer their distribution through Power Tools Distribution. Numbers and other measurement are therefore easier obtained. There will also be bench-marking with Dell, due to its striking distribution success. More information about other external companies will be searched on the Internet and in books.
3.1.3 Step 3 Many aspects contribute to the design of the distribution network. Financial, environmental, administration aspects are important. But consideration of lead time to customers, the present markets and location of the future markets will have an even bigger impact on the final decision. The data used in this phase derives from discussions with persons involved in the different areas and from books. Also, the customers’ aspects on distribution, gathered from interviews, are used. Due to the scope of this thesis, no strategic planning program or mathematical modelling will be used. Instead, the problem will be approached with a holistic view on the entire chain. The lead time will be measured and a breakdown of the costs shows that the costs of freight and inventory have largest impact on the total cost; therefore the modelling starts from there. After new, financially justified, models are created; complexity will be added and other aspects will be weighted in the final decision. Validation will be done by
11
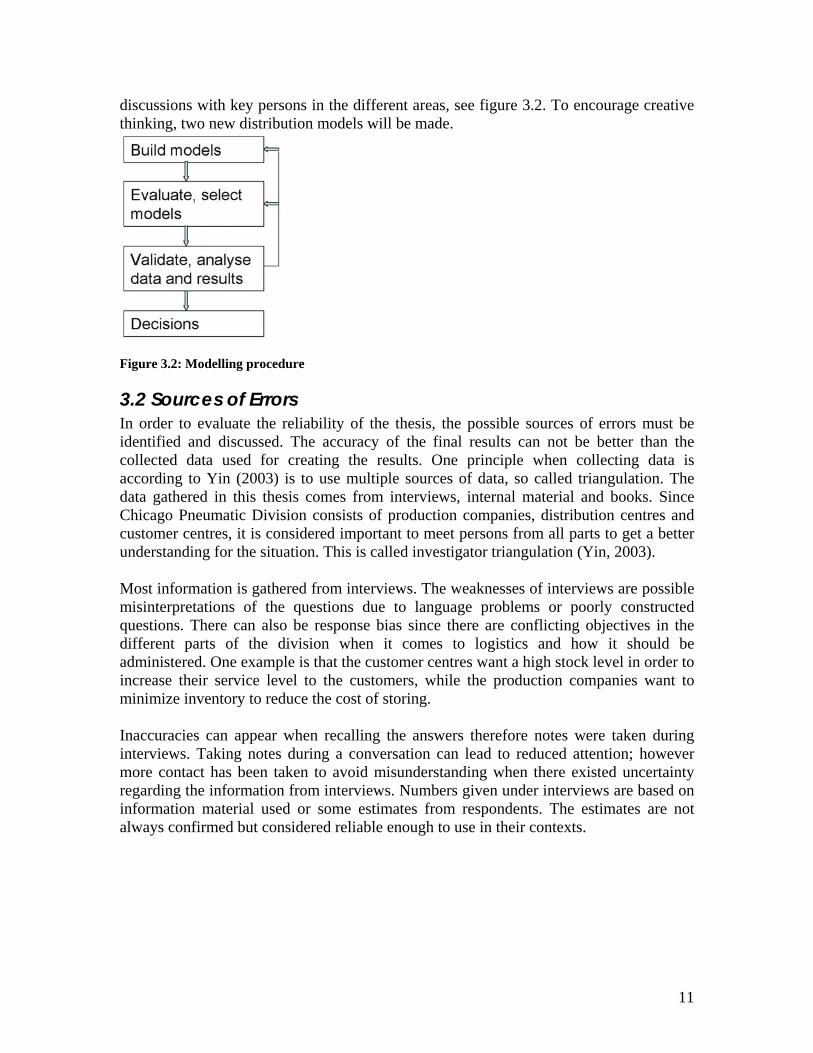
discussions with key persons in the different areas, see figure 3.2. To encourage creative thinking, two new distribution models will be made.
Figure 3.2: Modelling procedure
3.2 Sources of Errors In order to evaluate the reliability of the thesis, the possible sources of errors must be identified and discussed. The accuracy of the final results can not be better than the collected data used for creating the results. One principle when collecting data is according to Yin (2003) is to use multiple sources of data, so called triangulation. The data gathered in this thesis comes from interviews, internal material and books. Since Chicago Pneumatic Division consists of production companies, distribution centres and customer centres, it is considered important to meet persons from all parts to get a better understanding for the situation. This is called investigator triangulation (Yin, 2003). Most information is gathered from interviews. The weaknesses of interviews are possible misinterpretations of the questions due to language problems or poorly constructed questions. There can also be response bias since there are conflicting objectives in the different parts of the division when it comes to logistics and how it should be administered. One example is that the customer centres want a high stock level in order to increase their service level to the customers, while the production companies want to minimize inventory to reduce the cost of storing. Inaccuracies can appear when recalling the answers therefore notes were taken during interviews. Taking notes during a conversation can lead to reduced attention; however more contact has been taken to avoid misunderstanding when there existed uncertainty regarding the information from interviews. Numbers given under interviews are based on information material used or some estimates from respondents. The estimates are not always confirmed but considered reliable enough to use in their contexts.
12
4 Frame of Reference The frame of reference will explain the theory used for describing the present situation and to create new distribution models. First, a brief explanation of supply chain management and logistics will be given as well as the reasons why supply chain management is important. The next section describes modelling of supply chain, including constraints and cost aspects. The last section describes different distribution techniques.
4.1 Supply Chain Management and Logistics A definition of Supply Chain Management from Council of Supply Chain Management Professionals (CSCMP, 2005) is:
“Supply Chain Management encompasses the planning and management of all activities involved in sourcing and procurement, conversion, and all Logistics Management activities. Importantly, it also includes coordination and collaboration with channel partners, which can be suppliers, intermediaries, third-party service providers, and customers. In essence, Supply Chain Management integrates supply and demand management within and across companies.”
Hence, supply chain management is including all different companies in the supply chains. Business processes and functions have to be linked between the companies and may include cooperation in sales, product design, finance and information technology. According to Simchi-Levi et al. (2003) supply chain management includes a cost minimisation of the whole system, without sub optimisation of smaller parts of the supply chain. Since the system is not linear, the sum of optimised sub-systems is not the optimum of the whole system (Seppäla et al, 1995). A holistic view must be taken to be able to understand what is most beneficial for the whole chain. The definition of Logistics Management from Council of Supply Chain Management Professionals (CSCMP, 2005) follows:
“Logistics Management is that part of Supply Chain Management that plans, implements, and controls the efficient, effective forward and reverse flow and storage of goods, services and related information between the point of origin and the point of consumption in order to meet customers' requirements. “
Here logistics management is seen as a part of the supply chain. It includes transportation, warehousing and inventory management, logistics network design as well as demand/supply planning. However, many definitions of supply chain management and logistics exist. The difference between them depends on who is addressing the issue and there is not always such a clear distinction between them as the definitions above. There will be no distinction made between the two in this thesis.
4.2 Purpose of Supply Chain Management The importance of a well-functioning, cost-efficient logistics network is constantly increasing. Today’s competitive environment with global markets, fast introduction of products with short life cycle and more intensive service expectations from customers
13
force many companies to invest in new supply chain strategies (Simchi-Levi et al, 2003). Another reason for an efficient supply chain is the increased pressure on reduced capital. New technologies, in communication and transportation, bring new possibilities to manage the supply chain. According to Al-Mashari (2000) a survey of more than 300 supply-chain-related executives, showed that 92 percent of them planned to implement new supply chain strategies, which suggests this is an ever-ongoing activity in companies. There are many ways to improve the logistics and resource utilisation. Return Of Investment (ROI) is a common way to measure how improvements in logistics can lead to increased productivity of capital (Christopher, 2005). ROI is the ratio between net profit and the assets utilised to produce this profit.
employedcapitalsales
salesprofit
employedcapitalprofitROI *==
The logistics structure impact on the ROI in different ways. The improvements that can be done in each area are stated to the left in figure 4.1.
Figure 4. 1: Logistics impact on ROI (Christopher, 2005)
Customer service and logistics efficiency are ways to increase sales revenue and decrease the costs. Pipeline management is when the manufacturing and procurement lead times are adjusted after the needs of the marketplace in order to act more flexible and agile. Cash-to-cash cycle time is how long time it takes to convert an order into cash, on which the logistics structure has a large impact. Just-in-time logistics is a pull based system where all products should be make to order and therefore inventory costs are minimized. Asset deployment and utilisation is how the fixed assets are used in best way.
Sales Revenue
Costs
Cash
Accounts Receivable/payable
Inventory
Fixed assets
Profit
Capital employed
Return on Investmen
+
-
+
+
Customer service
Logistics efficiency
Pipeline management
Cash-to-cash cycle time
Just-in-time logistics
Asset deployment and utilization
/
14
4.3 Modelling Logistics Networks According to Ned Bauhof, eighty percent of a company’s logistics costs are locked in when designing and planning the supply chain strategy. Therefore it is of highest importance to do a network analysis of the supply chain network and seek answer to following questions:
o How many distribution centres should the company have? o Are there opportunities to consolidate them? o What is the role of each one in the supply chain?
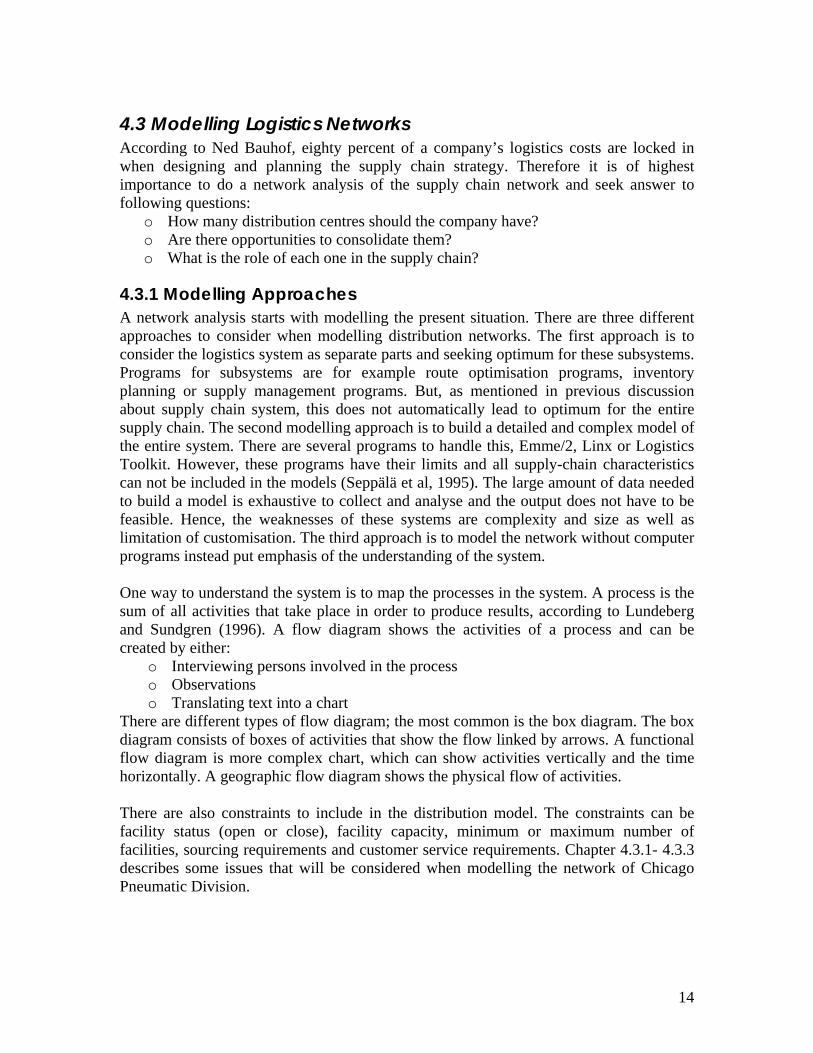
4.3.1 Modelling Approaches A network analysis starts with modelling the present situation. There are three different approaches to consider when modelling distribution networks. The first approach is to consider the logistics system as separate parts and seeking optimum for these subsystems. Programs for subsystems are for example route optimisation programs, inventory planning or supply management programs. But, as mentioned in previous discussion about supply chain system, this does not automatically lead to optimum for the entire supply chain. The second modelling approach is to build a detailed and complex model of the entire system. There are several programs to handle this, Emme/2, Linx or Logistics Toolkit. However, these programs have their limits and all supply-chain characteristics can not be included in the models (Seppälä et al, 1995). The large amount of data needed to build a model is exhaustive to collect and analyse and the output does not have to be feasible. Hence, the weaknesses of these systems are complexity and size as well as limitation of customisation. The third approach is to model the network without computer programs instead put emphasis of the understanding of the system. One way to understand the system is to map the processes in the system. A process is the sum of all activities that take place in order to produce results, according to Lundeberg and Sundgren (1996). A flow diagram shows the activities of a process and can be created by either:
o Interviewing persons involved in the process o Observations o Translating text into a chart
There are different types of flow diagram; the most common is the box diagram. The box diagram consists of boxes of activities that show the flow linked by arrows. A functional flow diagram is more complex chart, which can show activities vertically and the time horizontally. A geographic flow diagram shows the physical flow of activities. There are also constraints to include in the distribution model. The constraints can be facility status (open or close), facility capacity, minimum or maximum number of facilities, sourcing requirements and customer service requirements. Chapter 4.3.1- 4.3.3 describes some issues that will be considered when modelling the network of Chicago Pneumatic Division.
15
4.3.2 Lead time The logistics structure is driving cost, but also lead time and delivery service (Abrahamsson & Aronsson, 1999). A very important aspect when modelling new distribution structures is the current lead time to customers and how important lead time is to them (Beverage Industry, 2005). Also important to lead time is the reliability of confirmed lead time. The customers may order in advance, especially for larger project, and back-order of one product can delay the entire project. The high competition on the market increases the importance of short lead time to attract customers. Also, the large introduction of new products increases the substitutability between products from different brands and the more commodity product; the more important is the lead time as a differentiator.
4.3.3 Environment The way the supply chain structure is set up will have impact on environment. Figure 4.2 shows how the different parts in the supply chain, from raw-material procurement, inbound logistics, transformation, outbound logistics, and marketing to after-sales service affect the environment.
Figure 4.2: Logistics decisions that affect the environment (Wu & Dunn, 1995)
The environmental impact starts with choosing environmentally friendly products and vendors. More efficient material handling and warehousing lead to cost savings, as well as possible reduction in waste material, packaging material and energy. Several environmental issues are affected by the design of the distribution network. Cost-efficient distribution system can also lead to environmental benefits. For each distribution model there will be different impacts. Direct shipping means smaller and more frequent shipments, thus generating traffic. Frequent deliveries add the pressure on roads and more discharge. On the other hand, there is no longer a need for a warehouse, which leads to reduced energy consumption and transportation to the warehouse. Warehousing and cross-docking means that scale of economy can be achieved; hence transportation can be maximal efficiently used. Also, storage, energy and excess location can be reduced, which leads to cost savings and less impact on environment (Wu &Dunn, 1995).
Transportation has the largest negative impact on the environment in the logistics system. Transportation contributes to several negative environmental effects, such as air pollution, energy consumption, noise and other damages on people and land (Wu &Dunn, 1995). Selection of carrier and mode are considered having a large impact, rail are one of the most favourable and airfreight the least. In conclusion, being environmentally friendly means more efficient use of transports with better space utilisation and optimised routes combined with more efficient materials handling and storing.
4.3.4 Enterprise Resource Planning systems Chicago Pneumatic Division is implementing SAP, an Enterprise Resource Planning system (ERP). Therefore, the modelling will also be evaluated after feasibility in SAP. ERP is software that integrates departments and functions across a company. It runs off a single database, enabling various departments to share information and communicate with each other (Payne, 2002). ERP systems are meant to improve overall effectiveness and competitive performance, increase responsiveness to customers and support strategic initiatives. Other tangible benefits are inventory reduction, personnel reduction and productivity improvements (Gargeya, 2005). Implementing an ERP-system is a time-consuming and an expensive procedure. Software and hardware need to be purchased, however, the largest cost is personnel cost for organising the implementation and structure of the ERP-system (Gargeya, 2005).The success of the implementation depends on a number of factors, for example the business plan and vision, management support and minimum customisation. According to Gargeya, 70 percent of all ERP systems fail to be completely implemented even after three years. There was either complete failure, where the entire project was rejected, or partial failure, where some parts are not working satisfying. The alternative to ERP is “best of breed” software, which is a combination of software packages for each area that are linked together by an interface. There are many different ERP-vendors, however SAP is considered to be the largest one with more than 50 percent of the market. SAP R/3 is real-time business application software that brings together several core business functions into one data-base, where all different functions can operate. It is arranged into distinct functional modules, such as Sales & Distribution, Finance, Logistics Execution and Production. All modules are managed separately, but can be integrated if the information needs to be shared in more than one module. The largest advantage with SAP is the wide range of different functions it offers. On the other hand is the complexity of the system and therefore the resulting implementation considered to be the largest disadvantage with SAP (Gargeya, 2005) together with its inflexibility once design and installed. SAP R/3 is a client/server based application, utilizing a 3-tiered model. This means the user interacts with the presentation level, SAP graphical user interface, which is considered as tier 1. The next tier is the application level, which contains the business-specific logic. The databases with information, such as transactional and configuration data is the last tier (Al-Mashari, 2000). SAP R/3 has its own language called Advanced Business Application Programming (ABAP). Customers can either modify existing SAP
code to modify existing functionality or develop their own functions. The interaction with the database is made by SQL-statements.
4.4 Total cost analysis Since the objective of restructuring the distribution network is reducing costs, both costs in current as well as new structures must be identified and compared. This way of mapping the costs highlights how changes in network structure shift the costs between the cost elements and affect the total cost. For example it can justify the large cost for airfreight by an even bigger decrease in inventory costs (Håkansson, 2003). The cost parameters included in the total cost analysis are based on the most resource consuming activities in the distribution centre. They are also affecting the Return of Investment, c.f. figure 4.1. The customer service can be increased by shorten lead time and higher availability, which affects the warehouse and inventory costs. Logistics efficiency can be a reduction in costs for administration. Cash-to-cash cycle time is depending of the internal procedure but shorter lead time will also affect. A shorten lead time will affect cost for warehouse, inventory and transportation. The inventory cost and cost of fixed assets in the total cost analysis can be direct referred to the capital employed. The parameters are (Abrahamsson& Aronsson, 1999; Bolstorff 2003): 1. Administration
a) Management (General Management, Finance, Human Resources, Quality Assurance)
b) Order Handling and Invoicing c) Forwarding d) Inventory and Purchasing Management
2. Warehousing a) Housing. Costs for buildings, rent or depreciation. Also includes real estate taxes
and security costs. b) Maintenance. The cost for electricity and heating. c) Machines/equipment. Cost of renting or depreciation. d) Warehouse personnel. Labour cost for persons working with receiving and
inspection, stocking, picking, packing and loading of the trucks. e) Insurance. Includes both fire and corporate insurance.
3. Inventory carrying costs a) Tied-up capital. The cost of capital can be set to the company’s Weighted Cost
of Capital (WACC). b) Obsolete stock. c) Insurance for products in stock
4. IT a) System operation and maintenance. Development, operations,
hardware/software licenses, maintenance, network, hosting, and people. 5. Transportation
a) Transport Insurance. Any extra insurance above standard b) Packaging material. c) Inbound. To distribution centre d) Outbound. From distribution centre to customers
18
4.5 Supply Chain Concepts Some important supply chain concepts are stated in this section, in order to understand how the present supply chain is managed and how this is affecting the way distribution can be handled today. However, there exist more interesting concepts that allow other kind of distribution. These concepts will be explained here, but only used as recommendations.
4.5.1 Push/Pull-based Supply Chains In order to identify the appropriate supply chain strategy, demand uncertainty and the importance of economies of scale needs to be identified. In a push based supply chain, products are made to stock and supply chain production forecast is based on a long-term perspective. This gives little ability to meet changes in demand pattern and a larger inventory, due to increased safety stock and larger production batches. In a push-based supply chain focus is on cost minimisation. A push strategy is suitable when the demand uncertainty is relatively low and economy of scale is important. In a pull-based supply chain, focus is on matching customer demand with production, short-term planning. The products are made to order and no inventory is kept in a pure pull-system. But, a pull-based system is harder to administrate and it is not possible to achieve economy of scale (Simchi-Levi et al, 2003). Pull based strategies are mostly used for products with high demand uncertainty and little importance of economies of scale.
4.5.2 Make to order versus make to stock According to Wanke and Zinn (2004) there are six variables that affect make to order versus make to stock decisions. The six variables are process technology, obsolescence, perishability, lead time ratio, delivery time and coefficient of variation of sales. The higher variation of sales and risk for obsolescence and perishability, the greater benefits of make to order due to the large risks. For a small lead time ratio, which is delivery time over supply lead time, is make to stock choices preferred. Make to order solutions are more frequent when the manufacturing process is flexible and when there is a short delivery time.
4.5.3 Leagile Leagile is a technique that combines the lean and agile paradigm (Mason-Jones et al 2003). The lean strategy is a push-strategy best for large volume, low variety, stable demand and a long replenishment lead time (Christopher 2005). By working closely with suppliers, the inventories of components and materials can be minimised. Lean technique maximises economy of scale and focus on efficiency. When there exists uncertain demand and many variants of products with short replenishment lead times, the agile paradigm is preferred. An agile supply chain can quicker adjust to market changes and produces customised products for smaller market segments, in a pull-mode. However, if the demand is unpredictable and replenishment lead times long, a mix of both lean and agile technique must be considered. A lean strategy will be used for all production until the decoupling point, where the products are customised. Forecasting will be used for procurement and production of commodity material and since there is an aggregated demand, the forecast can be improved. The agile strategy is used after the decoupling
19
point and is demand driven to quicker respond to unpredictable demand. This is called leagile, delayed differentiation or postponent (Anand 2004).
4.5.4 Nuanced lead time A new trend in logistics is to nuance the lead time to different customers segments and create several supply chain within the same company (A.T. Kearney, 2004). It means each segment of customer has its own supply chain and lead time. A balance between customisation and complexity is crucial. According to A.T Kearny, many companies have too few supply chains which lead to over servicing some customer segments and unnecessary high costs.
4.5.5 Centralised versus decentralised distribution system A centralised distributions system manages all distribution activities from one centre, while the decentralised systems split the distribution between many local warehouses. Figure 4.3 shows the trade-off between number of warehouses, inventory-, transportation and storage cost.
A major advantage of having a centralised warehouse is scale of economy. The economy of scale depends on the complexity and how much local adjustments there need to be on the products (Abrahamson & Aronsson, 1999). Costs for administration and labour will decrease by more efficient resource utilisation in a centralised warehouse, which is shown in figure 4.4. Another benefit of centralisation is to maintain the same service level while decreasing the inventory level, also shown in figure 4.4. The demand variability is reduced if demand is aggregated from several locations; if demand increases in one market, products allocated to other markets can be reallocated to the market which needs it. The higher coefficient of variation the more benefit from centralised systems. The reduction in variability leads to a decrease in safety stock and therefore reduces the average inventory. If we assume that the coefficient of variation ( Lδ ) and the correlation between different markets is the same for all inventories, then the safety stock is:
20
Lkss δ*= , where k is a constant Two inventories will then give following variation:
LLLL δδδδ *2222 =+=
Hence, the variation for n warehouses is:
Ln δ* , and the total safety stock for n warehouses is:
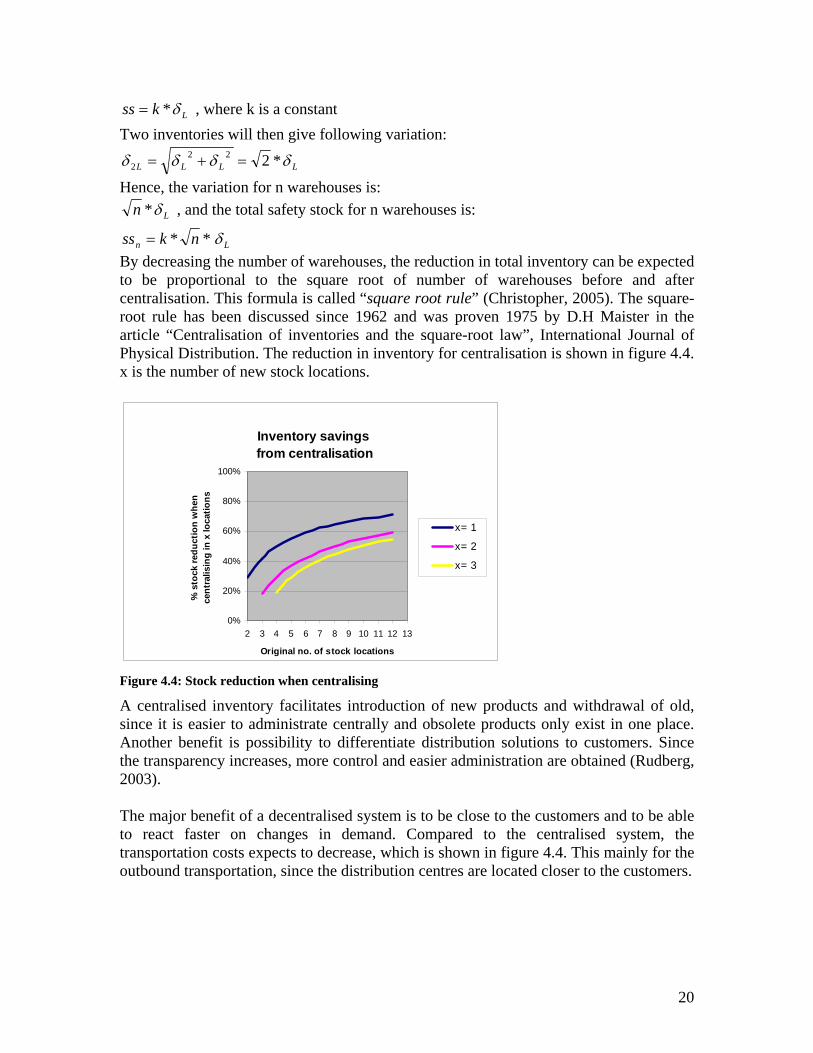
** nkssn = Lδ By decreasing the number of warehouses, the reduction in total inventory can be expected to be proportional to the square root of number of warehouses before and after centralisation. This formula is called “square root rule” (Christopher, 2005). The square-root rule has been discussed since 1962 and was proven 1975 by D.H Maister in the article “Centralisation of inventories and the square-root law”, International Journal of Physical Distribution. The reduction in inventory for centralisation is shown in figure 4.4. x is the number of new stock locations.
Inventory savings from centralisation
0%
20%
40%
60%
80%
100%
2 3 4 5 6 7 8 9 10 11 12 13
Original no. of stock locations
% s
tock
redu
ctio
n w
hen
cent
ralis
ing
in x
loca
tions
x= 1
x= 2
x= 3
Figure 4.4: Stock reduction when centralising
A centralised inventory facilitates introduction of new products and withdrawal of old, since it is easier to administrate centrally and obsolete products only exist in one place. Another benefit is possibility to differentiate distribution solutions to customers. Since the transparency increases, more control and easier administration are obtained (Rudberg, 2003). The major benefit of a decentralised system is to be close to the customers and to be able to react faster on changes in demand. Compared to the centralised system, the transportation costs expects to decrease, which is shown in figure 4.4. This mainly for the outbound transportation, since the distribution centres are located closer to the customers.
21
4.6 Distribution Techniques Once the supply chain concept is in place, different distribution techniques can be considered. Many factors influence the choice of distribution strategies and there will often a trade-off between them. More than one strategy can be used in order to customize the distribution after a specific supply chain.
4.6.1 Direct shipment The products are shipped from the manufacturer to customers, without involving a distribution centre or a warehouse. Therefore, a large cost reduction can be obtained, since all costs for those units can be eliminated. The lead time will also be shortened when shipping directly. Disadvantages are more frequent, smaller transports which lead to increased transportation cost. All scale of economy and risk-pooling effects, which can be achieved in a distribution centre, is lost (Simchi-Levi et al, 2003). This strategy is mostly used when it is possible to fill up the whole truck from the manufacturer. It is also used when lead time is crucial, such as for grocery. There are two different approaches when implementing this strategy if the service should be maintained. Either the manufacturer has shortened their production lead time so they can react on customer demand directly and only make to order. Otherwise, if the production processes does not allow this, the manufacturer needs to keep stock.
4.6.2 Warehousing Three basic kinds of inventory are considered; raw material, work-in-progress and finished goods. This section will only discuss the inventory of finished goods, due to the scope of the thesis. The reasons for keeping inventory in a warehouse are:
o To protect against unexpected changes in customer demand. Production forecasting is often not enough to meet customer demand and no forecast is perfect. Therefore the inventory is kept to protect against underestimating the demand. Demand uncertainty has grown, due to shorter product life cycles and an increased product variety (Simchi-Levi et al, 2003). o To manage demand seasonality Many businesses have peaks, for example Christmas selling season. o To protect against uncertainty in supply. The uncertainty in supply can arise from own production as well as supply from external suppliers. o To take advantage of scale of economy It is more efficient to produce in larger batches. It is also more cost efficient to transport larger consolidated shipments than smaller more frequent transports. o Products in transit The goods in transit, for example transit by boat, can also be considered as a type of inventory.
22
4.6.3 Cross-Docking Cross-docking is when incoming goods are coordinated with outgoing transports as far as possible and the products rarely stay in the warehouse for more than 10 to 15 hrs. One example is Wal-Mart. The goods arrive at the warehouses from the different manufacturers and are then transferred to vehicles and delivered to retailers as fast as possible. Therefore, the costs of inventory can be reduced and lead time improved. But the coordination requires detailed planning between suppliers, distribution centre and customers. To manage the material flow, forecasting is necessary as well as visibility between the different layers in the supply chain (Wu & Dunn, 1995). Cross-docking is most efficient in distribution systems with large volumes, where the trucks can be completely filled up.
23
5 Present situation This chapter describes the material handling from manufacturing to distribution. The global distribution network is shown and explained, also the different distribution ways to the end-users. A more detailed description of how the distribution centres are managed is included. Furthermore, to give a broader picture of the present situation, all logistics costs are mapped in a total cost analysis. Constraints for distribution modelling, caused by the present situation, are also described.
5.1 Products The CP Division divides their products into the three main categories: Tools, Accessories and Spares. The categories are further divided into classes depending on lead time to customers. Horizon Day 1 (HD1) is make to stock, i.e. should be available in the distribution centre. HD1 consists of the product classes A, B and C, according to the Pareto principle (Simchi-Levi et al, 2003). Horizon Day 2 (HD2) and Horizon Day 3 (HD3) are made to order. HD2 has a lead time of two weeks, while HD3 has a lead time of 6-8 weeks. There are relatively few HD1 articles (SKU), but the majority of the sales made are HD1 as the market the CP Division serves expects delivery within 48 hours (72 hours in America, up to a week for Asia) and the internal lead time is between 21 to 90 days. According to Paul Humphreys in UK sales, the relationship between sales and order lines for the three main categories are:
o Tools 60 % of value, 20% of order lines o Accessories 20 % of value. 40 % of order lines o Spares. 20 % of value. 40 % of order lines
The tools from different production sites have about the same weight (½-5 kg) and size, but there is a big difference in value and markets. The value of a pneumatic tool is approximately 300 Euro while an electric tool has a value of approximately 2000 Euro (excluding cable and digital controller).
5.1.1 Desoutter The highest product cost-added production company site is Desoutter. Desoutter does both machining and assembly of high product cost pneumatic tools. Desoutter serves the customer segments Light Assembly, Aerospace and General Industry.
5.1.2 Tech-Motive and Georges Renault Tech-Motive and Georges Renault assemble electric brushless tools. Tech-Motive has its largest market in North America, while Georges Renault primarily serves the European market. The customer segment they are serving is mainly land transportation.
5.1.3 Chicago Pneumatic Chicago Pneumatic assembles cost efficient pneumatic tools, of which 90% are sold to the automotive market. The rest is for land transportation.
24
5.1.4 Qianshao Qianshao is assembling and machining very low product cost pneumatic tools for the aircraft industry, general industry and also to light assembly, primarily to the Chinese market.
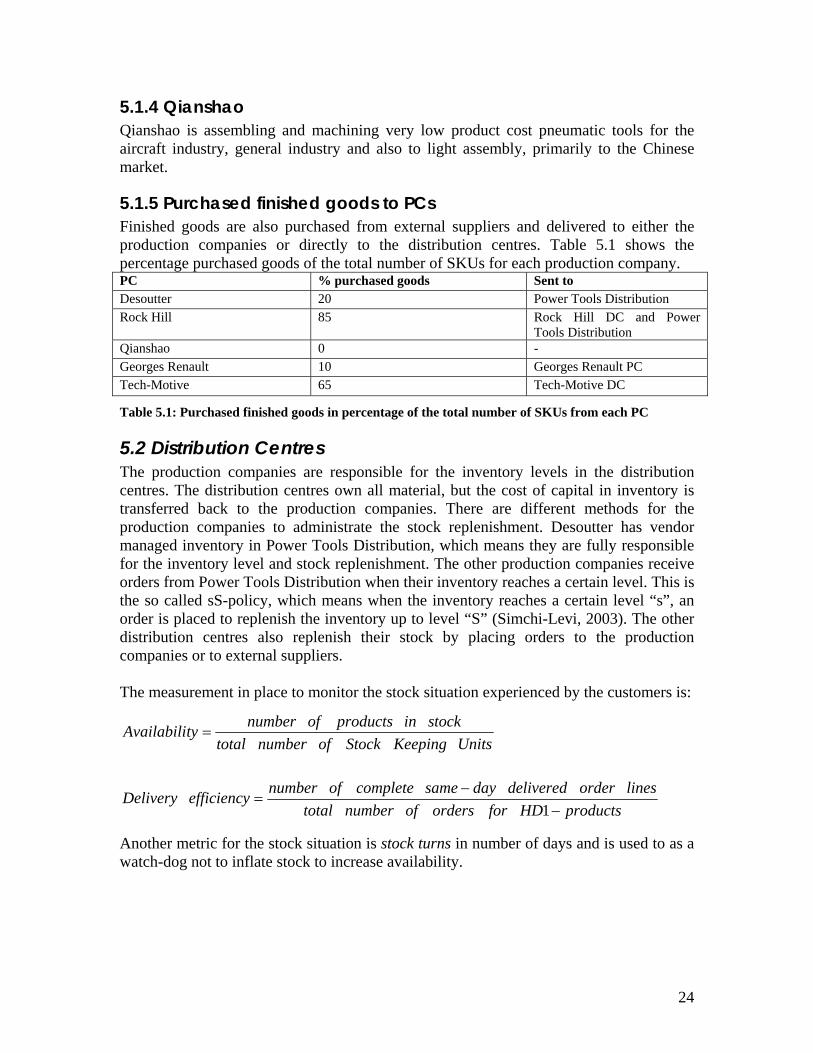
5.1.5 Purchased finished goods to PCs Finished goods are also purchased from external suppliers and delivered to either the production companies or directly to the distribution centres. Table 5.1 shows the percentage purchased goods of the total number of SKUs for each production company. PC % purchased goods Sent to Desoutter 20 Power Tools Distribution Rock Hill 85 Rock Hill DC and Power
Tools Distribution Qianshao 0 - Georges Renault 10 Georges Renault PC Tech-Motive 65 Tech-Motive DC
Table 5.1: Purchased finished goods in percentage of the total number of SKUs from each PC
5.2 Distribution Centres The production companies are responsible for the inventory levels in the distribution centres. The distribution centres own all material, but the cost of capital in inventory is transferred back to the production companies. There are different methods for the production companies to administrate the stock replenishment. Desoutter has vendor managed inventory in Power Tools Distribution, which means they are fully responsible for the inventory level and stock replenishment. The other production companies receive orders from Power Tools Distribution when their inventory reaches a certain level. This is the so called sS-policy, which means when the inventory reaches a certain level “s”, an order is placed to replenish the inventory up to level “S” (Simchi-Levi, 2003). The other distribution centres also replenish their stock by placing orders to the production companies or to external suppliers. The measurement in place to monitor the stock situation experienced by the customers is:
Another metric for the stock situation is stock turns in number of days and is used to as a watch-dog not to inflate stock to increase availability.
25
5.2.1 Transfer Price The distribution centres purchase the products from the production companies to a transfer price. When the customer centres places an order to the distribution centres they have another transfer price. The transfer price exists due to tax regulations for trade between countries. The final price, paid by the customers, is paid to the customer centres. Available profit is shared between the CC, DC and the PC by exercising the transfer price up or down.
5.2.2 Point-of-Sales data and Production Planning In the set up between Power Tools Distribution and Desoutter, Power Tools Distribution sends a daily free-stock file, containing information about the current inventory levels. An analysis to arrive at the required inventory replenishment is then made by the production centre. What has been sold, the Point-of-Sales (POS) data, is also obtained from the free-stock file. When products are sold to specialists, and sometimes also the specialists c.f. 5.3, the POS-data is delayed and fluctuations in demand can only be detected when a new order is placed. In general, the generalists and stockist share very little information about the end-users with the customer centres, since they are afraid of customer loss. The specialists provide more information because they sell customised solutions where both the division and the specialist are involved to create the final product and the fact that they do not stock product to the same degree as the generalists. A bullwhip effect, caused by the lack of information, may appear, especially with the generalists. Bullwhip-effect is when the demand fluctuations in the supply chain increase with the distance to customers (Christopher, 2005). Another problem is that stockists, generalists and sometimes also specialists are placing few but big orders, which makes it more difficult for the distribution centres to plan their inventory levels as well as for production companies to plan and forecast the production. Desoutter uses the POS-data daily, while Chicago Pneumatic, Georges Renault and Tech-Motive use traditional forecasting methods every 1-3 month to plan their production. Qianshao makes a yearly production plan.
5.3 Distribution to end-user There are different ways for a customer to place orders:
o Fax. The customer faxes in a manual order, which the customer centre is manually entering into the system and is then automatically sent to a distribution centre. About 65 % of all orders are received this way.
o E-mail. The e-mail is printed out and the procedure is the same as for fax. About 5% of all orders.
o Telephone. A customer calls their sales representative and this person contacts a customer centre, which enters the order. About 10 % of all orders.
o CP Connect. Customers can also access to the Internet based forum CP Connected in order to buy products, check availability or prices. When customers type in their order manually in CP Connect the order goes automatically to a distribution centre without customer centre involved. About 20% of all orders. There are
26
mainly specialists or generalists using it. CP Connect is only available for users in Europe and America.
o EDI. Some large customers can connect to customer centres' system and then automatically place their orders, without manually entering from either customer or a customer centre. Very few orders are placed this way, since it is expensive to integrate customers system with the customer centres'.
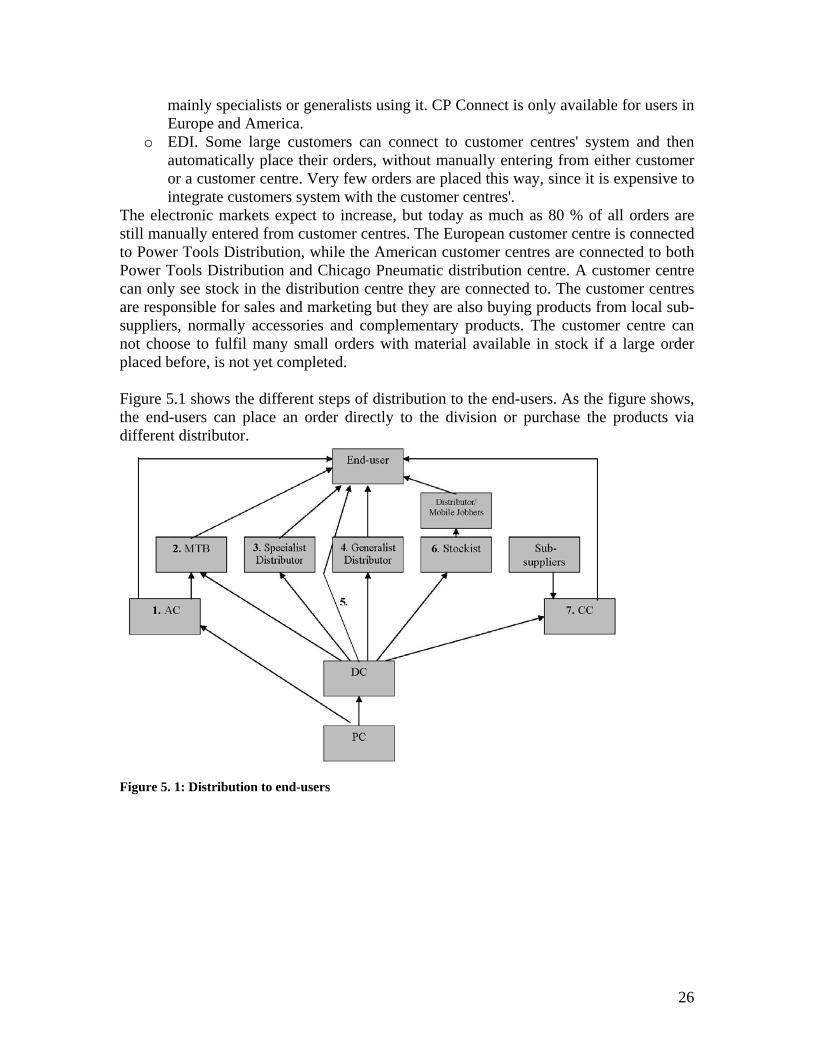
The electronic markets expect to increase, but today as much as 80 % of all orders are still manually entered from customer centres. The European customer centre is connected to Power Tools Distribution, while the American customer centres are connected to both Power Tools Distribution and Chicago Pneumatic distribution centre. A customer centre can only see stock in the distribution centre they are connected to. The customer centres are responsible for sales and marketing but they are also buying products from local sub-suppliers, normally accessories and complementary products. The customer centre can not choose to fulfil many small orders with material available in stock if a large order placed before, is not yet completed. Figure 5.1 shows the different steps of distribution to the end-users. As the figure shows, the end-users can place an order directly to the division or purchase the products via different distributor.
Figure 5. 1: Distribution to end-users
27
1. The production company sends the components to the application centre, where it is assembled into a customer specific product, such as an assembly system.
2. The distribution centre and application centre send products to a Machine Tool Builder (MTB). The MTB assembles advanced customised solutions, similar solutions as the Application Centres do but the MTB is an external customer.
3. The customer procures the products through specialist distributors. The specialists sell customised solutions containing CP's products and carry some stock.
4. The customer buys through generalist distributors, such as catalogue houses, which are selling less advanced products with specified performance. They carry own stock for a longer period than the specialist distributors.
5. Direct delivery from distribution centre to end-user, after an order from a customer centre is placed.
6. The customer purchases via a distributor or a mobile-jobber, who buys via a stockist. The stockist often keeps large stocks, much more than the generalists.
7. The customer centre purchases rare components, which are not produced in any production company, from sub-suppliers. Customer centre can either ship components directly to a customer or assembly them in the customer centre. They can also do the assembling at the customers. This flow is constantly increasing and accounts for about 5 % of all sales.
5.4 Global distribution network Figure 5.2 shows how products are shipped between the plants and the different markets. The only flows of components shown in the figure are between the production companies, all other flows are for finished goods. To facilitate understanding of the different flows, generalists and specialist distributors are both seen as distributors, c.f 5.3, since they distribute products in the same way. There is no direct shipping from production companies to customer: all products go through a distribution centre. In most cases, the production companies are accountable for transportation to distribution centres. The distribution centres and customer centres manage the outbound transportation. All of them use external forwarders.
28
Figure 5. 2: CPD Global distribution network
5.4.1 Georges Renault and Desoutter Production Companies Georges Renault and Desoutter handle their world wide distribution through Power Tools Distribution. Both ship once a day to Power Tools Distribution by truck. Georges Renault also ship customer specific products to an Application Centre in Europe.
5.4.2 Tech-Motive Distribution Centre Tech-Motive production company is in the same building as the distribution centre. Tech-Motive make all their products to order, therefore all products are directly shipped to the customers. The distribution centre only ships to America. If a product is requested in another part of the world, the customer centres need to purchase it back from external suppliers.
5.4.3 Chicago Pneumatic Distribution Centre Rock Hill manages their production and distribution in the same building and materials for production as well as finished goods arrive to the distribution centre. The distribution
CPQ
MTB
GRE
PTD
CPT
RH DC
ATC DEA
Suppliers of finished goods
CPT DC
Stockist
Distributors
MTB
Rest of the World CC present
Rest of the World CC not present
Americas CC present
CPD
Distributors
Distributors
Distributor
CC A/C US A/C Euro
CPQ DC
Stockist
Distributors
29
centre ships to US, Canada, Mexico, and South America: products requested in the rest of the world are shipped to Power Tools Distribution and distributed from there. The North-American market accounts for about 65 % of the total sales, the rest is mainly Europe. 97% of all SKUs from Chicago Pneumatic are available in both Rock Hill and Power Tools Distribution. Chicago Pneumatic ships by sea to Power Tools Distribution 2 times per month, which takes 4-6 weeks. Some delayed products and spares are freighted by air, this happens about once a week. All products to the American market are shipped by truck. The lead time for customers in USA is 2-4 days. Most products from Rock Hill, c.f. 5.1.5, are purchased from external suppliers, of which 95% are located in Asia. Two of the biggest suppliers in Asia, that accounts for 80 % of total purchased goods, drop-ship to Power Tools Distribution.
5.4.4 Qianshao Distribution Centre Qianshao also runs production and distribution in the same building. The tools made in Qianshao are shipped to China, Malaysia, Singapore and Thailand. 97% of their total sales are in Asia. Products from Power Tools Distribution are distributed directly to the eight branch offices or to customers. Average two air shipments from PTD are sent every month, and sporadically airfreight for low weight tools needed urgently. This flow mainly consists of tools and spares, not components. Products from Qianshao requested in the rest of the world are shipped to Power Tools Distribution and Rock Hill Distribution Centre by sea every month, which takes 4-6 weeks. Air freight is used in urgent cases. The lead time for customers in China is one week if the tool is available in Qianshao distribution centre. Components made for Desoutter and Rock Hill are distributed from Qianshao. The products from the distribution centre are shipped to the eight branch offices. The branch offices also carry stock. 90% of all customers buy directly from the branch offices. Another reason for having the branch offices is due to the complicated tax-regulations for distribution between provinces in China. However, the division is working on minimising the stock in these branches.
5.4.5 Power Tools Distribution Power Tools Distribution is a global distribution centre located in Hoeselt, Belgium. There are several Atlas Copco divisions managing their distribution through Power Tools Distribution: Chicago Pneumatic Division, Atlas Copco Tools and Assembly Systems, Construction Tools and A&M Electric Tools. A&M Electric Tools is a division divested in 2005, but stills buys service from Power Tools Distribution. Chicago Pneumatic Division accounts for 10-12% floor space and turnover of 13% in Power Tools Distribution. The distribution centre perform call-offs, warehousing, shipping, customer support and customer adjustments such as kitting and changes. Power Tools Distribution ships across the world, but the major market is Europe. The lead time in Europe is 24-48 hrs and everything is shipped by truck. The lead time to the rest of the world is 48-72 hrs with air freight.
30
5.5 Total cost analysis To be able to understand the current network and propose a new structure, a total cost analysis is done. The total cost analysis gives a hint of the cost-efficiency in current network and the basic conditions for development of a new logistics structure. The logistics costs can also be bench-marked against other divisions within Atlas Copco as well as external companies within the same business.
5.5.1 Delimitations for cost analysis Transportation Network The transportation network to be analysed is shown in figure 5.3, some flows are excluded due to the scope and delimitations of the thesis. However, this delimitation is not affecting the final result adversely.
Figure 5.3: Distribution network to be analysed
Duty The receiver is obligated to pay duty when material is shipped between the duty zones Asia, Europe and USA. If a product shipped over several duty zones, it is possible to reclaim the duty if it was paid more than once. Because of this, it does not matter where the distribution centre is located as long as the source and the destination stays the same. The duty paid for the inbound material is excluded in the current costs and will also be
CPQ GRE
PTD RH DC
ATC DEA
Suppliers of finished goods
Asia Europe America
CPQ DC
31
excluded from the new cost calculations. The duty for the outbound freight belongs to the receiver and is therefore not included in this analysis. Rock Hill is the only distribution centre today, which is reclaiming duty. Power Tools Distribution has a limited flow of material shipped over several duty zones. The reclaim of duty is today only done for tools, but it can be done for spares as well if the flows would increase significant. There will be an extended administrational work when reclaiming duty, but this will not be calculated in the analysis.
5.5.2 Costs in the distribution centres The freight costs are from September 2004-August 2005. The other costs are per year, all costs are measured in transfer price in TEuro. All depreciation is based on Atlas Copco standard. All purchasing is done by the production companies; therefore there is only call-off in the distribution centre. The cost of capital is set to 12%, according to Atlas Copco’s Weighted Cost of Capital (WACC). No distinction will be made between standard and express costs, due to the lack of information. All costs are shown in table 5.2.
32
PTD RH DC CPQ DC Total Administration Management 213 98 32 343 Order handling and invoicing 29 72 101 Forwarding 17 50 67 Inventory and call-off Management 56 47 7.6 111 Total administration costs 315 267 40 622 Warehousing Housing 70 245 2.8 318 Maintenance 42 65 1.7 109 Machines/equipment 44 7.5 52 Warehouse personnel 641 305 3.8 950 Insurance 7.1 2.8 9.9 Total warehousing costs 804 625 8.3 1439 Inventory carrying cost Cost of tied-up capital (WACC based) 1357 772 59 2188 Obsolete stock and slow moving items 573 370 23 966 Insurance for products in stock 14 87 101 Total inventory carrying costs 1944 1229 82 3255 IT System operations and maintenance 141 76 0.6 218 Transportation Transport Insurance 100 100 Packaging Material 103 66 5.3 174 Inbound from external suppliers (finished goods) 5.5 856 862 DES, GRE to PTD 271 271 CPQ DC to PTD 7.0 7.0 PTD to CPQ DC 4.4 4.4 CPQ DC to RH DC 1.6 1.6 RH DC to PTD 150 150 Outbound 1702 675 76 2453 Total transportation costs 2186 1747 90 4023 Total DC costs 5390 3944 221 9555
Table 5.2: Logistics cost in CPD Distribution Centres (in TEuro)
33
5.5.3 Explanation to costs Power Tools Distribution All costs in Power Tools Distribution are gathered by Hans af Sille’n and allocated in the same way as the distribution centre divides the operating costs between the divisions. Power Tools Distribution also manages credit control and order handling with external customers as well as customer adjustment. However, these costs are excluded in the analysis to be able to compare the costs between the distribution centres. The transport insurance is an ETI (Extended transport insurance) and is normally taken in order to cover the different product value to the standard conditions given from forwarders. Chicago Pneumatic Distribution Centre The distribution centre is estimated from Rob Kendrick to account for 18% of total building space. The insurance for the warehouse is included in the housing cost. The insurance for the products in stock covers the products whether they are transported or kept in inventory and it is not possible to separate them. The inbound transportation costs are only for products from externals suppliers, since the distribution centre is in the same building as the production. Approximately 58% of the costs from external suppliers are freight; the rest is duty and handling fees (fees to handle paperwork and legislations from the ports, ships and transporters), which is excluded in the costs. The freight costs and weight does not include the material from the customer centres in Brazil and Chile, since this is a very small flow and the numbers difficult to obtain. Qianshao Distribution Centre The costs from Qianshao are only for the distribution centre (head office). All costs are gathered by Thomas Dahlgren and Tina Ding. The costs for management includes order handling, invoicing and forwarding. The costs for the inventory and material handling in the branch offices are excluded, since this is beyond the scope. The distribution centre is approximated to account for 5% of total costs for management cost, housing, maintenance and IT in Qianshao. There are no machines used in the distribution centre and no insurance for products in stock or for transportation.
5.5.4 Efficiencies in the distribution centres To be able to compare the costs in the different distribution centres, the operating costs (administration, warehousing and IT) need to be divided after a common denominator. The denominator should be the cost driver for that activity. Considered cost drivers are:
o Weight (kilograms) handled in the distribution centre. If the relationship between numbers of sold tools, spares and accessories are approximately the same for all distribution centres, then weight is a good cost driver for all operational activities. However, table 5.3 shows that the relationship is uneven, so this key can not be used. The relationship tools, spares and accessories in the table shows how many spares and accessories there are for one tool. The number of spare parts in Qianshao includes both spares and accessories.
34
No of units sold/year PTD RH DC CPQ DC Tools 336000 605911 57529 Spares 932000 1113998 635813 Accessories 589000 1647 Relationship tools/spares/accessories 1/2.7/1.8 1/1.8/0 1/11
Table 5.4: Number of tools, spares and accessories sold each year from each DC
o Number of tools handled in the distribution centre. This will not reflect the material handling, since there is an uneven relationship tools, spares and accessories between the distribution centres.
o Product Cost (VK in Atlas Copco nomenclature) value in the distribution centres. The VK-value is the sum of direct manufacturing costs and direct wage, material overhead and processing overhead and reflects the volume and the value in the distribution centre. This key will be used to divide the management costs and all fixed costs such as housing, maintenance, machines/equipment, insurance and IT-costs. This key may benefit the distribution centres with high value products, but after discussion with the distribution centres as well as other stakeholders, this key is still considered to be the most suitable one to use.
o Order lines per year in the distribution centres. This is a cost driver for material handling and is used to divide the labour based costs, such as order handling and invoicing, forwarding, inventory and call-off management and warehouse personnel. Order lines are the most detailed measurement for material handling today.
Table 5.5 shows the results when dividing all costs using the VK-key and order lines-key to measure efficiency in the distribution centre. All numbers are in Euro.
Cost/ DC PTD RH DC CPQ DC Administration Management (VK-key) 2.9625*10-3 2.66033 *10-3 8.5135*10-3 Order handling and invoicing (Order lines key) 9.877106*10-2 36.42029*10-2 Forwarding (Order lines key) 5.832393*10-2 25.291868*10-2 Inventory and call-off Management (Order lines key) 1.9153716*10-1 2.3673189*10-1 2.518558*10-1 Warehousing Housing (VK-key) 9.7639*10-4 66.6304*10-4 7.568*10-4 Maintenance (VK-key) 0.0005.8333*10-4 17.7174*10-4 4.595*10-4 Machines/equipment (VK-key) 6.0556*10-4 2.038*10-4 Warehouse personnel (Order lines key) 2.21078751 1.54179228 0.1259279 Insurance (VK-key) 9.8611*10-5 7.608*10-5 IT System operations and maintenance (VK-key) 1.95278*10-3 2.05435*10-3 0.1622*10-3
Table 5.5: Cost per order line and VK-value
It is not be possible to draw any conclusions of the total value of operations, since different keys have been used. However, we can conclude that; - the administration is more cost efficient in Power Tools Distribution than Rock Hill, - housing and maintenance are most expensive in Rock Hill,
35
- the largest difference between the distribution centres is in the labour intense post warehouse personnel, where Qianshao provides the undisputable lowest cost for labour. The costs for machines/equipment and insurance in Qianshao expect to be in place when the operation increases in size.
5.6 Other modelling aspects
5.6.1 Future The present situation as well as the future must be considered when creating new distribution models. More detailed data will be used when modelling, but some guidelines for the future in Chicago Pneumatic Division are:
o More acquisitions to gain market share o Market growth: Europe 8%, North America 15% and Asia 25% annually. o Products from each production companies are sold in more markets.
5.6.2 Lead time Depending on how customers value lead time, some basic prerequisites for the distribution network are set. If the lead time is considered crucial, the current lead time will be a limiting factor when modelling. If the lead time can be extended without customer loss, the modelling can be less restricted. The experienced lead time to customers is from when they place an order until they receive their goods. The activities that take place between are order handling, picking, packing and the shipping from distribution centre to customer. When investigating the importance of the lead time, it is important to have in mind that the five different customer segments in Chicago Pneumatic Division; Vehicle Service, Land Transportation, Air and Spacecraft, Light Assembly and General Industry, are most probably valuing lead time different. The importance of lead time depends on the type of business, the type of product (commodity or specialised), if they customers pre-order and if they keep own inventory or not. The vehicle service customers in USA; Stampede, Hoosier Tools and Arizona Rubber, considered Chicago Pneumatic Division as one of the best when it comes to lead time and reliability. The lead time is not of high importance, since they all are stockists and place their orders in advance and keep own inventory. IDG, another vehicle service customer in USA, believes Chicago Pneumatic Division has a standard lead time compared to its competitors and considered reliability as the biggest problem. Smaller specialist distributors in USA, such as Discount Tire, also places order in advance and considered service instead of lead time the most important. A land transportation customer and specialist distributor in England, Midlands Air Tools, considered the lead time as very important. The same holds for Cromwell Tools, a generalist distributor in UK, in the land transportation segment. Looking at 2005 Customer Satisfaction Survey for the European market, it reveals average satisfaction from customers when it comes to delivery. The deliveries are often complete and accurate but reliability is a bigger problem. The reason for this is the 2004
36
problem with long and inaccurate lead time from plant, due to a production move from France to the UK. Lead time to customers is not a part of the survey. In conclusion, the brief investigation of the customers to Chicago Pneumatic Division gives no obvious answer about the importance of lead time. Hence, the lead time will not restrict modelling so far. If the new distribution models result in a longer lead time, the division needs to make further investigation about customer aspects on lead time and how that should be valued.
5.6.3 Environmental aspects When modelling a sustainable logistics structure, the impact on environment is an important factor to consider. There are several stakeholders demanding a sustainable environment, where negative environmental effects are reduced. Customers play a major role, but also non-governmental organisations, laws and regulations influence the companies as well as internal policies. Since Chicago Pneumatic Division produces indirect material used in industrial production, there is less environmental demand from customers on this material than direct material. According to Anna Brandhorst-Satzkorn, environmental manager at Atlas Copco, laws and regulations are most restricting in the way distribution is handled today. She also considers Atlas Copco’s environmental policy to have an impact. Atlas Copco considers itself to be the leader in environmental practise in its industry and their environmental policy also includes distribution: “When developing products and services, Atlas Copco tries to understand, address, and minimize the negative environmental effects that the products and services may have, when being manufactured, distributed, and used, as well as at their disposal.” The production companies are required to follow up on the policy and all transportation are reported internally to the head quarter. It is measured the tonne kilometres air freight, rail, land- and sea transportation but also what fuel that is used for the trucks. Based on those numbers, CO2 emission is calculated. Reporting every year is compulsory, but every quarter is recommended.
5.6.4 SAP Georges Renault and Desoutter are going live with SAP January 2 while Chicago Pneumatic goes live on January 9. Power Tools Distribution went live February 2004. Consideration to further acquisitions and new structures were taken in the design phase of SAP and therefore the current solution permits flow from production company to production company, production company to distribution centre and distribution centre to distribution centre, i.e. all possible flows in future network.
37
6 Bench-marking Benchmarking is the process of comparing performance against that of others in an effort to identify areas for improvement and receive new ideas. According to Hackner and Kleiner 2000, a benchmarking study consists of four phases: planning, analysis, integration and action. In the planning phase, it is determined what to benchmark and what key performance indicators to use. It is important to seek partners with analogue values, or to clarify the differences to avoid misinterpretations of the results. The data collection also takes place in the planning phase. In the next phase, the analysis, the possible performance gap between your company and the benchmarking partners needs to be understood. The next step is to establish functional goals and implementation plans, which is part of the integration phase. The new processes are implemented and monitored in the last action phase. The benchmarking process in this thesis includes the planning phase and the analysis phase. The results from the analysis phase will be used in the modelling section, to understand limitations and possibilities in the present distribution and production structure. Many interesting factors along the supply chain affect the total result and success. The scope of the thesis starts from the flow of finished goods from manufacturing units to customers; therefore the benchmarking studies will focus on this part of the supply chain. The main questions studied are: Distribution networks:
o How is the production managed? o How many production units are there and where are they located? o What products are produced where? o Are the products made to order or to stock?
o How is the distribution managed? o How many distribution centres do they operate and where are they
located? o How is it decided what products to store where?
o What are the underlying reasons for the current design? o How long is the internal lead time? o What lead time do they have to their customers? o How has the lead time to customers changed?
Supply Chain Measurements o What different measurements are used to evaluate the performance in the supply
chain?
6.1 Atlas Copco Tools and Assembly Systems Atlas Copco Tools and Assembly System (ACTA) is the sister division in the business area Industrial Technique. All information regarding ACTA bases on an interview with Gösta Henningsson. ACTA produce hand-held electric and pneumatic tools as well as assembly systems. This corresponds to the products from Chicago Pneumatic Division, except from that ACTA produces a larger proportion of electric tools, which account for a higher value than the pneumatic tools.
38
Their main customer segments are automotive and general industry and the customers are located world wide. ACTA is about three times the size of Chicago Pneumatic and have had a pure organic growth without acquisitions for nearly twenty years. In 1980 ACTA consisted of seven manufacturing plants and the production schedule was based on quarterly forecasts. The internal lead time was three months, which made it necessary to have inventory in each plant. The distribution from production companies to customers were handled by the customer centres. The restructure started by transferring all the local inventories to one central warehouse in Skara. The shipments from Skara warehouse were then shipped consolidated over the border, in order to avoid customer clearance. After it left the border, the packages were split out and distributed to the customers by the customer centres. When the implementation of a central warehouse got accepted by all parts, the warehouse started to manage all distribution all the way to the customers. The next step was to restructure the production, since they consider it impossible to achieve more efficient distribution without a better organised production structure. From 1980-1988, seven production plants were consolidated into two and the production control was changed from push to more pull-mode. However, it is not a pure pull system, since products are still made to stock. This led to a shortening in lead time from 16-20 weeks to 2-3 weeks and increased delivery efficiency, from 70% to 90%. The total inventory value decreased from 60% of Net invoiced sales to 28%. However, a warehouse in Skara is not optimal for transportation to Europe and it was therefore decided to build a central warehouse in Belgium. Power Tools Distribution was opened in 1992 by ACTA and other Atlas Copco divisions, such as A&M Electric Tools and the European acquisitions in Chicago Pneumatic Division. All shipments from Power Tools Distribution to customers in Europe were delivered within 24-48 hrs and to the US within 72 hrs. It was not possible to do any differentiation in lead time in this solution, since that would affect the scale of economy. Today, with further improvements, ACTA have 13% of net invoiced sales tied up in inventory. In the late nineties, many competitors decided to have distribution centres in America, to reduce their lead times to customers there. ACTA did a research in 2002, whether a distribution centre in USA was needed or not. After an analysis of customer demand on lead time in the US, the proposal was rejected so all products to America is still air freighted from Power Tools Distribution. A similar research for the Asian market was done a few years after, and it was concluded that a distribution centre there was needed. The products stored in the distribution centre in Shanghai are larger assembly system and shipped there by sea in large containers. Since ACTA have a centralised distribution structure, it is interesting to analyse how much they have tied up in inventory compared to Chicago Pneumatic Division. ACTA have in total 100 days in inventory, compared to Chicago Pneumatic Division’s 115 days.
39
This includes all material in the customer centres, in the production companies and distribution centres. The number of days in inventory depends on lead time from suppliers and production, demand uncertainty, service level and of course the logistics structure, c.f 4.3. To be able to do a comparison, it will be assumed that the service level and demand uncertainty is the same for both. Nevertheless, the lead time from suppliers is longer for Chicago Pneumatic Division; one third of their suppliers have a lead time on three months, while ACTA has a standard lead time of two weeks. Because of this, it will not be possible to draw any unambiguous conclusions of the effects of a decentralised structure from the number of days in inventory, but it is noticed that the difference is relatively low with consideration to the lead time from suppliers.
6.2 Dell Dell offers custom configuration of personal computers, portables and servers. They started in 1984 and have today three manufacturing plants in Ireland, USA and Malaysia. All plants produce similar product, all built to order. The internal lead time for assembly is five hours. Dell has a direct business model, which means the customer buys directly from Dell without involving any retailer. All these factors; similar products in all production plants, the importance of a short lead time and the concept of build to order, makes it possible to Dell to have a direct distribution to their customers. Only customised products are made by Dell, hence the production of speakers, monitors and other standard peripherals are outsourced. These suppliers are required to have 15-20 days of inventory in merge hubs located in suitable places. There are nine merge hubs in Europe. There are also hubs for the incoming components to Dell, located only five minutes away from the production plants. This system is in place because most suppliers are located in Asia and can not deliver from there within the time frames required by Dell. There has been discussions and analysis whether the customers should receive two shipments; the computer from Dell and the monitors and speakers from sub suppliers, or if they should receive a consolidated shipment. The result was consolidated shipment for all customers in Europe and split shipment for the American market. To manage the consolidation in Europe, there are different sortation centres run by Dell. The sortation centre has only a cross-docking function and no inventory is kept there. Figure 6.1 shows the flow.
40
Figure 6.2: Material flow for Dell
Dell has several measurements for their supply chain. A major measure they use for distribution is “cost-per-box”. All products are divided into product categories, but no further breakdown is used. All information regarding Dell is from Stephen O’Mullan, logistics manager at Dell.
6.3 Electrolux Electrolux is one of the world’s largest providers of appliances and equipment for kitchen, cleaning and outdoor use, for both personal and professional use. They consist of two business areas; Indoor products (white goods and floor care products) and Outdoor products (garden equipments). The products are sold under many different brands, for example AEG, Jonsered and Electrolux. All information about Electrolux is based on information on their homepage and interviews with Torkel Elgh, Former Vice President Electrolux Logistics AB. Electrolux customise their distribution after customers and products. They have a wide range of distribution structures; from echelon inventory structure with suppliers, warehouses and retailers to vendor managed inventory (VMI). VMI are often applied by the large retailers such as Dixon and B&Q. Electrolux are responsible for the products in their showrooms and inventory and the replenishment lead time is only a few hours. In return they get immediate Point-Of-Sales data, which leads to improved supply planning. Electrolux has production units all over the world and all products are available for all markets, but the products are often specific for a market. The products are heavy, which leads to a low cost per kilo. The stocking locations are located in order to avoid air freight and to be able to use the least expensive freight. Approximately 50% of all transports are by rail and the rest is by trucks. Air freight is used very seldom. There are three distribution centres in Sweden, with different assortment of products. These distribution centres act as Regional Centres and manage orders from all kinds of business units. Electrolux also runs a cross-docking hub, where the products from the three distribution centres are consolidated. Only packages over 12 m3 are direct delivered from the distribution centre. As a general rule the customers will never receive more than two shipments.
Suppliers Hub Dell
Sortation centre
Customers
Merge hub
Materials ordering cycle: 10-20 days
Customer fulfilment cycle: 2-5days
41
This is not the only distribution structure in Sweden. Some customers, for example El-Giganten, receive all products made to order and keep their own inventory. Another example of distribution is the hub Electrolux manages for one of their customers (OnOff). All incoming goods from different suppliers and Electrolux are coordinated with the outbound flow to all retail stores. Electrolux has created a special distribution structure to manage spare parts. The delivery time to customers today 24 hours and is considered as very important. Three distribution centres are set up in Europe. All these centres have the same order system and replenishment policy. To be able to deliver within 24 hours and avoid the most expensive freight, all products are available in all distribution centres. This means that the production units and external suppliers supply all three. When a spare part is ordered, the availability in the closest distribution centre is checked and if the product, contrary to expectation, is not available there, the order is sent to the second closest distribution centre. There are many different products, both value and volume wise, in Electrolux’s distribution centres. To evaluate the efficiency they have developed different keys; for example they measure how many order lines that are shipped per day to compare the outbound shipping. But since the products are different and require different handling and storing, only distribution centres with similar products are compared.
6.4 Benchmarking analysis There are several findings which will be useful when modelling new distribution models for Chicago Pneumatic Division. ACTA’s consolidation of production units enables an efficient supply to a central warehouse. All the production companies in Chicago Pneumatic Division manufacture different products available on all markets even though the largest market for each production company is the local market. Nevertheless, this will lead to very high inbound costs if CPD is to centralise the distribution. The products from Dell are also available on all markets and a short lead time to customers is crucial. Dell has manufacturing units on the different markets, producing the same products. This leads to a fast relatively inexpensive delivery to customers. Dell also makes all their products to order, which eliminates the need of a distribution centre and an inventory of finished goods. This is a very important point that must be taken into account for future distribution for Chicago Pneumatic Division <very important point, maybe you could highlight even further.>. The hubs that Dell uses for consolidation of packages are also interesting. If Chicago Pneumatic Division would have each product stored in only one distribution centre, the need for a consolidation hub must be analysed. None of Electrolux’s products can carry air freight, and are therefore stocked in distribution centres in each market. They try to reduce the inventory costs by having one product in only one distribution centre per country but if the required lead time to
42
customers can not be met without express freight, the product will be stored in several distribution centres. Chicago Pneumatic Division also needs to analyse if their products can carry air freight, which will decide whether a product should be stored in one place or several.
43
7 Distribution Models All possible distribution models, from centralisation to decentralisation, are analysed in order to see where the possible cost savings occur or other beneficial consequences. The flows from external suppliers in all figures below are only for Rock Hill products.
7.1 Model 1: One distribution centre The distribution modelling starts by analysing a centralisation of all distribution activities, which is illustrated in figure 7.1. Power Tools Distribution will be the only distribution centre considered when analysing the possibilities for one central distribution centre supplying all markets. This is due to:
o Outbound transportation: The majority of Chicago Pneumatic Division’s market is in Europe (56%) and therefore Power Tools Distribution will give the lowest outbound transportation costs of all distribution centres.
o Inbound transportation: Desoutter and Georges Renault, which together account for annual sales on 69MEuro, are both located in Europe. Rock Hill in America has an annual sale of 50MEuro, of which 85% arise from products purchased from suppliers located in Asia. The transportation cost is approximated to be the same to Europe as to America; hence only 15% of the inbound transportation from Rock Hill will be affected if moving the operation. The Asian market accounts for only 6% of the total annual sales. This is predominantly products from Qianshao.
Figure 7.1: Model 1
CPQ GRE
PTD RH DC
ATC DEA
Suppliers of finished goods
Asia Europe America
CPQ DC
44
7.2 Model 2: Two distribution centres There are six different combinations of consolidating the three distribution centres into two: 1) Rock Hill to Power Tools Distribution To move the distribution from Rock Hill is analysed in model 1. 2) Qianshao to Power Tools Distribution This alternative is also analysed in model 1. 3) Power Tools Distribution to Rock Hill The reasons for consolidating these two into Rock Hill would be that Rock Hill distribution centre is more cost-efficient and that the inventory reductions are balancing the increased freight costs.
o Looking at section 5.5.6, we can conclude that Rock Hill in general is not more cost efficient than Power Tools Distribution.
o The inventory savings is less than in model 1. The inventory reductions due to consolidation are the same, but the longer lead time due to sea freight makes the inventory increase larger than in model 1, since the products from Desoutter and Georges Renault are the highest value added products.
o Another important aspect is that the current lead time to customers in Europe is 24 hours for products from Power Tools Distribution, which is impossible to accomplish from America.
The total inventory savings are low and there are no cost savings for material handling, which makes it very difficult to justify the increased freight cost. Because of these reasons, moving Power Tools Distribution to Rock Hill is not considered feasible.
4) Qianshao to Rock Hill These two distribution centres have no overlapping inventory; hence there are no possible inventory reductions to achieve. The only reason for moving Qianshao to Rock Hill is to achieve economy in scale. However, these possible cost savings will never justify the increased freight costs, since 85% of the CPQ products go to the Asian market. 5) Power Tools Distribution to Qianshao These two distribution centres have no overlapping inventory and most products from Power Tools Distribution are sold on the European market, which leads to very large transportation costs. To move the distribution to Qianshao will not be further considered. 6) Rock Hill to Qianshao If Rock Hill distribution moves to Qianshao, their external suppliers must ship directly to Qianshao. The products from suppliers in Asia account for 85% of the weight from Rock Hill. If these products are handled from Qianshao distribution centre, it opens up new possibilities for the products assembled in Rock Hill. These products can either be handled in Qianshao together with the purchased products, or it can be handled in Power Tools Distribution. Given that more customers of Rock Hill produced products are located in Europe, 20 % compared to a few percentage in Asia, Power Tools Distribution is preferred over Qianshao. In conclusion, the alternative when all products from Asian
45
suppliers go through Qianshao and the Rock Hill produced products go through Power Tools Distribution will be the only one considered alternative when calculating costs for two distribution centres. This is shown in figure 7.2.
Figure 7.2: Model 2
7.3 Model 3: Three distribution centres When consider the alternative to have three distribution centres, the question is whether a product should be available in all distribution centres in the markets where it is sold or if a product should be stocked in only one distribution centre and distributed from there to all markets. This is a balance of inventory costs versus freight costs. If a product is available in one distribution centre, it needs to be air freighted to all international customers in order to meet required lead time. If the product is available in several distribution centres, it can be freighted by sea between the centres, which is less expensive than air freight. But this alternative results in a larger inventory, due to multiple stocking locations and longer inbound transportation. In general, high value products lead to larger costs of inventory and one stocking location is often preferred. Low value products are less expensive to keep in inventory and the least expensive freight can be chosen and the products are stored in multiple stocking locations. Both alternatives will be analysed in the models below.
CPQ GRE
PTD RH DC
ATC DEA
Asia Europe America
CPQ DC
Suppliers of finished goods
46
7.3.1 Model 3a This model implies several stocking locations for one product, see figure 7.3. The customers will receive only one shipment, since the three distribution centres supply their own market. The only differences from the present situation are:
o Products from Desoutter and Georges Renault are shipped to Power Tools Distribution and from there to Rock Hill and Qianshao
o Products from Rock Hill are shipped to Qianshao
Figure 7.3: Model 3a
CPQ GRE
PTD RH DC
ATC DEA
Asia Europe America
CPQ DC
Suppliers of finished goods
47
7.3.2 Model 3b In this model, a product is only stored in one distribution centre and is shipped from there to customers across the world, see figure 7.4. If a customer orders products from different distribution centres, they will receive split shipment.
Figure 7.4: Model 3b The products can be stocked in a distribution centre close to where they are manufactured or close to where they are sold. The products manufactured by the production companies are mainly sold in the same market as they are produced. This is also the case for most material from external suppliers. The Rock Hill products purchased from suppliers in Asia is the main exception. The closest distribution centre to where they are manufactured is Qianshao and to have them stocked here will be analysed in model 2. However, to avoid the large cost of air freight in this model, these products will be stocked in Rock Hill. In conclusion, all products are stored in the distribution centre closest to where their largest markets. A direct distribution, where the products are distributed from the production companies directly to the customers is another option. The products needs to be air freighted to all customers, as in model 3b. The products are then made to order, instead of made to stock as today. Whether the production companies are able to make the products to order is not a part of the thesis and the option of having a direct distribution is up to the division to consider if they decide model 3b is of interest.
CPQ GRE
PTD RH DC
ATC DEA
Asia Europe America
CPQ DC
Suppliers of finished goods
48
8 Data gathering and assumptions A total cost analysis will be done for each model in order to find the most cost efficient structures. This section explains general rules and calculations used to perform the total cost analysis. 8.1 Operating Cost Administration, warehousing and IT are all part of the operating costs. All these costs in the current structure have been divided per unit using different keys, depending on cost driver c.f 5.5.6. The new operating costs will be calculated by using the cost per unit (order lines or VK-value) in the distribution centre and multiply it with the new capacity. Examples how the different keys are used are shown below:
8.2.1 Cost of tied up capital The size of the inventory is dependent of the network structure. Two factors, which influence the size of the inventory is considered:
o The inbound transportation mode o The number of stocking places
Inventory changes due to inbound transportation mode The longer inbound lead time, the larger inventory is needed to balance demand fluctuations and to maintain the same service level. The lead time will have an impact on the average inventory level. The average inventory level is calculated:
stockSafetyQlevelinventoryAverage +=2
The Economic Order Quantity (EOQ) model shows how the optimal reorder quantity Q is calculated:
hKDQ 2
= , where
K= fixed setup cost D= constant demand of D items per day h= inventory carrying cost per unit per day According to Simchi-Levi (2003) the lead time affect the safety stock with the square root of the lead time. The rest of the inventory will also be affected, since the order quantity increases. It will be assumed that it increases with approximately half the lead time, which is 20 days. Inventory change due to the number of stocking locations The change in safety stock due to the number of stocking locations can be calculated by using the square-root formula, c.f 4.5.5. The square-root formula is only valid if the coefficient of variation and the correlation between different markets is the same for all
49
inventories, which means we can only apply the formula for the value of the Rock Hill products stored in both Rock Hill and Power Tools Distribution. The inventory levels for the rest of the products are unaffected when reducing or increasing the number of stocking locations. Present value of inventory and safety stock Table 8.1 shows the value of the products from the production companies in each distribution centre. Value of inventory in DC/ products from PC
DEA, GRE ATC CPQ Total in DC
PTD 7100 4200 11300 RH DC 6400 6400 CPQ DC 520 520
Table 8.1: Value of the present inventory in T Euro
The value of the safety stock can be determined by:
daysofnoinstocksafetyaveragedaysofnointurnsStock
inventoryofValuestocksafetyofValue *=
The average safety stock and stock turns in number of days, for the products from different production companies in different distribution centres, are shown in table 8.2. Average safety stock in no of days/products from PC DEA, GRE ATC CPQ 21 35 28 Stock turns in no of days in DC/ products from PC DEA, GRE ATC CPQ PTD 48 90 RH DC 55 CPQ DC 115
Table 8.2: Average safety stocks and stock turns in number of days
The calculated values of the safety stocks, for the products from different production companies in different distribution centres, are shown in table 8.3. Value of safety stock/ products from PC
DEA, GRE ATC CPQ Total in DC
PTD 3106 2450 5556 RH DC 4073 4073 CPQ DC 127 127
Table 8.3: Value of the safety stocks in T Euro
8.2.2 Obsolete stock and insurance The exact impact on the obsolete stock depending on the network structure is difficult to estimate. It will be assumed that the obsolete stock in Rock Hill decrease by 20% when centralising the stock, which is in model 1 and 2. Since the inventory values are changing in all distribution centres in model 3a and 3b, the value of the obsolete stock will change according to the inventory level. It will be large differences in insurance cost between the models, depending on if the insurance in Rock Hill is in place or not. This insurance cost is fairly high and also includes products while transported. All insurance cost is based on the inventory level. Qianshao does not have insurance, which is considered necessary if
50
the volume increases. Therefore, their cost for insurance is based on Power Tools Distribution’s rate.
8.3 Transportation
8.3.1 Transportation insurance and packaging material The cost for transportation insurance is the same in all models, since it is the same value of products shipped in all models. The cost for packaging material is not depending on the network structure and will therefore stay the same.
8.3.2 Transportation costs Transportation modes The inbound transportation is sea or land in all models. This is the most inexpensive transportation mode and the only one considered in this analysis, since to air freight products to all distribution centres largely exceeds the present costs. Also, it is not financially justified to choose a faster and more expensive transportation to a destination where the products are stored for a longer period. Sea freight can not be used for the outbound transport, since the current lead time to customers is about one week and sea freight takes 4-6 weeks. Therefore, all products are air freighted to international customers. Freight calculations All destinations must be aggregated to be able to calculate the new transportation costs within the time frame given in this project. Only one destination per continent will be used for calculating the cost of sea or airfreight. This destination is in most cases the distribution centre, since these rates are applied in the present situation are therefore easier obtained. Australia and Africa are not large markets and will therefore be split between the European, American and the Asian market. To be able to compare the new costs with the present transportation costs, the delivery from the distribution centres all the way to the customers must be added to the new costs. The rates used for calculating land transport within the same continent are calculated for each distribution centre:
These rates consist of a combination of standard and express costs. In reality, the products will go directly to customers without crossing the distribution centre, which will be less expensive. To give an example of the transportation calculations, the freight from Rock Hill to customers in Asia is:
CPQ) Asia fromate within average r to Asiaght per kg (air freid in Asiaoducts sol% of RH prm RH weight fro Outbound to Asia t from RH Freight
+∗∗=cos
When comparing the costs for the new models with the current costs, one must be aware of the fact that there are more express costs in the current structure than in the new models. The only express cost in the new models is the average rate for land transportation to customers in the same continent
51
Weights and destinations Table 8.4 shows how much, in percentage, of the total weight from each production company that is sold in respectively market. This data is based on the weight to the different continents today and is gathered from the distribution centre. Note that this relationship is somewhat different than the NIS divided between the continents, depending on that the continents order products in different price ranges but with the same weight. Markets/PC DEA, GRE ATC CPQ Europe 80 8 10 America 15 87 8 Asia 5 5 82 Total 100% 100% 100%
Table 8.4: Market share in percentage of total weight from each production company
Table 8.5 shows the outbound weight from each distribution centre, provided from the distribution managers. The weight from the distribution centre also includes the external suppliers of finished goods. The weight from Power Tools Distribution is from Desoutter and Georges Renault but it also contains the products from Rock Hill sold in Europe and Asia, which accounts for 225844 KG.
Table 8.5: Outbound weight from the distribution centres
Transportation rates All rates are shown in Appendix 2. The rates between Qianshao and Rock Hill are gathered from FedEx, based on the Rock Hill account. All other rates are from Conny Bervoets, Power Tools Distribution. The gathering of freight rates shows that distance and weight are cost drivers, but also the source and destination. For example, to ship products from Asia to America is very expensive since Asia is the largest export continent and America the largest import continents, according to Conny Bervoets. Another example is that it is three times more expensive to air freight products from Europe to Qianshao as Shanghai. However, it will not make a significant difference to use the rates to Qianshao or Shanghai in the models, since this is a relatively small flow in all models. All costs for sea freight is given per container and the calculation of how many kilos that is in one 40’ container is shown in Appendix 3.
DC PTD RH DC CPQ DC Outbound weight 926 Tonnes 1 691 Tonnes 149 Tonnes
52
9 Total cost analysis
9.1 Operating costs The operating cost in T Euro, in each model is shown in table 9.1. Operating cost in T Euro Current structure Model 1 Model 2 Model 3a Model 3b Administration Management 343 333 527 355 335 Order handling and invoicing 101 51 32 108 129 Forwarding 67 30 19 73 88 Inventory and call-off Management 110 99 111 112 115 Total administration costs 621 513 689 648 667 Warehousing Housing 318 110 102 364 470 Maintenance 109 66 61 118 141 Machines/equipment 51 68 54 48 40 Warehouse personnel 949 1144 731 905 877 Insurance 9,9 11.1 10.3 9.9 9,3 Total warehousing costs 1437 1399 959 1445 1537 IT System operations and maintenance 217 220 157 213 220 Total 2275 2132 1805 2306 2424
Table 9.1: Operating cost in all models Table 9.1 shows that the administration in Power Tools Distribution is the most cost efficient and a centralised distribution will therefore provide the lowest cost for administration. Warehousing is labour intensive, which is inexpensive in Qianshao. This makes model 2, where the products from suppliers in Asia are managed by Qianshao, most beneficial when looking at the costs for warehousing. The IT costs are relatively small, but Qianshao has the lowest cost for IT, which can be seen in model 2. In total, model 2 contributes with the lowest operational costs, due to the very cost efficient warehousing.
9.2 Inventory costs The inventory costs in T Euro, for the different models are shown in table 9.2. Costs/Structure Current structure Model 1 Model 2 Model 3a Model 3b Cost of tied-up capital (WACC based) 2187 2236 1839 2450 1844 Obsolete stock and slow moving items 965 891 891 1065 830 Insurance for products in stock 101 23 30 130 101 Total inventory carrying costs 3253 3150 2760 3645 2775 Table 9.2: Inventory costs in all models Model 1 can reduce inventory due to centralisation, but there will also be an increase in the inventory to balance the longer lead time for products shipped from Rock Hill and Qianshao to Power Tools Distribution.
53
Model 2 will have a similar reduction in safety stock, since the Rock Hill produced products are only available in Power Tools Distribution and the purchased products only stored in Qianshao. The safety stock reduction is therefore the same as in the centralised model, although it is divided between the two distribution centres (15% in Power Tools Distribution and 85% in Qianshao). There will also be a decrease in inbound lead time from external suppliers to Qianshao, which makes it possible to further decrease the inventory. Model 3a is the only model where the inventory costs increase, since the number of stocking locations for products from Desoutter and Georges Renault increases from one to three. These products are also sea freighted between the distribution centres, which further increase the inventory level. The Rock Hill products that was stored in Power Tools Distribution are now also stored in Qianshao. Also the obsolete stock will be affected by the risk pooling effect when centralising. Model 3b leads to similar inventory savings as in model 2. This inventory savings are due to that all products are stored in only one place and are air freighted to all customers. The Rock Hill products from Asia are still freighted by sea. The largest reduction in the obsolete stock appears in model 3b, since that is dependent on the inventory size. The large changes in insurance cost depends on if the Rock Hill insurance is used or not. In reality, the differences between the models are smaller, since the Rock Hill insurance covers both products in inventory and while transported.
9.3 Transportation costs The transportation costs are shown in table 9.3. All costs in T Euro. Structure Current Structure Model 1 Model 2 Model 3a Model 3b Transport Insurance 100 100 100 100 100 Packaging Material 174 174 174 174 174 Inbound from external suppliers 861 861 91 861 861 DEA, GRE to PTD 271 271 271 250 271 CPQ DC to PTD 7 29 7.0 PTD to RH DC PTD to CPQ DC 4.4 5.9 CPQ DC to RH DC 1.6 1.6 RH DC to PTD 150 243 117 137 RH to CPQ 13 Outbound 2452 6283 11925 2017 3132 Total 4021 7961 12678 3567 4538
Table 9.3: Transportation costs in all models
The transportation costs are very large in model 1, due to the fact that 85% of the total weight from RH goes to America and 82% of the weight from CPQ goes to Asia.
54
In model 2, all products from CPQ, including the RH products from suppliers in Asia, are air freighted to all customers world wide. Since RH products are mostly sold in America, it will be a large volume of products air freighted to America. Asia is the largest export continent and America the largest import continent, which makes the rates for air freight between these to continents very high. The cost for transportation is smaller in model 3a than today, since DEA and GRE products are shipped by sea in this model. Model 3b leads to larger transportation costs than today, since every distribution centre ships world wide by air. Since a lot is shipped express by air in the current structure, the differences are relatively small.
9.4 Total costs All costs for the present situation are 9,555 kEuro as shown in section 5.5.4.
55
9.4.1 Model 1 PTD Administration Management 333 Order handling and invoicing 51 Forwarding 30 Inventory and call-off Management 99 Total administration costs 513 Warehousing Housing 110 Maintenance 66 Machines/equipment 68 Warehouse personnel 1144 Insurance 11 Total warehousing costs 1399 Inventory carrying cost Cost of tied-up capital (WACC based) 2236 Obsolete stock and slow moving items 891 Insurance for products in stock 23 Total inventory carrying costs 3150 IT System operations and maintenance 220 Transportation Transport Insurance 100 Packaging Material 174 Inbound from external suppliers (finished goods) 861 DES, GRE to PTD 271 CPQ DC to PTD 29 PTD to CPQ DC CPQ DC to RH DC RH DC to PTD 243 Outbound 6473 Total transportation costs 8151 Total DC costs 13433
Table 9.4: Total costs for model 1
56
9.4.2 Model 2 PTD CPQ DC Total Administration Management 230 298 528 Order handling and invoicing 32 32 Forwarding 19 19 Inventory and call-off Management 61 50 111 Total administration costs 341 348 689 Warehousing Housing 76 26 102 Maintenance 45 16 61 Machines/equipment 47 7.1 54.1 Warehouse personnel 706 25 731 Insurance 7.6 2.6 10.2 Total warehousing costs 882 77 958 Inventory carrying cost Cost of tied-up capital (WACC based) 1026 813 1839 Obsolete stock and slow moving items 617 274 891 Insurance for products in stock 11 20 31 Total inventory carrying costs 1654 1107 2761 IT System operations and maintenance 151 5.7 157 Transportation Transport Insurance 100 100 Packaging Material 113 62 175 Inbound from external suppliers (finished goods) 5.5 86 92 DES, GRE to PTD 271 271 CPQ DC to PTD PTD to RH PTD to CPQ DC CPQ DC to RH DC RH DC to PTD 117 117 Outbound 2159 9524 11683 Total transportation costs 2766 9672 12438 Total DC costs 5793 11209 17001
Table 9.5: Total costs for model 2
57
9.4.3 Model 3a
Table 9.6: Total costs for model 3a
PTD RH DC CPQ DC Total Administration Management 173 126 57 356 Order handling and invoicing 23 88 111 Forwarding 14 61 75 Inventory and call-off Management 44 57 11 112 Total administration costs 254 332 68 654 Warehousing Housing 57 317 5.1 379 Maintenance 34 84 3.1 121 Machines/equipment 35 9.7 1.4 46 Warehouse personnel 519 371 5.3 895 Insurance 5.8 3.6 0.5 9.9 Total warehousing costs 651 785 15 1451 Inventory carrying cost Cost of tied-up capital (WACC based) 1083 1020 347 2450 Obsolete stock and slow moving items 526 491 48 1065 Insurance for products in stock 13 116 1.2 130 Total inventory carrying costs 1622 1627 396 3645 IT System operations and maintenance 114 98 1.1 213 Transportation Transport Insurance 100 100 Packaging Material 103 66 5.3 174 Inbound from external suppliers (finished goods) 5.5 856 862 DES, GRE to PTD 235 235 CPQ DC to PTD 7.0 7.0 PTD to RH 12 12 PTD to CPQ DC 5.9 5.9 CPQ DC to RH DC 1.6 1.6 RH to CPQ 14 14 RH DC to PTD 136 136 Outbound 1189 731 97 2017 Total transportation costs 1650 1803 111 3565 Total DC costs 4291 4645 591 9528
58
9.4.4 Model 3b PTD RH DC CPQ DC Total Administration Management 134 169 32 335 Order handling and invoicing 18 111 129 Forwarding 11 77 88 Inventory and call-off Management 35 72 7.6 115 Total administration costs 198 429 40 667 Warehousing Housing 44 424 2.8 471 Maintenance 26 113 1.7 141 Machines/equipment 27 13 40 Warehouse personnel 403 471 3.8 878 Insurance 4.5 4.8 9 Total warehousing costs 505 1025 8.3 1538 Inventory carrying cost Cost of tied-up capital (WACC based) 852 929 62 1843 Obsolete stock and slow moving items 360 447 23 830 Insurance for products in stock 14 87 101 Total inventory carrying costs 1226 1463 85 2774 IT System operations and maintenance 88 131 0.6 220 Transportation Transport Insurance 100 100 Packaging Material 103 66 5.3 174 Inbound from external suppliers (finished goods) 5.5 856 862 DES, GRE to PTD 271 271 CPQ DC to PTD PTD to CPQ DC CPQ DC to RH DC RH DC to PTD Outbound 1450 1404 278 3132 Total transportation costs 1930 2326 283 4539 Total DC costs 3947 5374 417 9738
Table 9.7: Total costs for model 3b
59
9.5 Future 2008 year’s weight distribution between the continents from each production company is estimated by Thomas Dahlgren. These values are shown in table 9.8. Markets/PC DEA, GRE ATC CPQ Europe 68 11 23 America 9 88 22 Asia 23 1 55 Total 100% 100% 100%
Table 9.8: Future market share in percentage of total weight from each production company
Thomas Dahlgren has also estimated future VK-values for each distribution centres in 2008. Based on the relationship between the present and the future VK-value, the number of order lines in the future has been calculated. These values are used to compute the operational costs in the distribution centre. The VK-values and order lines s are shown in table 9.9. DC VK-value Order lines PTD 80 000 K Euro 321,9 K RH DC 80 000 K Euro 429,7 K CPQ DC 40 000 K Euro 362,2 K
Table 9. 9: Future VK-value and order lines in the distribution centres
The new values and markets are compiled in the same model as above. The results of the different models are shown in table 9.10. All costs in T Euro.
60
Present situation Model 1 Model 2 Model 3a Model 3b Administration Management 790 593 1192 413 777 Order handling and invoicing 190 106 38 327 235 Forwarding 129 63 23 225 161 Inventory and call-off Management 246 206 248 250 179 Total administration costs 1355 968 1501 1215 1352 Warehousing Housing 647 195 172 338 888 Maintenance 208 117 103 104 258 Machines/equipment 65 121 78 42 47 Warehouse personnel 1416 2388 941 1284 1261 Insurance 14 20 17 8.5 13 Total warehousing costs 2350 2841 1311 1777 2467 Inventory carrying cost Cost of tied-up capital (WACC based) 3825 4506 3608 4750 3829 Obsolete stock and slow moving items 1688 1525 1428 1600 1619 Insurance for products in stock 193 47 52 145 264 Total inventory carrying costs 5706 6078 5088 6495 5712 IT System operations and maintenance 327 391 197 194 331 Transportation Transport Insurance 110 178 178 110 50 Packaging Material 316 316 316 316 316 Inbound from external suppliers (finished goods) 1889 1889 194 1889 1889 DES, GRE to PTD 230 298 298 185 271 CPQ DC to PTD 44 159 44 PTD to CPQ DC 11 RH to CPQ 5.9 PTD to RH 7.9 CPQ DC to RH DC 48 48 RH DC to PTD 71 201 201 65 Outbound 5734 6649 26540 4950 10033 Total transportation costs 8442 9690 27727 7632 12559 Total DC costs 18180 19968 35824 17313 22421
Table 9.10: Future costs for all models
61
By looking at the how the different markets are split, we can see that the major differences are:
o Increased market share in Asia for products from Desoutter and Georges Renault o A large market increase for Qianshao products in Europe and America
Overall, the products from the different production companies are sold in more markets than before. The changes in VK-values show that the importance of Qianshao increases, since their VK-value are expected to increase by 10.8 times. Rock Hill is expected to increase 2.2 times and Power Tools Distribution 1.1. The increased flow to different markets makes model 1 more beneficial, since less products are shipped back and forth to their local market. But the local market is still the largest for each production company and a centralisation does not provide any cost savings. Model 2 shows even clearer that this is not a feasible option. This is due to the increased volume of Rock Hill products and that less of these products are sold in Asia than before. Model 3a is still the only model that provides cost savings. They are slightly higher than today, 5% compared to 1%. This is due to the increased volume of goods. The increased flow to different markets and the increased volume of goods shipped makes to cost of air freight significant large in model 3b. This was not as apparent in the models where the present flow was applied, since a lot of products were air freighted already. Whether future acquisitions or consolidations will fit in selected distribution models is depending on where the distribution centres is located. Future acquisitions or consolidations will have smallest impact on model 1, since the distribution is separated from the production companies. The other distribution models are based on the current location of the production companies and are more sensitive to changes in the production structure.
9.6 Selection of two models for further analysis Four models were created in order to examine where the possible cost savings occurred. After compiling these models with the current and future volumes, two models can be selected for further analysis. Model 2 is leads to large cost savings for operations and in inventory, but the large cost for transportation makes this model more expensive than the present structure. This model turns out to be even more expensive in the future scenario. Due to this, this model will not be recommended for further analysis. Model 3b leads to large inventory savings but also large transportations costs. In total, it does not result in any cost reductions today or in the future. This model also brings the
62
disadvantage of as much as three shipments to one customer or an extra cost of using a consolidation hub, and will therefore not be recommended. The two models that are of most interest is model 1 and model 3a and only these two will be considered.
10 Other modelling aspects
10.1 Lead time All models have been created in order to meet the required lead time from customers today. Customers that today receive shipments from a very close located distribution centre may experience a slightly longer lead time if the products are air freighted from a continent, which is the case for model 1. Model 3a leads to the same or better lead time, since everything is stored in a local distribution centre.
10.2 Environmental aspects A part of the scope was to include the environmental aspects of the selected models. This analysis will be a comparison of the total ton-kilometres and transportation mode between the present situation and the selected models, since that is a part of the environmental reporting each production company are obligated to do. The distances between the continents are approximated to be (Google Earth): Between America and Asia: 13 000 km Between America and Europe: 7000 km Between Europe and Asia: 9000 km The transportation within the same continent is assumed to be the same in both models and will therefore be excluded in this analysis. The weight, in tonnes, to each continent is based on table 8.4 and 8.5 and is shown in table 9.11. Weight/PC DEA,GRE ATC CPQ Europe 560 135 15 America 105 1471 12 Asia 35 85 122 Total 700 1691 149
Table 9.11: Weight to each production company to the different continents
The tonne-km and transportation mode for the present situation and the selected models are shown in table 9.12. Tonne-km shipped by boat Tonne-km shipped by air Total tonne-km Present situation 1 831 000 1 815 000 3 646 000 Model 1 13 178 000 13 294 000 26 472 000 Model 3a 3 391 000 - 3 391 000
Table 9. 12: Tonne km and transportation mode for present situation and selected models
Table 9.12 clearly shows an increase in transportation, both sea and air, in model 1. This depends on that a large volume of products are shipped back and forth between the continents. In model 3a, the total tonne-km is less than today. This depends on the Rock
63
Hill products to Asia that today are shipped to Power Tools Distribution by sea and air freighted from there to Asia. In model 3a, they are shipped directly to Qianshao in Asia by sea. The main difference, in an environmental perspective, is the elimination of air freight in model 3a. Recalling section 4.3.2, we can conclude that model 3a is more environmentally friendly than the distribution structure today, since model 3a provides a decreased number of tonne-km and eliminates the need of the least favourable transportation mode, which is air freight. Model 1 leads to increased transportation and increased use of air freight, which is contrary to Atlas Copco’s environmental policy.
10.3 SAP According to Stefan Jonsson, SAP-consultant for Chicago Pneumatic Division, both model 1 and 3a are possible to implement in SAP. As long as the production companies only are connected and shipping to only one distribution centre, it means the same administrative work.
64
11 Conclusions and recommendations The thesis included three objectives:
o Map the current Chicago Pneumatic Division distribution network including a total cost analysis of the structure
o Bench-mark the current Chicago Pneumatic Division structure with successful distribution/logistic companies
o Develop two separate distribution models, with consideration to goods flow as well as financial and environmental aspects both in present and future situation.
A complimentary objective is to safeguard the support of SAP of the suggested models. The mapping of the present distribution network showed a complex system, where different strategies were applied by the distribution centres. It was questioned whether this structure, that was a result of the acquisitions made, was the best way to manage the global distribution. The total cost analysis was used to measure efficiencies in the distribution centres and showed that Power Tools Distribution has the most cost efficient administration, while Qianshao is most cost efficient in warehousing, which is labour-intense. It is not possible to draw any conclusion of which distribution centre that is most efficient in total, since different keys were used to divide the costs. The bench-marking studies showed examples of prerequisites for different distribution strategies, such as a centralised distribution and direct distribution. These prerequisites are not in place in Chicago Pneumatic Division today and limit the possibilities to have a different distribution structure. Four models were created to examine all possible range of distribution, from centralised structure to a decentralised, but only two must be selected for further analysis and recommendations. A total cost analysis of the present and future volumes showed that model 2 does not bring any cost savings due to the large volume of goods that must be air freighted from Qianshao to America. Model 3b does not result in any cost savings with the present volumes, but turns out even more expensive when calculating with the future volumes, since more products are sold in different continents. In conclusion, model 1 and 3a are the two models chose for further analysis and recommendation.
11.1 Recommendations
11.1.1 Model 1 Model 1 means a centralisation of all distribution centres to Power Tools Distribution.
o This model results in large costs in the present situation but when products are sold in more markets, the prerequisites for a centralised distribution gets better. It is still not financially beneficial, due to that most products are still sold in their local market.
o The lead time to customers will be approximately the same as today, since the products to Asia and America are freighted by air.
o Another benefit of a centralised distribution is that the POS-data is easier obtained than in a decentralised structure.
65
o There will be more transportation in this model than before and also more air freight, which is not beneficial for the environment
o The distribution structure is possible in SAP, according to Stefan Jonsson To centralise the distribution has been a trend lately, but in order to gain the possible advantages of this structure it demands another kind of production location, which does not exist in Chicago Pneumatic Division today. If the production structure is changed by new acquisitions or consolidation, this alternative can be interesting to analyse again.
11.1.2 Model 3a Model 3a implies every distribution centres carries enough stock to supply their market.
o This model provides small cost savings in the current situation. This is a sustainable structure and results in larger cost savings when the products are sold in more markets.
o The lead time to customers is the same or better than before, since products are now stored in the local distribution centre.
o The POS-data needs to be collected from three distribution centres, which leads to more administrative work.
o The customers receive only one consolidated shipment. The customer benefits of this are up to the company value.
o This model is also sustainable environmentally, since it results in less transportation and use of air freight
o This model is feasible in SAP, according to Stefan Jonsson. The results show that the products from Chicago Pneumatic Division can not carry air freight. This model will be recommended for the company to analyse further, since it brings financial, environmentally and customer advantages.
11.2 Delimitations In model 3a, Desoutter and Georges Renault ship to Power Tools Distribution and the products are transported from there to the other distribution centres. Whether this is the optimal flow or if the two production companies should ship directly to Rock Hill and Qianshao instead can be discussed. The reason behind the proposed structure was to get scale of economy and to facilitate the administration, which can only be achieved if the production companies consolidate their shipments to one destination and if Power Tools Distribution manages the material handling and freight to the other distribution centres. This structure is also easier to implement in SAP. In a large analysis as this, it is necessary to make assumptions and aggregation of data, which leads to a certain margin of error. One possible source of error is the weight from each distribution centre. This is important since the weights are used in all freight calculations. Another possible source of error is the estimated weight per container, which is shown in Appendix 3 and used to calculate all cost for sea freight. The freight rates are considered reliable, since they are provided and used by Power Tools Distribution. The freight rates given by FedEx are based on the Rock Hill account in order to get accurate prices.
66
There are different methods to calculate an inventory change due to consolidation. The square root formula used in this analysis is scientifically proved and has been used for decades. There are also scientifically proved calculations of how the inventory is affected by a longer lead time. This is used to calculate the change in safety stock, but the changes in the average inventory level is estimated in this thesis. The keys used to divide the operating cost are very important and an incorrect key can lead to misleading results. The keys used in Power Tools Distribution were considered to be used also in this thesis, but was not possible since they needed detailed data that was not available. Nevertheless, the keys that were used gave results, which are reasonable with consideration to the different conditions in the distribution centres.
67
References Articles and Presentations Abrahamsson Mats (2004). Logistic Thermometer Abrahamsson, Mats \& Håkan Aronsson (1999). Measuring Logistics Structure. International Journal of Logistics Research and Application, Vol. 2, No 3 Anand, Krishnan S& Girotra, Karan (2004). The strategic perils of delayed differentiation under competition. Al-Mashari, Majed & Zairi, Mohamed (2000). Supply-chain re-engineering using enterprise resource planning (ERP) systems: an analysis of a SAP R/3 implementation case. International Journal of Physical Distribution and Logistics Management. Vol. 30. No. ¾ A.T Kearney, Inc (2003). How many supply chains do you need? Bauhaus, Ned (2005). Establishing the optimal distribution center network. Beverage Industry. Bolstorff, Peter (2003). Measuring the impact of supply chain performance. Logistics Today, No 12. Gargeya, Vidyaranya B. (2005) Success and failure factors of adopting SAP in ERP system implementation. International Journal of Physical Distribution and Logistics Management. Vol.11. No 5 Hackner Maria & Kleiner Brian 2000. 12 Steps to Better Benchmarking. Industrial Management, March-April. Lundeberg, M& Sundgren B (1996). Advancing your business: People and Information system in concert. Stockholm School of Economics. Mason-Jones R & Naylor B & Towill D (2000). Lean, Agile or Leagile? Matching your supply chain to the marketplace. International Journal of Production Research. Vol 38, No 17. McKinnon, Alan (2003). The effects of Transport Investment on Logistical Efficiency. ESRC Seminar Series: TSU Oxford University Pyne, William (2002). The time for ERP? International Journal of Physical Distribution and Logistics Management, Vol. 51, No 2 Kärkkäinen, Mikko& Ala-Risku, Timo& Holmström, Jan (2003). Increasing customer value and decreasing distribution costs with merge-in-transit. International Journal of Physical Distribution and Logistics Management, Vol. 3, No 2
68
Rudberg, Martin (2004). Lecture Notes Rudberg, Martin (2003). Tidsstyrd direktdistribution. Linkopings Universitet Wanke, Peter F & Zinn, Walter (2004). Strategic Logistics Decision Making. International Journal of Physical Distribution and Logistics Management. Vol. 34, No 6 Wu, Haw-Ju & Dunn, Steve C. (1995). Environmental responsible logistics systems. International Journal of Physical Distribution & Logistics Management. Vol. 25 No 2. Books Christopher, Martin (2005). Logistics and Supply Chain Management. Financial Times Prentice Hall Hakansson, Ola (2003). Logistik for konkurrenskraft-ett ledaransvar. Liber Ekonomi, Upplaga 1:1. Stadtler Hartmut & Kilger, Christoph (2005). Supply Chain Management and Advanced Planning. Springer, third edition. Simchi-Levi, David & Kaminsky, Philip & Simchi-Levi, Edith (2003). Designing & Managing the Supply Chain. McGraw-Hill, second edition Sullivan William G., Bontadelli James A & Wicks Elin M (2000), Engineering Economy, Prentice Hall, Inc, Twelfth Edition Yin, Robert K. (2003). Case Study Research, Design and Methods. Sage Publications. Third edition CPD Material Atlas Copco Annual Report 2004 Chicago Pneumatic Division, Brochure, 2005 Robison, Charlie. Strategy Presentation for Chicago Pneumatic Division v13. 2005 The way we do things. Atlas Copco database. 2005 Customer Satisfaction Survey. Corporate Total. Info Quest. Business process review. Internet http://www.cscmp.org/ Council of Supply Chain Management Professionals. Visited 2005/10/06
http://earth.google.com/ Google Earth. Visited 2006/01/07 Oral References Af Sille’n, Hans. General Manager, Power Tools Distribution Antier, Yves Vice President Sales, Chicago Pneumatic Austin, Barrie. Material Flow Manager, Desoutter Bervoets, Conny. Transport Coordinator. Power Tools Distribution Brandhorst-Satzkorn, Anna. Environmental Manager, Atlas Copco Dahlgren, Thomas. Vice President Operations, Desoutter Ding, Tina. Business Controller, Qianshao Elgh, Torkel. Former Vice President, Electrolux Logistics AB Gasaway, Greg. Strategic Sourcing Manager, Chicago Pneumatic Henriksson, Gösta. Former Logistics Manager, Atlas Copco Humphreys, Paul. Insides Sales and CP Connected, Desoutter Jonsson, Stefan. SAP Consultant Kendrick, Rob. Operations Manager, Chicago Pneumatic Lewis, Jay N. National Sales Manager, Chicago Pneumatic McDermott, Joseph J. Director, Industrial Distribution Group (IDG) Mitchell, Bob. Vice President Sales Europe, Desoutter Moreton, Paul. Manager, Discount Tire O’Mullan, Stephen, Logistics Manager EMEA Dell Powell, Darren. Sales Manager UK, Desoutter Paul, Pradip. Sr. Project Manager. Chicago Pneumatic Snelgrove, Eileen. Business Controller, Desoutter Thibau, Hans. Operations Manager, Power Tools Distribution
Appendix 1: Abbreviations CPD = Chicago Pneumatic Division PC = Product Company CC = Customer Centre DC = Distribution Centre AC = Application Centre DEA = Desoutter GRE = Georges Renault RH = Chicago Pneumatic (Rock Hill) CPT = Tech-Motive CPQ = Qianshao PTD = Power Tools Distribution, European DC RH DC = Rock Hill Distribution Centre, supplied by Chicago Pneumatic CPQ DC = Qianshao Distribution Centre, supplied by Qianshao CPT DC = Tech-Motive Distribution Centre, supplied by Tech-Motive MTB = Machine Tool Builders HD1 = Horizon Day 1 SAP = Systems, Applications and Products
Appendix 2: Freight rates AIR
CPQ to PTD Local charges at Tao : CNY Euro Unit Customs Clearance Fee: 200 21 shipment Terminal charge : 1.1 0.12 kg Documentary fee : 50 5.3 shipment Security fee: 3 0.32 parcel Air freight charge : Minimum 530 CNY 0-45 -kg: 65 6.85 kg +45 kg: 35 3.69 kg +100 kg: 33 3.48 kg +300 kg 31 3.27 kg +500 kg 30 3.16 kg +1000kg 28 2.95 kg Fuel surcharge 5 0.53 kg Security charge 1.2 0.13 kg Delivery charges in Belgium Arrival cost : 45 shipment Clearance : 30 shipment Handling 15 shipment Delivery:
71
0-400 kg 16.12 kg 400-1000kr 32.34 kg 1000-5000kg 47.45 kg
PTD to CPQ Minimum 45 Euro 0-45 -kg: 3.38 kg +45 kg: 3.13 kg +100 kg: 1.91 kg +300 kg 1.57 kg +500 kg 1.53 kg fuel surcharge 0.5 kg security charge 0.15 kg
RH to PTD Door to door rate USD Euro Unit Minimum charge USD 118 >100 kg 1.18 1.01 kg >500 kg 0.88 0.75 kg fuel surcharge 0.6 kg security charge 0.15 kg
PTD to RH Door to door rate Flatrate 1.65 kg fuel surcharge 0.6 kg security charge 0.15 kg AMS fee 8 shipment
CPQ to Memphis Boxes 300*150*60mm 8 6.8 kg 3kg/box 10.23 8.69 kg Shipping every day
RH to CPQ Boxes 300*150*60mm 7.92 6.73 kg 4kg/box 4.38 3.72 kg
LAND (standard+express) PTD to Europe 1.83661 kg CPQ to Asia 0.61967 kg RH to America 0.5357 kg
72
SEA
RH to PTD USD Euro Unit FCL (door to door) 1890 1614 20' container 2100 1793 40' container LCL sea: 80 68.3 m3 inland us: min 150 128.1 >227 14/45kg 12 kg >454 12/45kg 10.2 kg >907 10/45kg 8.5 kg Handling fees 85 73 shipment
Reception charges 48/1000kg or 16/333kg
LCL charges 8 m3 Clearance, handling 55 shipment Delivery to PTD min 45 flat 0.1 kg ISPS fee 14 container
PTD to Hong Kong Transport PTD to Antwerp 300 container Terminal handling 140 container ISPS 14 container Handling 35 shipment Bill of lading 25 BL Sea freight Antwerp-Hongkong 175 149 20' container CAF 14.175 12 20' container BAF 199 169 20' container Sea freight Antwerp-Hongkong 300 255 40' container CAF 24.3 20.62 40' container BAF 398 338 40' container
PTD to RH Transport from PTD to Antwerp 300 container ISPS 14 container Handling 35 container Bill of lading 25 BL AMS fee 25 shipment Sea freight 1000 849 20' container BAF 63 20' container CAF 423 20' container Sea freight 1150 976 40' container BAF 69 40' container CAF 816 40' container
Appendix 3: Weight per 40’ container Weight per 40' container Boxes 30*15*6 cm Euro pallets 80*120*15, max height 180cm, max weight 1000kg 40' container 12*2.35*2.39 m 29 pallets/container (20 layers) 300 boxes/pallet 8700 boxes/container 26000KG/container