lumal Kejuruleraan 4 (1992) 43-48 Distribution of Ga Vacancies in Zn Diffused GaAs Zahari Mohamed Darns Iftekhar Ahmed ABSTRACT A detailed discussion on the distribution and the characteristics of vacancy profiles in Zn diffused GaAs is presented in this paper. Vacancies are consumed during the diffusion process, creating short-fall. in the equilibrium vacancy concentration. The crystal tries to recover this· short-fall by ' vacancy diffusion and vacancy generation process. In course of time, the depth in the vacancy short-fall decreases, but this short-fall propagates deeper into the crystal. ABSTRAK Perbincangan mendalam ke atas agihan dan ciri-ciri profil kekosongan dalam GaAs yang diresap dengan Zn dibincang dalam kertaskerja ini. Kekosongan digunakan semasa proses resapan, membentuk kejatuhan- pendek dalam ketumpatan "eseimbangan kekosongan. Hablur cuba untuk memulihkan kejatuhan-pendek ini dengan resapan kekosongan dan proses penjanaan kekosongan. Dalam masa, kedalaman kejatuhan-pendek kekosongan merosot, tetapi kejatuhan-pendek ini merambat lebih dalam ke dalam hablur. INTRODUCTION Zn in GaAs occupies Ga sites and behaves as an acceptor. Ga vacancies play an important role during Zn diffusion in GaAs. So far, there are only limited reports on the distribution of Ga vacancies in Zn diffused GaAs. Tuck [I) and Tuck and Kadhim (2) considered vacancy break- down below the equilibrium value during Zn diffusion in GaAs. Tbey also predicted vacancy production by dislocation climb. According to their model, equation for vacancies is, (I) wbere Dv is the diffusion coefficient for vacancies and k is the constant of proportionality. Cv and are tbe Ga vacancy concentrations at any diffusion time and at equilibrium respectively. C, is the substitutional impurity concentration. In the above equation, the first term on the right hand side represents vacancies gained by diffusion from the surface, the second represents loss of vacancies due to interstitial Zn becoming substitutional, and the third term is the bulk production of vacancies by dislocation lJiimb, etc. But Tuck and Kadhim (2) converted equation (I)
Transcript
lumal Kejuruleraan 4 (1992) 43-48
Distribution of Ga Vacancies in Zn Diffused GaAs
Zahari Mohamed Darns Iftekhar Ahmed
ABSTRACT
A detailed discussion on the distribution and the characteristics of vacancy profiles in Zn diffused GaAs is presented in this paper. Vacancies are consumed during the diffusion process, creating short-fall. in the equilibrium vacancy concentration. The crystal tries to recover this· short-fall by ' vacancy diffusion and vacancy generation process. In course of time, the depth in the vacancy short-fall decreases, but this short-fall propagates deeper into the crystal.
ABSTRAK
Perbincangan mendalam ke atas agihan dan ciri-ciri profil kekosongan dalam GaAs yang diresap dengan Zn dibincang dalam kertaskerja ini. Kekosongan digunakan semasa proses resapan, membentuk kejatuhanpendek dalam ketumpatan "eseimbangan kekosongan. Hablur cuba untuk memulihkan kejatuhan-pendek ini dengan resapan kekosongan dan proses penjanaan kekosongan. Dalam masa, kedalaman kejatuhan-pendek kekosongan merosot, tetapi kejatuhan-pendek ini merambat lebih dalam ke dalam hablur.
INTRODUCTION
Zn in GaAs occupies Ga sites and behaves as an acceptor. Ga vacancies play an important role during Zn diffusion in GaAs. So far, there are only limited reports on the distribution of Ga vacancies in Zn diffused GaAs. Tuck [I) and Tuck and Kadhim (2) considered vacancy breakdown below the equilibrium value during Zn diffusion in GaAs. Tbey also predicted vacancy production by dislocation climb. According to their model, equation for vacancies is,
(I)
wbere Dv is the diffusion coefficient for vacancies and k is the constant of proportionality. Cv and C~ are tbe Ga vacancy concentrations at any diffusion time and at equilibrium respectively. C, is the substitutional impurity concentration. In the above equation, the first term on the right hand side represents vacancies gained by diffusion from the surface, the second represents loss of vacancies due to interstitial Zn becoming substitutional, and the third term is the bulk production of vacancies by dislocation lJiimb, etc. But Tuck and Kadhim (2) converted equation (I)
44 .. in terms of impurity concentration to produce impurity profiles and no vacancy distribution was reported. Gosele and Morehead [3] and van Ommen [4], while simulating ZnjGaAs system, also concentrated on the impurity profile. Chiang and Pearson [5] measured Ga vacancy concentration at the surface and analyzed their charged state. Tuck [6], while discussing Ga-As-Zn ternary phase diagram, tried to predict possible concentrations of point defects, such as Ga and As vacancies in the range of solidus. He did not calculate or predict defect distributions in Znj GaAs diffusion systems.
Zahari and Tuck [7] reported a nature of vacancy distribution in their paper. They predicted a substantial drop in the vacancy concentration in the bulk below the normal equilibrium value. This paper reports on the distributions of Ga vacancies in Zn diffused GaAs and the characteristics of their variations. Profiles presented in this paper are the best fit profiles to the experimental results of Tuck and Kadhim [2] under the excess As over pressure at temperature lOOO°C.
For the simulation, the Discrete Finite Difference (dfd) method [7] has been used. The ·model assumes simultaneous diffusion of Ga host atoms and Zn interstitials. Ga host atoms diffuse by vacancy mechanism and Zn interstitials by interstitial mechanism. Substitutional Zn are effectively immobile. During the diffusion process, Zn interstitials become substitutional occupying vacant Ga sites. The process creates Ga vacancies when substitutional Zn become interstitial leaving Ga sites. The model also assumes bulk vacancy generation proportional to the short-fall [7].
DISCRETE FINITE DIFFERENCE METHOD
This simple method was developed by Zahari and Tuck [8] where a crystal is ass\llIled to consist of a finite n\llIlber of crystal planes or nodes, each separated by a distance Ox as shown in Figure I.
l>X l>X
Nn,n-l----+--- Nn,n+l
t--- Nn-l.n Nn+l.n---"i
n-1 n n+1
FIGURE I. Impurity jump between adjacent plan ..
Each plane has a fixed number of lattice points occupied by either host atom, vacancy or impurity atom, so that:
L=H+V+I (2)
45
where L is the concentration of lattice sites. H, V, and I represent host, vacancy and impurity concentrations respectivelY. Interstitial impurities from each crystal plane jump to the adjacent planes. This jump is proportional to the number of impurities available to jump. Mter a diffusion step At, impurity concentration at node n is:
In "" = In + k;(In + I - 2In + In-I) (3)
where k; is the constant of proportionality and is given by:
(4)
D; is the in.terstitiai diffusion coefficient. For a stable system, k; must not exceed 0.5.
Host atoms diffuse by vacancy mechanism. Their jump depends both on the number of atoms available to jump and on the number of vacancies to receive them, After a time At, the number of host atoms at node n is given by:
where kH is a constant of proportionality given by:
DHAt kH = (Ax)2y'
(6)
V is the equilibrium vacancy concentration and DH is the host atom diffnsion coefficient. Care should be taken so that the number of atoms jumping does not exceed the number available to jump, simultaneously the number of vacancies to receive them. It requires that:
(7a)
(7b)
SIMULATION OF VACANCY DISTRIBUTION
The above mentioned model is capable to produce impurity as well as corresponding vacancy profiles. At the beginning of diffusion, an equilibrium vacancy concentration is assumed throughout the crystal. Host atom diffusion takes place by vacancy mechanism. It consumes vacancies. The vacancy concentration is then readjusted according to equation (2). At the end of diffusion step or iteration, a very fast transition between the substitutional and interstitial impurities takes place for several times. This transition process creates vacancies when substitutional impurities come to interstitial sites leaving lattice sites and it consumes vacancies when interstitial impurities move to substitutional
...
.. 46
sites. This process also consumes vacancies. The crystal then generates vacancies which is proportional to the short-fall below the equilibrium value, i.e.
AV. = k At(V' - V,J (8)
where k and V· are tbe vacancy generation constant and the equilibrium vacancy concentration. V. is the vacancy concentration at the nth node during diffusion. The above process will give vacancy distributions inside the crystal
~ .~ 10 '8
~ " o 50
Condition 1 ~Condition 2 ----
BCD
100 150
Depth (iJm)
200
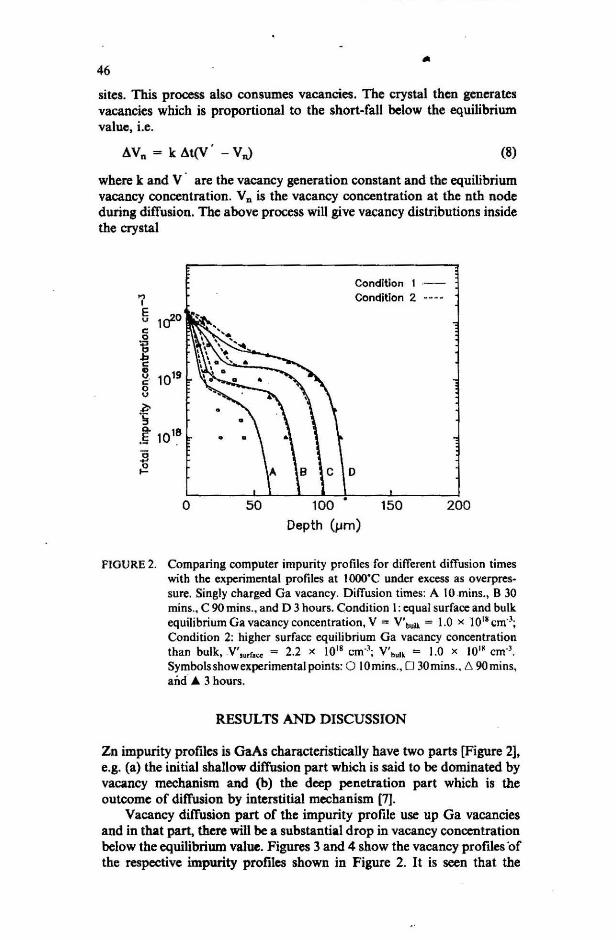
fIGURE 2. Comparing computer impurity profiles for different diffusion times with the experimental profiles at IOOO·C under excess as overpres· sure. Singly charged Ga vacancy. Diffusion times: A 10 mins., B 30 mins .• C 90 mins .• and D 3 hours. Condition 1: equal surface and bulk equilibrium Ga vacancy concentration. V "" V'bulk = 1.0 X 10"1 em'); Condition 2: higher surface equilibrium Ga vacancy concentration than bulk, V',urr.ce = 2.2 X 10¹⁸ em'); V'bulk = 1.0 X JOI8 em-J
Zn impurity profiles is GaAs characteristically have two parts [Figure 2]. e.g. (a) the initial shallow diffusion part which is said to be dominated by vacancy mechanism and (b) the deep penetration part which is the outcome of diffusion by interstitial mechanism [7].
Vacancy diffusion part of the impurity profile use up Ga vacancies and in that part, there will be a substantial drop in vacancy concentration below the equilibrium value. Figures 3 and 4 show the vacancy profiles 'of the respective impurity profiles shown in Figure 2. It is seen that the
47
vacancy concentration in the vacancy profile keeps falling below the equilibrium value for the corresponding shallow diffusion part of the impurity profile; it then gradually goes' to equilibrium concentration in the interstitial diffusion part.
Short-fall in the vacancy profile occurs in the concave region of the impurity profile. In the concave region, impurity diffusion mechanism changes from vacancy mechanism to intentitial mechanism. Figures 3 and 4 also show vacancy profiles at different diffusion times. It is seen that at lower diffusion times, vacancy short-fall is at its maximum and it is also recovering to the equilibrium value fast. With the increase in time, vacancy short-fall decreases and the short-fall region expands; but the short-fall in the vacancy concentration starts from a place further inside the crystal. This is because, with the increase in time, more vacancies arc diffusing in from the surface and more vacancy generation is taking place. Figures 3 and 4 also show that, with the increase in diffusion time, vacancy short-fall (recovering part of the vacancy profile) propagates further inside the crystal. The reason is that more impurities diffuse into the crystal in the course of time and they become substitutional occupying vacant Ga sites.
o 50 100 150
Depth ().1m)
A-B ----c····· .. · 0- -
200 250
FIGURE 3. Computed vacancy profiles for different diffusion times. Singly charged Ga vacancy. Equal surface and bulk equilibrium Ga vacancy concentration. V' =- V'bulk :0:::. 1.0 X tO lll cm-3. A 10 mins., B 30 min •. , C 90 mins., and D 3 hours.
CONCLUSION
The dfd method efficiently calculates the impurity distributions as well as vacancy distributions. Distributions of impurities and vacancies are interrelated. Characteristics and distributions of vacancy profile follow impurity distribution and diffusion time .
FIGURE 4. Computed vacancy profiles for different diffusion times. Singly charged Ga vacancy. Higher surface equilibrium Ga vacancy concentration than bulk. V'.urf..,. = 2.2 X lOiS em']; V'bulk = 1.0 X 101 11 cm-3. A 10 mins., B 30 mins. , C 90 mins. , and 0 3 hours.
REFERENCES
I. Tucle, B. 1969. Diffusion of Zinc in GaAs. J. Phys. Chem. Solids 30: 253-260. 2. Tuck, B. , & Kadhim, M. A. H. 1972. Anomalous Diffusion Profiles of Zinc in
GaAs. J. Mater. Sci. 7: 581-591. 3. Gose1., U., &'Morchead, F. 1981. Diffusion of Zinc in Gallium Arsenide: A
new model. J. Appl. Phys. 52(7): 4617-4619. 4. van Ommen, A. H. 1983. Examination of Models for Zn Diffusion in GaAs.
J. Appl. Phys. 54(9): 5055-5058.
5. Chiang, S. Y., & Pearson, G. L. 1975. Properties ofYacancy Defects in GaAs Single Crystals. J. Appl. Phys. 46(7): 2986-2991.
6. Tuck, B. 1976. The GaAs/Zn Solidus at IOOO·C. J. Phys. D: Appl. Phys. 9: 2061-2073.
7. Zahari, M. D., & Tuck, B. 1985. Substitutional-Interstitial Diffusion in Semiconductors. J. Phys. D: .Appl. Phys. 18: 1585-1595.
8. Zahari, M. D., & Tucle, B. 1982. Effect ofYacancy Reduction on Diffusion in Senticonductors. J . Phys. D: Appl. Phys. 15: 1741-1750.
Jabatan Kejuruteraan E1eletrik. Elektronik dan Sistem Fakulti Kejurutcraan . Universiti Kebangsaan Malaysia 43600 UKM Bangi. Sclangor D.E., Malaysia.