34
DISTRIBUTION OF NATURALLY OCCURING RADIONUCLIDES AND MINERALOGICAL CHARACTERIZATION OF IJEBU-IFE, OGUN STATE NIGERIA. BY OLAGBAJU PETER OLUWADAMILARE
DISTRIBUTION OF NATURALLY OCCURING RADIONUCLIDES AND MINERALOGICAL CHARACTERIZATION OF IJEBU-IFE, OGUN STATE NIGERIA.
BY
OLAGBAJU PETER OLUWADAMILARE

INTRODUCTION
➢Natural radionuclide's andEnvironment (UNSCEAR, 2000).
➢Variation of natural radionuclides
➢Sources of natural radionuclides
GEOGRAPHY AND GEOLOGY OF STUDY AREA
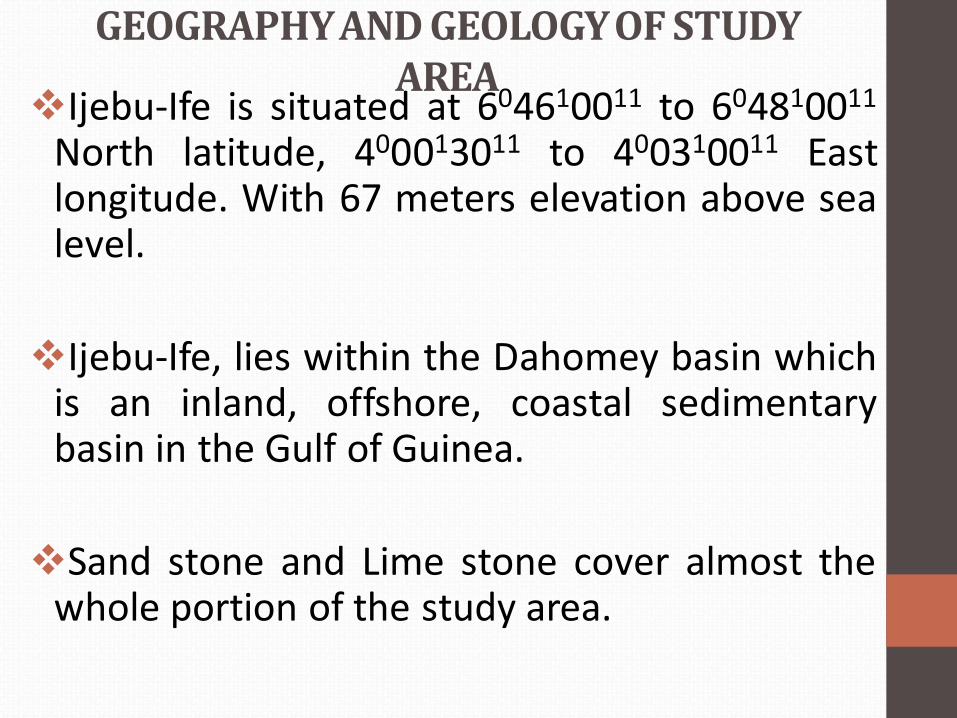
❖Ijebu-Ife is situated at 604610011 to 604810011
North latitude, 400013011 to 400310011 Eastlongitude. With 67 meters elevation above sealevel.
❖Ijebu-Ife, lies within the Dahomey basin whichis an inland, offshore, coastal sedimentarybasin in the Gulf of Guinea.
❖Sand stone and Lime stone cover almost thewhole portion of the study area.

IJEBU-IFE AND ENVIRONS
Odo lewuIgara
Ijebu-Ife
Ijebu-Itele
Ijebu-Imushin
Isonyin
TAI SOLARIN
UNIVERSITY
60 40’00
”60 4
2’00
”60 4
4’00
”60 4
6’00
”60 4
8’00
”
3055’00” 3057’00” 3059’00” 4001’00” 4003’00” 4005’00”
60 50’00
”3055’00” 3057’00” 3059’00” 4001’00” 4003’00” 4005’00”
6040’00”
6042’00”
6044’00”
6046’00”
6048’00”
6050’00”
4.0km2.00
Sands and clay
LEGEND
Sands, clays and shale
Alluvium
Shale and limestone
Sandstone and limestone
Porphyritic granite
Geological boundary
Dual carriage
Minor roads
Main paths
Main roads
Ogun-state
OGUN STATE
Ijebu-Ife

JUSTIFICATION
UNSCEAR, (1993)
Soil as a direct source (IAEA, 1990)
Knowledge of background radiation level

AIM AND OBEJECTIVES
The general objective of this study is todetermine the naturally occurring radionuclidesand mineralogical characterization of Ijebu-Ife,Ogun State, Nigeria.

AIM AND OBEJECTIVESThe specific objectives of this study are
❖To determine the activity concentrations of thenaturally occurring radionuclides in soil ofIjebu-Ife.
❖To measure in situ radiation level
❖To estimate the radiological doses and hazardindices of the soil
❖To measure and compare in-situ andlaboratory measurement of effective dose

AIM AND OBEJECTIVES
The specific objectives of this study are
• To determine the mineralogical characterizationof soil in the study area.
• To relate radiation level with the geological andmineralogical characterization of the studyarea.

LITERATUREREVIEW
❖Otwoma et al., (2012),
❖Ramasary et al., (2009b)
❖Ramasary et al., (2009b)
❖Navas et al., (2002)

Materials and methods
➢Sampling method
➢Sampling preparation
➢Sample analysis
RADIATION DOSE AND HAZARD INDICES CALCULATION
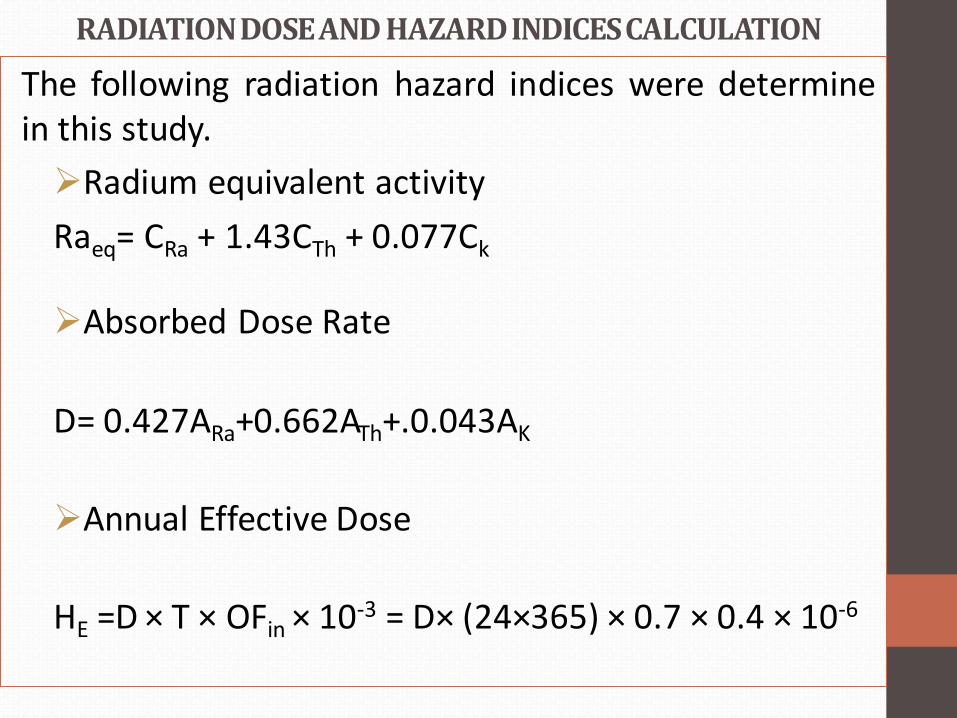
The following radiation hazard indices were determinein this study.
➢Radium equivalent activity
Raeq= CRa + 1.43CTh + 0.077Ck
➢Absorbed Dose Rate
D= 0.427ARa+0.662ATh+.0.043AK
➢Annual Effective Dose
HE =D × T × OFin × 10-3 = D× (24×365) × 0.7 × 0.4 × 10-6

RADIATION DOSE AND HAZARD INDICES CALCULATION
The following radiation hazard indices will bedetermine in this study.
➢Internal hazard Index
Hex = CRa/370 + CTh/259 + Ck/4810
➢External hazard Index
Hin = CRa/185 + CTh/259 + Ck/4810
NB: The value of this index must be less than unityfor the radiation hazard to be negligible (Avwiri,2013).

RADIATION DOSE AND HAZARD INDICES CALCULATION
➢Annual Gonadal Dose Equivalent
AGED (μSvy-1) = 3.09CRa + 4.18CTh + 0.314CK
➢Excess Lifetime Cancer Risk.
ELCR= HE × DL × RF
➢ Representative Gamma Index,
Iγ= CRa/150 + CTh/100 + CK/1500≤1The value of Iγ must be less than unity in orderto keep the radiation hazard insignificant.
RESULTS AND DISCUSSION
S/N Sampling location Sampling
coding
Elevation
(m)
Latitude
(E)
Longitude
(N)
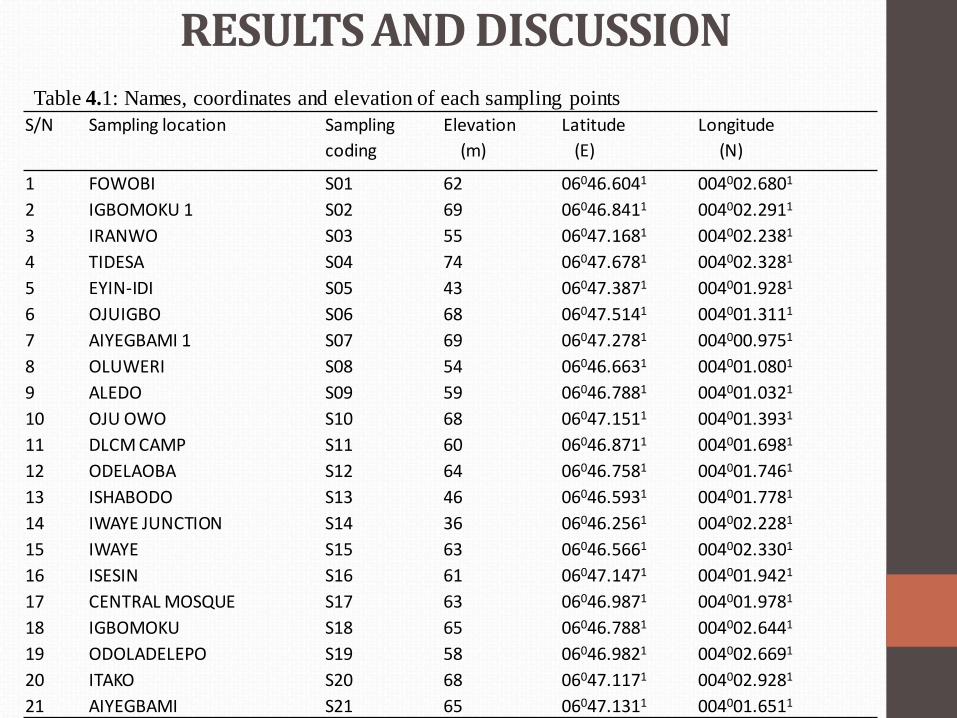
1 FOWOBI S01 62 06046.6041 004002.6801
2 IGBOMOKU 1 S02 69 06046.8411 004002.2911
3 IRANWO S03 55 06047.1681 004002.2381
4 TIDESA S04 74 06047.6781 004002.3281
5 EYIN-IDI S05 43 06047.3871 004001.9281
6 OJUIGBO S06 68 06047.5141 004001.3111
7 AIYEGBAMI 1 S07 69 06047.2781 004000.9751
8 OLUWERI S08 54 06046.6631 004001.0801
9 ALEDO S09 59 06046.7881 004001.0321
10 OJU OWO S10 68 06047.1511 004001.3931
11 DLCM CAMP S11 60 06046.8711 004001.6981
12 ODELAOBA S12 64 06046.7581 004001.7461
13 ISHABODO S13 46 06046.5931 004001.7781
14 IWAYE JUNCTION S14 36 06046.2561 004002.2281
15 IWAYE S15 63 06046.5661 004002.3301
16 ISESIN S16 61 06047.1471 004001.9421
17 CENTRAL MOSQUE S17 63 06046.9871 004001.9781
18 IGBOMOKU S18 65 06046.7881 004002.6441
19 ODOLADELEPO S19 58 06046.9821 004002.6691
20 ITAKO S20 68 06047.1171 004002.9281
21 AIYEGBAMI S21 65 06047.1311 004001.6511
Table 4.1: Names, coordinates and elevation of each sampling points

Geological map showing the bedrock types that underlie the study area
Ijebu - Ife
4001’00” 4001’30” 4002’00” 4003’00”60 46’00
”60 4
6’30
”60 4
7’00
”60 4
7’30
”60 4
8’00
”
4002’30”
4001’00” 4001’30” 4002’00” 4003’00”4002’30”
6046’00”
6046’30”
6047’00”
6047’30”
6048’00”
1.0km0.50
Sampling points
Dual carriage
LEGEND
Sandstone and limestone
Roads 21
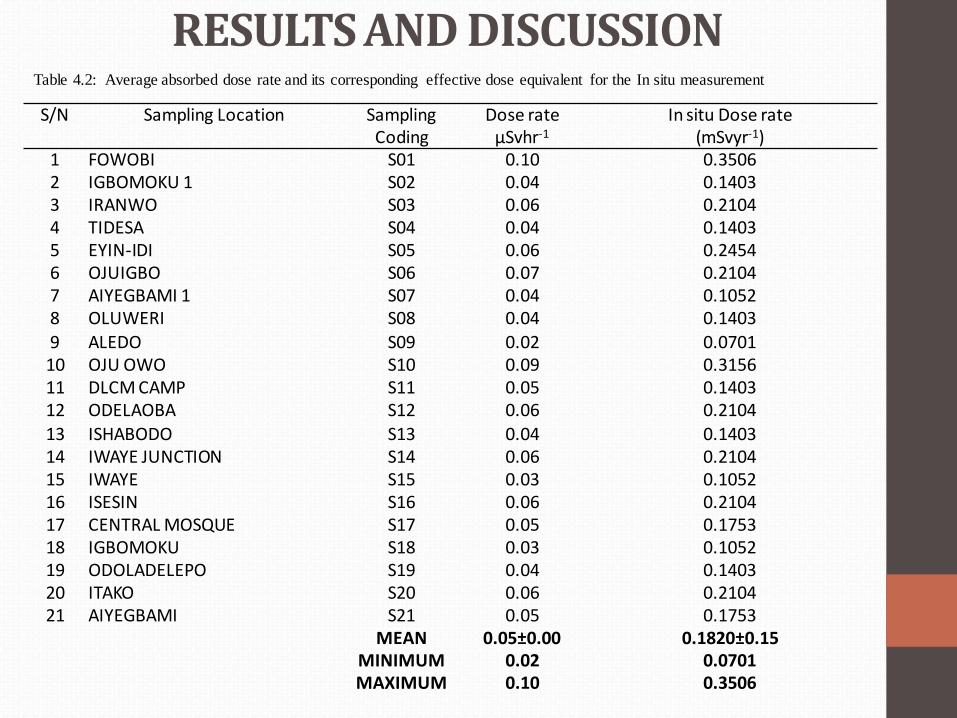
RESULTS AND DISCUSSION
S/N Sampling Location SamplingCoding
Dose rateµSvhr-1
In situ Dose rate (mSvyr-1)
1 FOWOBI S01 0.10 0.35062 IGBOMOKU 1 S02 0.04 0.14033 IRANWO S03 0.06 0.21044 TIDESA S04 0.04 0.14035 EYIN-IDI S05 0.06 0.24546 OJUIGBO S06 0.07 0.21047 AIYEGBAMI 1 S07 0.04 0.10528 OLUWERI S08 0.04 0.1403
9 ALEDO S09 0.02 0.070110 OJU OWO S10 0.09 0.315611 DLCM CAMP S11 0.05 0.140312 ODELAOBA S12 0.06 0.210413 ISHABODO S13 0.04 0.140314 IWAYE JUNCTION S14 0.06 0.210415 IWAYE S15 0.03 0.105216 ISESIN S16 0.06 0.210417 CENTRAL MOSQUE S17 0.05 0.175318 IGBOMOKU S18 0.03 0.105219 ODOLADELEPO S19 0.04 0.140320 ITAKO S20 0.06 0.210421 AIYEGBAMI S21 0.05 0.1753
MEANMINIMUMMAXIMUM
0.05±0.000.020.10
0.1820±0.150.07010.3506
Table 4.2: Average absorbed dose rate and its corresponding effective dose equivalent for the In situ measurement
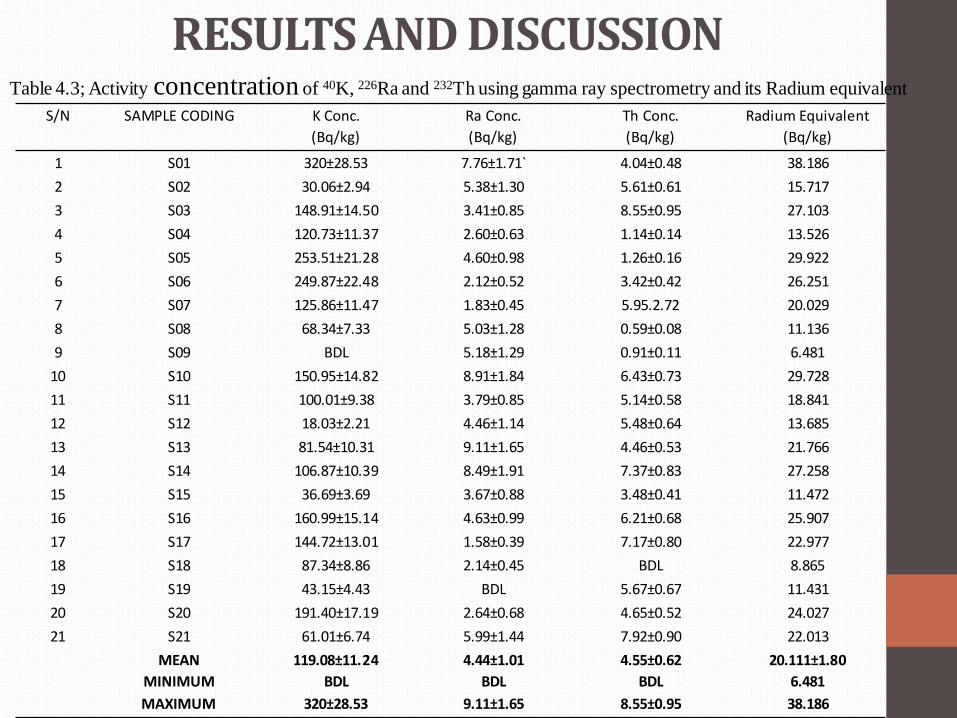
RESULTS AND DISCUSSION
S/N SAMPLE CODING K Conc.
(Bq/kg)
Ra Conc.
(Bq/kg)
Th Conc.
(Bq/kg)
Radium Equivalent
(Bq/kg)
1 S01 320±28.53 7.76±1.71` 4.04±0.48 38.186
2 S02 30.06±2.94 5.38±1.30 5.61±0.61 15.717
3 S03 148.91±14.50 3.41±0.85 8.55±0.95 27.103
4 S04 120.73±11.37 2.60±0.63 1.14±0.14 13.526
5 S05 253.51±21.28 4.60±0.98 1.26±0.16 29.922
6 S06 249.87±22.48 2.12±0.52 3.42±0.42 26.251
7 S07 125.86±11.47 1.83±0.45 5.95.2.72 20.029
8 S08 68.34±7.33 5.03±1.28 0.59±0.08 11.136
9 S09 BDL 5.18±1.29 0.91±0.11 6.481
10 S10 150.95±14.82 8.91±1.84 6.43±0.73 29.728
11 S11 100.01±9.38 3.79±0.85 5.14±0.58 18.841
12 S12 18.03±2.21 4.46±1.14 5.48±0.64 13.685
13 S13 81.54±10.31 9.11±1.65 4.46±0.53 21.766
14 S14 106.87±10.39 8.49±1.91 7.37±0.83 27.258
15 S15 36.69±3.69 3.67±0.88 3.48±0.41 11.472
16 S16 160.99±15.14 4.63±0.99 6.21±0.68 25.907
17 S17 144.72±13.01 1.58±0.39 7.17±0.80 22.977
18 S18 87.34±8.86 2.14±0.45 BDL 8.865
19 S19 43.15±4.43 BDL 5.67±0.67 11.431
20 S20 191.40±17.19 2.64±0.68 4.65±0.52 24.027
21 S21 61.01±6.74 5.99±1.44 7.92±0.90 22.013
MEAN
MINIMUM
MAXIMUM
119.08±11.24
BDL
320±28.53
4.44±1.01
BDL
9.11±1.65
4.55±0.62
BDL
8.55±0.95
20.111±1.80
6.481
38.186
Table 4.3; Activity concentration of 40K, 226Ra and 232Th using gamma ray spectrometry and its Radium equivalent

RESULTS AND DISCUSSION
0
50
100
150
200
250
300
350
400
450
Act
ivit
y co
nce
ntr
atio
n B
q/k
g
sample code
K
U
th
Figure 5; Activity concentration of 40K, 226Ra and 232Th using gamma ray spectrometry and its Radium equivalent

RESULTS AND DISCUSSION
S/N SAMPLE CODING Absorbed dose rate
nGyhr-1
Annual Effective dose
mSvhr-1
External hazard index Internal hazard index
1 S01 19.753 0.0485 0.1031 0.1241
2 S02 7.304 0.0179 0.0434 0.0570
3 S03 13.519 0.0332 0.0731 0.0824
4 S04 7.056 0.0173 0.0365 0.0436
5 S05 13.699 0.0336 0.0700 0.0824
6 S06 13.914 0.0342 0.0719 0.0766
7 S07 10.132 0.0249 0.0541 0.0590
8 S08 5.477 0.0134 0.0301 0.0437
9 S09 2.814 0.0069 0.0185 0.0315
10 S10 14.552 0.0357 0.0803 0.1044
11 S11 9.321 0.0229 0.0519 0.0611
12 S12 6.307 0.0155 0.0370 0.0490
13 S13 10.349 0.0254 0.0598 0.0834
14 S14 13.010 0.0322 0.0746 0.0966
15 S15 5.449 0.0134 0.0310 0.0409
16 S16 13.011 0.0319 0.0710 0.0825
17 S17 11.644 0.0286 0.0620 0.0663
18 S18 4.669 0.0115 0.0249 0.0297
19 S19 5.609 0.0138 0.0319 0.0309
20 S20 12.436 0.0305 0.0659 0.0720
21 S21 10.424 0.0256 0.0595 0.0756
MEAN
MINIMUM
MAXIMUM
10.025±0.92
2.814
19.753
0.0246±0.00
0.0069
0.0485
0.0543±0.05
0.0185
0.1031
0.0663±0.06
0.0297
0.1241
Table 4.4:Air absorbed dose rates, annual effective dose and external hazard index for soils of Ijebu-Ife, Ogun State.
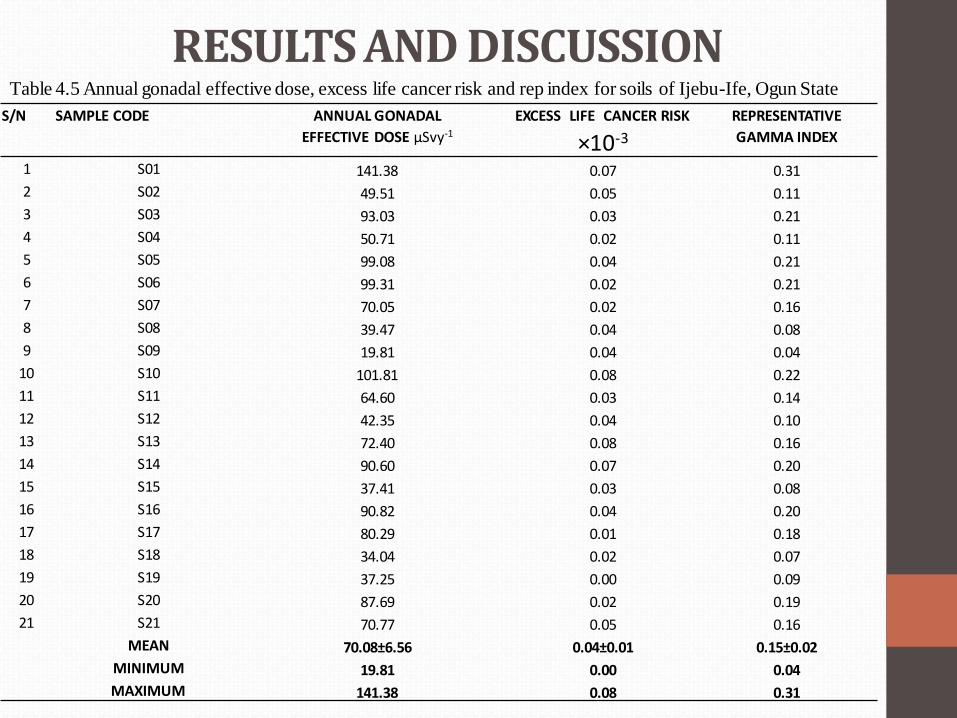
RESULTS AND DISCUSSIONS/N SAMPLE CODE ANNUAL GONADAL
EFFECTIVE DOSE μSvy-1
EXCESS LIFE CANCER RISK
×10-3
REPRESENTATIVE
GAMMA INDEX
1 S01 141.38 0.07 0.31
2 S02 49.51 0.05 0.11
3 S03 93.03 0.03 0.21
4 S04 50.71 0.02 0.11
5 S05 99.08 0.04 0.21
6 S06 99.31 0.02 0.21
7 S07 70.05 0.02 0.16
8 S08 39.47 0.04 0.08
9 S09 19.81 0.04 0.04
10 S10 101.81 0.08 0.22
11 S11 64.60 0.03 0.14
12 S12 42.35 0.04 0.10
13 S13 72.40 0.08 0.16
14 S14 90.60 0.07 0.20
15 S15 37.41 0.03 0.08
16 S16 90.82 0.04 0.20
17 S17 80.29 0.01 0.18
18 S18 34.04 0.02 0.07
19 S19 37.25 0.00 0.09
20 S20 87.69 0.02 0.19
21 S21 70.77 0.05 0.16
MEAN 70.08±6.56 0.04±0.01 0.15±0.02
MINIMUM 19.81 0.00 0.04
MAXIMUM 141.38 0.08 0.31
Table 4.5 Annual gonadal effective dose, excess life cancer risk and rep index for soils of Ijebu-Ife, Ogun State
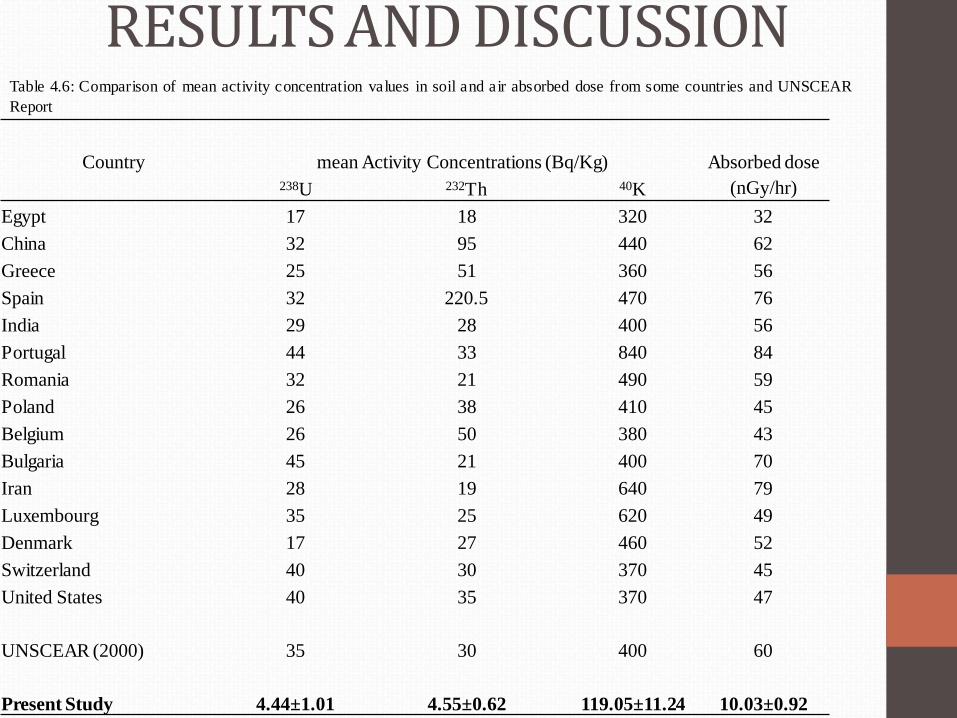
RESULTS AND DISCUSSION
Country mean Activity Concentrations (Bq/Kg) Absorbed dose
238U 232Th 40K (nGy/hr)
Egypt 17 18 320 32
China 32 95 440 62
Greece 25 51 360 56
Spain 32 220.5 470 76
India 29 28 400 56
Portugal 44 33 840 84
Romania 32 21 490 59
Poland 26 38 410 45
Belgium 26 50 380 43
Bulgaria 45 21 400 70
Iran 28 19 640 79
Luxembourg 35 25 620 49
Denmark 17 27 460 52
Switzerland 40 30 370 45
United States 40 35 370 47
UNSCEAR (2000) 35 30 400 60
Present Study 4.44±1.01 4.55±0.62 119.05±11.24 10.03±0.92
Table 4.6: Comparison of mean activity concentration values in soil and air absorbed dose from some countries and UNSCEAR
Report
RESULTS AND DISCUSSION
0
0.05
0.1
0.15
0.2
0.25
0.3
0.35
0.4
S01 S02 S03 S04 S05 S06 S07 S08 S09 S10 S11 S12 S13 S14 S15 S16 S17 S18 S19 S20 S21 MEAN
Efff
ecti
ve d
ose
rate
s (m
Sv/y
r)
Sample code
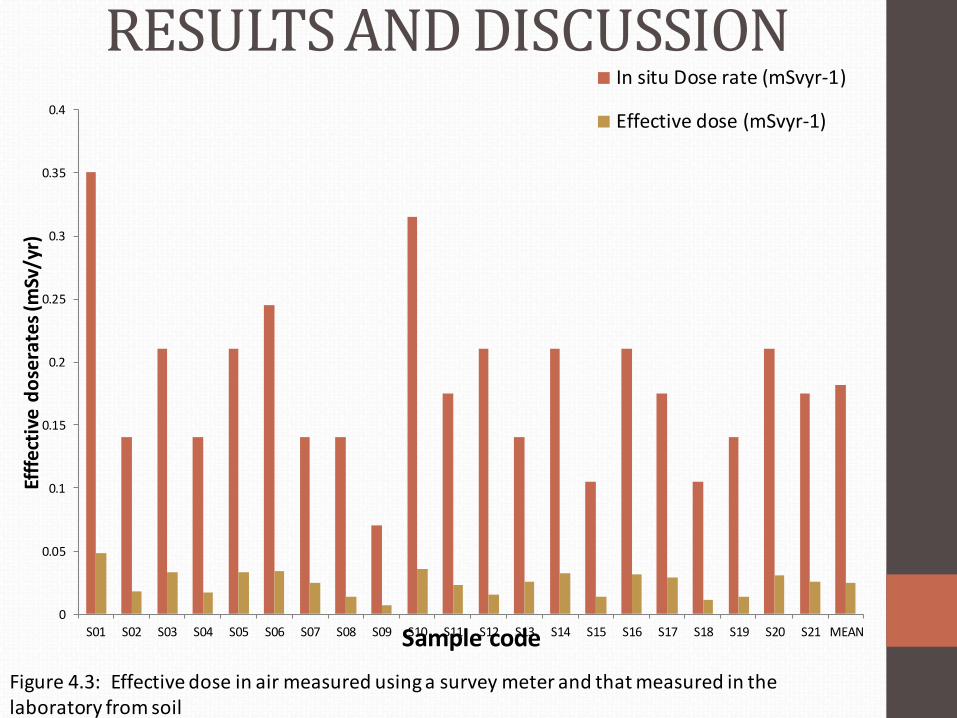
In situ Dose rate (mSvyr-1)
Effective dose (mSvyr-1)
Figure 4.3: Effective dose in air measured using a survey meter and that measured in the laboratory from soil
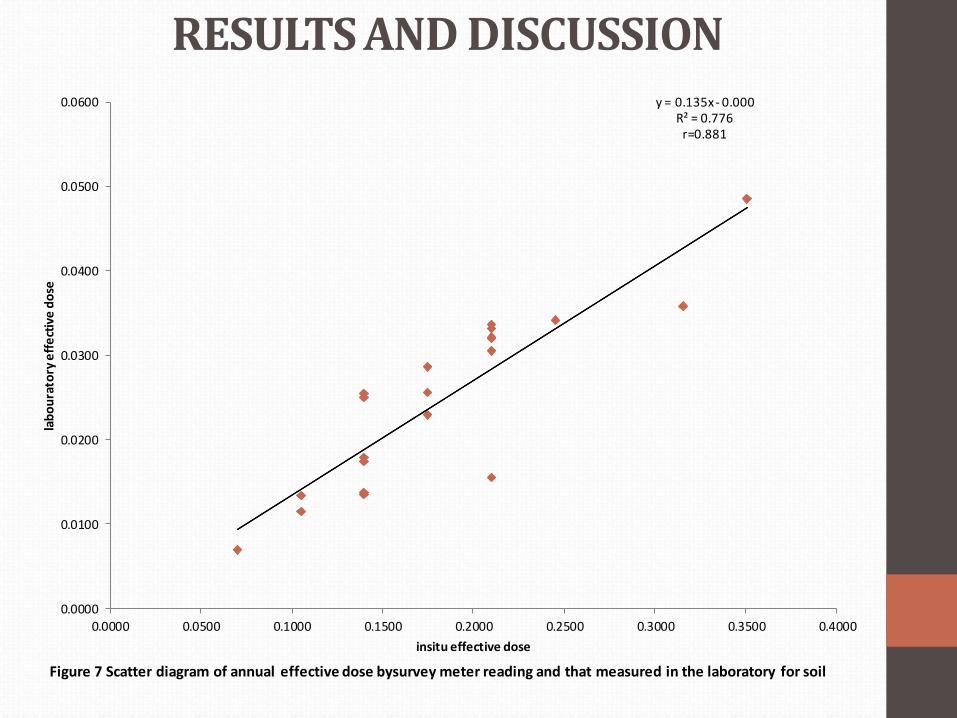
RESULTS AND DISCUSSIONy = 0.135x - 0.000
R² = 0.776r=0.881
0.0000
0.0100
0.0200
0.0300
0.0400
0.0500
0.0600
0.0000 0.0500 0.1000 0.1500 0.2000 0.2500 0.3000 0.3500 0.4000
lab
ou
rato
ry e
ffe
ctiv
e d
ose
insitu effective dose
Figure 7 Scatter diagram of annual effective dose bysurvey meter reading and that measured in the laboratory for soil

RESULTS AND DISCUSSION
CONCLUSION
➢ Activity concentration of Naturally occurringradionuclide are below the recommendedworld average values .
➢ Low radioactivity level implies the presenceof sand stone and lime stones as theunderlying soil (Ramasamy et al., 2009).

CONCLUSION➢Ijebu- Ife Ogun state is safe for living,
agricultural and other purposes, since theradiation doses are well below the worldaverage values recommended by UNSCEAR,(2000).
➢Ijebu-Ife Ogun State have no or insignificantradiological hazards since the radiologicalhazards calculated are less than unity
CONCLUSION ➢ In-situ measured effective dose was found to
be higher than that measured from the activityconcentration of naturally occurringradionuclide in the laboratory. Akinwale et al.,2015).
➢The generally low radiation level is due to thetype of geology and underlying rock/soils(limestone and sand stone) present in the studyarea.
CONCLUSION
High composition of quartz in the study areaalso enhance the low concentration ofradionuclides.

RECOMMENDATION
• Regular monitoring should be conducted totake care of unforeseen eventualities thatmay arise due to day to day human activities.
• Radiation level of other bedrocks typesaround the study area can be measured forcomparrism study
CONTRIBUTION TO KNOWLEDGE
The following have been achieved:
❖The activity concentrations of naturally occurring radionuclides in soil of Ijebu-Ife have been measured.
❖In-situ radiation level have been measured
❖The radiological doses and hazard indices of the soil samples have been evaluated.

CONTRIBUTION TO KNOWLEDGE
❖In-situ and laboratory measurement of effective dose was compared
❖Mineralogical characterization of soils in the study area have been determined.
❖The radiation level has been related with the geological and mineralogical characterization of the study area
Selected references• Abdel-Razek, Y.A., Abu-Diab, A.A. and Bakhit, A.F. 2012. Correlation between
the Concentrations of the Heavy Minerals and the Terrestrial Radioactivity at El Massaid and El Kharrouba, Sinai, Egypt. X1 Radiation Physics & Protection conference, 25-28 November 2012, Nasr City-Cairo, Egypt.
• Adewale, O.O., Tubosun, I.A., Ojo, J.O.(2015). Assessment Of Terrestrial Naturally Occurring Radioactive Material In Soil And Mine Tailings Of AwoAnd Ede, Osun-State. Nigeria. Ife Journal Of Science Vol. 17, No. 1 (2015)
• Agbalagba, E.O., Avwiri,G.O. and Chad-Umoren, Y.E. 2012. Gross Alpha and Beta Activity Concentration and Estimation of Adults and Infants Dose Intake in Surface and Ground Water of Ten Oil Fields Environment in Western Niger Delta of Nigeria.Journal Applied Science Environ Manage 17 (2):269-279.
• Akintola, A.I., Ikhane, P.R., Okunola, O.A., Akintola, G.O. and Adekoya, A.A. 2012. Geochemical Features of the Precambrian Pan-African Pegmatities of Ijebu-Ife Area, South Western Nigeria. Environmental, Ecology and management 1(1): 38-61.
• Avwiri, G.O., Osimobi, J.C. and Agbalagba, E.O. 2013.Evaluation of Natural Occurring Radionuclide Variation with Lithology Depth Profile of Udi and Ezeagu Local Government Areas of Enugu State, Nigeria.
• Ayar,A., Dogru, M., Acik, Y., Sahin, S. and Gulbayrak, C. 2005. Evaluation of Indoor and Outdoor Natural Gamma Radiation Levels in Public Schools of Eastern Turkish City of Elazig. International Conference on Children’s Environmental Health in Central Asia, CEHCA, Almaty/Kazakhstan.

SELECTED REFERENCES• Chad-Umoren, Y.E. and Ohwekevwo, E. 2012.Influence of Crude Oil Spillage
on the Gamma-Radiation Status of Water and Soil in Ogba/Egbema/NdoniArea, Nigeria. Energy and Environment Research; 3(2); 45- 52.
• Coker, J.O., Mustapha, A.O., Makinde, V. and Adesodun, J.K. 2014. Radiometric Survey to determine the Terrestrial Gamma Radiation Levels: A Case Study of Sagamu and Abeokuta, Southwestern Nigeria. International Journal of Pure and Applied Science Technology 21(1):31-38.
• Dowdall, M. and O’Dea, J. 2002. Ra-226/U-238 Disequilibrium in an Upland Organic Soil Exhibiting Elevated Natural Radioactivity. Journal of .Environmental Radioactivity 59 (1): 91-104.
• European Commission, Radiation Protection 112, Radiological Protection Principles Concerning the Natural Radioactivity of Building Materials, Brussels, European Commission, 1999.
• Farai, I.P. and Vincent, U.E. 2006.Outdoor Radiation Level Measurement in Abeokuta, Nigeria byThermo LuminescentDissymmetry. Nigerian Journal of Physics 18(1):121-126.
• Gbadebo, A.M. 2011. Natural Radionuclides Distribution in the Granitic Rocks and Soils of abandoned Quarry Sites, Abeokuta, South Western Nigeria. Asian Journal of Applied Sciences, 4(2): 176-185.
• Gholami, M., Mirzaei, S. and Jomehzadeh, A. 2011.Gamma Background Radiation Measurement in Lorestan Province, Iran.Iran Journal Radiation Res., 9(2): 89-93.