+ All Categories
Home > Documents > Distribution of neurotransmitter ... - ruhr-uni-bochum.de

Distribution of neurotransmitter ... - ruhr-uni-bochum.de

Date post: 25-Oct-2021
Category:
Upload: others
View: 3 times
Download: 0 times
Share this document with a friend
23
Distribution of Neurotransmitter Receptors and Zinc in the Pigeon (Columba livia) Hippocampal Formation: A Basis for Further Comparison With the Mammalian Hippocampus Christina Herold, 1 * Verner P. Bingman, 2 Felix Strockens, 3 Sara Letzner, 3 Magdalena Sauvage, 4 Nicola Palomero-Gallagher, 5 Karl Zilles, 5,6 and Onur Gunturkun 3 1 C. & O. Vogt Institute of Brain Research, University of Dusseldorf, 40225 Dusseldorf, Germany 2 Department of Psychology and J.P. Scott Center for Neuroscience, Bowling Green State University, Bowling Green, Ohio 43403 3 Department of Biopsychology, Institute of Cognitive Neuroscience, Faculty of Psychology, Ruhr-University Bochum, 44780 Bochum, Germany 4 Research Department of Neuroscience, Mercator Research Group “Structure of Memory,” Faculty of Medicine, Ruhr-University Bochum, 44780 Bochum, Germany 5 Institute of Neuroscience and Medicine INM-1, Research Center Julich, 52425 Julich, Germany 6 Department of Psychiatry, Psychotherapy and Psychosomatics, RWTH Aachen University, and JARA—Translational Brain Medicine, 52074 Aachen, Germany ABSTRACT The avian hippocampal formation (HF) and mammalian hippocampus share a similar functional role in spatial cognition, but the underlying neuronal mechanisms allowing the functional similarity are incompletely understood. To understand better the organization of the avian HF and its transmitter receptors, we analyzed binding site densities for glutamatergic AMPA, NMDA, and kainate receptors; GABA A receptors; muscarinic M 1 ,M 2 and nicotinic (nACh) acetylcholine receptors; noradrenergic a 1 and a 2 receptors; serotonergic 5-HT 1A receptors; dopaminergic D 1/5 receptors by using quanti- tative in vitro receptor autoradiography. Additionally, we performed a modified Timm staining procedure to label zinc. The regionally different receptor densities mapped well onto seven HF subdivisions previously described. Several differences in receptor expression highlighted distinct HF subdivisions. Notable examples include 1) high GABA A and a 1 receptor expression, which ren- dered distinctive ventral subdivisions; 2) high a 2 recep- tor expression, which rendered distinctive a dorsomedial subdivision; 3) distinct kainate, a 2 , and muscarinic receptor densities that rendered distinctive the two dorsolateral subdivisions; and 4) a dorsomedial region characterized by high kainate receptor density. We further observed similarities in receptor binding densities between subdivisions of the avian and mam- malian HF. Despite the similarities, we propose that 300 hundred million years of independent evolution has led to a mosaic of similarities and differences in the organization of the avian HF and mammalian hippocam- pus and that thinking about the avian HF in terms of the strict organization of the mammalian hippocampus is likely insufficient to understand the HF of birds. J. Comp. Neurol. 522:2553–2575, 2014. V C 2014 Wiley Periodicals, Inc. INDEXING TERMS: hippocampus; entorhinal cortex; receptor; avian; autoradiography; zinc In both mammals and birds, the hippocampal forma- tion (HF) plays a similar role in spatial cognition (Colombo and Broadbent, 2000; Bingman et al., 2005) and shows comparable neuroanatomical, neurochemi- cal, and electrophysiological characteristics (Bingman et al., 2005). The overall homology between the mam- malian and avian HF is well established (Reiner et al., Grant sponsor: Alexander von Humboldt-Stiftung (to V.P.B.); Grant sponsor: HGF Program “Function and Dysfunction of the Nervous Sys- tem” (to K.Z.); Grant sponsor: Deutsche Forschungsgemeinschaft; Grant number: SFB874 (to O.G.). *CORRESPONDENCE TO: Christina Herold, C. & O. Vogt Institute of Brain Research, University of Dusseldorf, 40225 Dusseldorf, Germany. E-mail: [email protected] Received August 16, 2013; Revised January 17, 2014; Accepted January 21, 2014. DOI 10.1002/cne.23549 Published online January 29, 2014 in Wiley Online Library (wileyonlinelibrary.com) V C 2014 Wiley Periodicals, Inc. The Journal of Comparative Neurology | Research in Systems Neuroscience 522:2553–2575 (2014) 2553 RESEARCH ARTICLE
Transcript

Distribution of Neurotransmitter Receptors and Zincin the Pigeon (Columba livia) Hippocampal Formation:A Basis for Further Comparison With the MammalianHippocampus

Christina Herold,1* Verner P. Bingman,2 Felix Str€ockens,3 Sara Letzner,3 Magdalena Sauvage,4

Nicola Palomero-Gallagher,5 Karl Zilles,5,6 and Onur G€unt€urk€un3

1C. & O. Vogt Institute of Brain Research, University of D€usseldorf, 40225 D€usseldorf, Germany2Department of Psychology and J.P. Scott Center for Neuroscience, Bowling Green State University, Bowling Green, Ohio 434033Department of Biopsychology, Institute of Cognitive Neuroscience, Faculty of Psychology, Ruhr-University Bochum, 44780

Bochum, Germany4Research Department of Neuroscience, Mercator Research Group “Structure of Memory,” Faculty of Medicine, Ruhr-University

Bochum, 44780 Bochum, Germany5Institute of Neuroscience and Medicine INM-1, Research Center J€ulich, 52425 J€ulich, Germany6Department of Psychiatry, Psychotherapy and Psychosomatics, RWTH Aachen University, and JARA—Translational Brain Medicine,

52074 Aachen, Germany

ABSTRACTThe avian hippocampal formation (HF) and mammalian

hippocampus share a similar functional role in spatial

cognition, but the underlying neuronal mechanisms

allowing the functional similarity are incompletely

understood. To understand better the organization of

the avian HF and its transmitter receptors, we analyzed

binding site densities for glutamatergic AMPA, NMDA,

and kainate receptors; GABAA receptors; muscarinic

M1, M2 and nicotinic (nACh) acetylcholine receptors;

noradrenergic a1 and a2 receptors; serotonergic 5-HT1A

receptors; dopaminergic D1/5 receptors by using quanti-

tative in vitro receptor autoradiography. Additionally, we

performed a modified Timm staining procedure to label

zinc. The regionally different receptor densities mapped

well onto seven HF subdivisions previously described.

Several differences in receptor expression highlighted

distinct HF subdivisions. Notable examples include 1)

high GABAA and a1 receptor expression, which ren-

dered distinctive ventral subdivisions; 2) high a2 recep-

tor expression, which rendered distinctive a

dorsomedial subdivision; 3) distinct kainate, a2, and

muscarinic receptor densities that rendered distinctive

the two dorsolateral subdivisions; and 4) a dorsomedial

region characterized by high kainate receptor density.

We further observed similarities in receptor binding

densities between subdivisions of the avian and mam-

malian HF. Despite the similarities, we propose that

300 hundred million years of independent evolution has

led to a mosaic of similarities and differences in the

organization of the avian HF and mammalian hippocam-

pus and that thinking about the avian HF in terms of

the strict organization of the mammalian hippocampus

is likely insufficient to understand the HF of birds. J.

Comp. Neurol. 522:2553–2575, 2014.

VC 2014 Wiley Periodicals, Inc.

INDEXING TERMS: hippocampus; entorhinal cortex; receptor; avian; autoradiography; zinc

In both mammals and birds, the hippocampal forma-

tion (HF) plays a similar role in spatial cognition

(Colombo and Broadbent, 2000; Bingman et al., 2005)

and shows comparable neuroanatomical, neurochemi-

cal, and electrophysiological characteristics (Bingman

et al., 2005). The overall homology between the mam-

malian and avian HF is well established (Reiner et al.,

Grant sponsor: Alexander von Humboldt-Stiftung (to V.P.B.); Grantsponsor: HGF Program “Function and Dysfunction of the Nervous Sys-tem” (to K.Z.); Grant sponsor: Deutsche Forschungsgemeinschaft;Grant number: SFB874 (to O.G.).

*CORRESPONDENCE TO: Christina Herold, C. & O. Vogt Institute ofBrain Research, University of D€usseldorf, 40225 D€usseldorf, Germany.E-mail: [email protected]

Received August 16, 2013; Revised January 17, 2014;Accepted January 21, 2014.DOI 10.1002/cne.23549Published online January 29, 2014 in Wiley Online Library(wileyonlinelibrary.com)VC 2014 Wiley Periodicals, Inc.

The Journal of Comparative Neurology | Research in Systems Neuroscience 522:2553–2575 (2014) 2553

RESEARCH ARTICLE

2004; Jarvis et al., 2013), but what continues to con-

cern researchers is uncertainty with respect to what, if

any, areas of the avian HF correspond to the well-

defined dentate gyrus (DG) and Ammon’s horn (CA3

and CA1 in particular) of the mammalian hippocampus.

The avian HF (Fig. 1) can be coarsely divided into

ventromedial (V-complex), dorsomedial (DM), and dorso-

lateral (DL) subdivisions. Further subdivisions (ventro-

medial Tr, Vl, and Vm; dorsomedial DMd and DMv; and

dorsolateral DLd and DLv; Fig. 2) have been described

(Erichsen et al., 1991; Kahn et al., 2003; Atoji and Wild,

2004). Erichsen et al. (1991) proposed that the medial

(Vm) and lateral (Vl) dense cell layers of the V-complex

correspond to areas of Ammon’s horn, the area

between the two cell layers (Tr) to the hilar region, and

the dorsomedial HF (DMd and DMv) to the dentate

gyrus (DG). However, they acknowledged uncertainty

with respect to a dentate gyrus-like structure in the

avian HF. The tracing study of Kahn et al. (2003) and

Sz�ek�ely and Krebs (1996) in zebra finch (Taeniopygia

guttata) essentially led to the same conclusions with

respect to the interclass comparisons of Erichsen et al.

(1991). By contrast, Atoji and Wild (2004) proposed,

based on connectivity data and kainic acid lesions, that

the cell layers of the V-complex actually correspond to

the DG, whereas an Ammon’s horn-like subdivision is

found in DM. Timm staining for zinc is a powerful

marker for mossy fibers in mammals and has also been

used to search for a DG mossy fiber-like system in bird

species other than pigeons (Faber et al., 1989; Aboitiz,

1993; Montagnese et al., 1993, 1996; T€omb€ol et al.,

2000b), but those Timm staining studies failed to reveal

distinct, rat-like fiber labeling in the HF of birds. How-

ever, zinc labeling has been used to classify different

types of glutamatergic synapses that can be found

numerously in the CA fields (Sindreu et al., 2003).

To understand better the organization of the avian HF

and its transmitter receptors and to shed light on the

extent to which there are anatomically defined structures

in the avian HF that are comparable to the DG and CA

regions in the mammalian hippocampus, we mapped the

distribution of 11 different neurotransmitter receptors in

the pigeon HF. Our goal was to describe the regional

receptor expression in the pigeon hippocampal formation

as well as to characterize the receptor organization of HF

in distinct subdivisions. We then compared the receptor

binding data with published data for the hippocampus in

different mammalian species (Kraemer et al., 1995;

Palomero-Gallagher et al., 2003; Topic et al., 2007; Cremer

et al., 2011). To complement the receptor data, we further

carried out a zinc-staining procedure in the pigeon.

MATERIALS AND METHODS

Receptor autoradiographyWe examined a total of six adult pigeons (Columba

livia) of unknown sex. Animals were obtained from local

breeders and were housed in individual cages (30 3 30

3 45 cm) in a temperature (21�C 6 1�C)- and humidity-

controlled room with a 12-hour light/dark circle. The

subjects had access to grit, food, and water ad libitum.

All experimental procedures were approved by national

authorities (LANUV NRW, Germany) and were carried

out in accordance with the National Institutes of Health

Guide for care and use of laboratory animals. Animals

were decapitated and the brains removed from the

skull, frozen immediately in isopentane at 240�C, and

stored at 270�C. Serial coronal 10-lm sections were

cut with a cryostat microtome (2800 Frigocut E; Reich-

ert-Jung). Sections were thaw mounted on gelatinized

slides, freeze dried, and stained with a modified cell

body staining for cytoarchitectonic analysis or proc-

essed for receptor autoradiography (Merker, 1983;

Palomero-Gallagher et al., 2008).

Details of the autoradiographic labeling procedure have

been published elsewhere (Zilles et al., 2002a,b; Schleicher

et al., 2005). Binding protocols are summarized in Table 1.

Three steps were performed in the following sequence: 1)

A preincubation step removed endogenous ligand from the

tissue. 2) During the main incubation step, binding sites

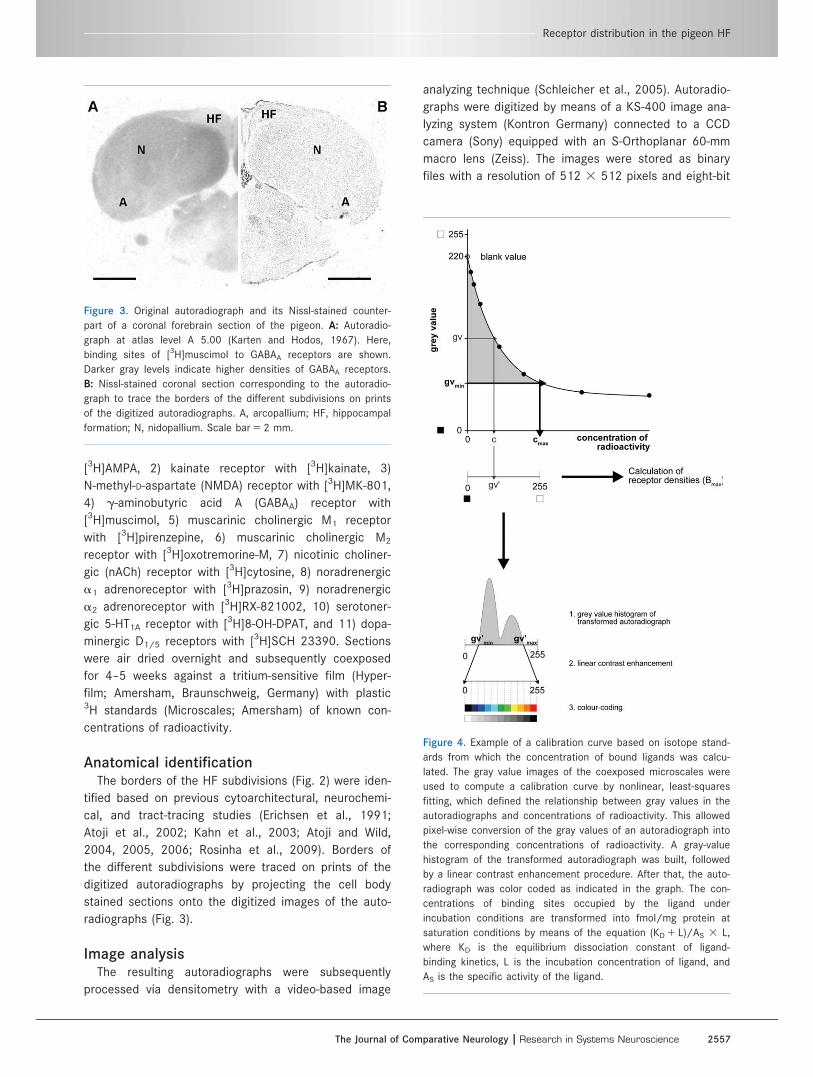
Figure 1. Nissl-stained transverse section of the forebrain of the

pigeon. A: Full transverse section at atlas level A 6.75 (Karten

and Hodos, 1967). The boxed area indicates the region of inter-

est, the hippocampal formation. At bottom, a lateral view of the

pigeons brain was prepared that indicates the location of the

plane of the illustrated section (not scaled). B: Enlarged image of

the hippocampal formation labeled in A. A, arcopallium; DM, dor-

somedial region of HF; DL, dorsolateral region of HF; HF, hippo-

campal formation; N, nidopallium; V-complex, region that

comprises the ventral subdivisions of the HF. Scale bars 5 2.5

mm in A; 500 lm in B.

C. Herold et al.

2554 The Journal of Comparative Neurology |Research in Systems Neuroscience

were labeled with tritiated ligand (total binding). Coincuba-

tion of the tritiated ligand and a 1,000–10,000-fold excess

of an appropriate nonlabeled ligand (displacer) determined

nonspecific and thus nondisplaceable binding. Specific

binding is the difference between total and nonspecific

binding. 3) A final rinsing step eliminated unbound radioac-

tive ligand from the sections.

The following binding sites were labeled according to

the above-cited protocols: 1) a-amino-3-hydroxy-5-

methyl-4-isoxalone propionic acid (AMPA) receptor with

Figure 2. Nissl-stained and schematic representation of the pigeon hippocampal formation subdivision boundaries from rostrocaudal atlas

levels A 4.00 to A 9.50 (Karten and Hodos, 1967). A–E: Nissl-stained coronal sections of the hippocampal formation. F–J: Nissl-stained

coronal section with the boundaries following Atoji and Wild (2004, 2006). K–O: Schematic representation of the subdivision scheme used

to map the receptor densities and zinc labeling. The hippocampal formation in the pigeon comprises seven regions: the V-complex, con-

sisting of the ventrolateral (Vl) and ventromedial (Vm) cell bands and the cellular inner triangular region (Tr), the dorsomedial region DM

and its ventral (DMv) and dorsal (DMd) subdivisions, and the dorsolateral region DL and its ventral (DLv) and dorsal (DLd) subdivisions.

Scale bar 5 500 lm.

Receptor distribution in the pigeon HF

The Journal of Comparative Neurology | Research in Systems Neuroscience 2555

TAB

LE

1.

Incu

bati

on

Co

nd

itio

ns

Use

dfo

rR

ece

pto

rA

uto

rad

iog

rap

hy

Rece

pto

r

3H

ligan

d

(in

cub

ati

on

con

cen

trati

on

)

Dis

pla

cer

(in

cub

ati

on

con

cen

trati

on

)In

cub

ati

on

bu

ffer

Pre

incu

bati

on

step

Main

incu

bati

on

step

Rin

sin

gst

ep

AM

PA

[3H

]AM

PA

(10

nM

)Q

uis

quala

te(1

0l

M)

50

mM

Tris

-ace

tate

(pH

7.2

)3

31

0m

inat

4� C

inin

cub

ati

on

buff

er

45

min

at

4� C

inin

cub

a-

tion

buff

er1

10

0m

MK

SC

N

43

4se

cat

4� C

inin

cu-

bati

on

buff

er1

23

2se

cat

4� C

inace

tone/

glu

tara

ldehyd

eK

ain

ate

[3H

]kain

ate

(8nM

)K

ain

ate

(10

0l

M)

50

mM

Tris

-cit

rate

(pH

7.1

)3

31

0m

inat

4� C

inin

cub

ati

on

buff

er

45

min

at

4� C

inin

cub

a-

tion

buff

er1

10

mM

Ca-

ace

tate

43

4se

cat

4� C

inin

cu-

bati

on

buff

er1

23

2se

cat

4� C

inace

tone/

glu

tara

ldehyd

eN

MD

A[3

H]M

K-8

01

(5nM

)M

K-8

01

(10

0l

M)

50

mM

Tris

-HC

l(p

H7

.2)

15

min

at

25� C

inin

cub

ati

on

buff

er

60

min

at

25� C

inin

cub

a-

tion

buff

er1

30

lM

gly

cine

15

0lM

sperm

idin

e

23

5m

inat

4� C

inin

cu-

bati

on

buff

er

Musc

ari

nerg

icch

olin

erg

icM

1

[3H

]pir

enze

pin

e(1

nM

)P

irenze

pin

e(1

0l

M)

Mod

ifie

dK

reb

s-R

inger

buff

er

(pH

7.4

)2

0m

inat

25� C

inin

cub

ati

on

buff

er

60

min

at

25� C

inin

cub

a-

tion

buff

er

23

5m

inat

4� C

inin

cu-

bati

on

buff

er

Musc

ari

nerg

icch

olin

erg

icM

2

[3H

]oxo

trem

ori

ne-M

(0.8

nM

)C

arb

ach

ol

(1l

M)

20

mM

Hep

es-

Tris

(pH

7.5

)11

0m

MM

gC

l 2

20

min

at

25� C

inin

cub

ati

on

buff

er

60

min

at

25� C

inin

cub

a-

tion

buff

er

23

2m

inat

4� C

inin

cu-

bati

on

buff

er

Nic

oti

nic

cholin

erg

ic[3

H]c

ytis

ine

(1nM

)N

icoti

ne

(10

lM

)5

0m

MTr

is-H

Cl

(pH

7.4

)11

20

mM

NaC

l15

mM

KC

l11

mM

MgC

l 21

2.5

mM

CaC

l 2

15

min

at

22� C

inin

cub

ati

on

buff

er

90

min

at

4� C

inin

cub

a-

tion

buff

er

23

2m

inat

4� C

inin

cu-

bati

on

buff

er

a1

Ad

renore

cep

tor

[3H

]pra

zosi

n(0

.2nM

)P

hento

lam

ine

(10

lM

)5

0m

MTr

is-H

Cl

(pH

7.4

)3

0m

inat

37� C

inin

cub

ati

on

buff

er

45

min

at

30� C

inin

cub

a-

tion

buff

er

23

5m

inat

4� C

inin

cu-

bati

on

buff

er

a2

Ad

renore

cep

tor

[3H

]UK

-14

30

4(1

.4nM

)[3

H]R

X-8

21

00

2(6

nM

)

Nora

dre

nalin

e(1

00

lM

)(–

)ad

renalin

e(1

0l

M)

50

mM

Tris

-HC

l(p

H7

.7)1

10

0l

MM

nC

l 25

0m

MTr

is-H

Cl

(pH

7.4

)11

00

mM

MnC

l 21

0.1

%A

scorb

icaci

d1

0.3

lM

8-O

H-D

PA

T

15

min

at

22� C

inin

cub

ati

on

buff

er

30

min

at

22� C

inin

cub

ati

on

buff

er

90

min

at

22� C

inin

cub

a-

tion

buff

er

30

min

at

22� C

inin

cub

ati

on

buff

er

5m

inat

4� C

inin

cub

ati

on

buff

er

23

20

sec

at

4� C

inin

cub

ati

on

buff

er

GA

BA

A[3

H]m

usc

imol

(6nM

)G

AB

A(1

0lM

)5

0m

MTr

is-c

itra

te(p

H7

.0)

33

5m

inat

4� C

inin

cub

ati

on

buff

er

40

min

at

4� C

inin

cub

a-

tion

buff

er

33

3se

cat

4� C

inin

cu-

bati

on

buff

er

Sero

tonin

erg

ic5

-HT 1

A

[3H

]8

-OH

-DP

AT

(1nM

)S

ero

tonin

(10

lM

)1

70

mM

Tris

-HC

l(p

H7

.6)1

4m

MC

aC

l 21

0.0

1%

Asc

orb

icaci

d

30

min

at

22� C

inin

cub

ati

on

buff

er

60

min

at

22� C

inin

cub

a-

tion

buff

er

13

5m

inat

4� C

inin

cu-

bati

on

buff

er

Dop

am

inerg

icD

1/

5[3

H]S

CH

-23

39

0(0

.5nM

)S

KF

83

56

6(1

lM

)5

0m

MTr

is-H

Cl

(pH

7.4

)11

20

mM

NaC

l15

mM

KC

l12

mM

CaC

l 21

1m

MM

gC

l 21

1l

MM

ianse

rin

20

min

at

22� C

inin

cub

ati

on

buff

er

90

min

at

22� C

inin

cub

a-

tion

buff

er

23

10

min

at

4� C

inin

cu-

bati

on

buff

er

C. Herold et al.

2556 The Journal of Comparative Neurology |Research in Systems Neuroscience

[3H]AMPA, 2) kainate receptor with [3H]kainate, 3)

N-methyl-D-aspartate (NMDA) receptor with [3H]MK-801,

4) g-aminobutyric acid A (GABAA) receptor with

[3H]muscimol, 5) muscarinic cholinergic M1 receptor

with [3H]pirenzepine, 6) muscarinic cholinergic M2

receptor with [3H]oxotremorine-M, 7) nicotinic choliner-

gic (nACh) receptor with [3H]cytosine, 8) noradrenergic

a1 adrenoreceptor with [3H]prazosin, 9) noradrenergic

a2 adrenoreceptor with [3H]RX-821002, 10) serotoner-

gic 5-HT1A receptor with [3H]8-OH-DPAT, and 11) dopa-

minergic D1/5 receptors with [3H]SCH 23390. Sections

were air dried overnight and subsequently coexposed

for 4–5 weeks against a tritium-sensitive film (Hyper-

film; Amersham, Braunschweig, Germany) with plastic3H standards (Microscales; Amersham) of known con-

centrations of radioactivity.

Anatomical identificationThe borders of the HF subdivisions (Fig. 2) were iden-

tified based on previous cytoarchitectural, neurochemi-

cal, and tract-tracing studies (Erichsen et al., 1991;

Atoji et al., 2002; Kahn et al., 2003; Atoji and Wild,

2004, 2005, 2006; Rosinha et al., 2009). Borders of

the different subdivisions were traced on prints of the

digitized autoradiographs by projecting the cell body

stained sections onto the digitized images of the auto-

radiographs (Fig. 3).

Image analysisThe resulting autoradiographs were subsequently

processed via densitometry with a video-based image

analyzing technique (Schleicher et al., 2005). Autoradio-

graphs were digitized by means of a KS-400 image ana-

lyzing system (Kontron Germany) connected to a CCD

camera (Sony) equipped with an S-Orthoplanar 60-mm

macro lens (Zeiss). The images were stored as binary

files with a resolution of 512 3 512 pixels and eight-bit

Figure 3. Original autoradiograph and its Nissl-stained counter-

part of a coronal forebrain section of the pigeon. A: Autoradio-

graph at atlas level A 5.00 (Karten and Hodos, 1967). Here,

binding sites of [3H]muscimol to GABAA receptors are shown.

Darker gray levels indicate higher densities of GABAA receptors.

B: Nissl-stained coronal section corresponding to the autoradio-

graph to trace the borders of the different subdivisions on prints

of the digitized autoradiographs. A, arcopallium; HF, hippocampal

formation; N, nidopallium. Scale bar 5 2 mm.

Figure 4. Example of a calibration curve based on isotope stand-

ards from which the concentration of bound ligands was calcu-

lated. The gray value images of the coexposed microscales were

used to compute a calibration curve by nonlinear, least-squares

fitting, which defined the relationship between gray values in the

autoradiographs and concentrations of radioactivity. This allowed

pixel-wise conversion of the gray values of an autoradiograph into

the corresponding concentrations of radioactivity. A gray-value

histogram of the transformed autoradiograph was built, followed

by a linear contrast enhancement procedure. After that, the auto-

radiograph was color coded as indicated in the graph. The con-

centrations of binding sites occupied by the ligand under

incubation conditions are transformed into fmol/mg protein at

saturation conditions by means of the equation (KD 1 L)/AS 3 L,

where KD is the equilibrium dissociation constant of ligand-

binding kinetics, L is the incubation concentration of ligand, and

AS is the specific activity of the ligand.

Receptor distribution in the pigeon HF

The Journal of Comparative Neurology | Research in Systems Neuroscience 2557

gray value. The gray-value images of the coexposed

microscales were used to compute a calibration curve

by nonlinear, least-squares fitting, which defined the

relationship between gray values in the autoradiographs

and concentrations of radioactivity that were then indi-

cated in the color-coded autoradiographs (see Fig. 4).

This allowed the pixel-wise conversion of the gray

values of an autoradiograph into the corresponding

concentration of radioactivity. The concentrations of

binding sites occupied by a ligand under incubation

conditions are transformed into fmol/mg protein at

saturation conditions by means of the equation

(KD 1 L)/AS 3 L, where KD is the equilibrium dissocia-

tion constant of ligand-binding kinetics, L is the incuba-

tion concentration of ligand, and AS is the specific

activity of the ligand.

For the analysis of each ligand for each subdivision

for a given pigeon, we attempted to sample HF, in the

left hemisphere, at six evenly distributed anterior–pos-

terior levels between A 9.5 and A 4.0 according to the

atlas of Karten and Hodos (1967). However, for some

ligands in some individuals, the tissue was not of suffi-

cient quality to carry out an analysis at all six levels,

and receptor concentrations were derived from the tis-

sue available and based on fewer than six sections.

Also, not all subdivisions extend across the entire

anterior–posterior range sampled. For example, the

V-complex is not discernible at more anterior levels,

and DLd and DMd are not discernible at more posterior

levels (Fig. 2); as a result, fewer than six sections were

used for these subdivisions. The mean of the gray val-

ues contained in a specific HF subdivision over the

sampled AP levels from one animal was then trans-

formed into a receptor concentration (fmol/mg protein).

The mean of each ligand in each subdivision averaged

across the six animals was then reported as the recep-

tor concentration. All receptor-binding densities are pre-

sented as mean 6 SEM. Quantitative, multireceptor

data are presented in regional fingerprints that were

prepared as polar plots that separately show the

density of a single receptor type for all subdivisions

(Fig. 5).

Statistical analysisFor comparisons (see below), it was useful to deter-

mine whether any difference in receptor densities

among the HF subdivisions, either visually or quantita-

tively revealed, was statistically verifiable. To do this,

we first applied a Friedman ANOVA across all subdivi-

sions for each ligand. If significant, pair-wise compari-

sons were run with the Wilcoxon-rank test. For all

statistical analyses, Statistica 10 (StatSoft, Tulsa, OK)

was used. The significance level was set at 0.05.

Zinc labelingFor the zinc-labeling procedure, an additional five

adult pigeons of unknown sex obtained from local

breeders were used. Pigeons were housed in individual

cages (30 3 30 3 45 cm) in a temperature

(21�C 6 1�C)- and humidity-controlled room with a 12-

hour light–dark circle. The subjects had access to grit,

food, and water ad libitum. All experimental procedures

were approved by national authorities (LANUV NRW,

Germany) and were carried out in accordance with the

National Institutes of Health Guide for care and use of

laboratory animals. All subjects were transcardially per-

fused for 5 min with a 0.1% Na2S in phosphate-buffered

solution (105 mM NaH2PO4 � 2H2O in distilled H2O, pH

set to 6.35 with NaOH) using an average pressure of

15 ml/min (modified from Danscher and Zimmer,

1978). The brain was removed and incubated for 3

hours in a 5% phosphate-buffered Acrolein solution for

immersion fixation, followed by rinsing for twice for 30

min and twice for 5 min in PB. After incubation for 24

hours in 30% sucrose in PB for cryoprotection, brains

were cut into 25-lm thin frontal sections using a micro-

tome (Leica Microsystems, Wetzlar, Germany). Every

tenth section was mounted on slides. Slides were

rinsed for 5 min in distilled water and briefly dried at

30�C.

For the zinc staining, four solutions were prepared.

1) Gum arabic, 450 g, was dissolved in 900 ml distilled

H2O and stirred for 5 days. After a few hours of precipi-

tation, the supernatant was collected and the precipi-

tate discarded. The Gum arabic solution can be stored

at 220� until further use. 2) Citric acid monohydrate

(C6H8O7 � H2O), 5 g, was dissolved in 12.5 ml distilled

H2O. After complete dissolving of citric acid monohy-

drate, 4.85 g trisodium citrate dihydrate (Na3C6H5O7 �2H2O) was added to the solution. The solution was

then filled to 20 ml with distilled H2O. 3) Hydroquinone,

1.7 g, was dissolved in 30 ml distilled H2O. 4) Silver

nitrate, 0.21 g, was dissolved in 30 ml distilled H2O.

Because the solution is light sensitive, it has to be pro-

tected from light all the time.

One hundred twenty-five milliliters of the gum arabic

solution was mixed with solutions 2–4 and stirred for 5

min. The emergent developer solution was poured into

an opaque plastic box, and sections were incubated in

the developer solution for 3–4 hours. When staining

had reached a sufficient intensity, as determined visu-

ally, the sections were removed from the developer

solution and washed under running tap water for 15

minutes. After incubation in H2O overnight, slices were

dehydrated and embedded/coverslipped in DPX

(Sigma-Aldrich). It was crucial to use high-grade H2O to

C. Herold et al.

2558 The Journal of Comparative Neurology |Research in Systems Neuroscience

Figure 5. Receptor fingerprints of the pigeon hippocampal formation (HF) subdivisions. The coordinate polar plots (A–K) show the individual

receptor densities in fmol/mg protein for all subdivisions. The black lines connecting the mean densities of the receptors in each subdivision

define the shape of the fingerprint so the reader can quickly notice substantial differences in the distribution of receptors in all subdivisions

of the HF. As demonstrated in the fingerprint, glutamatergic AMPA and NMDA receptors are very similarly distributed in the pigeon HF, with

high densities in all areas and a decline in DMd, whereas the high kainate receptors densities in DMd and DLd cause a peak in these subdi-

visions. GABAA receptor densities peaked in the Vl region and showed a decline in DMd. Muscarinic M1 and M2 receptors showed the same

fingerprint shape. Densities differed substantially between DLv and the other subdivisions, which resulted in a substantial peak in the west–

north direction of their polar plots. By contrast, nicotinic receptors were densely distributed in DMv, Tr, and DLd. Noradrenergic a1 and a2

substantially differed in their distributions. Very intense labeling for a1 was found in the V-complex, so the northeast direction dominates the

shape of its fingerprint. By contrast, a2 receptor levels were high in DMv and the DL regions. 5-HT1A receptor distributions, although with

much lower densities, were similar to the GABAA receptor distributions but showed no break in DMd. Finally, D1/5 receptor distribution was

similar to the M2 distribution. Note that the scales in A–K are different. DMd, dorsal part of the dorsomedial region of HF; DMv, ventral part

of the dorsomedial region of HF; DLd, dorsal part of dorsolateral region of HF; DLv, ventral part of dorsolateral region of HF; Tr, triangular

region of the ventromedial region of HF; Vm, ventromedial part of the V-complex; Vl, ventrolateral part of the V-complex.

Receptor distribution in the pigeon HF

prevent any metal or chloride ions from contaminating

working solutions or labware until completing incuba-

tion in developer solution, because such ions can inter-

fere with autometallographic zinc labeling.

Sections were analyzed with a Zeiss Axio Imager M1

Microscope (Carl Zeiss) with 32.5 objective. HF images

at A 9.50, A 8.00, A 6.50, and A 5.00 (according to the

atlas of Karten and Hodos, 1967) were taken with an

AxioCam MRM (Carl Zeiss) and the software AxioVison

4.8 (Carl Zeiss) with an exposure time of 8.4 msec.

To demonstrate that the observed labeling was spe-

cific to zinc, we carried out two control procedures.

One control pigeon was perfused without using Na2S.

For a second control pigeon, the developer solution

was prepared without silver nitrate. Further steps were

performed as described above.

RESULTS

Figure 2 displays representative Nissl-stained sections

and schematic images of the HF subdivisions used to

map the receptor radiographs and zinc labeling. Begin-

ning ventromedially and moving dorsolaterally, we subdi-

vided HF into a ventromedial region (V-complex) with a

medial cell layer (Vm), triangular region (Tr), lateral cell

layer (Vl), dorso-dorsomedial region (DMd), ventro-

dorsomedial region (DMv), dorso-dorsolateral region

(DLd) and ventro-dorsolateral region (DLv).

Figure 6. Color-coded autoradiographs showing the distribution and density of AMPA, kainate, NMDA, GABAA, M1, M2, nicotinic cholinergic

(nACh), a1, a2 5-HT1A, and D1/5 receptors in coronal sections through the pigeon HF around rostrocaudal level A 4.00 (A–L). Densities can

be read using the scale for each receptor on the top of each autoradiograph. Note that the end of the red scale indicates the best fit for the

investigated HF substructures but not the maximal densities. White outlines show the location of the ventricle. Scale bar 5 1.3 mm.

C. Herold et al.

2560 The Journal of Comparative Neurology |Research in Systems Neuroscience

Receptor-binding site densities in the HFBinding site densities of all receptors are presented

in a two-dimensional polar coordinate plot to construct

a multireceptor fingerprint for each analyzed receptor

for all HF subdivisions (see Fig. 5). Glutamatergic AMPA

and NMDA receptors and GABAergic GABAA receptors

displayed the highest densities. By contrast, muscari-

nergic cholinergic M1, serotonergic 5-HT1A, and dopami-

nergic D1/5 receptors displayed low densities

throughout HF (see Fig. 5). As illustrated in the color-

coded autoradiographs, in general, most of the HF sub-

divisions were labeled by glutamate and GABAA recep-

tors, and it is noteworthy that noradrenergic a1 and a2

receptors nicely resolved some subdivisions (Figs. 6, 7).

All receptor binding site densities are given in fmol/mg

protein.

AMPAComparisons between all studied subdivisions using a

Friedman ANOVA showed significant regional differences

Figure 7. Color-coded autoradiographs showing the distribution and density of AMPA, kainate, NMDA, GABAA, M1, M2, nicotinic cholinergic

(nACh), a1, a2 5-HT1A, and D1/5 receptors in coronal sections through the pigeon HF around rostrocaudal level A 6.50 (A–L). Densities can

be read using the scale for each receptor on the top of each autoradiograph. Note that the end of the red scale indicates the best fit for the

investigated HF substructures but not the maximal densities. The white outlines show the location of the ventricle. Scale bar 5 1.1 mm.

Receptor distribution in the pigeon HF

The Journal of Comparative Neurology | Research in Systems Neuroscience 2561

of the AMPA receptor densities (v2 [N 5 6,

df 5 6] 5 25.64, P< 0.001). AMPA receptor concentra-

tions varied from 1,164 6 77 fmol/mg in DMd to

1,802 6 58 fmol/mg in Dlv (Figs. 5–7). A high receptor

density was also found in Tr (1,777 6 80 fmol/mg). In

general, densities of the dorsolateral subdivisions were

higher than those of the dorsomedial subdivisions, with

DMd showing the lowest binding site densities among

the dorsal regions. Densities in DLd were higher than

densities in DMd (N 5 6, T 5 1, P< 0.05), and DLv was

different from DMv and DMd (both N 5 6, T 5 0,

P< 0.05). AMPA receptor labeling clearly separated DMd

and DMv from the V-complex, which showed higher bind-

ing site densities. DMv and DMd showed lower densities

of AMPA receptors than Tr and Vl (all N 5 6, T 5 0,

P< 0.05), and only DMd was additionally different from

Vm (N 5 6, T 5 0, P< 0.05). DMd was also different

from DMv. DMv displayed a binding site density of

1,611 6 67 fmol/mg, which was about 50% higher com-

pared with DMd (N 5 6, T 5 0, P< 0.05). Within the V-

complex, the higher receptor density in Tr can be distin-

guished from Vm (N 5 6, T 5 0, P< 0.05).

KainateThe densities of kainate receptors varied between the

HF subdivisions (v2 [N 5 6, df 5 6] 5 29.50, P< 0.001).

Highest densities for kainate receptors were detected

in DLd (398 6 15 fmol/mg) and lowest in DMv

(238 6 23 fmol/mg; Figs. 5–7). In the dorsolateral

region, DLd and DLv showed different binding site den-

sities (N 5 6, T 5 0, P< 0.05). More than any other

ligand, labeling of kainate in DMd, with a concentration

of 328 6 23 fmol/mg, clearly separated it from sur-

rounding subdivisions as DMd displayed lower densities

than DLd and higher densities than DMv (both N 5 6,

T 5 0, P< 0.05; Fig. 8). In the V-complex, a stepwise

decrease in kainate binding site concentration could be

observed from Vl (303 6 29 fmol/mg) to Tr (289 6 27

fmol/mg) to Vm (245 6 23 fmol/mg; Vl and Tr: N 5 6,

T 5 1, P< 0.05; Tr and Vm: N 5 6, T 5 0, P< 0.05; Vl

and Vm: N 5 6, T 5 0, P< 0.05; Fig. 5).

NMDASimilarly to AMPA receptors, NMDA receptors were

highly expressed in HF. The Friedman ANOVA revealed

a significant overall effect (v2 [N 5 6, df 5 6] 5 26.57,

P< 0.001). The highest amounts of NMDA labeling

were detected in Tr (1,855 6 83 fmol/mg) and the

Figure 8. Color-coded autoradiographs and zinc labeling in the

pigeon hippocampal formation (HF). A–J: Color-coded autoradio-

graphs of selected receptors at selected rostrocaudal levels from

A 4.00 to A 9.50 highlighting subdivision differences designated

by different receptor densities. Red areas indicated high receptor

densities; blue areas showed low receptor densities. K–O: Subdi-

vision differences in zinc labeling observed in the pigeon HF from

rostrocaudal levels A 4.00 to A 9.50. Black areas were high in

zinc, and light gray areas were low in zinc.

C. Herold et al.

2562 The Journal of Comparative Neurology |Research in Systems Neuroscience

lowest in DMd (1,297 6 76 fmol/mg; Figs. 5–7). Bind-

ing site densities for NMDA receptors were homogene-

ously distributed throughout DLd (1,543 6 141 fmol/

mg) and DLv (1,646 6 85 fmol/mg; N 5 6, T 5 5, n.s.).

Dorsomedially, DMv showed considerably higher con-

centrations of NMDA receptor labeling (1639 6 98

fmol/mg) than DMd (N 5 6, T 5 0, P< 0.05). Further-

more, DMv was clearly distinct with respect to the V-

complex (DMv and Tr: N 5 6, T 5 0, P< 0.05; DMv and

Vl and DMv and Vm: both N 5 6, T 5 1, P< 0.05). In

the V-complex, Tr showed a higher density of NMDA

receptors compared with Vm (N 5 6, T 5 0, P< 0.05)

but not Vl (N 5 6, T 5 2, n.s.). However, Vl showed a

higher density (1,768 6 82 fmol/mg) than Vm

(1,456 6 93 fmol/mg; N 5 6, T 5 0, P< 0.05). Notably,

NMDA displayed a relatively more homogeneous bind-

ing site pattern in rostral HF compared with the more

regionally distinctive pattern in caudal HF (Figs. 6, 7).

GABAA

GABAA receptor densities varied from 807 6 72 fmol/

mg protein in Vl to 221 6 33 fmol/mg in DMd (v2

[N 5 6, df 5 6] 5 28.79, P< 0.001; Figs. 5–8). The dor-

solateral regions DLd (588 6 54 fmol/mg) and DLv

(658 6 40 fmol/mg) showed an approximately threefold

higher receptor concentration compared with DMd

(221 6 33 fmol/mg). DMd showed lower GABAA recep-

tor density than DLv, DLd, and DMv (all N 5 6, T 5 0,

P< 0.05), and DMv (415 6 55 fmol/mg) showed lower

densities than DLd (N 5 6, T 5 1, P< 0.05) and DLv

(N 5 6, T 5 0, P< 0.05). Furthermore, DMv and DMd

differed from all V-complex subdivisions (all N 5 6,

T 5 0, P< 0.05, except for DMv and Vm: N 5 6, T 5 1,

P< 0.05). Indeed, the low GABAA receptor densities in

DMd and DMv clearly separate the entire DM from the

neighboring ventromedial and dorsolateral regions (Figs.

6–8). In the V-complex, GABAA receptor densities

decreased from Vl (807 6 72 fmol/mg) to Tr (601 6 57

fmol/mg) to Vm (546 6 43 fmol/mg; Figs. 5–8). How-

ever, significant differences could be detected only

between Vl and Tr (N 5 6, T 5 0, P< 0.05) and Vl and

Vm (N 5 6, T 5 0, P< 0.05).

M1

Muscarinergic cholinergic M1 receptors were barely

detectable throughout HF (Figs. 5–7). Modestly high

receptor densities could be seen in DLd (69 6 7 fmol/

mg) and DLv (107 6 5 fmol/mg). In the rest of HF, M1

receptor density ranged between 27 6 3 fmol/mg in

Vm and 57 6 7 fmol/mg in DMv. Statistical analysis

revealed a significant regional overall effect (v2 [N 5 6,

df 5 6] 5 34.64, P< 0.001). Subsequent post hoc anal-

yses showed that all subdivisions displayed different

densities of M1 receptors compared with each other (all

N 5 6, T 5 0, P< 0.05), except for the comparisons

between DLd and DMv (N 5 6, T 5 4, n.s.) and DMd

and Tr (N 5 6, T 5 5, n.s.; Figs. 5–7).

M2

M2 receptor binding resulted in a clear parcellation of

HF into its subdivisions (Figs. 5–7). Lowest densities

were detected in DMd (64 6 13 fmol/mg), with highest

densities (267 6 24 fmol/mg) in DLv. The Friedman

ANOVA resulted in a significant overall effect (v2

[N 5 6, df 5 6] 5 29.43, P< 0.001). DLv showed higher

amounts of M2 receptors than DLd (179 6 13 fmol/mg;

N 5 6, T 5 1, P< 0.05) and DMv (111 6 22 fmol/mg;

N 5 6, T 5 0, P< 0.05). The densities of M2 receptor in

DMd were lower than in all other regions (all N 5 6,

T 5 0; P< 0.05). Receptor density decreased from Vl

(140 6 20 fmol/mg) to Tr (125 6 23 fmol/mg; N 5 6,

T 5 0, P< 0.05) to Vm (97 6 14 fmol/mg protein; com-

pared with Tr N 5 6, T 5 1, P< 0.05). DMv densities

were not different from any subdivision of the V-

complex (Vl N 5 6, T 5 3, n.s.; TR and Vm N 5 6, T 5 6,

n.s.; Figs. 5–7).

nAChBinding sites for nACh receptors showed an inverse pat-

tern of densities in DLd and DLv compared with both

muscarinergic cholinergic receptor types (Figs. 5–8). A

significant overall effect was detected with the Friedman

ANOVA (v2 [N 5 6, df 5 6] 5 27.57, P< 0.001). The con-

centration of nACh receptors was higher in DLd

(228 6 22 fmol/mg) compared with DLv (167 6 16

fmol/mg; N 5 6, T 5 0, P< 0.05). Highest binding site

density was detected in DMv (273 6 31 fmol/mg). DMd

(190 6 18 fmol/mg) displayed a lower binding density

for nACh receptors than DMv and DLd (both N 5 6,

T 5 0, P< 0.05). Density for nACh receptors in DMv was

also higher compared with DLd, DLv, Vl (172 6 15 fmol/

mg) and Vm (166 6 18 fmol/mg; all N 5 6, T 5 0,

P< 0.05) but not Tr (262 6 32 fmol/mg; Figs. 5–8).

a1

The Friedman ANOVA revealed a significant regional

effect of noradrenergic a1 receptors in the pigeon HF

(v2 [N 5 6, df 5 6] 5 31,57, P< 0.001). Noradrenergic

a1 receptors were detected at only 16 6 1 fmol/mg in

DMd, but substantially higher amounts of 226 6 11

fmol/mg were found in Tr (Figs. 5–8). DLd (67 6 5

fmol/mg) and DLv (74 6 4 fmol/mg) displayed interme-

diate densities of a1 adrenoreceptors. Vl (172 6 14

fmol/mg) and Vm (177 6 27 fmol/mg) showed similar

a1 receptor densities. The a1 receptor binding with

[3H]prazosin generally rendered the entire V-complex

Receptor distribution in the pigeon HF

The Journal of Comparative Neurology | Research in Systems Neuroscience 2563

distinctive (Figs. 6–8). DMv displayed at least a fourfold

lower density (36 6 4 fmol/mg) than any ventromedial

region and was distinct from all other regions (all

N 5 6, T 5 0, P< 0.05). The lowest density of noradren-

ergic a1 receptors in the HF was detected in DMd (all

N 5 6, T 5 0, P< 0.05).

a2

Whereas a1 adrenoreceptors were highly expressed in

the V-complex, a2 adrenoreceptors showed high den-

sities in the dorsolateral and dorsomedial regions. Den-

sities of a2 adrenoreceptors in the HF varied from

441 6 48 fmol/mg in DMv to 153 6 19 fmol/mg in

DMd (Figs. 5–8). The Friedman ANOVA detected a sig-

nificant regional overall effect (v2 [N 5 6,

df 5 6] 5 30.07, P< 0.001). Densities of a2 adrenore-

ceptors in DMd were threefold lower than in DMv

(N 5 6, T 5 0, P< 0.05; Figs. 5–7). Densities in DMv

were also higher in comparison with the regions of the

V-complex (Vl & Tr N 5 6, T 5 0, P< 0.05; Vm N 5 6,

T 5 1, P< 0.05). In the V-complex, Vl (271 6 28 fmol/

mg) showed higher densities than Tr (201 6 21 fmol/

mg; N 5 6, T 5 0, P< 0.05) but not Vm (220 6 19

fmol/mg; N 5 6, T 5 4, P 5 0.17). The noradrenergic a2

adrenoreceptors were also abundant but unequally dis-

tributed in DLd (418 6 31 fmol/mg) and DLv (354 6 18

fmol/mg; N 5 6, T 5 0, P< 0.05).

5-HT1A

The expression of serotonergic 5-HT1A receptors was

generally low throughout the pigeon HF (Figs. 5–8), and

no significant regional overall differences were detected

(v2 [N 5 6, df 5 6] 5 10.00, P 5 0.15). However, a nota-

bly stronger signal could be found in DMd in some sec-

tions, especially at the border between DMd and DMv

(see, e.g., Fig. 8). However, this stronger signal seemed

to be highly variable across pigeons; no significant dif-

ference was detected between DMd (46 6 3 fmol/mg)

and neighboring DMv (40 6 3 fmol/mg), DLd (44 6 5

fmol/mg), or DLv (42 6 3 fmol/mg). Densities in the V-

complex varied and showed the highest value in Vl

(60 6 10 fmol/mg).

D1/5

Dopaminergic D1/5 receptors showed the lowest den-

sities of all measured receptor types (Figs. 5–7). How-

ever, the Friedman ANOVA detected a significant

regional overall effect (v2 [N 5 6, df 5 6] 5 22.86,

P< 0.001). The maximal density was 26 6 3 fmol/mg

in DLv (all comparisons N 5 6, T 5 0, P< 0.05; except

for the comparison between DLv & DLd N 5 6, T 5 1,

P< 0.05). Although D1/5 receptors provided little

obvious separation among the HF subdivisions, the

boundary between DMd and DMv was rendered distinc-

tive by an almost complete lack of D1/5 receptors in

DMd (Figs. 5–7). DMd showed the lowest receptor den-

sity compared with all other DM and DL structures

(13 6 1 fmol/mg; all N 5 6, T 5 0, P< 0.05).

Zinc stainingAlthough we did not see distinct layers of mossy fibers

as found in rat hippocampus (but see Discussion), there

is heterogeneity in the density of labeling that maps

remarkably well onto our subdivision boundaries (Fig. 8).

Moving from ventromedially to dorsolaterally, high zinc

density indicated by the dense black labeling is clearly

seen throughout Vl, Vm, and Tr. This dense labeling is

diminished in DMv, and labeling is virtually nonexistent in

DMd. In dorsolateral DLv, dense labeling is seen again,

but moderate labeling, similarly to DMv, is seen in DLv.

The zinc data clearly indicate a well-defined boundary

between the rich labeling in the V-complex and the

absence of labeling in DMd. Also noteworthy is that zinc

does not seem to distinguish between DMv and DLv.

DISCUSSION

Summary of main findingsBy using receptor autoradiography for 11 different neu-

rotransmitter receptors and zinc staining, we show that

the hippocampal formation of the pigeon can be subdi-

vided into seven subdivisions, which match well with

other subdivisional schemes based on neurotransmitter

distribution (Erichsen et al., 1991) and connectivity (Kahn

et al., 2003; Atoji and Wild, 2004). Additionally, our data

offer a further basis for comparing subdivisions of the

mammalian and avian hippocampal formation. Our

approach has the advantage that we can compare the

receptor architecture of an evolutionarily ancient brain

structure, which retains a similar role in spatial cognition

in species that have had independent evolutionary histor-

ies for about 300 million years. Similarities between birds

and mammals may offer insight into how selective pres-

sure may conserve basic receptor traits regardless of

structural differences. In addition, it remains uncertain

whether clear similarities exist among the subdivisions of

avian and mammalian HF. Therefore, an important goal of

our study was to compare the receptor architecture of

the pigeon and mammalian HF to assess better which, if

any, avian subdivisions may correspond best to the mam-

malian hippocampal DG, CA fields, subiculum, and EC.

Subdivisional organization of the avianhippocampal formation: previous studies

Different criteria have been used to define subdivi-

sions of the HF in diverse bird species (Casini et al.,

C. Herold et al.

2564 The Journal of Comparative Neurology |Research in Systems Neuroscience

1986; Erichsen et al., 1991; Krebs et al., 1991; Monta-

gnese et al., 1996; Sz�ek�ely, 1999; Atoji et al., 2002;

Kahn et al., 2003; Atoji and Wild, 2006; Nair-Roberts

et al., 2006; Suarez et al., 2006; Mayer et al., 2009;

Sherry, 2011). During the first part of the twentieth

century, judging from comparative studies between rep-

tiles and different types of mammals (e.g., rodents,

insectivores, and chiroptera; Rose, 1912) and birds

(e.g., chicken and pigeons; Rose, 1914), Rose divided

the caudal part of the avian dorsomedial forebrain into

a ventrally located Ammon’s formation and a dorsally

located entorhinal area, which, in his opinion, were

comparable to the similarly named regions in mammals

(Rose, 1914, 1926). In 1930, Craigie studied the kiwi’s

(Apteryx australis) brain and named the dense cellular

layer between Rose’s Ammon’s formation and entorhi-

nal area the fascia dentate, which was not included in

Rose’s earlier analysis. A few years later, Craigie (1935)

studied the emu’s (Dromiceius novaehollandiae) brain.

He introduced the terms hippocampal area and parahip-

pocampal area (APH) based on cell types and their

arrangement. However, a clear border between the ven-

tral and dorsal parts of HF as well as between the APH

and the hyperpallium apicale (HA) were not defined.

Furthermore, the HF in most other bird species is con-

siderably smaller than that in the emu, so the emu clas-

sification is difficult to apply to other bird species.

Using Nissl staining and the previous data, Karten

and Hodos (1967) divided the pigeon hippocampal for-

mation into two regions, a hippocampus proper and the

APH. Analysis of neurotransmitters and related enzymes

with immunohistochemical methods offered the first

higher resolution HF subdivision scheme and revealed

seven candidate subdivisions (Erichsen et al., 1991;

Krebs et al., 1991). A later electrophysiological study

was able to resolve five of these subdivisions (Siegel

et al., 2000). Probably the most influential subdivisional

scheme of the avian HF comes from the work of Atoji

and Wild (2004, 2006). Using tract tracing and Nissl

staining, they divided the pigeon hippocampal formation

into a dorsomedial region (DM), a dorsolateral region

(DL), a medial V-complex region (V), which included a

triangular region (Tr) with adjacent ventromedial (Vml)

and ventrolateral (Vll) cell layers. Also located dorsome-

dially were three smaller areas, a magnocellular (Ma), a

parvocellular (Pa), and a cell-poor (Po) region (Atoji and

Wild, 2004, 2006). Additionally, Atoji and Wild (2004,

2006) showed that DM could be further subdivided into

a lateral portion (DMl) and a medial portion (DMm). DL

could also be further subdivided into a dorsal portion

(DLd) and a ventral portion (DLv). It is the subdivisional

scheme of Atoji and Wild (2004) that we used to create

our provisional subdivisional map, and indeed it is

remarkable how well many of the receptors studied

here, as well as the zinc labeling, respected the borders

of these subdivisions.

Boundaries and subdivisions of the pigeonHF based on receptor autoradiography

Consistent with earlier studies using immunohisto-

chemical (Krebs et al., 1991; Erichsen et al., 1991) and

tract tracing (Atoji and Wild, 2004, 2006; Kahn et al.,

2003) analyses, the receptor data indicated relatively

sharp boundaries between the most lateral portions of

HF, namely, DLd and DLv, and laterally adjacent areas

(for some examples see Figs. 6–8). The border between

HA and dorsolateral HF was especially visible with

AMPA, GABAA, M2, a1, a2, and 5-HT1A receptor label-

ing. Densities of AMPA, GABAA, M2, and 5-HT1A recep-

tors were higher in HA than in neighboring DLd and

DLv, whereas densities of a1 and a2 receptors were

lower (quantitative HA data not presented).

More posteriorly, dorsolateral HF has been typically

distinguished from the neighboring dorsolateral corticoid

area (CDL) based on its shape; CDL is characterized as

a uniformly thin wall, whereas DL decreases in thickness

as it approaches CDL laterally (Montagnese et al., 1993;

Atoji and Wild, 2004, 2006). Our ligand maps, by con-

trast, reveal a much clearer boundary. The border

between HF and CDL is particularly distinct with GABAA,

M2, a1, a2, and 5-HT1A receptor labeling (Figs. 6, 7).

Densities of GABAA, a1, and 5-HT1A receptors are higher

in the CDL than in dorsolateral HF, whereas M2 and a2

receptor densities are lower (quantitative data for CDL

not presented; Herold et al., 2011, 2012). Also notable

is that in more caudal HF CDL borders DMd and DMv as

DLd and DLv disappear (for examples see Fig. 8).

Receptor imaging also allowed identification of a

boundary between the HF dorsolateral subdivisions,

DLd and DLv, and the adjacent dorsomedial structures,

DMd and DMv. Densities of AMPA, kainate, GABAA, M1,

M2, and a1 receptors were higher in DLd and DLv,

whereas nACh receptors were lower in DLd and DLv

compared with, in particular, DMv (Figs. 5–7). In gen-

eral, the multireceptor mapping supports the identifica-

tion of seven subdivisions as proposed by Erichsen

et al. (1991) and Atoji and Wild (2004, 2006).

Glutamate receptorsGlutamate AMPA and NMDA receptor densities were

high in all regions of the pigeon HF. AMPA binding did

not vary between DLd and DLv, but clearly separated

DL from DMv. Furthermore, DMd displayed a relatively

low concentration compared with the other regions and

could be clearly separated from DMv. In general, DM

Receptor distribution in the pigeon HF

The Journal of Comparative Neurology | Research in Systems Neuroscience 2565

showed lower densities than the surrounding DL and V-

complex ventromedial regions. In the V-complex, AMPA

binding was lower in Vm compared with Tr. Our results

showed higher AMPA densities in the pigeon HF com-

pared with those reported for [3H]AMPA binding in

marsh tits (Parus palustris) and blue tits (Parus caeru-

leus; Stewart et al., 1999). Furthermore, there seemed

to be no differences in AMPA receptor densities

between DL (their APH) and DM/V-complex (their Hp)

in tits.

An immunhistochemical analysis of glutamatergic

AMPA receptor subunits revealed that GluR1, GluR2/3,

and GluR4 are expressed in the pigeon HF (Rosinha

et al., 2009). Especially GluR1 and GluR2/3 were

expressed pre dominantly in so-called IR and T neurons,

whereas GluR4 was expressed predominantly in so-called

R neurons. IR neurons are multipolar projection neurons,

T neurons are triangular pyramidal neurons, and R neu-

rons are ovoid or stellate cells that may be glial cells or

local interneurons (T€omb€ol et al., 2000a; Atoji et al.,

2002). Rosinha et al. (2009) observed intense labeling for

GluR1 and GluR2/3 in the V-complex, in which we

detected high AMPA receptor densities as well.

Generally fewer kainate receptors were expressed

compared with NMDA or AMPA, but kainate receptors

showed a differential regional distribution pattern. Kai-

nate receptor density reached a maximum in DLd and

DMd, and the lowest densities were measured in DMv.

Again, DMv was distinct from the surrounding DL, ven-

tromedial regions, and DMd. In the V-complex, a step-

wise decrease in receptor density could be detected

from Vl to Tr to Vm. We are aware of no other studies

that have looked at kainate receptor binding in birds.

NMDA receptor binding discriminated mainly among

DMd, DMv, and the V-complex. Highest NMDA receptor

densities were found in Vl and Tr, and the lowest den-

sities were detected in DMd. Similarly to AMPA recep-

tors, NMDA receptor binding in the V-complex

separated Tr from Vm but not Vl. Furthermore, the pat-

tern of NMDA receptors seemed to become increas-

ingly distinctive in the subdivisions of the more caudal

part of HF. Compared with our present results, densito-

metric measurements of NMDA receptor binding with

[3H]MK801 in blue and marsh tits showed the same

overall densities in the HF of blue tits and slightly lower

densities for marsh tits (Stewart et al., 1999). However,

in both marsh and blue tits, there seemed to be only

small overall differences in NMDA receptor densities

between DL (their APH) and DM/V-complex (their Hp).

GABAA receptorExamination of GABAA receptor densities showed again

a clear boundary between HF dorsolateral and dorso-

medial regions. Densities decreased overall from DL to

DMv to DMd. In addition, DMv was different from the

V-complex, which showed higher GABAA receptor den-

sities. Within the V-complex, a decrease from Vl to Tr

to Vm was observed. Earlier binding studies in pigeons

did not show differences in GABAA receptor labeling in

the Hp/APH region (Veenman et al., 1994). However,

our pattern of GABAA receptor density is in general

agreement with results from other bird species looking

at GABAergic neurochemistry. In members of the Corvi-

dae and Paridae, calbindin distribution divides HF into

five main regions, and the medial and the lateral

branches of what would be the V-complex are different

(Montagnese et al., 1993). Glutamate decarboxylase

(GAD; an enzyme in GABAergic interneurons) was found

homogeneously distributed in the neuropil of the pigeon

DM and DL, and in small to medium-sized immunoreac-

tive cells throughout the entire HF (Krebs et al., 1991).

The pattern of GAD was approximately coextensive with

the calbindin staining of Montagnese et al. (1993). As

with the intensely GAD- and calbindin-labeled areas, we

found high densities of GABAA receptors throughout the

entire pigeon DL and Vl. By contrast, GABAA receptors

were relatively weakly expressed in DM, particularly in

DMd.

Cholinergic receptorsThe different cholinergic receptors were each distinctly

distributed throughout the HF. M1 densities were high-

est, followed by M2 and nACh. M1 receptors showed

the highest concentration in DLv and lower densities in

DLd, DMv, and Tr. A low M1 receptor density rendered

DMd distinct from the other regions. In the V-complex,

densities decreased from Vl to Tr to Vm, again showing

a difference in receptor profile between the medial and

the lateral dense cell layers. A similar receptor distribu-

tion pattern was also found for M2 receptors. By con-

trast, nACh receptor binding showed higher densities in

DLd compared with DLv. Both DLv and DLd were differ-

ent from DMv, whereas DMv again was not distinguish-

able from Tr. However, higher densities in Tr separated

this region from Vl and Vm.

Analysis of muscarinic (M-type) receptors with [3H]N-

methyl scopolamine showed no differences in densities

between DM/V-complex (their Hp) and DL (their APH)

in quail (Coturnix coturnix japonica) but higher amounts

of M-type receptors in DL compared with DM/V-com-

plex in starlings (Sturnus vulgaris; Ball et al., 1990). The

densities of M-type receptors in the quail and starling

HF were higher across all major subdivisions compared

with our findings in pigeon. Although the difference

could be explained by species variation, probably more

important is the use of subtype-specific ligands for the

C. Herold et al.

2566 The Journal of Comparative Neurology |Research in Systems Neuroscience

group of M-type receptors in our study. Our binding

protocols label M1 and M2 subtypes separately, which

can explain the higher densities for all M-type receptors

found by Ball et al. (1990). Our findings are also in line

with an earlier autoradiographic study, which showed

only low to moderate densities of M-type receptors,

25–250 fmol/mg protein, in DL and DM/V-complex of

the pigeon (Dietl et al., 1988). As with starlings (Ball

et al., 1990), pigeons showed higher densities of M-

type receptors in DL than in all other HF subregions.

Weak labeling of muscarinic cholinergic receptors was

found in DMd, but nACh receptors occurred at a rela-

tively high density in DMd (see Fig. 5).

Monoaminergic receptorsMonoaminergic receptors showed highly variable den-

sities in the pigeon HF. Highest densities were

observed for noradrenergic a receptors and lowest for

D1/5 receptors a1 Receptors were expressed in the V-

complex region, with highest densities both in Tr and in

Vm. This finding is in contrast to the lower density in

Vl. The a1 receptor density of the V-complex was

clearly different from that of DMv. DMv can be sepa-

rated from DMd, DLd, and DLv by differences in a1

receptor density. However, DLd and DLv could not be

discriminated by their a1 receptor binding. a2 Receptor

binding was higher in DMv and the DL regions. By con-

trast, a2 receptors were more dense in DLd compared

with DLv but did not differ from DMv. Again, DMd was

rendered distinct by its lower a2 receptor density com-

pared with DMv, DLd, and DLv. In the V-complex, a rel-

atively homogeneous distribution of a2 receptors was

detected. Vl showed higher densities compared with Tr

but not Vm. Our results seem to be in line with the dis-

tribution of a2 receptors in the European starling (Hei-

movics et al., 2011). Although not quantified in their

publication, the autoradiographs of the starling HF look

similar to the autoradiographs that we obtained for

pigeons.

Serotonergic 5-HT1A receptors did not differ among

any of the subdivisions. This has already been reported

for DL and the DM/V-complex (APH and Hp, respec-

tively, in Herold et al., 2012). The quantitative result is

somewhat surprising, because a higher density in DMd

was detected by visual inspection in a number of brain

sections (see Figs. 6, 7). Similarly to the neurotransmit-

ter 5-HT labeling in DMd and DMv (DMs and parts of

DMi in Krebs et al., 1991), 5-HT1A receptor labeling in

our study seemed to slowly decrease from rostral to

caudal HF, perhaps obscuring subdivision differences in

5-HT1A receptor density.

Dopaminergic D1/5 receptors were differentially dis-

tributed between DLv and all other subregions. They

reach their highest densities in DLv compared with the

other subregions. Additionally, lower D1/5 densities

were observed in DMd compared with the surrounding

regions. As in our results, tyrosine hydroxylase (TH) was

detected mainly in the dorsal parts of the pigeon HF

(Krebs et al., 1991). In general, the low densities of D1/

5 receptors observed in the pigeon HF are in line with

former studies in pigeons, quails, and chicken (Gallus

gallus; Dietl and Palacios, 1988; Ball et al., 1995;

Schnabel and Braun, 1996; Kleitz et al., 2009).

Comparison with the mammalianhippocampal formation

The avian HF and mammalian hippocampus develop

from the same portion of the telencephalon (Kallen,

1962; Rodriguez et al., 2002), share the same cell

types (Molla et al., 1986; T€omb€ol et al., 2000a), and

have similar neurochemical profiles (Erichsen et al.,

1991; Krebs et al., 1991). A special characteristic of

both the avian HF and the mammalian hippocampus is

adult neurogenesis (Altman, 1962; Barnea and Notte-

bohm, 1994; Eriksson et al., 1998; Hoshooley et al.,

2005; Ming and Song, 2005; Pytte et al., 2007). The

similarities may explain the presumably conserved role

of both the avian HF and the mammalian hippocampus

in cognition (Sherry et al., 1992; Colombo and Broad-

bent, 2000). However, the connections to other brain

areas, e.g., septum, hypothalamus, brainstem nuclei,

and telencephalic sensory processing areas, are not

fully identical (Casini et al., 1986; Atoji and Wild,

2006). Furthermore, the cytoarchitectural differences

between the avian and the mammalian HF have made it

difficult to identify similarities in subdivisional organiza-

tion (but see Erichsen et al., 1991; Kahn et al., 2003;

Atoji and Wild, 2006; Papp et al., 2007).

The mammalian hippocampus is divided into distinct

subregions based on anatomical criteria, DG with the

hilus region, Ammon’s horn (comprising the fields CA1–

CA4), and the subiculum (Amaral and Witter, 1989;

Insausti, 1993; Amunts et al., 2005; Witter, 2007).

Because of the distinct cytoarchitecture of DG and

Ammon’s horn regions, they can be distinguished from

the laterally positioned subiculum and EC. Typically, the

CA regions are densely packed with pyramidal neurons,

whereas the DG is densely packed with granular cells.

In contrast, the avian HF is a more nuclear-like struc-

ture, densely packed with heterogeneous populations of

neurons with a slow transition into the parahippocampal

area (DL). In the mammalian hippocampus, the EC is

part of the parahippocampal area (gyrus parahippocam-

palis) and differs considerably from the hippocampal

Receptor distribution in the pigeon HF

The Journal of Comparative Neurology | Research in Systems Neuroscience 2567

regions (Amaral and Witter, 1989; Insausti, 1993;

Amunts et al., 2005; Witter, 2007).

Different regions of the avian HF, based on tracing

studies, have been proposed to be homologues of the

mammalian DG. Sz�ek�ely and Krebs (1996) and Kahn

et al. (2003) proposed that DM is a homologue of DG

and that the V-complex is a homologue of unspecified

CA fields. Atoji and Wild (2004, 2006), by contrast,

claimed that DM shows properties of both CA and sub-

iculum, whereas the V-shaped structure (our V-com-

plex), because of its intrinsic connections, seems to be

more similar to DG. However, seemingly all researchers

agree that DL is comparable to EC (Sz�ek�ely, 1999; Sie-

gel et al., 2002; Atoji and Wild, 2004; Puelles et al.,

2007; Rattenborg and Martinez-Gonzalez, 2011).

In general, the receptor autoradiographic analysis of

10 different receptor types in the hippocampus of 11

different mammalian species showed that a1, M1, 5-

HT2, GABAA, AMPA, kainate, and NMDA receptor den-

sities were minimally variable across species, whereas

a2, 5-HT1A, and M2 were highly variably expressed (Pal-

omero-Gallagher, 1999). In many of the species studied

and compared with all other hippocampal structures,

CA3 showed the lowest receptor densities (Kraemer

et al., 1995; Palomero-Gallagher, 1999; Zilles et al.,

2000; Cremer et al., 2009). To compare and identify

better the subdivision similarities (and differences)

between pigeon HF and mammalian hippocampus, we

created a summary of the already published receptor

data in the mammalian HF (Table 2). This table provides

the relative receptor densities for each mammalian hip-

pocampal substructure normalized to the mean value of

the investigated receptor type in the total hippocampus.

For better comparisons, we also added the relative den-

sities for each substructure of the pigeon HF. As in the

pigeon, glutamate receptors showed high densities in

the mammalian hippocampus, with higher densities for

AMPA and NMDA compared with kainate receptors (Pal-

omero-Gallagher, 1999; Zilles et al., 2000; Topic et al.,

2007). In rats (Rattus norvegicus) and mice (Mus mus-

culus), CA1 showed the highest densities for AMPA and

NMDA receptors, followed by DG. In contrast, CA3 and

DG were high in kainate receptors (Table 2). Overall,

the following conclusions can be drawn: in comparing

the relative densities of glutamatergic receptors in the

different subdivisions of the rodent hippocampus and

pigeon HF, the most striking similarities exist between

high kainate receptor densities in Vl, Tr, DMd, and DG/

CA3, as well as DLd vs. EC, and low kainate receptor

concentrations in Vm/DMv and CA1/CA2. NMDA and

AMPA receptor densities were mostly comparable

between Vl/Tr/DMv and DG/CA1 (Table 2). Binding of

GABAA receptors with [3H]muscimol showed high recep-

tor densities in the pigeon HF and mammalian hippo-

campus (Kraemer et al., 1995; Topic et al., 2007;

Cremer et al., 2009, 2010). GABAA receptor densities

decreased from Ent to DG to CA1 to CA2 to CA3 in

mouse, rat, and marmoset (Callithrix jacchus) brains.

Again, Vl/Tr/Vm and the DL regions resembled DG/

CA1 and EC, respectively. DMv was similar to CA2, and

DMd, with its very low GABAA densities, was compara-

ble to CA3. M receptors were more highly expressed in

the marmoset and the rodent hippocampus compared

with the pigeon HF, but nACh showed higher densities

in pigeons compared with rodents (Pauly et al., 1989;

Kraemer et al., 1995; Topic et al., 2007; Wolff et al.,

2008; Cremer et al., 2009). In pigeons, cholinergic

binding sites nicely discriminated among the different

subdivisions; however, no pattern was observed to indi-

cate any correspondence among mammalian and avian

hippocampal substructures based on density variation

in cholinergic receptors (Table 2). This lack of corre-

spondence may reflect interspecies variability with

respect to cholinergic receptor types that may obscure

detection of general differences in the hippocampal–

cholinergic systems in mammals and birds. The analysis

of the monoaminergic receptors revealed that a2 recep-

tor binding suggests a similarity for CA1/DG and Vl/

DMv, whereas lower densities in CA2/CA3 appear to

resemble more Tr/Vm/DMd (Table 2; Zilles et al.,

1993). 5-HT1A receptors showed comparable relative

densities only between DG and Vl and between CA1

and Vm for the rat, but not for mice or other mammals

(Table 2; Palomero-Gallagher, 1999). D1/5 receptors

also suggest a DG more similar to Vl and DMv. The

high densities of D1/5 receptors in the DL regions are

also detected in EC.

Overall, we propose close similarity between DG/

CA1 and the Vl/Tr/DMv regions, whereass DMd/Vm

might be more comparable to the CA2/CA3 regions.

DMd shared several receptor characteristics with CA3,

and generally DMv was more similar to CA1 and Vm

resembled CA2. The DL regions seemed to be compara-

ble to EC (Fig. 9). This latter finding is in line with the

generally accepted similarity between DL and EC (for

review see Atoji and Wild, 2006).

Zinc stainingHigh levels of zinc in the mossy fiber system of rats

have led avian researchers to seek a DG equivalent in

birds, relying on Timm staining. In previous studies

(Faber et al., 1989; Montagnese et al., 1993; T€omb€ol

et al., 2000b) of chick and zebra finch brains, an

obvious parallel to DG could not be revealed. An exami-

nation of our zinc staining (Fig. 8) also failed to reveal

the distinctive labeling suggestive of the layered

C. Herold et al.

2568 The Journal of Comparative Neurology |Research in Systems Neuroscience

TAB

LE

2.

Co

mp

ari

son

of

Neu

rotr

an

smit

ter

Rece

pto

rD

en

siti

es

inth

eP

igeo

nan

dM

am

malia

nH

ipp

oca

mp

al

Fo

rmati

on

(HF)1

Rela

tive

bin

din

gd

en

siti

es

inth

ep

igeo

nH

F(%

)R

ela

tive

bin

din

gd

en

siti

es

inth

em

am

malia

nH

F(%

)

Rece

pto

rV

lTr

Vm

DM

vD

Md

DLd

DLv

CA

1C

A2

CA

3D

GE

CS

peci

es

AM

PA

10

71

09

99

99

71

10

41

11

10

9(1

),1

14

(2),

11

7(5

),1

02

(6),

11

0(4

),1

15

(7)

90

(1),

87

(2),

94

(5)

86

(1),

78

(2),

94

(5),

95

(4),

90

(7)

97

(1),

10

4(2

),9

5(5

),9

8(6

),9

6(4

),9

4(7

)

68

(6)

Rat,

Mouse

Kain

ate

10

19

68

17

91

09

13

21

02

52

(1),

67

(2,6

),5

9(5

),7

1(4

),6

3(7

)7

4(1

),5

8(2

),6

9(5

)1

40

(1),

12

7(2

),1

74

(5),

11

6(4

),1

13

(7)

12

4(1

),1

13

(2),

13

2(6

),9

7(5

),1

13

(4),

12

5(7

)

13

4(6

)R

at,

Mouse

NM

DA

11

01

16

91

10

28

19

61

03

12

0(1

),1

24

(2),

13

0(5

),1

05

(6),

12

6(4

),1

35

(7),

11

0(3

)

84

(1),

83

(2),

99

(5),

88

(3)

74

(1),

71

(2),

83

(5),

81

(4),

69

(7),

82

(3)

90

(1),

10

1(2

),8

9(5

),9

5(6

),9

3(4

),9

7(7

),9

4(3

)

77

(6)

Rat,

Mouse

,M

arm

ose

t

GA

BA

A1

47

11

01

00

76

40

10

71

20

80

(2),

87

(6),

12

2(4

),1

06

(7),

11

1(3

)

70

(2),

72

(3)

47

(2),

62

(4),

58

(7),

60

(3)

11

9(2

),1

11

(6),

11

4(4

),1

37

(7),

11

2(3

)

11

8(6

)R

at,

Mouse

,M

arm

ose

t

M1

74

65

52

10

96

11

32

20

61

18

(2),

12

8(1

2),

11

9(7

),1

13

(8),

10

1(3

)

74

(2),

67

(12

),1

04

(3)

65

(2),

94

(12

),7

1(7

),7

0(8

),9

7(3

)1

09

(2),

13

9(1

2),

11

0(7

),1

17

(8),

99

(3)

11

1(1

2)

Rat,

Mouse

,M

arm

ose

t

M2

99

89

69

79

46

12

71

90

11

5(2

),1

41

(12

),9

1(7

),1

24

(8),

10

3(3

)

10

1(2

),8

6(1

2),

11

0(3

)1

05

(2),

10

4(1

2),

14

2(7

),7

9(8

),1

11

(3)

86

(2),

89

(12

),7

4(7

),9

7(8

),8

8(3

)1

46

(12

)R

at,

Mouse

,M

arm

ose

t

nA

Ch

83

12

68

01

31

91

10

98

05

6(1

2),

10

3(7

),5

6(1

2)

56

(12

),4

5(7

)2

60

(12

),1

52

(7)

18

5(1

2)

Rat,

Mouse

a1

15

62

06

16

13

31

56

16

79

5(2

),1

08

(7),

88

(3)

10

2(2

),1

01

(3)

10

1(2

),1

04

(7),

95

(3)

10

3(2

),8

8(7

),1

10

(3)

10

4(1

3)

Rat,

Mouse

,M

arm

ose

ta

29

26

87

51

50

52

14

21

20

10

3(2

)9

0(2

)8

6(2

)1

05

(2)

13

2(1

3)

Rat

5-H

T 1A

13

01

00

93

87

10

19

79

39

3(2

),7

9(9

),2

05

(7)

44

(2)

73

(2),

29

(7)

13

0(2

),1

19

(9),

66

(7)

27

(13

)R

at,

Mouse

D1

/5

96

89

87

98

72

11

01

48

39

(2),

76

(10

)5

8(2

)5

4(2

)1

77

(2),

14

7(1

0)

17

0(1

1)

Rat

1V

alu

es

for

each

stru

cture

corr

esp

ond

toth

ere

cep

tor

densi

tyin

perc

enta

ge

rela

tive

toth

em

ean

densi

tyof

the

rece

pto

rty

pe

inth

ehip

poca

mp

us

(mam

mals

)or

the

HF

(pig

eons)

.Th

eco

ncl

usi

on

of

this

sum

-

mary

isill

ust

rate

din

Fig

ure

9.

(1)

Palo

mero

-Galla

gher

et

al.,

20

03

;(2

)To

pic

et

al.,

20

07

;(3

)K

raem

er

et

al.,

19

95

;(4

)Zill

es

et

al.,

20

00

;(5

)M

art

ens

et

al.,

19

98

;(6

)C

rem

er

et

al.,

20

09

;(7

)C

rem

er

et

al.,

20

11

;(8

)W

olff

et

al.,

20

08

;(9

)Zavi

tsan

ou

et

al.,

20

10

;(1

0)

Savo

sta

et

al.,

19

86

;(1

1)

Cre

mer

et

al.,

20

10

;(1

2)

Sih

ver

et

al.,

19

97

;(1

3)

our

unp

ub

lished

data

.

Receptor distribution in the pigeon HF

The Journal of Comparative Neurology | Research in Systems Neuroscience 2569

organization of mossy fibers in rats (Danscher et al.,

1973; Danscher and Zimmer, 1978; Zimmer and Haug,

1978). At first glance, our findings also call into ques-

tion whether mossy fibers, and by inference a strict

equivalent to the DG, is present in birds, despite the

indicators of our autoradiographic analysis. However, a

further examination of Figure 8 shows that the V-

complex of the avian HF is densely labeled with zinc,

whereas in the DMv area staining is low, and the DMd

is almost devoid of zinc staining. In the DL region, high

levels of zinc could be observed in the DLv region but

not in the DLd. No distinctive laminar-like labeling simi-

lar to the rat hippocampus could be observed. In fact,

the diffuse but dense labeling in our V-complex resem-

bles the diffuse and dense labeling in the CA regions of

the primate hippocampus (Amaral et al., 2007). There-

fore, if one considers the density of zinc labeling rather

than looking for distinct mossy fibers, our V-complex

resembles more the CA regions of mammals and partic-

ularly primates. On the other hand, not only the mossy

fibers in the mammalian hippocampus are labeled with

zinc. Zinc labeling occurred also in the granular cell

layer and the molecular layer of DG (Zimmer and Haug,

1978; De Biasi and Bendotti, 1998). Given this fact, our

zinc results do not exclude a correspondence between

Vl/Tr and DG or Vm/DMv/DMd and the CA regions as

suggested by the receptor data. Dense zinc labeling in

the DLv and low labeling in DLd is in line with the non-

homogeneous labeling of EC and subiculum in the rat

HF (Zimmer and Haug, 1978; Riba-Bosch and Perez-

Clausell, 2004).

The colocalization of NMDA receptors and zinc char-

acterizes much of Ammon’s horn of the mammalian hip-

pocampus, where glutamate and zinc (Zn21) are

coreleased (Sindreu et al., 2003; Qian and Noebels,

2005). Thus, the extent to which NMDA receptors and

zinc colocalize in the avian HF is of additional compara-

tive interest. However, one limitation of our staining

technique is that it labeled only vesicular zinc, leaving

extracellular zinc undetected. Despite this limitation,

examination of the NMDA fingerprint in Figure 5 and

the zinc labeling in Figure 8 reveals some notable simi-

larities. Based on the fingerprints, the highest density

of NMDA receptors were found in Vl and Tr of the V-

complex, where there was also dense labeling for zinc.

Vm, by contrast, had lower NMDA receptor densities

and less dense zinc labeling. Similarities continue in the

two DM subdivisions, where higher NMDA and zinc

labeling densities were found in DMv compared with

DMd. Overall, there is an apparent correlation between

the density of NMDA receptors and the zinc labeling

density in the avian HF, a pattern also found in the

mammalian hippocampus. From the perspective of pos-

sible subdivision parallels, the dense coupling of NMDA

Figure 9. Similarities between receptor distribution in the subdivisions of the pigeon HF (A) and receptor distribution in the subdivisions of

a typical (idealistic) mammalian hippocampus (B). The same colors indicate substantial overlap in relative receptor densities based on

semiquantitative comparisons between the pigeon HF and the rat hippocampus (Table 2). Here DMv, Vl, and Tr share similarities with DG

and CA1 (indicated in orange), and DMd and Vm share similarities with CA2 and CA3 (indicated in blue), whereas DLd/DLv share similar-

ities with entorhinal cortex (EC; indicated in green). CA1, cornu ammonis field 1; CA2, cornu ammonis field 2; CA3, cornu ammonis field

3; DG, dentate gyrus; DMd, dorsal part of the dorsomedial region of HF; DMv, ventral part of the dorsomedial region of HF; DLd, dorsal

part of dorsolateral region of HF; DLv, ventral part of dorsolateral region of HF; EC, entorhinal cortex; Tr, triangular region of the ventrome-

dial region of HF; Vm, ventromedial part of the V-complex; Vl, ventrolateral part of the V-complex.

C. Herold et al.

2570 The Journal of Comparative Neurology |Research in Systems Neuroscience

receptors and zinc in Vl and Tr argues for similarity

with the CA fields of Ammon’s horn.

CONCLUSIONS

Although the mammalian hippocampus and avian HF

derive from the same portion of the developing pallium

(Reiner et al., 2004; Jarvis et al., 2013), their relation-

ship to the rest of the forebrain is somewhat different.

Whereas the mammalian hippocampus interacts, indi-

rectly, with virtually the entire neocortex (Bird and Bur-

gess, 2008), the avian HF has more limited connectivity

(Csillag et al., 1994; Leutgeb et al., 1996; Kr€oner and

G€unt€urk€un, 1999; Atoji et al., 2002; Atoji and Wild,

2005). For example, unlike the case for the mammalian

hippocampus, only a small projection from the medial

septum to HF has been detected (Casini et al., 1986;

Atoji and Wild, 2004; Montagnese et al., 2004). Given

the incomplete correspondence in the subdivisional

organization of the mammalian and avian HF, it is

tempting to speculate that the differences in connectiv-

ity can in part explain how the two systems evolved dif-

ferent internal characteristics (Aboitiz, 1993; Manns

and Eichenbaum, 2005; Papp et al., 2007; Rattenborg

and Martinez-Gonzalez, 2011). However, in both mam-

mals and birds, the hippocampal formation shares a

number of morphological, physiological, and neuro-

chemical similarities (Krebs et al., 1989; Bingman and

Mench, 1990; Erichsen et al., 1991; Montagnese et al.,

1993; Colombo et al., 1997; Margrie et al., 1998;

Gagliardo et al., 1999; T€omb€ol et al., 2000a; Atoji

et al., 2002; Budzynski et al., 2002; Bingman et al.,

2003, 2005; Kahn et al., 2003; Atoji and Wild, 2004,

2005, 2006; Hough and Bingman, 2004; Bischof et al.,

2006; Nair-Roberts et al., 2006; Hoshooley and Sherry,

2007; Sherry, 2011; Gupta et al., 2012) and plays a

similar role in cognition, especially in spatial cognition

(Bingman et al., 1998; Colombo and Broadbent, 2000;

Suzuki and Clayton, 2000; Tommasi et al., 2003; Wata-

nabe and Bischof, 2004; Ruploh et al., 2011; Mayer

et al., 2012). By comparing the receptor architectonic

profile of the pigeon HF with the mammalian hippocam-

pus, we detected a number of shared traits (Fig. 9).

However, as indicated by a study in the zebra finch

that investigated the expression of immediate early

genes during spatial learning, a study that detected

individual patch locations that were not in line with pre-

viously described hippocampal subdivisions (Mayer

et al., 2012), it may be possible that information proc-

essing in the HF of birds is, at least in part, different

from that in the mammalian hippocampus (but see

Kahn et al., 2003). Sz�ek�ely (1999) also came to the

same conclusion, that the avian HF probably has a

somewhat different wiring organization compared with

the mammalian hippocampus. Therefore, in assuming a

kind of nonlaminar, network organization for the avian

HF (for review see Atoji and Wild, 2006), it may be that

there was less selective pressure to organize the avian

HF into anatomically discrete subdivisions such as

those found in the mammalian hippocampus. Another

point is that, although the avian HF and mammalian

hippocampus develop from the same type of cells dur-

ing development, so far expression profiles of selective

markers have not clarified whether these cells are more

amygdala- or more cortex-like, or both (Reiner et al.,

2004; Dugas-Ford et al., 2012; Chen et al., 2013; Jarvis

et al., 2013). To understand the development of hippo-

campal subfields, it is also very important to under-

stand how cells originate, how cells migrate, and during

which time window cells express specific genes that

organize their future targets during development (Chris-

tie et al., 2013; Montiel and Molnar, 2013). As one last

consideration, from analysis of gene expression profiles

between different species, some researchers have pro-

posed that the DG is one of the most recently evolved

structures of the mammalian brain (see Kempermann,

2012). Thus, it may be that birds did not evolve a DG,

but this would not exclude the independent evolution of

a functional equivalent, as has been shown for the nido-

pallium caudolaterale of birds and the prefrontal cortex

of mammals (G€unt€urk€un, 2012).

Overall, our study reveals an avian HF characterized

by distinct subdivisions based on differences in

receptor-type distribution and zinc density. Similarities

to the mammalian HF could be observed between Vl/

Tr/DMv and DG/CA1, between Vm/DMd and CA2/

CA3, and between DL and Ent (Table 2, Fig. 9). How-

ever, we suggest that 300 hundred million years of

independent evolution has led to a mosaic of similar-

ities and differences in the subdivisional organization of

the avian HF and mammalian hippocampus and that

thinking about the avian HF in terms of the strict subdi-

visional organization of the mammalian hippocampus is

likely insufficient to understand the avian HF.

CONFLICT OF INTEREST STATEMENT

The authors declare that there are no conflicts of

interest.

ROLE OF AUTHORS

All authors had full access to all the data in the

study and take responsibility for the integrity of the

data and the accuracy of the data analysis. Study con-

cept and design: CH, VPB, KZ, OG. Acquisition of data:

CH, NP-G, SL, FS. Analysis and interpretation of data:

Receptor distribution in the pigeon HF

The Journal of Comparative Neurology | Research in Systems Neuroscience 2571

CH, VPB, MS, OG. Drafting of the manuscript: CH, VPB,

OG. Critical revision of the manuscript for important

intellectual content: CH, VPB, MS, KZ, OG. Statistical

analysis: CH. Obtained funding: VPB, Z, OG. Administra-

tive, technical, and material support: CH, NP-G, SL, FS.

Study supervision: CH, NP-G, KZ, OG.

LITERATURE CITEDAboitiz F. 1993. Further comments on the evolutionary origin

of the mammalian brain. Med Hypoth 41:409–418.Altman J. 1962. Are new neurons formed in the brains of

adult mammals? Science 135:1127–1128.Amaral DG, Witter MP. 1989. The three-dimensional organiza-

tion of the hippocampal formation: a review of anatomi-cal data. Neuroscience 31:571–591.

Amaral DG, Scharfman HE, Lavenex P. 2007. The dentategyrus: fundamental neuroanatomical organization (den-tate gyrus for dummies). Prog Brain Res 163:3–22.

Amunts K, Kedo O, Kindler M, Pieperhoff P, Mohlberg H, ShahNJ, Habel U, Schneider F, Zilles K. 2005. Cytoarchitec-tonic mapping of the human amygdala, hippocampalregion and entorhinal cortex: intersubject variability andprobability maps. Anat Embryol 210:343–352.

Atoji Y, Wild JM. 2004. Fiber connections of the hippocampalformation and septum and subdivisions of the hippocam-pal formation in the pigeon as revealed by tract tracingand kainic acid lesions. J Comp Neurol 475:426–461.

Atoji Y, Wild JM. 2005. Afferent and efferent connections ofthe dorsolateral corticoid area and a comparison withconnections of the temporo-parieto-occipital area in thepigeon (Columba livia). J Comp Neurol 485:165–182.

Atoji Y, Wild JM. 2006. Anatomy of the avian hippocampal for-mation. Rev Neurosci 17:3–15.

Atoji Y, Wild JM, Yamamoto Y, Suzuki Y. 2002. Intratelence-phalic connections of the hippocampus in pigeons(Columba livia). J Comp Neurol 447:177–199.

Ball GF, Nock B, Wingfield JC, McEwen BS, Balthazart J. 1990.Muscarinic cholinergic receptors in the songbird andquail brain: a quantitative autoradiographic study. JComp Neurol 298:431–442.

Ball GF, Casto JM, Balthazart J. 1995. Autoradiographic local-ization of D1-like dopamine receptors in the forebrain ofmale and female Japanese quail and their relationshipwith immunoreactive tyrosine hydroxylase. J Chem Neu-roanat 9:121–133.

Barnea A, Nottebohm F. 1994. Seasonal recruitment of hippo-campal neurons in adult free-ranging black-capped chick-adees. Proc Natl Acad Sci U S A 91:11217–11221.

Bingman VP, Mench JA. 1990. Homing behavior of hippocam-pus and parahippocampus lesioned pigeons followingshort-distance releases. Behav Brain Res 40:227–238.

Bingman VP, Strasser R, Baker C, Riters LV. 1998. Paired-associate learning is unaffected by combined hippocam-pal and parahippocampal lesions in homing pigeons.Behav Neurosci 112:533–540.

Bingman VP, Hough GE 2nd, Kahn MC, Siegel JJ. 2003. Thehoming pigeon hippocampus and space: in search ofadaptive specialization. Brain Behav Evol 62:117–127.

Bingman VP, Gagliardo A, Hough GE 2nd, Ioale P, Kahn MC,Siegel JJ. 2005. The avian hippocampus, homing inpigeons and the memory representation of large-scalespace. Integr Comp Biol 45:555–564.

Bird CM, Burgess N. 2008. The hippocampus and memory: insightsfrom spatial processing. Nat Rev Neurosci 9:182–194.

Bischof HJ, Lieshoff C, Watanabe S. 2006. Spatial memoryand hippocampal function in a non-foodstoring songbird,

the zebra finch (Taeniopygia guttata). Rev Neurosci 17:43–52.

Budzynski CA, Gagliardo A, Ioale P, Bingman VP. 2002. Partic-ipation of the homing pigeon thalamofugal visual path-way in sun-compass associative learning. Eur J Neurosci15:197–210.

Casini G, Bingman VP, Bagnoli P. 1986. Connections of thepigeon dorsomedial forebrain studied with WGA-HRP and3H-proline. J Comp Neurol 245:454–470.

Chen CC, Winkler CM, Pfenning AR, Jarvis ED. 2013. Molecu-lar profiling of the developing avian telencephalon:regional timing and brain subdivision continuities. JComp Neurol 521:3666–3701.

Christie KJ, Emery B, Denham M, Bujalka H, Cate HS, TurnleyAM. 2013. Transcriptional regulation and specification ofneural stem cells. Adv Exp Med Biol 786:129–155.

Colombo M, Broadbent N. 2000. Is the avian hippocampus afunctional homologue of the mammalian hippocampus?Neurosci Biobehav Rev 24:465–484.

Colombo M, Cawley S, Broadbent N. 1997. The effects of hip-pocampal and area parahippocampalis lesions inpigeons: II. Concurrent discrimination and spatial mem-ory. Q J Exp Psychol B 50:172–189.

Craigie EH. 1930. Studies on the brain of the kiwi (Apteryxaustralis). J Comp Neurol 49:223–357.

Craigie EH. 1935. The cerebral hemispheres of the kiwi andof the emu (Apteryx and Dromiceius). J Anat 69:380–393.

Cremer CM, Palomero-Gallagher N, Bidmon HJ, Schleicher A,Speckmann EJ, Zilles K. 2009. Pentylenetetrazole-induced seizures affect binding site densities for GABA,glutamate and adenosine receptors in the rat brain. Neu-roscience 163:490–499.

Cremer CM, Bidmon HJ, Gorg B, Palomero-Gallagher N,Escobar JL, Speckmann EJ, Zilles K. 2010. Inhibition ofglutamate/glutamine cycle in vivo results in decreasedbenzodiazepine binding and differentially regulatedGABAergic subunit expression in the rat brain. Epilepsia51:1446–1455.

Cremer CM, Lubke JH, Palomero-Gallagher N, Zilles K. 2011.Laminar distribution of neurotransmitter receptors in dif-ferent reeler mouse brain regions. Brain Struct Funct216:201–218.

Csillag A, Sz�ek�ely AD, Davies DC. 1994. Termination pattern ofmedial hyperstriatum ventrale efferents in the archistria-tum of the domestic chick. J Comp Neurol 348:394–402.

Danscher G, Zimmer J. 1978. An improved Timm sulphide sil-ver method for light and electron microscopic localiza-tion of heavy metals in biological tissues. Histochemistry55:27–40.

Danscher G, Haug FM, Fredens K. 1973. Effect of diethyldi-thiocarbamate (DEDTC) on sulphide silver stained bou-tons. Reversible blocking of Timm’s sulphide silver stainfor “heavy” metals in DEDTC treated rats (light micros-copy). Exp Brain Res 16:521–532.

De Biasi S, Bendotti C. 1998. A simplified procedure for thephysical development of the sulphide silver method toreveal synaptic zinc in combination with immunocyto-chemistry at light and electron microscopy. J NeurosciMethods 79:87–96.

Dietl MM, Palacios JM. 1988. Neurotransmitter receptors inthe avian brain. I. Dopamine receptors. Brain Res 439:354–359.

Dietl MM, Cortes R, Palacios JM. 1988. Neurotransmitterreceptors in the avian brain. II. Muscarinic cholinergicreceptors. Brain Res 439:360–365.

C. Herold et al.

2572 The Journal of Comparative Neurology |Research in Systems Neuroscience

Dugas-Ford J, Rowell JJ, Ragsdale CW. 2012. Cell-type homolo-gies and the origins of the neocortex. Proc Natl Acad SciU S A 109:16974–16979.

Erichsen JT, Bingman VP, Krebs JR. 1991. The distribution ofneuropeptides in the dorsomedial telencephalon of thepigeon (Columba livia): a basis for regional subdivisions. JComp Neurol 314:478–492.

Eriksson PS, Perfilieva E, Bjork-Eriksson T, Alborn AM,Nordborg C, Peterson DA, Gage FH. 1998. Neurogenesisin the adult human hippocampus. Nat Med 4:1313–1317.

Faber H, Braun K, Zuschratter W, Scheich H. 1989. System-specific distribution of zinc in the chick brain. A light-and electron-microscopic study using the Timm method.Cell Tissue Res 258:247–257.

Gagliardo A, Ioale P, Bingman VP. 1999. Homing in pigeons:the role of the hippocampal formation in the representa-tion of landmarks used for navigation. J Neurosci 19:311–315.

G€unt€urk€un O. 2012. The convergent evolution of neural sub-strates for cognition. Psychol Res 76:212–219.

Gupta S, Maurya R, Saxena M, Sen J. 2012. Defining struc-tural homology between the mammalian and avian hippo-campus through conserved gene expression patternsobserved in the chick embryo. Dev Biol 366:125–141.

Heimovics SA, Cornil CA, Ellis JM, Ball GF, Riters LV. 2011.Seasonal and individual variation in singing behavior cor-relates with alpha2-noradrenergic receptor density inbrain regions implicated in song, sexual, and socialbehavior. Neuroscience 182:133–143.

Herold C, Palomero-Gallagher N, Hellmann B, Kr€oner S, TheissC, G€unt€urk€un O, Zilles K. 2011. The receptor architectureof the pigeons’ nidopallium caudolaterale: an avian ana-logue to the mammalian prefrontal cortex. Brain StructFunct 216:239–254.

Herold C, Palomero-Gallagher N, G€unt€urk€un O, Zilles K. 2012.Serotonin 5-HT1A receptor binding sites in the brain ofthe pigeon (Columba livia). Neuroscience 200:1–12.

Hoshooley JS, Sherry DF. 2007. Greater hippocampal neuronalrecruitment in food-storing than in non-food-storing birds.Dev Neurobiol 67:406–414.

Hoshooley JS, Phillmore LS, Macdougall-Shackleton SA. 2005.An examination of avian hippocampal neurogenesis inrelationship to photoperiod. Neuroreport 16:987–991.

Hough GE, Bingman VP. 2004. Spatial response properties ofhoming pigeon hippocampal neurons: correlations withgoal locations, movement between goals, and environ-mental context in a radial-arm arena. J Comp Physiol ANeuroethol Sens Neural Behav Physiol 190:1047–1062.

Insausti R. 1993. Comparative anatomy of the entorhinal cor-tex and hippocampus in mammals. Hippocampus 3(SpecNo.):19–26.

Jarvis ED, Yu J, Rivas MV, Horita H, Feenders G, Whitney O,Jarvis SC, Jarvis ER, Kubikova L, Puck AE, Siang-BakshiC, Martin S, McElroy M, Hara E, Howard J, Pfenning A,Mouritsen H, Chen CC, Wada K. 2013. Global view ofthe functional molecular organization of the avian cere-brum: mirror images and functional columns. J CompNeurol 521:Spc1.

Kahn MC, Hough GE 2nd, Ten Eyck GR, Bingman VP. 2003.Internal connectivity of the homing pigeon (Columba livia)hippocampal formation: an anterograde and retrogradetracer study. J Comp Neurol 459:127–141.

Kallen B. 1962. II. Embryogenesis of brain nuclei in the chicktelencephalon. Ergeb Anat Entwicklungsgesch 36:62–82.

Karten H, Hodos W. 1967. A stereotaxic atlas of the brain ofthe pigeon (Columba livia). Baltimore: The Johns HopkinsUniversity Press.

Kempermann G. 2012. New neurons for “survival of thefittest.” Nat Rev Neurosci 13:727–736.

Kleitz HK, Cornil CA, Balthazart J, Ball GF. 2009. Species dif-ferences in the relative densities of D1- and D2-likedopamine receptor subtypes in the Japanese quail andrats: an in vitro quantitative receptor autoradiographystudy. Brain Behav Evol 73:81–90.

Kraemer M, Zilles K, Schleicher A, Gebhard R, Robbins TW,Everitt BJ, Divac I. 1995. Quantitative receptor autoradi-ography of eight different transmitter-binding sites in thehippocampus of the common marmoset, Callithrix jac-chus. Anat Embryol 191:213–225.

Krebs JR, Sherry DF, Healy SD, Perry VH, Vaccarino AL. 1989.Hippocampal specialization of food-storing birds. ProcNatl Acad Sci U S A 86:1388–1392.

Krebs JR, Erichsen JT, Bingman VP. 1991. The distribution ofneurotransmitters and neurotransmitter-related enzymesin the dorsomedial telencephalon of the pigeon (Columbalivia). J Comp Neurol 314:467–477.

Kr€oner S, G€unt€urk€un O. 1999. Afferent and efferent connec-tions of the caudolateral neostriatum in the pigeon(Columba livia): a retro- and anterograde pathway tracingstudy. J Comp Neurol 407:228–260.

Leutgeb S, Husband S, Riters LV, Shimizu T, Bingman VP.1996. Telencephalic afferents to the caudolateral neo-striatum of the pigeon. Brain Res 730:173–181.

Manns JR, Eichenbaum H. 2005. Time and treason to the tri-synaptic teachings: theoretical comment on Kesner et al.(2005). Behav Neurosci 119:1140–1143.

Margrie TW, Rostas JA, Sah P. 1998. Long-term potentiationof synaptic transmission in the avian hippocampus. JNeurosci 18:1207–1216.

Mayer U, Watanabe S, Bischof HJ. 2009. Hippocampal activa-tion of immediate early genes Zenk and c-Fos in zebrafinches (Taeniopygia guttata) during learning and recall ofa spatial memory task. Neurobiol Learn Mem 93:322–329.

Mayer U, Watanabe S, Bischof HJ. 2012. Spatial memory andthe avian hippocampus: research in zebra finches. JPhysiol Paris doi: 10.1016/j.jphysparis.2012.05.002.

Merker B. 1983. Silver staining of cell bodies by means ofphysical development. J Neurosci Methods 9:235–241.

Ming GL, Song H. 2005. Adult neurogenesis in the mammaliancentral nervous system. Annu Rev Neurosci 28:223–250.

Molla R, Rodriguez J, Calvet S, Garcia-Verdugo JM. 1986. Neu-ronal types of the cerebral cortex of the adult chicken(Gallus gallus). A Golgi study. J Hirnforsch 27:381–390.

Montagnese CM, Geneser FA, Krebs JR. 1993. Histochemicaldistribution of zinc in the brain of the zebra finch (Taeno-pygia guttata). Anat Embryol 188:173–187.

Montagnese CM, Krebs JR, Meyer G. 1996. The dorsomedialand dorsolateral forebrain of the zebra finch, Taeniopygiaguttata: a Golgi study. Cell Tissue Res 283:263–282.

Montagnese CM, Sz�ek�ely AD, Adam A, Csillag A. 2004. Effer-ent connections of septal nuclei of the domestic chick(Gallus domesticus): an anterograde pathway tracingstudy with a bearing on functional circuits. J Comp Neu-rol 469:437–456.

Montiel JF, Molnar Z. 2013. The impact of gene expressionanalysis on evolving views of avian brain organization. JComp Neurol 521:3604–3613.

Nair-Roberts RG, Erichsen JT, Reboreda JC, Kacelnik A. 2006.Distribution of substance P reveals a novel subdivision inthe hippocampus of parasitic South American cowbirds.J Comp Neurol 496:610–626.

Palomero-Gallagher N. 1999. Transmitterrezeptoren im Hippo-campus verschiedener S€augetiere: Vergleichend-anatomische Untersuchungen und Analyse geschlechts-

Receptor distribution in the pigeon HF

The Journal of Comparative Neurology | Research in Systems Neuroscience 2573

und zyklusabh€angiger Verteilungsmuster. Dissertation,Heinrich-Heine-Universit€at D€usseldorf.

Palomero-Gallagher N, Bidmon HJ, Zilles K. 2003. AMPA, kai-nate, and NMDA receptor densities in the hippocampusof untreated male rats and females in estrus and dies-trus. J Comp Neurol 459:468–474.

Palomero-Gallagher N, Schleicher A, Lindemann S, LessenichA, Zilles K, Loscher W. 2008. Receptor fingerprinting thecircling ci2 rat mutant: insights into brain asymmetryand motor control. Exp Neurol 210:624–637.

Papp G, Witter MP, Treves A. 2007. The CA3 network as amemory store for spatial representations. Learn Mem14:732–744.

Pauly JR, Stitzel JA, Marks MJ, Collins AC. 1989. An autoradio-graphic analysis of cholinergic receptors in mouse brain.Brain Res Bull 22:453–459.

Puelles L, Martinez-de-la-Torre M, Paxinos G, Watson C,Martinez S. 2007. The chick brain in stereotaxic coordi-nates: an atlas featuring neuromeric subdivisions andmammalian homologies. San Diego: Acadamic Press.

Pytte CL, Gerson M, Miller J, Kirn JR. 2007. Increasing stereo-typy in adult zebra finch song correlates with a decliningrate of adult neurogenesis. Dev Neurobiol 67:1699–1720.

Qian J, Noebels JL. 2005. Visualization of transmitter releasewith zinc fluorescence detection at the mouse hippocam-pal mossy fibre synapse. J Physiol 566:747–758.

Rattenborg NC, Martinez-Gonzalez D. 2011. A bird-brain viewof episodic memory. Behav Brain Res 222:236–245.

Reiner A, Perkel DJ, Bruce LL, Butler AB, Csillag A, Kuenzel W,Medina L, Paxinos G, Shimizu T, Striedter G, Wild M, BallGF, Durand S, Gunturkun O, Lee DW, Mello CV, PowersA, White SA, Hough G, Kubikova L, Smulders TV, WadaK, Dugas-Ford J, Husband S, Yamamoto K, Yu J, Siang C,Jarvis ED, Avian Brain Nomenclature F. 2004. Revisednomenclature for avian telencephalon and some relatedbrainstem nuclei. J Comp Neurol 473:377–414.

Riba-Bosch A, Perez-Clausell J. 2004. Response to kainic acidinjections: changes in staining for zinc, FOS, cell deathand glial response in the rat forebrain. Neuroscience125:803–818.

Rodriguez F, Lopez JC, Vargas JP, Broglio C, Gomez Y, SalasC. 2002. Spatial memory and hippocampal palliumthrough vertebrate evolution: insights from reptiles andteleost fish. Brain Res Bull 57:499–503.

Rose M. 1912. Histologische Lokalisation der Großhirnrindebei kleinen S€augetieren. J Psychol Neurol 19.

Rose M. 1914. €Uber die cytoarchitektonische Gleiderung desVorderhinrs der V€ogel. J Psychol Neurol 21:278–352.

Rose M. 1926. Der Allocortex bei Tier und Mensch 1. Teil.Jour Psychol Neurol 34:1–111.

Rosinha MU, Ferrari EA, Toledo CA. 2009. Immunohistochemi-cal distribution of AMPA-type label in the pigeon (C. livia)hippocampus. Neuroscience 159:438–450.

Ruploh T, Kazek A, Bischof HJ. 2011. Spatial orientation inJapanese quails (Coturnix coturnix japonica). PLoS One 6:e28202.

Schleicher A, Palomero-Gallagher N, Morosan P, Eickhoff SB,Kowalski T, de Vos K, Amunts K, Zilles K. 2005. Quanti-tative architectural analysis: a new approach to corticalmapping. Anat Embryol 210:373–386.

Schnabel R, Braun K. 1996. Development of dopamine recep-tors in the forebrain of the domestic chick in relation toauditory imprinting. An autoradiographic study. Brain Res720:120–130.

Sherry DF. 2011. The hippocampus of food-storing birds.Brain Behav Evol 78:133–135.

Sherry DF, Jacobs LF, Gaulin SJ. 1992. Spatial memory andadaptive specialization of the hippocampus. Trends Neu-rosci 15:298–303.

Siegel JJ, Nitz D, Bingman VP. 2000. Hippocampal thetarhythm in awake, freely moving homing pigeons. Hippo-campus 10:627–631.

Siegel JJ, Nitz D, Bingman VP. 2002. Electrophysiological pro-file of avian hippocampal unit activity: a basis forregional subdivisions. J Comp Neurol 445:256–268.

Sihver W, G€unther P, Schiebs R, Bigl V. 1997. Repeatedadministration of tacrine to normal rats: effects on cho-linergic, glutamamtergic and gabaergic receptor subtypesin rat using receptor autoradiography. Neurochem Int 31:693–703.

Sindreu CB, Varoqui H, Erickson JD, Perez-Clausell J. 2003.Boutons containing vesicular zinc define a subpopulationof synapses with low AMPAR content in rat hippocam-pus. Cereb Cortex 13:823–829.

Stewart MG, Cristol D, Philips R, Steele RJ, Stamatakis A,Harrison E, Clayton N. 1999. A quantitative autoradio-graphic comparison of binding to glutamate receptorsub-types in hippocampus and forebrain regions of afood-storing and a non-food-storing bird. Behav Brain Res98:89–94.

Suarez J, Davila JC, Real MA, Guirado S, Medina L. 2006. Cal-cium-binding proteins, neuronal nitric oxide synthase,and GABA help to distinguish different pallial areas inthe developing and adult chicken. I. Hippocampal forma-tion and hyperpallium. J Comp Neurol 497:751–771.

Suzuki WA, Clayton NS. 2000. The hippocampus and memory:a comparative and ethological perspective. Curr OpinNeurobiol 10:768–773.

Sz�ek�ely AD. 1999. The avian hippocampal formation: subdivi-sions and connectivity. Behav Brain Res 98:219–225.

Sz�ek�ely AD, Krebs JR. 1996. Efferent connectivity of the hip-pocampal formation of the zebra finch (Taenopygia gut-tata): an anterograde pathway tracing study usingPhaseolus vulgaris leucoagglutinin. J Comp Neurol 368:198–214.

T€omb€ol T, Davies DC, Nemeth A, Alpar A, Sebesteny T.2000a. A golgi and a combined Golgi/GABA immunogoldstudy of local circuit neurons in the homing pigeon hip-pocampus. Anat Embryol 201:181–196.

T€omb€ol T, Davies DC, Nemeth A, Sebesteny T, Alpar A.2000b. A comparative Golgi study of chicken (Gallusdomesticus) and homing pigeon (Columba livia) hippo-campus. Anat Embryol 201:85–101.

Tommasi L, Gagliardo A, Andrew RJ, Vallortigara G. 2003. Sep-arate processing mechanisms for encoding of geometricand landmark information in the avian hippocampus. EurJ Neurosci 17:1695–1702.

Topic B, Willuhn I, Palomero-Gallagher N, Zilles K, Huston JP,Hasenohrl RU. 2007. Impaired maze performance inaged rats is accompanied by increased density ofNMDA, 5-HT1A, and alpha-adrenoceptor binding in hippo-campus. Hippocampus 17:68–77.

Veenman CL, Albin RL, Richfield EK, Reiner A. 1994. Distribu-tions of GABAA, GABAB, and benzodiazepine receptors inthe forebrain and midbrain of pigeons. J Comp Neurol344:161–189.

Watanabe S, Bischof HJ. 2004. Effects of hippocampal lesionson acquisition and retention of spatial learning in zebrafinches. Behav Brain Res 155:147–152.

Witter MP. 2007. Intrinsic and extrinsic wiring of CA3: indica-tions for connectional heterogeneity. Learn Mem 14:705–713.

Wolff SC, Hruska Z, Nguyen L, Dohanich GP. 2008. Asymmet-rical distributions of muscarinic receptor binding in the

C. Herold et al.

2574 The Journal of Comparative Neurology |Research in Systems Neuroscience

hippocampus of female rats. Eur J Pharmacol 588:248–250.

Zilles K, Qu M, Schleicher A. 1993. Regional distribution andheterogeneity of alpha-adrenoceptors in the rat andhuman central nervous system. J Hirnforsch 34:123–132.

Zilles K, Wu J, Crusio WE, Schwegler H. 2000. Water mazeand radial maze learning and the density of binding sitesof glutamate, GABA, and serotonin receptors in the hip-pocampus of inbred mouse strains. Hippocampus 10:213–225.

Zilles K, Palomero-Gallagher N, Grefkes C, Scheperjans F, BoyC, Amunts K, Schleicher A. 2002a. Architectonics of the

human cerebral cortex and transmitter receptor finger-prints: reconciling functional neuroanatomy and neuro-chemistry. Eur Neuropsychopharmacol 12:587–599.

Zilles K, Schleicher A, Palomero-Gallagher N, Amunts K.2002b. Quantitative analysis of cyto- and receptor archi-tecture of the human brain. In: Mazziotta JC, Toga A, edi-tors. Brain mapping: the methods. Amsterdam: Elsevier.p 573–602.

Zimmer J, Haug FM. 1978. Laminar differentiation of the hip-pocampus, fascia dentata and subiculum in developingrats, observed with the Timm sulphide silver method. JComp Neurol 179:581–617.

Receptor distribution in the pigeon HF

The Journal of Comparative Neurology | Research in Systems Neuroscience 2575


Recommended