Environment Protection Engineering Vol. 39 2013 No. 1 DOI: 10.5277/EPE130109 GHAZALEH MONAZAMI TEHRANI 1,2 , ROSLI HASHIM 1 , A. HALIM SULAIMAN 1 , BELIN TAVAKOLY SANY 1 , AISHAH SALLEH 1 , REZA KHANI JAZANI 2 , AHMAD SAVARI 3 , RASOUL FALAH BARANDOUST 4 DISTRIBUTION OF TOTAL PETROLEUM HYDROCARBONS AND POLYCYCLIC AROMATIC HYDROCARBONS IN MUSA BAY SEDIMENTS (NORTHWEST OF THE PERSIAN GULF) Sediment samples were collected from the coastal area of the Petrochemical Special Economic Zone of Musa Bay. The samples were analyzed to determine the degree of hydrocarbon contamina- tion and identify the sources of PAHs which were evaluated by employing the ratios of specific PAHs compounds and principal component analysis (PCA). The levels of TPH concentration in the studied area were relatively moderate compared to the world-wide chronically oil-contaminated loca- tions. The concentration of total PAHs was lower than those in other parts of the Musa Bay but ap- proached the NOAA sediment quality guideline value. 1. INTRODUCTION The Petrochemical Special Economic Zone (PETZONE) was established in the southeast of Iran, in the vicinity of Musa Bay (northwest of the Persian Gulf) in 1997. PETZONE consists of the area of approximately 2600 ha and contains fifteen petro- chemical companies and five sanitarium and effluent treatment stations. Since PETZONE was established, some parts (Zangee and Jafari creeks) of Musa Bay have become enclosed in PETZONE constructions and divided into two parts [1, 2]. The Musa Bay (Khowr-e Musa) is a basin with a 50 km long connection to the open ocean _________________________ 1 Institute of Biological Sciences, University of Malaya, 50603, Malaysia, corresponding author G.M. Tehrani, e-mail: [email protected]2 Health, Safety and Environment Faculty, Shahid Beheshti University, Tehran, Iran. P.O. Box: 165964431. 3 Department of Oceanography, University of Marine Science and Technology, Khorramshahr, Iran. P.O. Box: 64199-43175. 4 Laboratory of PETZONE Environmental Office, P.O. Box: 0652262.
DISTRIBUTION OF TOTAL PETROLEUM HYDROCARBONS AND POLYCYCLIC AROMATIC HYDROCARBONS IN MUSA
BAY SEDIMENTS (NORTHWEST OF THE PERSIAN GULF)
Sediment samples were collected from the coastal area of the Petrochemical Special Economic Zone of Musa Bay. The samples were analyzed to determine the degree of hydrocarbon contamina-tion and identify the sources of PAHs which were evaluated by employing the ratios of specific PAHs compounds and principal component analysis (PCA). The levels of TPH concentration in the studied area were relatively moderate compared to the world-wide chronically oil-contaminated loca-tions. The concentration of total PAHs was lower than those in other parts of the Musa Bay but ap-proached the NOAA sediment quality guideline value.
1. INTRODUCTION
The Petrochemical Special Economic Zone (PETZONE) was established in the southeast of Iran, in the vicinity of Musa Bay (northwest of the Persian Gulf) in 1997. PETZONE consists of the area of approximately 2600 ha and contains fifteen petro-chemical companies and five sanitarium and effluent treatment stations. Since PETZONE was established, some parts (Zangee and Jafari creeks) of Musa Bay have become enclosed in PETZONE constructions and divided into two parts [1, 2]. The Musa Bay (Khowr-e Musa) is a basin with a 50 km long connection to the open ocean
_________________________ 1Institute of Biological Sciences, University of Malaya, 50603, Malaysia, corresponding author G.M.
and it is not an estuary [3]. Moreover, several creeks are branched out from it, includ-ing the Zangee, Jafari, Moavi, Ghanam, and Marimus creeks [2, 4, 5]. It is located in a large cross-border area of intertidal mud flats and a common characteristic of almost all intertidal mud flats is the high productivity which makes them attractive for breed-ing, nesting, overwintering and migration stop-over grounds for birds and as nursery ground for many fish species [3, 6, 7].
Musa Bay is a semi-enclosed ecosystem, and several studies have shown that pol-lution and its adverse effects are stronger in semi-enclosed areas than in the open sea and based on the characteristics of these ecosystems, as the flow of water decreases, the concentrations of nutritious substances and biodiversity increase. The water circu-lation in Persian Gulf is anti-clockwise, and the water exchange rate from the narrow striate of Hormuz is 3 to 5 years, the water of Musa Bay is exchanged during this time frame. In addition, the semi-diurnal tide in the intertidal mud flat zone naturally dredges and transports sediments and associated pollutants [3, 6, 8].
According to the IMO declaration, the Gulf area is the most sensitive area in the world and Department of Environment has reported that, the Musa Bay is considered the most sensitive marine area in Iran and the Gulf area due to its unique ecosystem. Therefore, Musa Bay is important for the whole northwestern coast of the Persian Gulf [3]. Due to the sensitivity of the aquatic ecosystem of the Persian Gulf, several studies have been performed on various pollutants and primary sources. Based on the scientific reports, we learn that 49% of the world’s oil production comes from the Gulf states and passes through this old waterway and it holds an estimated about 57–66% of the world oil reserves. Several studies showed that the Persian Gulf is the most oil-polluted marine area in the world, even before the Gulf war and the Gulf oil pollution is about 48 times that of any other similar area on the Earth [3, 9–11]. During the first Gulf war over 700 wells were destroyed and burned thus after the Gulf War, interest in the contamination of the Persian Gulf (especially oil pollution due to the presence of natural sources of oil and gas) and its adverse effects increased. In the past four to five decades, this area has been the major waterway for oil transport and it has suffered from oil spills into its marine environment thus several studies and regional sea pro-grams were conducted to estimate the rate of damage to this valuable aquatic ecosys-tem [10, 12]. The risks to aquatic biota are difficult to assess due to the complex na-ture of the hydrocarbon mixtures. Therefore, during the last decades, several researches were done in this area due to its sensitivity and also several point source and nonpoint sources of pollutions. In 1996, studies showed that the Iranian coastal area (especially the southern region along the Imam Khomeini port) was contaminated with petroleum hydrocarbons but in a lesser scope than that of the most Arabian coasts [13]. In 2005, the concentrations and distributions of various petroleum hydrocarbons (PHs), chlorinated pesticides and PCBs were determined in biota and coastal sedi-ments in seven countries (Bahrain, Iran, Kuwait, Oman, Qatar, Saudi Arabia and the United Arab Emirates) of the ROPME sea area. Results of this study showed that the
Distribution of hydrocarbons in Musa Bay sediments 117
extensive marine contamination regarding to organochlorinated compounds and PHs was not observed [14]. Also during the last decades Iran’s coastal problems have been increased which has been realized that related to the sectoral management [15].
Among the organic pollution of aquatic environments, aliphatic hydrocarbons and polycyclic aromatic hydrocarbons (PAHs) have received much attention due to their omnipresent distribution in marine sediments. Many researches showed that the lipo-philic characteristics of polyaromatic hydrocarbons, their tendency to accumulate in sediments, their low degradation rate and high stability also their potential to manifest the ecotoxicological activity, the concentration of PAH in sediment is an appropriate index of the status of contaminates in marine environments [16–19]. Several studies have classified the sources of PAHs into two categories, pyrolytic and petrogenic. Pyrolytic PAHs are formed as a consequence of incomplete combustion although petrogenic PAHs are mainly derived from crude oil and its refined products. The use of ratios of PAH components of the same molecular weight is well founded as an in-dex to interpret PAH composition and its possible sources, for example molecular indices such as fluoranthene/pyrene are are used to identify emission sources [20, 21]. Thus, in the present study, due to the vicinity of PETZONE, Bandar-e-Imam Khomeini petrochemical company and ports and other industries to Musa Bay, the distribution and sources of total petroleum hydrocarbons and polycyclic aromatic hy-drocarbons in the sediment of Musa Bay close to the PETZONE (northwest of the Persian Gulf) was monitored.
2. MATERIALS AND METHODS
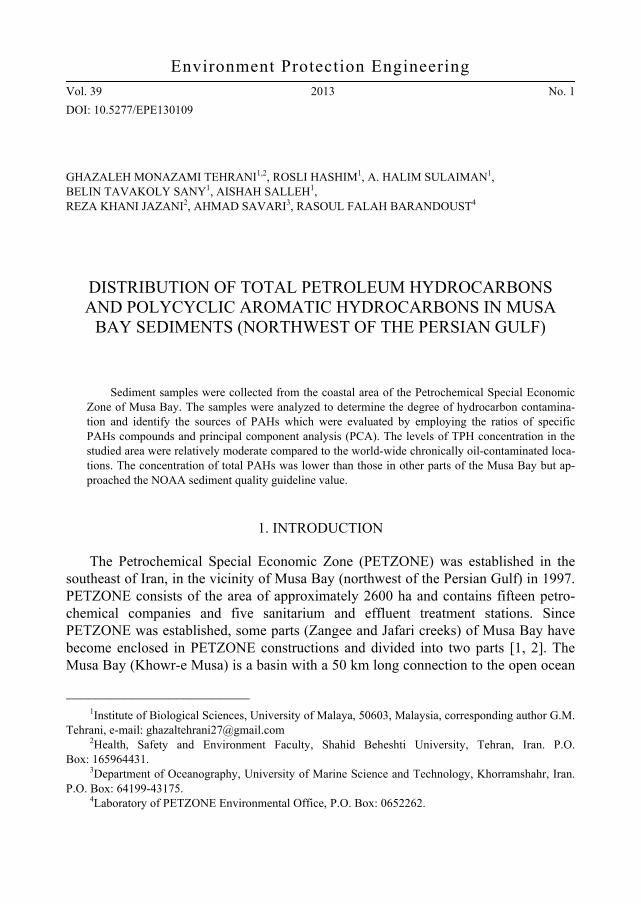
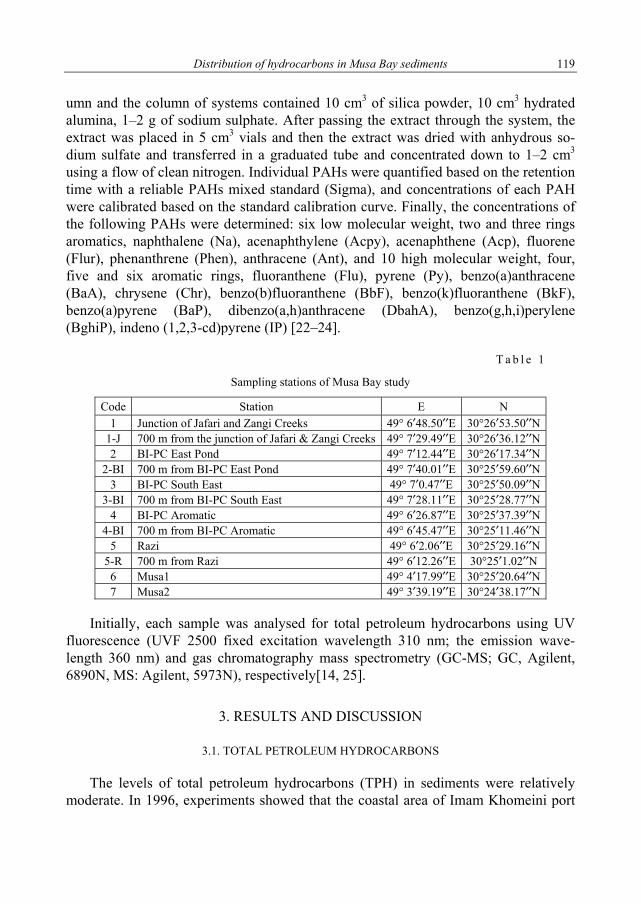
Sediment samples from Musa Bay were collected from 12 stations located in the coastal area of the Petrochemical Special Economic Zone (PETZONE) from June 2009 to June 2010 using an Ekman-Birge grab sampler (225 cm2). The sampling sites are shown in Fig. 1.
Five (1–5) sampling stations were in the proximity of PETZONE wastewater dis-charge points and drown to make one sampling point 0.7 km apart on each transect. The sampling stations presented in Table 1.
The study area is covered with fine-grained sediments and the top 0–5 or 0–10 cm from each grab samples was obtained to provide an appropriate sample of surface sediment. Then, sediment samples were stored in aluminum foil and placed on ice after sampling, immediately transported to the laboratory and kept in the refrigerator at –20 °C before analysis. In the laboratory, 10–20 grams of freeze-dried sediment sam-ple (freeze-drier model: Operon), ground and sieved at 125 µm, were placed in the glass tube of the reactor. The extraction was conducted using a microwave oven (at 115 °C for 20 min). A 15 g aliquot of freeze-dried sediment sample was placed in the glass tube of the reactor with 40 cm3 of hexane:methylene chloride (1:1 v/v).
118
intera ro
Fig.
Sulfur was remrferences durintary evaporator
1. Location of the
moved using acng gas chromatr. Sediment sam
G.M. TEHRANI et
study area and sam
tivated elementtography, and tmples were frac
al.
mpling stations in M
tal copper in orthe extracts wectionated on a s
Musa Bay
rder to avoid pere concentratedsilica gel–alumi
otential d using ina col-
Distribution of hydrocarbons in Musa Bay sediments 119
umn and the column of systems contained 10 cm3 of silica powder, 10 cm3 hydrated alumina, 1–2 g of sodium sulphate. After passing the extract through the system, the extract was placed in 5 cm3 vials and then the extract was dried with anhydrous so-dium sulfate and transferred in a graduated tube and concentrated down to 1–2 cm3 using a flow of clean nitrogen. Individual PAHs were quantified based on the retention time with a reliable PAHs mixed standard (Sigma), and concentrations of each PAH were calibrated based on the standard calibration curve. Finally, the concentrations of the following PAHs were determined: six low molecular weight, two and three rings aromatics, naphthalene (Na), acenaphthylene (Acpy), acenaphthene (Acp), fluorene (Flur), phenanthrene (Phen), anthracene (Ant), and 10 high molecular weight, four, five and six aromatic rings, fluoranthene (Flu), pyrene (Py), benzo(a)anthracene (BaA), chrysene (Chr), benzo(b)fluoranthene (BbF), benzo(k)fluoranthene (BkF), benzo(a)pyrene (BaP), dibenzo(a,h)anthracene (DbahA), benzo(g,h,i)perylene (BghiP), indeno (1,2,3-cd)pyrene (IP) [22–24].
T a b l e 1
Sampling stations of Musa Bay study
Code Station E N 1 Junction of Jafari and Zangi Creeks 49° 6′48.50′′E 30°26′53.50′′N
1-J 700 m from the junction of Jafari & Zangi Creeks 49° 7′29.49′′E 30°26′36.12′′N 2 BI-PC East Pond 49° 7′12.44′′E 30°26′17.34′′N
2-BI 700 m from BI-PC East Pond 49° 7′40.01′′E 30°25′59.60′′N 3 BI-PC South East 49° 7′0.47′′E 30°25′50.09′′N
3-BI 700 m from BI-PC South East 49° 7′28.11′′E 30°25′28.77′′N 4 BI-PC Aromatic 49° 6′26.87′′E 30°25′37.39′′N
4-BI 700 m from BI-PC Aromatic 49° 6′45.47′′E 30°25′11.46′′N 5 Razi 49° 6′2.06′′E 30°25′29.16′′N
5-R 700 m from Razi 49° 6′12.26′′E 30°25′1.02′′N 6 Musa1 49° 4′17.99′′E 30°25′20.64′′N 7 Musa2 49° 3′39.19′′E 30°24′38.17′′N
Initially, each sample was analysed for total petroleum hydrocarbons using UV
fluorescence (UVF 2500 fixed excitation wavelength 310 nm; the emission wave-length 360 nm) and gas chromatography mass spectrometry (GC-MS; GC, Agilent, 6890N, MS: Agilent, 5973N), respectively[14, 25].
3. RESULTS AND DISCUSSION
3.1. TOTAL PETROLEUM HYDROCARBONS
The levels of total petroleum hydrocarbons (TPH) in sediments were relatively moderate. In 1996, experiments showed that the coastal area of Imam Khomeini port
G.M. TEHRANI et al. 120
was classified as slightly polluted; however, the concentrations of contaminants were close to the lower limit of moderately polluted areas. Nevertheless, the observed amount of contamination was lower than that of most Arab coasts and the TPH con-centration in the Persian Gulf sediments was categorised into four levels (guideline): Unpolluted area/natural background level (10–15 µg/g), slightly polluted area/upper permissible limits (15–50 µg/g), moderately polluted area (50–200 µg/g), heavily pol-luted area (>200 µg/g). Thus the concentrations <15 µg/g, as chrysene equivalents are considered to represent natural background levels in this region [13].
In 2000, the Mangrove Afforestation Program was initiated in the coastal area sur-rounding the aforementioned creeks and Musa Bay, including PETZONE and the re-gion surrounding Mahshahr oil export terminal to increase the amount of green space around industrial zones [26]. In 2004, the Research Institute of the National Petro-chemical Industry of Iran showed that the most polluted areas in Musa Bay were lo-cated in the vicinity of petrochemical industries and Mahshahr oil export terminal. The Institute reported that the concentration of total oil and grease (TOG) in Musa Bay sediments was 9.15 mg/g; therefore, the Bay is more polluted than other Arabic coastal areas [27]. In 2009, Taatizadeh studied the impact of TPH on Musa Bay by evaluating regions located in the vicinity of Imam Khomeini port (near PETZONE). In the aforementioned study, the concentration of TPH ranged from 5.44 to 16.66 µg/g (average 10.13 µg/g) [28].
T a b l e 2
Average concentrations of TPH in the sampling stations of Musa Bay
Total 48.98 The average concentrations of TPH obtained in the present investigation are
shown in Table 2. The TPH concentrations of sediment samples presented an average
valuwasarra
backoverat th
tiondar-reacconcconcoutleasta resCreeDepAs aconc
ue of 48.98 µg/ observed at 3
anged as follows
3-BI
At all of the skground value (r, the TPH conche site.
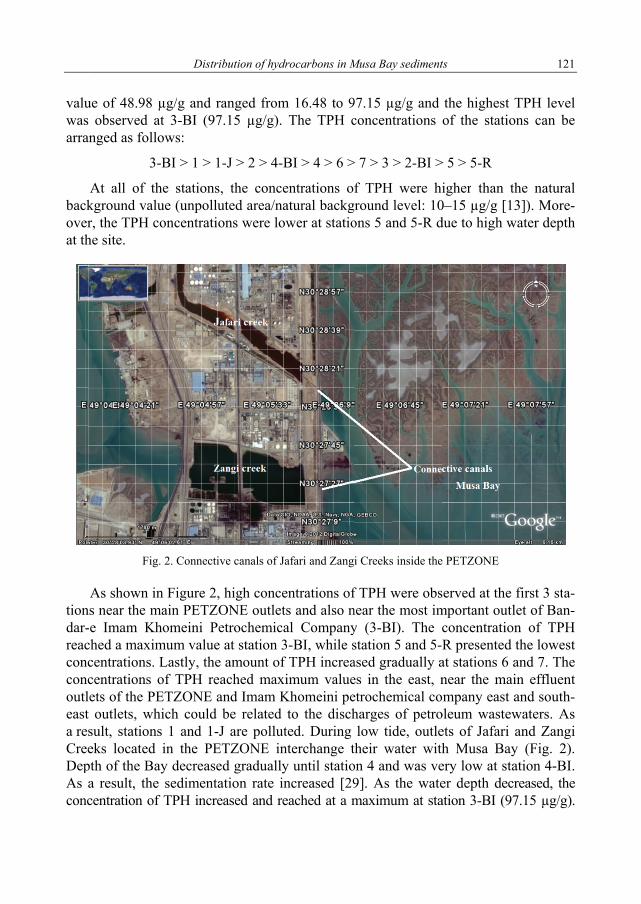
Fig. 2. C
As shown in Fins near the main-e Imam Khomched a maximumcentrations. Lascentrations of Tlets of the PETZt outlets, whichsult, stations 1 eks located in
pth of the Bay da result, the secentration of TP
Distribution of
/g and ranged f-BI (97.15 µg/s:
> 1 > 1-J > 2 >
stations, the co(unpolluted areacentrations were
Connective canals
igure 2, high con PETZONE oumeini Petrochemm value at statiostly, the amountTPH reached mZONE and Imamh could be relat
and 1-J are pothe PETZONE
decreased gradudimentation rat
PH increased an
f hydrocarbons in M
from 16.48 to 9/g). The TPH c
> 4-BI > 4 > 6 >
oncentrations oa/natural backge lower at statio
of Jafari and Zang
oncentrations ofutlets and also nmical Companyon 3-BI, while st of TPH increa
maximum valuem Khomeini peted to the discholluted. During E interchange tually until statiote increased [29
nd reached at a m
Musa Bay sediment
97.15 µg/g and concentrations
> 7 > 3 > 2-BI >
f TPH were higround level: 10ons 5 and 5-R d
i Creeks inside the
f TPH were obsnear the most imy (3-BI). The cstation 5 and 5-Rased gradually aes in the east, netrochemical coharges of petrolow tide, outle
their water withon 4 and was ve9]. As the watemaximum at sta
ts
the highest TPof the stations
> 5 > 5-R
igher than the 0–15 µg/g [13])due to high wate
PETZONE
erved at the firsmportant outlet oconcentration oR presented the
at stations 6 andnear the main empany east and
oleum wastewatets of Jafari andh Musa Bay (Fery low at statioer depth decreaation 3-BI (97.15
121
H level can be
natural . More-er depth
st 3 sta-of Ban-of TPH e lowest d 7. The effluent d south-ters. As d Zangi Fig. 2).
on 4-BI. ased, the 5 µg/g).
G.M. TEHRANI et al. 122
Another reason may be related to the mangrove forest area which is located in the east part of the PETZONE. The presence of fine sediment along the mangrove line can increase the sedimentation rate. As the hydrodynamic energy time decreases, these types of forests can trap suspended solids; thus, enough time is available for the storage and re-deposition of fine particles. Due to the high total organic carbon content, aerobic conditions and rapid change of burial, the potential for the deposition of anthropogenic pollutants adsorbed by sediments in mangrove forests is high [31, 32].
Stations 5 and 5-R are located near the port of Razi and the outlet of Razi petro-chemical company; however, the water depth is very high in this area. Therefore, this region is less polluted than the other stations and it is classified as slightly polluted; nevertheless, the concentration of contaminants was close to the natural background value [13].This variation is mainly related to differences in the locations (closeness to the main petrochemical effluents), depth of the sediment sampling stations and also there is no mangrove plants. Station 6 is located near the Imam Khomeini port, and station 7 is situated in the mouth of Marimus Creek. However, effluent outlets were not present alongside these stations. As a result, the stations were classified as slightly polluted (slightly polluted area/upper permissible limits:15–50 µg/g [13]). These sites were not as deep as at stations 5 and 5-R; thus, the observed contaminant concentra-tion may be related to shipping activity and strong tidal currents in the mouth of Ma-rimus Creek. On the other hand, due to another guideline, TPH concentrations higher than 500 µg/g are indicative of significant pollution and less than 10 µg/g are consid-ered as unpolluted sediments [33], also according to some guidelines, concentrations lower than 15 µg/g as chrysene equivalents, are considered to represent natural back-ground levels in the ROPME Sea area [14].
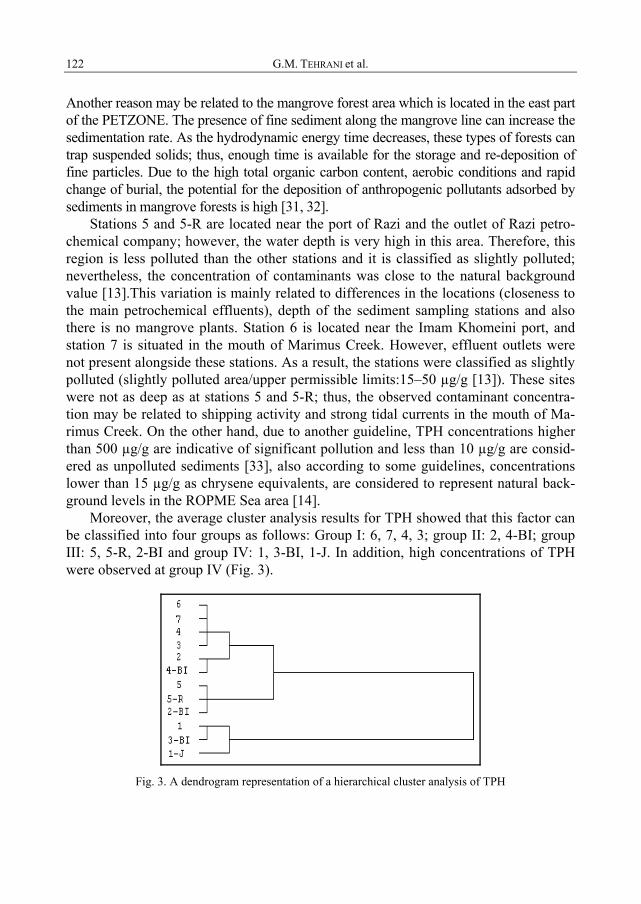
Moreover, the average cluster analysis results for TPH showed that this factor can be classified into four groups as follows: Group I: 6, 7, 4, 3; group II: 2, 4-BI; group III: 5, 5-R, 2-BI and group IV: 1, 3-BI, 1-J. In addition, high concentrations of TPH were observed at group IV (Fig. 3).
Fig. 3. A dendrogram representation of a hierarchical cluster analysis of TPH
Distribution of hydrocarbons in Musa Bay sediments 123
In conclusion, the levels of TPH concentration in the study area relatively moderate compared to chronically oil-contaminated area such as, Gulf of Oman (0.05–779 µg/g) and also highly oil-contaminated coastline of BAPCO oil refinery in Bahrain (779 µg/g) [34], oil-contaminated coastline of Saudi Arabia after the Gulf war (11–6900 µg/g) [35], near-shoreline marine sediments of the United Arabian Emirates, in 1994 (0.4–212 µg/g), highly oil-impacted sediments of Hong Kong’s Victoria Har-bour (60–646 µg/g) [36] and New York Bight (35–2900 µg/g) [14].
3.2. POLYCYCLIC AROMATIC HYDROCARBONS
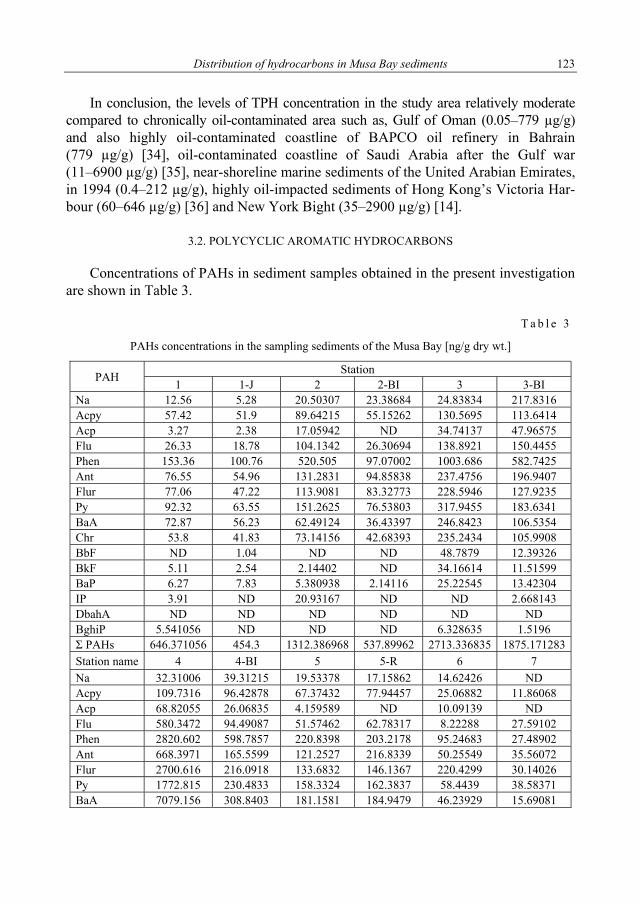
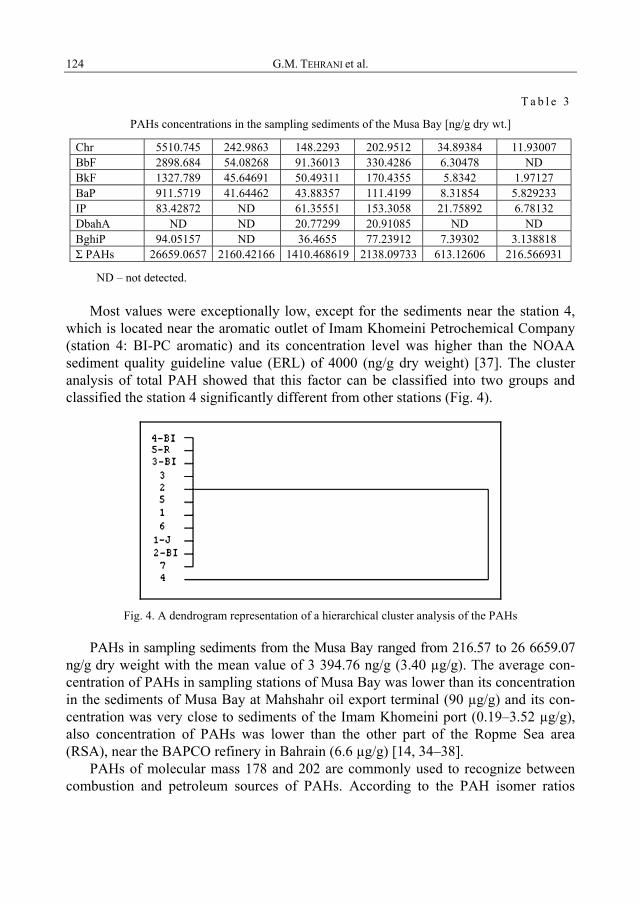
Concentrations of PAHs in sediment samples obtained in the present investigation are shown in Table 3.
T a b l e 3
PAHs concentrations in the sampling sediments of the Musa Bay [ng/g dry wt.]
ND – not detected. Most values were exceptionally low, except for the sediments near the station 4,
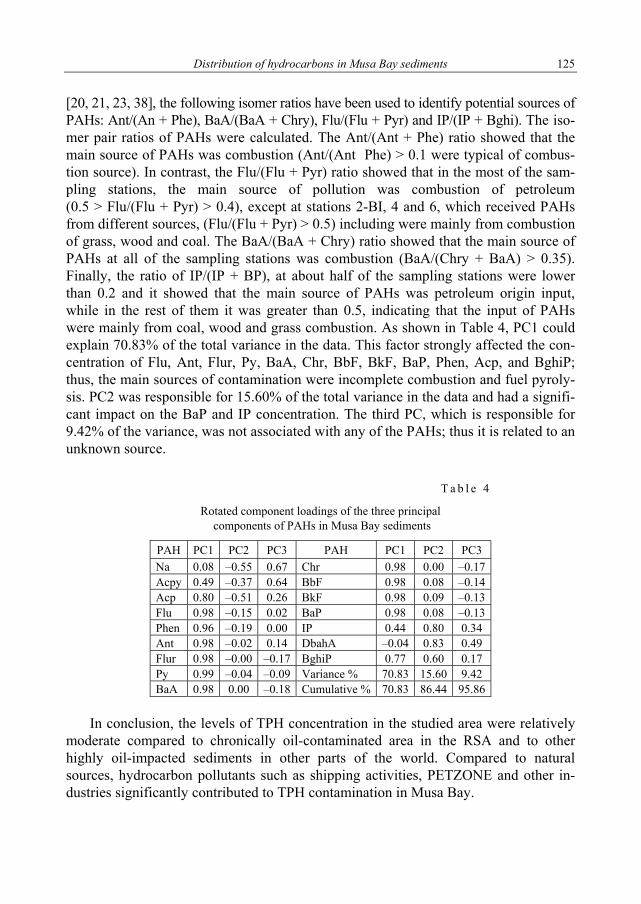
which is located near the aromatic outlet of Imam Khomeini Petrochemical Company (station 4: BI-PC aromatic) and its concentration level was higher than the NOAA sediment quality guideline value (ERL) of 4000 (ng/g dry weight) [37]. The cluster analysis of total PAH showed that this factor can be classified into two groups and classified the station 4 significantly different from other stations (Fig. 4).
Fig. 4. A dendrogram representation of a hierarchical cluster analysis of the PAHs
PAHs in sampling sediments from the Musa Bay ranged from 216.57 to 26 6659.07 ng/g dry weight with the mean value of 3 394.76 ng/g (3.40 µg/g). The average con-centration of PAHs in sampling stations of Musa Bay was lower than its concentration in the sediments of Musa Bay at Mahshahr oil export terminal (90 µg/g) and its con-centration was very close to sediments of the Imam Khomeini port (0.19–3.52 µg/g), also concentration of PAHs was lower than the other part of the Ropme Sea area (RSA), near the BAPCO refinery in Bahrain (6.6 µg/g) [14, 34–38].
PAHs of molecular mass 178 and 202 are commonly used to recognize between combustion and petroleum sources of PAHs. According to the PAH isomer ratios
Distribution of hydrocarbons in Musa Bay sediments 125
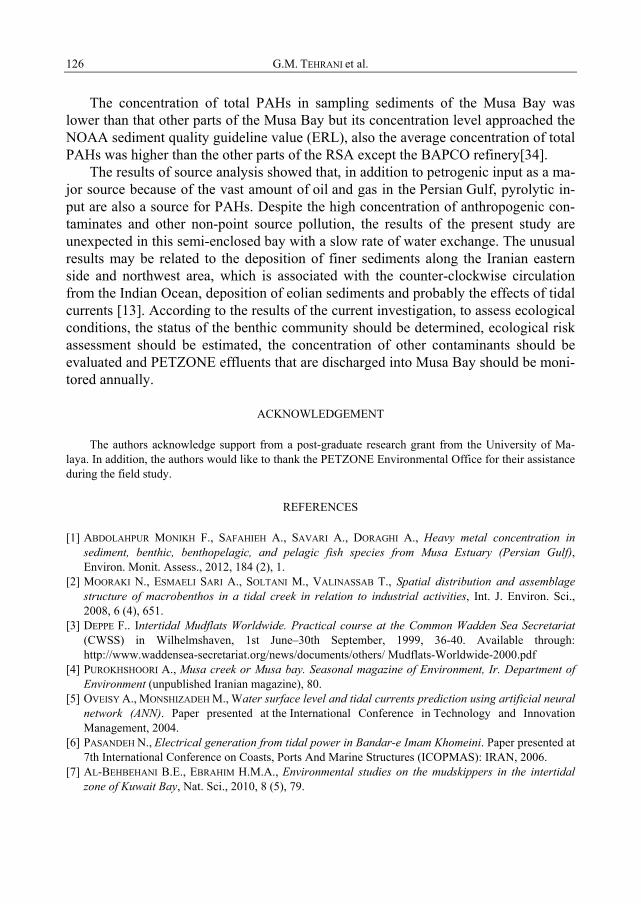
[20, 21, 23, 38], the following isomer ratios have been used to identify potential sources of PAHs: Ant/(An + Phe), BaA/(BaA + Chry), Flu/(Flu + Pyr) and IP/(IP + Bghi). The iso-mer pair ratios of PAHs were calculated. The Ant/(Ant + Phe) ratio showed that the main source of PAHs was combustion (Ant/(Ant Phe) > 0.1 were typical of combus-tion source). In contrast, the Flu/(Flu + Pyr) ratio showed that in the most of the sam-pling stations, the main source of pollution was combustion of petroleum (0.5 > Flu/(Flu + Pyr) > 0.4), except at stations 2-BI, 4 and 6, which received PAHs from different sources, (Flu/(Flu + Pyr) > 0.5) including were mainly from combustion of grass, wood and coal. The BaA/(BaA + Chry) ratio showed that the main source of PAHs at all of the sampling stations was combustion (BaA/(Chry + BaA) > 0.35). Finally, the ratio of IP/(IP + BP), at about half of the sampling stations were lower than 0.2 and it showed that the main source of PAHs was petroleum origin input, while in the rest of them it was greater than 0.5, indicating that the input of PAHs were mainly from coal, wood and grass combustion. As shown in Table 4, PC1 could explain 70.83% of the total variance in the data. This factor strongly affected the con-centration of Flu, Ant, Flur, Py, BaA, Chr, BbF, BkF, BaP, Phen, Acp, and BghiP; thus, the main sources of contamination were incomplete combustion and fuel pyroly-sis. PC2 was responsible for 15.60% of the total variance in the data and had a signifi-cant impact on the BaP and IP concentration. The third PC, which is responsible for 9.42% of the variance, was not associated with any of the PAHs; thus it is related to an unknown source.
T a b l e 4
Rotated component loadings of the three principal components of PAHs in Musa Bay sediments
In conclusion, the levels of TPH concentration in the studied area were relatively
moderate compared to chronically oil-contaminated area in the RSA and to other highly oil-impacted sediments in other parts of the world. Compared to natural sources, hydrocarbon pollutants such as shipping activities, PETZONE and other in-dustries significantly contributed to TPH contamination in Musa Bay.
G.M. TEHRANI et al. 126
The concentration of total PAHs in sampling sediments of the Musa Bay was lower than that other parts of the Musa Bay but its concentration level approached the NOAA sediment quality guideline value (ERL), also the average concentration of total PAHs was higher than the other parts of the RSA except the BAPCO refinery[34].
The results of source analysis showed that, in addition to petrogenic input as a ma-jor source because of the vast amount of oil and gas in the Persian Gulf, pyrolytic in-put are also a source for PAHs. Despite the high concentration of anthropogenic con-taminates and other non-point source pollution, the results of the present study are unexpected in this semi-enclosed bay with a slow rate of water exchange. The unusual results may be related to the deposition of finer sediments along the Iranian eastern side and northwest area, which is associated with the counter-clockwise circulation from the Indian Ocean, deposition of eolian sediments and probably the effects of tidal currents [13]. According to the results of the current investigation, to assess ecological conditions, the status of the benthic community should be determined, ecological risk assessment should be estimated, the concentration of other contaminants should be evaluated and PETZONE effluents that are discharged into Musa Bay should be moni-tored annually.
ACKNOWLEDGEMENT
The authors acknowledge support from a post-graduate research grant from the University of Ma-laya. In addition, the authors would like to thank the PETZONE Environmental Office for their assistance during the field study.
REFERENCES
[1] ABDOLAHPUR MONIKH F., SAFAHIEH A., SAVARI A., DORAGHI A., Heavy metal concentration in sediment, benthic, benthopelagic, and pelagic fish species from Musa Estuary (Persian Gulf), Environ. Monit. Assess., 2012, 184 (2), 1.
[2] MOORAKI N., ESMAELI SARI A., SOLTANI M., VALINASSAB T., Spatial distribution and assemblage structure of macrobenthos in a tidal creek in relation to industrial activities, Int. J. Environ. Sci., 2008, 6 (4), 651.
[3] DEPPE F.. Intertidal Mudflats Worldwide. Practical course at the Common Wadden Sea Secretariat (CWSS) in Wilhelmshaven, 1st June–30th September, 1999, 36-40. Available through: http://www.waddensea-secretariat.org/news/documents/others/ Mudflats-Worldwide-2000.pdf
[4] PUROKHSHOORI A., Musa creek or Musa bay. Seasonal magazine of Environment, Ir. Department of Environment (unpublished Iranian magazine), 80.
[5] OVEISY A., MONSHIZADEH M., Water surface level and tidal currents prediction using artificial neural network (ANN). Paper presented at the International Conference in Technology and Innovation Management, 2004.
[6] PASANDEH N., Electrical generation from tidal power in Bandar-e Imam Khomeini. Paper presented at 7th International Conference on Coasts, Ports And Marine Structures (ICOPMAS): IRAN, 2006.
[7] AL-BEHBEHANI B.E., EBRAHIM H.M.A., Environmental studies on the mudskippers in the intertidal zone of Kuwait Bay, Nat. Sci., 2010, 8 (5), 79.
Distribution of hydrocarbons in Musa Bay sediments 127
[8] KAMPF J.M., SADRINASAB, The circulation of the Persian Gulf: A numerical study, Ocean. Sci., 2006, 2, 27.
[9] FATIMAH M.A., AL-AWADHI, The Year of the Ocean and its crucial importance to the Gulf, Desalination, 1999, 123 (2–3), 127.
[10] NADIM F., BAGTZOGLOU A.C., IRANMAHBOOB J., Coastal management in the Persian Gulf region within the framework of the ROPME programme of action, Ocean. Coast. Manage., 2008, 51 (7), 556.
[11] PRICE A., Impact of the 1991 Gulf War on the coastal environment and ecosystems: current status and future prospects, Environ. Int., 1998, 24 (1–2), 91.
[12] SAEED T., AL-MUZAINI S., AL-BLOUSHI A., Post-Gulf War assessment of the levels of PAHs in the sediments from Shuaiba Industrial Area, Kuwait, Water Sci. Technol., 1996, 34 (7–8), 195.
[13] MASSOUD AL-ABDALI F., AL-GHADBAN A.N., AL-SARAWI M., Bottom sediments of the Arabian Gulf. II. TPH and TOC contents as indicators of oil pollution and implications for the effect and fate of the Kuwait oil slick, Environ. Pollut., 1999, 93 (3), 271.
[14] DE MORA S., TOLOSA I., FOWLER S.W., VILLENEUVE J.P., CASSI R., CATTINI C., Distribution of petroleum hydrocarbons and organochlorinated contaminants in marine biota and coastal sediments from the ROPME Sea Area during 2005, Mar. Pollut. Bull., 2010, 60 (12), 2323.
[15] PAK A., FARAJZADEH M., Iran’s Integrated Coastal Management plan: Persian Gulf, Oman Sea, and southern Caspian Sea coastlines, Ocean. Coast Manage., 2007. 50 (9), 754.
[16] KENNISH M.J., Pollution impacts on marine biotic communities, CRC Press, Boca Raton, FL., 1997 . [17] GUZZELLA L., DE PAOLIS A., Polycyclic aromatic hydrocarbons in sediments of the Adriatic Sea,
Mar. Pollut. Bull., 1994, 28, 159. [18] FRAGOSO N.M., HODSON P.V., ZAMBON S., Evaluation of an exposure assay to measure uptake of
sediment PAH by fish, Environ. Monit. Assess., 2006, 116 (1), 481. [19] AGARWAL T., KHILLARE P., ASHRIDHAR V., PAHs contamination in bank sediment of the Yamuna
River, Delhi, India, Environ. Monit. Assess., 2006, 123(1), 151. [20] LI G., XIA X., YANG Z., WANG R., VOULVOULIS N., Distribution and sources of polycyclic aromatic
hydrocarbons in the middle and lower reaches of the Yellow River, China, Environ. Pollut., 2006, 144 (3), 985.
[21] YUNKER M.B., MACDONALD R.W., VINGARZAN R., MITCHELL R.H., GOYETTE D., SYLVESTRE S., PAHs in the Fraser River basin: a critical appraisal of PAH ratios as indicators of PAH source and composition, Org. Geochem., 2002, 33 (4), 489.
[22] HERZFELDER E.R., GOLLEDGE R.W., Method for the determination of extractable petroleum hydrocarbons (EPH), Massachusetts Department of Environmental Protection, Boston, 2004, 39.
[23] SEMLALI A., CHAFIK A., TALBI M., BUDZINSKI H., Origin and Distribution of polycyclic aromatic hydrocarbons in Lagoon Ecosystems of Morocco, Environ. Pollut. Toxicol., 2012, 3, 37.
[24] VIGURI J., VERDE J., IRABIEN A., Environmental assessment of polycyclic aromatic hydrocarbons (PAHs) in surface sediments of the Santander Bay, Northern Spain, Chemosphere, 2002. 48 (2), 157.
[25] MOOPAM. Manual of Oceanographic Observation and Pollutant Analysis Methods, Regional Organization for the Protection of the Marine Environment, Kuwait, 1999, 483, 29.
[26] National Petrochemical company (NPC). Petrochemistry seasonal announcement, 2006, 36. Available through: www.petzone.ir
[27] RIPI, Contamination of the marine environment from industrial discharges, Research Institute Of Petroleum Industry (unpublished local report), 2004.
[28] TAATIZADEH H., Evaluation of oil pollution in Bandar-e Imam Khomeini and offer some recommendation, unpublished master thesis, Tehran University, Faculty of Environment, 2009, 151.
[29] HENDERSON G.M., LINDSAY F.N., SLOWEY N.C., Variation in bioturbation with water depth on marine slopes: A study on the Little Bahamas Bank, Mar. Geol., 1999, 160 (1), 105.
G.M. TEHRANI et al. 128
[30] FURUKAWA K., WOLANSKI E., MUELLER H., Currents and sediment transport in mangrove forests. Estuarine, Estuar. Coast. Shelf S., 1997, 44(3), 301.
[31] CUNHA-LIGNON M., COELHO C. Jr., ALMEIDA R., MENGHINI R., CORREA F., SCHAEFFER-NOVELLI Y., CINTRÓN-MOLERO G., DAHDOUH-GUEBAS F., Mangrove forests and sedimentary processes on the south coast of São Paulo State (Brazil), J. Coast. Res., 2009, 405.
[32] VOLKMAN J.K., HOLDSWORTH D.G., NEILL G.P., BAVOR H. Jr., Identification of natural, anthropogenic and petroleum hydrocarbons in aquatic sediments, Sci. Total. Environ., 1992, 112 (2–3), 203.
[33] TOLOSA I., DE MORA S.J., FOWLER S.W., VILLENEUVE J.P., BARTOCCI J., CATTINI C., Aliphatic and aromatic hydrocarbons in marine biota and coastal sediments from the Gulf and the Gulf of Oman, Mar. Pollut Bull., 2005, 50 (12),1619.
[34] READMAN J., BARTOCCI J., TOLOSA I., FOWLER S., OREGIONI B., ABDULRAHEEM M., Recovery of the coastal marine environment in the Gulf following the 1991 war-related oil spills, Mar. Pollut Bull., 1996, 32 (6), 493.
[35] HONG H., XU L., ZHANG L., CHEN J., WONG Y., WAN T., Special guest paper: Environmental fate and chemistry of organic pollutants in the sediment of Xiamen and Victoria Harbours, Mar. Pollut Bull., 1995, 31 (4–12), 229.
[36] LONG E.R., MACDONALD D.D., SMITH S.L., CALDER F.D., Incidence of adverse biological effects within ranges of chemical concentrations in marine and estuarine sediments, Environ. Manage., 1995, 19 (1), 81.
[37] WANG C., WANG W., HE S., DU J., SUN Z., Sources and distribution of aliphatic and polycyclic aromatic hydrocarbons in Yellow River Delta Nature Reserve, China, Appl. Geochem., 2011, 26 (8), 1330.