32
GujaratDistrict Factbook™
Narmada District
(Key Socio-economic Data of Narmada District, Gujarat)January, 2017

Editor & DirectorDr. R.K. Thukral
Research EditorDr. Shafeeq Rahman
Compiled, Researched and Published byDatanet India Pvt. Ltd.D-100, 1st Floor,Okhla Industrial Area, Phase-I,New Delhi-110020.Ph.: 91-11-43580781, 26810964-65-66Email : [email protected] : http://www.datanetindia-ebooks.com
Report No.: DFB/GJ-487-0117
ISBN : 978-93-86370-30-3
First Edition : January, 2017
Price : Rs. 7500/- US$ 200
© 2017 Datanet India Pvt. Ltd.All right reserved. No part of this book may be reproduced, stored in a retrievalsystem or transmitted in any form or by any means, mechanical, photocopying,recording or otherwise without the prior written permission of the publisher.
Printed in India

Narmada District at a Glance
District came into Existence 2nd October, 1997
District Headquarter Rajpipla
Distance from State Capital 203 Kms.
Geographical Area (In Square km.) 2,817 (Ranks 22nd in State and 409th in India)Wastelands Area (In Square km.)(2008-2009)
338.21
Total Number of Households 1,22,039
Population 5,90,297 (Persons), 3,01,086 (Males), 2,89,211 (Females) (Ranks 24th in Stateand 528th in India)
Population Growth Rate (2001-2011)
14.75 (Persons), 14.05 (Males), 15.49 (Females)
Number of SubDistricts/Towns/Villages
Sub-districts (04), Towns (05) and Villages (609)
Forest Cover (2015) 37.17% of Total Geographical AreaPercentage of Urban/RuralPopulation
10.48 (Urban), 89.52 (Rural)
Administrative Language Gujarati
Principal Languages (2001) Bhili/Bhilodi (51.87%), Gujarati (44.24%), Hindi (2.17%), Marathi (1.16%),Khandeshi (0.12%), Urdu (0.05%) and Others (0.16%)
Population Density 210 (Persons per Sq. km.)
Sex Ratio 961 (Females per 1000 Males)
Child Ratio (Age Group 0-6 Year) 941 (Females per 1000 Males)
Number of Live Births (2014) 8,233 (Persons), 4,265 (Males), 3,968 (Females)
Number of Deaths (2014) 2,388 (Persons), 1,448 (Males), 940 (Females)
Literacy Rate (In %age) 72.31 (Persons), 81.19 (Males), 63.09 (Females)
Literates 3,70,336 (Persons), 2,11,767 (Males), 1,58,569 (Females)
Illiterates 2,19,961 (Persons), 89,319 (Males), 1,30,642 (Females)
Major Religions Hindu (94.84%), Muslim (3.83%), Christian (0.75%), Jain (0.06%), Sikh (0.02%)and Buddhist (0.01%)
Schedule Caste Population 8,733 (Persons), 4,465 (Males), 4,268 (Females), Percentage of SC in TotalPopulation (0.21)
Major Schedule Caste Population
Mahyavansi, Dhed, Dhedh, Vankar, Maru Vankar, Antyaj (43.12%); Bhambi,Bhambhi, Asadaru, Asodi, Chamadia, Chamar, Chamar-Ravidas, Chambhar,Chamgar, Haralayya, Harali, Khalpa, Machigar, Mochigar, Madar, Madig, Mochi (inDangs district and Umergaon Taluka of Valsad district only), , Nalia, Telugu Mochi,Kamati Mochi, Ranigar, Rohidas, Rohit, Samgar (29.47%); Bhangi, Mehtar,Olgana, Rukhi, Malkana, Halalkhor, Lalbegi, Balmiki, Korar, Zadmalli,Barwa...
Schedule Tribe Population 4,81,392 (Persons), 2,44,524 (Males), 2,36,868 (Females), Percentage of ST inTotal Population (5.40)
Major Schedule Tribe Population
Bhil, Bhil Garasia, Dholi Bhil, Dungri Bhil, Dungri Garasia, Mewasi Bhil, Rawal Bhil,Tadvi Bhil, Bhagalia, Bhilala, Pawra, Vasava, Vasave (74.72%); Dhanka, Tadvi,Tetaria, Valvi (21.01%); Gamit, Gamta, Gavit, Mavchi, Padvi (0.89%); Kathodi,Katkari, Dhor Kathodi, Dhor Katkari, Son Kathodi, Son Katkari (0.38%); Bhil,Bhilala, Barela, Patelia (0.33%)
Number of Total Workers 2,94,795 (Persons), 1,74,282 (Males), 1,20,513 (Females)Labour Force Participation Rate(2011-2012)
58.17% (Rural), 49.2% (Urban)
Major Source of Income NA
Gross District Domestic Product NA
Net District Domestic Product NA
Per Capita Income NA
Number of Tourists (-) NA
Major Tourist Places
Kashivishwanath Mahadev Temple, Kabir Temple, Shuklatirth Shiva Temple andNareshwar Temple, Surpaneshwar Shiva Temple, Nizamshah Dargah, andDashavatar Ranchhodrai Temple, Shoolpaneshwar Wildlife Sanctuary andRatanmahal Wildlife Sanctuary, Sagai-Malsamot Eco Campsite, Zarwani EcoCampsite and Vishal Khadi Campsite, Rajwant Palace and Sardar Sarovar Dam.
Note: A ll figures for 2011 Census, Otherwise year is mentioned.
No. Particulars Page No.
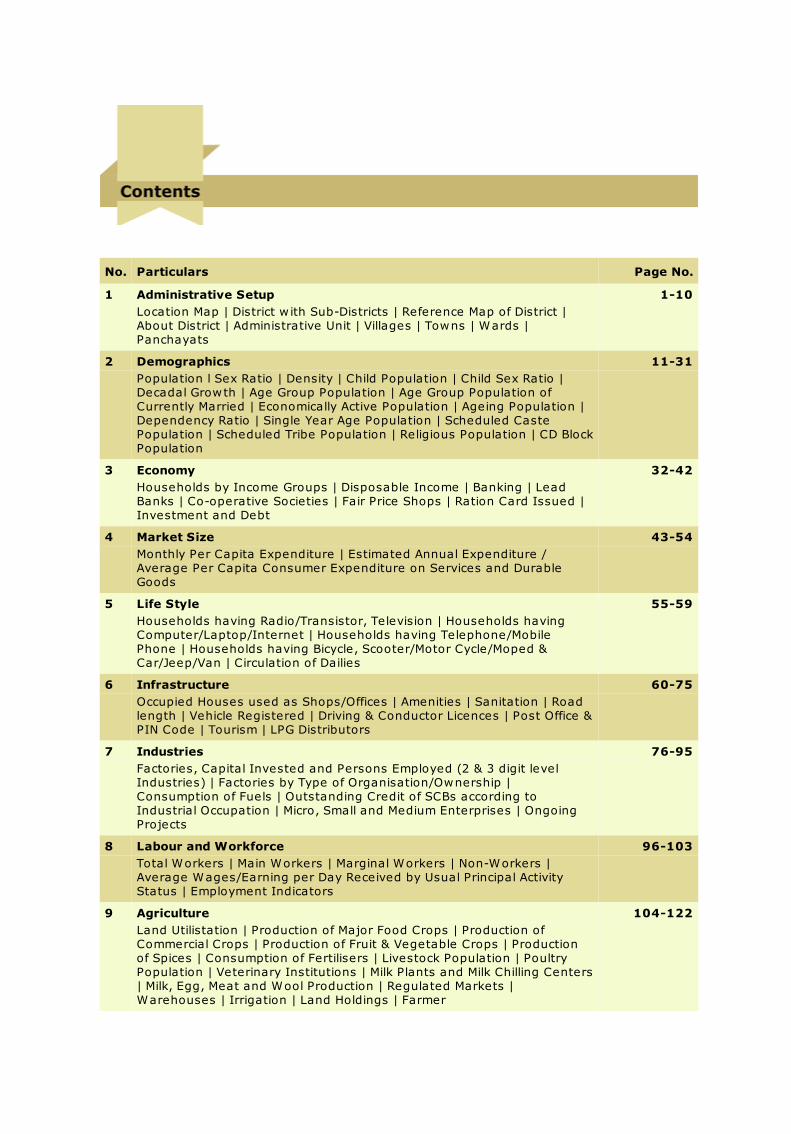
1 Administrative Setup 1-10
Location Map | District w ith Sub-Districts | Reference Map of District |About District | Administrative Unit | Villages | Towns | Wards |Panchayats
2 Demographics 11-31
Population l Sex Ratio | Density | Child Population | Child Sex Ratio |Decadal Growth | Age Group Population | Age Group Population ofCurrently Married | Economically Active Population | Ageing Population |Dependency Ratio | Single Year Age Population | Scheduled CastePopulation | Scheduled Tribe Population | Religious Population | CD BlockPopulation
3 Economy 32-42
Households by Income Groups | Disposable Income | Banking | LeadBanks | Co-operative Societies | Fair Price Shops | Ration Card Issued |Investment and Debt
4 Market Size 43-54
Monthly Per Capita Expenditure | Estimated Annual Expenditure /Average Per Capita Consumer Expenditure on Services and DurableGoods
5 Life Style 55-59
Households having Radio/Transistor, Television | Households havingComputer/Laptop/Internet | Households having Telephone/MobilePhone | Households having Bicycle, Scooter/Motor Cycle/Moped &Car/Jeep/Van | Circulation of Dailies
6 Infrastructure 60-75
Occupied Houses used as Shops/Offices | Amenities | Sanitation | Roadlength | Vehicle Registered | Driving & Conductor Licences | Post Office &PIN Code | Tourism | LPG Distributors
7 Industries 76-95
Factories, Capital Invested and Persons Employed (2 & 3 digit levelIndustries) | Factories by Type of Organisation/Ownership |Consumption of Fuels | Outstanding Credit of SCBs according toIndustrial Occupation | Micro, Small and Medium Enterprises | OngoingProjects
8 Labour and Workforce 96-103
Total Workers | Main Workers | Marginal Workers | Non-Workers |Average Wages/Earning per Day Received by Usual Principal ActivityStatus | Employment Indicators
9 Agriculture 104-122
Land Utilistation | Production of Major Food Crops | Production ofCommercial Crops | Production of Fruit & Vegetable Crops | Productionof Spices | Consumption of Fertilisers | Livestock Population | PoultryPopulation | Veterinary Institutions | Milk Plants and Milk Chilling Centers| Milk, Egg, Meat and Wool Production | Regulated Markets |Warehouses | Irrigation | Land Holdings | Farmer
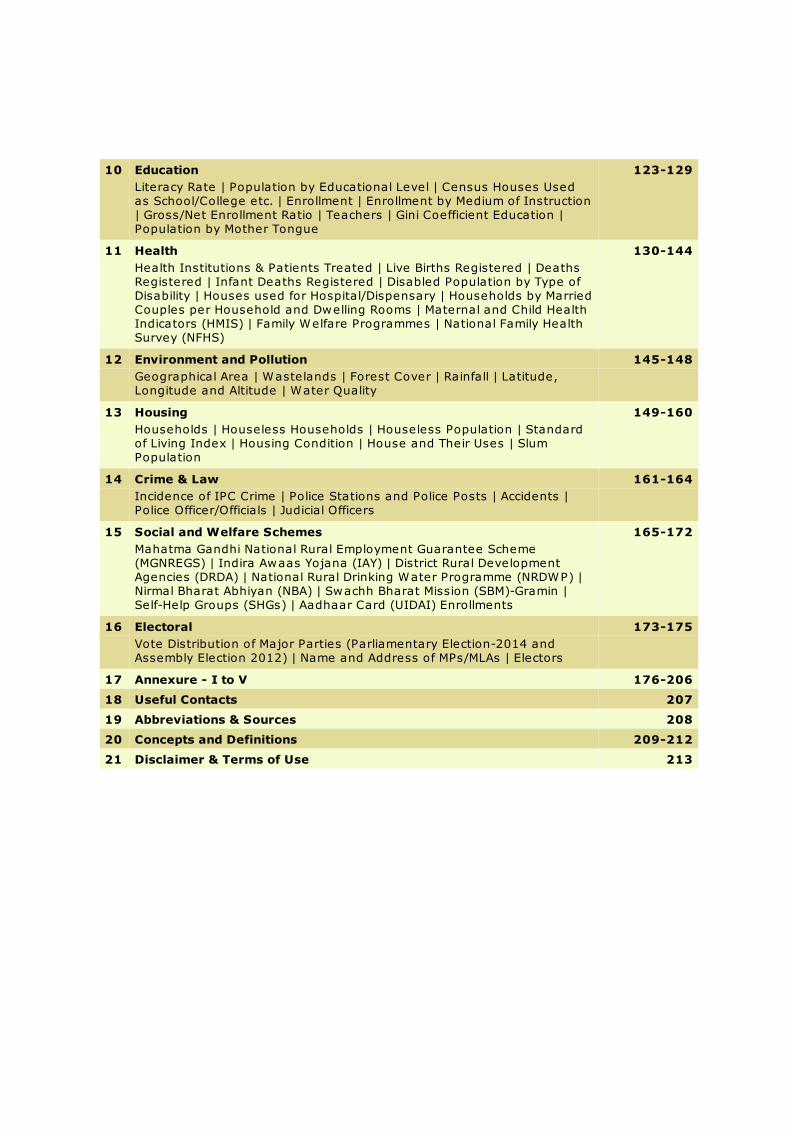
10 Education 123-129
Literacy Rate | Population by Educational Level | Census Houses Usedas School/College etc. | Enrollment | Enrollment by Medium of Instruction| Gross/Net Enrollment Ratio | Teachers | Gini Coefficient Education |Population by Mother Tongue
11 Health 130-144
Health Institutions & Patients Treated | Live Births Registered | DeathsRegistered | Infant Deaths Registered | Disabled Population by Type ofDisability | Houses used for Hospital/Dispensary | Households by MarriedCouples per Household and Dwelling Rooms | Maternal and Child HealthIndicators (HMIS) | Family Welfare Programmes | National Family HealthSurvey (NFHS)
12 Environment and Pollution 145-148
Geographical Area | Wastelands | Forest Cover | Rainfall | Latitude,Longitude and Altitude | Water Quality
13 Housing 149-160
Households | Houseless Households | Houseless Population | Standardof Living Index | Housing Condition | House and Their Uses | SlumPopulation
14 Crime & Law 161-164
Incidence of IPC Crime | Police Stations and Police Posts | Accidents |Police Officer/Officials | Judicial Officers
15 Social and Welfare Schemes 165-172
Mahatma Gandhi National Rural Employment Guarantee Scheme(MGNREGS) | Indira Awaas Yojana (IAY) | District Rural DevelopmentAgencies (DRDA) | National Rural Drinking Water Programme (NRDWP) |Nirmal Bharat Abhiyan (NBA) | Swachh Bharat Mission (SBM)-Gramin |Self-Help Groups (SHGs) | Aadhaar Card (UIDAI) Enrollments
16 Electoral 173-175
Vote Distribution of Major Parties (Parliamentary Election-2014 andAssembly Election 2012) | Name and Address of MPs/MLAs | Electors
17 Annexure - I to V 176-206
18 Useful Contacts 207
19 Abbreviations & Sources 208
20 Concepts and Definitions 209-212
21 Disclaimer & Terms of Use 213
GujaratDistrict FactbookDistrict Factbook™™ Narmada District

1
Narmada DistrictGujarat
District FactbookDistrict Factbook™™
Administrative Setup
Location Map

GujaratDistrict FactbookDistrict Factbook™™ Narmada District
Administrative Setup
2
3
Narmada DistrictGujarat
District FactbookDistrict Factbook™™
Administrative Setup
GujaratDistrict FactbookDistrict Factbook™™ Narmada District
4
5
Narmada DistrictGujarat
District FactbookDistrict Factbook™™
About Narmada District
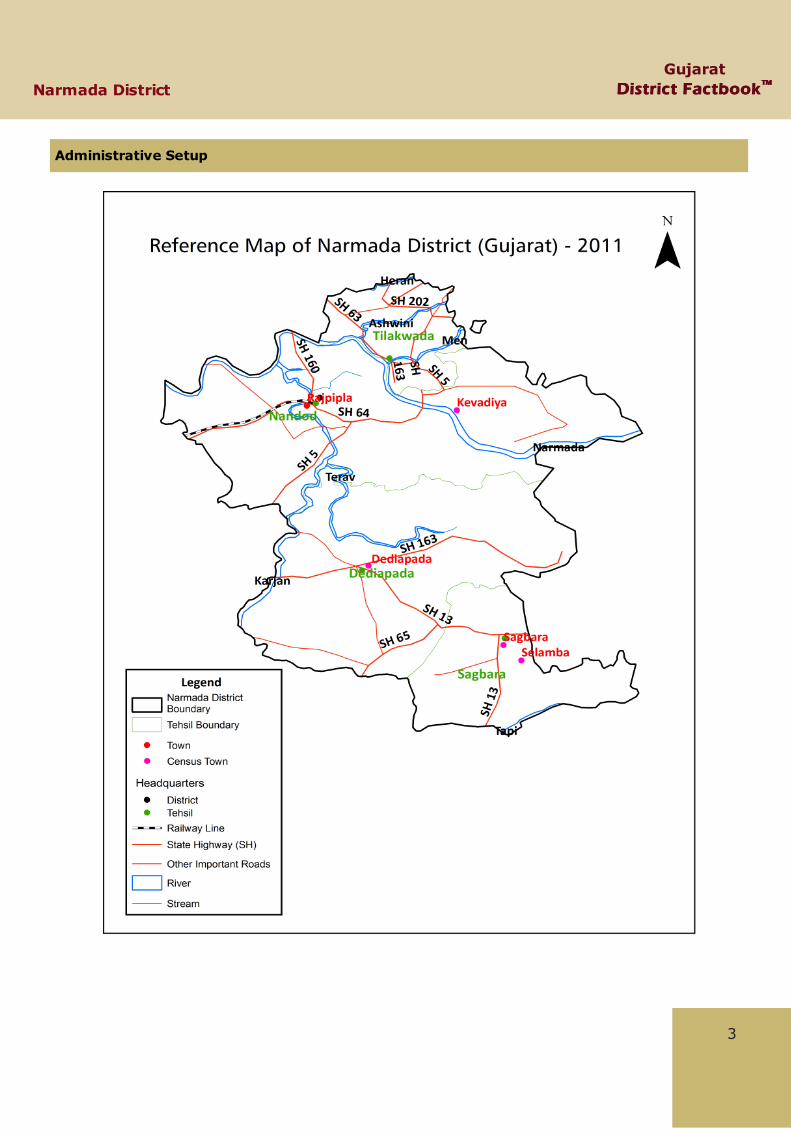
Narmada is a district of Gujarat state with its administrative headquarters located atRajpipla town. This district was emerged as a separate district in the map of Gujaratstate on October 2, 1997. At the very beginning the district comprised Tilakwada talukaof earlier Vadodara district and Nandod taluka , Dediyapada taluka and Sagbara taluka ofearlier Bharuch district.
Geographically, the district lies at 21.75°N latitude, 73.70°E longitude and 1057 mAltitude. The district encompasses a geographical area of 2,817 sq km and it is boundedby Vadodara district on the north, Maharashtra state on the east, Tapi district on thesouth and Bharuch district on the west. Most of its rainfall occurs in the monsoonseason. The actual rainfall in the district was 684.5 mm in the year of 2015-16.
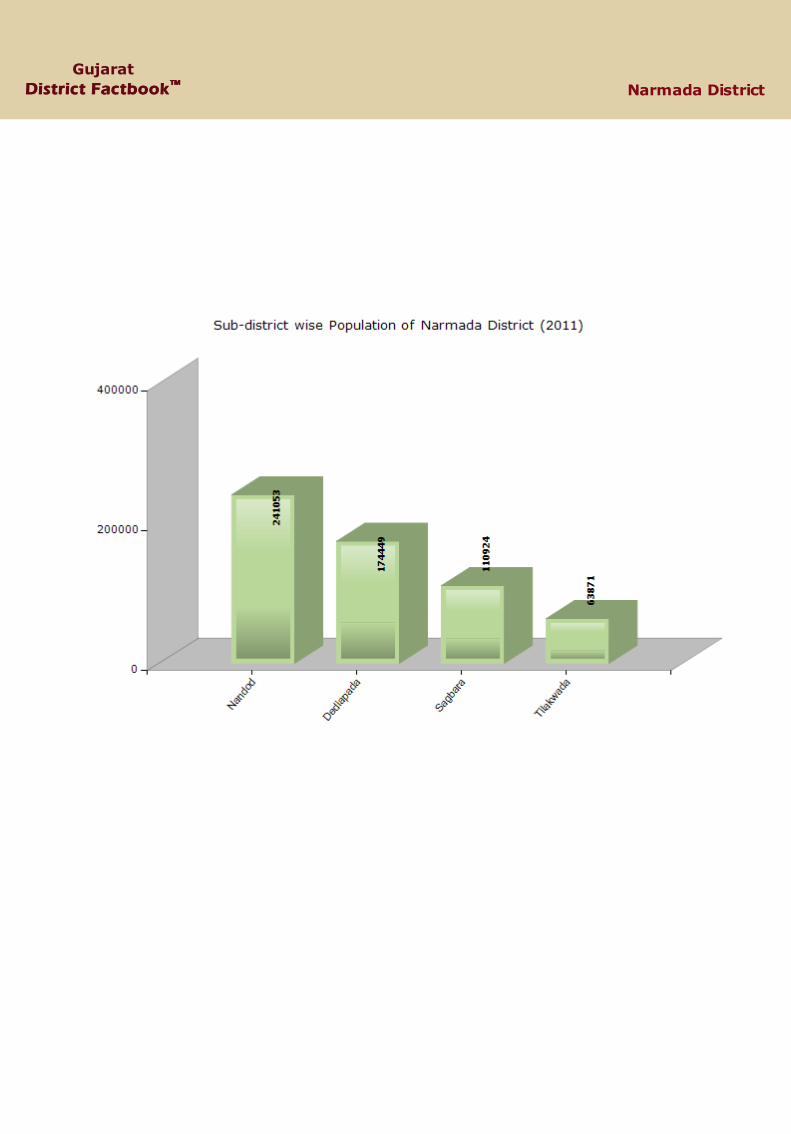
Administration wise, the district is divided into 4 sub-districts namely Nandod, Sagbara,Dediyapada and Tilakwada. The district comprises 5 towns and 609 villages. There are 2Parliamentary constituencies and 2 Assembly constituencies in the district.
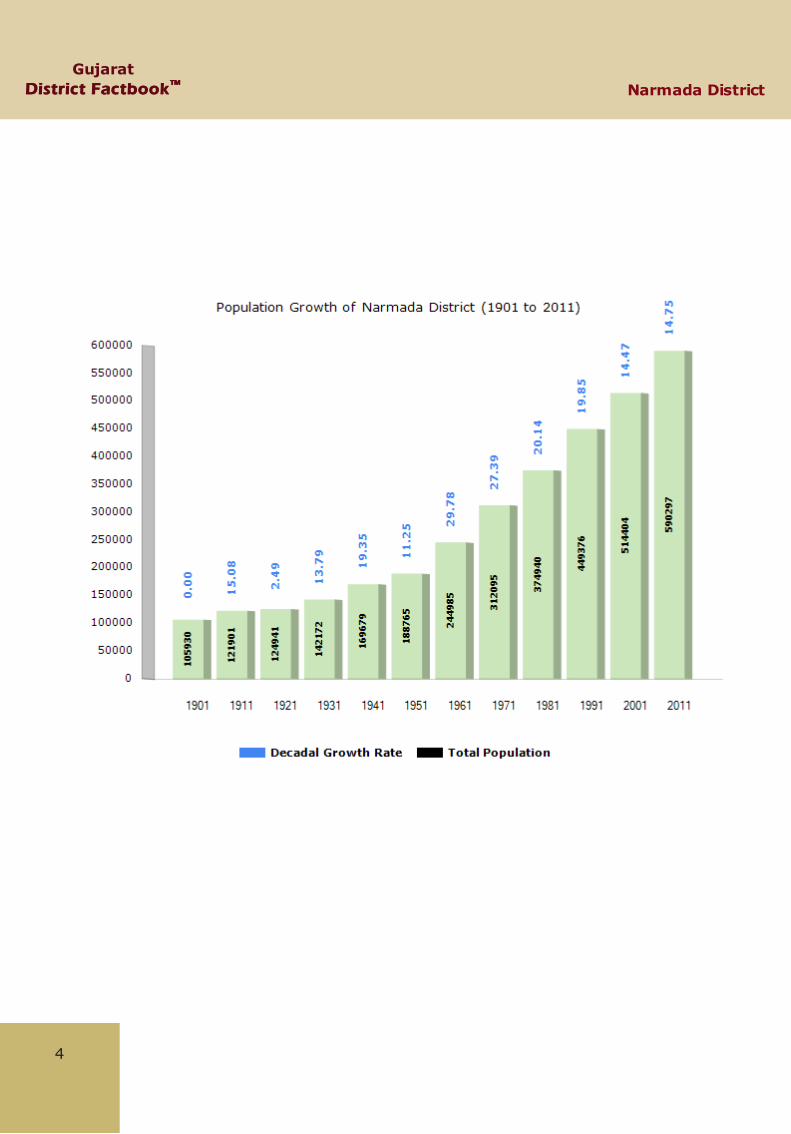
According to 2011 census the district has a population of 5,90,297 (persons) out ofwhich 3,01,086 (males) and 2,89,211 (females). The district has a sex ratio of 961females for every 1000 males. In the year 2001-2011 the population growth rate in thedistrict was 14.75% (persons) including 14.05 % (males) and 15.49 % (females). Themajor religions in the district are Hindu and Muslim with 94.84% and 3.83% respectively.
The economy of the district is solely based on agriculture. Most of the population in thedistrict are engaged in agriculture in order to earn their livelihood. The chief agriculturalproducts in the district are jowar, maize, sugarcane, tuwar, cotton, cane, grams,plantain, sesame, bajra, etc. The adoption of the new agricultural technologies amongstthe famers of the district helps to increase the production of various agricultural items.Though the district is scantily industrialised yet it has some industries of textiles, sugar,chemicals, agro industries, etc. There are also some small scale industries of paper,wood products and food products in the district which helps in its economy to a greatextent. In the year 2006 the Ministry of Panchayati Raj declared Narmanda one of thecountry's 250 most backward districts and currently receiving funds from the BackwardRegions Grant Fund Programme (BRGF).

GujaratDistrict FactbookDistrict Factbook™™ Narmada District
The district is an abode of several reputed educational institutions. It provides a platformfor higher education. Some of its recognised educational institutions are Government ArtsCollege, Shri Ratnasinhji Mahida Commerce College, Shri Maharaja Rajendrasinhji ArtsScience College, Faculty of Technology DDU, M.D. Kahor Arts and Commerce College,etc. As per 2011 census the literacy rate in the district is 72.31% (persons), 81.19%(males) and 63.09% (females).
Mansukhbhai Dhanjibhai Vasava, an eminent Indian Politician and the present UnionMinister of State for Tribal Affairs in Government of India under the Prime Ministership ofNarendra Modi was born on 1 June, 1957 in the Narmada district. For the first time hewas elected to the 12th Lok Sabha of India. He is a member of Bharatiya Janata Party.
The district has numerous centres of attraction which allures many travellers fromdifferent parts of the country as well as world. The district is a great destination forpilgrims since it is full of pious places. The holy rivers of the district are Saraswati River,Orsang and Narmada River. Devotees from the far distance place cometo the district totake a dip in the scared waters of these rivers. Some prominent ancient temples in thedistrict are Surpaneshwar Shiva temple, Kashi vishwanath Mahadev temple, Kabir temple,Shuklatirth Shiva temple and Nareshwar temple. Shoolpaneshwar Wildlife Sanctuary andRatanmahal Wildlife Sanctuary, located in Dediapada Range are the most exciting spotsfor wildlife lovers. Rajwant Palace, built in the period of 1910 is a heritage hotel and aroyal museum at present. Sardar Sarovar Dam, situated at a distance of 27 km fromRajpipla is famous as the largest dam on Narmada River which height is 128 metres.
6

7
Narmada DistrictGujarat
District FactbookDistrict Factbook™™
Administrative Setup Administrative UnitAdministrative Division:- Central Region
Sub-districts:
1. Dediapada
2. Nandod
3. Sagbara
4. Tilakwada
Towns:
1. Dediapada (CT)
2. Kevadiya (CT)
3. Rajpipla (M)
4. Sagbara (CT)
5. Selamba (CT)
Sub-districts, Towns, CD Blocks and Villages(2011)
District Sub-districts Towns CD Blocks Villages
Narmada 4 5 4 609
Gujarat 225 348 223 18225
India 5924 7933 6596 640930
Rank of District in State 23 24 23 16
Rank of District in India 520 439 560 416

11
Narmada DistrictGujarat
District FactbookDistrict Factbook™™
Demographics
Population(2011)
Residence District Persons Male Female
Total Narmada 590297 301086 289211
Gujarat 60439692 31491260 28948432
India 1210569573 623121843 587447730
Rank of District in State 24 24 24
Rank of District in India 528 527 527
Rural Narmada 528425 269408 259017
Gujarat 34694609 17799159 16895450
India 833463448 427632643 405830805
Rank of District in State 24 24 24
Rank of District in India 494 493 493
Urban Narmada 61872 31678 30194
Gujarat 25745083 13692101 12052982
India 377106125 195489200 181616925
Rank of District in State 25 25 25
Rank of District in India 540 542 536

35
Narmada DistrictGujarat
District FactbookDistrict Factbook™™
Economy
Offices, Deposits, Credit and C-D Ratio of Scheduled Commercial Banks (SCBs)Rs. in Million (September, 2016)
District Narmada Gujarat IndiaRank ofDistrictin State
Rank ofDistrictin India
Number of Offices 49 7507 135263 25 529
Deposits 13434 5503577 100965397 25 532
Credit 6271 3982181 75178857 25 517
Credit-Deposit Ratio (C-D Ratio) 46.68 72.36 74.46 15 338
By Bank GroupRs. in Million (September, 2016)
Bank Group Narmada Gujarat IndiaRank ofDistrictin State
Rank ofDistrictin India
State Bank of India and Its AssociatesNumber of Offices 8 1347 24493 25 530
Deposits 4551 1258025 22988903 25 538
Credit 1132 906546 15874037 25 552
Credit-Deposit Ratio (C-D Ratio) 24.87 72.06 69.05 19 481
Nationalised BanksNumber of Offices 28 4006 66577 25 478
Deposits 7015 3070896 47342652 25 488
Credit 3810 1907343 34201792 24 464
Credit-Deposit Ratio (C-D Ratio) 54.32 62.11 72.24 9 263
Regional Rural BanksNumber of Offices 7 717 20858 24 526
Deposits 704 103140 3215425 22 516
Credit 517 61848 2187606 22 508
Credit-Deposit Ratio (C-D Ratio) 73.43 59.97 68.03 7 262
Private Sector BanksNumber of Offices 6 1420 23020 23 447
Deposits 1164 1040718 22460896 25 461
Credit 812 1047379 19231413 25 450
Credit-Deposit Ratio (C-D Ratio) 69.77 100.64 85.62 15 290
Foreign BanksNumber of Offices - 17 315 0 0
Deposits - 30799 4957521 0 0
Credit - 59066 3684010 0 0
Credit-Deposit Ratio (C-D Ratio) - 191.78 74.31 0 0
All Scheduled Commercial BanksNumber of Offices 49 7507 135263 25 529
Deposits 13434 5503577 100965397 25 532
Credit 6271 3982181 75178857 25 517
Credit-Deposit Ratio (C-D Ratio) 46.68 72.36 74.46 15 338
43
Narmada DistrictGujarat
District FactbookDistrict Factbook™™
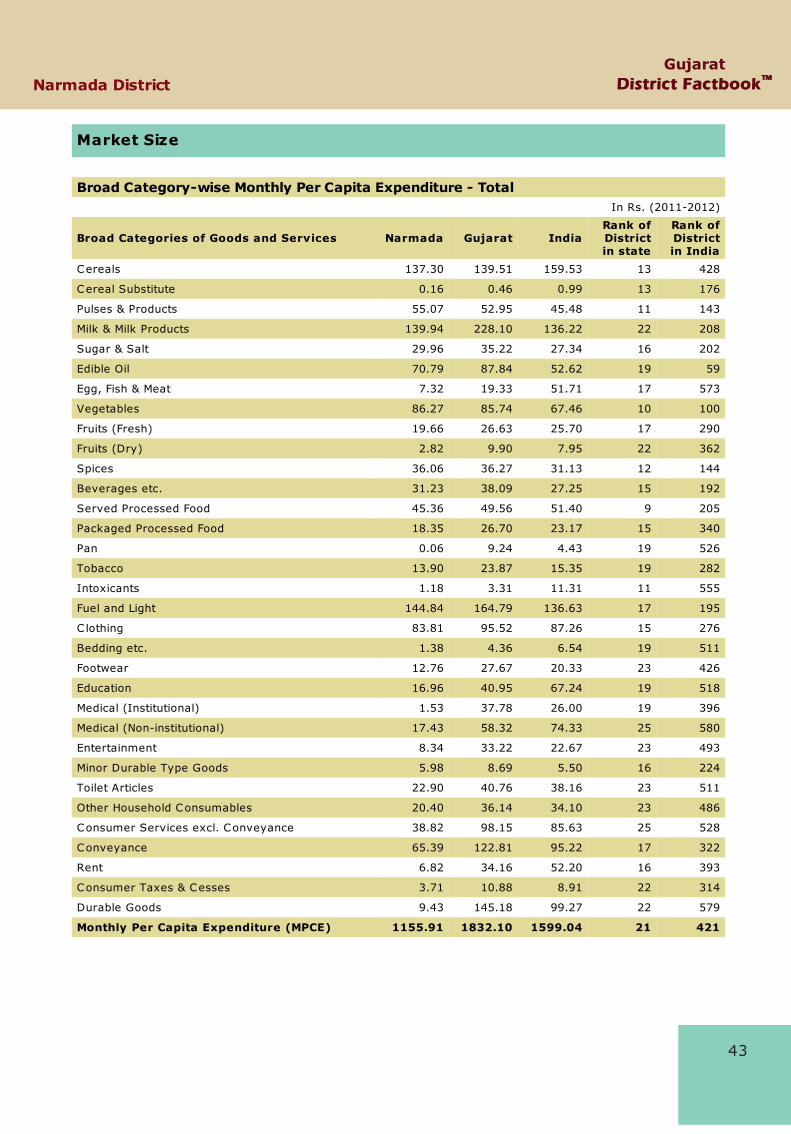
Market Size
Broad Category-wise Monthly Per Capita Expenditure - Total In Rs. (2011-2012)
Broad Categories of Goods and Services Narmada Gujarat IndiaRank ofDistrictin state
Rank ofDistrictin India
Cereals 137.30 139.51 159.53 13 428
Cereal Substitute 0.16 0.46 0.99 13 176
Pulses & Products 55.07 52.95 45.48 11 143
Milk & Milk Products 139.94 228.10 136.22 22 208
Sugar & Salt 29.96 35.22 27.34 16 202
Edible Oil 70.79 87.84 52.62 19 59
Egg, Fish & Meat 7.32 19.33 51.71 17 573
Vegetables 86.27 85.74 67.46 10 100
Fruits (Fresh) 19.66 26.63 25.70 17 290
Fruits (Dry) 2.82 9.90 7.95 22 362
Spices 36.06 36.27 31.13 12 144
Beverages etc. 31.23 38.09 27.25 15 192
Served Processed Food 45.36 49.56 51.40 9 205
Packaged Processed Food 18.35 26.70 23.17 15 340
Pan 0.06 9.24 4.43 19 526
Tobacco 13.90 23.87 15.35 19 282
Intoxicants 1.18 3.31 11.31 11 555
Fuel and Light 144.84 164.79 136.63 17 195
C lothing 83.81 95.52 87.26 15 276
Bedding etc. 1.38 4.36 6.54 19 511
Footwear 12.76 27.67 20.33 23 426
Education 16.96 40.95 67.24 19 518
Medical (Institutional) 1.53 37.78 26.00 19 396
Medical (Non-institutional) 17.43 58.32 74.33 25 580
Entertainment 8.34 33.22 22.67 23 493
Minor Durable Type Goods 5.98 8.69 5.50 16 224
Toilet Articles 22.90 40.76 38.16 23 511
Other Household Consumables 20.40 36.14 34.10 23 486
Consumer Services excl. Conveyance 38.82 98.15 85.63 25 528
Conveyance 65.39 122.81 95.22 17 322
Rent 6.82 34.16 52.20 16 393
Consumer Taxes & Cesses 3.71 10.88 8.91 22 314
Durable Goods 9.43 145.18 99.27 22 579
Monthly Per Capita Expenditure (MPCE) 1155.91 1832.10 1599.04 21 421
59
Narmada DistrictGujarat
District FactbookDistrict Factbook™™
Life Style
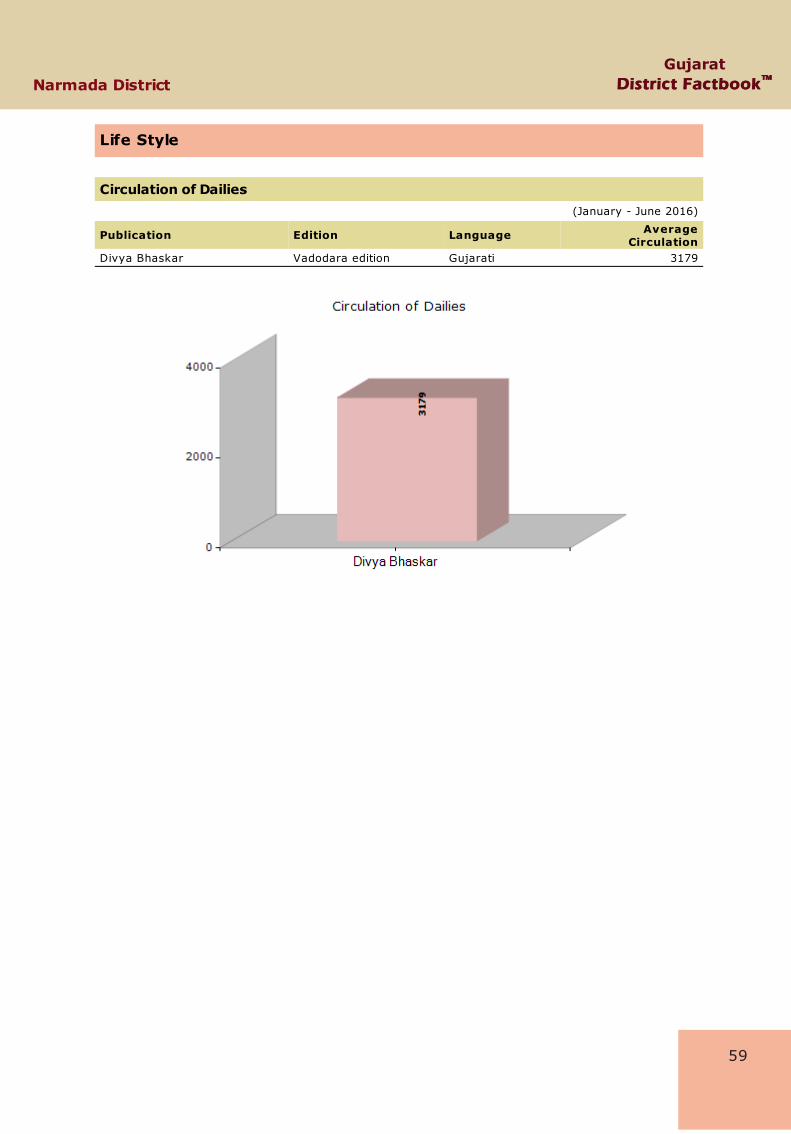
Circulation of Dailies (January - June 2016)
Publication Edition Language AverageCirculation
Divya Bhaskar Vadodara edition Gujarati 3179
GujaratDistrict FactbookDistrict Factbook™™ Narmada District
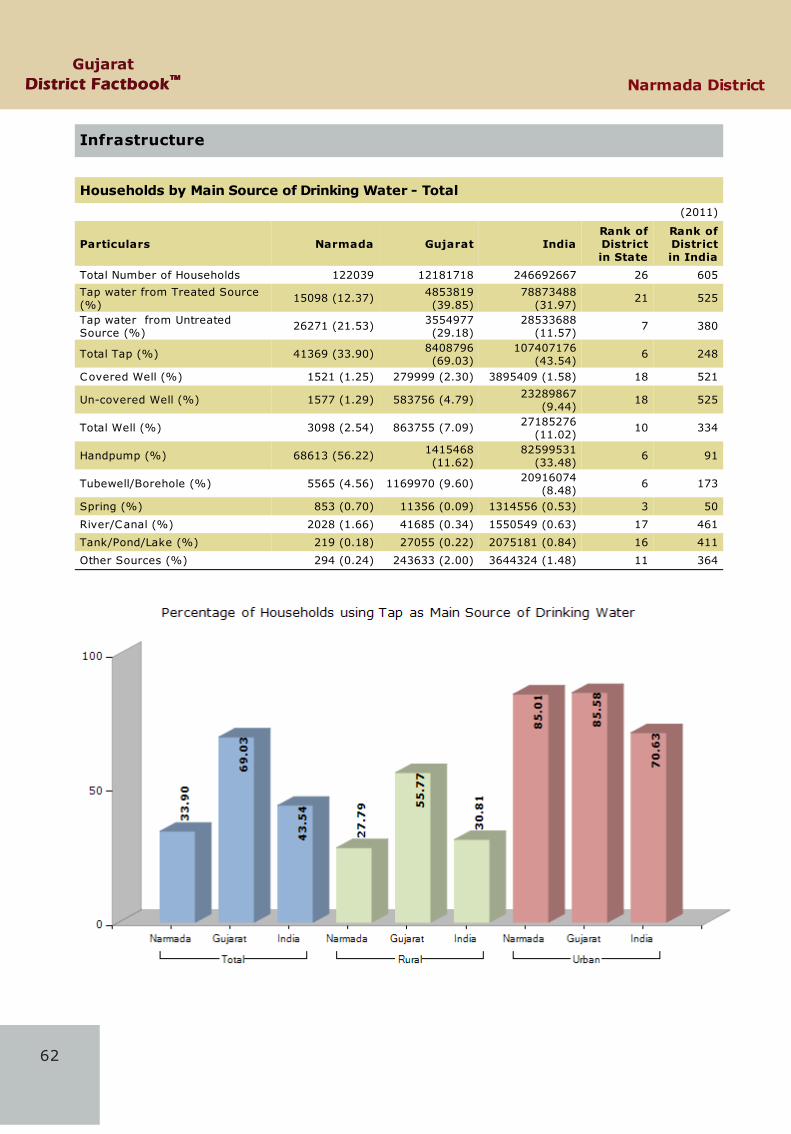
Infrastructure
Households by Main Source of Drinking Water - Total(2011)
Particulars Narmada Gujarat IndiaRank ofDistrictin State
Rank ofDistrictin India
Total Number of Households 122039 12181718 246692667 26 605
Tap water from Treated Source(%)
15098 (12.37) 4853819(39.85)
78873488(31.97)
21 525
Tap water from UntreatedSource (%)
26271 (21.53) 3554977(29.18)
28533688(11.57)
7 380
Total Tap (%) 41369 (33.90) 8408796(69.03)
107407176(43.54)
6 248
Covered Well (%) 1521 (1.25) 279999 (2.30) 3895409 (1.58) 18 521
Un-covered Well (%) 1577 (1.29) 583756 (4.79) 23289867(9.44)
18 525
Total Well (%) 3098 (2.54) 863755 (7.09) 27185276(11.02)
10 334
Handpump (%) 68613 (56.22) 1415468(11.62)
82599531(33.48)
6 91
Tubewell/Borehole (%) 5565 (4.56) 1169970 (9.60) 20916074(8.48)
6 173
Spring (%) 853 (0.70) 11356 (0.09) 1314556 (0.53) 3 50
River/Canal (%) 2028 (1.66) 41685 (0.34) 1550549 (0.63) 17 461
Tank/Pond/Lake (%) 219 (0.18) 27055 (0.22) 2075181 (0.84) 16 411
Other Sources (%) 294 (0.24) 243633 (2.00) 3644324 (1.48) 11 364
62
71
Narmada DistrictGujarat
District FactbookDistrict Factbook™™
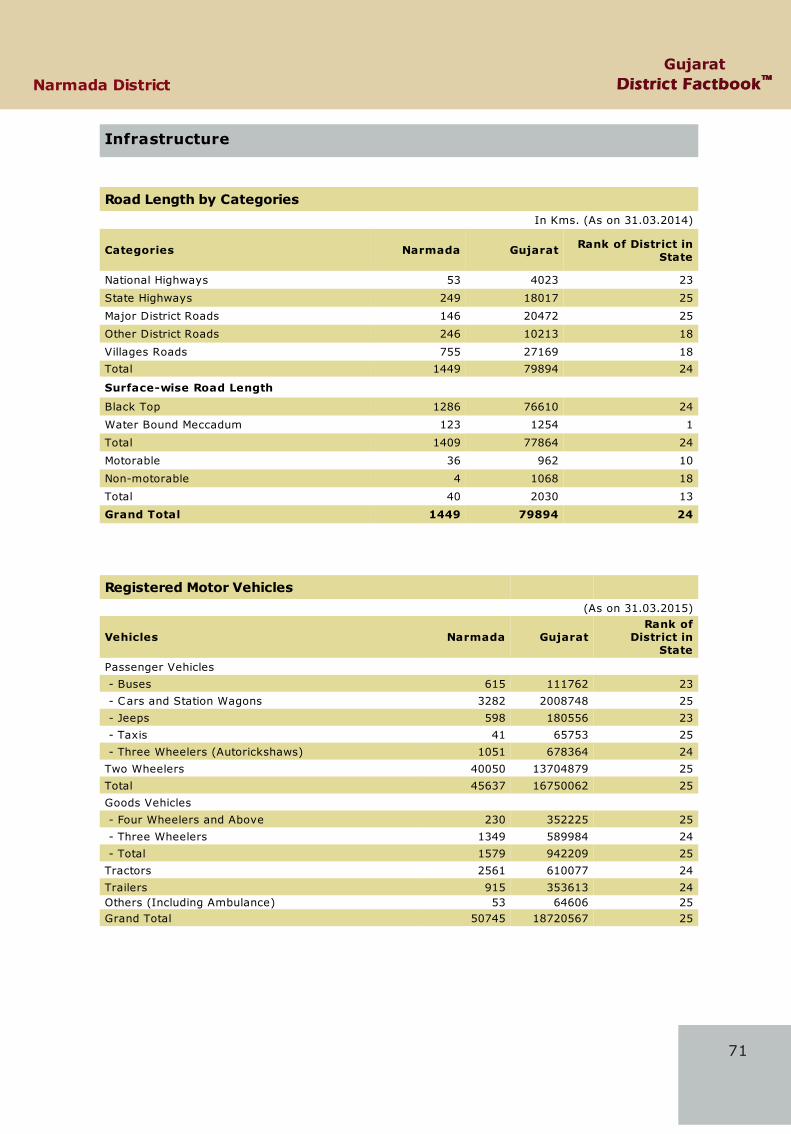
Infrastructure
Road Length by CategoriesIn Kms. (As on 31.03.2014)
Categories Narmada Gujarat Rank of District inState
National Highways 53 4023 23
State Highways 249 18017 25
Major District Roads 146 20472 25
Other District Roads 246 10213 18
Villages Roads 755 27169 18
Total 1449 79894 24
Surface-wise Road Length
Black Top 1286 76610 24
Water Bound Meccadum 123 1254 1
Total 1409 77864 24
Motorable 36 962 10
Non-motorable 4 1068 18
Total 40 2030 13
Grand Total 1449 79894 24
Registered Motor Vehicles (As on 31.03.2015)
Vehicles Narmada GujaratRank of
District inState
Passenger Vehicles
- Buses 615 111762 23
- Cars and Station Wagons 3282 2008748 25
- Jeeps 598 180556 23
- Taxis 41 65753 25
- Three Wheelers (Autorickshaws) 1051 678364 24
Two Wheelers 40050 13704879 25
Total 45637 16750062 25
Goods Vehicles
- Four Wheelers and Above 230 352225 25
- Three Wheelers 1349 589984 24
- Total 1579 942209 25
Tractors 2561 610077 24
Trailers 915 353613 24Others (Including Ambulance) 53 64606 25Grand Total 50745 18720567 25
GujaratDistrict FactbookDistrict Factbook™™ Narmada District
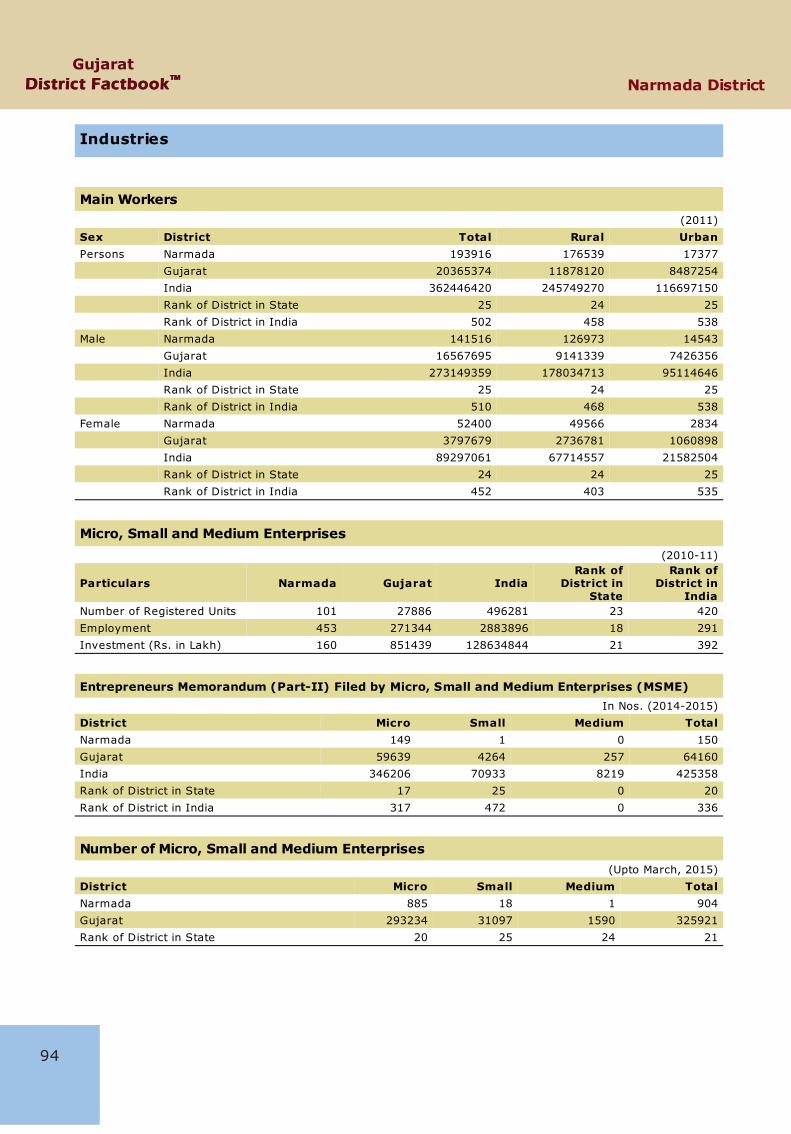
Industries
Main Workers(2011)
Sex District Total Rural UrbanPersons Narmada 193916 176539 17377
Gujarat 20365374 11878120 8487254
India 362446420 245749270 116697150
Rank of District in State 25 24 25
Rank of District in India 502 458 538
Male Narmada 141516 126973 14543
Gujarat 16567695 9141339 7426356
India 273149359 178034713 95114646
Rank of District in State 25 24 25
Rank of District in India 510 468 538
Female Narmada 52400 49566 2834
Gujarat 3797679 2736781 1060898
India 89297061 67714557 21582504
Rank of District in State 24 24 25
Rank of District in India 452 403 535
Micro, Small and Medium Enterprises
(2010-11)
Particulars Narmada Gujarat IndiaRank of
District inState
Rank ofDistrict in
IndiaNumber of Registered Units 101 27886 496281 23 420
Employment 453 271344 2883896 18 291
Investment (Rs. in Lakh) 160 851439 128634844 21 392
Entrepreneurs Memorandum (Part-II) Filed by Micro, Small and Medium Enterprises (MSME)In Nos. (2014-2015)
District Micro Small Medium TotalNarmada 149 1 0 150
Gujarat 59639 4264 257 64160
India 346206 70933 8219 425358
Rank of District in State 17 25 0 20
Rank of District in India 317 472 0 336
Number of Micro, Small and Medium Enterprises(Upto March, 2015)
District Micro Small Medium TotalNarmada 885 18 1 904
Gujarat 293234 31097 1590 325921
Rank of District in State 20 25 24 21
94
GujaratDistrict FactbookDistrict Factbook™™ Narmada District
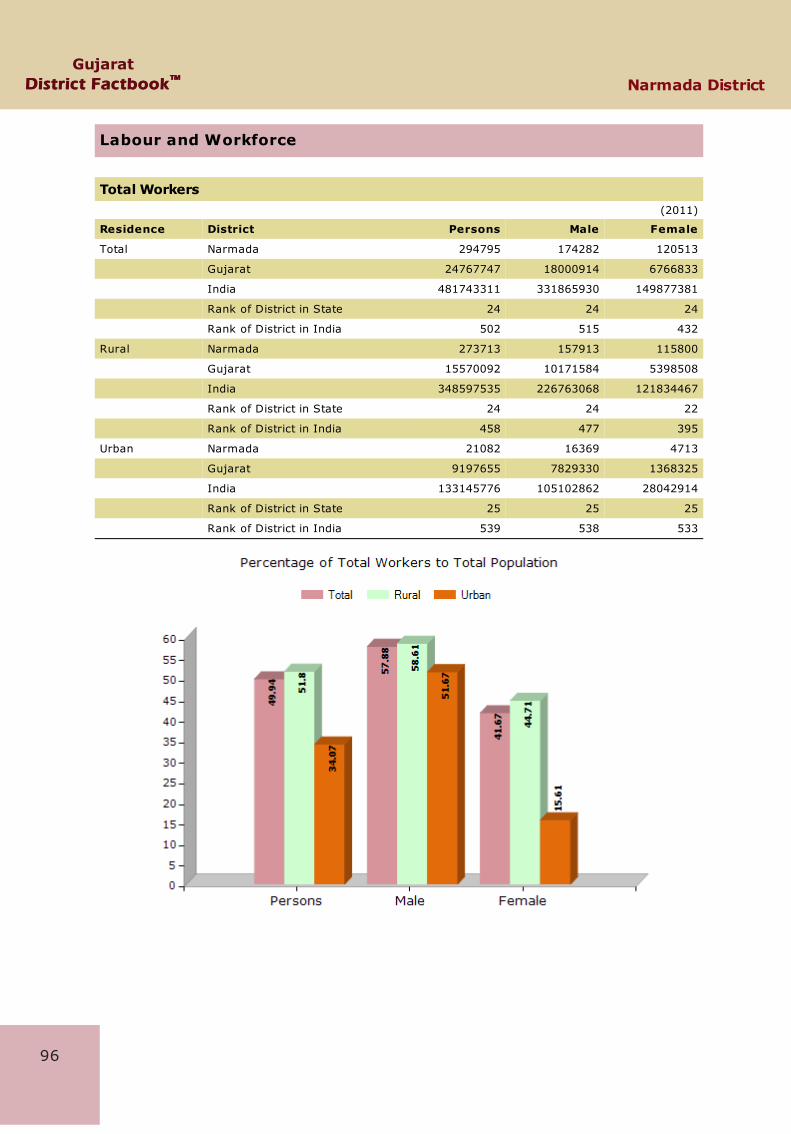
Labour and Workforce
Total Workers(2011)
Residence District Persons Male Female
Total Narmada 294795 174282 120513
Gujarat 24767747 18000914 6766833
India 481743311 331865930 149877381
Rank of District in State 24 24 24
Rank of District in India 502 515 432
Rural Narmada 273713 157913 115800
Gujarat 15570092 10171584 5398508
India 348597535 226763068 121834467
Rank of District in State 24 24 22
Rank of District in India 458 477 395
Urban Narmada 21082 16369 4713
Gujarat 9197655 7829330 1368325
India 133145776 105102862 28042914
Rank of District in State 25 25 25
Rank of District in India 539 538 533
96
GujaratDistrict FactbookDistrict Factbook™™ Narmada District
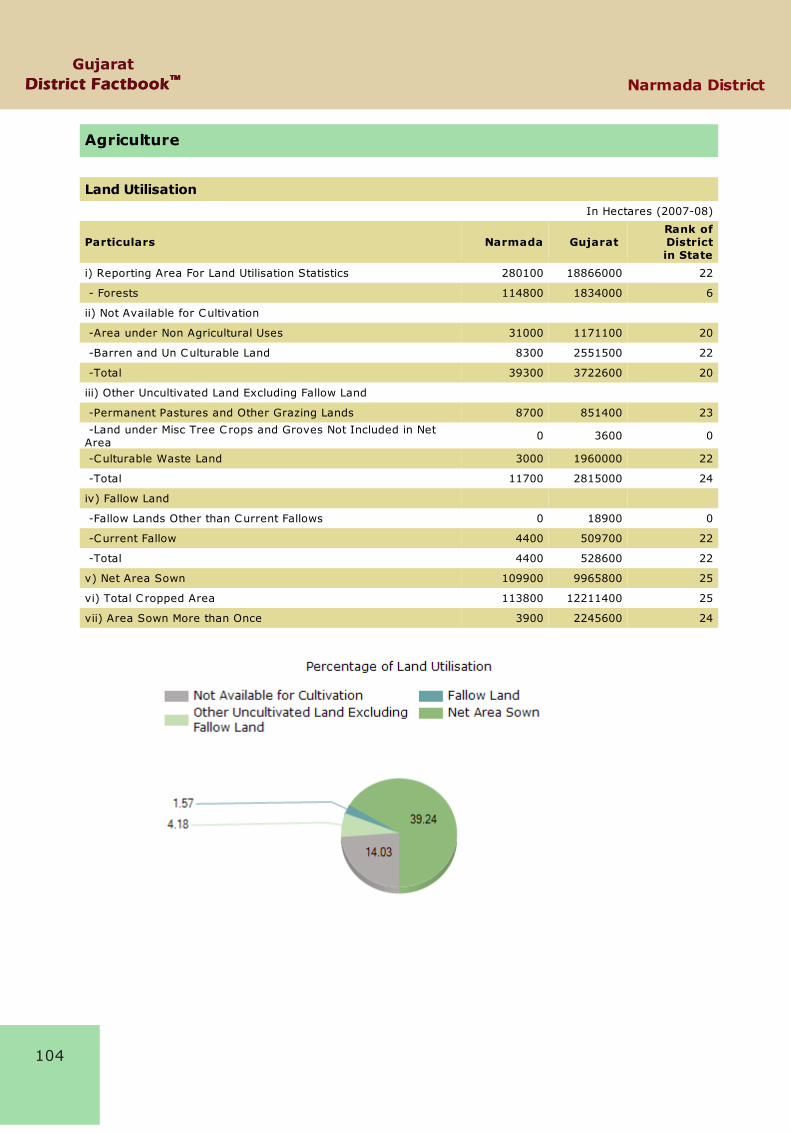
Agriculture
Land UtilisationIn Hectares (2007-08)
Particulars Narmada Gujarat Rank ofDistrictin State
i) Reporting Area For Land Utilisation Statistics 280100 18866000 22
- Forests 114800 1834000 6
ii) Not Available for Cultivation
-Area under Non Agricultural Uses 31000 1171100 20
-Barren and Un Culturable Land 8300 2551500 22
-Total 39300 3722600 20
iii) Other Uncultivated Land Excluding Fallow Land
-Permanent Pastures and Other Grazing Lands 8700 851400 23
-Land under Misc Tree Crops and Groves Not Included in NetArea
0 3600 0
-Culturable Waste Land 3000 1960000 22
-Total 11700 2815000 24
iv) Fallow Land
-Fallow Lands Other than Current Fallows 0 18900 0
-Current Fallow 4400 509700 22
-Total 4400 528600 22
v) Net Area Sown 109900 9965800 25
vi) Total C ropped Area 113800 12211400 25
vii) Area Sown More than Once 3900 2245600 24
104

123
Narmada DistrictGujarat
District FactbookDistrict Factbook™™
Education
Literacy Rate (2011)
Residence District Persons Male Female
Total Narmada 72.31 81.19 63.09
Gujarat 78.03 85.75 69.68
India 72.99 80.89 64.64
Rank of District in State 19 22 19
Rank of District in India 317 330 324
Rural Narmada 70.46 79.83 60.74
Gujarat 71.71 81.61 61.36
India 67.77 77.15 57.93
Rank of District in State 16 17 14
Rank of District in India 278 294 277
Urban Narmada 87.48 92.34 82.41
Gujarat 86.31 90.98 81.03
India 84.11 88.76 79.11
Rank of District in State 11 8 10
Rank of District in India 166 144 181
Population by Educational Level(2011)
Educational Level Narmada Gujarat IndiaRank ofDistrictin State
Rank ofDistrictin India
Illiterate 219961 19346334 447216165 24 517
Literate 370336 41093358 763638812 25 521
Literate without Educational Level 30533 2317423 35153231 24 364
Below Primary 93286 8462829 146897597 24 480
Primary 104423 10557001 184170833 25 504
Middle 62787 6453935 133903266 25 528
Matric/Secondary 39223 6131997 105939743 25 525
Higher Secondary/Intermediate Pre-University/Senior Secondary
22344 3153566 77942593 24 535
Non-technical Diploma or Certificate not Equal toDegree
172 37756 1072289 25 443
Technical Diploma or Certificate not Equal toDegree
3347 661401 7238719 24 311
Graduate and Above 12738 3174158 68288971 25 555
Unclassified 1483 143292 3031570 24 433

GujaratDistrict FactbookDistrict Factbook™™ Narmada District
Health
Live Births Registered(2014)
Residence District Person Male Female
Total Narmada 8233 4265 3968
Gujarat 1205140 639124 566016
India 23001523 12183175 10804541
Rank of District in State 25 25 25
Rank of District in India 530 530 530
Rural Narmada 2852 1414 1438
Gujarat 308241 163545 144696
India 10763908 5709934 5044361
Rank of District in State 25 25 25
Rank of District in India 537 544 532
Urban Narmada 5381 2851 2530
Gujarat 896899 475579 421320
India 12237615 6473241 5760180
Rank of District in State 25 25 25
Rank of District in India 456 453 457
Still Births Registered(2014)
Residence District Person Male Female
Total Narmada - - -
Gujarat - - -
India 124130 56442 47832
Rank of District in State 0 0 0
Rank of District in India 0 0 0
Rural Narmada - - -
Gujarat - - -
India 41620 21359 17953
Rank of District in State 0 0 0
Rank of District in India 0 0 0
Urban Narmada - - -
Gujarat - - -
India 82494 35075 29871
Rank of District in State 0 0 0
Rank of District in India 0 0 0
132

137
Narmada DistrictGujarat
District FactbookDistrict Factbook™™
Health
Houses used for Hospital/Dispensary(2011)
Residence District Total Number ofCensus Houses
Hospital/Dispensary etc.
Total Narmada 160369 211
Gujarat 17524030 39801
India 330407375 682584
Rank of District in State 25 25
Rank of District in India 537 545
Rural Narmada 138121 153
Gujarat 9293240 14004
India 220633493 360065
Rank of District in State 24 25
Rank of District in India 507 536
Urban Narmada 22248 58
Gujarat 8230790 25797
India 109773882 322519
Rank of District in State 25 25
Rank of District in India 522 531

145
Narmada DistrictGujarat
District FactbookDistrict Factbook™™
Environment and Pollution
Geographical Area
Area in Km2 (2011)
District Total Rural Urban
Narmada 2817 2791.87 25.13
Gujarat 196244 188840.46 7403.54
India 3287469 3101505.00 102221.00
Rank of District in State 22 21 25
Rank of District in India 421 396 551
Wastelands by Category
Area in Km2 (2008-2009)
Category Narmada Gujarat IndiaRank ofDistrictin State
Rank ofDistrictin India
Gullied/Ravenous Land (Medium) 9.50 337.74 6145.96 8 115
Gullied/Ravenous Land (Deep) - 0.93 1266.06 0 0
Land with Dense Scrub 37.64 9817.36 86979.91 23 309
Land with Open Scrub 26.53 6539.36 93033.00 21 375
Waterlogged and Marshy Land (Permanent) - 0.21 1757.07 0 0
Waterlogged and Marshy Land (Seasonal) - 23.67 6946.31 0 0
Land Affected by Salinity/Alkalinity (Medium) - 1129.73 5414.53 0 0
Land Affected by Salinity/Alkalinity (Strong) - - 1391.09 0 0
Shifting Cultivation - Current Jhum - - 4814.68 0 0
Shifting Cultivation - Abandoned Jhum - - 4210.46 0 0
Under-Utilised/Degraded Forest (Scrub Domin) 82.03 1796.44 83699.71 9 232
Under-Utilised/Degraded Forest (Agriculture) 179.81 244.63 15680.26 1 27
Degraded Pastures/Grazing Land - 15.20 6832.17 0 0
Degraded Land under Plantation Crop 2.25 48.04 278.53 3 26
Sands-Riverine - 0.90 2111.96 0 0
Sands-Coastal - 66.82 654.47 0 0
Sands-Desertic - - 3934.80 0 0
Sands-Semi Stab.-Stab>40m - - 9279.75 0 0
Sands-Semi Stab.-Stab 15-40m - - 14273.03 0 0
Mining Wastelands 0.42 14.13 593.65 4 136
Industrial wastelands - - 58.00 0 0
Barren Rocky/Stony Waste 0.04 72.92 59482.29 11 358
Snow covered /Glacial Area - - 58183.44 0 0
Total 338.21 20108.06 467021.16 16 299

149
Narmada DistrictGujarat
District FactbookDistrict Factbook™™
Housing
Total Households(2011)
District Total Rural Urban
Narmada 122174 108962 13212
Gujarat 12248428 6773558 5474870
India 249454252 168565486 80888766
Rank of District in State 25 24 25
Rank of District in India 523 491 534
Houseless Households(2011)
District Total Rural Urban
Narmada 762 706 56
Gujarat 36925 12938 23987
India 449761 192865 256896
Rank of District in State 14 7 24
Rank of District in India 159 73 426

Narmada DistrictGujarat
District FactbookDistrict Factbook™™
Crime & Law
Incidence of IPC Crime (2014)
Crime Heads Narmada Gujarat IndiaRank ofDistrictin State
Rank ofDistrictin India
Murder 12 1124 34134 24 534Attempt to Commit Murder 2 756 41898 26 603Culpable Homicide Not Amounting To Murder 1 57 3349 9 388Attempt To Commit Culpable Homicide 0 3 4371 0 0Rape 8 841 38678 23 561Attempt To Commit Rape 0 6 4310 0 0Kidnapping & Abduction 15 2722 78412 24 547Dacoity 0 296 4399 0 0Making Preparation And Assembly ForCommitting Dacoity 0 15 2835 0 0
Robbery 0 1209 38090 0 0Criminal Trespass/Burglary 15 4477 114667 25 564Theft 40 14337 442464 25 562Unlawful Assembly 1 243 9878 24 168Riots 10 1354 66206 25 475Criminal Breach of Trust 3 1070 20089 25 499Cheating 2 1574 109737 26 613Forgery 0 246 11268 0 0Counterfeiting 1 96 1979 18 337Arson 1 217 9299 24 553Grievous Hurt 41 3363 105560 21 360Dowry Deaths 0 23 8458 0 0Assault on Women with Intent to Outrage herModesty 21 1352 82411 20 486
Insult to the Modesty of Women 0 173 9738 0 0Cruelty by Husband or his Relatives 15 5991 123163 26 513Importation of Girls From Foreign Country 0 0 14 0 0Causing Death by Negligence 91 7132 128837 24 419Offences Against State 0 0 177 0 0Offences Promoting Enmity Between DifferentGroups 0 11 337 0 0
Extortion 0 185 8210 0 0Disclosure of Identity of Victims 0 0 135 0 0Incidence of Rash Driving 139 29677 409857 24 390Human Trafficking 0 3 726 0 0Unnatural Offence 0 22 1148 0 0Other IPC Crimes 246 52810 944105 25 504Total Cognizable IPC Crimes 664 131385 2858939 25 546
161
165
Narmada DistrictGujarat
District FactbookDistrict Factbook™™
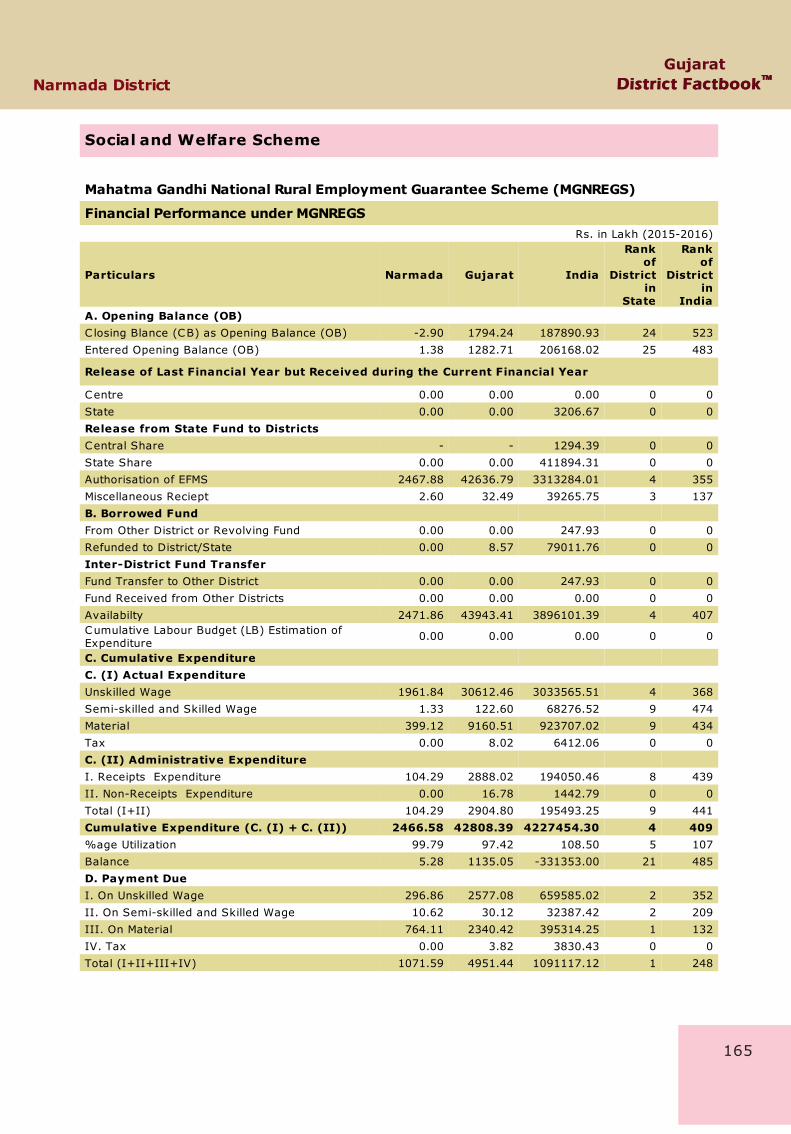
Social and Welfare Scheme
Mahatma Gandhi National Rural Employment Guarantee Scheme (MGNREGS)
Financial Performance under MGNREGSRs. in Lakh (2015-2016)
Particulars Narmada Gujarat India
Rankof
Districtin
State
Rankof
Districtin
IndiaA. Opening Balance (OB)C losing Blance (CB) as Opening Balance (OB) -2.90 1794.24 187890.93 24 523
Entered Opening Balance (OB) 1.38 1282.71 206168.02 25 483
Release of Last Financial Year but Received during the Current Financial Year
Centre 0.00 0.00 0.00 0 0
State 0.00 0.00 3206.67 0 0
Release from State Fund to DistrictsCentral Share - - 1294.39 0 0
State Share 0.00 0.00 411894.31 0 0
Authorisation of EFMS 2467.88 42636.79 3313284.01 4 355
Miscellaneous Reciept 2.60 32.49 39265.75 3 137
B. Borrowed Fund From Other District or Revolving Fund 0.00 0.00 247.93 0 0
Refunded to District/State 0.00 8.57 79011.76 0 0
Inter-District Fund TransferFund Transfer to Other District 0.00 0.00 247.93 0 0
Fund Received from Other Districts 0.00 0.00 0.00 0 0
Availabilty 2471.86 43943.41 3896101.39 4 407Cumulative Labour Budget (LB) Estimation ofExpenditure
0.00 0.00 0.00 0 0
C. Cumulative Expenditure C. (I) Actual ExpenditureUnskilled Wage 1961.84 30612.46 3033565.51 4 368
Semi-skilled and Skilled Wage 1.33 122.60 68276.52 9 474
Material 399.12 9160.51 923707.02 9 434
Tax 0.00 8.02 6412.06 0 0
C. (II) Administrative Expenditure I. Receipts Expenditure 104.29 2888.02 194050.46 8 439
II. Non-Receipts Expenditure 0.00 16.78 1442.79 0 0
Total (I+II) 104.29 2904.80 195493.25 9 441
Cumulative Expenditure (C. (I) + C. (II)) 2466.58 42808.39 4227454.30 4 409%age Utilization 99.79 97.42 108.50 5 107
Balance 5.28 1135.05 -331353.00 21 485
D. Payment DueI. On Unskilled Wage 296.86 2577.08 659585.02 2 352
II. On Semi-skilled and Skilled Wage 10.62 30.12 32387.42 2 209
III. On Material 764.11 2340.42 395314.25 1 132
IV. Tax 0.00 3.82 3830.43 0 0
Total (I+II+III+IV) 1071.59 4951.44 1091117.12 1 248

i
GujaratNarmada District District Factbook™
Get Complete BookAt Datanet India eBooks Store
www.datanetindia-ebooks.comor go directly at
http://www.datanetindia-ebooks.com/District_Factbook/Gujarat/Narmada