19
District heating year 2013 21.1.2014
| Date post: | 11-Dec-2015 |
| Category: |
Documents |
| Upload: | charles-bullington |
| View: | 215 times |
| Download: | 2 times |

District heating year 2013
21.1.2014

21.1.20142
District heating and cooling 2013
• Heat sales (incl. taxes) 2 330 mill. €
• Sold heat energy 31,6 TWh
• Average price of DH (incl. taxes) 7,4 c/kWh
• Inhabitants in DH apartments 2,7 mill.
• Market share of district heat 46 %
• Sold district cooling energy 169 GWh

21.1.20143
Market share of space heatingResidential, commercial and public buildings
district heat46,0 %
electricity18,6 %
heat pump11,6 %
light fuel oil8,2 %
wood13,1 %
heavy fuel oil1,4 %
natural gas1,1 %
Source: Statistics FinlandNet effective heating energy, 2012
Heat pump: includes the electricityconsumption of heat pumpsElectricity: includes the electricityconsumption of heat distributionequipment and electric sauna stovesWood: includes the wood used bysauna stoves

21.1.20144
Temperature corrected district heat consumption, TWh
0
5
10
15
20
25
30
35
1970 1976 1982 1988 1994 2000 2006 2012
TWh

21.1.20145
District heat consumption
0
1000
2000
3000
4000
5000
6000
J an Feb Mar Apr May J un J ul Aug Sep Oct Nov Dec
GWh
2010 2011 2012 2013theoretical consumption 2013 if it had been a "normal" year in temperatures

21.1.20146
District heat production 201334,5 TWh
Cogenerated electricity 13,8 TWh
cogenerated heat 74%
separate heat 26%
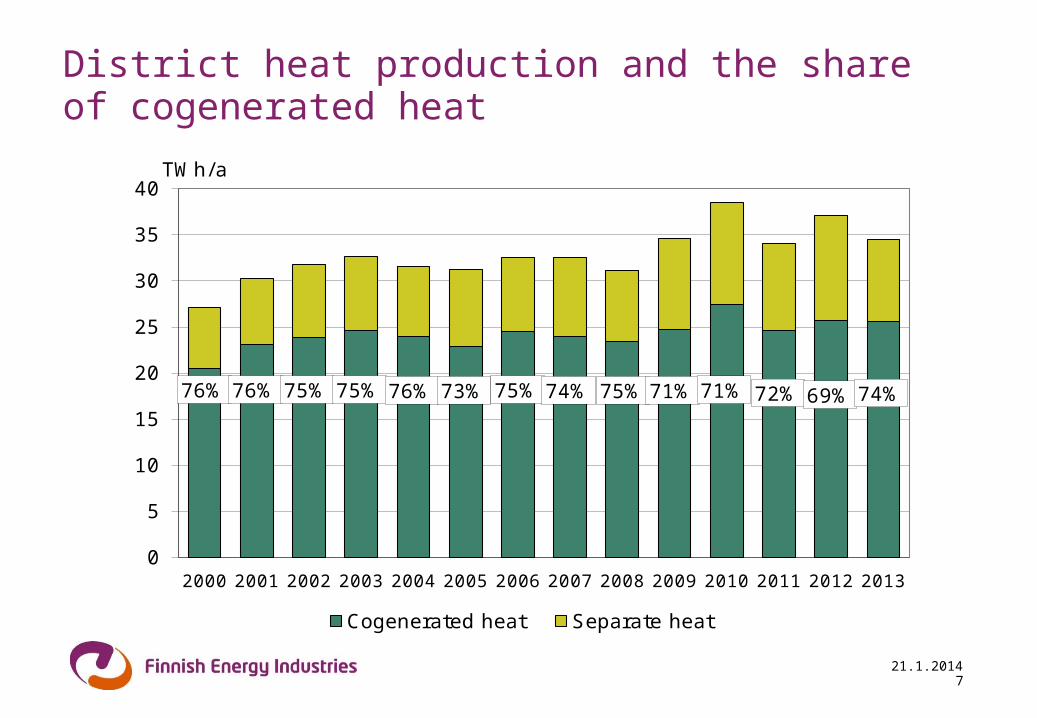
21.1.20147
District heat production and the share of cogenerated heat
76% 76% 75% 75% 76% 73% 75% 74% 75% 71% 71% 72% 69% 74%
0
5
10
15
20
25
30
35
40
2000 2001 2002 2003 2004 2005 2006 2007 2008 2009 2010 2011 2012 2013
TWh/a
Cogenerated heat Separate heat

21.1.20148
Production capacity of district heat and connected heat load of the customers
0
5
10
15
20
25
1970 1975 1980 1985 1990 1995 2000 2005 2010
GW
Production capacity Connected heat load

21.1.2014
District heat production plants
Combined heat and power plants as well as stationary heating plants and heat plants
Source: District Heating in Finland 2012, Finnish Energy Industries
9
21.1.201410
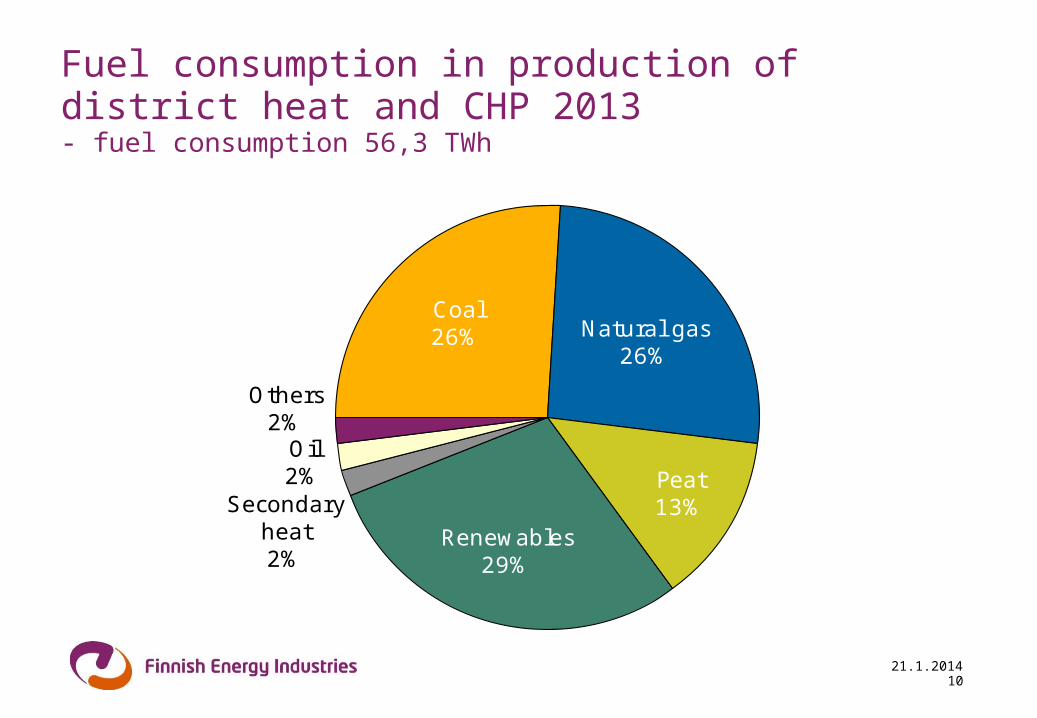
Fuel consumption in production of district heat and CHP 2013- fuel consumption 56,3 TWh
Coal26% Natural gas
26%
Peat13%
Renewables29%
Secondary heat2%
Oil2%
Others2%
21.1.201411
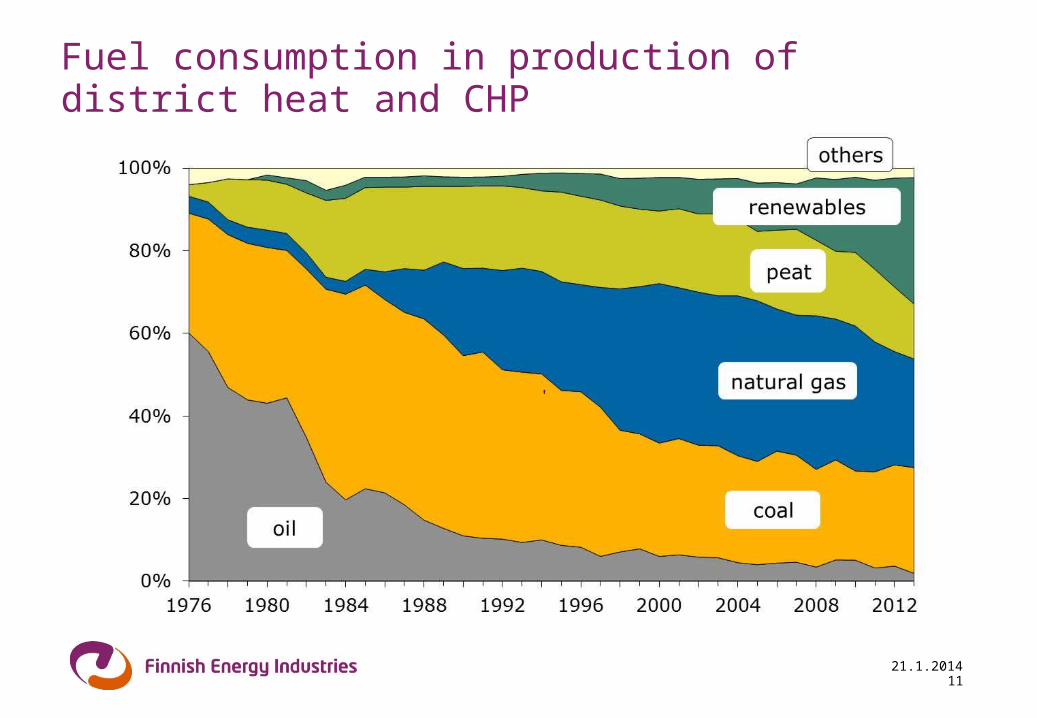
Fuel consumption in production of district heat and CHP

21.1.2014
Fuels used in district heat production and CHP productionyear 2012
Source: District Heating in Finland 2012, Finnish Energy Industries
12
21.1.201413
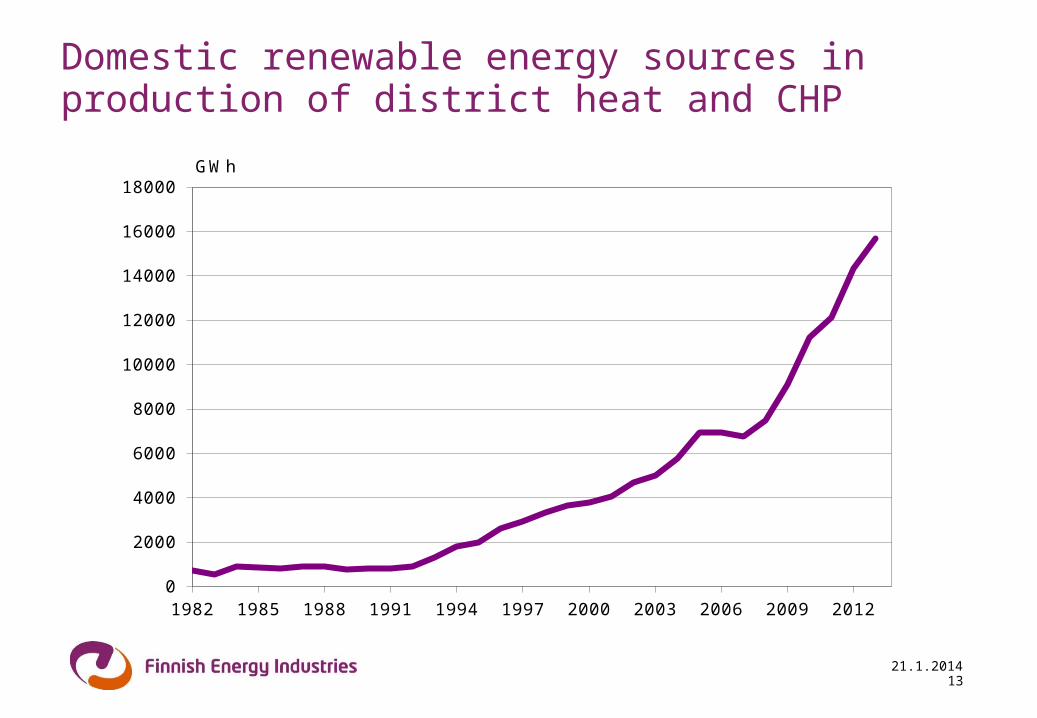
Domestic renewable energy sources in production of district heat and CHP
0
2000
4000
6000
8000
10000
12000
14000
16000
18000
1982 1985 1988 1991 1994 1997 2000 2003 2006 2009 2012
GWh

21.1.201414
Specific carbon dioxide emissions from district heat production
Sources:Statistics Finland (2000...2011)Finnish Energy Industries (1976...1999, 2012...2013)

21.1.201415
Value of heat sales, bill. €(incl. VAT)
0,0
0,5
1,0
1,5
2,0
2,5
2000 2002 2004 2006 2008 2010 2012
billion €
21.1.201416
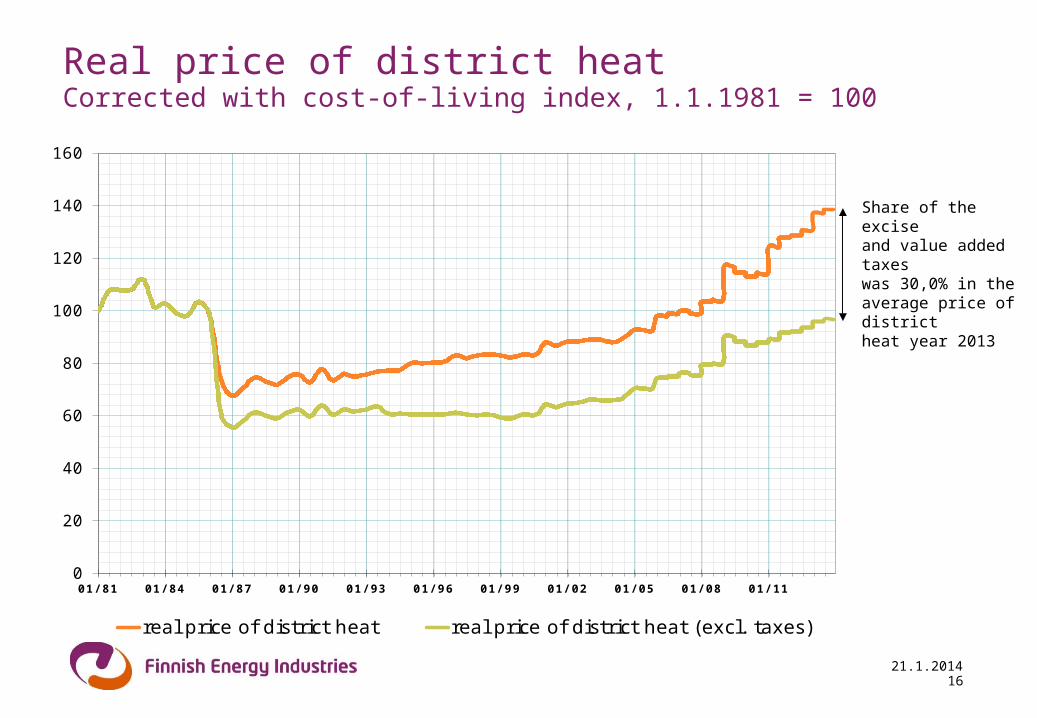
Real price of district heat Corrected with cost-of-living index, 1.1.1981 = 100
Share of the exciseand value added taxeswas 30,0% in theaverage price of districtheat year 2013
0
20
40
60
80
100
120
140
160
01/ 81 01/ 84 01/ 87 01/ 90 01/ 93 01/ 96 01/ 99 01/ 02 01/ 05 01/ 08 01/ 11
real price of district heat real price of district heat (excl. taxes)

21.1.201417
Prices of district heat and fuels in heat productionindex, January 2004 = 100
CHP = combined heat and power production
80
120
160
200
240
280
320
360
400
440
J anuary-04 J anuary-05 J anuary-06 J anuary-07 J anuary-08 J anuary-09 J anuary-10 J anuary-11 J anuary-12 J anuary-13 J anuary-14
District heat Natural gas, CHP Hard coal, CHP
Milled peat Natural gas, non CHP Hard coal, non CHP
Firewood Heavy fuel oil, non CHP
Sources:Statistics FinlandEnergy Authority
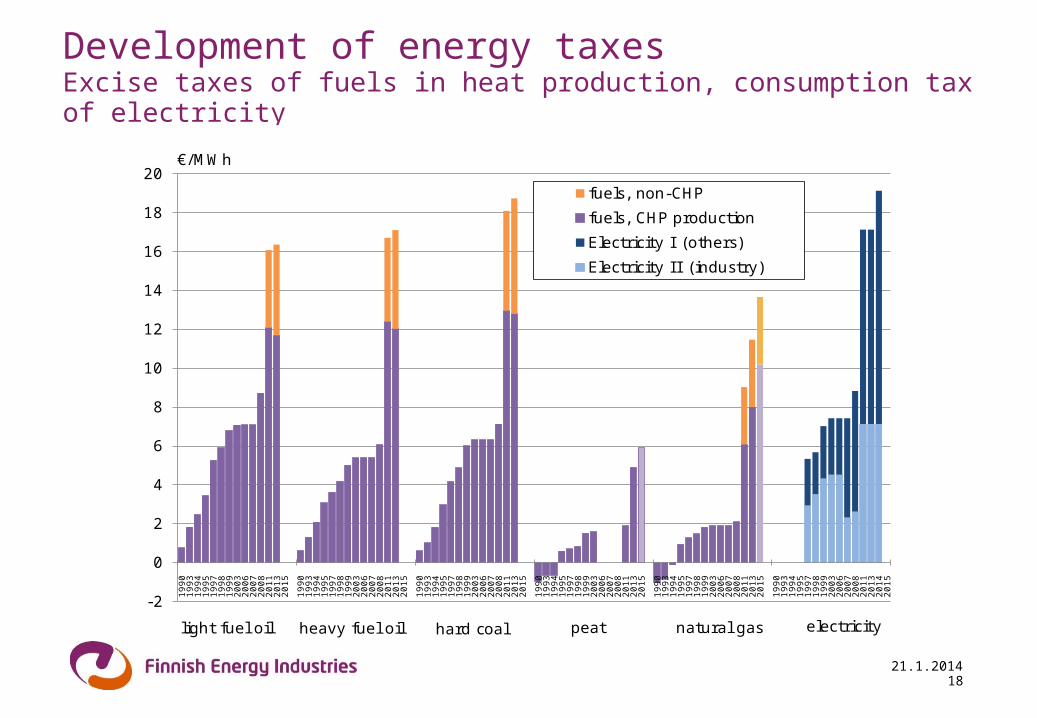
Development of energy taxes Excise taxes of fuels in heat production, consumption tax of electricity
21.1.201418
-2
0
2
4
6
8
10
12
14
16
18
201
99
01
99
31
99
41
99
51
99
71
99
81
99
92
00
32
00
62
00
72
00
82
01
12
01
32
01
5
19
90
19
93
19
94
19
95
19
97
19
98
19
99
20
03
20
06
20
07
20
08
20
11
20
13
20
15
19
90
19
93
19
94
19
95
19
97
19
98
19
99
20
03
20
06
20
07
20
08
20
11
20
13
20
15
19
90
19
93
19
94
19
95
19
97
19
98
19
99
20
03
20
06
20
07
20
08
20
11
20
13
20
15
19
90
19
93
19
94
19
95
19
97
19
98
19
99
20
03
20
06
20
07
20
08
20
11
20
13
20
15
19
90
19
93
19
94
19
95
19
97
19
98
19
99
20
03
20
06
20
07
20
08
20
11
20
13
20
14
20
15
€/MWh
fuels, non-CHP
fuels, CHP production
Electricity I (others)
Electricity I I (industry)
light fuel oil heavy fuel oil hard coal electricitynatural gaspeat

21.1.201419
District cooling – delivered energy and connected heat load
0
50
100
150
200
0
20 000
40 000
60 000
80 000
100 000
120 000
140 000
160 000
180 000
2001 2002 2003 2004 2005 2006 2007 2008 2009 2010 2011 2012 2013
Connected load MWSale MWh
delivered energy connected load


