143
District of Columbia Development Plan District Department of Transportation Prepared By: Foursquare Integrated Transportation Planning September 2015
| Date post: | 14-Sep-2018 |
| Category: |
Documents |
| Upload: | vuonghuong |
| View: | 216 times |
| Download: | 0 times |
District of Columbia
Development Plan
District Department of Transportation
Prepared By:Foursquare Integrated Transportation Planning
September 2015

September 2015
Contents 1 Introduction ....................................................................................................................................... 2
2 Strategic Framework .......................................................................................................................... 0
2.1 Goals and Objectives ..................................................................................................................... 0
2.2 Performance Measures ................................................................................................................... 2
2.3 Monitoring and Evaluation ............................................................................................................. 7
2.4 Reporting ........................................................................................................................................ 9
3 Market Study .................................................................................................................................... 10
3.1 Introduction .................................................................................................................................. 10
3.1.1 Key Findings ......................................................................................................................................................... 10
3.2 Terminology and Data Sources .................................................................................................... 12
3.2.1 Key Terminology ................................................................................................................................................... 12
3.2.2 Data Sources ......................................................................................................................................................... 12
3.3 Users (Membership) ...................................................................................................................... 12
3.3.1 Demographic Profile and Use ............................................................................................................................... 13
3.3.2 Capital Bikeshare Member Use ............................................................................................................................. 13
3.4 Trip Characteristics ....................................................................................................................... 14
3.5 Spatial Analysis ............................................................................................................................. 22
3.5.1 Methodology ........................................................................................................................................................ 24
3.5.2 High Ridership Propensity Areas ........................................................................................................................... 26
3.5.3 High Revenue Propensity Areas ............................................................................................................................ 28
3.5.4 Public Health and Welfare Propensity Areas ......................................................................................................... 30
3.5.5 High Accessibility Score ........................................................................................................................................ 32
3.6 Bikeshare SWOT Analysis ............................................................................................................. 34
3.7 Conclusion .................................................................................................................................... 43
4 Program Expansion Plan ................................................................................................................... 44
4.1 Scenario Planning ......................................................................................................................... 44
4.1.1 Development of Each Scenario ............................................................................................................................. 45
4.1.2 Summary of Analysis Results ................................................................................................................................. 49
4.1.3 Key Takeaways ...................................................................................................................................................... 51
4.2 Recommended Expansion Criteria ............................................................................................... 52
4.2.1 Policy 1: Balance between Station Typologies ...................................................................................................... 52
4.2.2 Policy 2: Ensure Suitable Capacity in the District’s Core Neighborhoods ............................................................. 53
4.2.3 Policy 3: Optimize Where Station Dock Expansion Occurs ................................................................................... 55
4.2.4 Policy 4: Maintain a Minimum Station Density When Possible .............................................................................. 55

September 2015
4.3 Recommended System Expansion Plan ....................................................................................... 55
4.3.1 Methodology for Developing Recommendations ................................................................................................. 56
4.3.2 Overview of Expansion ......................................................................................................................................... 58
4.3.3 Expansion by Fiscal Year ....................................................................................................................................... 62
4.3.4 Detailed Maps of Proposed Expansion ................................................................................................................. 68
4.3.5 Expansion Plan Justification .................................................................................................................................. 75
5 Financial Plan ................................................................................................................................... 77
5.1 Assumptions ................................................................................................................................. 77
5.1.1 Capital Cost Assumptions ..................................................................................................................................... 77
5.1.2 Operating Cost Assumptions ................................................................................................................................ 77
5.1.3 System Revenue Assumptions .............................................................................................................................. 78
5.2 Capital Costs ................................................................................................................................ 80
5.3 State OF Good Repair Costs ........................................................................................................ 81
5.4 Operating Costs and Ridership .................................................................................................... 82
5.5 Financial Findings ......................................................................................................................... 84
5.5.1 Capital Cost .......................................................................................................................................................... 84
5.5.2 Operating Costs ................................................................................................................................................... 85
5.5.3 Sponsorships......................................................................................................................................................... 85
6 Next Steps ....................................................................................................................................... 87
Appendix A: Screening of Individual Measures ......................................................................................... 88
Overview 88
Mapped Measures ................................................................................................................................................................... 89
Appendix B: Propensity Mapping Methodology ..................................................................................... 133
Background 133
Mapping Measures to a Grid ................................................................................................................................................. 133
Normalizing Data ................................................................................................................................................................... 133
Combining Data into a Unified Measure ................................................................................................................................ 134

September 2015
Glossary of Terms Casual Users: Bikeshare users who purchase a short-term membership of 1 or 3 days (& previously
5 days) Registered Users / Subscribers: Bikeshare users who purchase a long-term membership of 1 or 12
months
Rebalancing: The movement of bicycles from full to empty stations Downtime: Time which a bikeshare station is entirely full, empty, or otherwise unavailable for use Overtime: Duration of a bikeshare trip after the first 30 fee-free minutes
Usage Fees: Bikeshare revenue generated from overtime Membership Fees: Bikeshare revenue generated from the sale of memberships
Market Typology: Subdivision of the District of Columbia based on anticipated bikeshare usage
characteristics Core Area: Area of the District of Columbia that features a net gain of bicycles during the AM Peak (6am – 9am)
Dock: The docking points where bicycles are checked-out and checked-in Dock Expansion: The installation of additional docks at a bikeshare station
Introduction September 2015
DC Capital Bikeshare Development Plan | 2
1 Introduction
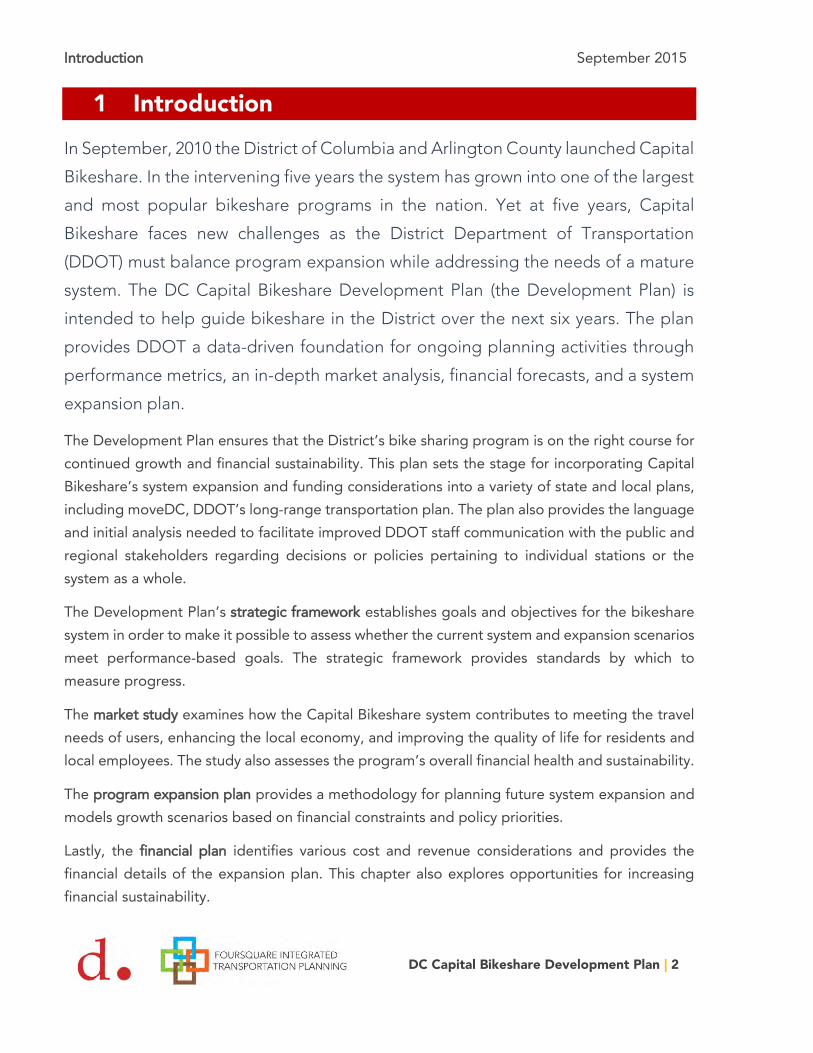
In September, 2010 the District of Columbia and Arlington County launched Capital Bikeshare. In the intervening five years the system has grown into one of the largest and most popular bikeshare programs in the nation. Yet at five years, Capital Bikeshare faces new challenges as the District Department of Transportation (DDOT) must balance program expansion while addressing the needs of a mature system. The DC Capital Bikeshare Development Plan (the Development Plan) is intended to help guide bikeshare in the District over the next six years. The plan provides DDOT a data-driven foundation for ongoing planning activities through performance metrics, an in-depth market analysis, financial forecasts, and a system expansion plan.
The Development Plan ensures that the District’s bike sharing program is on the right course for continued growth and financial sustainability. This plan sets the stage for incorporating Capital Bikeshare’s system expansion and funding considerations into a variety of state and local plans, including moveDC, DDOT’s long-range transportation plan. The plan also provides the language and initial analysis needed to facilitate improved DDOT staff communication with the public and regional stakeholders regarding decisions or policies pertaining to individual stations or the system as a whole.
The Development Plan’s strategic framework establishes goals and objectives for the bikeshare system in order to make it possible to assess whether the current system and expansion scenarios meet performance-based goals. The strategic framework provides standards by which to measure progress.
The market study examines how the Capital Bikeshare system contributes to meeting the travel needs of users, enhancing the local economy, and improving the quality of life for residents and local employees. The study also assesses the program’s overall financial health and sustainability.
The program expansion plan provides a methodology for planning future system expansion and models growth scenarios based on financial constraints and policy priorities.
Lastly, the financial plan identifies various cost and revenue considerations and provides the financial details of the expansion plan. This chapter also explores opportunities for increasing financial sustainability.

Strategic Framework September 2015
DC Capital Bikeshare Development Plan | 0
2 Strategic Framework
The foundation for the Development Plan is a Strategic Framework, comprised of goals, objectives, and performance measures specific to the District’s Capital Bikeshare. The goals, objectives, and performance measures were developed under the leadership of DDOT’s Active Transportation Branch (ATB) and are intended to not only guide the Development Plan but also allow the agency to assess performance of the program moving forward.
The Strategic Framework starts with goals for the program. Goals are clear statements of purpose; each with its own function that drives an end result. Connected to each goal are a set of objectives. Objectives are written as specific, measurable statements of what will be done to achieve a related goal. Finally each objective has assigned to it certain performance measures, built from currently available data that will quantitatively or qualitatively track progress toward an objective over time.
2.1 GOALS AND OBJECTIVES
In 2011 Capital Bikeshare established a unified regional mission for the program:
“to transform our community by providing a high quality, convenient and affordable bicycle transit system that will connect people to more places where
they live, work, and play in the region.”
During this process, program partners also established a regional vision for Capital Bikeshare,
“Life connected by pedal strokes.”
DDOT has developed four goals, and a range of supporting objectives, that are grounded both in the regional mission and vision of Capital Bikeshare, and in the vision presented by the District’s moveDC plan. The selected four goals can each be succinctly summarized under a theme. The hope for these goals is that they evocatively communicate what motivates the planning and operations of Capital Bikeshare in Washington D.C. The program goals not only help frame internal planning for the system, but allow DDOT to clearly communicate to the public what drives decision-making.

Strategic Framework September 2015
DC Capital Bikeshare Development Plan | 1
Theme: Transportation | Goal 1: Ensure Bikeshare is a Valued Part of the District's Transportation System for All Users
1.1: Increase transportation system utility for users. 1.2: Integrate bikeshare into the existing transit system. 1.3: Reduce bikeshare crashes and encourage a culture of safety among users.
Theme: Community | Goal 2: Leverage Bikeshare to Promote a Thriving Community
2.1: Promote retail and entertainment spending through improved accessibility. 2.2: Develop a bikeshare system that effectively serves tourists and visitors in DC. 2.3: Reduce the environmental impact of transportation by maximizing the use of bikeshare and providing a strong alternative to driving alone.
Theme: Quality of Life | Goal 3: Make People's Lives Better Through Bikeshare
3.1: Attract a wide variety of users regardless of age, race, income, and gender. 3.2: Improve public health by increasing physical activity through biking, reducing health disparities among communities in the District 3.3: Expand user access to a range of destinations, including jobs and services that can be reached by bikeshare.
Theme: Program Sustainability | Goal 4: Use Effective Management and Decision Making to Guarantee System Sustainability
4.1: Maintain bikeshare in a state of good repair. 4.2: Grow responsibly by balancing service provision, system costs, public input, and revenue generation concerns. 4.3: Ensure bikeshare technology and procurement remain flexible to meet the constantly changing needs of the system.

Strategic Framework September 2015
DC Capital Bikeshare Development Plan | 2
2.2 PERFORMANCE MEASURES
The District’s Capital Bikeshare goals and objectives detail what the bikeshare system will do for residents, workers, and visitors, and how DDOT will act in order to realize these goals. The performance measures will be used to monitor and evaluate the Capital Bikeshare system. Certain measures pertain to the full bikeshare system, others to individual station performance, and many can be applied to both. Table 2-1 provides the detailed list of performance measures and shows how they tie back to the goals (indicated by the goal theme) and objectives. The icons indicate if the measure will be tracked at a system-wide or station-level, or both. Measures that reference distance from bikeshare stations are calculated based on street network distance, not straight-line distance.

Strategic Framework September 2015
DC Capital Bikeshare Development Plan | 3
TABLE 2-1 | PERFORMANCE MEASURES
Goal Objectives # Performance Measure Frequency Citywide Station Specific
Tran
spor
tatio
n
Increase transportation system utility for users
1 Capital Bikeshare ridership Annual
2 Number of induced trips1 Annual
3 Trips lost due to station downtime as calculated by dividing ridership by the average percent of the day a station is in working order.
Annual
Integrate bikeshare into existing transit system
4 Number of transfers to Metrorail or public transit buses Annual
5 Total transit boardings within one-eighth of a mile of a bikeshare station
Triennial
Reduce bikeshare crashes and encourage a culture of safety
among users
6 Number of crash incidents Annual
7 Percent of riders that report using a helmet Annual
8 Feet of bicycle lanes, cycletracks, and off-road shared-use paths within a quarter of a mile of a bikeshare station
Triennial
1 Trips that, without bikeshare, would not have been taken.

Strategic Framework September 2015
DC Capital Bikeshare Development Plan | 4
Goal Objectives # Performance Measure Frequency Citywide Station Specific
Com
mun
ity
Promote retail and entertainment spending through improved
accessibility
9 Percent of riders that report that bikeshare improves access to commercial businesses
Annual
10 Number of retail and hospitality jobs within a quarter mile of a bikeshare station
Triennial
Develop a bikeshare system that effectively serves tourists / visitors
in DC
11 Number of casual memberships purchased by users with billing zip code outside a Capital Bikeshare member jurisdiction
Annual
12 Proportion of hotel rooms and top tourist destinations2
within a quarter mile of a bikeshare station
Triennial
Reduce the environmental impact of transportation by maximizing
the use of bikeshare and providing a strong alternative to driving
alone.
13 Number of car trips reduced3 Annual
14 Green House Gas (GHG) reduction Annual
2 Top tourist destinations are identified in the Market Study with the help of Destination DC. 3 Percent of surveyed users who stated they would have driven if bikeshare was not available multiplied by the number of annual bikeshare trips.

Strategic Framework September 2015
DC Capital Bikeshare Development Plan | 5
Goal Objectives # Performance Measure Frequency Citywide Station Specific
Qua
lity
of L
ife
Attract a wide variety of users regardless of age, race, income,
and gender
15 Demographic profile (age, income, race, sex) of bikeshare population compared to the demographic profile of the District population as a whole
Annual
Improve public health by increasing physical activity
through biking, reducing health disparities among communities
in the District
16 Total and average per person calories burned through bikesharing
Annual
17 Percent of surveyed respondents who report more physical activity since joining bikeshare
Annual
Expand user access to a range of destinations, including jobs and services that can be reached by
bikeshare
18 Number of employees and households, per square mile, within bikeshare service area
Triennial
19 Percent of total public service destinations4 within a
quarter of a square mile of a bikeshare station
Annual
4 Public service destinations are defined as public schools, public libraries, recreation centers, full-service grocery stores, and DC Department of Human Service (DHS) centers.

Strategic Framework September 2015
DC Capital Bikeshare Development Plan | 6
Goal Objectives # Performance Measure Frequency Citywide Station Specific
Prog
ram
Sus
tain
abili
ty Maintain bikeshare in a state of
good repair
20 Average age of bicycle fleet Annual
21 Number of station and dock failures Annual
22 Cost recovery ratio Annual
23 Operating cost per dock Annual
24 Private-sector financial support for Capital Bikeshare; the total monetary value of corporate memberships, sponsorships, and advertising
Triennial
Ensure bikeshare technology and procurement remain flexible to meet the constantly changing
needs of the system
25 Average capital cost of bikeshare equipment (bikes and docks)
Annual
26 Instances of vendor procurement delays 5 Annual
27 Instances of new technology adoption (e.g. new payment, software upgrades, new bicycles, new dock types)
Annual
5 Descriptive measure that documents whether there are any delays in procuring equipment. Can be qualitative in nature and does not necessarily need to provide a precise duration of delay.

Strategic Framework September 2015
DC Capital Bikeshare Development Plan | 7
2.3 MONITORING AND EVALUATION
The District’s Capital Bikeshare goals, objectives and performance measures provide clarity and transparency to the formation of the Development Plan. To track performance measures, DDOT has set targets that gauge progress towards the objectives.
The targets vary depending on the measure. Certain measures lend themselves to specific targets, such as reducing the number of crash incidents year over year to zero. Other targets do not have a specific numerical end goal, but rather an annual trajectory of improvement such as increasing the number of induced trips, or trips that might not have otherwise be taken, year over year. Lastly, some measures are descriptive because they do not have a set target, but still serve to inform bikeshare planners on how the service is operating.
Table 2-2 indicates the measure, target, and data source that will be used for monitoring and evaluation of the system.
TABLE 2-2 |PERFORMANCE TARGETS)
# Annual Measures Targets Sources System-wide Baseline Figures
1 Capital Bikeshare Ridership Year over year increase. Monthly operating report 2.62 million trips (DC only, FY2014)
2 Number of induced trips6 Increase number of induced trips, year over year.
Capital Bikeshare Survey Analysis Required
3 Trips lost due to station downtime Reduce the number of trips, year over year.
Monthly operating report 58,221 per month (FY2014)
4 Number of transfers to Metrorail or public transit buses
Descriptive measure, no set target. Capital Bikeshare Survey Analysis Required
5 Total transit boardings within one-eighth of a mile of a bikeshare station
Increase in the percent of transit boardings within a one-eighth mile radius of bikeshare stations.
WMATA and DDOT Data 379,269 boardings
6 Number of crash incidents Achieve zero crash incidents by reducing the number of crash incidents, year over year.
Monthly operating report Analysis Required
7 Percent of riders that report using a helmet
Achieve 100 percent helmet usage by increasing the percent of riders who use them, year over year.
Capital Bikeshare Survey Analysis Required
8 Feet of bicycle lanes, cycletracks, and off-road shared-use paths within a quarter -mile of a bikeshare station
Annual increase year over year. DDOT GIS Data 510,768 feet
6 Trips that, without bikeshare, would not have been taken.

Strategic Framework September 2015
DC Capital Bikeshare Development Plan | 8
# Annual Measures Targets Sources System-wide Baseline Figures
9 Percent of riders that report that bikeshare improves access to commercial businesses
Increase percent of riders that report improved access to commercial businesses, year over year.
Capital Bikeshare Survey Analysis Required
10 Number of retail and hospitality jobs within a quarter mile of a bikeshare station
Annual increase year over year. LEHD Data7 ~70,600 jobs (FY2015)
11 Number of casual memberships purchased by users with billing code outside member jurisdictions
Annual increase year over year. Membership records 78% (CY2014)
12 Hotel rooms and top tourist
destinations8 within a quarter-mile
of a bikeshare station
Achieve coverage of 100 percent of top tourist destinations and 90 percent of city hotel rooms located within a quarter-mile of a bikeshare station.
Hotel Rooms: Data made available through DC GIS; Tourist Attractions: As defined by Market Study / Destination DC
58% of top attractions and 81% of hotel rooms (FY2015)
13 Number of car trips reduced Increase the number of car trips reduced, year over year.
Capital Bikeshare Survey and DDOT Data
Analysis Required
14 Green House Gas (GHG) reduction Greater GHG reduction, year over year.
Capital Bikeshare Survey and DDOT Data
Analysis Required
15 Demographic profile (age, income, race, sex) of bikeshare population compared to the demographic profile of the District population as a whole
Achieve parity between DC’s bikeshare population and the city’s overall population; track progress in improving parity, year over year.
DDOT Data and US Census Data
See Section 3.3.1
16 Total and average per person calories burned through bikesharing
Increase total and average per person calories burned through bikesharing, year over year.
Monthly operating report Analysis Required
17 Percent of surveyed respondents who report more physical activity since joining bikeshare
Increase percent of respondents who report more physical activity, year over year.
Capital Bikeshare Survey Analysis Required
18 Percent of District jobs and residents within bikeshare service area
Increase the number of employees and households with the bikeshare service area, year over year.
US Census Data 39% of residents and 81% of jobs
19 Percent of total public service
destinations9 within a quarter of a
square mile of a bikeshare station
Descriptive measure, no set target. DC GIS Data 44%
20 Average age of bicycle fleet Maintain average bicycle fleet at or below useful lifespan age.
Data on year of purchase for current fleet.
3 years
21 Number of station and dock failures
Reduce the number of failures, year over year.
Monthly operating report Analysis Required
22 Cost recovery ratio Over the long-run attain and maintain a 100 percent cost recovery ratio for operations.
Annual financial results 79% (CY2014)
7 US Census Longitudinal Employer-Household Dynamics (LEHD) 8 Top tourist destinations are identified in the Market Study with the help of Destination DC. 9 Public service destinations are defined as public schools, public libraries, recreation centers, full-service grocery stores, and DC Department of Human Service (DHS) centers.

Strategic Framework September 2015
DC Capital Bikeshare Development Plan | 9
# Annual Measures Targets Sources System-wide Baseline Figures
23 Operating cost per dock Descriptive measure, no set target. Annual financial results $144 per month
24 Private-sector financial support for Capital Bikeshare; the total monetary value of corporate memberships, sponsorships, and advertising
Descriptive measure, no set target. DDOT Data Analysis Required
25 Average capital cost of bikeshare equipment (bikes and docks)
Ensure that the average capital cost of bikeshare equipment, year over year, is not increasing beyond the rate of inflation or in an otherwise unexplained manner.
DDOT procurement $3,171 per dock of new station; $1,470 per bicycle
26 Instances of procurement delays Descriptive measures, not set target. DDOT Data Analysis Required
27 Instances of new technology adoption (e.g. new payment, software upgrades, new bicycles, new dock types)
Descriptive measures, not set target. DDOT Data Analysis Required
2.4 REPORTING
The majority of the DDOT Capital Bikeshare’s 27 performance measures will be tracked and reported on an annual basis. The remaining six measures are recommended for triennial measurement; these triennial measures are more complicated to calculate and might be burdensome to track every year. Alternatively, DDOT could approach these measures on a triennial cycle; the agency would track one third of these measures each year so that at the end of the three year cycle all measures are up to date.
Changes, within DDOT’s control, such as new stations, educational programming on biking, or additional bike infrastructure may impact the results of the performance measures. Changes outside of DDOT’s control, such as employment opportunities, the opening of a new tourist attraction, or a major residential development will also impact many of these measures. By keeping the pulse of changes within the District’s Capital Bikeshare system and its riders’ and potential riders’ environment, DDOT will be able maintain a clear path towards realizing its objectives and achieving its goals.

Market Study September 2015
DC Capital Bikeshare Development Plan | 10
3 Market Study
3.1 INTRODUCTION
The Capital Bikeshare system is one of the most successful bikeshare programs in the country, and the District of Columbia is the largest municipal participant in this regional partnership. Over the last five years the program has grown substantially and today spans much of the District, providing bikeshare stations within a quarter mile walk of 40 percent of the residents and 80 percent of jobs. With all of the program’s success, DDOT recognizes the need to actively look to the program’s future and assess its needs and opportunities.
The purpose of this market study is to examine how the Capital Bikeshare system contributes to meeting the travel needs of residents, workers, and visitors in the District, the local economy, quality of life, and the program’s overall financial health and sustainability. The market study’s conclusions are intended to guide the expansion recommendations in Section 4, along with supporting future decision making about Capital Bikeshare within DDOT.
The market study is a composite of different analyses to better understand how the Capital Bikeshare program functions in the District of Columbia today. The study consists of the following sections:
Characteristics of Capital Bikeshare users; Capital Bikeshare trip patterns and station performance; The Capital Bikeshare system vis-à-vis a series of geographic measures; and, Strength, Weaknesses, Opportunities, and Threats (SWOT) analysis that summarizes and links
Market Study findings back to the plan’s strategic objectives.
3.1.1 Key Findings The main findings of the market analysis are explored in this chapter of the Development Plan. Overall the study found that Capital Bikeshare successfully serves much of the District’s core bikeshare market. Future expansion will require a more targeted and nuanced approach, focusing on filling in gaps, improving service reliability, and diversifying the user base. The key findings of the market analysis are summarized below.
Market Study September 2015
DC Capital Bikeshare Development Plan | 11
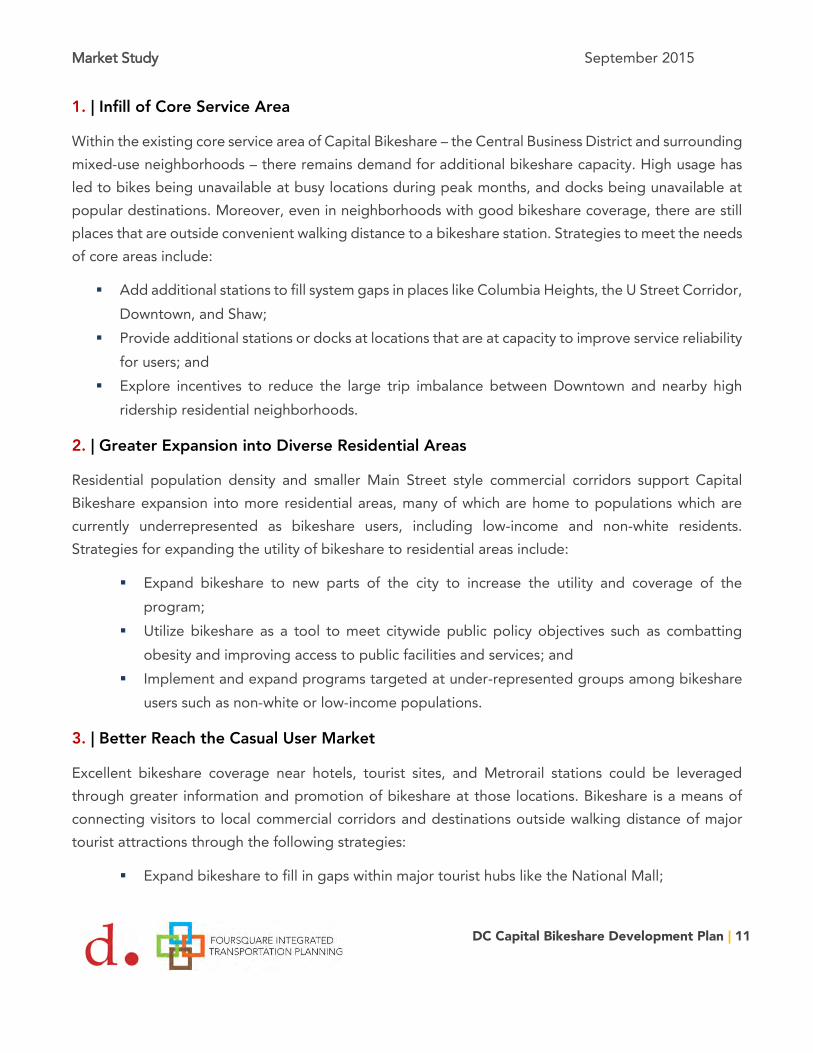
1. | Infill of Core Service Area
Within the existing core service area of Capital Bikeshare – the Central Business District and surrounding mixed-use neighborhoods – there remains demand for additional bikeshare capacity. High usage has led to bikes being unavailable at busy locations during peak months, and docks being unavailable at popular destinations. Moreover, even in neighborhoods with good bikeshare coverage, there are still places that are outside convenient walking distance to a bikeshare station. Strategies to meet the needs of core areas include:
Add additional stations to fill system gaps in places like Columbia Heights, the U Street Corridor, Downtown, and Shaw;
Provide additional stations or docks at locations that are at capacity to improve service reliability for users; and
Explore incentives to reduce the large trip imbalance between Downtown and nearby high ridership residential neighborhoods.
2. | Greater Expansion into Diverse Residential Areas
Residential population density and smaller Main Street style commercial corridors support Capital Bikeshare expansion into more residential areas, many of which are home to populations which are currently underrepresented as bikeshare users, including low-income and non-white residents. Strategies for expanding the utility of bikeshare to residential areas include:
Expand bikeshare to new parts of the city to increase the utility and coverage of the program;
Utilize bikeshare as a tool to meet citywide public policy objectives such as combatting obesity and improving access to public facilities and services; and
Implement and expand programs targeted at under-represented groups among bikeshare users such as non-white or low-income populations.
3. | Better Reach the Casual User Market
Excellent bikeshare coverage near hotels, tourist sites, and Metrorail stations could be leveraged through greater information and promotion of bikeshare at those locations. Bikeshare is a means of connecting visitors to local commercial corridors and destinations outside walking distance of major tourist attractions through the following strategies:
Expand bikeshare to fill in gaps within major tourist hubs like the National Mall;

Market Study September 2015
DC Capital Bikeshare Development Plan | 12
Further integrate bikeshare into city wayfinding to make the program more accessible to non-residents; and
Continue to build relationships with major tourist attractions, the Convention Center, and hotels to further the popularity of bikeshare as a travel option among tourists.
3.2 TERMINOLOGY AND DATA SOURCES
3.2.1 Key Terminology A full glossary of terms is listed after the Table of Contents.
Casual Users: Bikeshare users who purchase a short-term membership of 1 or 3 days (& previously 5 days) Registered Users / Subscribers: Bikeshare users who purchase a long-term membership of 1 or 12 months Rebalancing: The movement of bicycles from full to empty stations Downtime: Time which a bikeshare station is entirely full, empty, or otherwise unavailable for use Overtime: Duration of a bikeshare trip after the first 30 fee-free minutes Usage Fees: Bikeshare revenue generated from overtime
3.2.2 Data Sources The market study relies on a wide range of data sources to produce maps and analysis, including:
District of Columbia GIS Open Data, 2014 Metropolitan Washington Council of Governments (MWCOG) TPB Version 2.3.52 model simulation,
2013 WMATA Metrobus boardings data and Metrorail station entrances, 2013 Longitudinal Employment-Household Dynamics (LEHD), U.S. Census Bureau, 2014 U.S. Census, 2010 Decennial Census U.S. Census American Community Survey (ACS) 2008-2012 D.C. Department of Health, District of Columbia Communities Putting Prevention to Work: Obesity,
2010 Capital Bikeshare Membership Survey, 2014 Capital Bikeshare Trip Data, Q4 2013 to Q3 2014 Capital Bikeshare Operating Monthly Reports
3.3 USERS (MEMBERSHIP)
Capital Bikeshare annually conducts a survey to determine the characteristics of the program’s members, characteristics of bikeshare trips, and travel behavior changes in response to bikeshare access. In fall 2014, Capital Bikeshare polled 27,600 members via email and received 4,314 responses,

Market Study September 2015
DC Capital Bikeshare Development Plan | 13
a 16 percent response rate. While this response rate is significant, it is unscientific, as respondents self-select to answer the survey, and there are no controls to ensure that respondents accurately represent the broader membership.
Of these responses, 75 percent came from District residents, and the remaining responses were from residents of neighboring jurisdictions. Registered users account for 79 percent of bikeshare trips in the region;10 21 percent of trips were made by casual users who were not represented in the annual survey and whose demographic information remains largely unknown.
3.3.1 Demographic Profile and Use The District’s non-white and low-income populations were not well represented among Capital Bikeshare’s 2014 member survey responses when compared to the demographic profile of the District as a whole. To a smaller degree, the District’s residents who are 35 years or older and female were also underrepresented in Capital Bikeshare’s survey responses.
TABLE 3-1 | SUMMARY DEMOGRAPHICS FOR CAPITAL BIKESHARE SURVEY RESPONDENTS VS. THE DISTRICT OF COLUMBIA
Demographic Indicator Capital Bikeshare Survey Respondents (DC only)
District of Columbia Population11
Difference (Percentage Points)
White/Caucasian 81% 43% +38 Household Income < $50,000 16% 43% -27 Under Age 35 63% 52% +11 Female 42% 53% -11
3.3.2 Capital Bikeshare Member Use Capital Bikeshare members reported their top three reasons for joining the program as:
To get around more easily and faster; Take advantage of one-way bicycle travel options; and Enjoyment of cycling.
These motivations are reflected in the diverse destinations and activities accessed through bikeshare, but when asked the purpose of their most recent trip, 49 percent of respondents indicated it was for commuting purposes. DC Capital Bikeshare respondents reported using the system, at least occasionally, to access social or entertainment destinations (93 percent), personal appointments (89
10 Capital Bikeshare Trip Data, Q4 2013 to Q3 2014 11 DC Neighborhood Profiles 2013 http://www.wdcep.com/wp-content/uploads/2010/08/np.pdf
Market Study September 2015
DC Capital Bikeshare Development Plan | 14
percent), restaurant/meal destinations (86 percent), shopping destinations (86 percent), commute to/from work (78 percent), and for exercise or recreation purposes (56 percent). The most common non-commute purpose trip was to access social or entertainment destinations (19 percent).
Although commuting is the most common reported trip purpose among bikeshare respondents, many of the respondents who reported frequent use of bikeshare for commuting also reported transit as their primary commute mode in a later question of the survey. This suggests that they might have been using bikeshare to access a bus or train as part of their overall commute, or using bikeshare as an occasional supplement to their regular transit trip. Capital Bikeshare’ s role in connecting members to transit as part of their overall trip can be seen in that 64 percent of respondents indicated that at least one of the bikeshare trips they made last month started or ended at a Metrorail station. Twenty-one percent of respondents indicated that they used bikeshare to access Metrorail six or more times in the last month.
Bikeshare member trips average 11.6 minutes in length and 1.4 miles in distance. These short trips are supported by the density of activity centers in the city, as well as the density of existing bikeshare stations. The majority of bikeshare respondents (78 percent) reported living within a quarter mile of a bikeshare station and, for employed bikeshare respondents, the vast majority (83 percent) work within a quarter mile of a station. This convenience factor may well play a large role in induced trips among bikeshare members. Forty-nine percent of respondents report using bikeshare to make at least one trip they would not have made if bikeshare had not been available – nearly all induced trips were made for non-commuting purposes.
From the current user perspective, respondents want more bike docks at existing stations (54 percent) and want stations added in residential areas (43 percent). Respondents also identified structural barriers to bicycling in the DC area. Among those most commonly mentioned were the lack of dedicated bike lanes or paths, the lack of connections between bike lanes or paths, drivers who are inconsiderate of cyclists, and poorly-maintained bicycle riding surfaces. The majority of respondents were only moderately satisfied or unsatisfied with the availability of bicycles and open docks within the system.
3.4 TRIP CHARACTERISTICS
On average, Capital Bikeshare trips are short in distance and duration; users most frequently made trips that began and ended in the same neighborhood. Based on the District’s officially defined neighborhood clusters, the neighborhood clusters in which trips are most frequently made, in descending order, are:
Downtown, Chinatown, Penn Quarter, Mount Vernon; National Mall;

Market Study September 2015
DC Capital Bikeshare Development Plan | 15
Dupont Circle, Connecticut Ave/K Street; Capitol Hill, Lincoln Park; and Union Station, Stanton Park, Kingman Park.
Inter-neighborhood trips also tend to be short distance trips, primarily between nearby neighborhoods and downtown. The most frequent neighborhood cluster pairs, in descending order, are:
Crosstown trips from the western to eastern parts of the District’s Central Business District (Dupont Circle, Connecticut Ave/K Street to Downtown, Chinatown, Penn Quarter, Mount Vernon);
From the National Mall to the Central Business District (National Mall to Downtown, Chinatown, Penn Quarter, Mount Vernon);
Crosstown trips from the eastern to western parts of the Central Business District (Downtown, Chinatown, Penn Quarter, Mount Vernon to Dupont Circle, Connecticut Ave/K Street);
Shaw/Logan Circle to Dupont Circle/Connecticut Ave/K Street; and From the Central Business District to the National Mall (Downtown, Chinatown, Penn
Quarter, Mount Vernon to National Mall).
Figure 3-1, displays the internal neighborhood trip pairs.

Market Study September 2015
DC Capital Bikeshare Development Plan | 16
FIGURE 3-1 | TRIP FREQUENCY BETWEEN NEIGHBORHOOD CLUSTERS
Market Study September 2015
DC Capital Bikeshare Development Plan | 17
High demand in these neighborhoods has led to station “down time,” instances of empty stations, where no bicycles are available to users, or full stations, where no open dock is available to allow a user to end their journey. Station down time theoretically leads to lost trips,12 particularly in high demand neighborhoods. The stations that feature both a large number of trips, and high duration of downtime seem to be clustered in Downtown, Adams Morgan, and Logan Circle. Some stations (e.g Lincoln Memorial) have a relatively low rate of down time but still rank highly in estimated lost trips per month because of their overall high ridership. See Figure 3-2 for the distribution of stations by lost trips and percent down time.
12 Lost trips are estimated by dividing a station’s ridership by the proportion of the day a station is normally operating

Market Study September 2015
DC Capital Bikeshare Development Plan | 18
FIGURE 3-2 | STATION DOWNTIME AND LOST TRIPS MAP
Market Study September 2015
DC Capital Bikeshare Development Plan | 19
Ideally, equal numbers of trips would occur between a pair of stations in either direction throughout the day. However, each day hundreds or more trips occur from Columbia Heights to the Central Business District (CBD), Columbia Heights to Shaw, and Adams Morgan to Dupont, than happen in the reverse. This net loss of bicycles leads to empty stations in “uphill” neighborhoods and full stations in the CBD. The most common trips to occur disproportionately in one direction reflect the topography of the District. Uphill neighborhoods experience a daily net-loss of bicycles to lower lying destinations. These travel patterns put a great strain on Capital Bikeshare’s ability to ensure the system is rebalanced throughout the day.

Market Study September 2015
DC Capital Bikeshare Development Plan | 20
FIGURE 3-3 | NEIGHBORHOOD TRIP IMBALANCE MAP

Market Study September 2015
DC Capital Bikeshare Development Plan | 21
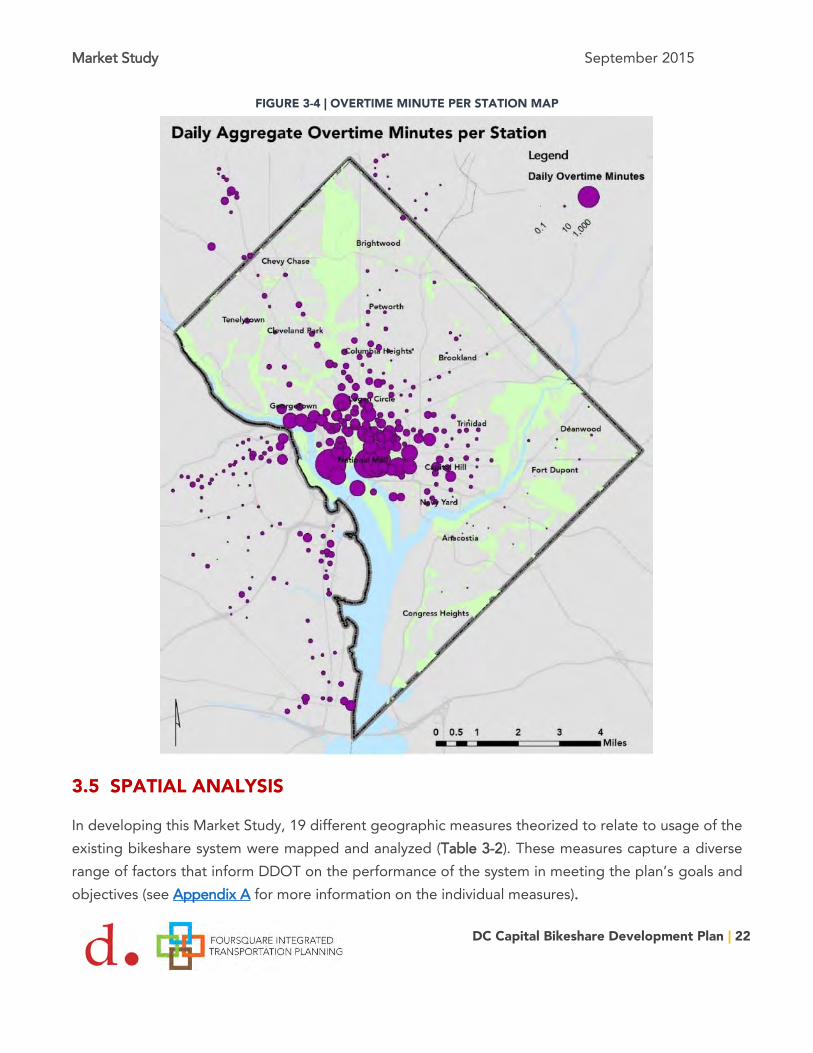
The busiest stations in the Capital Bikeshare system are not necessarily the most important from a revenue-generation standpoint. Busy bikeshare stations in the CBD and surrounding neighborhoods largely serve commuters who rarely take trips lasting over 30 minutes, therefore incurring almost no usage fees. Stations located at major tourist and recreation sites attract a high proportion of casual riders who not only pay relatively more in membership fees for short-term access to the system, but are also much more likely to take trips over 30 minutes, thereby incurring usage fees. Usage fees are generated through overtime minutes - the number of minutes a rider takes over the first 30 free minutes – and are a significant source of revenue for Capital Bikeshare. The top five stations for overtime generation account for 21 percent of average daily overtime minutes system-wide. Four of these stations are located on the National Mall, with the remaining station located at the National Portrait Gallery.
Market Study September 2015
DC Capital Bikeshare Development Plan | 22
FIGURE 3-4 | OVERTIME MINUTE PER STATION MAP
3.5 SPATIAL ANALYSIS
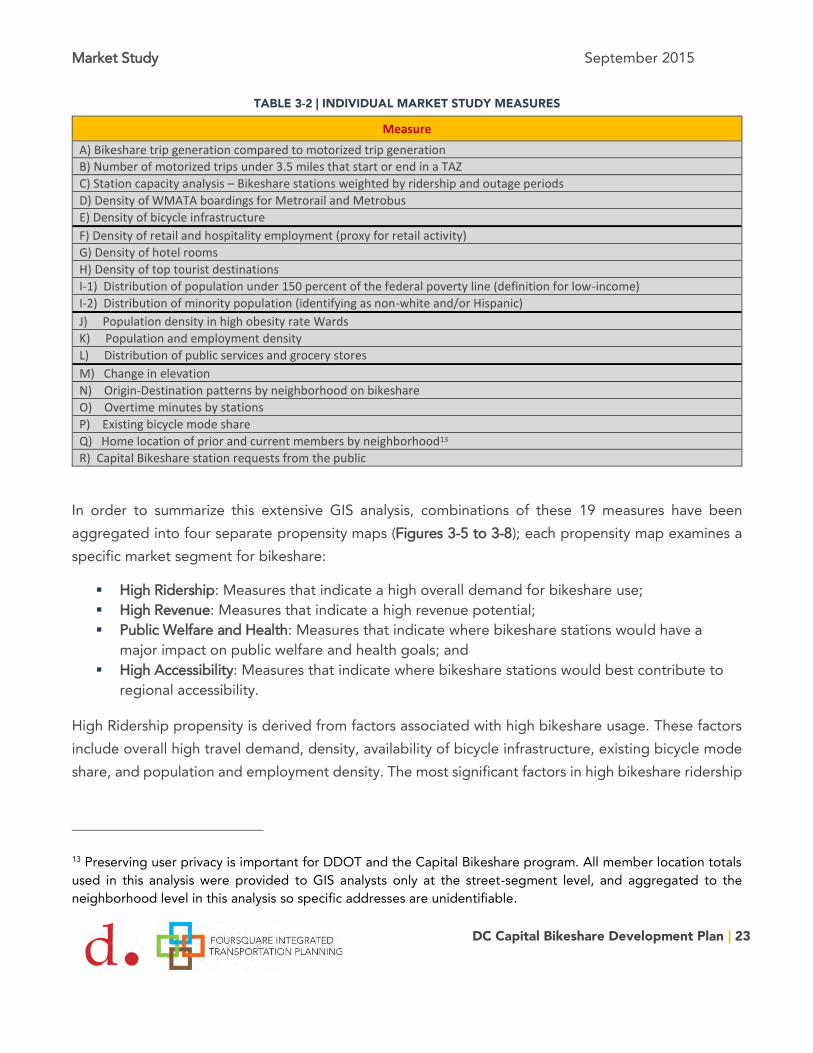
In developing this Market Study, 19 different geographic measures theorized to relate to usage of the existing bikeshare system were mapped and analyzed (Table 3-2). These measures capture a diverse range of factors that inform DDOT on the performance of the system in meeting the plan’s goals and objectives (see Appendix A for more information on the individual measures).
Market Study September 2015
DC Capital Bikeshare Development Plan | 23
TABLE 3-2 | INDIVIDUAL MARKET STUDY MEASURES
Measure
A) Bikeshare trip generation compared to motorized trip generation
B) Number of motorized trips under 3.5 miles that start or end in a TAZ
C) Station capacity analysis – Bikeshare stations weighted by ridership and outage periods
D) Density of WMATA boardings for Metrorail and Metrobus
E) Density of bicycle infrastructure
F) Density of retail and hospitality employment (proxy for retail activity)
G) Density of hotel rooms
H) Density of top tourist destinations
I-1) Distribution of population under 150 percent of the federal poverty line (definition for low-income)
I-2) Distribution of minority population (identifying as non-white and/or Hispanic)
J) Population density in high obesity rate Wards
K) Population and employment density
L) Distribution of public services and grocery stores
M) Change in elevation
N) Origin-Destination patterns by neighborhood on bikeshare
O) Overtime minutes by stations
P) Existing bicycle mode share
Q) Home location of prior and current members by neighborhood13
R) Capital Bikeshare station requests from the public
In order to summarize this extensive GIS analysis, combinations of these 19 measures have been aggregated into four separate propensity maps (Figures 3-5 to 3-8); each propensity map examines a specific market segment for bikeshare:
High Ridership: Measures that indicate a high overall demand for bikeshare use; High Revenue: Measures that indicate a high revenue potential; Public Welfare and Health: Measures that indicate where bikeshare stations would have a
major impact on public welfare and health goals; and High Accessibility: Measures that indicate where bikeshare stations would best contribute to
regional accessibility.
High Ridership propensity is derived from factors associated with high bikeshare usage. These factors include overall high travel demand, density, availability of bicycle infrastructure, existing bicycle mode share, and population and employment density. The most significant factors in high bikeshare ridership
13 Preserving user privacy is important for DDOT and the Capital Bikeshare program. All member location totals used in this analysis were provided to GIS analysts only at the street-segment level, and aggregated to the neighborhood level in this analysis so specific addresses are unidentifiable.

Market Study September 2015
DC Capital Bikeshare Development Plan | 24
are population and employment density. This measure was included to allow DDOT to visualize where the greatest ridership demand exists for bikeshare in the District.
High Revenue propensity is based on factors that drive casual trips taken by infrequent users and tourists. Casual users contribute a large share of total revenue, and generally occur around retail destinations, tourist sites, major hotels, and densely developed neighborhoods. This propensity map allows DDOT to visualize where revenue generation opportunities exist for the system.
Public Welfare propensity is built around factors that illustrate public policy objectives. This analysis includes non-white population, low-income population, the obesity rate, access to public services, access to grocery stores, and overall population and employment density. This propensity map is intended to help DDOT visualize where stations meet public needs that otherwise might be overlooked if revenue and ridership were the only determining factors in station location planning.
Finally, the High Accessibility measure looks at connectivity to trip generators, public facilities, transportation infrastructure, and public transit service. Factors include transit activity, bike infrastructure, trip generation, and public services. This map allows DDOT to visualize how well the bikeshare system meets the transportation objective of improving citywide accessibility, by complementing other modes of transportation and providing connections to vital destinations.
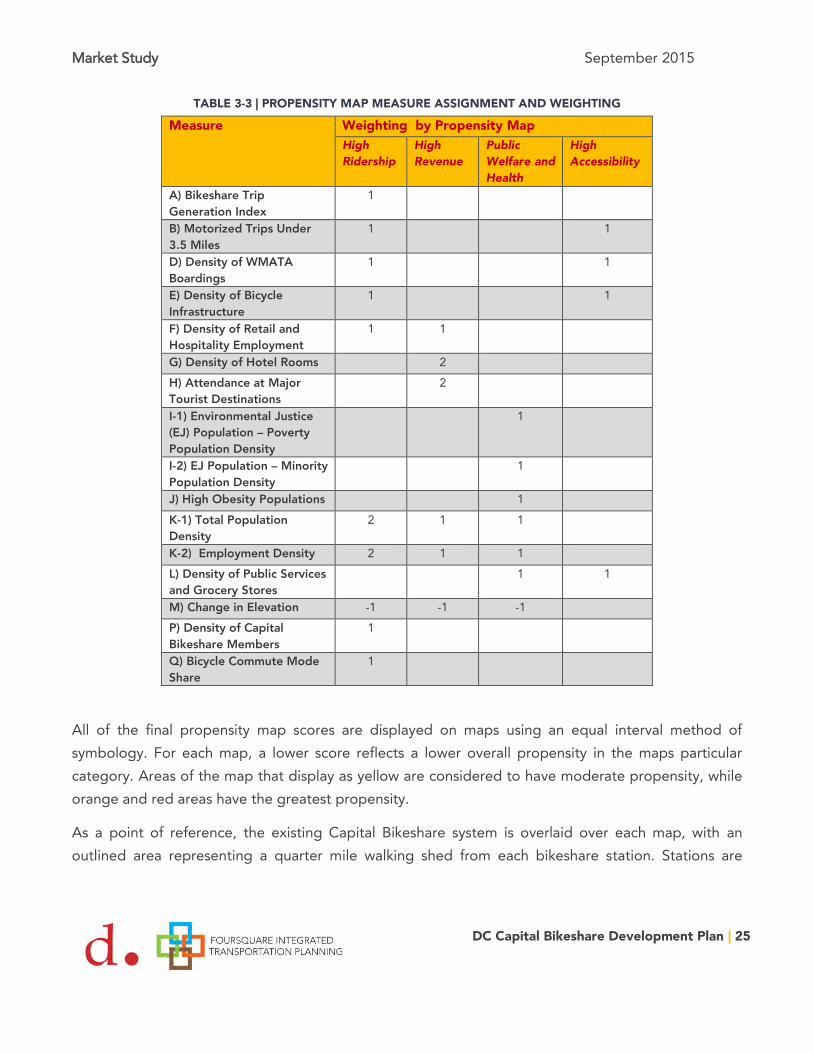
3.5.1 Methodology Each propensity map is composed of a series of measures that have been normalized to a scale of zero to one, with one representing the maximum value and zero the minimum value. The measures used in this analysis are largely based on absolute numbers (e.g., the number of bicycle commuters, or low-income population per square mile) instead of percentages (e.g., proportion of population that is low-income); a location for example may have 100 percent of its population below the poverty line, but still barely register under the low-income measure if its total population is negligible. This approach was taken so that each measure gauges the total population impacted by bikeshare. In scoring the maps, certain measures were provided with an additional weighting based on the perceived importance of that factor. As research into relationships between the variables and their relative impact on the propensity factors develops, weighting may be adjusted to better predict outcomes. Table 3-3 outlines all the measures included in the study, and to which propensity measure(s) each is assigned. See Appendix B for more details on the methodology, including statistics on the data range of each measure and normalization method.
Market Study September 2015
DC Capital Bikeshare Development Plan | 25
TABLE 3-3 | PROPENSITY MAP MEASURE ASSIGNMENT AND WEIGHTING
Measure Weighting by Propensity Map High Ridership
High Revenue
Public Welfare and Health
High Accessibility
A) Bikeshare Trip Generation Index
1
B) Motorized Trips Under 3.5 Miles
1 1
D) Density of WMATA Boardings
1 1
E) Density of Bicycle Infrastructure
1 1
F) Density of Retail and Hospitality Employment
1 1
G) Density of Hotel Rooms 2
H) Attendance at Major Tourist Destinations
2
I-1) Environmental Justice (EJ) Population – Poverty Population Density
1
I-2) EJ Population – Minority Population Density
1
J) High Obesity Populations 1
K-1) Total Population Density
2 1 1
K-2) Employment Density 2 1 1
L) Density of Public Services and Grocery Stores
1 1
M) Change in Elevation -1 -1 -1
P) Density of Capital Bikeshare Members
1
Q) Bicycle Commute Mode Share
1
All of the final propensity map scores are displayed on maps using an equal interval method of symbology. For each map, a lower score reflects a lower overall propensity in the maps particular category. Areas of the map that display as yellow are considered to have moderate propensity, while orange and red areas have the greatest propensity.
As a point of reference, the existing Capital Bikeshare system is overlaid over each map, with an outlined area representing a quarter mile walking shed from each bikeshare station. Stations are

Market Study September 2015
DC Capital Bikeshare Development Plan | 26
categorized by the average proportion of the day they are in downtime. High downtime rates are a good reflection whether a station has capacity issues and needs to be expanded.
3.5.2 High Ridership Propensity Areas The High Ridership propensity map is intended to show which areas are estimated to have the highest ridership demand for bikeshare. Overall the existing system does a good job of serving high scoring areas. The greatest estimated demand for bikeshare is exhibited in Downtown, and dense mixed-use neighborhoods near Downtown such as Logan Circle, Columbia Heights, Dupont Circle, and Capitol Hill. The results of the map are not surprising as the higher propensity neighborhoods all exhibit high employment or population densities, high rates of transit usage and bicycle commuting, and high trip demand. The neighborhoods that score highly in this measure also tend to have capacity issues at nearby bikeshare stations.
While the existing bikeshare system already serves most of the city that scores as having high ridership propensity, there are a few important gaps in the system, including:
16th Street between Park Rd and Spring Rd in Columbia Heights; 16th Street along the west side of Meridian Hill Park; O Street Market redevelopment in Shaw; Eastern Columbia Heights between Washington Hospital Center and Georgia Ave.; Portions of Southwest DC; and Capitol Hill around Stanton Park.
Station downtime rates suggest that much of the investments made to encourage higher ridership should occur as infill stations within a quarter-mile of existing bikeshare stations, or as dock expansions to existing bikeshare stations. Downtown, the National Mall, Logan Circle, Adams Morgan, and Columbia Heights all exhibit a high concentration of stations with high average downtimes.

Market Study September 2015
DC Capital Bikeshare Development Plan | 27
FIGURE 3-5 | RIDERSHIP PROPENSITY MAP

Market Study September 2015
DC Capital Bikeshare Development Plan | 28
3.5.3 High Revenue Propensity Areas High revenue locations are intended to illustrate where in the District high bikeshare user revenue is expected through casual use by infrequent users and visitors. This map captures locations with major attractions, concentrations of hotel rooms, and a high density of hospitality and retail destinations. As expected this map shows the greatest demand concentrated in Downtown DC, Dupont Circle, and along the National Mall. As with the high ridership measure, the existing system does a good job of serving these areas but a few gaps remain:
The Capitol complex including the Capitol Visitors Center, Library of Congress, and Supreme Court;
National Gallery; Bureau of Printing and Engraving, and the Holocaust Museum; Basilica of the National Shrine of Immaculate Conception (Catholic University); and Woodley Park Metro and the nearby Marriot Wardman and Omni Shoreham hotel complexes.

Market Study September 2015
DC Capital Bikeshare Development Plan | 29
FIGURE 3-6 | REVENUE PROPENSITY MAP
Market Study September 2015
DC Capital Bikeshare Development Plan | 30
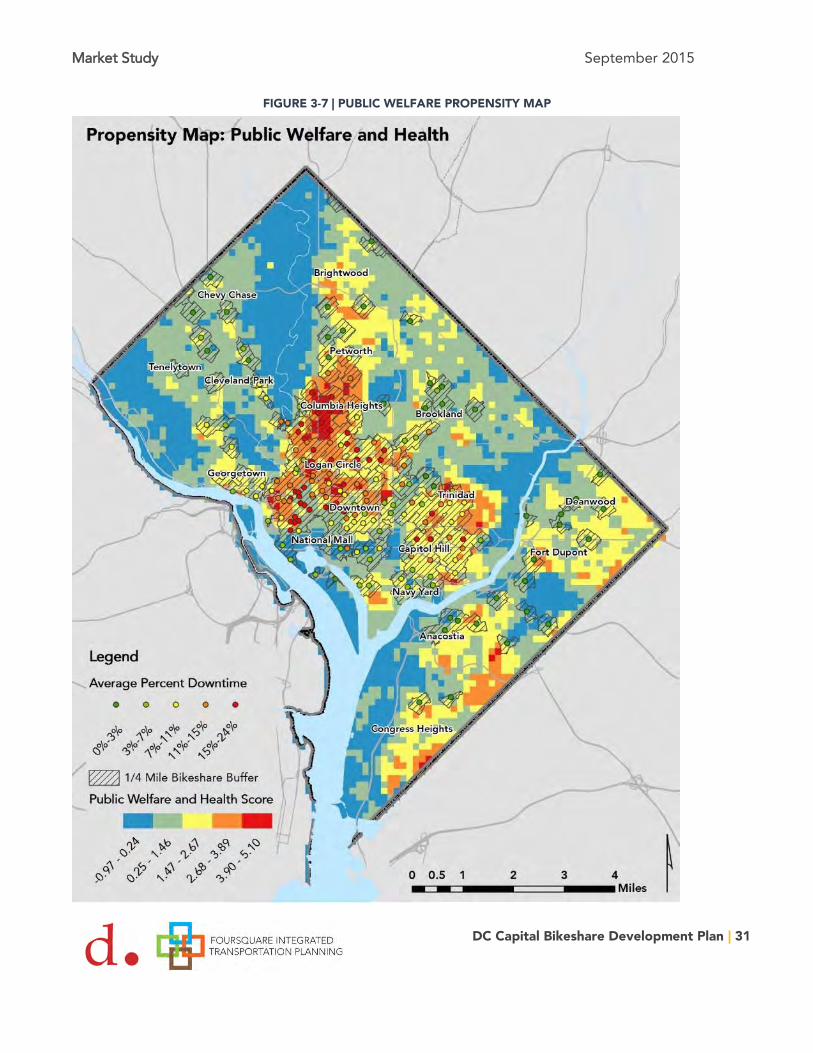
3.5.4 Public Health and Welfare Propensity Areas This propensity map is intended to show locations that serve public health and welfare goals such as combating obesity, improving bikeshare user equity, enhancing accessibility to public facilities, and supporting access to jobs and housing. Compared to the previous two measures, the Capital Bikeshare system does not serve a number of areas that show a high value for achieving public health and welfare goals. The highest scoring area in this analysis is Columbia Heights; the neighborhood’s very high population densities, diverse demographics, and concentration of public services all helped this area to rank highly.
The following neighborhoods score highly in this measure but lack adequate bikeshare coverage:
Carver-Langston neighborhood along Benning Road; Multiple areas along Southern Avenue along the District border; Alabama Avenue between Congress Heights and Skyline; Southwest DC, south of the Waterfront Metro; Columbia Heights south of the Petworth Metro along Sherman and New Hampshire Avenue; Columbia Heights along 16th Street from Park Rd. to Spring St.; Upper Petworth along Georgia Avenue south of Minnesota Avenue; 14th Street in Brightwood; Brentwood (north of New York Avenue); Fort Dupont; and St. Elizabeth’s campus.
Market Study September 2015
DC Capital Bikeshare Development Plan | 31
FIGURE 3-7 | PUBLIC WELFARE PROPENSITY MAP
Market Study September 2015
DC Capital Bikeshare Development Plan | 32
3.5.5 High Accessibility Score This map is intended to show areas where placing bikeshare stations would improve accessibility (i.e. the ability to access a greater number of destinations within a given time period). High scoring areas exhibit good transit access, high trip demand, public services, and bicycle infrastructure. Overall the existing bikeshare system is fairly successful at contributing to improving regional accessibility. Many of the city’s major transit hubs and destinations already are well serviced by bikeshare. The propensity map highlights certain accessibility hotspots in the District such as Dupont Circle, Downtown D.C., Columbia Heights, U Street, NoMa, and Minnesota Avenue Station, all of which are served by bikeshare. There are a few system gaps in areas that score high in this accessibility measure, including:
Transit access points to the south of L’Enfant Plaza; Southwest D.C.; Congress Heights; and Deanwood.

Market Study September 2015
DC Capital Bikeshare Development Plan | 33
FIGURE 3-8 | ACCESSBILITY PROPENSITY MAP

Market Study September 2015
DC Capital Bikeshare Development Plan | 34
3.6 BIKESHARE SWOT ANALYSIS
Capital Bikeshare’s future growth and success depend on conditions that are supportive of bikeshare activity. This study utilizes a wide range of sources from GIS analyses to user survey results, in order to understand the needs and opportunities for growth and development within the system. To help organize and summarize the findings of this extensive data collection effort, a Strengths, Weaknesses, Opportunities and Threats (SWOT) analysis was conducted that ties the findings of this market study back to the program’s strategic goals and objectives.
This SWOT analysis identifies where the Capital Bikeshare system currently succeeds in effectively serving its markets, along with areas where the Capital Bikeshare systems presently underperforms; it also assesses factors outside Capital Bikeshare’s control that impact the program presently and/or in the future. Strengths, Weaknesses, Opportunities and Threats will be framed through the following questions:
Strengths: What are the ways bikeshare succeeds or is anticipated to succeed in serving its markets?
Weakness: What are the ways bikeshare falls behind or is anticipated to fall short in serving its markets?
Opportunity: What are opportunities bikeshare can take advantage of in future expansion? Threats: What factors pose threats or constraints on future bikeshare expansion?
Note: Each specific strength, weakness, opportunity, and threat is labeled with an identifying number for easier reference. Each finding will be labeled with an “s”, “w”, “o”, or “t” followed by one digit representing the goal related to that finding.
Why a SWOT Analysis?
A SWOT Analysis is a strategic planning method used to evaluate the strength, weaknesses, opportunities, and threats of a project or venture. It is intended to help guide development and prioritization of strategic initiatives. SWOT analyses are often used in business planning to identify strategic advantages and anticipate future challenges.

Market Study September 2015
DC Capital Bikeshare Development Plan | 35
Goal 1: Ensure Bikeshare is a Valued Part of the District's Transportation System for All Users
How well does Capital Bikeshare connect and complement the District’s Metrorail and bus network?
14 Southern Avenue and Capitol Heights Metrorail Stations are included in this count of 42 metro stations in DC even though the stations are across the DC line in Maryland because they serve DC residents.
Characteristics of Capital Bikeshare Today Factors Impacting Capital Bikeshare’s Future
Strengths Weaknesses Opportunities Threats The existing bikeshare system does a good job of connecting to transit overall. Eighty-three percent of DC Metrorail stations have a bikeshare dock within 1/8th of a mile of a station entrance. 14 (S1-1)
Southern Avenue and Capitol Heights Metrorail stations do not have bikeshare docks within half a mile of the station entrances. (W1-1) The Federal Triangle Metrorail station does not have a bikeshare station within a quarter of a mile of the station’s entrance. (W1-2)
Capital Bikeshare stations would only have to serve five percent of the District’s land area to connect with 78 percent of transit riders. (O1-1) Bikeshare can provide an alternative to Metro for short trips, freeing up capacity during peak months and improving core capacity of the system. (O1-2)
Lack of bicycle infrastructure dissuades users from utilizing bikeshare to connect to other modes. (T1-1)

Market Study September 2015
DC Capital Bikeshare Development Plan | 36
Goal 2: Leverage Bikeshare to Promote a Thriving Community
How well does Capital Bikeshare promote job access, tourism, retail and entertainment spending?
15 2014 Capital Bikeshare Member Survey.
Characteristics of Capital Bikeshare Today Factors Impacting Capital Bikeshare’s Future
Strengths Weaknesses Opportunities Threats Sixty-four percent of bikeshare members reported using Capital Bikeshare to access a Metrorail station in the last month.15 (S1-2)
Poor bikeshare connections remain at some key transit locations: Major bus stops along the 70 Line on Georgia
Avenue. Woodley Park, Capitol South, Congress Heights,
and L’Enfant Plaza Metrorail station have bikeshare stations located slightly more than an eighth of a mile away and not within eyesight of the station entrance. (W1-3)
Bikeshare may provide total travel time savings over some bus trips. (O1-3) Wayfinding information within Metrorail stations and at major bus stops to direct riders to the closest bikeshare dock. (O1-4)
Ensuring that adequate space is provided in new infill development to accommodate future bikeshare stations. (T1-2)
Market Study September 2015
DC Capital Bikeshare Development Plan | 37
Characteristics of Capital Bikeshare Today Factors Impacting Capital Bikeshare’s Future
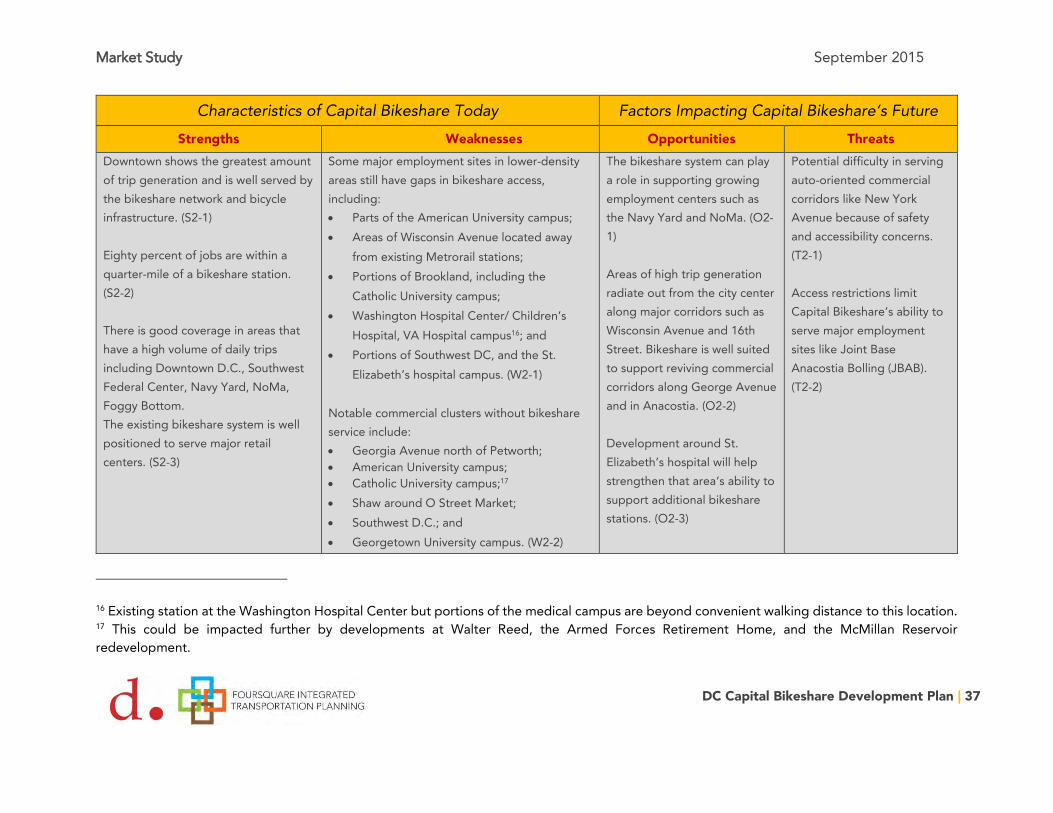
Strengths Weaknesses Opportunities Threats Downtown shows the greatest amount of trip generation and is well served by the bikeshare network and bicycle infrastructure. (S2-1) Eighty percent of jobs are within a quarter-mile of a bikeshare station. (S2-2) There is good coverage in areas that have a high volume of daily trips including Downtown D.C., Southwest Federal Center, Navy Yard, NoMa, Foggy Bottom. The existing bikeshare system is well positioned to serve major retail centers. (S2-3)
Some major employment sites in lower-density areas still have gaps in bikeshare access, including: Parts of the American University campus; Areas of Wisconsin Avenue located away
from existing Metrorail stations; Portions of Brookland, including the
Catholic University campus; Washington Hospital Center/ Children’s
Hospital, VA Hospital campus16; and Portions of Southwest DC, and the St.
Elizabeth’s hospital campus. (W2-1) Notable commercial clusters without bikeshare service include: Georgia Avenue north of Petworth; American University campus; Catholic University campus;17 Shaw around O Street Market; Southwest D.C.; and Georgetown University campus. (W2-2)
The bikeshare system can play a role in supporting growing employment centers such as the Navy Yard and NoMa. (O2-1) Areas of high trip generation radiate out from the city center along major corridors such as Wisconsin Avenue and 16th Street. Bikeshare is well suited to support reviving commercial corridors along George Avenue and in Anacostia. (O2-2) Development around St. Elizabeth’s hospital will help strengthen that area‘s ability to support additional bikeshare stations. (O2-3)
Potential difficulty in serving auto-oriented commercial corridors like New York Avenue because of safety and accessibility concerns. (T2-1) Access restrictions limit Capital Bikeshare’s ability to serve major employment sites like Joint Base Anacostia Bolling (JBAB). (T2-2)
16 Existing station at the Washington Hospital Center but portions of the medical campus are beyond convenient walking distance to this location. 17 This could be impacted further by developments at Walter Reed, the Armed Forces Retirement Home, and the McMillan Reservoir redevelopment.

Market Study September 2015
DC Capital Bikeshare Development Plan | 38
Characteristics of Capital Bikeshare Today Factors Impacting Capital Bikeshare’s Future
Strengths Weaknesses Opportunities Threats Nearly all hotel rooms and major tourist destinations are within a quarter mile of a bikeshare station. Stations located at major tourist and recreation sites contribute a high proportion of user revenue to the system. (S2-4)
National Zoo visitors who use the Woodley Park-Zoo Metrorail Station do not have a bikeshare station that is visible from the rail station entrance or enroute to the Zoo. (W2-3) No bikeshare stations serve attractions on Capitol Hill, including the Capitol Building and Library of Congress. (W2-4)
Proximity of bikeshare stations to hotels/tourist destinations and the density of bike infrastructure downtown could likely support more tourist use with continued and expanded promotion through hotels. (O2-4) Tourist sites outside of downtown that do not currently have bikeshare stations could be incorporated into the network with the addition of a few stations. (O2-5)
Restrictions on locating bikeshare on federal grounds will continue to restrict Capital Bikeshare’s ability to serve top tourist destinations. (T2-3)
Goal 3: Make People's Lives Better Through Bikeshare: How well does Capital Bikeshare expand user access to a range of destinations and attract a wide variety of users to use bikeshare to reach those destinations?
Market Study September 2015
DC Capital Bikeshare Development Plan | 39
Characteristics of Capital Bikeshare Today Factors Impacting Capital Bikeshare’s Future
Strengths Weaknesses Opportunities Threats
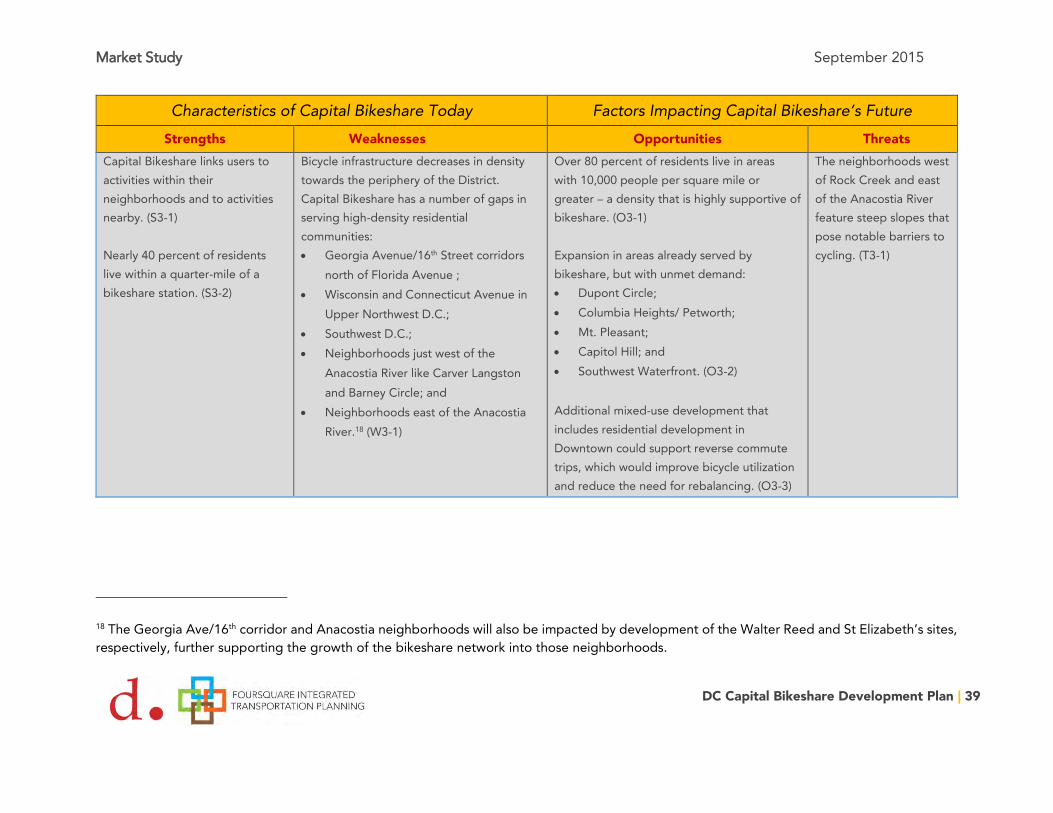
Capital Bikeshare links users to activities within their neighborhoods and to activities nearby. (S3-1) Nearly 40 percent of residents live within a quarter-mile of a bikeshare station. (S3-2)
Bicycle infrastructure decreases in density towards the periphery of the District. Capital Bikeshare has a number of gaps in serving high-density residential communities: Georgia Avenue/16th Street corridors
north of Florida Avenue ; Wisconsin and Connecticut Avenue in
Upper Northwest D.C.; Southwest D.C.; Neighborhoods just west of the
Anacostia River like Carver Langston and Barney Circle; and
Neighborhoods east of the Anacostia River.18 (W3-1)
Over 80 percent of residents live in areas with 10,000 people per square mile or greater – a density that is highly supportive of bikeshare. (O3-1) Expansion in areas already served by bikeshare, but with unmet demand: Dupont Circle; Columbia Heights/ Petworth; Mt. Pleasant; Capitol Hill; and Southwest Waterfront. (O3-2)
Additional mixed-use development that includes residential development in Downtown could support reverse commute trips, which would improve bicycle utilization and reduce the need for rebalancing. (O3-3)
The neighborhoods west of Rock Creek and east of the Anacostia River feature steep slopes that pose notable barriers to cycling. (T3-1)
18 The Georgia Ave/16th corridor and Anacostia neighborhoods will also be impacted by development of the Walter Reed and St Elizabeth’s sites, respectively, further supporting the growth of the bikeshare network into those neighborhoods.

Market Study September 2015
DC Capital Bikeshare Development Plan | 40
Characteristics of Capital Bikeshare Today Factors Impacting Capital Bikeshare’s Future
Strengths Weaknesses Opportunities Threats
Approximately 39 percent of city residents live within a quarter-mile of a bikeshare station. (S3-4) 43 percent of residents living in high population density Census Blocks are within a quarter-mile of bikeshare. (S3-5) The existing bicycle infrastructure network is well served by bikeshare. (S3-6)
The share of non-white population is higher in neighborhoods further from Downtown, where there is less coverage under the quarter-mile bikeshare buffer area. Many high poverty neighborhoods in Northeast (e.g., Trinidad) and Southeast (e.g., Congress Heights) have limited access to bikeshare. (W3-2) Members are more white (85 percent), more male (59 percent), younger (63 percent under 35), and more affluent (16 percent with household income of less than $50,000) than the general population of DC.19 (W3-4)
Expand coverage in high poverty neighborhoods in Northeast and Southeast. (O3-4) Further develop marketing and outreach programs to expand participation among low- income and minority residents in the District. (O3-5)
Some stations, concentrated east of the Anacostia River and far Northwest, have no bicycle infrastructure within a quarter-mile. (T3-1)
19 2014 Capital Bikeshare Member Survey.

Market Study September 2015
DC Capital Bikeshare Development Plan | 41
Characteristics of Capital Bikeshare Today Factors Impacting Capital Bikeshare’s Future
Strengths Weaknesses Opportunities Threats
The existing bikeshare system connects well to public service destinations within the core of the city. (S3-7 Bikeshare stations cover all locations with two or more public services and all but one Department of Human Services (DHS) center. (S3-8)
The existing Capital Bikeshare system has critical coverage gaps in areas with high obesity rates. The three Wards with above the citywide average obesity rate - Ward 5, Ward 7, and Ward 8 – have limited bikeshare system coverage.20 (W3-5) Northeast along the Prince George’s county line, east of the Anacostia River, and west of Rock Creek Park, all have poorer bikeshare connections to public service destinations. (W3-6)
Expand coverage in Ward 5, 7, and 8 to provide access to cycling in areas with high obesity rates. (O3-6)
If Prince George’s County does not join the Capital Bikeshare system, bikeshare cannot fully serve the community along the District-Prince George’s County line. (T3-2)
20 Because obesity rate data is only available at the Ward level, this analysis does not provide the complete picture of where high obesity populations live. Pockets of high obesity rates may exist in the other Wards that are not reflected in the available information.

Market Study September 2015
DC Capital Bikeshare Development Plan | 42
Goal 4: Use Effective Management and Decision Making to Guarantee System Sustainability
Is Capital Bikeshare growing in a fiscally responsible and sustainable manner?
Characteristics of Capital Bikeshare Today Factors Impacting Capital Bikeshare’s Future
Strengths Weaknesses Opportunities Threats
Sustained annual ridership growth since program inception. Some of the highest ridership stations (e.g., National Mall and Union Station) benefit from all day demand that keeps the stations below capacity. (S4-1) Five stations, all in the District, account for 21 percent of over-time minutes in the system. These high revenue generation stations are located in areas that serve tourists. (S4-2)
Many of the highest ridership stations are not necessarily the most important stations from a revenue generating standpoint. Busy commuter bikeshare stations in Downtown D.C. and nearby dense neighborhoods produce many trips, but most of these trips are short and do not incur any overtime. (W4-1) The system struggles to keep stations operational in certain areas, especially Downtown and Columbia Heights, during peak months due to high demand. (W4-2)
Opportunity to recoup lost trips is predominately in mixed-use areas of Columbia Heights, Adams Morgan, Logan Circle and Downtown. (O4-1) Rebalancing challenges could be partially addressed through innovative techniques such as variable pricing, staffed bicycle corrals, improved demand management and new technologies that allow dock-less operations. (O4-2)
Uphill neighborhoods experience a daily net-loss of bicycles to lower lying destinations. This travel pattern puts a strain on Capital Bikeshare’s rebalancing resources. (T4-1)

Market Study September 2015
DC Capital Bikeshare Development Plan | 43
3.7 CONCLUSION
The results of this market analysis illustrate a bikeshare system that has largely succeeded at serving the District’s most promising, and “lowest-hanging” core market segments for bikeshare. From a geographic perspective the current system provides good coverage in most of Washington’s higher density residential and employment centers. Major mixed-use destinations like Dupont Circle, employment centers like Downtown DC, and tourist attractions like the National Mall all feature a dense network of bikeshare stations. Bikeshare trips serve a diverse range of trip purposes and types, from recreation to commuting. The demographics of bikeshare users reflect the demographics of the District’s younger, well educated, and affluent residents.
However, the market analysis highlights a number of gaps and weaknesses in Capital Bikeshare’s existing coverage and user base. The system’s user base does not reflect the overall demographics of the District, and minority and low-income residents are under-represented among Capital Bikeshare members. While the system has grown substantially over the last five years, the system features a number of gaps that leave some potential users just beyond convenient walking distance to a bikeshare station.
For individuals with easy access to bikeshare, service reliability is a growing barrier to use. Users showed a high preference for expanding existing stations and stated dissatisfaction with the availability of bicycles and docks. Expanding the system to serve other higher-density residential areas of the city runs the risk of further straining peak-period station dock capacity by adding to the number of trips ending in downtown DC.
The results of the market study highlight a system that has only a handful of easily apparent service gaps in high priority areas, but a number of opportunities for more targeted expansion to fill in service gaps, support public service goals, and better serve a more diverse user base. Future expansion opportunities are in neighborhoods where building Capital Bikeshare ridership will require a nuanced approach that requires not just installing new stations, but requires improved outreach and marketing about the system.
Expansion Plan September 2015
DC Capital Bikeshare Development Plan | 44
4 Program Expansion Plan
The market study allowed the study team to better understand where the greatest need exists for bikeshare in the District. Yet the question remains, how should the system expand and grow over time? This section seeks to answer that question by outlining a strategy for program growth and expansion. The team began by developing three scenarios that show the impacts of various expansion strategies. From there, a set of expansion planning criteria and an expansion plan were developed.
It is important to note that all the expansion scenarios and financial projections rely upon a snapshot of current system performance, land-use patterns, and basic cost structure. As these inputs change over time, so should the District’s expansion strategy.
4.1 SCENARIO PLANNING
As part of the DDOT Bikeshare Development Plan, the project team conducted a scenario analysis to better understand the estimated impact of three expansion strategies on overall program finances and ridership. The scenarios help illustrate the long term capital and operating costs of different expansion strategies and will allow the project team to move forward to formulate a final expansion plan.
The three scenarios included in the study are:
Scenario 1: Baseline Expansion – Scenario One is the “do nothing” scenario. It assumes no additional stations will be added to the system. Ridership and revenue growth will solely come from year-over-year increases in station utilization. This scenario will still feature large capital needs in the future to support the replacement of stations and bicycles.
Scenario 2: Balanced Expansion – Scenario 2 relies heavily on the results of the bikeshare market study (see Section 3). Stations are located only in areas that show a high demand for bikeshare stations in the four aggregate propensity maps developed in the market study: high ridership demand, high revenue potential, high public health and welfare impacts, and high accessibility. The projected system is sized to completely cover all areas that show high demand under these four measures but are not within a quarter mile of a bikeshare station. To account for increased demand of stations in the District’s downtown core (shown on Figures 4-1 and 4-2), this scenario also assumes that for every 10 docks of

Expansion Plan September 2015
DC Capital Bikeshare Development Plan | 45
expansion outside Downtown, 4 docks of capacity will be added in the core through station expansion and new stations21. The scenario assumes a 5-year build out.
Scenario 3: Aggressive Expansion – Scenario 3 projects out the expansion necessary to place all parts of the District with a residential population density of 10,000 people per square mile or greater within a quarter mile of a bikeshare station. Scenario 3 would exceed moveDC’s goal of having 75 percent of the city’s population within a quarter mile of a bikeshare station. Like with Scenario 2, any expansion outside the downtown core would be matched at a 10:4 dock ratio with additional core capacity. The scenario assumes a 5-year build out.
4.1.1 Development of Each Scenario Defining Market Typologies Each scenario uses a common financial and ridership model, but varies two factors: The number of total stations in each year and ridership profile of those stations. Using the market analysis as a guide, the District was divided into three market typologies: High Ridership, Accessibility, and High Revenue areas. High ridership areas are locations that show high commuter demand for bikeshare throughout the year. These areas are categorized by high ridership rates, low casual usage, and a smaller (but still significant) decline in ridership between the warmer and cooler months of the year than the other two typologies. High revenue locations are places that have high tourist demand. These locations are categorized by very high casual use and ridership during peak months. Ridership drops off substantially during the winter in these markets. Finally, Accessibility areas cover the parts of the city that do not fall into the previous two categories. These areas are categorized by low casual use rates and lower overall ridership. Figures 4-1 and 4-2 show the locations of these three market typologies.
For each typology the team defined the daily trip rate per bike as well as the proportion of casual to registered users. These rates were calculated based on statistics of existing stations that fall into each typology. Finally a system-wide average was calculated to forecast ridership within the existing bikeshare system.
21 Ratio calculated based on the net loss of trips to the downtown core during the AM peak. 50 percent of additional core capacity will be accomplished through station expansion and 50 percent through additional stations.
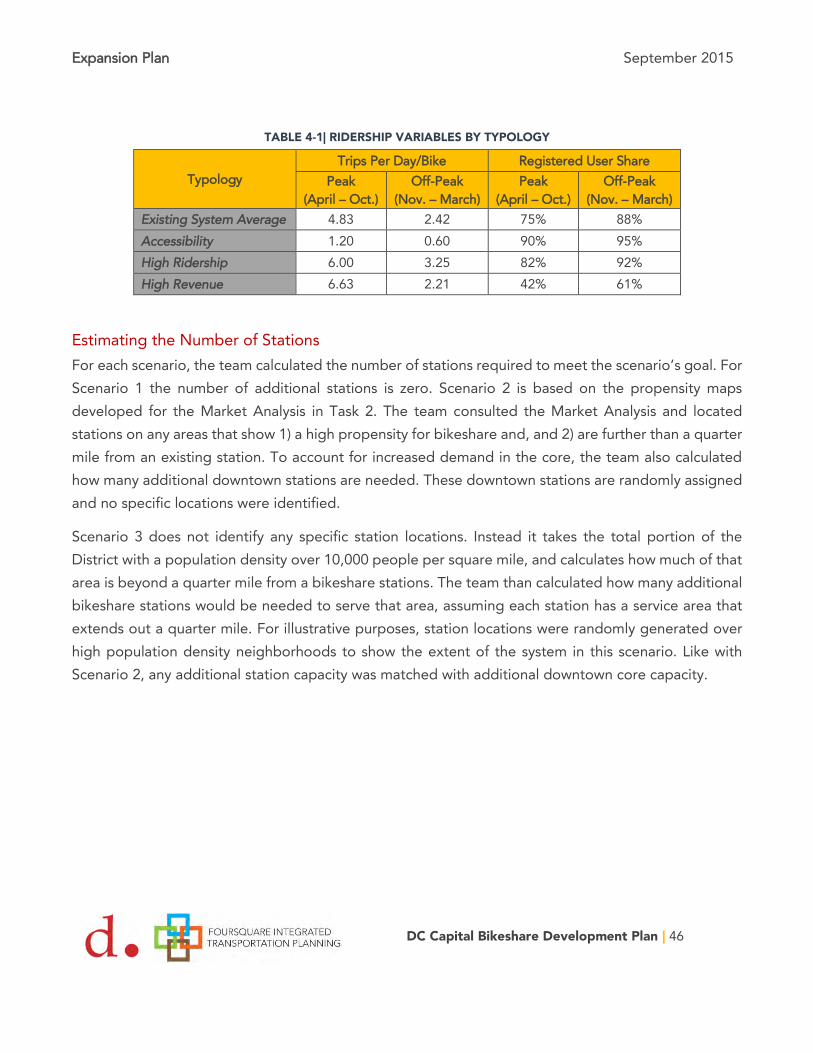
Expansion Plan September 2015
DC Capital Bikeshare Development Plan | 46
TABLE 4-1| RIDERSHIP VARIABLES BY TYPOLOGY
Typology Trips Per Day/Bike Registered User Share
Peak (April – Oct.)
Off-Peak (Nov. – March)
Peak (April – Oct.)
Off-Peak (Nov. – March)
Existing System Average 4.83 2.42 75% 88% Accessibility 1.20 0.60 90% 95% High Ridership 6.00 3.25 82% 92% High Revenue 6.63 2.21 42% 61%
Estimating the Number of Stations For each scenario, the team calculated the number of stations required to meet the scenario’s goal. For Scenario 1 the number of additional stations is zero. Scenario 2 is based on the propensity maps developed for the Market Analysis in Task 2. The team consulted the Market Analysis and located stations on any areas that show 1) a high propensity for bikeshare and, and 2) are further than a quarter mile from an existing station. To account for increased demand in the core, the team also calculated how many additional downtown stations are needed. These downtown stations are randomly assigned and no specific locations were identified.
Scenario 3 does not identify any specific station locations. Instead it takes the total portion of the District with a population density over 10,000 people per square mile, and calculates how much of that area is beyond a quarter mile from a bikeshare stations. The team than calculated how many additional bikeshare stations would be needed to serve that area, assuming each station has a service area that extends out a quarter mile. For illustrative purposes, station locations were randomly generated over high population density neighborhoods to show the extent of the system in this scenario. Like with Scenario 2, any additional station capacity was matched with additional downtown core capacity.

Expansion Plan September 2015
DC Capital Bikeshare Development Plan | 47
FIGURE 4-1 | SCENARIO 2 DISTRIBUTION OF STATIONS (FOR ILLUSTRATIVE PURPOSES ONLY)
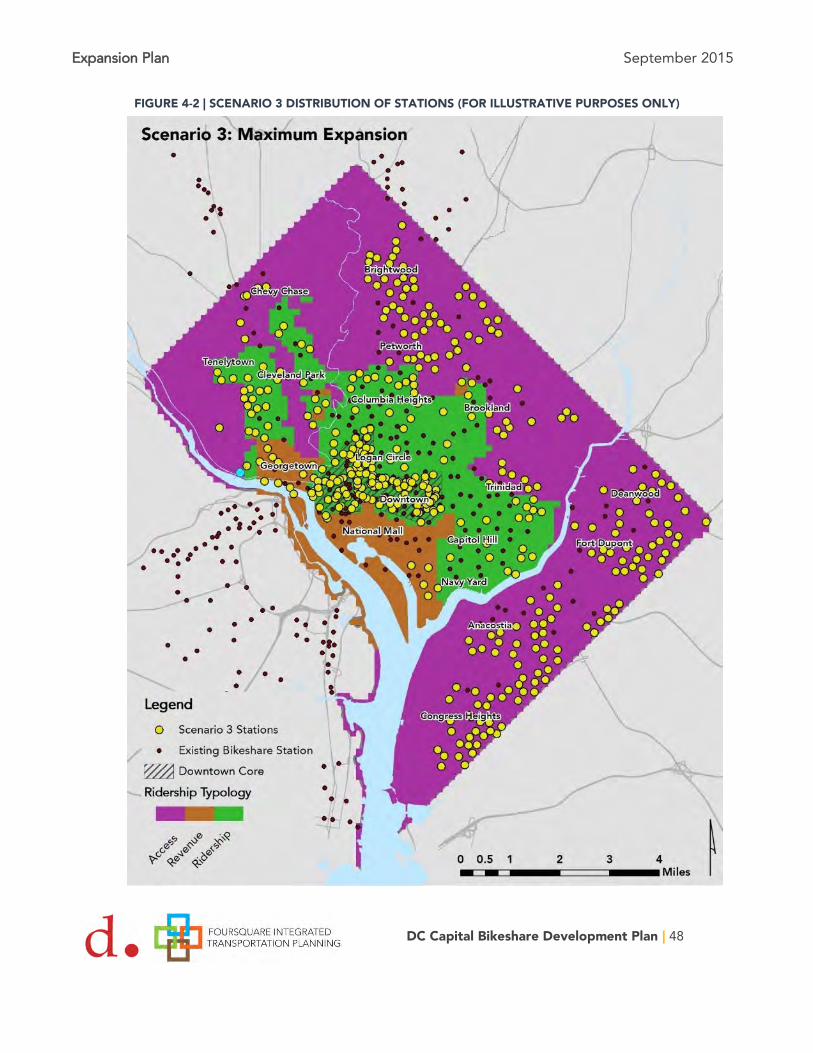
Expansion Plan September 2015
DC Capital Bikeshare Development Plan | 48
FIGURE 4-2 | SCENARIO 3 DISTRIBUTION OF STATIONS (FOR ILLUSTRATIVE PURPOSES ONLY)

Expansion Plan September 2015
DC Capital Bikeshare Development Plan | 49
TABLE 4-2 | EXPANSION BY SCENARIO (TOTAL OVER 5-YEARS)
Scenario 1 Scenario 2 Scenario 3 Access Stations 0 26 205 Revenue Stations 0 7 17 Ridership Stations (Outside Core) 0 17 77 Core Stations 0 10 60 Total Stations 0 62 359 Core Expansion Plates (4 Docks) 0 38 225
4.1.2 Summary of Analysis Results Operating Costs and Deficit The baseline scenario shows that the District’s Capital Bikeshare program faces an ongoing operating deficit moving forward. The program should expect a gradual improvement in the cost recovery ratio if bi-annual fee increases are indexed to inflation.
Scenario Two has a nearly identical cost recovery rate per year as the Baseline Scenario. Because overall operating costs in this scenario will be higher, the actual size of the deficit would be nearly 50 percent greater by FY2021 than the Baseline Scenario.
Scenario Three would lead to a cost recovery rate that stays relatively stable at 67 to 68 percent. Because of the ambitious system expansion however, the operating deficit would grow over time, reaching $6.4 million per year by FY2021.
TABLE 4-3 | SCENARIO OPERATING COST SUMMARY*
FY2016 FY2017 FY2018 FY2019** FY2020 FY2021 Baseline Scenario
Ridership 2,530,000 2,633,000 2,730,000 2,840,000 2,960,000 3,070,000
Revenue $4,920,000 $5,280,000 $5,470,000 $6,880,000 $6,100,000 $6,560,000
Costs $6,520,000 $6,720,000 $6,920,000 $7,130,000 $7,340,000 $7,560,000
Operating Balance -$1,600,000 -$1,440,000 -$1,450,000 -$250,000 -$1,240,000 -$1,000,000
Cost Recovery Rate
75% 79% 79% 96% 83% 87%
Scenario 2
Ridership 2,610,000 2,850,000 3,100,000 3,370,000 3,630,000 3,810,000
Revenue $5,090,000 $5,720,000 $6,200,000 $7,950,000 $7,470,000 $8,110,000
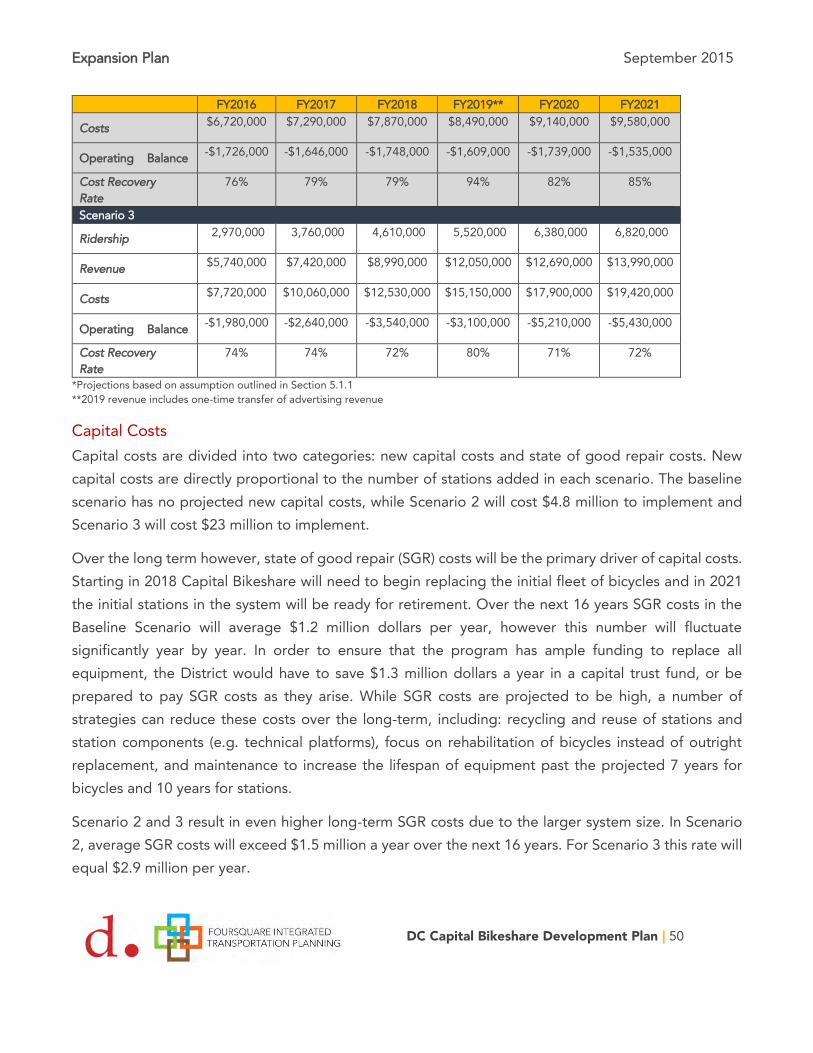
Expansion Plan September 2015
DC Capital Bikeshare Development Plan | 50
FY2016 FY2017 FY2018 FY2019** FY2020 FY2021
Costs $6,720,000 $7,290,000 $7,870,000 $8,490,000 $9,140,000 $9,580,000
Operating Balance -$1,726,000 -$1,646,000 -$1,748,000 -$1,609,000 -$1,739,000 -$1,535,000
Cost Recovery Rate
76% 79% 79% 94% 82% 85%
Scenario 3
Ridership 2,970,000 3,760,000 4,610,000 5,520,000 6,380,000 6,820,000
Revenue $5,740,000 $7,420,000 $8,990,000 $12,050,000 $12,690,000 $13,990,000
Costs $7,720,000 $10,060,000 $12,530,000 $15,150,000 $17,900,000 $19,420,000
Operating Balance -$1,980,000 -$2,640,000 -$3,540,000 -$3,100,000 -$5,210,000 -$5,430,000
Cost Recovery Rate
74% 74% 72% 80% 71% 72%
*Projections based on assumption outlined in Section 5.1.1
**2019 revenue includes one-time transfer of advertising revenue
Capital Costs Capital costs are divided into two categories: new capital costs and state of good repair costs. New capital costs are directly proportional to the number of stations added in each scenario. The baseline scenario has no projected new capital costs, while Scenario 2 will cost $4.8 million to implement and Scenario 3 will cost $23 million to implement.
Over the long term however, state of good repair (SGR) costs will be the primary driver of capital costs. Starting in 2018 Capital Bikeshare will need to begin replacing the initial fleet of bicycles and in 2021 the initial stations in the system will be ready for retirement. Over the next 16 years SGR costs in the Baseline Scenario will average $1.2 million dollars per year, however this number will fluctuate significantly year by year. In order to ensure that the program has ample funding to replace all equipment, the District would have to save $1.3 million dollars a year in a capital trust fund, or be prepared to pay SGR costs as they arise. While SGR costs are projected to be high, a number of strategies can reduce these costs over the long-term, including: recycling and reuse of stations and station components (e.g. technical platforms), focus on rehabilitation of bicycles instead of outright replacement, and maintenance to increase the lifespan of equipment past the projected 7 years for bicycles and 10 years for stations.
Scenario 2 and 3 result in even higher long-term SGR costs due to the larger system size. In Scenario 2, average SGR costs will exceed $1.5 million a year over the next 16 years. For Scenario 3 this rate will equal $2.9 million per year.
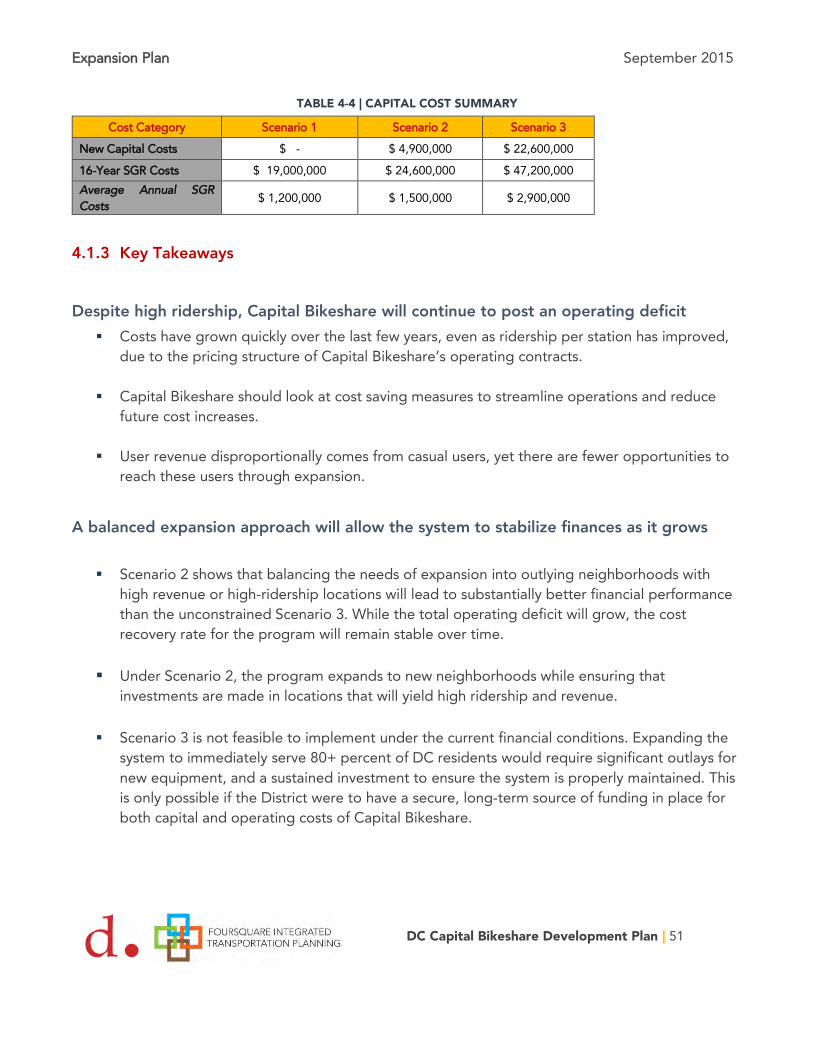
Expansion Plan September 2015
DC Capital Bikeshare Development Plan | 51
TABLE 4-4 | CAPITAL COST SUMMARY
Cost Category Scenario 1 Scenario 2 Scenario 3
New Capital Costs $ - $ 4,900,000 $ 22,600,000
16-Year SGR Costs $ 19,000,000 $ 24,600,000 $ 47,200,000 Average Annual SGR Costs
$ 1,200,000 $ 1,500,000 $ 2,900,000
4.1.3 Key Takeaways
Despite high ridership, Capital Bikeshare will continue to post an operating deficit Costs have grown quickly over the last few years, even as ridership per station has improved,
due to the pricing structure of Capital Bikeshare’s operating contracts.
Capital Bikeshare should look at cost saving measures to streamline operations and reduce future cost increases.
User revenue disproportionally comes from casual users, yet there are fewer opportunities to
reach these users through expansion.
A balanced expansion approach will allow the system to stabilize finances as it grows
Scenario 2 shows that balancing the needs of expansion into outlying neighborhoods with high revenue or high-ridership locations will lead to substantially better financial performance than the unconstrained Scenario 3. While the total operating deficit will grow, the cost recovery rate for the program will remain stable over time.
Under Scenario 2, the program expands to new neighborhoods while ensuring that
investments are made in locations that will yield high ridership and revenue.
Scenario 3 is not feasible to implement under the current financial conditions. Expanding the system to immediately serve 80+ percent of DC residents would require significant outlays for new equipment, and a sustained investment to ensure the system is properly maintained. This is only possible if the District were to have a secure, long-term source of funding in place for both capital and operating costs of Capital Bikeshare.
Expansion Plan September 2015
DC Capital Bikeshare Development Plan | 52
The DDOT study team has concluded that an approach similar to that outlined in Scenario 2 is the best strategy to develop the system. A final expansion plan that builds upon the basic approach of this scenario is presented in Section 4.3.
4.2 RECOMMENDED EXPANSION CRITERIA
The Market Study (Section 3) and Scenario Planning exercise (Section 4.1) provide DDOT a better understanding of the trade-offs inherent in different system expansion strategies. In creating a final expansion plan, the study team felt it was important to develop a set of criteria to guide the proposed expansion of Capital Bikeshare over the next five years.
Expansion criteria allow DDOT to ensure future expansion meets the program’s strategic goals and objectives. The criteria structure to how the District will decide where future bikeshare investments will occur. As this plan is a living document, it will also allow the District to respond to future concerns or on-the-ground impacts, without compromising the integrity of the program’s finances and strategic objectives.
4.2.1 Policy 1: Balance between Station Typologies As a publicly-funded program, Capital Bikeshare has a duty to serve the public good. The desire to expand the system and provide stations in new neighborhoods can sometimes run counter to what is optimal for the program’s financial well-being. Bikeshare usage rates differ widely across the city, with some areas featuring a much higher rate of ridership than others. The planning team recommends that DDOT establish a station expansion policy that balances stations by type of location. The DDOT development plan breaks down the city into three market areas: High Ridership, High Revenue, and Accessibility (see Section 4.1). Stations located in each of these three markets are expected to have different ridership characteristics and revenue generating potential.
DDOT’s goals and objectives for Capital Bikeshare help guide the creation of the expansion policy. The District wants to increase the importance of bikeshare in the city’s overall transportation network, diversify the program’s ridership base, and utilize bikeshare to connect residents to new opportunities. To meet these goals, the program will need to expand to new neighborhoods in the District, yet this expansion may run counter to the program’s objective to grow in a financially responsible way. In order to ensure that cost recovery rates for the program remain stable, every station added in Accessibility areas should be complemented with stations in High Revenue and High Ridership areas. Based on financial projections for the program, DDOT should target the following allocation of stations:
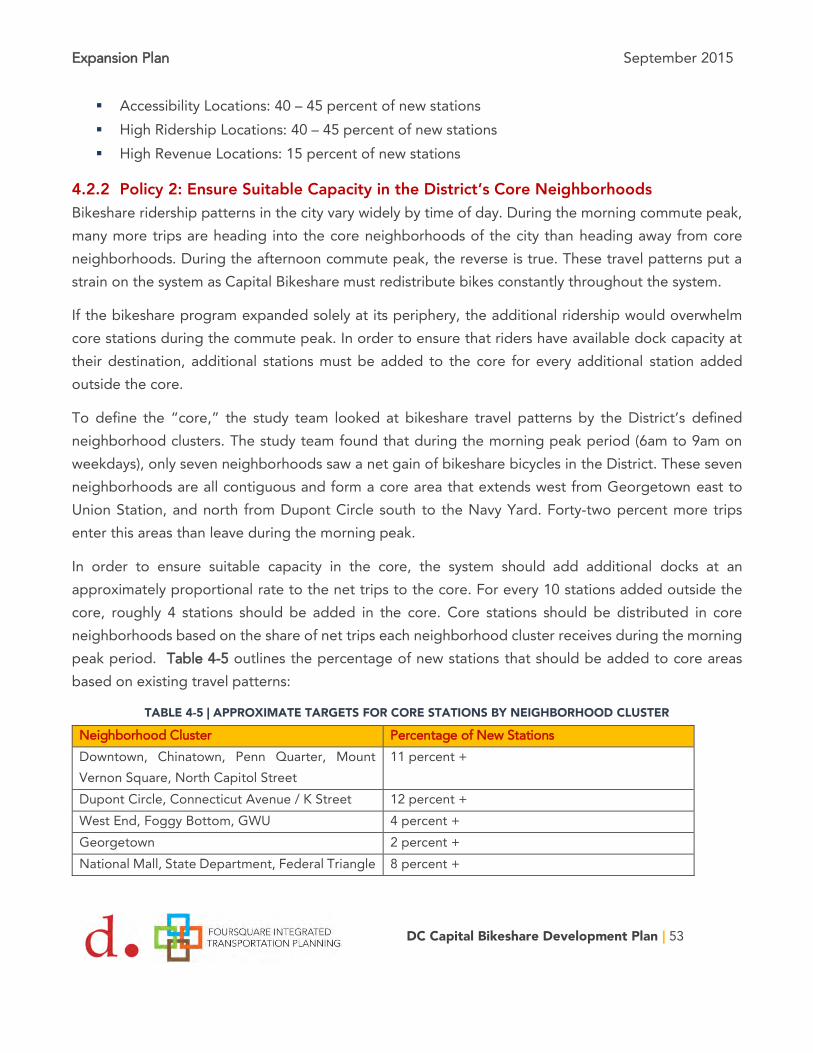
Expansion Plan September 2015
DC Capital Bikeshare Development Plan | 53
Accessibility Locations: 40 – 45 percent of new stations High Ridership Locations: 40 – 45 percent of new stations High Revenue Locations: 15 percent of new stations
4.2.2 Policy 2: Ensure Suitable Capacity in the District’s Core Neighborhoods Bikeshare ridership patterns in the city vary widely by time of day. During the morning commute peak, many more trips are heading into the core neighborhoods of the city than heading away from core neighborhoods. During the afternoon commute peak, the reverse is true. These travel patterns put a strain on the system as Capital Bikeshare must redistribute bikes constantly throughout the system.
If the bikeshare program expanded solely at its periphery, the additional ridership would overwhelm core stations during the commute peak. In order to ensure that riders have available dock capacity at their destination, additional stations must be added to the core for every additional station added outside the core.
To define the “core,” the study team looked at bikeshare travel patterns by the District’s defined neighborhood clusters. The study team found that during the morning peak period (6am to 9am on weekdays), only seven neighborhoods saw a net gain of bikeshare bicycles in the District. These seven neighborhoods are all contiguous and form a core area that extends west from Georgetown east to Union Station, and north from Dupont Circle south to the Navy Yard. Forty-two percent more trips enter this areas than leave during the morning peak.
In order to ensure suitable capacity in the core, the system should add additional docks at an approximately proportional rate to the net trips to the core. For every 10 stations added outside the core, roughly 4 stations should be added in the core. Core stations should be distributed in core neighborhoods based on the share of net trips each neighborhood cluster receives during the morning peak period. Table 4-5 outlines the percentage of new stations that should be added to core areas based on existing travel patterns:
TABLE 4-5 | APPROXIMATE TARGETS FOR CORE STATIONS BY NEIGHBORHOOD CLUSTER
Neighborhood Cluster Percentage of New Stations Downtown, Chinatown, Penn Quarter, Mount Vernon Square, North Capitol Street
11 percent +
Dupont Circle, Connecticut Avenue / K Street 12 percent + West End, Foggy Bottom, GWU 4 percent + Georgetown 2 percent + National Mall, State Department, Federal Triangle 8 percent +
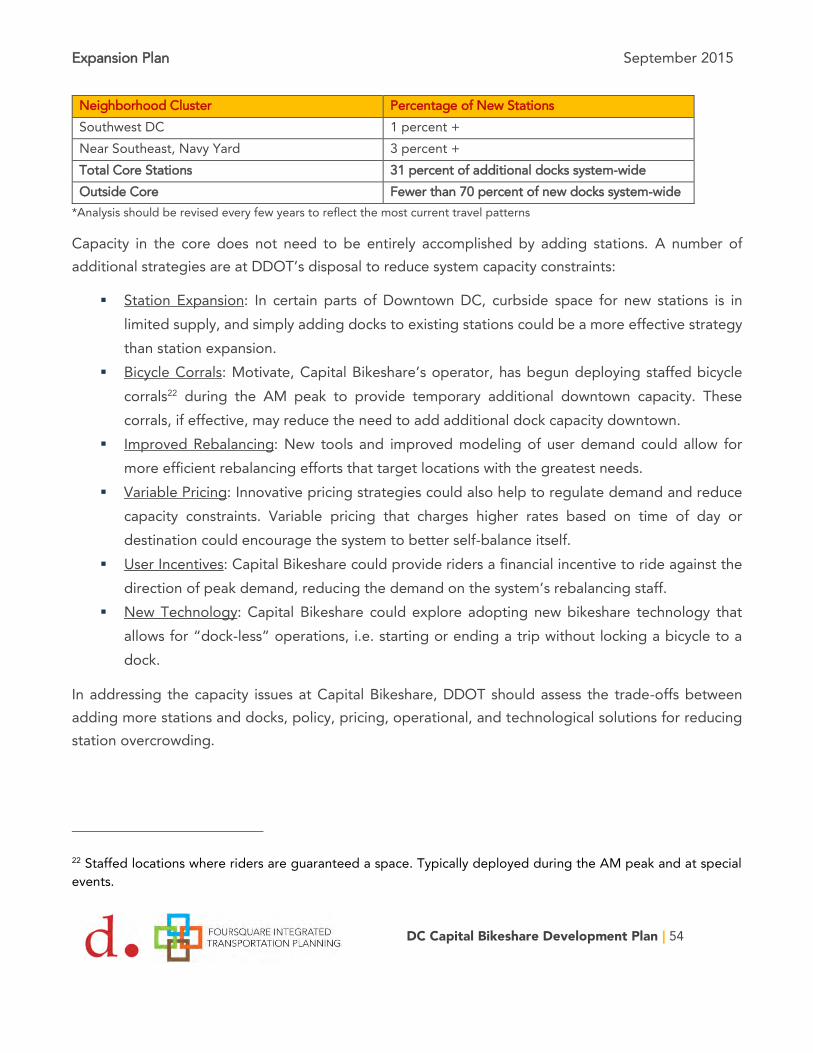
Expansion Plan September 2015
DC Capital Bikeshare Development Plan | 54
Neighborhood Cluster Percentage of New Stations Southwest DC 1 percent + Near Southeast, Navy Yard 3 percent + Total Core Stations 31 percent of additional docks system-wide Outside Core Fewer than 70 percent of new docks system-wide
*Analysis should be revised every few years to reflect the most current travel patterns
Capacity in the core does not need to be entirely accomplished by adding stations. A number of additional strategies are at DDOT’s disposal to reduce system capacity constraints:
Station Expansion: In certain parts of Downtown DC, curbside space for new stations is in limited supply, and simply adding docks to existing stations could be a more effective strategy than station expansion.
Bicycle Corrals: Motivate, Capital Bikeshare’s operator, has begun deploying staffed bicycle corrals22 during the AM peak to provide temporary additional downtown capacity. These corrals, if effective, may reduce the need to add additional dock capacity downtown.
Improved Rebalancing: New tools and improved modeling of user demand could allow for more efficient rebalancing efforts that target locations with the greatest needs.
Variable Pricing: Innovative pricing strategies could also help to regulate demand and reduce capacity constraints. Variable pricing that charges higher rates based on time of day or destination could encourage the system to better self-balance itself.
User Incentives: Capital Bikeshare could provide riders a financial incentive to ride against the direction of peak demand, reducing the demand on the system’s rebalancing staff.
New Technology: Capital Bikeshare could explore adopting new bikeshare technology that allows for “dock-less” operations, i.e. starting or ending a trip without locking a bicycle to a dock.
In addressing the capacity issues at Capital Bikeshare, DDOT should assess the trade-offs between adding more stations and docks, policy, pricing, operational, and technological solutions for reducing station overcrowding.
22 Staffed locations where riders are guaranteed a space. Typically deployed during the AM peak and at special events.

Expansion Plan September 2015
DC Capital Bikeshare Development Plan | 55
4.2.3 Policy 3: Optimize Where Station Dock Expansion Occurs The most basic metric for determining if a station has too few docking points or bicycles is how much of the day it spends entirely full or empty (i.e. downtime). If a station is unable to keep up with demand during much of the peak period, Capital Bikeshare can expand a station with docks and bicycles. However, downtime is not a perfect metric for selecting stations for expansion. Certain stations have significant downtime but also low ridership; these locations tend to have a lot of unidirectional traffic that empties or fills up the station in a short time. In such instances, additional dock capacity may be used up quickly and have a negligible effect on overall system performance.
The team recommends that DDOT prioritize additional capacity for stations that meet the following criteria:
Station has a high amount of downtime (greater than 15 percent of the day); Station has high overall ridership, indicating that additional capacity would serve the largest
number of users; or Demand at the station is not being accommodated by a new station or dock expansion at a
nearby location.
4.2.4 Policy 4: Maintain a Minimum Station Density When Possible The utility of a bikeshare system is largely determined by the number of destinations a rider can reach in a short time. Most bikeshare trips are under 3 miles and 30 minutes in duration. Denser bikeshare systems benefit from the network effect of having a greater number of convenient origin and destination pairs.
When expanding the system, the District should try to maintain a maximum distance between stations of half a mile. An even higher station density is preferable. In some instances, terrain and land uses will require the system to place stations farther than half a mile from an existing station location, but these exceptions should be rare.
When expanding the system into new parts of the District, DDOT should phase-in clusters of nearby stations over a short period of time; this will ensure that new stations are adequately connected to the rest of the bikeshare system.
4.3 RECOMMENDED SYSTEM EXPANSION PLAN
The market study conducted as part of this plan (Section 3), shows that there are extensive opportunities for expanding bikeshare in the District. Based on the Scenario Planning exercise in (Section 4.1), the
Expansion Plan September 2015
DC Capital Bikeshare Development Plan | 56
DDOT study team concluded that an approach that builds on Scenario 2 struck the best balance between achieving program goals while meeting budget constraints. Building out the system to serve all densely developed parts of the city is financially unrealistic over the next six years. Likewise, keeping the system at its current size would mean a large portion of the District’s population would remain without access to nearby bikeshare stations, and the demonstrated unmet demand within the system’s current boundaries would be left unserved.
The expansion plan recommendations in this study are presented as general quarter-mile diameter areas. In each of these circles, specific locations would have to be identified based on DDOT’s station siting criteria. The recommendations cover a six year period, however all growth is projected to occur solely between FY2016 and FY2018.
4.3.1 Methodology for Developing Recommendations The expansion plan reflects the culmination of extensive analysis conducted for the Development Plan. Financial projections, the market study, scenario exercise, planning criteria, and program goals and objectives all helped the team arrive at these recommendations. The following section outlines considerations used to develop the expansion plan recommendations:
Inclusion of Existing Committed Station Locations The team felt it was important to honor existing commitments by DDOT for future bikeshare stations. Due to procurement delays caused by the bankruptcy of Capital Bikeshare’s largest equipment supplier, DDOT was unable to procure equipment for 20 specific stations. These stations are included in the plan and scheduled to be installed in FY2016, or as soon as site-specific issues are addressed. These locations are:
MLK & St. Elizabeth’s Campus (Gate 1) MLK & St Elizabeth’s Campus (Gate 5) Alabama Avenue & Stanton Road SE L’Enfant Plaza at Banneker Circle SW 18th Street & C Street NW 18th Street & Monroe Street NE New Jersey Avenue & L Street NW Connecticut Avenue & Albermarle Street NW New Jersey Avenue and D Street SE Wisconsin Avenue & Ingomar Street NW Van Buren Street & Recreation Center NE
Expansion Plan September 2015
DC Capital Bikeshare Development Plan | 57
Piney Branch Parkway & Georgia Avenue NW 16th Street & Minnesota Avenue SE Ely Place and 37th Street / Fort Dupont Ice Rink SE 48th Street and Massachusetts Avenue NW (American University Law School) 14th Street and Irving Street NW Nannie Helen Burroughs Avenue Street and Division Avenue NE Missouri Avenue and Georgia Avenue NW 901 D Street NE 1401 New York Avenue NE
Financial Constraints While the team did not identify specific dollar-figure financial constraints, DDOT concluded that based on existing funding sources for Capital Bikeshare, the program can realistically expand by up to 100 to 110 stations by FY2021 (fewer than 100 if some existing stations are expanded as well).
Phasing of Stations The expansion plan covers a three year period from FY2016 to FY2018. While the financial plan continues to FY2021, no expansion is planned for after FY2018. DDOT currently projects to have funding for between 40 and 50 new stations in FY2016. The plan makes a final assumption of 47 new stations and eight expansions of existing stations. Twenty of the new stations will be at already committed locations.
After FY2016, stations expansion will slow down to 27 station in FY2017 and 25 stations in FY2018. Condensing expansion into three years will allow DDOT to quickly expand to fill identified system gaps and reassess broader system performance when State of Good Repair costs begin to accrue.
Location Criteria The final expansion plan primarily tries to achieve full coverage in all areas that showed a high bikeshare need under the four propensity maps. These areas are colored in red and orange in Figures 3-5 to 3-8. Adjustments were made so that the recommendations conformed to the proposed planning criteria. For example, additional stations were added to the core area and recommendations tried to focus on creating coherent clusters of stations.
Dock Expansion In some instances, the team identified existing stations where dock expansion would be more effective than placing a nearby station. These locations were identified based on the “lost trip” calculation
Expansion Plan September 2015
DC Capital Bikeshare Development Plan | 58
discussed in the market study (see Section 3 or Appendix B). Locations with 1) a high rate of lost trips and 2) no suitable alternative station nearby were candidates for expansion. For planning purposes, the study assumed that stations only expand by four or eight docks and half as many bicycles. Any station with the equivalent of 600 lost trips or less a month received a four dock expansion, while stations with a lost trip rate greater than 600, expanded by eight docks. All expansions are scheduled for FY2016 and FY2017.
4.3.2 Overview of Expansion The Development Plan strives to expand the bikeshare system across Washington D.C. in a deliberate and well-planned manner. The expansion plan calls for 99 additional bikeshare stations and expansion of 21 existing stations. The phasing of stations is designed to ensure that new stations are within easy bicycling distance of other bikeshare stations. Most of Capital Bikeshare’s expansion into new neighborhoods will therefore occur as clusters of stations intended to come online around the same time.
The overall expansion plan accomplishes two strategic objectives: it provides more neighborhoods with bikeshare access while building up system capacity and filling gaps in parts of the District where Capital Bikeshare is already available. The plan proposes a significant expansion of Capital Bikeshare east of the Anacostia River as far as the District’s southern border with Prince George’s County. New infill stations will make the system more convenient in neighborhoods like Columbia Heights where bikeshare has proven very successful.
During every fiscal year through FY2018, expansion in outlining areas will be matched by additional stations in the District’s core. A total of 28 stations are planned for the core area, as opposed to 71 stations outside the core. The proposed expansion will occur near or on the National Mall, within Foggy Bottom / West End, Dupont Circle, and Downtown DC. The capacity analysis identified especially high demand for bikeshare near Farragut Square.
In addition to the 99 planned new stations, 21 existing stations will be expanded (space permitting), including nine in the core area and 12 in outlying parts of the city. Expansion should improve the availability of bicycles at critical hubs in the Capital Bikeshare system such as near U Street Metro, Logan Circle at P Street, and Dupont Circle. Expansion in the core area will occur in FY2016 with all other station expansions completed by FY2017. Actual station expansion conducted by DDOT will likely vary from the recommendations based on additional siting analyses.
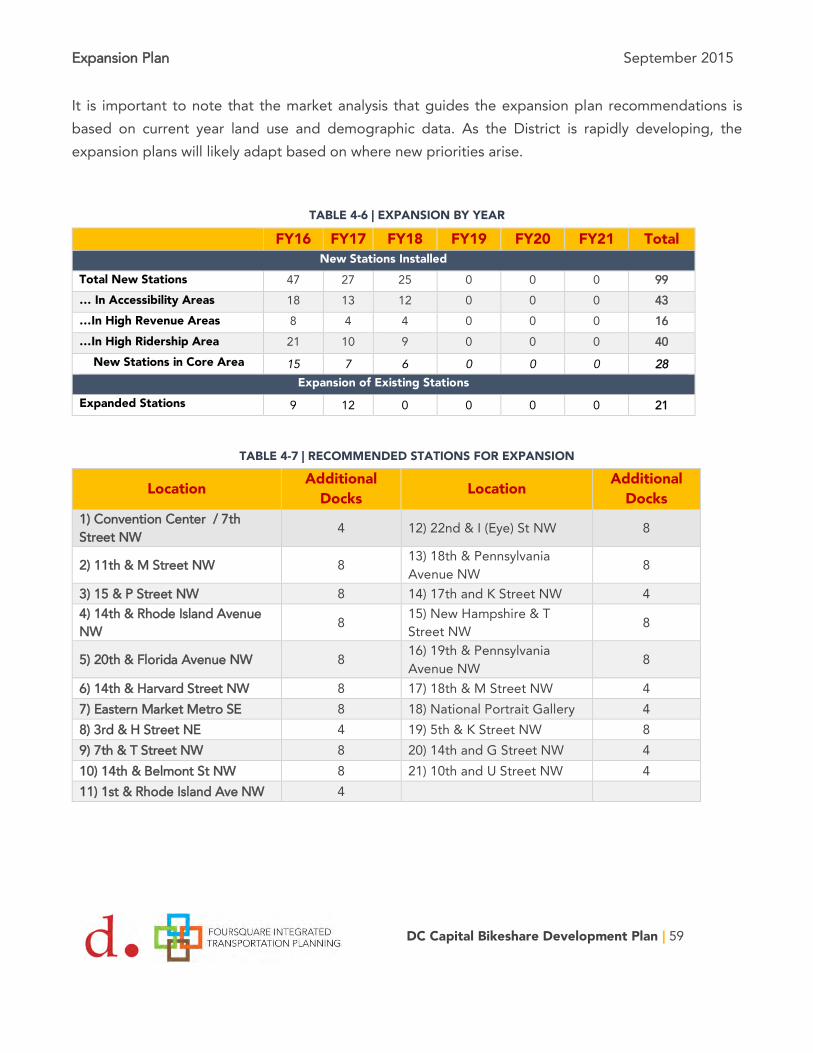
Expansion Plan September 2015
DC Capital Bikeshare Development Plan | 59
It is important to note that the market analysis that guides the expansion plan recommendations is based on current year land use and demographic data. As the District is rapidly developing, the expansion plans will likely adapt based on where new priorities arise.
TABLE 4-6 | EXPANSION BY YEAR
FY16 FY17 FY18 FY19 FY20 FY21 Total New Stations Installed
Total New Stations 47 27 25 0 0 0 99
… In Accessibility Areas 18 13 12 0 0 0 43
…In High Revenue Areas 8 4 4 0 0 0 16
…In High Ridership Area 21 10 9 0 0 0 40
New Stations in Core Area 15 7 6 0 0 0 28 Expansion of Existing Stations
Expanded Stations 9 12 0 0 0 0 21
TABLE 4-7 | RECOMMENDED STATIONS FOR EXPANSION
Location Additional Docks Location
Additional Docks
1) Convention Center / 7th Street NW
4 12) 22nd & I (Eye) St NW 8
2) 11th & M Street NW 8 13) 18th & Pennsylvania Avenue NW
8
3) 15 & P Street NW 8 14) 17th and K Street NW 4 4) 14th & Rhode Island Avenue NW
8 15) New Hampshire & T Street NW
8
5) 20th & Florida Avenue NW 8 16) 19th & Pennsylvania Avenue NW
8
6) 14th & Harvard Street NW 8 17) 18th & M Street NW 4 7) Eastern Market Metro SE 8 18) National Portrait Gallery 4 8) 3rd & H Street NE 4 19) 5th & K Street NW 8 9) 7th & T Street NW 8 20) 14th and G Street NW 4 10) 14th & Belmont St NW 8 21) 10th and U Street NW 4 11) 1st & Rhode Island Ave NW 4
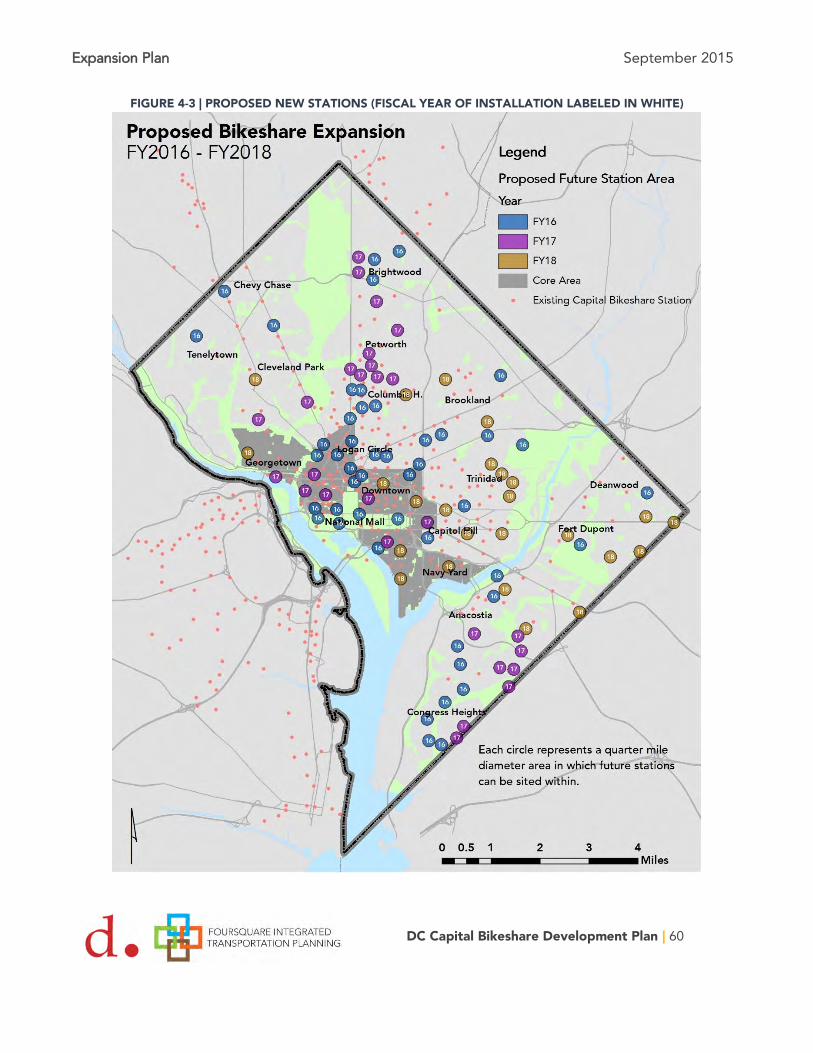
Expansion Plan September 2015
DC Capital Bikeshare Development Plan | 60
FIGURE 4-3 | PROPOSED NEW STATIONS (FISCAL YEAR OF INSTALLATION LABELED IN WHITE)
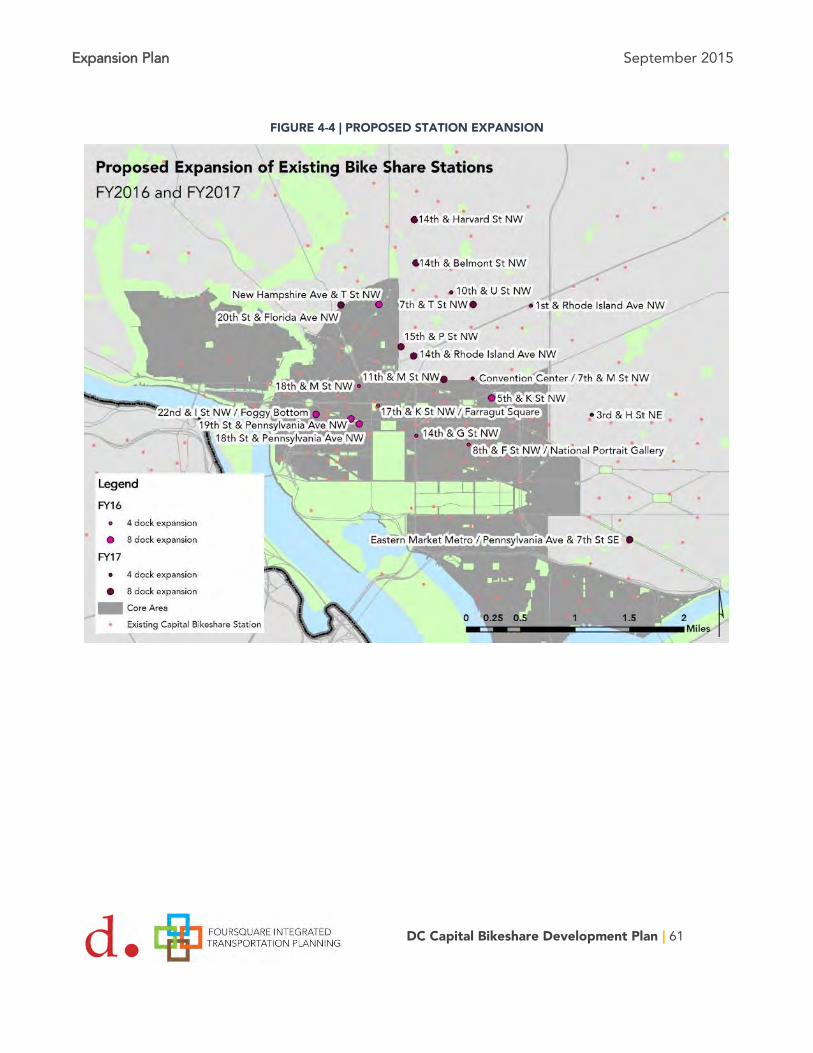
Expansion Plan September 2015
DC Capital Bikeshare Development Plan | 61
FIGURE 4-4 | PROPOSED STATION EXPANSION
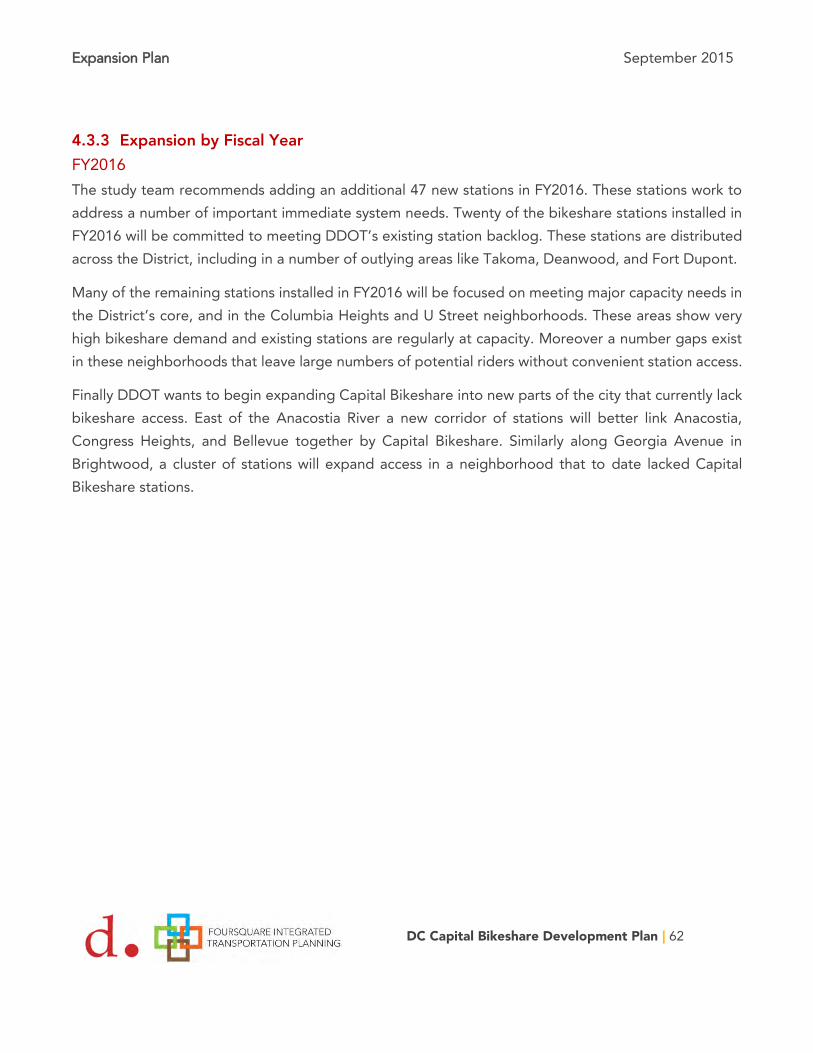
Expansion Plan September 2015
DC Capital Bikeshare Development Plan | 62
4.3.3 Expansion by Fiscal Year FY2016 The study team recommends adding an additional 47 new stations in FY2016. These stations work to address a number of important immediate system needs. Twenty of the bikeshare stations installed in FY2016 will be committed to meeting DDOT’s existing station backlog. These stations are distributed across the District, including in a number of outlying areas like Takoma, Deanwood, and Fort Dupont.
Many of the remaining stations installed in FY2016 will be focused on meeting major capacity needs in the District’s core, and in the Columbia Heights and U Street neighborhoods. These areas show very high bikeshare demand and existing stations are regularly at capacity. Moreover a number gaps exist in these neighborhoods that leave large numbers of potential riders without convenient station access.
Finally DDOT wants to begin expanding Capital Bikeshare into new parts of the city that currently lack bikeshare access. East of the Anacostia River a new corridor of stations will better link Anacostia, Congress Heights, and Bellevue together by Capital Bikeshare. Similarly along Georgia Avenue in Brightwood, a cluster of stations will expand access in a neighborhood that to date lacked Capital Bikeshare stations.
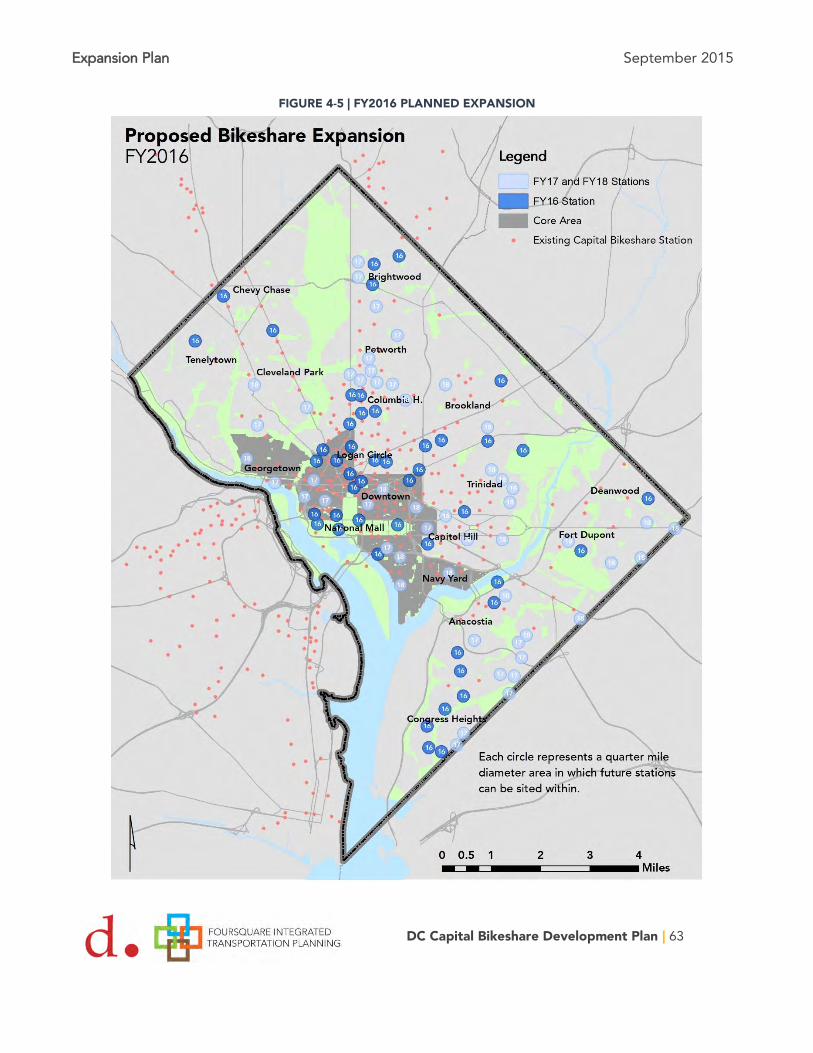
Expansion Plan September 2015
DC Capital Bikeshare Development Plan | 63
FIGURE 4-5 | FY2016 PLANNED EXPANSION

Expansion Plan September 2015
DC Capital Bikeshare Development Plan | 64
FY2017 In FY2017 DDOT proposes to expand Capital Bikeshare by 27 new stations. This expansion will focus on expanding into areas adjacent to where the system expanded in FY2016. New stations in Columbia Heights and Petworth will help serve densely developed residential areas. Additional stations in Petworth, Brightwood Park, and Brightwood, will provide Capital Bikeshare stations every quarter to half mile along the Georgia Avenue and 14th Street corridors.
East of the Anacostia River, new stations will open up in dense residential areas along Southern Avenue, providing bikeshare connections within convenient walking distance of the Southern Avenue Metro station. This expansion will build off of FY2016 expansion in Congress Heights and help expand Capital Bikeshare to a large part of the District that currently lacks bikeshare.
Finally in FY2017, DDOT proposes to expand the system in high demand locations within the city’s Downtown core. Notably, a number of stations will serve areas with high tourist demand such as the Georgetown waterfront, Woodley Park Metro station, and Capitol Hill.

Expansion Plan September 2015
DC Capital Bikeshare Development Plan | 65
FIGURE 4-6 | FY2017 PLANNED EXPANSION

Expansion Plan September 2015
DC Capital Bikeshare Development Plan | 66
FY2018 In FY2018 DDOT will complete the proposed expansion with 25 new stations. A large cluster of stations will be placed in neighborhoods east of the Anacostia River such as Deanwood, Capitol Heights, Lincoln Heights, Benning Ridge, and Fairfax Village. These additional bikeshare locations will serve important nodes in these neighborhoods and large residential populations.
Southeast and Northeast DC are another focus area for expansion in FY2018. The plan will focus on filling in system gaps in Capitol Hill and the H Street Corridor. The Carter-Langston neighborhood, an area that scored high in the propensity analysis, will see its first bikeshare stations.
Finally, a number of stations will be placed in strategic locations across the District to fill in any high-priority remaining needs. A new station in Brookland will improve access to the National Basilica and Catholic University. Two stations in Southwest DC will improve access to federal jobs and new development on the Southwest Waterfront. An additional station on Wisconsin Avenue will better serve Cathedral Heights, while a station in Georgetown will provide bikeshare access to the Georgetown Medical Center and University campus.

Expansion Plan September 2015
DC Capital Bikeshare Development Plan | 67
FIGURE 4-7 | FY2018 EXPANSION
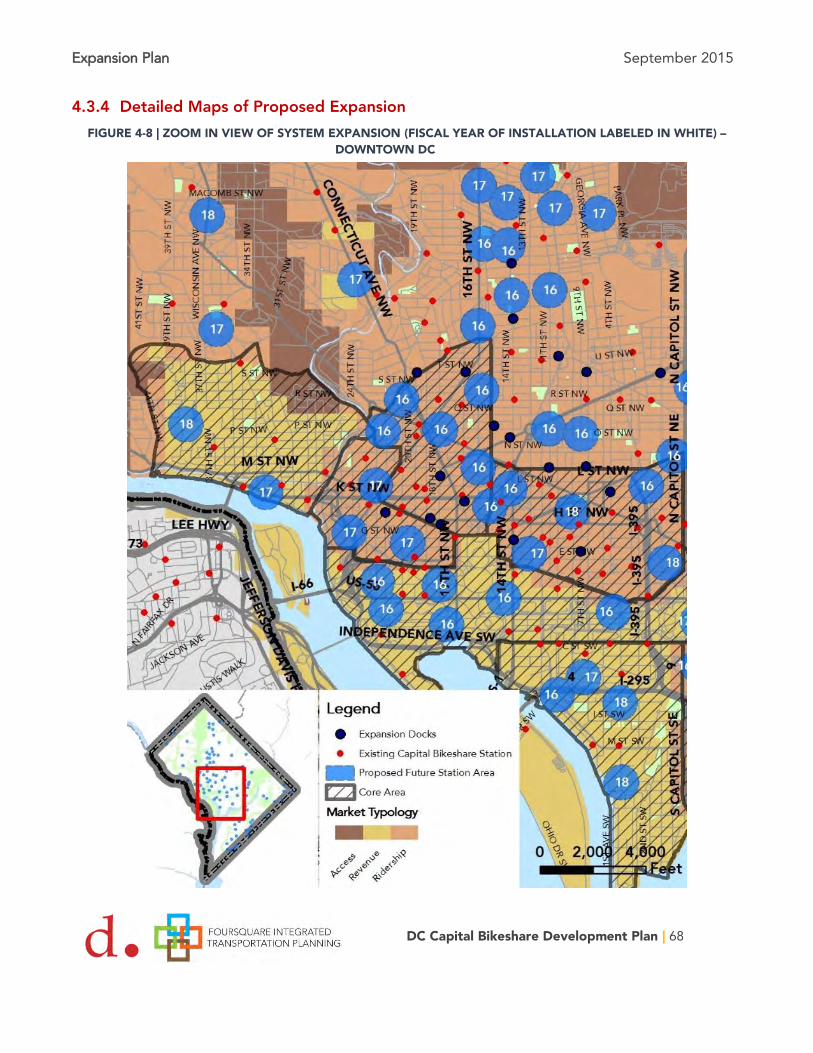
Expansion Plan September 2015
DC Capital Bikeshare Development Plan | 68
4.3.4 Detailed Maps of Proposed Expansion FIGURE 4-8 | ZOOM IN VIEW OF SYSTEM EXPANSION (FISCAL YEAR OF INSTALLATION LABELED IN WHITE) –
DOWNTOWN DC

Expansion Plan September 2015
DC Capital Bikeshare Development Plan | 69
FIGURE 4-9 | ZOOM IN VIEW OF SYSTEM EXPANSION (FISCAL YEAR OF INSTALLATION LABELED IN WHITE) – WEST OF ROCK CREEK
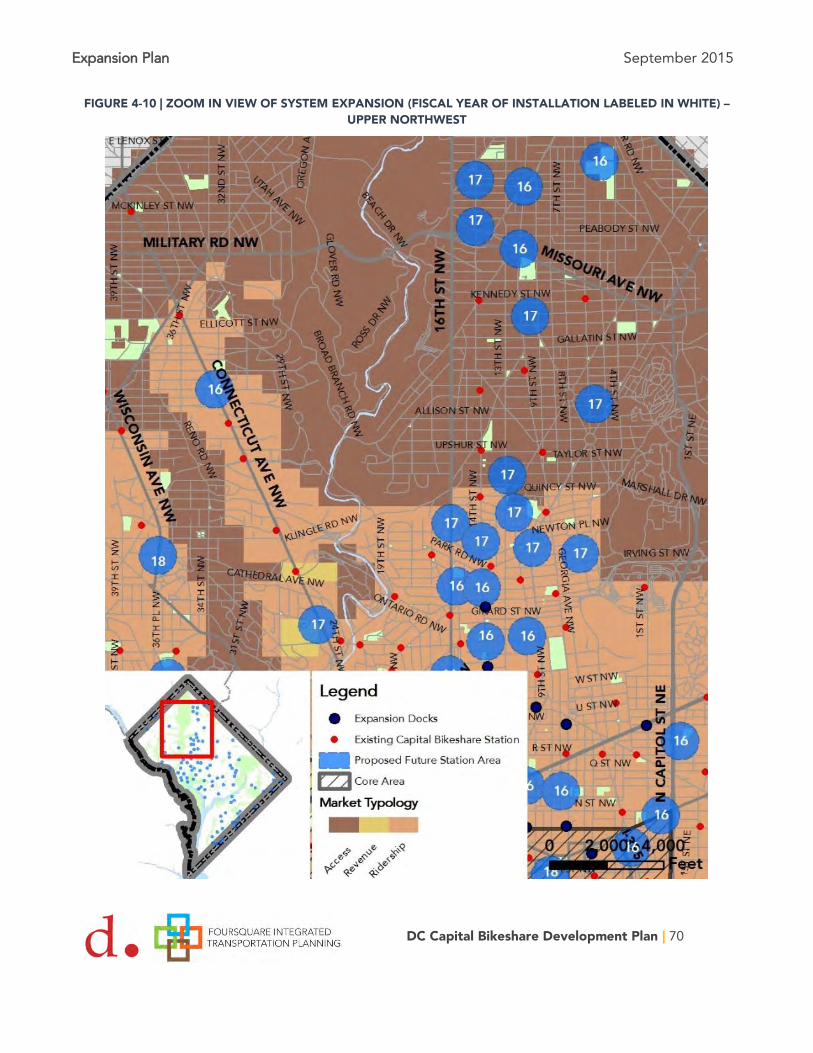
Expansion Plan September 2015
DC Capital Bikeshare Development Plan | 70
FIGURE 4-10 | ZOOM IN VIEW OF SYSTEM EXPANSION (FISCAL YEAR OF INSTALLATION LABELED IN WHITE) – UPPER NORTHWEST

Expansion Plan September 2015
DC Capital Bikeshare Development Plan | 71
FIGURE 4-11 | ZOOM IN VIEW OF SYSTEM EXPANSION (FISCAL YEAR OF INSTALLATION LABELED IN WHITE) - BROOKLAND
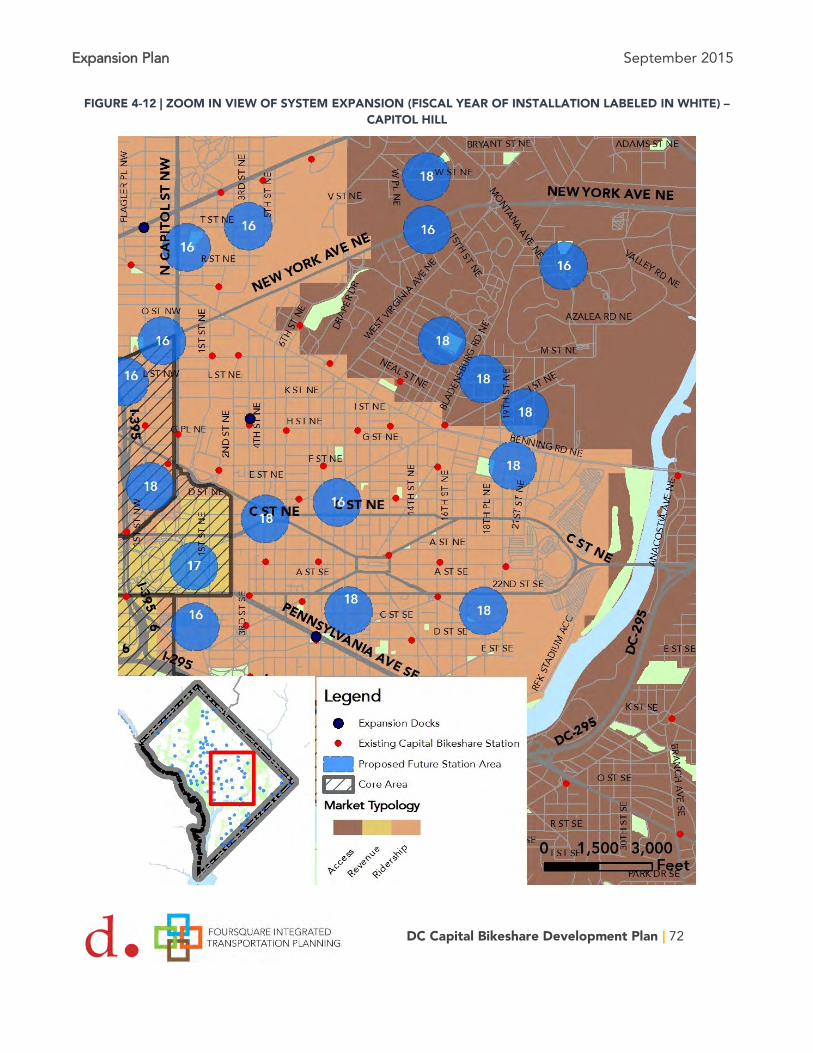
Expansion Plan September 2015
DC Capital Bikeshare Development Plan | 72
FIGURE 4-12 | ZOOM IN VIEW OF SYSTEM EXPANSION (FISCAL YEAR OF INSTALLATION LABELED IN WHITE) – CAPITOL HILL
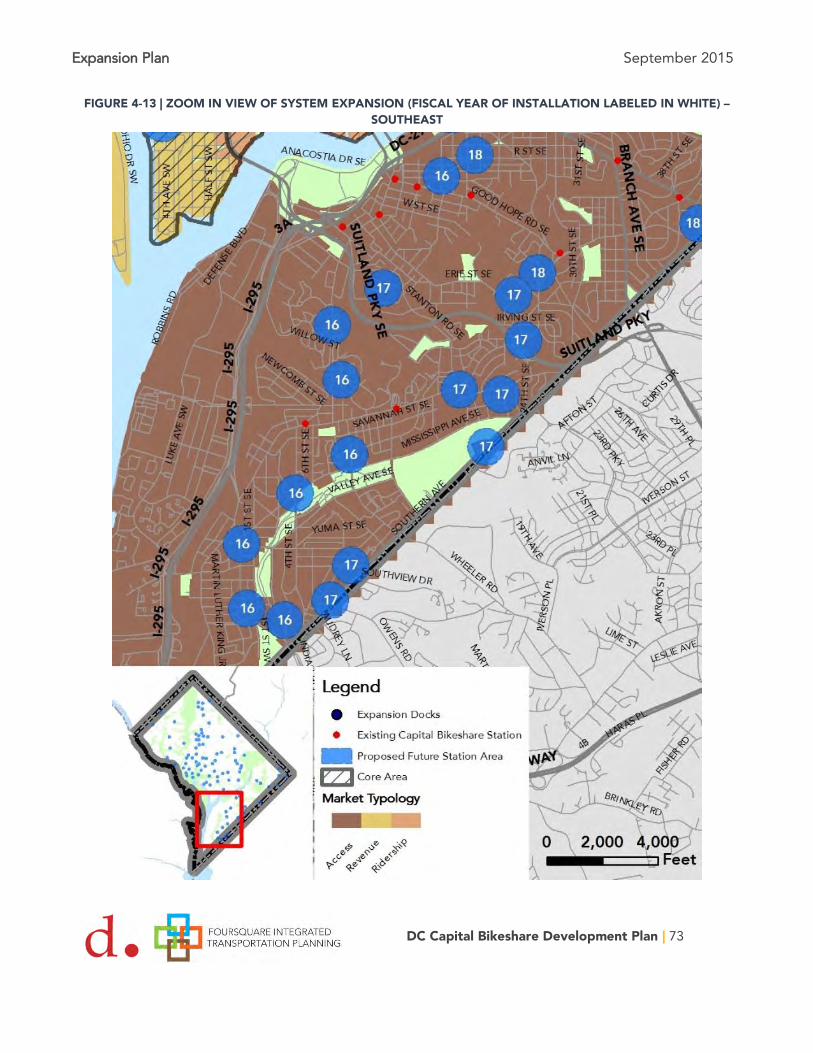
Expansion Plan September 2015
DC Capital Bikeshare Development Plan | 73
FIGURE 4-13 | ZOOM IN VIEW OF SYSTEM EXPANSION (FISCAL YEAR OF INSTALLATION LABELED IN WHITE) – SOUTHEAST
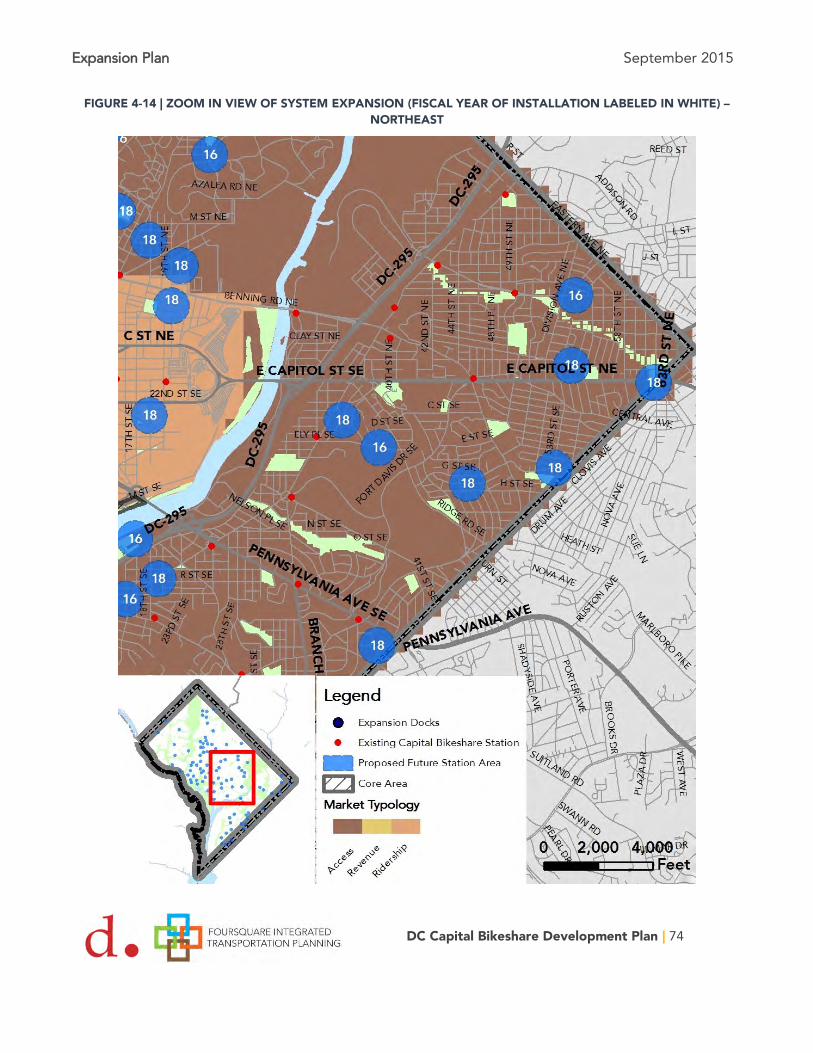
Expansion Plan September 2015
DC Capital Bikeshare Development Plan | 74
FIGURE 4-14 | ZOOM IN VIEW OF SYSTEM EXPANSION (FISCAL YEAR OF INSTALLATION LABELED IN WHITE) – NORTHEAST

Expansion Plan September 2015
DC Capital Bikeshare Development Plan | 75
4.3.5 Expansion Plan Justification The expansion plan proposed by this study was designed to address the needs identified in the market analysis, while staying within the boundaries of the program’s financial constraints. These recommendations have been vetted against the SWOT analysis presented in Section 3.6. This section identifies specifically how the expansion plan would help address SWOT findings. The station location recommendations are targeted at addressing existing program weaknesses and future program opportunities. Throughout this section, SWOT analysis findings are cited by using each finding’s code (e.g. W1-1, O3-3 … etc.)
Goal 1: Ensure Bikeshare is a Valued Part of the Districts Transportation System How well does Capital Bikeshare Connect and Complement the District’s Metrorail and Bus Network?
Expected Outcomes Due to Expansion Plan The expansion plan will help improve accessibility across the District of Columbia and promote multi-modal transportation by increasing access to public transit.
All Metro stations will have a bikeshare station within convenient distance to at least one station entrance. (Addresses W1-1, W1-2, W1-3)
Bikeshare will expand along major non-rail transit corridors such as Georgia Avenue, helping to improve transit accessibility in areas without convenient Metro access. (W1-3)
The number of transit boardings that occur within a quarter mile of a bikeshare station will grow from approximately 80% of city-wide boardings to 97% of city-wide boardings; effectively almost all public transit trips in the District will start within walking distance of a bikeshare station. (O1-1)
The expansion of docks and stations in Downtown DC will improve the effectiveness of Capital Bikeshare as an alternative to Metro in the Downtown Core. Capital Bikeshare can be a substitute for Metro trips in the most congested part of the rail system. (O1-2)
Goal 2: Leverage Bikeshare to Promote a Thriving Community How well does Capital Bikeshare promote job access, tourism, retail, and entertainment spending?
Expected Outcomes Due to Expansion Plan Capital Bikeshare will better connect the District’s residents to employment centers while expanding to better serve major tourist, entertainment, and retail centers.

Expansion Plan September 2015
DC Capital Bikeshare Development Plan | 76
Capital Bikeshare will expand to serve important employment areas lacking bikeshare access such as parts of American University, Wisconsin Avenue, Catholic University, Southwest, and the St. Elizabeth’s campus. (W2-1) (O2-3)
The expansion plan likewise will extend bikeshare along major neighborhood commercial corridors like Georgia Avenue. (W2-2) (O2-2)
Approximately 90% of District jobs will be within a quarter mile of a bikeshare station. All the District’s major tourist attractions will be bikeshare accessible. (W2-3) (W2-4)
Goal 3: Make People’s Lives Better through Bikeshare How well does Capital Bikeshare expand user access to a range of destinations and attract a wide variety of users to use bikeshare to reach those destinations?
Expected Outcomes Due to Expansion Plan The expansion plan is aimed at making Capital Bikeshare accessible to a greater cross-section of the District’s population.
The number of residents within a quarter mile of a bikeshare station will grow from 40 percent to 65 percent of the District’s population. (O3-1)
42 percent increase in the number of low-income residents within a quarter mile of a bikeshare station. (O3-4) (W3-2)
Improved coverage in neighborhoods with high non-white populations. (W3-2) Improved coverage in Wards with above average obesity rates. (W3-5) Expanded access to the District’s public schools, recreational facilities, parks, and community
centers. (W3-6)
Goal 4: Use Effective Management and Decision Making to Guarantee System Sustainability Is Capital Bikeshare Growing in a Fiscally Constrained and Responsible Manner?
The plan outlines a station expansion approach that attempts to strike a balance between expanding coverage and ensuring the system is fiscally sustainable.
Increase the number of stations near major tourist destinations to grow casual user use in proportion with system-wide growth. (W4-1)
Expand capacity in parts of the system that regularly suffer from capacity constraints. (W4-2) Balance station expansion geographically across the city to ensure stable cost recovery for the
program.
Financial Plan September 2015
DC Capital Bikeshare Development Plan | 77
5 Financial Plan
The following section presents detailed financial projections for the maintenance and expansion of the District’s bikeshare system. Bikeshare costs can be divided into a capital and an operating budget. The capital budget covers any expenses for equipment, parts, site planning, and installation costs. The operating budget includes all day-to-day expenses, including administration, marketing, and operating fees paid to the vendor or vendors. The financial figures here represent year of expenditure dollars and account for cost inflation. All costs are displayed by the District’s fiscal year, which runs from October 1 to September 30.
5.1 ASSUMPTIONS
5.1.1 Capital Cost Assumptions Equipment Costs: The capital costs in this budget were developed based on current equipment costs borne by Capital Bikeshare. The capital cost for additional stations is projected based on adding 15 dock stations at $56,712 (with bikes) and $8,160 for expansion plates with four docks. The model assumes an annual two percent increase to account for year-over-year cost escalations.
Installation: Capital costs also assume that every station will incur installation costs. Ten percent of stations are projected to require the construction of a concrete pad, making the average installation cost per station $3,300 in FY2016.
State of Good Repair: The cash flow model takes into account long-term state of good repair (SGR) costs. It is assumed that bicycles will need to be replaced every seven years while all other equipment will need replacement ten years after installation. SGR costs are not incorporated into the annual operating or capital cost projections, and are treated as a stand-alone cost.
5.1.2 Operating Cost Assumptions Operating costs are based on DDOT’s current operating contract with Motivate. Covered under the contract are per station costs for remote management of the station’s electronic access system, station
Financial Plan September 2015
DC Capital Bikeshare Development Plan | 78
balancing, station cleaning and maintenance, and bicycle maintenance. Additionally, the contract calculates call center costs by the number of bikes in the system and has fixed annual rates for administration, marketing, and website hosting. The average operating cost per dock is $144 per month for the current system. DDOT’s operating contract with the vendor is based largely on number of stations; smaller stations therefore will incur slightly higher operating costs per dock than the current systemwide average. Overall operating costs are assumed to increase by three percent each year based on inflation.
5.1.3 System Revenue Assumptions
Ridership:
The District’s Capital Bikeshare ridership is projected to grow year-over-year by four percent. The projected ridership increase is based on the historic growth rate of ridership per station since the program’s launch in 2010.23 The breakdown of ridership between casual users and registered members, as well as peak and off-peak season trips, is based on ridership data spanning October 2013 to October 2014 (Q4 2013 and Q1, Q2, and Q3 2014).
Monthly trips at new stations are projected based on two variables. First, ridership rates vary depending on where the station is located. The market study and scenario planning exercise (Section 3 and Section 4.1) identify three unique market typologies. Second, monthly ridership fluctuates based on whether a month falls into bikeshare’s peak season (April through October) or off-peak season (November through March). Table 5-1 displays the calculated average rate of trips per bike per day and the percentage of trips taken by registered users and casual users by market typology; different rates and percentages were assigned for peak and off-peak months.24
New and current stations in areas of the city that were designated under the access typology are assumed to have the lowest rate of trips per day during peak and off-peak months. Those stations are also assumed to have a very low share of casual users since the area is outside of the city’s core. New and existing stations in areas that meet the ridership typology criteria are assumed to have high rates of trips in the peak months with a smaller decrease in trips during off-peak months. The ridership typology has a larger share of casual users than the access typology. However registered users are still assumed to make up a large majority of year-round users. New and existing stations in the areas of the city designated under the revenue typology are assumed to have the highest rate of trips per day per
23 Per station ridership growth rates are highly variable year-over-year. Rates may decline in future years. 24 Ridership and trip rate assumptions are based on Q4 2013 to Q3 2014 trip data.
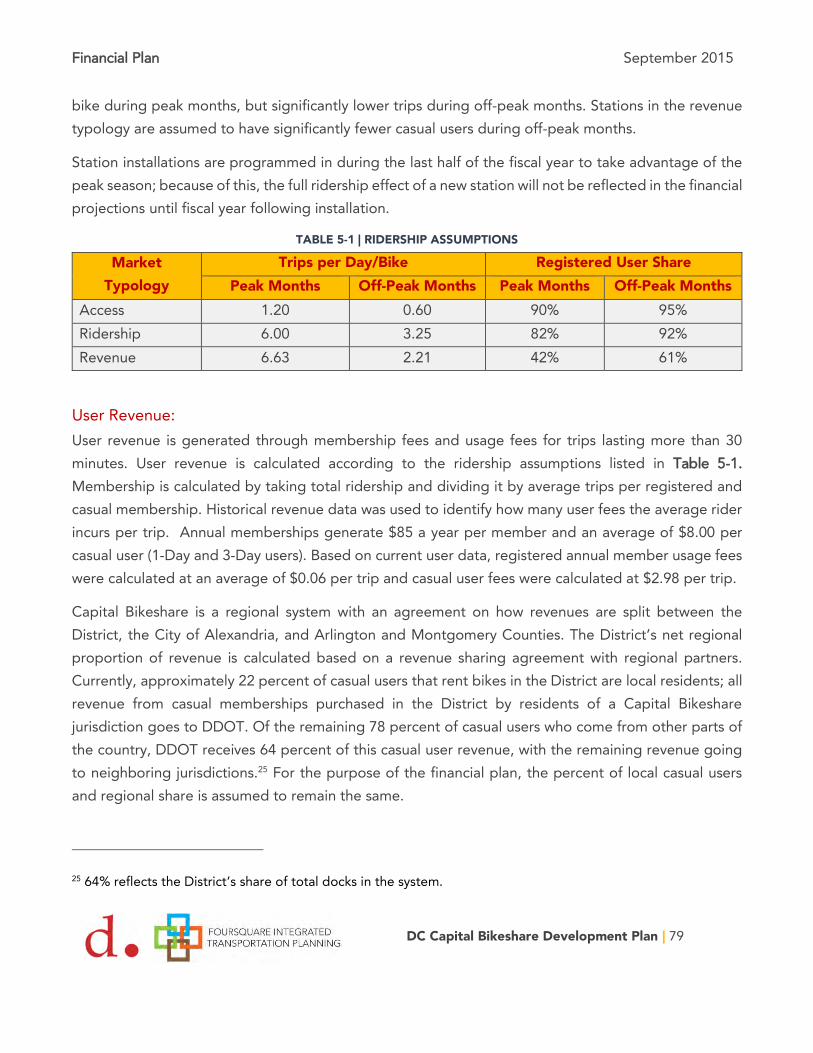
Financial Plan September 2015
DC Capital Bikeshare Development Plan | 79
bike during peak months, but significantly lower trips during off-peak months. Stations in the revenue typology are assumed to have significantly fewer casual users during off-peak months.
Station installations are programmed in during the last half of the fiscal year to take advantage of the peak season; because of this, the full ridership effect of a new station will not be reflected in the financial projections until fiscal year following installation.
TABLE 5-1 | RIDERSHIP ASSUMPTIONS
Market Typology
Trips per Day/Bike Registered User Share Peak Months Off-Peak Months Peak Months Off-Peak Months
Access 1.20 0.60 90% 95% Ridership 6.00 3.25 82% 92% Revenue 6.63 2.21 42% 61%
User Revenue: User revenue is generated through membership fees and usage fees for trips lasting more than 30 minutes. User revenue is calculated according to the ridership assumptions listed in Table 5-1. Membership is calculated by taking total ridership and dividing it by average trips per registered and casual membership. Historical revenue data was used to identify how many user fees the average rider incurs per trip. Annual memberships generate $85 a year per member and an average of $8.00 per casual user (1-Day and 3-Day users). Based on current user data, registered annual member usage fees were calculated at an average of $0.06 per trip and casual user fees were calculated at $2.98 per trip.
Capital Bikeshare is a regional system with an agreement on how revenues are split between the District, the City of Alexandria, and Arlington and Montgomery Counties. The District’s net regional proportion of revenue is calculated based on a revenue sharing agreement with regional partners. Currently, approximately 22 percent of casual users that rent bikes in the District are local residents; all revenue from casual memberships purchased in the District by residents of a Capital Bikeshare jurisdiction goes to DDOT. Of the remaining 78 percent of casual users who come from other parts of the country, DDOT receives 64 percent of this casual user revenue, with the remaining revenue going to neighboring jurisdictions.25 For the purpose of the financial plan, the percent of local casual users and regional share is assumed to remain the same.
25 64% reflects the District’s share of total docks in the system.

Financial Plan September 2015
DC Capital Bikeshare Development Plan | 80
Advertising:
The plan also assumes the continued generation of map panel26 revenue from 85 percent of stations. To be conservative, the model assumes a minimum guaranteed revenue of $231 per month per map panel under the city’s current contract. Additionally, the current contract includes a one-time scheduled payment in the spring of 2019 of $1,000,000 by the advertising contractor to DDOT.
5.2 CAPITAL COSTS
The capital costs of the District’s six-year expansion plan are estimated to be $6.5 million in year-of-expenditure dollars (see Table 5-2). Capital costs include new stations, bicycles, site planning, and installation costs. Over the planning period DDOT has planned to install 99 stations and add 735 bicycles to the current system of 202 stations and 1,737 bicycles.
TABLE 5-2 | CAPITAL COSTS FY2016 – FY2021
Fiscal Year FY2016 FY2017 FY2018 FY2019 FY2020 FY2021 Total
New Stations 47 27 25 0 0 0 99
New Bicycles 350 212 173 0 0 0 735
New Stations and Bicycles
$2,780,000 $1,678,000 $1,475,000 $0 $0 $0 $5,933,000
Site Planning and Installation Costs
$161,000 $95,000 $89,000 $0 $0 $0 $345,000
Total $3,058,000 $1,892,000 $1,564,000 $0 $0 $0 $6,514,000
26 Map panels at stations typically display a system map on one side, with space on the opposite side for advertising. Similar in size to bus shelter advertisements.
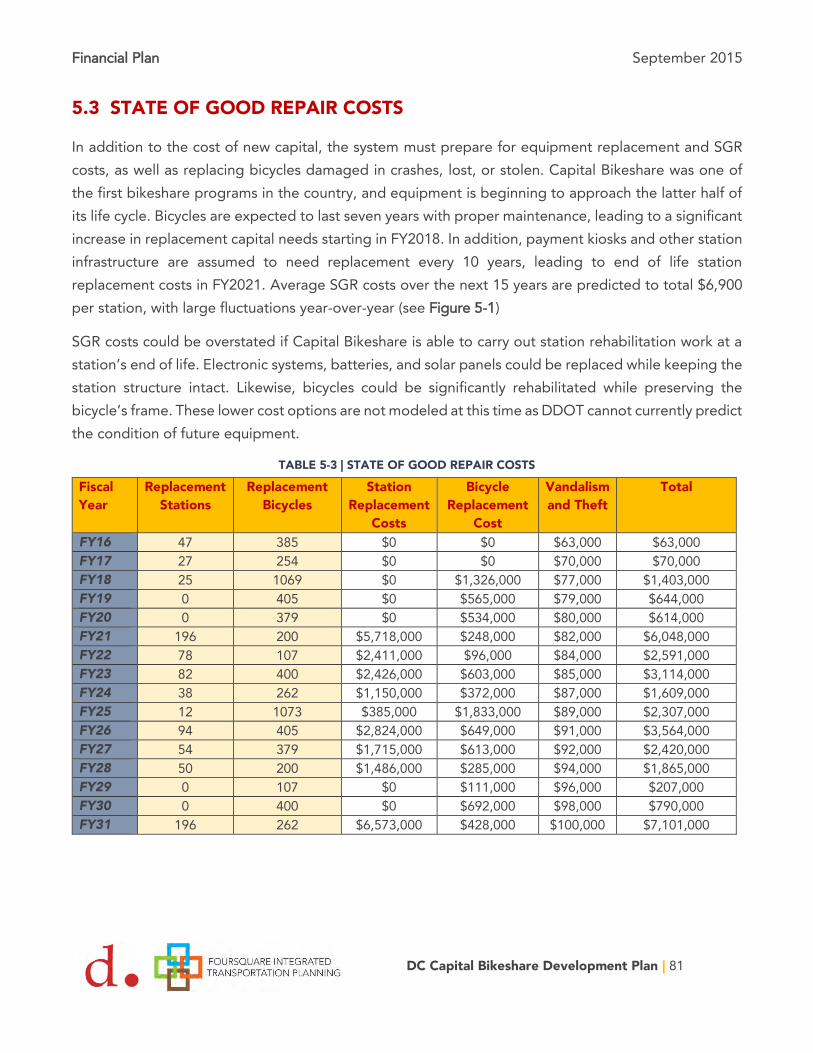
Financial Plan September 2015
DC Capital Bikeshare Development Plan | 81
5.3 STATE OF GOOD REPAIR COSTS
In addition to the cost of new capital, the system must prepare for equipment replacement and SGR costs, as well as replacing bicycles damaged in crashes, lost, or stolen. Capital Bikeshare was one of the first bikeshare programs in the country, and equipment is beginning to approach the latter half of its life cycle. Bicycles are expected to last seven years with proper maintenance, leading to a significant increase in replacement capital needs starting in FY2018. In addition, payment kiosks and other station infrastructure are assumed to need replacement every 10 years, leading to end of life station replacement costs in FY2021. Average SGR costs over the next 15 years are predicted to total $6,900 per station, with large fluctuations year-over-year (see Figure 5-1)
SGR costs could be overstated if Capital Bikeshare is able to carry out station rehabilitation work at a station’s end of life. Electronic systems, batteries, and solar panels could be replaced while keeping the station structure intact. Likewise, bicycles could be significantly rehabilitated while preserving the bicycle’s frame. These lower cost options are not modeled at this time as DDOT cannot currently predict the condition of future equipment.
TABLE 5-3 | STATE OF GOOD REPAIR COSTS
Fiscal Year
Replacement Stations
Replacement Bicycles
Station Replacement
Costs
Bicycle Replacement
Cost
Vandalism and Theft
Total
FY16 47 385 $0 $0 $63,000 $63,000 FY17 27 254 $0 $0 $70,000 $70,000 FY18 25 1069 $0 $1,326,000 $77,000 $1,403,000 FY19 0 405 $0 $565,000 $79,000 $644,000 FY20 0 379 $0 $534,000 $80,000 $614,000 FY21 196 200 $5,718,000 $248,000 $82,000 $6,048,000 FY22 78 107 $2,411,000 $96,000 $84,000 $2,591,000 FY23 82 400 $2,426,000 $603,000 $85,000 $3,114,000 FY24 38 262 $1,150,000 $372,000 $87,000 $1,609,000 FY25 12 1073 $385,000 $1,833,000 $89,000 $2,307,000 FY26 94 405 $2,824,000 $649,000 $91,000 $3,564,000 FY27 54 379 $1,715,000 $613,000 $92,000 $2,420,000 FY28 50 200 $1,486,000 $285,000 $94,000 $1,865,000 FY29 0 107 $0 $111,000 $96,000 $207,000 FY30 0 400 $0 $692,000 $98,000 $790,000 FY31 196 262 $6,573,000 $428,000 $100,000 $7,101,000
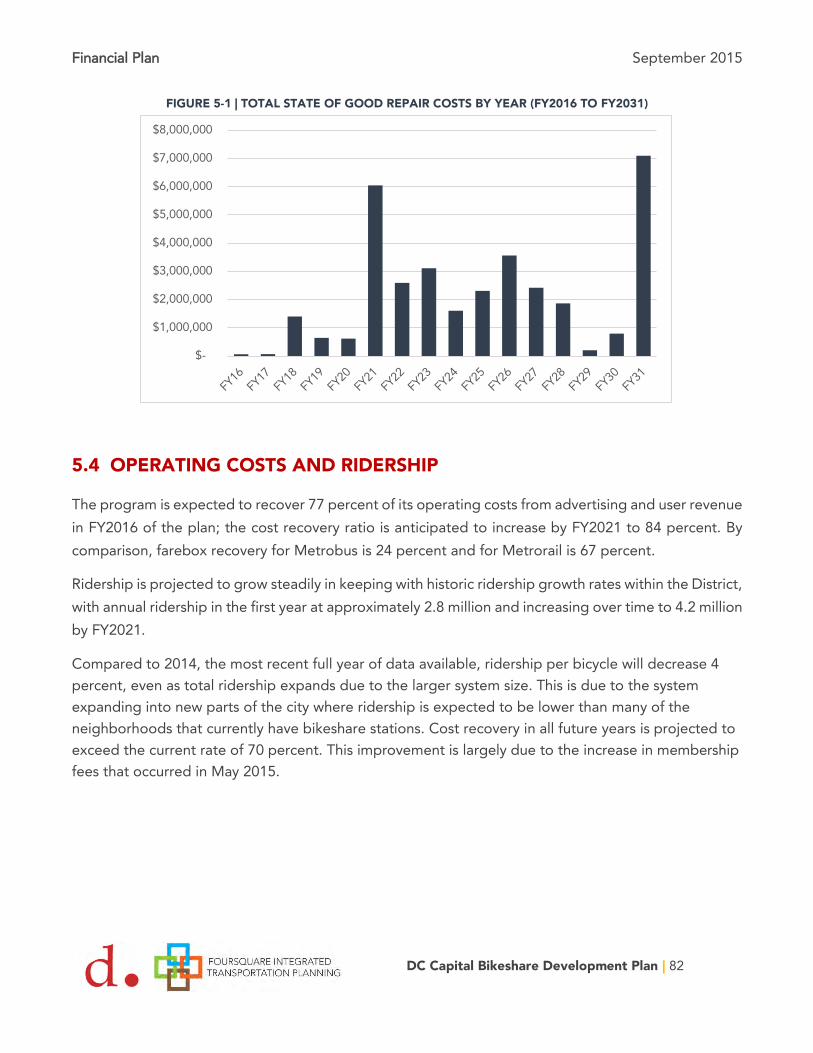
Financial Plan September 2015
DC Capital Bikeshare Development Plan | 82
FIGURE 5-1 | TOTAL STATE OF GOOD REPAIR COSTS BY YEAR (FY2016 TO FY2031)
5.4 OPERATING COSTS AND RIDERSHIP
The program is expected to recover 77 percent of its operating costs from advertising and user revenue in FY2016 of the plan; the cost recovery ratio is anticipated to increase by FY2021 to 84 percent. By comparison, farebox recovery for Metrobus is 24 percent and for Metrorail is 67 percent.
Ridership is projected to grow steadily in keeping with historic ridership growth rates within the District, with annual ridership in the first year at approximately 2.8 million and increasing over time to 4.2 million by FY2021.
Compared to 2014, the most recent full year of data available, ridership per bicycle will decrease 4 percent, even as total ridership expands due to the larger system size. This is due to the system expanding into new parts of the city where ridership is expected to be lower than many of the neighborhoods that currently have bikeshare stations. Cost recovery in all future years is projected to exceed the current rate of 70 percent. This improvement is largely due to the increase in membership fees that occurred in May 2015.
$-
$1,000,000
$2,000,000
$3,000,000
$4,000,000
$5,000,000
$6,000,000
$7,000,000
$8,000,000
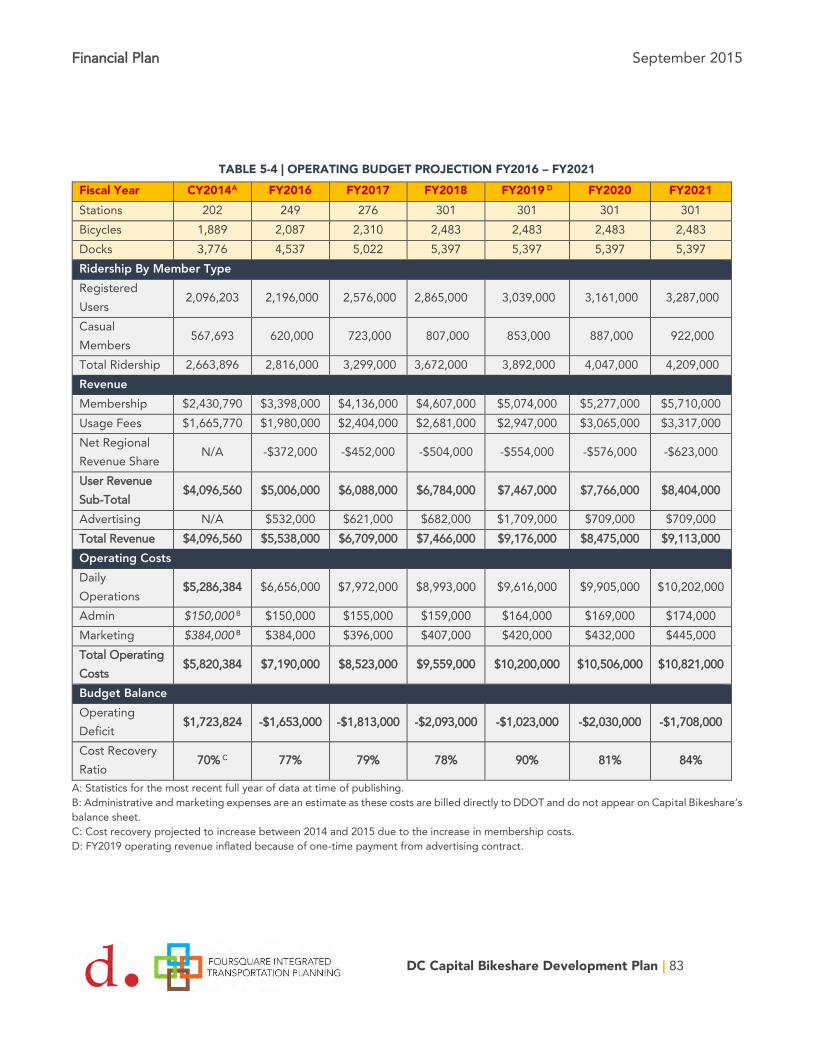
Financial Plan September 2015
DC Capital Bikeshare Development Plan | 83
TABLE 5-4 | OPERATING BUDGET PROJECTION FY2016 – FY2021
Fiscal Year CY2014A FY2016 FY2017 FY2018 FY2019 D FY2020 FY2021 Stations 202 249 276 301 301 301 301 Bicycles 1,889 2,087 2,310 2,483 2,483 2,483 2,483 Docks 3,776 4,537 5,022 5,397 5,397 5,397 5,397 Ridership By Member Type Registered Users
2,096,203 2,196,000 2,576,000 2,865,000 3,039,000 3,161,000 3,287,000
Casual Members
567,693 620,000 723,000 807,000 853,000 887,000 922,000
Total Ridership 2,663,896 2,816,000 3,299,000 3,672,000 3,892,000 4,047,000 4,209,000 Revenue Membership $2,430,790 $3,398,000 $4,136,000 $4,607,000 $5,074,000 $5,277,000 $5,710,000 Usage Fees $1,665,770 $1,980,000 $2,404,000 $2,681,000 $2,947,000 $3,065,000 $3,317,000 Net Regional Revenue Share
N/A -$372,000 -$452,000 -$504,000 -$554,000 -$576,000 -$623,000
User Revenue Sub-Total
$4,096,560 $5,006,000 $6,088,000 $6,784,000 $7,467,000 $7,766,000 $8,404,000
Advertising N/A $532,000 $621,000 $682,000 $1,709,000 $709,000 $709,000 Total Revenue $4,096,560 $5,538,000 $6,709,000 $7,466,000 $9,176,000 $8,475,000 $9,113,000 Operating Costs Daily Operations
$5,286,384 $6,656,000 $7,972,000 $8,993,000 $9,616,000 $9,905,000 $10,202,000
Admin $150,000 B $150,000 $155,000 $159,000 $164,000 $169,000 $174,000 Marketing $384,000 B $384,000 $396,000 $407,000 $420,000 $432,000 $445,000 Total Operating Costs
$5,820,384 $7,190,000 $8,523,000 $9,559,000 $10,200,000 $10,506,000 $10,821,000
Budget Balance Operating Deficit
$1,723,824 -$1,653,000 -$1,813,000 -$2,093,000 -$1,023,000 -$2,030,000 -$1,708,000
Cost Recovery Ratio
70% C 77% 79% 78% 90% 81% 84%
A: Statistics for the most recent full year of data at time of publishing. B: Administrative and marketing expenses are an estimate as these costs are billed directly to DDOT and do not appear on Capital Bikeshare’s balance sheet. C: Cost recovery projected to increase between 2014 and 2015 due to the increase in membership costs. D: FY2019 operating revenue inflated because of one-time payment from advertising contract.

Financial Plan September 2015
DC Capital Bikeshare Development Plan | 84
5.5 FINANCIAL FINDINGS
5.5.1 Capital Cost Long-Term Reduction of Capital Costs Although the model does not assume reductions in the cost of equipment, there are currently trends in the bikeshare industry that should be putting downward pressure on the cost of stations and bikes. Growth in bike sharing around the world has encouraged more companies to enter into the bike and station manufacturing business, which should increase competition in the industry and reduce equipment costs. By increasing the inter-operability of bikeshare equipment from other manufacturers, DDOT would have the ability to procure from a wide range of vendors.
Additionally, by having a six-year capital plan, DDOT can look for costs savings by placing advance orders and or by buying in bulk. Both of these factors should lower Capital Bikeshare’s expansion and replacement capital costs if pursued during contract and procurement negotiations.
State of Good Repair Pressures Maintaining the condition of Capital Bikeshare’s infrastructure in a SGR is critical to ensure that the Capital Bikeshare bicycle transit system remains efficient, reliable, and safe for over three million annual users. According to the equipment manufacturer, the estimated life of a Capital Bikeshare station that received proper maintenance is 10 years, while the estimated life span of a bike is over 5 years27. The District’s Capital Bikeshare system is approaching the end of the estimated lifecycle for the majority of the system’s bicycle stock and is halfway through the estimated lifecycle for the majority of stations. There is a real possibility that the District’s bikeshare system will begin to experience more equipment failures over the next few years. Alternately, there is also the possibility that the equipment will perform reliably past the estimated useful life. Capital Bikeshare staff should pay close attention to the equipment as it nears the end stages of its useful life to gain insight into conditions and factors that may impact the equipment’s durability.
Regardless of the variability of equipment life-cycles, the Capital Bikeshare system should plan for major SGR costs and consider them strategically when planning for system expansion. Staggering bulk station purchases so that they do not overlap with major replacement years will help smooth out SGR costs. Regular annual increases in stations and bikes, as shown in the capital plan, rather than huge purchases every five to ten years will also prevent major SGR costs from bunching into a single year.
27 Based on the durability of the current bicycle fleet, DDOT estimates bicycles will last for over seven years.
Financial Plan September 2015
DC Capital Bikeshare Development Plan | 85
5.5.2 Operating Costs Increasing Program Revenue per Trip Capital Bikeshare’s day-to-day operating costs are based on the current operating agreement with Motivate and are fixed annually to a uniform set of fees tied to the number of stations and bicycles. Under this contract model as Capital Bikeshare expands, its operating costs will go up at a fixed rate. Under Capital Bikeshare’s current revenue structure for user revenue to cover the fixed cost of the operating contract, ridership would need to increase by approximately 1,000,000 riders (a 35 percent increase) without adding new stations. A 35 percent increase in ridership on Capital Bikeshare’s current system is infeasible considering the existing capacity pressures placed on stations in the District’s highest demand areas.
As Capital Bikeshare has limited power to increase ridership on the existing system without adding additional stations, increasing the revenue per trip is a possible strategy to reduce the program’s operating deficit. The program could explore increasing membership rates and usage fees, but without adequate data on the elasticity of bikeshare user costs, DDOT cannot accurately predict how an increase in fees will impact total ridership. DDOT increased annual membership costs by 10 dollars in May 2015 to little observable impact on ridership and plans to continue to revisit fees on a bi-annual basis.
Decreasing Operating Costs per Trip As the program has limited options to increase revenue at its current cost base, lower operating costs is another means to improve program finances. Operating costs, since they are mostly labor costs, do not generally face the same downward pressures as capital costs. Program operating costs can only decline due to changes in the operating contract or efficiencies gained through smart planning and economies of scale. Capital Bikeshare could design and plan for expansion to be as efficient as possible from an operations standpoint. However, under Capital Bikeshare’s current operating contract, there are no direct means for DDOT to reap the reward of improved operational efficiencies. It is worth considering a move towards a more transparent contract model so that DDOT can better influence individual cost drivers of bikeshare. As bike sharing becomes more common in North America, new strategies might emerge that help streamline system operations and lower costs.
5.5.3 Sponsorships Many of Capital Bikeshare’s peer programs have successfully leveraged sponsorships to help fund capital and operating costs. Capital Bikeshare member jurisdictions are currently studying the feasibility of implementing a sponsorship program. Sponsorships come primarily in two forms. The first, and most lucrative, are title sponsorships. A title sponsor will commit to supporting the system over multiple years in exchange for the program carrying the sponsor’s logo and branding on stations, bicycles, and

Financial Plan September 2015
DC Capital Bikeshare Development Plan | 86
marketing material. Systems rarely have more than one or two title sponsors; in instances of multiple title sponsors, usually each sponsor’s branding appears on separate components of the system. The challenge with title sponsorships is that they are challenging and potentially costly to procure. A program like Capital Bikeshare must also work to reconcile a sponsor’s brand presence with Capital Bikeshare’s already well defined branding.
A second option for sponsorship are stations sponsors. Station sponsors commit an agreed upon amount of funding in exchange for the installation of a bikeshare station in or near their property. This process has been successfully utilized in a number of places, including Arlington County, to fund bikeshare equipment. Bikeshare station sponsorship can even be required as part of the site plan review process in order to remediate the transportation impacts of new developments.
Next Steps September 2015
DC Capital Bikeshare Development Plan | 87
6 Next Steps
The purpose of this study is to provide DDOT a data-driven understanding of the Capital Bikeshare system and where the greatest opportunities exist for expansion in the future. The study recommendations are intended to guide future decision making and ensure that expansion occurs in an informed and organized manner.
This study, however, just represents the first step in expanding the Capital Bikeshare program. Before any new stations are installed, the agency will conduct public outreach, coordinate with key stakeholders, and procure additional funding for stations. Public involvement will be key for DDOT to finalizing station siting. While this plan highlights recommended areas for stations, public feedback will help determine which specific locations are best suited for bikeshare stations.
This study primarily examines Capital Bikeshare’s finances and system design, yet public policy considerations will also impact the future system. As 40 percent of future bikeshare stations are located in areas that currently have low bikeshare ridership (but high overall transportation needs), DDOT will need to make a concerted push to address the equity gap among bikeshare riders. Equity is driven in part by the geographical distribution of stations; for low-income or minority riders to use bikeshare in large numbers, stations should be in accessible and convenient locations. Yet physical access is not the only determining factor. A lack of awareness about the program, cultural impressions of cycling, payment barriers to use, and perceptions of Capital Bikeshare, may contribute to hindering bikeshare ridership in parts of the District.
Bicycle infrastructure, specifically the lack of it, is another impediment to bikeshare usage. In parts of the District a disconnected street grid, busy roads, and steep grades all make bicycling a less appealing mode of transportation. The study team recommends that DDOT coordinate future investments in bicycle infrastructure with bikeshare expansion to ensure that new stations are convenient to cycle to and from.
Finally, regional coordination will play a decisive role in determining the success of Capital Bikeshare. This plan focuses specifically on Washington DC, but factors like the looming state of good repair needs affect all jurisdictions across the system. As Capital Bikeshare grows in the District, it increasingly pushes up to the city’s border. DDOT should continue to coordinate with neighboring jurisdictions to ensure that station siting and planning take into account the context across municipal boundaries.

Appendices September 2015
DC Capital Bikeshare Development Plan | 88
Appendix A: Screening of Individual Measures
The following section outlines the results of the mapping exercise conducted as part of the Development Plan. Each of the 19 individual measures mapped are intended to tie into the plan’s goals and objectives; these measures provide insight into how the existing system’s coverage relates to city demographics, demand drivers, and public-policy goals. Select measures are aggregated into topic-specific heat maps that will guide the system planning in future tasks of the study.
Overview The market study of the Development Plan (Section 3) seeks to understand how bikeshare is being utilized in Washington D.C and identify the system’s strengths and weaknesses at meeting the program’s goals and objectives as outlined by the plan’s strategic framework. Overall, the study team identified 13 mapping measures that can be directly tied to the program goals; six additional measures, slope, the origin-destination trip patterns of bikeshare and the distribution of revenue-generating overtime by station, are also mapped out as additional descriptive measures. Table 0-1 lists each measure and illustrates how they relates back to the program goals and objectives.
TABLE 0-1 | INDIVIDUAL GEO-SPATIAL MEASURES AND THE STRATEGIC PLANNING FRAMEWORK
Measure Related Goal Related Objective
A) Bikeshare trip generation compared to motorized trip generation
Goal 1: Ensure bikeshare is a valued part of DC’s transportation system
1.1 Increase transportation system utility for users
B) Number of motorized trips under 3.5 miles that start or end in a TAZ
C) Station capacity analysis – Bikeshare stations weighted by ridership and outage periods
D) Density of WMATA boardings for Metrorail and Metrobus
1.2 Integrate bikeshare into the existing transit system
E) Density of bicycle infrastructure 1.3 Reduce bikeshare crashes and encourage a culture of safety among users
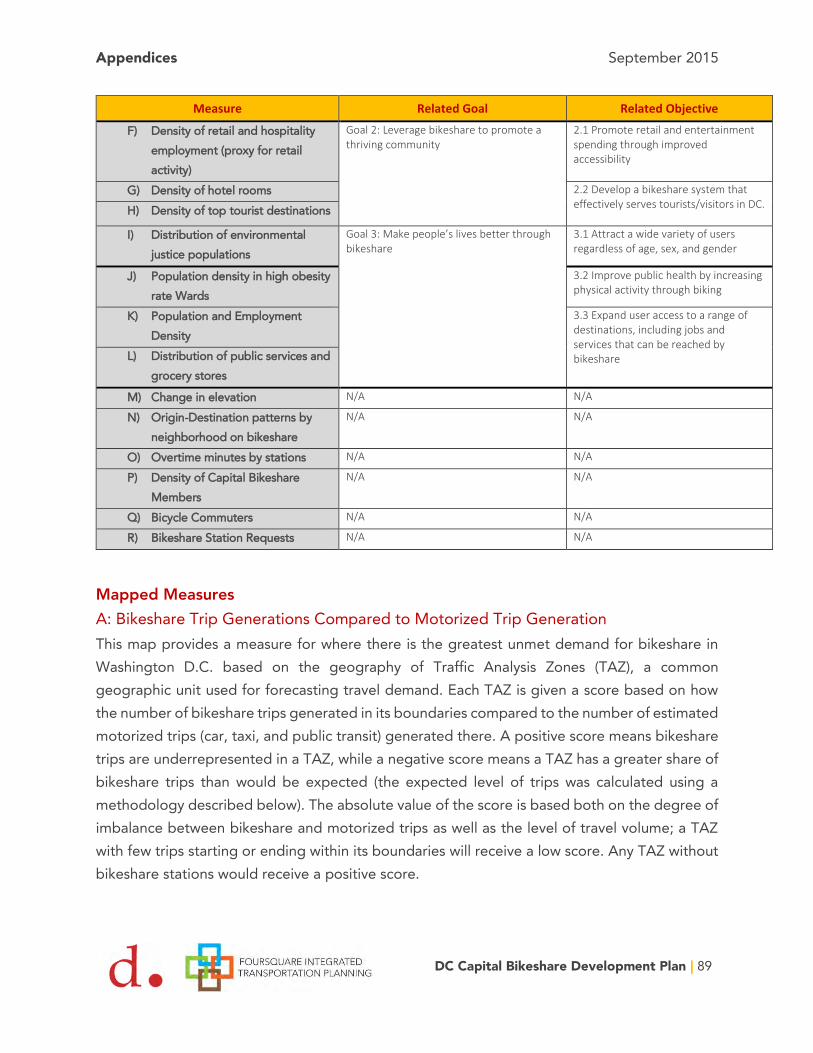
Appendices September 2015
DC Capital Bikeshare Development Plan | 89
Measure Related Goal Related Objective
F) Density of retail and hospitality employment (proxy for retail activity)
Goal 2: Leverage bikeshare to promote a thriving community
2.1 Promote retail and entertainment spending through improved accessibility
G) Density of hotel rooms 2.2 Develop a bikeshare system that effectively serves tourists/visitors in DC.
H) Density of top tourist destinations
I) Distribution of environmental justice populations
Goal 3: Make people’s lives better through bikeshare
3.1 Attract a wide variety of users regardless of age, sex, and gender
J) Population density in high obesity rate Wards
3.2 Improve public health by increasing physical activity through biking
K) Population and Employment Density
3.3 Expand user access to a range of destinations, including jobs and services that can be reached by bikeshare
L) Distribution of public services and grocery stores
M) Change in elevation N/A N/A
N) Origin-Destination patterns by neighborhood on bikeshare
N/A N/A
O) Overtime minutes by stations N/A N/A
P) Density of Capital Bikeshare Members
N/A N/A
Q) Bicycle Commuters N/A N/A
R) Bikeshare Station Requests N/A N/A
Mapped Measures A: Bikeshare Trip Generations Compared to Motorized Trip Generation This map provides a measure for where there is the greatest unmet demand for bikeshare in Washington D.C. based on the geography of Traffic Analysis Zones (TAZ), a common geographic unit used for forecasting travel demand. Each TAZ is given a score based on how the number of bikeshare trips generated in its boundaries compared to the number of estimated motorized trips (car, taxi, and public transit) generated there. A positive score means bikeshare trips are underrepresented in a TAZ, while a negative score means a TAZ has a greater share of bikeshare trips than would be expected (the expected level of trips was calculated using a methodology described below). The absolute value of the score is based both on the degree of imbalance between bikeshare and motorized trips as well as the level of travel volume; a TAZ with few trips starting or ending within its boundaries will receive a low score. Any TAZ without bikeshare stations would receive a positive score.

Appendices September 2015
DC Capital Bikeshare Development Plan | 90
The places where bikeshare trips are most over-represented are largely confined to the places with the greatest density of Capital Bikeshare stations. This intuitively makes sense as the bikeshare system does not currently serve the whole city equally, and bikeshare trips will be concentrated in the places where the system is most widely built-out.
Bikeshare trips are underrepresented in a large swath of the District. Much of the city receives a positive score of less than one, reflecting that outlying residential neighborhoods in the city produce few overall trips each day. The highest scoring areas frequently border TAZ’s that are well served by bikeshare, suggesting that some of this unmet demand is being picked up stations in neighboring TAZs. These high scoring locations include parts of Downtown, Georgetown, Dupont Circle, Columbia Heights, and Southwest. A number of areas in the city receive moderate scores: denser multi-family residential neighborhoods in the Upper Northwest such as west of Wisconsin Avenue, Chevy Chase, and Van Ness; parts of Columbia Heights and Petworth; Capitol Hill and the Navy Yard; and, activity centers east of the Anacostia River such as Anacostia and Congress Heights.
While this measure is a useful indicator of bikeshare demand, the scores do not directly capture whether there is unmet bikeshare demand in a particular TAZ. A location where bikeshare trips are highly underrepresented can still have low demand for bikeshare. Factors such as typography, surrounding land use densities, and the public’s propensity to bicycle all influence cycling demand and are not captured in this measure.
Methodology The final score is devised by calculating the difference between two ratio’s: a ratio of how many motorized trips start in a TAZ compared to the citywide rate (RatioMTG) and the ratio of how many bikeshare trips start in a TAZ compared to the citywide rate (RatioBTG).
The first step in developing this measure is calculating the RatioMTG :
𝑅𝑎𝑡𝑖𝑜𝑀𝑇𝐺 = 𝑊𝑒𝑒𝑘𝑑𝑎𝑦 𝑚𝑜𝑡𝑜𝑟𝑖𝑧𝑒𝑑 𝑡𝑟𝑖𝑝𝑠 𝑢𝑛𝑑𝑒𝑟 3.5 𝑚𝑖𝑙𝑒𝑠 𝑠𝑡𝑎𝑟𝑡𝑖𝑛𝑔 𝑖𝑛 𝑎 𝑇𝐴𝑍 ÷ 𝑇𝐴𝑍 𝑙𝑎𝑛𝑑 𝑎𝑐𝑟𝑒𝑎𝑔𝑒
𝑊𝑒𝑒𝑘𝑑𝑎𝑦 𝐶𝑖𝑡𝑦𝑤𝑖𝑑𝑒 𝑚𝑜𝑡𝑜𝑟𝑖𝑧𝑒𝑑 𝑡𝑟𝑖𝑝𝑠 𝑢𝑛𝑑𝑒𝑟 3.5 𝑚𝑖𝑙𝑒𝑠 ÷ 𝐶𝑖𝑡𝑦𝑤𝑖𝑑𝑒 𝑙𝑎𝑛𝑑 𝑎𝑐𝑟𝑒𝑎𝑔𝑒
The analysis based trip generation on the Transportation Planning Board’s (TPB) District of Columbia travel forecast for 2015. The analysis only looks at trips under 3.5 miles (straight line distance) as longer trips were considered too far to be suitable for bicycling.
The second ratio, RatioBTG, was calculated in a similar manner:
𝑅𝑎𝑡𝑖𝑜𝐵𝑇𝐺 = 𝐷𝑎𝑖𝑙𝑦 𝐵𝑖𝑘𝑒𝑠ℎ𝑎𝑟𝑒 𝑇𝑟𝑖𝑝𝑠 𝑠𝑡𝑎𝑟𝑡𝑖𝑛𝑔 𝑖𝑛 𝑎 𝑇𝐴𝑍 ÷ 𝑇𝐴𝑍 𝑙𝑎𝑛𝑑 𝑎𝑐𝑟𝑒𝑎𝑔𝑒
𝐶𝑖𝑡𝑦𝑤𝑖𝑑𝑒 𝑏𝑖𝑘𝑒𝑠ℎ𝑎𝑟𝑒 𝑡𝑟𝑖𝑝𝑠 ÷ 𝐶𝑖𝑡𝑦𝑤𝑖𝑑𝑒 𝑙𝑎𝑛𝑑 𝑎𝑐𝑟𝑒𝑎𝑔𝑒

Appendices September 2015
DC Capital Bikeshare Development Plan | 91
Once the two ratios are calculated, RatioBTG is subtracted from RatioMTG to arrive at the final score.
Sources: TPB Version 2.3.52 model simulation, 2013 Capital Bikeshare Trip Data Q4 2013 to Q3 2014

Appendices September 2015
DC Capital Bikeshare Development Plan | 92
Appendices September 2015
DC Capital Bikeshare Development Plan | 93
B: Motorized Trips Under 3.5 Miles
Results This analysis shows the total number of motorized trips per acre forecasted to start or end in a TAZ on an average weekday in 2015. Like with the previous map, motorized trips are filtered to only include those trips with a straight-line distance under 3.5 miles.
Trips in Washington D.C. are concentrated in the core, with Downtown TAZ’s showing the greatest amount of trip generation. Areas of high trip generation radiate out from the city center along major corridors such as Wisconsin Avenue and 16th Street. The areas with the weakest trip generation tend to be in lower-density outlying areas along the District’s boundary.
Methodology This map was developed using forecasted trip distribution from the Transportation Planning Board’s District of Columbia transportation model. Trip densities are based on forecasted average weekday trips in 2015 for all motorized modes under 3.5 miles. Only trips under 3.5 miles were considered so that only trips within biking distance area assessed.
Sources: TPB Version 2.3.52 model simulation, 2013

Appendices September 2015
DC Capital Bikeshare Development Plan | 94

Appendices September 2015
DC Capital Bikeshare Development Plan | 95
C: Station Capacity Analysis
Results This map illustrates to what degree a station is out-of-service (e.g. downtime) due to being out of capacity (either entirely full or empty of bicycles). The size of the circle reflects the number of trips “lost” due to a station being full or empty. The color of the circle illustrates how frequent the station is full or empty. The intent of the map is to depict where in the District’s Capital Bikeshare system station capacity issues are most pronounced.
Interestingly, the frequency a station is down, and ridership to that station are not closely correlated. Many of the higher ranking stations for lost trips (e.g. Union Station/Columbus Circle) rank highly because they have very high ridership, even if they are near the mean for downtime experienced. Conversely, a number of low ridership stations rank near the top for downtime. These stations likely experience very “peaked” demand; during certain periods these stations will only experience demand in one direction and quickly fill up or empty. Some very busy stations experience relatively little downtime since all day demand continually rebalances the station without outside intervention.
The stations that feature both a large number of lost trips, and high duration of downtime seem to be clustered in Downtown, Adams Morgan, and Logan Circle. These are mixed-use areas with high trip demand and diverse trip purposes that helps maintain all-day traffic. These area also roughly correlate with the high trip imbalances seen in Measure N-1. Each day hundreds of more trips occur between Adams Morgan and Columbia Heights to Downtown and Dupont Circle than happen in the reverse. This net loss of bicycles leads to empty stations in “uphill” neighborhoods and full stations Downtown.
Methodology Lost trips are estimated by finding the difference between the monthly station ridership and the monthly ridership divided by a stations up time (the inverse of downtime). This method assumes that during down-times, a station experiences the same rate of demand as it does during uptimes. This assumption may not necessarily be correct if downtimes occur largely at off-peak travel periods, such as late at night.
Sources: Operating monthly reports
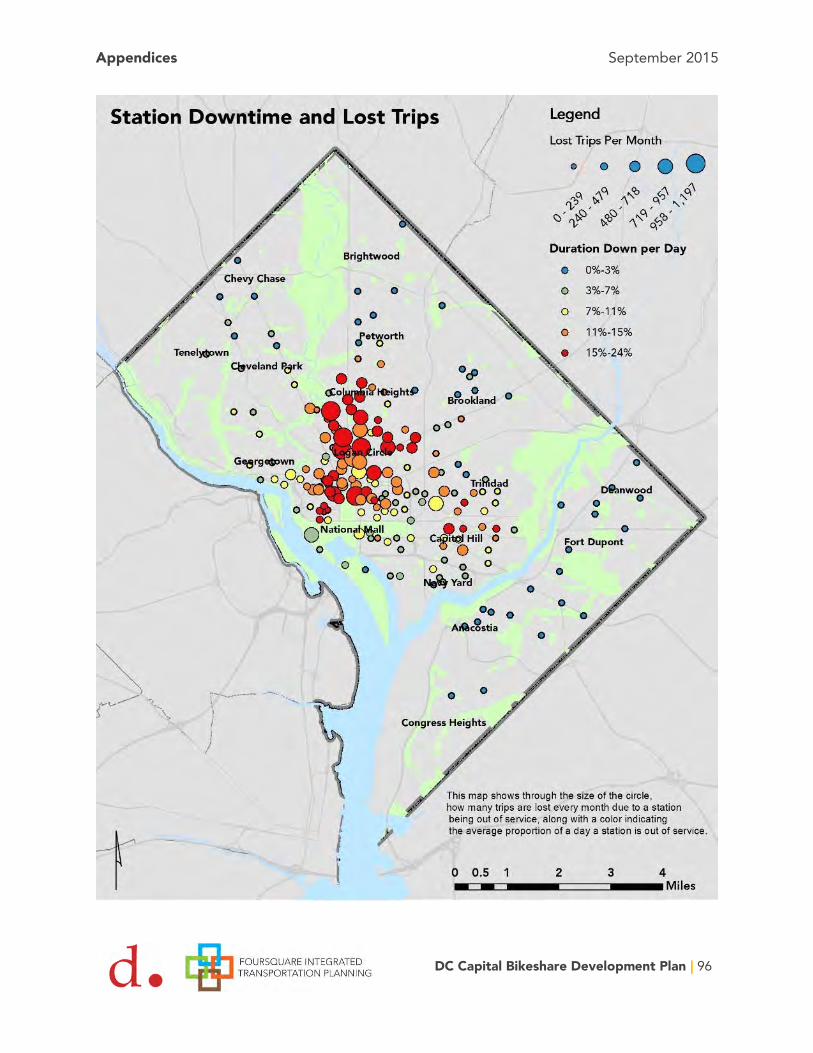
Appendices September 2015
DC Capital Bikeshare Development Plan | 96
Appendices September 2015
DC Capital Bikeshare Development Plan | 97
D: WMATA Transit Boarding Density
Results This map is intended to illustrate how well bikeshare connects to the existing transit system. Each grid cell reflects the number of transit boardings at Metrobus stops and Metrorail station entrances within an eighth of a mile walking radius.
Transit boardings in Washington DC are highly concentrated in a small area. The red areas of the map represent 78 percent of transit boarding activity in the city. The existing bikeshare system does a good job of connecting to transit overall. High transit ridership areas in Downtown DC especially are directly accessible by bikeshare. In other parts of the city, high ridership locations are within a short distance of bikeshare but not necessarily directly adjacent (within one eighth of a mile). The availability of bikeshare within eyesight of busy bus stops and Metrorail station exits is important to facilitate multi-modal journeys.
Methodology The map aggregates all Metrorail and Metrobus weekday boardings within one eighth of a mile of a grid cell’s center. Metrobus boardings are joined to their respective bus stops. Metrorail boardings are joined to the station entrance; Metrorail stations with multiple entrances have their daily boardings divided by the number of entrances. For this analysis elevators are not considered entrances.
Capital bikeshare stations are buffered by an eighth of a mile walking radius. This buffer is smaller than the one quarter of a mile buffer used on other maps because an eighth of a mile was considered the standard for a station being adjacent to a location instead of merely being within a convenient walking distance.
Sources WMATA Metrobus Boarding Data, 2013; Average weekday boardings. WMATA Metrorail station entrances, 2013; Average weekday station entrances.

Appendices September 2015
DC Capital Bikeshare Development Plan | 98

Appendices September 2015
DC Capital Bikeshare Development Plan | 99
E: Density of Bicycle Infrastructure
Results This map is intended to illustrate where bicycle infrastructure in Washington D.C is concentrated. The map looks at the feet of bicycle lanes, cycle tracks, and paths within a quarter-mile search radius of a grid cell (sized to one eighth by one eighth of a mile).
Overall bicycle infrastructure is concentrated in the core of the city, and decreases in density as one moves out toward the District’s boundary. There are some gaps in bicycle infrastructure near bikeshare stations. Some stations, concentrated east of the Anacostia River and far Northwest, have no bicycle infrastructure within a quarter-mile.
Methodology This map measures the feet of bicycle infrastructure within a quarter-mile (straight-line distance) of an analysis grid cell. Bicycle infrastructure is limited to bicycle lanes, cycle tracks, and off-road paths. Shared use roads and sidewalk bicycle routes were not included.
Sources Bicycle Network, DDOT 2014 Bicycle Trail Network, DC Open Data, 2014
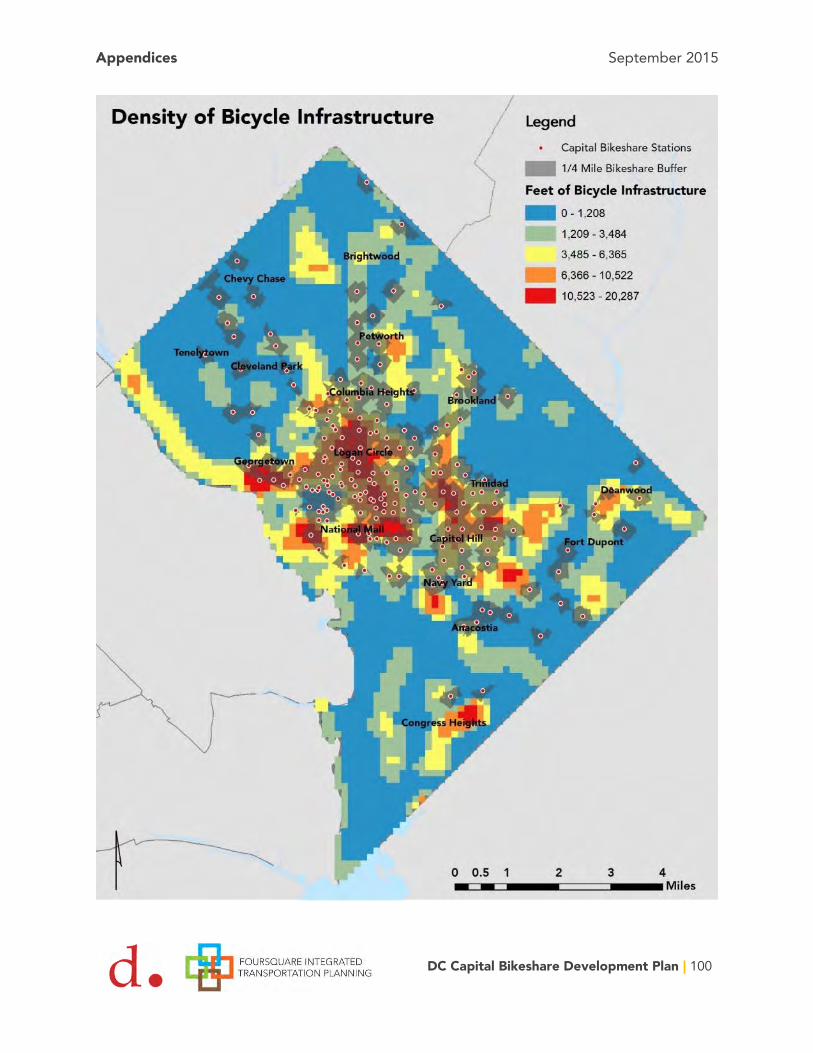
Appendices September 2015
DC Capital Bikeshare Development Plan | 100
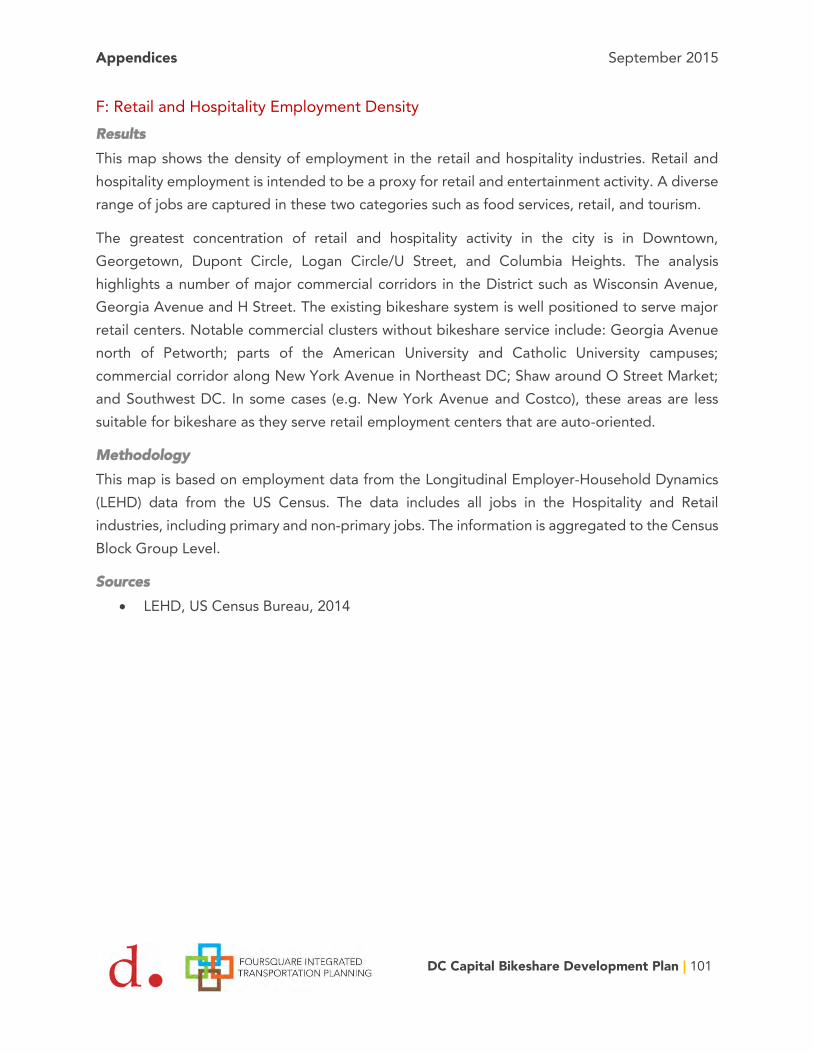
Appendices September 2015
DC Capital Bikeshare Development Plan | 101
F: Retail and Hospitality Employment Density
Results This map shows the density of employment in the retail and hospitality industries. Retail and hospitality employment is intended to be a proxy for retail and entertainment activity. A diverse range of jobs are captured in these two categories such as food services, retail, and tourism.
The greatest concentration of retail and hospitality activity in the city is in Downtown, Georgetown, Dupont Circle, Logan Circle/U Street, and Columbia Heights. The analysis highlights a number of major commercial corridors in the District such as Wisconsin Avenue, Georgia Avenue and H Street. The existing bikeshare system is well positioned to serve major retail centers. Notable commercial clusters without bikeshare service include: Georgia Avenue north of Petworth; parts of the American University and Catholic University campuses; commercial corridor along New York Avenue in Northeast DC; Shaw around O Street Market; and Southwest DC. In some cases (e.g. New York Avenue and Costco), these areas are less suitable for bikeshare as they serve retail employment centers that are auto-oriented.
Methodology This map is based on employment data from the Longitudinal Employer-Household Dynamics (LEHD) data from the US Census. The data includes all jobs in the Hospitality and Retail industries, including primary and non-primary jobs. The information is aggregated to the Census Block Group Level.
Sources LEHD, US Census Bureau, 2014

Appendices September 2015
DC Capital Bikeshare Development Plan | 102

Appendices September 2015
DC Capital Bikeshare Development Plan | 103
G: Hotel Room Map
Results This analysis shows the total number of hotel rooms aggregated to a one eighth of a mile grid. Hotel rooms are used as an indicator for tourist origins. Most hotel rooms are concentrated in Downtown, Dupont Circle, and Woodley Park. There are also a number of smaller hotels near the Waterfront area and Navy Yard.
Methodology Destination DC provided a list of the largest hotels in Washington, D.C. including the number of rooms available. This information was geocoded using Google Earth and imported into ArcGIS. The point file was then aggregated to a one eighth of a mile grid file.
Sources: Destination DC
H: Tourist Map
Results This analysis shows the total number of annual visitors to 29 of the most popular tourist destinations in Washington, D.C. The largest share of tourist destinations and those with the largest number of annual visitors are concentrated along the National Mall. The five most popular sites, in order of number of annual visitors, are: the Museum of Natural History, the Lincoln Memorial, Air and Space Museum, the Museum of American History, and the National Gallery of Art. The only tourist sites outside of Downtown are the National Zoo, Hillwood Museum, and the Basilica of the National Shrine of the Immaculate Conception.
Methodology Destination DC provided the list of tourist destinations and the number of annual visitors for the top destinations. The remaining visitor counts were obtained through a basic web search of the most recent annual reports available for each museum or tourist destination. Annual visitor counts were not available for the following the tourist sites: the Washington National Cathedral, United States Botanic Garden, the Phillips Collection, and Hillwood Museum and Gardens. Tourist destinations were then geocoded using Google Earth and exported to ArcGIS.
Sources: Destination DC
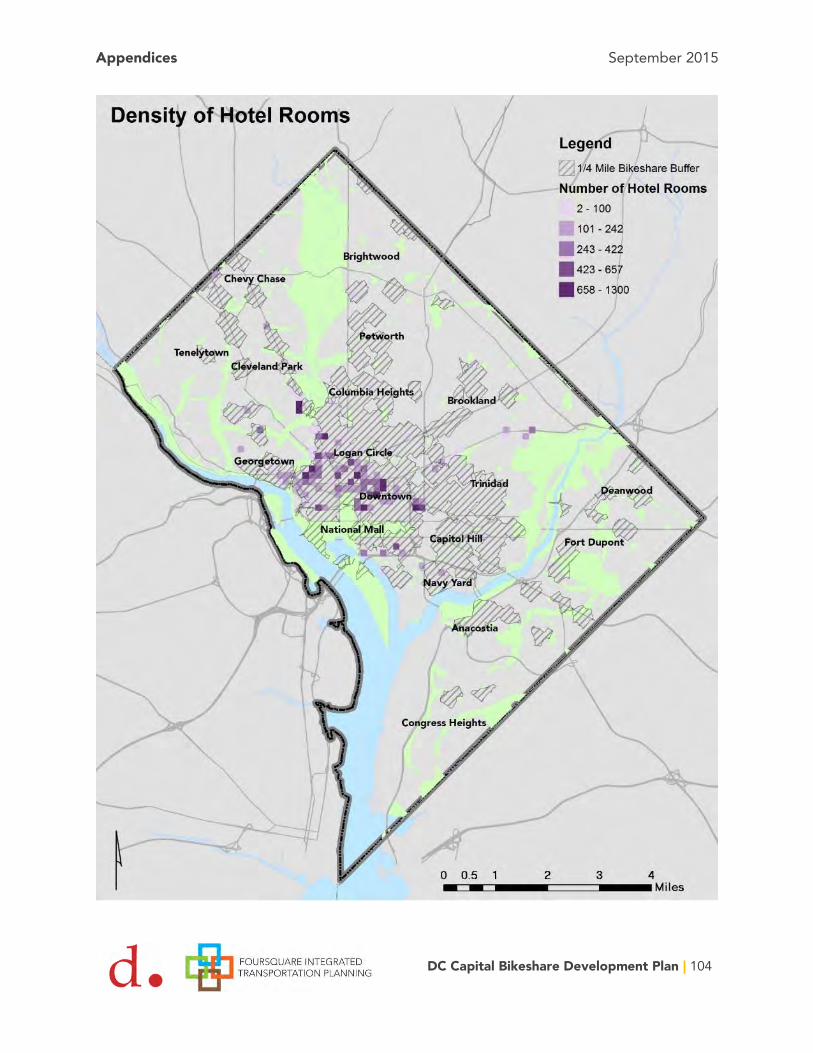
Appendices September 2015
DC Capital Bikeshare Development Plan | 104

Appendices September 2015
DC Capital Bikeshare Development Plan | 105

Appendices September 2015
DC Capital Bikeshare Development Plan | 106
I-1: Environmental Justice Populations – Minority Populations
Results This analysis shows the share of minority population in Washington, D.C. by Census Block Group as part of the Environmental Justice measure of the bikeshare market study. The map indicates that the highest concentration of minority population is in the Northeast and Southwest quadrants of the city. The share of minority population is higher farther from Downtown, where there is less coverage under the quarter-mile bikeshare buffer area.
Methodology Data used was U.S. Census data from Table B03002 Hispanic or Latino Origin by Race, 2008-2012 American Community Survey 5-Year Estimates. It was joined to Census Block Groups. Minority population is calculated as total population minus the non-Hispanic, white population.
Sources: ACS 2008-2012, Table B03002.
I-2 Environmental Justice Populations – Low-Income Populations
Results This analysis shows the ratio of income to poverty level for population living in Washington, D.C. by Census Block Group. The map shows individuals with income at 150 percent of the federal poverty level or lower. The results show the highest concentration of poverty are in the Southeast quadrant, Northeast quadrant, and parts of the Northwest quadrant particularly around Columbia Heights, Petworth, and Brightwood. A number of outlier Census Block Groups are shown to have high concentrations of low-income residents but are surrounded by high income Census Block Groups. These locations are largely at or near a university and likely reflect student populations. The map also shows where high poverty Census Block Groups are located in relation to the quarter-mile bikeshare buffer area. While most of Downtown and the Northwest have bikeshare coverage, many high poverty neighborhoods in Northeast (e.g. Trinidad) and Southeast (e.g. Congress Heights) have limited access to bikeshare.
Methodology Data used was U.S. Census data from Table C17002 Ratio of Income to Poverty Level in the Past 12 Months, 2008-2012 American Community Survey 5-Year Estimates that was joined to Census Block Groups. The poverty ratio is calculated for population for whom poverty status is determined.

Appendices September 2015
DC Capital Bikeshare Development Plan | 107
Sources: ACS 2008-2012, Table C17002
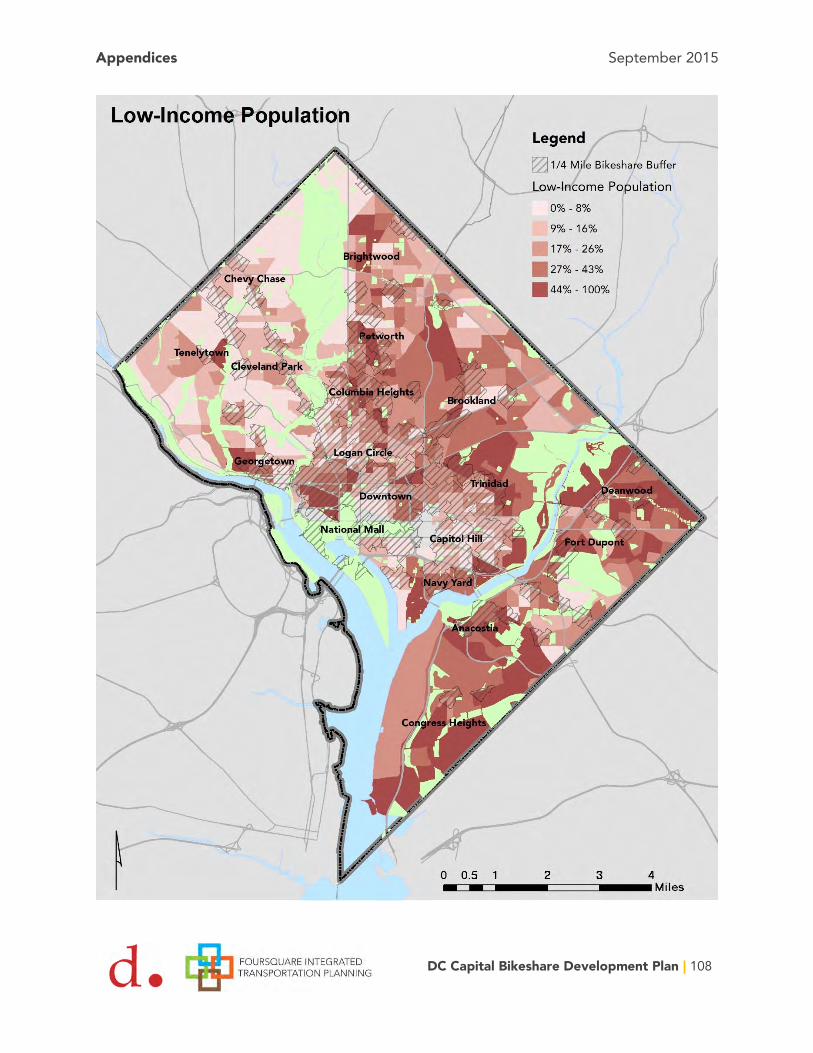
Appendices September 2015
DC Capital Bikeshare Development Plan | 108
Appendices September 2015
DC Capital Bikeshare Development Plan | 109
J: Population Density in High Obesity Rate Wards
Results This map depicts the population density in Wards with obesity rates above the all-Ward mean. The intention is to identify where the greatest concentration of populations with poor health indicators are located. Obesity rates correlate strongly with other public health issues such as diabetes and heart disease.
The existing Capital Bikeshare system does a poor job of serving populations in these high obesity areas. The three Wards that qualified as high obesity - Ward 5, Ward 7, and Ward 8 – have limited bikeshare system coverage. Some of the most densely populated Census Blocks in these Wards have no bikeshare stations within a quarter-mile walk.
Because obesity rate data is only available at the Ward level, this analysis does not provide the complete picture of where high obesity populations live. Pockets of high obesity rates may exist in the other Wards but are not shown here.
Methodology This map defines a “high obesity Ward” as any Ward with an obesity rate above the all-Ward average of 29.9 percent. For the Wards that qualify as high-obesity, the population density is displayed based on Census 2010 figures.
Sources Census, 2010 Population Count DC Department of Health, District of Columbia Communities Putting Prevention to
Work: Obesity, 2010
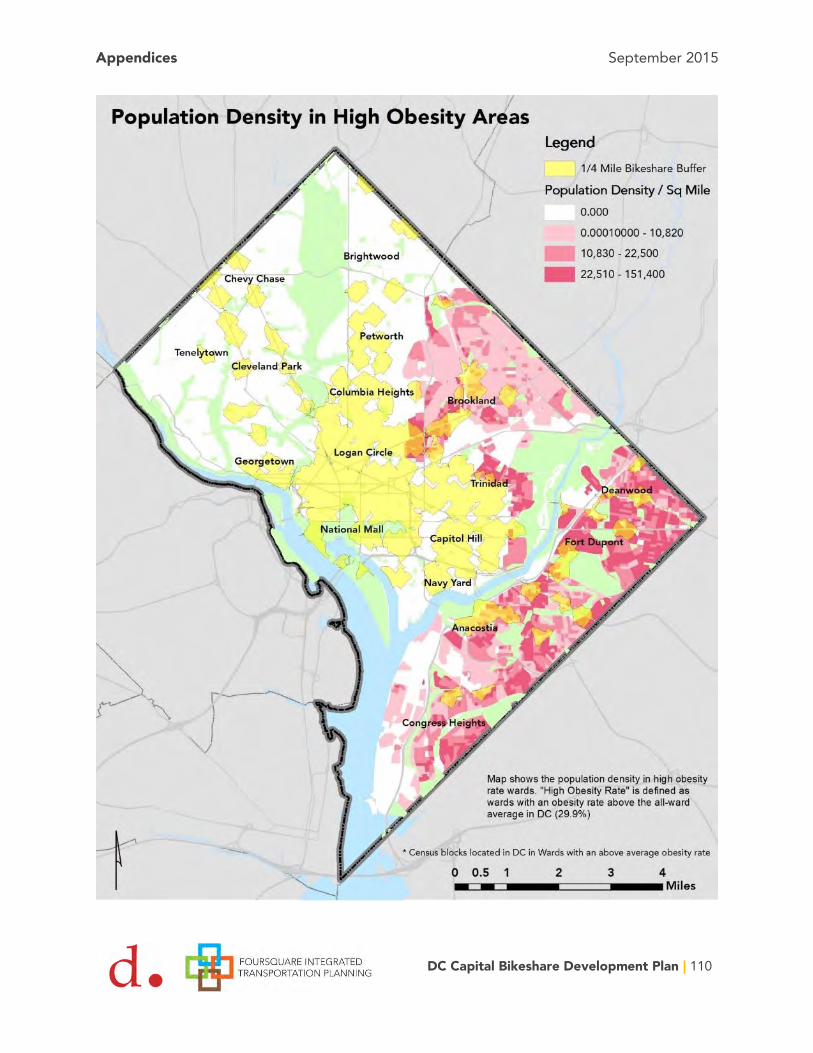
Appendices September 2015
DC Capital Bikeshare Development Plan | 110

Appendices September 2015
DC Capital Bikeshare Development Plan | 111
K-1: Population Density
Results This map depicts population density at the Census Block level across Washington D.C. in order to identify areas with high residential densities that have the best potential for bikeshare service. The density categories used in the map reflect density classifications used by the Federal Transit Administration (FTA) in determining transit-supportive land uses.28 According to FTA guidelines, areas with population densities above 10,000 people/square mile are considered medium-high to highly transit supportive. Bikeshare systems thrive in similar land-uses as locations with high transit propensity, therefore FTA guidelines were considered a good benchmark for determining which areas have population densities high enough to support bikeshare ridership.
Over 80 percent of the District’s population lives in areas with a population density greater than 10,000 people per square mile. Approximately 39 percent of city residents live within a quarter-mile walking distance of a bikeshare station. Forty-three percent of residents living in high population density Census Blocks are within a quarter-mile of a bikeshare station.29
Capital Bikeshare has a number of gaps in serving high density residential communities:
The neighborhoods along the Georgia Avenue/16th Street corridors north of Florida Avenue all have sizeable areas with no bikeshare stations.
Multi-family residential areas along Wisconsin and Connecticut Avenue in the Northwest DC are served by only a handful of station.
Southwest DC Neighborhoods just west of the Anacostia River like Carver Langston and Barney Circle. The majority of the neighborhoods east of the Anacostia River.
Methodology This map displays population density at the Census Block level from Census 2010 data. Census 2010 counts were used instead of more current 2008-2012 American Community Survey estimates because of the higher accuracy and smaller geography available.
28 Guidelines and Standards for Assessing Transit Supportive Land Uses, FTA, 2004 http://www.fta.dot.gov/documents/FTA_LU_Contractor_Guidelines_FY04_complete1.pdf 29 The District is forecasted to have added over 50,000 residents since 2010. As much of this growth is concentrated in high density areas, figures for how many people live within a quarter mile of bikeshare are likely higher than stated here.

Appendices September 2015
DC Capital Bikeshare Development Plan | 112
Sources Census, 2010 Population Count

Appendices September 2015
DC Capital Bikeshare Development Plan | 113
K-2: Employment Density
Results This map depicts employment density at the Census Block level across Washington D.C. in order to identify areas where the land use is dense enough to support bikeshare service. The density categories are set to mark meaningful boundaries between different land use types.30 The District has a great variation in employment densities between Census Blocks. Any Block with over 10 jobs per acre is considered to have a significant level of employment. Areas with 10 to 75 jobs per acre are predominantly neighborhood-level job centers. These areas include small commercial corridors and lower-density employment sites. Any block between 75 and 150 jobs per acre is considered a secondary employment area; these are large employment sites located job outside the core or in peripheral activity centers. Finally locations with more than 150 jobs per acre are considered core employment sites.
Over 80 percent of the District jobs are within a quarter-mile of a bikeshare station. Nearly all of the Census Blocks with a density greater than 75 jobs per acre are within walking distance to bikeshare. Some lower density major employment sites still feature gaps in bikeshare access:
Parts of the American University campus, Areas of Wisconsin Avenue located away from existing Metro stations Portions of Brookland, including the Catholic University campus Portions of the Washington Hospital Center/ Children’s Hospital, VA Hospital campus Portions of Southwest DC St. Elizabeth’s hospital campus
Methodology This map is based on Longitudinal Employer-Household Dynamics (LEHD) data. The employment count for all industries is aggregated to the Census Block Level. LEHD data has certain limitations that can under or over-report employment statistics based on the location of the employer’s headquarters. In some instances dispersed employment can be geocoded to a single site. Within this map, jobs in certain emerging employment sites such as Navy Yard and NoMa appear underreported likely due to the large share of development that has occurred since the last LEHD survey was conducted.
30 Florida Department of Transportation, Transit Oriented Development Design Guidelines, 2009

Appendices September 2015
DC Capital Bikeshare Development Plan | 114
Sources US Census, LEHD Data, 2014
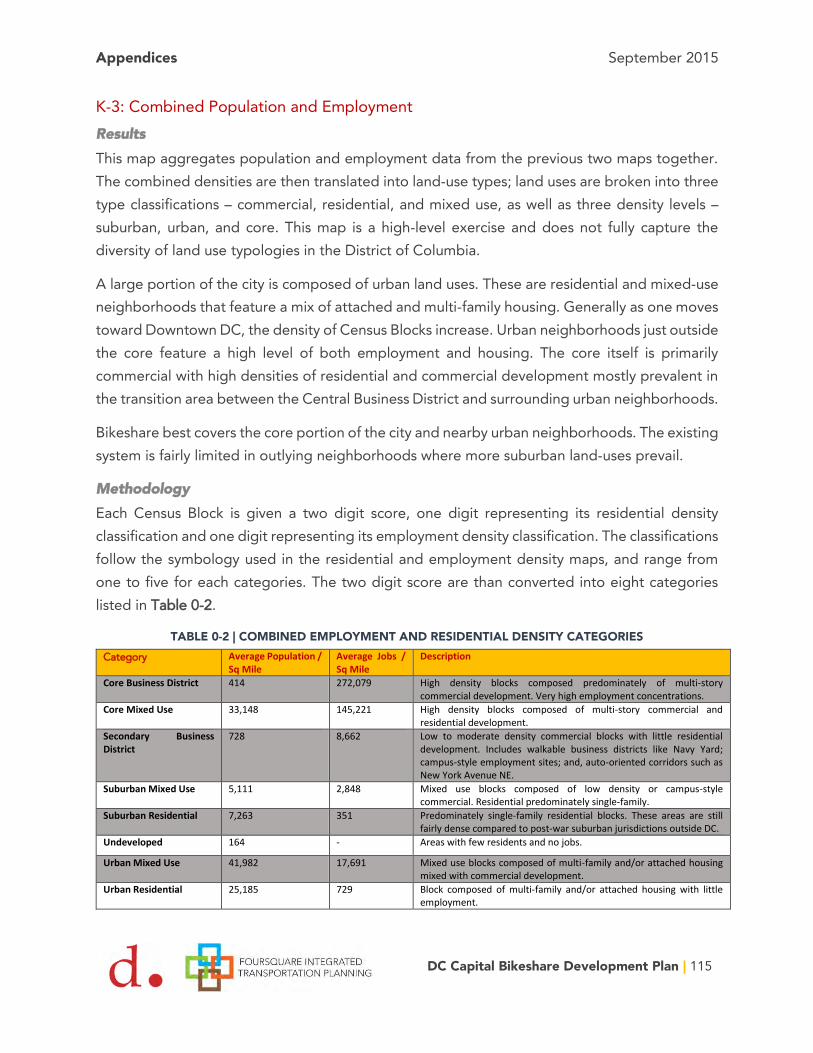
Appendices September 2015
DC Capital Bikeshare Development Plan | 115
K-3: Combined Population and Employment
Results This map aggregates population and employment data from the previous two maps together. The combined densities are then translated into land-use types; land uses are broken into three type classifications – commercial, residential, and mixed use, as well as three density levels – suburban, urban, and core. This map is a high-level exercise and does not fully capture the diversity of land use typologies in the District of Columbia.
A large portion of the city is composed of urban land uses. These are residential and mixed-use neighborhoods that feature a mix of attached and multi-family housing. Generally as one moves toward Downtown DC, the density of Census Blocks increase. Urban neighborhoods just outside the core feature a high level of both employment and housing. The core itself is primarily commercial with high densities of residential and commercial development mostly prevalent in the transition area between the Central Business District and surrounding urban neighborhoods.
Bikeshare best covers the core portion of the city and nearby urban neighborhoods. The existing system is fairly limited in outlying neighborhoods where more suburban land-uses prevail.
Methodology Each Census Block is given a two digit score, one digit representing its residential density classification and one digit representing its employment density classification. The classifications follow the symbology used in the residential and employment density maps, and range from one to five for each categories. The two digit score are than converted into eight categories listed in Table 0-2.
TABLE 0-2 | COMBINED EMPLOYMENT AND RESIDENTIAL DENSITY CATEGORIES Category Average Population /
Sq Mile Average Jobs / Sq Mile
Description
Core Business District 414 272,079 High density blocks composed predominately of multi-story commercial development. Very high employment concentrations.
Core Mixed Use 33,148 145,221 High density blocks composed of multi-story commercial and residential development.
Secondary Business District
728 8,662 Low to moderate density commercial blocks with little residential development. Includes walkable business districts like Navy Yard; campus-style employment sites; and, auto-oriented corridors such as New York Avenue NE.
Suburban Mixed Use 5,111 2,848 Mixed use blocks composed of low density or campus-style commercial. Residential predominately single-family.
Suburban Residential 7,263 351 Predominately single-family residential blocks. These areas are still fairly dense compared to post-war suburban jurisdictions outside DC.
Undeveloped 164 - Areas with few residents and no jobs.
Urban Mixed Use 41,982 17,691 Mixed use blocks composed of multi-family and/or attached housing mixed with commercial development.
Urban Residential 25,185 729 Block composed of multi-family and/or attached housing with little employment.

Appendices September 2015
DC Capital Bikeshare Development Plan | 116
Sources Census, LEHD Data, 2014 Census 2010 Population Counts

Appendices September 2015
DC Capital Bikeshare Development Plan | 117
L: Distribution of Public Services and Access to Food
Results This map shows the distribution of key destinations that provide public services or access to fresh foods. The map looks at the number of public schools, recreation centers, libraries, Department of Human Services (DHS) centers, and grocery stores within an analysis grid cell.
The existing bikeshare system connects well to public service destinations within the core of the city. Northeast along the Prince George’s county line, east of the Anacostia River, and west of Rock Creek Park, all have poorer bikeshare connections to public service destinations. All locations with two or more destinations within a grid cell are served by bikeshare with the exception of the Congress Heights DHS center, which is not directly accessible by bikeshare.
Methodology This map is based on publically available data of the locations of public schools, libraries, DHS centers, grocery stores, and recreational facilities. The point file behind this data is aggregated to an analysis grid to illustrate the density of public facilities.
Sources DC Open Data, 2014
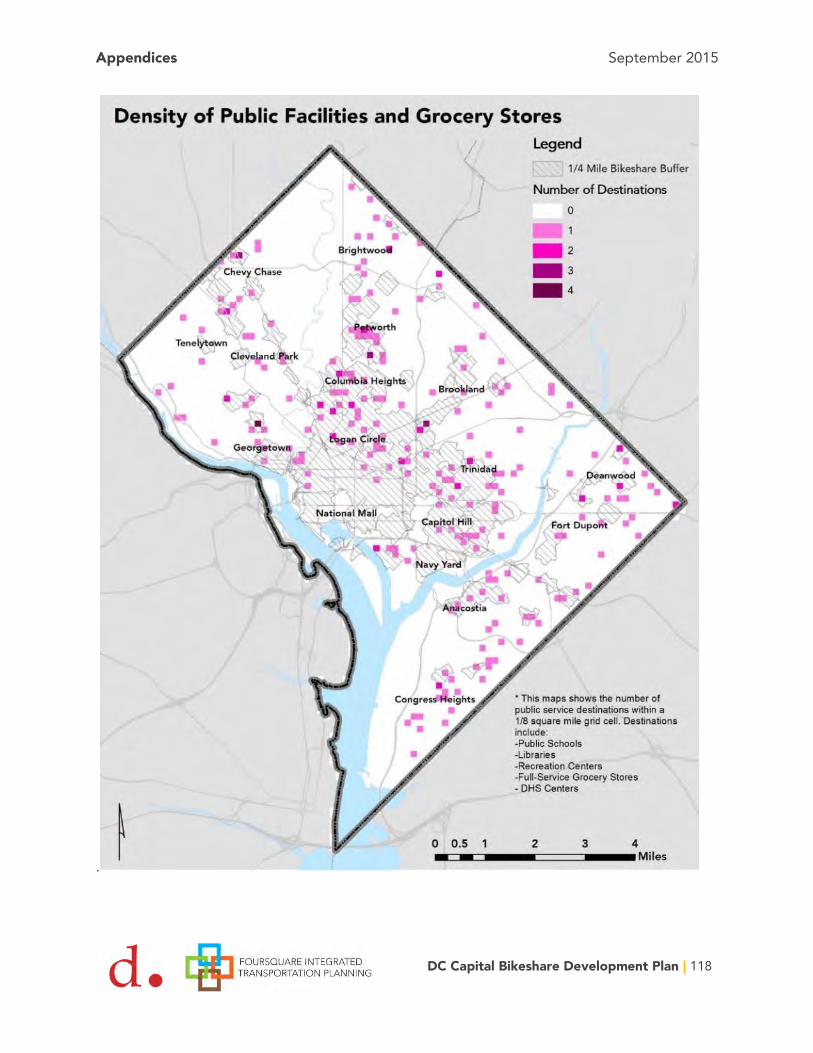
Appendices September 2015
DC Capital Bikeshare Development Plan | 118
.

Appendices September 2015
DC Capital Bikeshare Development Plan | 119
M: Slope (Change in Elevation)
Results This map shows the difference between the lowest and highest point by one eighth of a square mile analysis grid cell. Overall the District of Columbia is fairly flat. Much of the city between Rock Creek and the Anacostia River features little to moderate elevation changes. The neighborhoods west of Rock Creek and east of the Anacostia have a very different topography. Steep slopes pose notable barriers to cycling in certain areas.
Methodology This map is based on contour line elevation data for the District of Columbia. Each grid cell is assigned the maximum and minimum elevation that passes through its boundaries. As the map is based on the natural topography of the city, it does not account for level bridge crossings, such as the Connecticut Avenue bridge, that allow bicyclists to avoid the steep ascent from Rock Creek.
Sources DC Contour Line Elevation.

Appendices September 2015
DC Capital Bikeshare Development Plan | 120
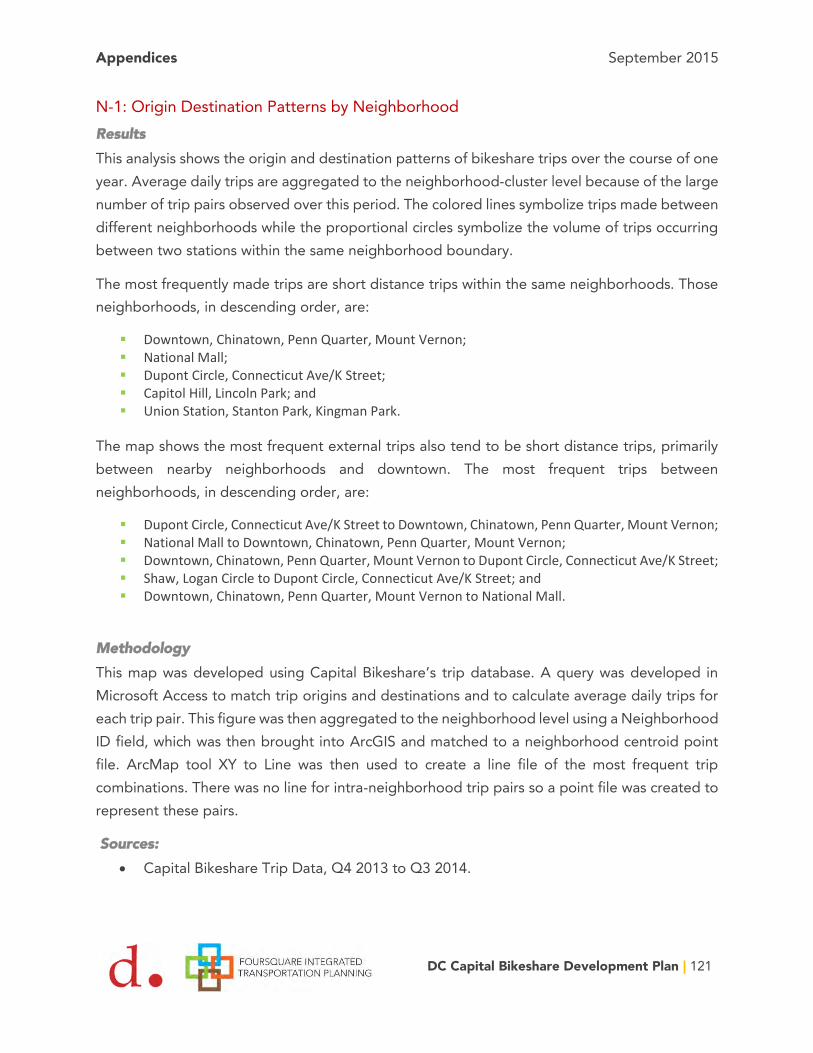
Appendices September 2015
DC Capital Bikeshare Development Plan | 121
N-1: Origin Destination Patterns by Neighborhood
Results This analysis shows the origin and destination patterns of bikeshare trips over the course of one year. Average daily trips are aggregated to the neighborhood-cluster level because of the large number of trip pairs observed over this period. The colored lines symbolize trips made between different neighborhoods while the proportional circles symbolize the volume of trips occurring between two stations within the same neighborhood boundary.
The most frequently made trips are short distance trips within the same neighborhoods. Those neighborhoods, in descending order, are:
Downtown, Chinatown, Penn Quarter, Mount Vernon; National Mall; Dupont Circle, Connecticut Ave/K Street; Capitol Hill, Lincoln Park; and Union Station, Stanton Park, Kingman Park.
The map shows the most frequent external trips also tend to be short distance trips, primarily between nearby neighborhoods and downtown. The most frequent trips between neighborhoods, in descending order, are:
Dupont Circle, Connecticut Ave/K Street to Downtown, Chinatown, Penn Quarter, Mount Vernon; National Mall to Downtown, Chinatown, Penn Quarter, Mount Vernon; Downtown, Chinatown, Penn Quarter, Mount Vernon to Dupont Circle, Connecticut Ave/K Street; Shaw, Logan Circle to Dupont Circle, Connecticut Ave/K Street; and Downtown, Chinatown, Penn Quarter, Mount Vernon to National Mall.
Methodology This map was developed using Capital Bikeshare’s trip database. A query was developed in Microsoft Access to match trip origins and destinations and to calculate average daily trips for each trip pair. This figure was then aggregated to the neighborhood level using a Neighborhood ID field, which was then brought into ArcGIS and matched to a neighborhood centroid point file. ArcMap tool XY to Line was then used to create a line file of the most frequent trip combinations. There was no line for intra-neighborhood trip pairs so a point file was created to represent these pairs.
Sources: Capital Bikeshare Trip Data, Q4 2013 to Q3 2014.

Appendices September 2015
DC Capital Bikeshare Development Plan | 122

Appendices September 2015
DC Capital Bikeshare Development Plan | 123
N-2: Origin-Destination Pairs by Net Directional Imbalance
Results This analysis shows where there is an imbalance in trips between neighborhood pairs. The color symbology shows the absolute difference in the average daily trips between a trip pair and its reverse direction trip pair, aggregated to the neighborhood level. The most common trips to occur disproportionately in one direction reflect the topography of the District. Uphill neighborhoods experience a daily net-loss of bicycles to lower lying destinations. These trip pairs (symbolized in red) are Columbia Heights to Downtown, Columbia Heights to Shaw, and Adams Morgan to Dupont. The map suggests where travel patterns put the greatest strain on Capital Bikeshare’s rebalancing resources.
Methodology This map was developed using Capital Bikeshare’s trip database. A query was developed in Microsoft Access to match trip origins and destinations and to calculate average daily trips for each trip pair. The reverse trip pair and average daily trips were also calculated. To create the map, the average daily trips and reverse daily trips were aggregated to the neighborhood of the station of origin and then the absolute difference between the two values were calculated.
Sources: Capital Bikeshare Trip Data, Q4 2013 to Q3 2014.
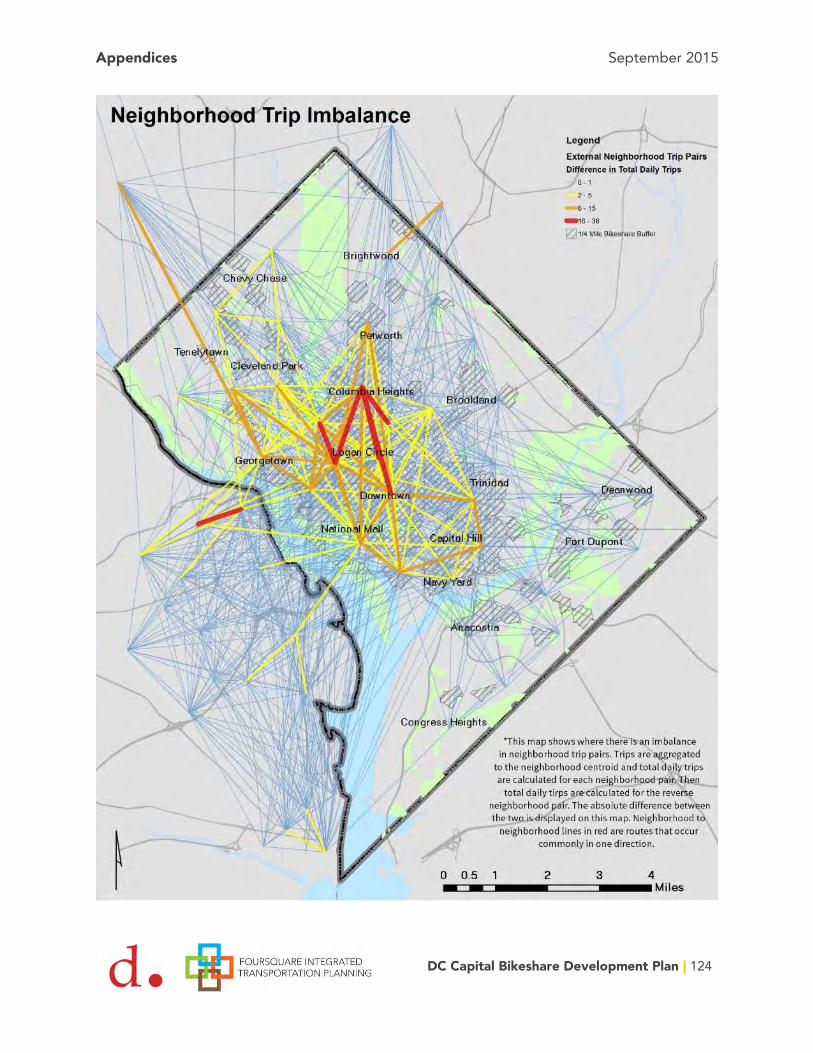
Appendices September 2015
DC Capital Bikeshare Development Plan | 124
Appendices September 2015
DC Capital Bikeshare Development Plan | 125
O: Overtime by Station
Results This map is intended to illustrate which stations produce the greatest amount of revenue from usage fees. The map uses overtime minutes – the number of minutes a rider takes over the first 30 free minutes – as a proxy for revenue. Usage fees are an important source of revenue for Capital Bikeshare. The analysis finds that many of the highest ridership stations are not necessarily the most important stations from a revenue generating standpoint. Stations located at major tourist and recreation sites generate a disproportionate number of overtime minutes. Busy commuter bikeshare stations in Downtown DC and surrounding dense neighborhoods produce many trips, but most of these trips are short and do not incur any overtime.
The top five stations for over-time generation account for 21 percent of average daily overtime minutes system-wide. Four of these stations are located on the National Mall, with the remaining station is located at the National Portrait Gallery. For comparison, the five busiest stations in terms of trips, account for only nine percent of ridership system wide.
Methodology This map is based on all trips taken between the October 1, 2013 and September 30, 2014. Based on the total trip duration, the ride time greater than 30 minutes was calculated and summed to the start station. The average daily overtime was calculated by dividing the total overtime minutes by the number of days the station was active during the one year period.
Sources Capital Bikeshare Trip Data, Q4 2013 to Q3 2014.
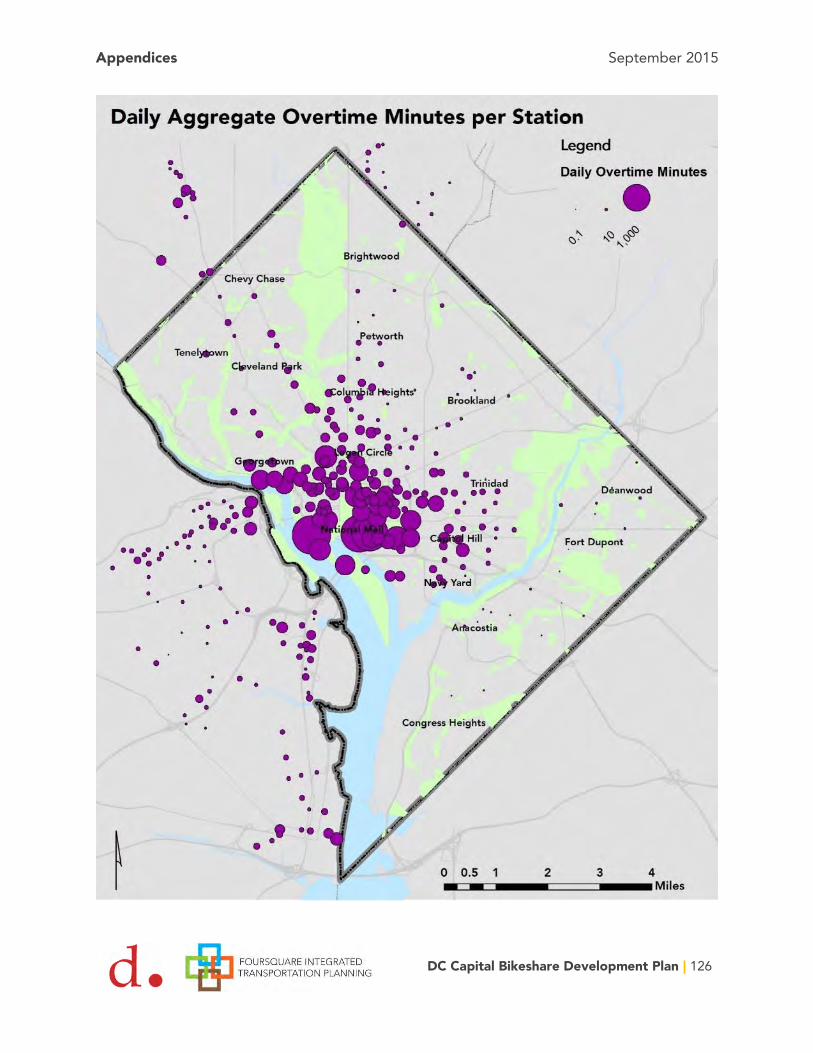
Appendices September 2015
DC Capital Bikeshare Development Plan | 126

Appendices September 2015
DC Capital Bikeshare Development Plan | 127
P: Density of Capital Bikeshare Members
Results This map depicts the distribution of Capital Bikeshare members across the city to identify where the highest concentration of bikeshare members live. Capital Bikeshare users are highly concentrated in two clusters. The first covers the Mid-City neighborhoods of Northwest DC, including Logan Circle, U Street, Columbia Heights, and Shaw. The second cluster is located on Capitol Hill and H Street. Smaller clusters of bikeshare users exist along Wisconsin and Connecticut Avenue in west of Rock Creek Park; portions of downtown with high residential populations; and the Southwest Waterfront area.
Methodology This map is based on anonymized data on the home location of active Capital Bikeshare members. To protect user privacy, addresses were provided at the intersection level. The team mapped the data to a one eighth of a square mile grid.
Sources Capital Bikeshare
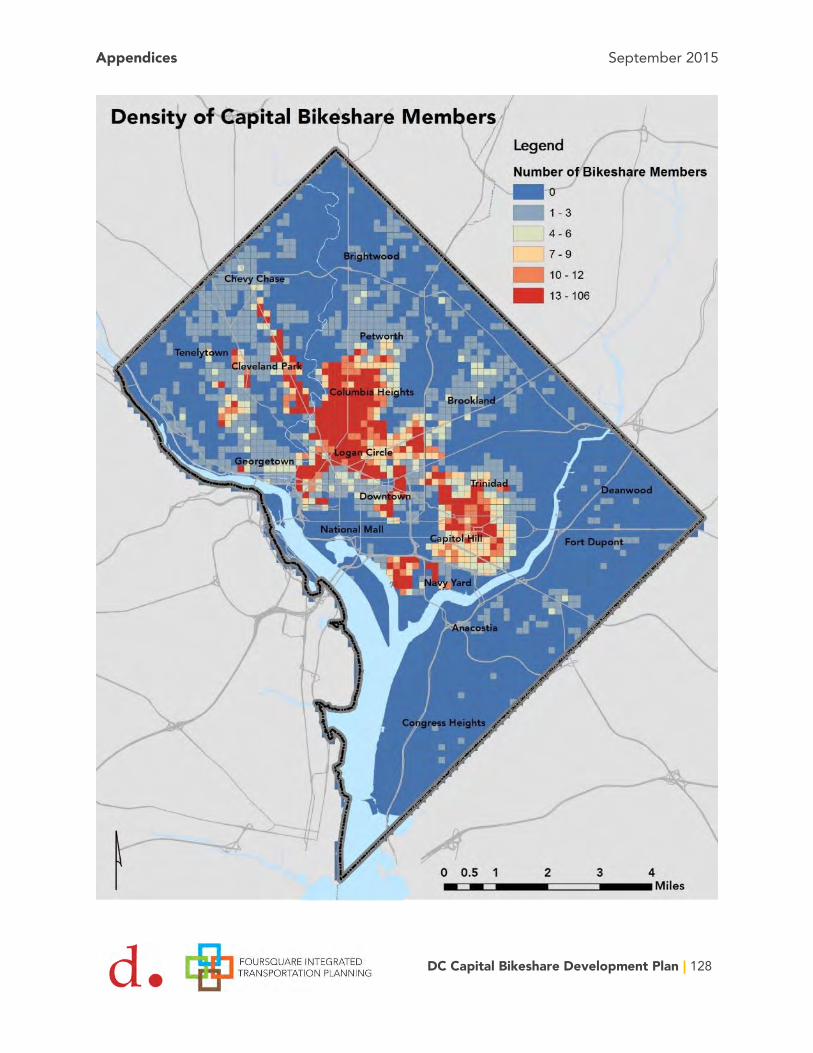
Appendices September 2015
DC Capital Bikeshare Development Plan | 128

Appendices September 2015
DC Capital Bikeshare Development Plan | 129
Q: Absolute Number of Bicycle Commuters
Results This map shows the number of bicycle commuters based on Census Tract geography. Existing high rates of bicycle usage are a good indicator of bikeshare demand. The areas with a high concentration of bicycle commuters in this map aligns well with the locations that feature a concentration of active Capital Bikeshare members. The greatest concentration of bicycle commuters in DC live in the Mid-City neighborhoods of Northwest DC (Logan Circle, U Street, Columbia Heights, Shaw) as well as the Capitol Hill/ H Street/ Eastern Market area. The neighborhoods near George Washington University and American University show a concentration of bicycle commuters as well, although this trend does not apply the other universities in the city.
Methodology This map is based on the US Census, American Community Survey. The map shows the absolute number of bicycle commuters as opposed to the percent of bicycle commuters among all commuters. The team chose to focus on absolute bicycle commuter counts rather than the percentage so as not to over-emphasize areas with a proportionally high number of bicycle commuters but overall small commuting population.
Sources US Census, American Community Survey 2008-2013
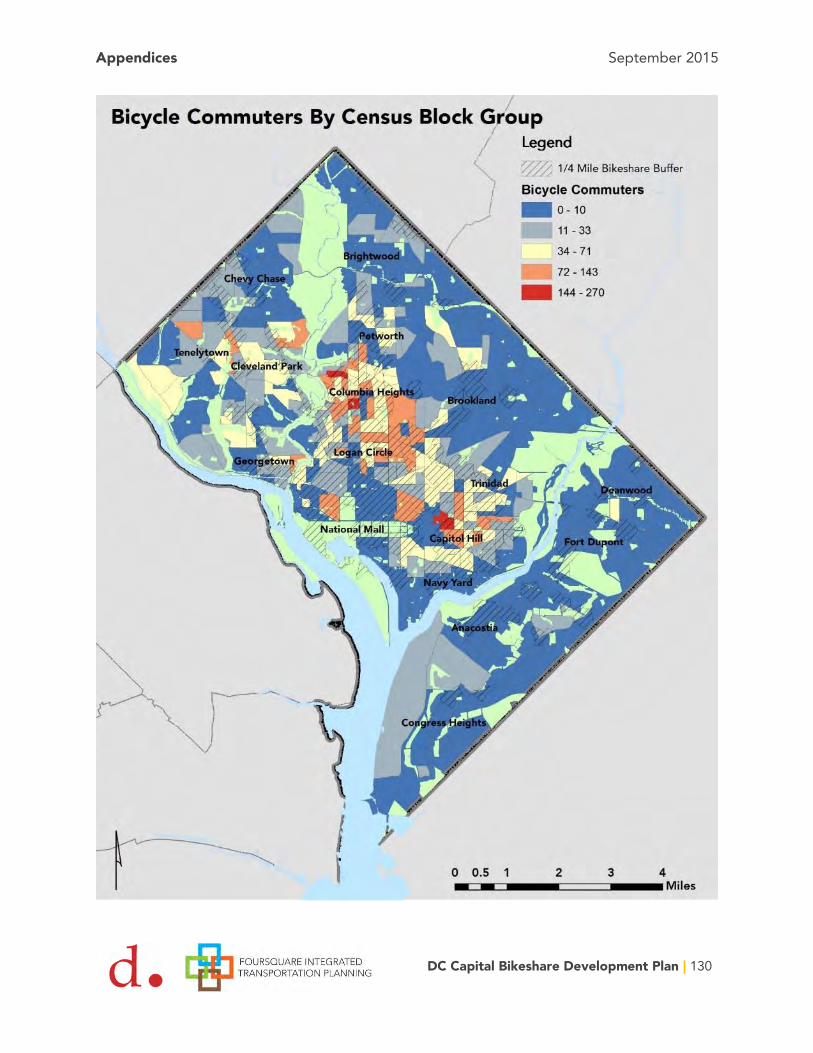
Appendices September 2015
DC Capital Bikeshare Development Plan | 130

Appendices September 2015
DC Capital Bikeshare Development Plan | 131
R: Heat Map of Bikeshare Station Requests
Results This map shows the concentration of station requests submitted through the Capital Bikeshare crowdsourcing map. Requests for new stations are largely concentrated in the parts of the District west of the Anacostia River. High demand locations include:
Dupont Circle Logan Circle U Street Columbia Heights Petworth Brightwood along Georgia Avenue Cathedral Heights National Arboretum The Palisades Georgetown Southwest Waterfront Chevy Chase
Methodology This map is a raster heat map based on location data pulled from the Capital Bikeshare request-a-station crowdsourcing map. The station requests are mapped as points. As many points are overlapping or clustered, the point data was converted to a raster heat map to show the density of station requests.
Sources http://cabistations.com/ data provided by GoDCGo
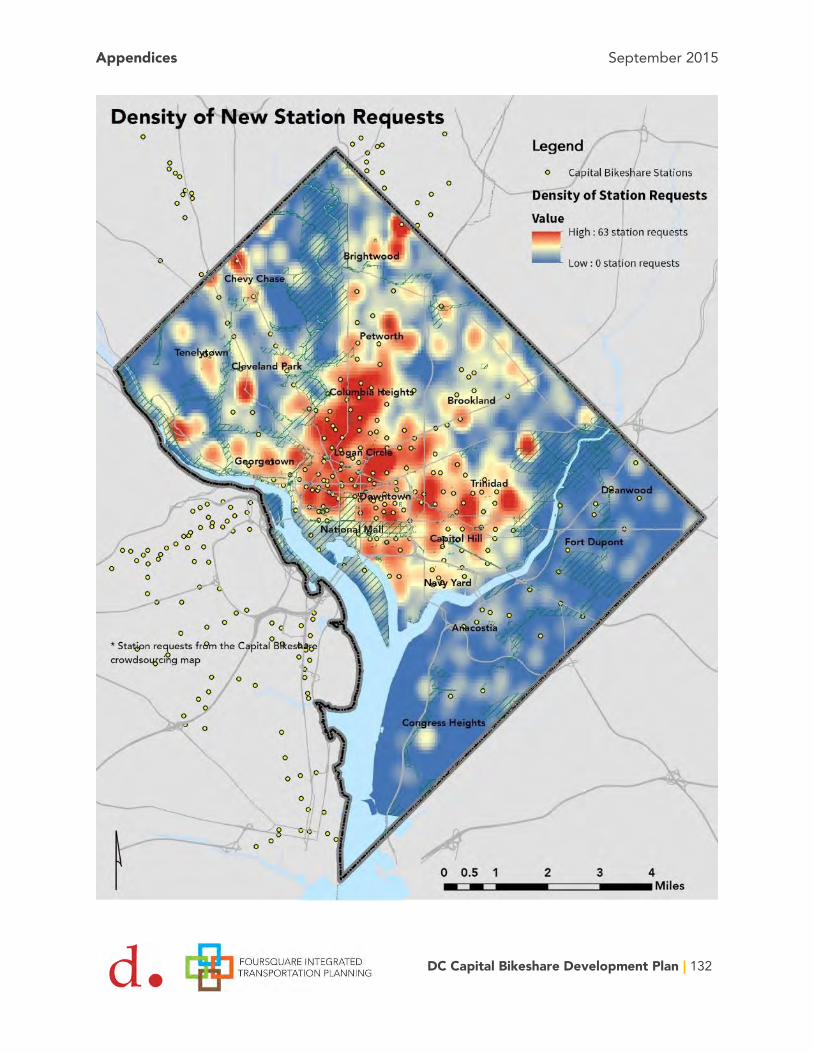
Appendices September 2015
DC Capital Bikeshare Development Plan | 132

Appendices September 2015
DC Capital Bikeshare Development Plan | 133
Appendix B: Propensity Mapping Methodology
Background The bikeshare market study examines 19 different geographic measures related to bikeshare usage. In order to summarize this extensive analysis and support later stages of the Development Plan, a series of aggregate propensity maps were developed. The sixteen measures were combined into four separate analyses, each one which looked at specific market segments/market typologies:
High Ridership: Measures that indicated a high overall demand for bikeshare.
High Revenue: Measures that indicate a high revenue potential, especially among casual users.
Public Welfare and Health: Measures that indicate where bikeshare stations would have a major impact on public welfare and health goals like combatting obesity, increasing the diversity of bikeshare users, and improving access to public facilities.
High Accessibility: Measures that indicate where bikeshare stations would best contribute to regional accessibility.
Mapping Measures to a Grid All measurements in the market study were aggregated to an analysis grid that covers the entire District of Columbia. Each analysis grid cell is one eighth by one eighth of a miles in area. Measures were assigned to the grid by simply averaging all values that overlap with a grid cell. Point based measures, like number of visitors per year to major tourist sites, are aggregated through a quarter-mile search distance.
Normalizing Data As the input measures in this analysis feature drastically different ranges and numerical distributions, normalization had to occur to allow for the development of propensity maps. The normalization process serves two purposes. First it constrains all factors to a range from zero (minimum) to one (maximum). Second, normalization allows for the removal of outliers that can skew the data.
Several methods were utilized to normalize the data to a standard scale (see Table B-1). For most measures, the cell’s value was normalized to its proportion of the maximum value in the sample. To control for outliers, the maximum was defined as a certain percentile (varied based

Appendices September 2015
DC Capital Bikeshare Development Plan | 134
on the distribution but typically either the 99th or 99.5th percentile). For example the average minority population density ranged from zero to 64,543 people per square mile, with the 99th percentile at 34,307 people per square mile. A cell with a minority population density of 17,153 receives a normalized score of 0.5, while a cell with an average minority population density of 45,000 would receive a normalized score of 1.0.
Certain measures were normalized by alternative methods. Factors like employment density, and tourist attractions do not lend themselves as well to proportional normalization as they have significant break points that are far below the samples maximum or even 99th percentile values. For example, population and employment density uses break points defined state-level and federal guidance on transit propensity; using a proportional method would under-score many areas that have population densities conducive to bike sharing.
Combining Data into a Unified Measure To arrive at the final four propensity maps, a set of relevant factors were identified for each of the propensity maps, and added together. Certain factors perceived as more significant were given a double weighting, while the normalized change in elevation was subtracted from the score. Table B-1 shows the factors and weighting used to develop the four propensity maps.
High Ridership propensity is derived from factors shown to contribute to high bikeshare usage. These factors include overall high travel demand, density, availability of bicycle infrastructure, existing bicycle mode share, and the density of retail. The most important factors in high bikeshare ridership are population and employment density.
High Revenue propensity is based on factors that drive casual trips taken by infrequent users and tourists. Casual users contribute a large share of total revenue, and generally occur in and around retail destinations, tourist sites, major hotels, and densely developed neighborhoods.
The Public Welfare propensity is built around factors that illustrate public policy objectives. This analysis includes minority population, low income population, the obesity rate, access to public services, access to grocery stores, and overall population and employment density.
Finally the accessibility measure looks at connectivity to trip generators, public facilities, transportation infrastructure, and public transit service. Factors include transit activity, bike infrastructure, trip generation, and public services.
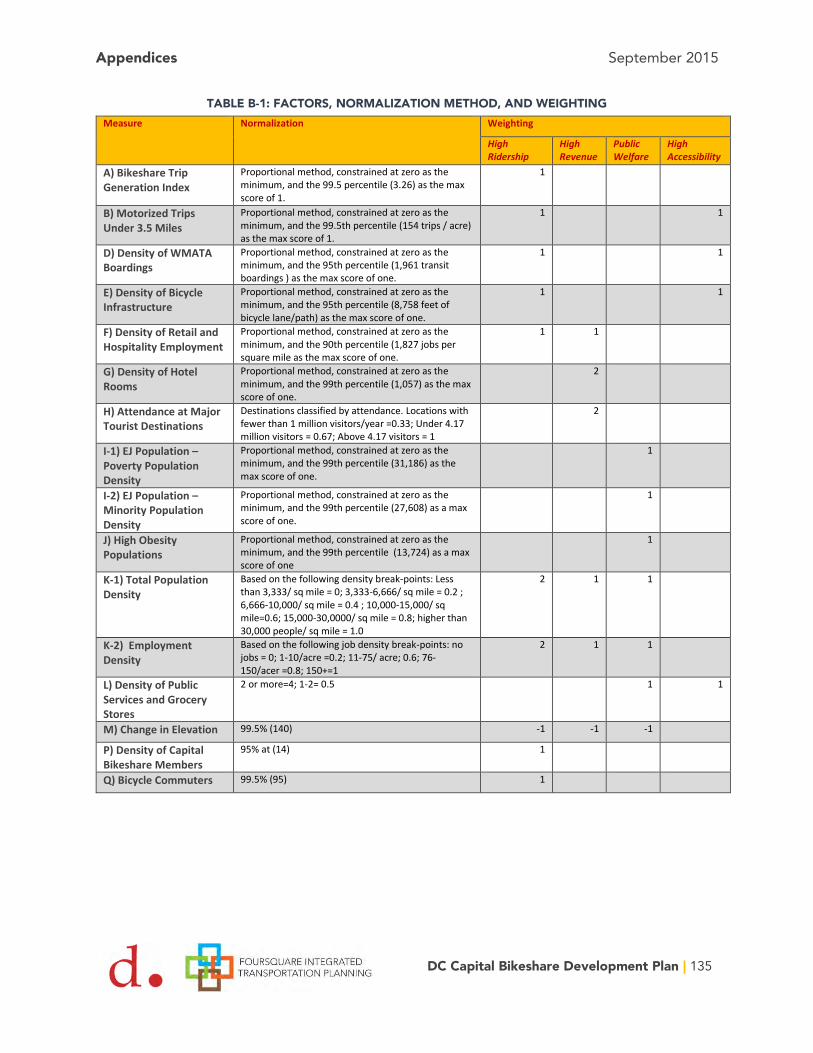
Appendices September 2015
DC Capital Bikeshare Development Plan | 135
TABLE B-1: FACTORS, NORMALIZATION METHOD, AND WEIGHTING Measure Normalization Weighting
High Ridership
High Revenue
Public Welfare
High Accessibility
A) Bikeshare Trip Generation Index
Proportional method, constrained at zero as the minimum, and the 99.5 percentile (3.26) as the max score of 1.
1
B) Motorized Trips Under 3.5 Miles
Proportional method, constrained at zero as the minimum, and the 99.5th percentile (154 trips / acre) as the max score of 1.
1 1
D) Density of WMATA Boardings
Proportional method, constrained at zero as the minimum, and the 95th percentile (1,961 transit boardings ) as the max score of one.
1 1
E) Density of Bicycle Infrastructure
Proportional method, constrained at zero as the minimum, and the 95th percentile (8,758 feet of bicycle lane/path) as the max score of one.
1 1
F) Density of Retail and Hospitality Employment
Proportional method, constrained at zero as the minimum, and the 90th percentile (1,827 jobs per square mile as the max score of one.
1 1
G) Density of Hotel Rooms
Proportional method, constrained at zero as the minimum, and the 99th percentile (1,057) as the max score of one.
2
H) Attendance at Major Tourist Destinations
Destinations classified by attendance. Locations with fewer than 1 million visitors/year =0.33; Under 4.17 million visitors = 0.67; Above 4.17 visitors = 1
2
I-1) EJ Population – Poverty Population Density
Proportional method, constrained at zero as the minimum, and the 99th percentile (31,186) as the max score of one.
1
I-2) EJ Population – Minority Population Density
Proportional method, constrained at zero as the minimum, and the 99th percentile (27,608) as a max score of one.
1
J) High Obesity Populations
Proportional method, constrained at zero as the minimum, and the 99th percentile (13,724) as a max score of one
1
K-1) Total Population Density
Based on the following density break-points: Less than 3,333/ sq mile = 0; 3,333-6,666/ sq mile = 0.2 ; 6,666-10,000/ sq mile = 0.4 ; 10,000-15,000/ sq mile=0.6; 15,000-30,0000/ sq mile = 0.8; higher than 30,000 people/ sq mile = 1.0
2 1 1
K-2) Employment Density
Based on the following job density break-points: no jobs = 0; 1-10/acre =0.2; 11-75/ acre; 0.6; 76-150/acer =0.8; 150+=1
2 1 1
L) Density of Public Services and Grocery Stores
2 or more=4; 1-2= 0.5 1 1
M) Change in Elevation 99.5% (140) -1 -1 -1
P) Density of Capital Bikeshare Members
95% at (14) 1
Q) Bicycle Commuters 99.5% (95) 1

Appendices September 2015
DC Capital Bikeshare Development Plan | 136
TABLE B-2 | SUMMARY STATISTICS BY MEASURE Measures Min Max Standard
Deviation
Mean Median 99.9th
Percentile
99.5th
Percentile
99th
Percentile
A) Bikeshare Trip Generation Index
-6.74 7.84 0.79 0.61 0.61 4.86 3.26 2.65
B) Motorized Trips Under 3.5 Miles
0.00 252.66 27.64 27.99 20.57 192.22 154.64 129.17
D) Density of WMATA Boardings
0.00 35,979.00 2,396.78 580.59 17.00 24,604.94 18,416.45 13,601.60
E) Density of Bicycle Infrastructure
0.00 20,286.90 3,046.94 2,227.73 1,041.63 18,511.35 14,684.70 13,329.70
F) Density of Retail and Hospitality Employment
0.00 116,222.24 5,523.93 1,143.81 0.00 81,365.27 35,438.62 25,030.80
G) Density of Hotel Rooms 0.00 2,559.00 181.47 32.95 0.00 2,329.78 1,393.60 1,057.45
H) Attendance at Major Tourist Destinations
0.00 26,100,000 1,846,058 306,117 0.00 22,768,000 16,200,000 9,973,500
I-1) EJ Population – Poverty Population Density
0.00 65,453.54 6,642.28 5,994.44 3,551.93 46,112.42 34,307.41 27,608.24
I-2) EJ Population – Minority Population Density
0.00 25,192.14 2,908.76 2,253.37 1,243.11 19,322.54 14,707.95 13,185.79
J) High Obesity Populations
0.00 39,222.30 3,362.07 2,670.60 1,288.53 22,257.32 15,937.83 13,724.12
K-1) Total Population Density
0.00 1,079.00 64.07 14.33 1.00 852.75 493.38 344.00
K-2) Employment Density 0.00 142,272.08 11,078.27 8,895.65 5,759.71 86,447.30 60,457.42 51,902.15
L) Density of Public Services and Grocery Stores
0.00 4.00 0.51 0.24 0.00 4.00 2.00 2.00
M) Change in Elevation 0.00 180.00 31.75 34.40 30.00 170.00 140.00 130.00
P) Density of Capital Bikeshare Members
0.00 106.00 7.23 2.30 0.00 81.33 47.13 35.90
Q) Bicycle Commuters 0.00 185.00 21.19 13.90 5.29 146.74 115.53 95.00


