District of Lake Country Source to Tap Assessment of the South Kalamalka Lake Intake – July 2010. Executive Summary The objectives of this assessment of the South Kalamalka Lake Intake were to characterize the lake and its immediate watershed, identify current and forecast future drinking water hazards and vulnerabilities, characterize the risk posed by each hazard and provide recommendations to reduce the impacts on District of Lake Country South Kalamalka intake. This assessment characterized natural and man-induced hazards to drinking water quality as physical, chemical or biological. Existing research was augmented by field studies of water currents near the intake and lab studies on the fall rates of particulate contaminants. This research was used to define a proposed Intake Protection Zone (IPZ), based on a two hour travel time of water currents to the intake. The hazard assessments were then divided into those occurring inside the IPZ and those occurring outside the IPZ. The same hazard occurring outside the IPZ was given a lower risk rating than that hazard presented within the IPZ where there is less dilution and less time to react to a contaminant. Specific recommendations and action plans were developed: (1) source protection for South Kalamalka Lake (2) water treatment and system protection plan and (3) future large expenditure improvements to the DLC Kalamalka Lake water system. Key recommendations include: applying for a License of Occupation over the Int ake Protection Zone; considering bylaws to protect the foreshore; modifying the water quality monitoring to comply with IHA filtration deferral; replacing the raw water sample line on the intake to comply with IHA requirements; continue to collect data on extending the intake; have a Comprehensive Emergency Plan prepared, and work with the railway and Hwy 97 on materials hauled and appropriate spill containment. This assessment confirms what we all know; source protection is important to preserving low-cost safe drinking water and it requires the co-operation of every Okanagan resident. Acknowledgements: Funding by District of Lake Country and Okanagan Basin Water Board Principal Author: H. Larratt, Data Management B. Larratt, Technical Illustrations R. Massey, Assistance from DLC staff P. Hansen, J. Allingham, Shane Cote and Greg Bucholtz.
Transcript
District of Lake Country Source to Tap Assessment of theSouth Kalamalka Lake Intake – July 2010.
Executive Summary
The objectives of this assessment of the South Kalamalka Lake Intake were tocharacterize the lake and its immediate watershed, identify current and forecast futuredrinking water hazards and vulnerabilities, characterize the risk posed by each hazardand provide recommendations to reduce the impacts on District of Lake Country SouthKalamalka intake.
This assessment characterized natural and man-induced hazards to drinking waterquality as physical, chemical or biological. Existing research was augmented by fieldstudies of water currents near the intake and lab studies on the fall rates of particulatecontaminants. This research was used to define a proposed Intake Protection Zone(IPZ), based on a two hour travel time of water currents to the intake. The hazardassessments were then divided into those occurring inside the IPZ and those occurringoutside the IPZ. The same hazard occurring outside the IPZ was given a lower riskrating than that hazard presented within the IPZ where there is less dilution and lesstime to react to a contaminant.
Specific recommendations and action plans were developed: (1) source protection forSouth Kalamalka Lake (2) water treatment and system protection plan and (3) futurelarge expenditure improvements to the DLC Kalamalka Lake water system. Keyrecommendations include: applying for a License of Occupation over the IntakeProtection Zone; considering bylaws to protect the foreshore; modifying the water qualitymonitoring to comply with IHA filtration deferral; replacing the raw water sample line onthe intake to comply with IHA requirements; continue to collect data on extending theintake; have a Comprehensive Emergency Plan prepared, and work with the railway andHwy 97 on materials hauled and appropriate spill containment.
This assessment confirms what we all know; source protection is important to preservinglow-cost safe drinking water and it requires the co-operation of every Okanaganresident.
Acknowledgements:Funding by District of Lake Country and Okanagan Basin Water Board
Principal Author: H. Larratt, Data Management B. Larratt, Technical IllustrationsR. Massey, Assistance from DLC staff P. Hansen, J. Allingham, Shane Cote andGreg Bucholtz.
2
Table of Contents
EXECUTIVE SUMMARY
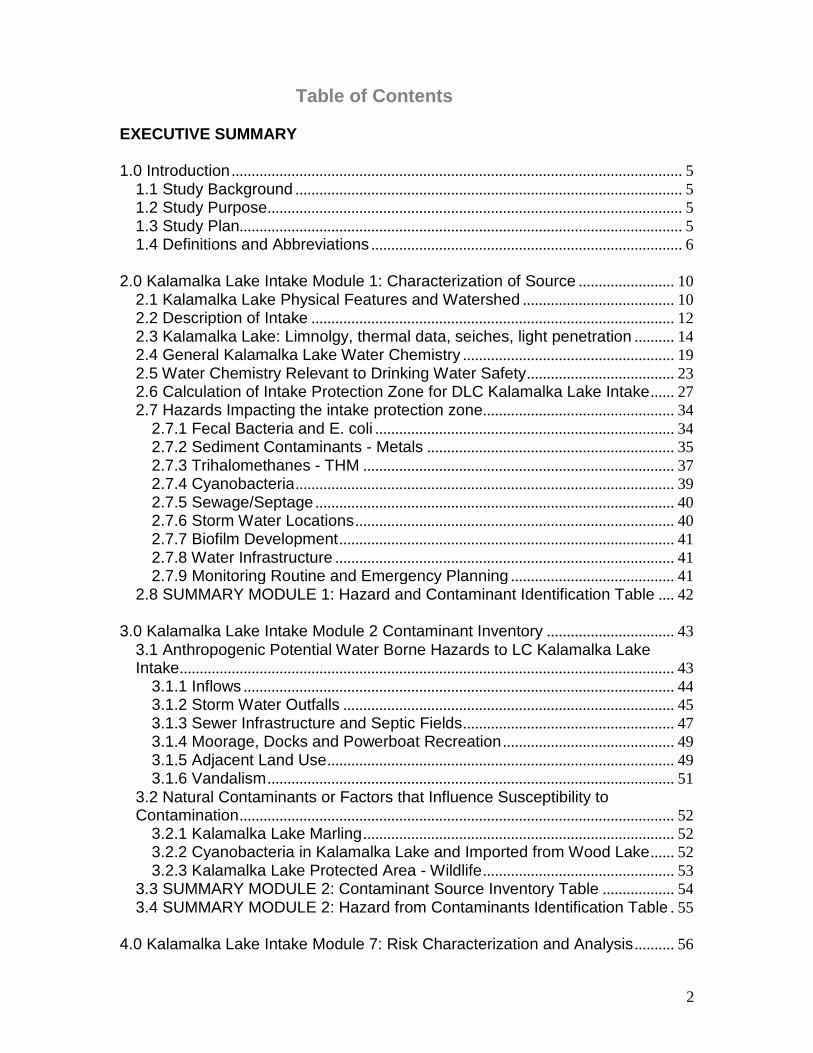
1.0 Introduction ................................................................................................................. 51.1 Study Background ................................................................................................. 51.2 Study Purpose........................................................................................................ 51.3 Study Plan............................................................................................................... 51.4 Definitions and Abbreviations .............................................................................. 6
2.0 Kalamalka Lake Intake Module 1: Characterization of Source ........................ 102.1 Kalamalka Lake Physical Features and Watershed ...................................... 102.2 Description of Intake ........................................................................................... 122.3 Kalamalka Lake: Limnolgy, thermal data, seiches, light penetration .......... 142.4 General Kalamalka Lake Water Chemistry ..................................................... 192.5 Water Chemistry Relevant to Drinking Water Safety..................................... 232.6 Calculation of Intake Protection Zone for DLC Kalamalka Lake Intake...... 272.7 Hazards Impacting the intake protection zone................................................ 34
2.7.1 Fecal Bacteria and E. coli ........................................................................... 342.7.2 Sediment Contaminants - Metals .............................................................. 352.7.3 Trihalomethanes - THM .............................................................................. 372.7.4 Cyanobacteria............................................................................................... 392.7.5 Sewage/Septage .......................................................................................... 402.7.6 Storm Water Locations................................................................................ 402.7.7 Biofilm Development.................................................................................... 412.7.8 Water Infrastructure ..................................................................................... 412.7.9 Monitoring Routine and Emergency Planning ......................................... 41
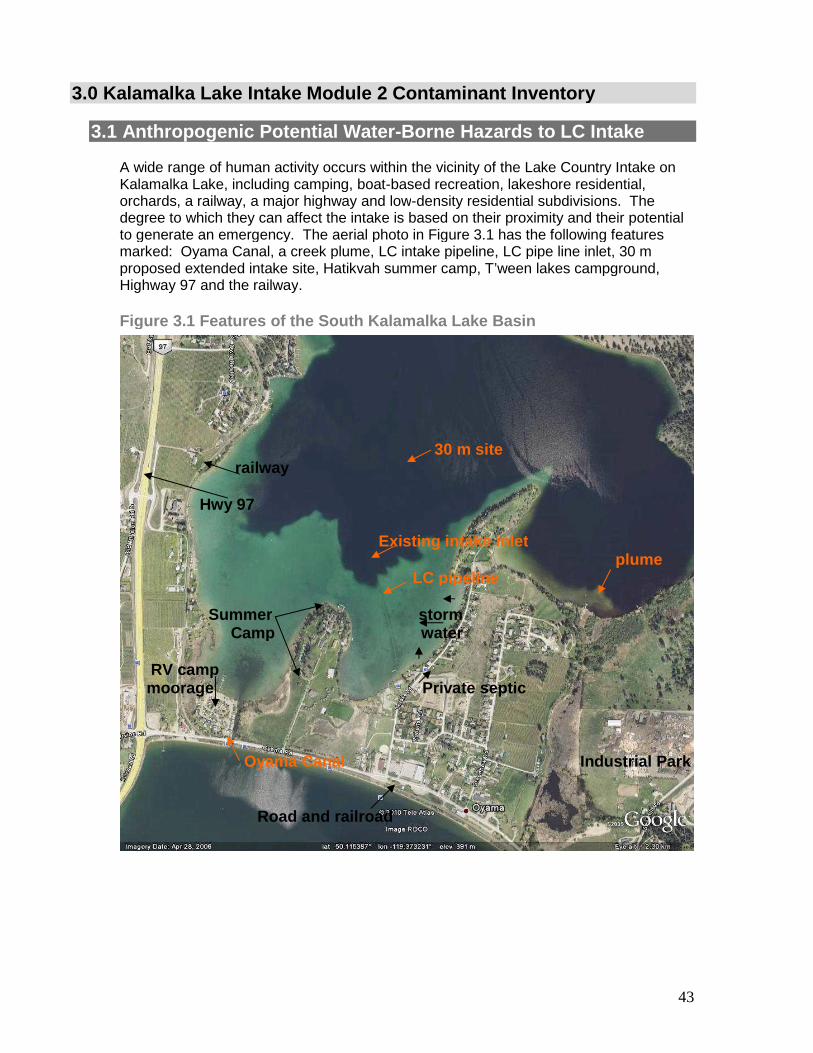
3.0 Kalamalka Lake Intake Module 2 Contaminant Inventory ................................ 433.1 Anthropogenic Potential Water Borne Hazards to LC Kalamalka LakeIntake............................................................................................................................ 43
3.1.1 Inflows ............................................................................................................ 443.1.2 Storm Water Outfalls ................................................................................... 453.1.3 Sewer Infrastructure and Septic Fields..................................................... 473.1.4 Moorage, Docks and Powerboat Recreation ........................................... 493.1.5 Adjacent Land Use....................................................................................... 493.1.6 Vandalism ...................................................................................................... 51
3.2 Natural Contaminants or Factors that Influence Susceptibility toContamination............................................................................................................. 52
3.2.1 Kalamalka Lake Marling.............................................................................. 523.2.2 Cyanobacteria in Kalamalka Lake and Imported from Wood Lake...... 523.2.3 Kalamalka Lake Protected Area - Wildlife................................................ 53
4.0 Kalamalka Lake Intake Module 7: Risk Characterization and Analysis .......... 56
3
4.1 Condition of Source............................................................................................. 614.2 Physical Integrity of Intake, Treatment and Distribution System ................. 614.3 Risk Assessment for Healthy and Health Compromised I ndividuals ......... 614.4 Strength/Weakness Opportunites/Threats SWOT Analysis ......................... 62
5.0 Kalamalka Lake Intake Module 8: Recommendations ...................................... 635.1 Source Protection Action Plan........................................................................... 635.2 Water Treatment and System Protection Plan ............................................... 655.3 Future Large Expenditure Improvements to LC System ............................... 67
Literature Cited or Consulted ....................................................................................... 70
Disclaimer: This report is based on limited, cost-constrained research on complex lakesystems. Larratt Aquatic Consulting Ltd and its associates have made a best attempt ataccuracy in data collection and presentation. No liability is incurred by LAC or DLC foraccidental omissions or errors made in the preparation of this report.
4
Figures, Tables and Appendices
Figure 1.1 Aerial Image and Bathymetric Map of South Kalamalka Lake
Figure 2.1 Seiche-Induced Temperature and Turbidity Spike at IntakeFigure 2.2 Thermistor Water Layer Temperature (for one year and multi-year)Figure 2.3 Kalamalka Lake South Intake Site Temperature and Dissolved
Oxygen Profiles, 2008Figure 2.4 Growing Season pH in Kalamalka Lake, 1981 – 2008Figure 2.5 Secchi Depth Average and Range in North and South
Kalamalka Lake, 2000 – 2008Figure 2.6 Average Total Nitrogen and Phosphorus in Kalamalka Lake, 1975 – 2008Figure 2.7 Chlorophyll-a in Kalamalka Lake, 1999 – 2008Figure 2.8 Average Growing Season Chlorophyll-a, 1999 – 2008Figure 2.9 Average Total Organic Carbon in Kalamalka and Wood LakesFigure 2.10 Turbidity at South Kalamalka, Lake Country Intake, 2008Figure 2.11 Annual Average Turbidity at Kalamalka Lake Intake, 2004 – 2009Figure 2:12 Average Turbidity at South Kalamalka and Wood Lakes, 2004 - 2009Figure 2.13 Photos of Settling Velocity Experiment, Kalamalka Lake, 2009Figure 2.14 South Kalamalka Lake Drogue Trials, 2009Figure 2.15 Proposed DLC Kalamalka Lake Intake Protection Zone
Figure 3.1 Features of the South Kalamalka Lake BasinFigure 3.2 Sodium and Chloride in Kalamalka Lake
Table 2.1 Size and Fall Velocity Estimates for Kalamalka Lake ParticulatesTable 2.2 Drogue Results of Lake Country Kalamalka Lake Intake Area 2009Table 2.3: Kalamalka Lake South Bacterial Water Quality 2009Table 2.4 Triplicate Sediment Core Results from 20m Near South Kalamalka
Lake Country Intake, 2001Table 2.5 Suspended Sediment Beneath South Kalamalka Lake Intake, 2009Table 2.6 Toxins Produced by Blue-Green Algae (Cyanobacteria)
Table 3.1 Annual Average Water Quality in Wood Lake and South Kalamalka LakeTable 3.2 Amry Effluent Data 2009-2010 and Monitoring Well Data
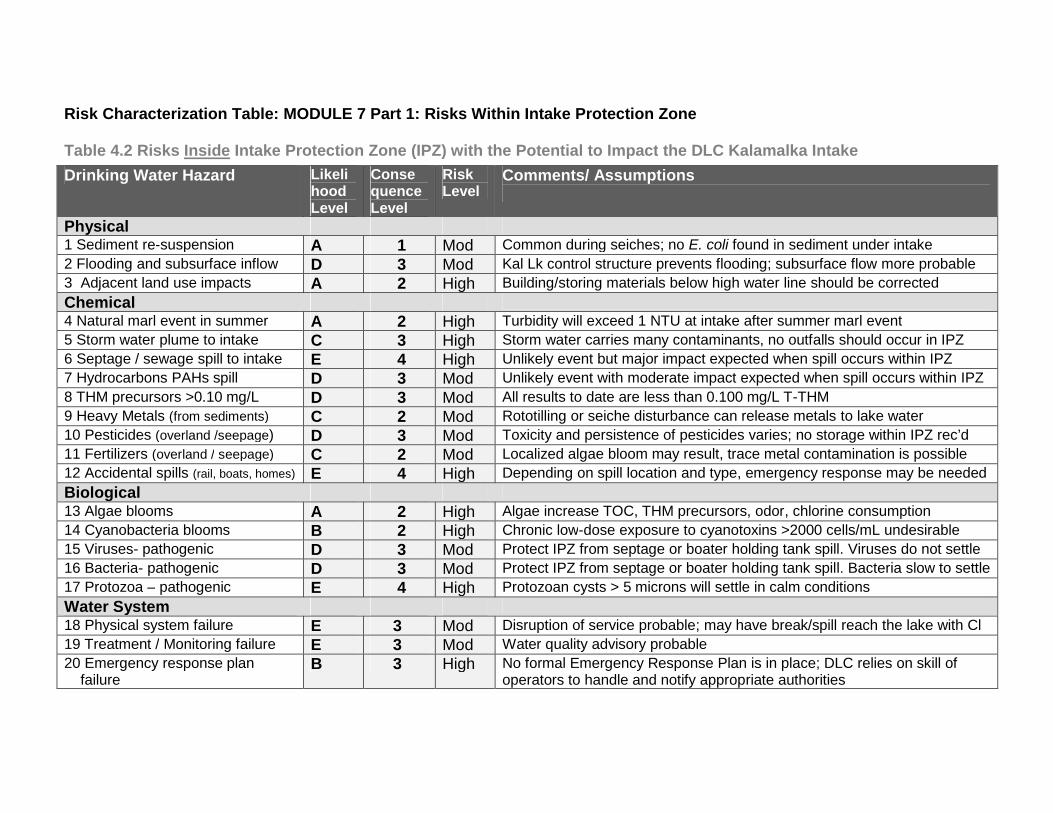
Table 4.1 Module 7 Hazard and Risk TablesTable 4.2 Risks INSIDE the Intake Protection Zone with the Potential to Impact the
DLC Kalamalka IntakeTable 4.3 Risks OUTSIDE the Intake Protection Zone with the Potential to Impact the
DLC Kalamalka IntakeTable 4.4 Strength/Weakness Opportunities/Threats Analysis Summary of
The DLC Kalamalka Lake Intake
Appendix 1: Supporting DocumentationAppendix 2: Activities Impacting the Intake Protection Zone ChecklistAppendix 3: E. coli Source Tracking in City of Kelowna Creeks Receiving Storm Water
and at Beaches
5
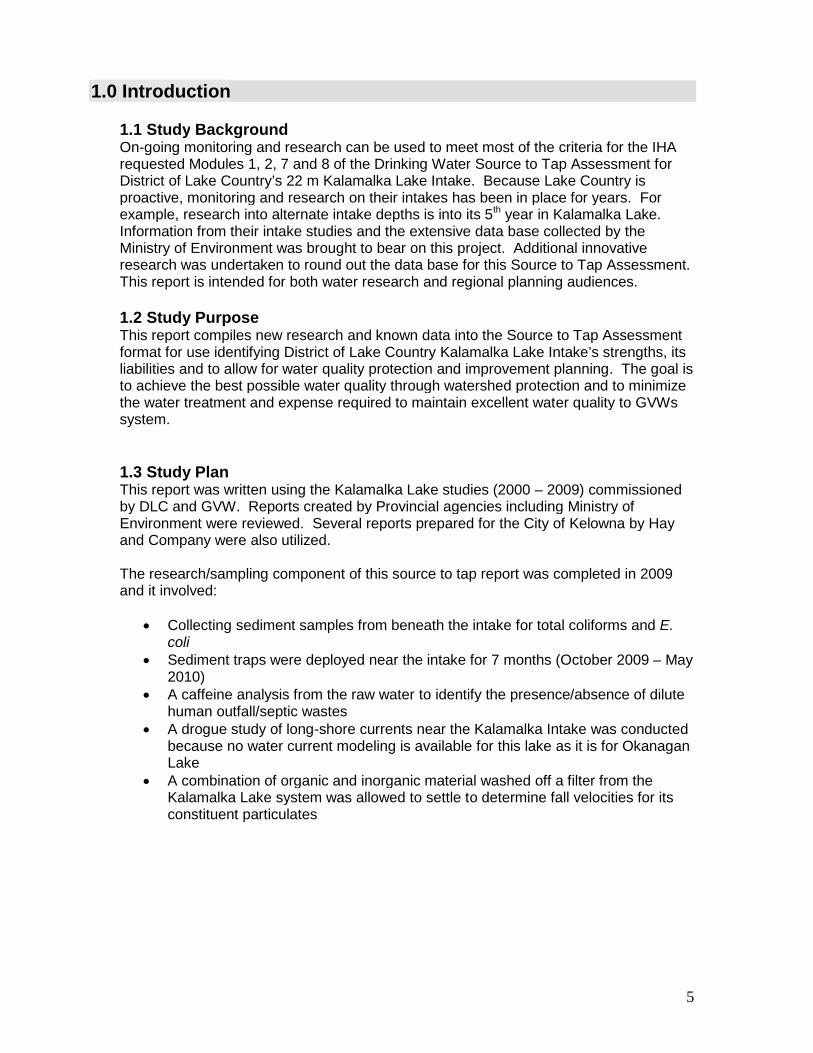
1.0 Introduction
1.1 Study BackgroundOn-going monitoring and research can be used to meet most of the criteria for the IHArequested Modules 1, 2, 7 and 8 of the Drinking Water Source to Tap Assessment forDistrict of Lake Country’s 22 m Kalamalka Lake Intake. Because Lake Country isproactive, monitoring and research on their intakes has been in place for years. Forexample, research into alternate intake depths is into its 5th year in Kalamalka Lake.Information from their intake studies and the extensive data base collected by theMinistry of Environment was brought to bear on this project. Additional innovativeresearch was undertaken to round out the data base for this Source to Tap Assessment.This report is intended for both water research and regional planning audiences.
1.2 Study PurposeThis report compiles new research and known data into the Source to Tap Assessmentformat for use identifying District of Lake Country Kalamalka Lake Intake’s strengths, itsliabilities and to allow for water quality protection and improvement planning. The goal isto achieve the best possible water quality through watershed protection and to minimizethe water treatment and expense required to maintain excellent water quality to GVWssystem.
1.3 Study PlanThis report was written using the Kalamalka Lake studies (2000 – 2009) commissionedby DLC and GVW. Reports created by Provincial agencies including Ministry ofEnvironment were reviewed. Several reports prepared for the City of Kelowna by Hayand Company were also utilized.
The research/sampling component of this source to tap report was completed in 2009and it involved:
Collecting sediment samples from beneath the intake for total coliforms and E.coli
Sediment traps were deployed near the intake for 7 months (October 2009 – May2010)
A caffeine analysis from the raw water to identify the presence/absence of dilutehuman outfall/septic wastes
A drogue study of long-shore currents near the Kalamalka Intake was conductedbecause no water current modeling is available for this lake as it is for OkanaganLake
A combination of organic and inorganic material washed off a filter from theKalamalka Lake system was allowed to settle to determine fall velocities for itsconstituent particulates
6
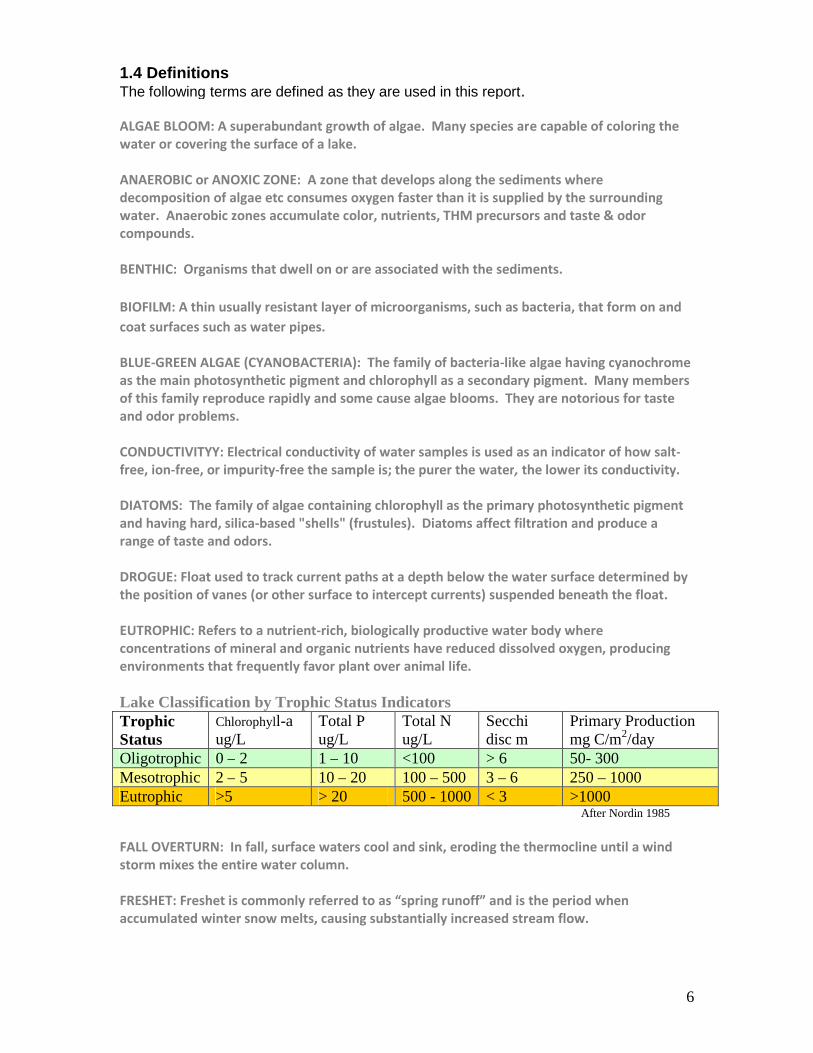
1.4 DefinitionsThe following terms are defined as they are used in this report.
ALGAE BLOOM: A superabundant growth of algae. Many species are capable of coloring thewater or covering the surface of a lake.
ANAEROBIC or ANOXIC ZONE: A zone that develops along the sediments wheredecomposition of algae etc consumes oxygen faster than it is supplied by the surroundingwater. Anaerobic zones accumulate color, nutrients, THM precursors and taste & odorcompounds.
BENTHIC: Organisms that dwell on or are associated with the sediments.
BIOFILM: A thin usually resistant layer of microorganisms, such as bacteria, that form on and
coat surfaces such as water pipes.
BLUE-GREEN ALGAE (CYANOBACTERIA): The family of bacteria-like algae having cyanochromeas the main photosynthetic pigment and chlorophyll as a secondary pigment. Many membersof this family reproduce rapidly and some cause algae blooms. They are notorious for tasteand odor problems.
CONDUCTIVITYY: Electrical conductivity of water samples is used as an indicator of how salt-free, ion-free, or impurity-free the sample is; the purer the water, the lower its conductivity.
DIATOMS: The family of algae containing chlorophyll as the primary photosynthetic pigmentand having hard, silica-based "shells" (frustules). Diatoms affect filtration and produce arange of taste and odors.
DROGUE: Float used to track current paths at a depth below the water surface determined bythe position of vanes (or other surface to intercept currents) suspended beneath the float.
EUTROPHIC: Refers to a nutrient-rich, biologically productive water body whereconcentrations of mineral and organic nutrients have reduced dissolved oxygen, producingenvironments that frequently favor plant over animal life.
Lake Classification by Trophic Status IndicatorsTrophicStatus
FALL OVERTURN: In fall, surface waters cool and sink, eroding the thermocline until a windstorm mixes the entire water column.
FRESHET: Freshet is commonly referred to as “spring runoff” and is the period whenaccumulated winter snow melts, causing substantially increased stream flow.
7
GENERA: The usual major subdivision of a family or subfamily in the classification oforganisms, usually consisting of more than one species.
GREEN ALGAE: The large family of algae containing chlorophyll as the primary photosyntheticpigment.
IRON RELATED BACTERIA: Non-disease-producing bacteria that grow in water and usedissolved iron as part of their metabolism.
LIMITED, NUTRIENT LIMITATION: In any environment, a nutrient or other growth requirementwill limit or restrict the potential growth of organisms. For example, phosphorus usually limitsalgae production in lakes; if there is an increase in all of the other nutrients, no increase inalgae growth will result because phosphorus is the “bottleneck”. Conversely, even a smallincrease in the phosphorus supply will result in increased algae growth.
LIMNOLOGY: The study of freshwater; physical and chemical considerations such as lakethermal behavior, nutrient cycling, basin morphology, sediment structure, etc.
MACRONUTRIENT: Macronutrients are the major constituents of cellular protoplasm andusually limit biological production. They include nitrogen, phosphorus, carbon, hydrogen andsulphur.
MARL: A marl event involves the precipitation of calcium carbonate, magnesium carbonateand calcium sulphate (gypsum) when the water warms or pH increases.
METALIMNION: The water layer containing the thermocline that is between the surfaceepilimnion and the bottom hypolimnion.
MICRONUTRIENT: Relatively minute amounts of a micronutrient are required to maintainplant growth within its environmental constraints. These include; Mn, Fe, Co, Zn, Cu, Mo etc.
MONOMICTIC: Refers to a lake that experiences only one period of mixing that extends fromfall, through the winter to early spring.
NANNOPLANKTON: Minute algae that pass through the mesh of fine (No. 20) bolting cloth.Most are less than 5 microns in their largest dimension.
PAHs Polynuclear (or polyclyclic) aromatic hydrocarbons (PAHs) are hydrocarbon compounds
with multiple benzene rings. PAHs are typical components of asphalts, fuels, oils, and greases.
PHYTOPLANKTON: Algae that float, drift or swim in standing water.
PHOTIC ZONE: The zone in a water body that receives sufficient sunlight for photosynthesis.
PLANKTON: Organisms that float or swim in water. Phytoplankton refers to plants;zooplankton to animals.
RIPARIAN: A riparian zone or riparian area is the interface between land and a stream or lake.Plant communities along the river margins are called riparian.
8
SECCHI DEPTH: The depth to which a 20 cm disk with alternate black and white quadrants canbe seen through the water column.
SEICHE: Wind-driven tipping of the water layers during the summer. Seiches cause the waterlayers to oscillate for days after a wind storm.
THERMOCLINE: The zone of greatest change in water temperature with depth (> 1oC/m) thatseparates the surface water (epilimnion) from the underlying cold hypolimnion.
ZOOPLANKTON: Minute animals that graze algae, bacteria and detritus.
Report abbreviations: DLC = District of Lake Country; MoE = Ministry of Environment:LAC = Larratt Aquatic Consulting; GEID = Glenmore-Ellison Irrigation District;
C of K= City of Kelowna; GVW = Greater Vernon Water OBWB= Okanagan Basin Water BoardUBC-O= UBC Okanagan campus IHA=Interior Health Authority
9
FIGURE 1.1: Aerial Image and Bathymetric Map of South Kalamalka Lake
10
2.0 Kalamalka Lake Intake Module 1: Characterization of Source
2.1 Kalamalka Lake Physical Features and WatershedKalamalka Lake contains 1520 x 106 m3 and drains a small watershed, resulting in acomparatively long residence time of 55 - 65 years.
Kalamalka Lake receives significant groundwater inflows and submerged springs havebeen noted by residents along the eastern shore. This groundwater probablycontributes to the marl precipitation in the lake. Kalamalka Lake’s immediate watershedincludes grassland / forest park; shoreline residential with modified shorelines anddocks; day-use beaches; and moderate density subdivisions with roads and storm wateroutfalls. Over 80% of the inflow to Kalamalka Lake is derived from Coldstream Creek.Intense, long-term agricultural use including cattle has damaged Coldstream Creek’sriparian areas and rendered this watershed vulnerable to erosion. For example, aserious failure occurred in January 2010 during a rain-on-snow event and the resultantorganic loading created over a meter of foam on the creek and adversely impacted theentire North Arm of Kalamalka Lake for weeks. The balance of the annual inflow comesfrom Wood Lake (Figure 1.1).
Assessments of human impact utilize conservative ions (Ca Na Mg K) of which Na is thebest and anions (Cl SO4 CO3 and HCO3) of which Cl is the best – i.e. it participates in thefewest reactions. Both sodium and chloride have shown a slow, steady increase since1976, indicating increased watershed disturbance, particularly municipal wastewater andstorm water run-off (Bryan, 1996).
The sediments under a lake also bear witness to adjacent land use. Sedimentsdeposited after European settlement show increased Mg Al Fe and P. A lens of arsenicand lead correspond to the use of lead arsenate as a pesticide. Recent sediments showincreased lead and zinc – the later from galvanized metals such as culverts (Walker et al.,
2003).
11
Shoreline Impacts Ecoscape Environmental Consultants estimated that 53.7% or 25kilometers of shoreline has a high level of impact. Areas of moderate and low impactaccount for 10.7% or 5.0 km and 33.3% or 15.5 km of the shoreline respectively(Schleppe, 2010). Impacts along the shoreline include lakebed substrate modification,riparian vegetation removal, construction of retaining walls, docks and other man-madefeatures.
Specifically, impacts included: 360 docks 213 retaining walls totaling 7 km (15%) of the shoreline 26 breakwater groynes 11 boat launches and 9 marinas with over 6 slips, 1 with on-water refueling 40% of shore length has received substrate modification
The predominant land use around the lake was natural area parks (28%), followed bytransportation (23.3 %). Single family areas were the third most commonly observedland use type, accounting for 22.3% of the shoreline; Stream confluences were the mostrare shore type around the Kalamalka Lake, accounting for only 2.3 % of the shorelinelength. This rare shore type was 66% disturbed. Wetland habitats accounted for 4.5% ofthe shoreline and in these areas the disturbance was much less, with only 23% of theshore length impacted (Schleppe, 2010).
The predominant shore types around the lake were gravel beaches (45%) and rockyshores (27%), followed by cliff / bluff (17%) and sand beaches (3.7%) of the shoreline.Aquatic vegetation occurs along 6.8% of the shoreline length. Of this, emergentvegetation was the most commonly observed (e.g., emergent grasses, willows, or otherareas with vegetation inundated during high water). The large littoral areas prohibitedmapping of the native beds of submergent vegetation. There were some small patchesof floating vegetation that were observed (Schleppe, 2010).
It is beyond the scope of this report to address efforts needed to prevent lake-widechemical and nutrient impacts on Kalamalka Lake as a whole. DLC does not control theirsource water and relies on the co-operation of all agencies, residents and users.
12
2.2 Description of Intake: Intake Location, Design, Construction and Maintenance
Location and depthThe DLC Kalamalka intake is located in 22 m of water and has 2 m of clearance from thesubstrate. The 800 mm diameter HDPE intake pipe is 440 m long measured from thelake shore. The intake manifold is detailed in the diagram below:
Physical Features and Design
13
Maintenance and Inspection/cleaningThe intake screen is diver-inspected and cleaned as needed, usually every 5 years or asrequired.
The pump house is enclosed in a tamper-resistant building that does not attractvandalism.
Water Treatment Overview: Water treatment on the Kalamalka Lake intake involvescoarse screening, pre-chlorination at the inlet and hypochlorite chlorination at the pumpstation. No additional injections of chlorine are required in the distribution system.
Water Monitoring Overview:Water quality samples are collected on a routine outlined below:
Kalamalka Lake – Raw Water1 sample per week: (4 samples per month)Currently there is no dedicated raw water test line: It must be installed toallow DLC to apply for filtration deferral. Sample pump must be allowed torun for 15 minutes. Chlorine is tested and if there is none detected, thenthe following samples are collected:
o Bacterial Total Coliform/E.coli, True color and UV Transmissivity(125mL bottle or 2 - 50 mL)
o Water chemistry: NTU, temp, pH conductivity , apparent color,water hardness
o On-line WQ equipment verification check
Distribution System1 sample per week:
o Bacterial Total Coliform/E.coli1 – 2 other locations per week testing water chemistry only
o Water chemistry: Free & Total Chlorine, NTU, temp, pH,conductivity, apparent color
Hydrology Kalamalka Lake is the largest source of potable water in the NorthOkanagan (A. Cotsworth, pers. comm.) Kalamalka Lake is deep for its size. It has amaximum depth of 142 m, contains 1520 million m3 and has a residence time of 55 – 65years. About 20% of its annual inflow comes from Wood Lake and 80% fromColdstream Creek and groundwater. Kalamalka Lake is a marl lake and has elevatedconcentrations of calcium and sulphate. Most of Kalamalka Lake is oligotrophic withphosphorus and occasionally nitrogen controlling algae growth (Nordin et al, 1988). Ingeneral, nutrient concentrations at the north and south end of Kalamalka Lake move inconcert, indicating whole-lake influences are more important than localized inputs.
Coldstream Creek Coldstream Creek imports nutrients and E. coli bacteria toKalamalka Lake. From Noble Canyon downstream, 45% of its riparian area needsrestoration (Ecoscape, 2010). Agricultural impacts on Coldstream Creek include streambank erosion, surface discharge of nutrients and horse/cattle/avian fecal material as wellas nitrate-enriched groundwater discharge. In the downstream urban areas, the mostobvious impacts stem from direct discharge of storm water. In MoE research,Coldstream Creek is far more impacted than Mission Creek or Shingle Creek in terms ofnitrates and bacterial counts (Sokal, 2010).
Wood Lake Inflows Water generally moves northward from Wood to Kalamalka Lakethrough the Oyama Canal. Wind action and lake seiching frequently cause oscillationsin the flow through the canal. In late summer and particularly in dry years, a net overallsoutherly flow occurs (MoE, 1975). In 2000, wastewater treatment replaced septic systemson Wood Lake and progressively lowered nutrient loading from Wood to KalamalkaLake. The flushing time for Wood Lake is about 20 years (Nordin et al., 1988).
The Hiram Walker plant pumped 22,730 m3/day of cooling water from Okanagan Lakeinto Upper Vernon Creek (Nordin et al., 1988). Its drainage included Duck Lake to MiddleVernon Creek to Wood Lake and ultimately to Kalamalka Lake. This influx temporarilyincreased Kalamalka Lake’s flushing rate to 37 - 45 years. The plant closed in 1992, andthe flushing stopped. Kalamalka Lake reverted to its original 55 – 65 year flushing time(MoE 1985). Normally, increasing a lake’s flushing rate lowers nutrient concentrations butin this case, nutrient-rich Duck Lake water accelerated algae production in Wood Lakewith a ripple effect to Kalamalka Lake.
Removal of the distillery cooling water was estimated to cause a reduction in nutrienttransfer of 15%N 23% P from Duck Lake to Wood Lake and 31% N 32% P from WoodLk to Kalamalka Lake (BC Research, 1974). Although the flushing water itself is of goodquality, the consequent increase in Vernon Creek flows result in a significant increase innutrient transfer from Duck to Wood and ultimately to Kalamalka Lake (BC R, 1974)
Normally, increasing a lake’s flushing rate lowers nutrient concentrations but in this case,nutrient-rich Duck Lake water accelerated algae production in Wood Lake with a rippleeffect to Kalamalka Lake. BC Research found that Kalamalka Lake algae productionincreases in response to Wood Lake inflows. Further, they found that an algae bloom inWood Lake surface water can be transported into the surface water at the South end ofKalamalka Lake where it mixes slowly within the epilimnion. Dispersion of the nutrient-rich Wood Lake water is largely dependent on the wind (BC Research, 1974). Althoughthere is some disagreement today about the effects of the water transfer (Walker et al.,
1994), Kalamalka Lake may well be better off without the increased flushing from HiramWalker in its drainage system (J. Allingham, pers comm. 2008).
15
To manage the fishery, the Oceola Fish and Game Club manage the releases fromeutrophic Duck (Ellison) Lake to Wood Lake. Releases begin in September and run allwinter to early summer.
Limnology Every year, Kalamalka Lake begins to stratify during late March.Stratification is firmly re-established by mid-May. Thermal/turbidity disturbances at theintakes caused by seiches (internal waves) tend to cluster in early June. The thermoclinegradually drops as Kalamalka Lake heats up over the summer. During the fall, thethermocline oscillates deeper into the lake. These oscillating periods (Aug/Sept/Oct) aremarked by mild taste/odor and turbidity events. Nutrients released from the sedimentsmay stimulate algae growth by mixing into the water column during seiches. AfterOctober, the Lake Country intake withdraws water from the cooling surface layer. Mixingcontinues as the thermal stratification became increasingly fragile until storms breakdown the water layers during November. Thermal mixing is complete by early December(Bryan, 1990). After December, the entire lake cools as a unit until very subtle inversestratification sets up in January.
SeichesSeiches are wind-driven tipping of a lake’s water layers during the summer. Seichescause the water layers to oscillate for days after a wind storm. For a fixed intake,seiches mean a rapid fluctuation in water temperature and turbidity as the intakealternately draws water from the surface layer and the deep hypolimnion (Figure 2.1).
Figure 2.1: Seiche-Induced Temperature and Turbidity Spike at Intake
Temperature and turbidity spike measured at GVW N-Kal Intake ___Temperature ___Turbidity
In the summer, the DLC Kalamalka intake draws from the bottom water layer exceptduring seiches. The vertical movement of a seiche is coupled to large internal waves.These waves break at the sides of the basin like surface waves do and they aresignificant sources of turbulence (Wetzel, 2001). For the water purveyors, seiches causeincreased water temperature and a turbidity spike as surface water is transported downto intakes for a period of 2-10 hours before the oscillating thermocline rises again,returning the bottom water layer to the intake. The main transport mechanism of surfacecontaminants to the Kalamalka Lake intake is seiches in the stratified (May – October)period.
Characteristics of seiches within Kalamalka Lake include: North or south-west winds with gusts exceeding 30 km/hr could generate a
seiche depending on the duration of the wind event. A typical period for theseiche to travel from the N to the S chain (15.4 km) would be approximately11.7 x 2 = 23.5 hours.
16
Seiches produce noticeable spikes in water temperature, conductivity, turbidity,color and algae densities at the Lake Country 22 m intake. Seiches have thebiggest impact on abstracted water quality during the spring and fall.
Turbulence and seiches are more intense at the South end of Kalamalka Lakethan they are at the North due to the shape of the lake basin.
Lake Country’s S thermistor chain recorded a 6 oC excursion at 30 m during 2005but a 2-3 oC fluctuation is more common. As intake depth increases, the intensityof seiches diminishes. An intake would need to be positioned deeper than 40 min order to evade all seiches.
Seiches and water currents direct the movement of “water parcels”- discreteinflows that gather in localized areas and travel as a mass while gradually mixingwith an increasing volume within the lake. For example, Coldstream Creekplumes often travel a “river of water” within Kalamalka Lake
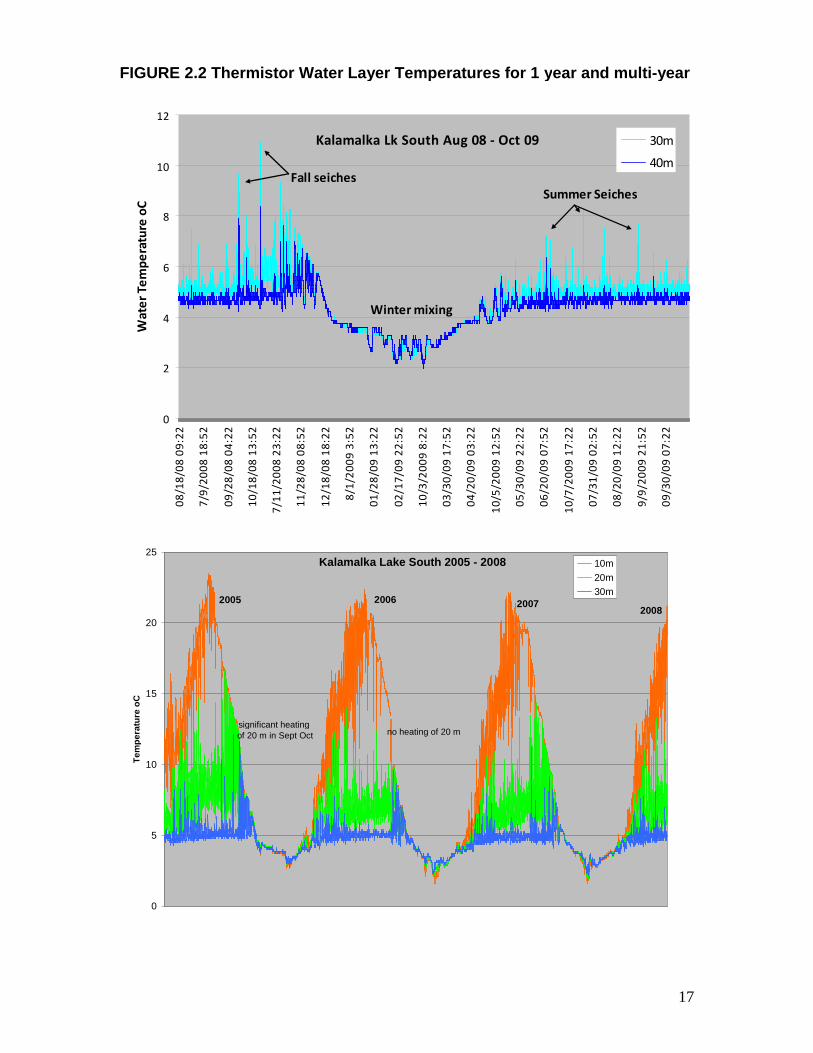
Large summer seiches are common in Kalamalka Lake (Figure 2.2). Each year, 7 - 12major seiches were detected by the N and S thermistor chains. Seiche activity wasalways greatest in the early summer as the water layers set up and again in the early fallas the surface layer cools and loses buoyancy (Figure 2.2).
Seiches increase the vulnerability of an intake to contaminants introduced to the surfacewater layer by a storm water outfall or a spill for example. Further water quality samplingof chemical and biological parameters at 30 and 40 meters is planned for 2010.
At the South end of Kalamalka Lake, seiches penetrate deep into the water columnbecause of the shape of the lake basin. The largest seiches occur in mid-June everyyear. During 2008, the maximum seiche temperature change at 20 m was 10oC but wasonly 4oC at 30 m (Figure 2). Water temperature changes of 5-8 oC within 48 hours areroutine at the current Lake Country 22 m intake (Larratt, 2008). In a warm summer,average intake temperatures reached 10.8 oC as opposed to the normal 7.5 – 8.5 oCrange. With seiches, peak temperatures can reach 13.6 oC at the LC intake.
As the cooling lake approached fall overturn, increased mixing thickened the surfacewater layer, pushing the thermocline down to the 20 m intake depth by September 222007 and October 8 2008 (Figure 2). A turbidity / taste and odor event can accompanythe transition from bottom to surface water. After the thermocline mixed below 20 m, theLake Country intake draws water from the cooling surface layer. Mixing continued and isusually complete by early December (Bryan, 1990) and in every year of this study, mixingbeyond the 40 m depth was complete by November 28.
17
FIGURE 2.2 Thermistor Water Layer Temperatures for 1 year and multi-year
Kalamalka Lake South 2005 - 2008
no heating of 20 m
2008200720062005
significant heatingof 20 m in Sept Oct
0
5
10
15
20
25
Te
mp
era
ture
oC
10m
20m
30m
Kalamalka Lk South Aug 08 - Oct 09
Summer SeichesFall seiches
Winter mixing
0
2
4
6
8
10
12
08
/18
/08
09
:22
7/9
/20
08
18
:52
09
/28
/08
04
:22
10
/18
/08
13
:52
7/1
1/2
00
82
3:2
2
11
/28
/08
08
:52
12
/18
/08
18
:22
8/1
/20
09
3:5
2
01
/28
/09
13
:22
02
/17
/09
22
:52
10
/3/2
00
98
:22
03
/30
/09
17
:52
04
/20
/09
03
:22
10
/5/2
00
91
2:5
2
05
/30
/09
22
:22
06
/20
/09
07
:52
10
/7/2
00
91
7:2
2
07
/31
/09
02
:52
08
/20
/09
12
:22
9/9
/20
09
21
:52
09
/30
/09
07
:22
Wat
er
Tem
pe
ratu
reo
C30m
40m
18
Dissolved Oxygen/Thermal Profiles A large microfloral crop generates a large super-saturated zone in early summer as shown in Figure 2.3, below. The supersaturatedzone is frequently smaller at the 30 m site than at the 20 m site, indicating lower algaeand bacteria production at 30 m than at 20 m. The super-saturated profiles correlate toincreased turbidity at the respective intakes and to elevated algal and bacterial counts.
FIGURE 2.3: Kalamalka Lake South Intake SiteTemperature and Dissolved Oxygen Profiles, 2008
19
2.4 General Kalamalka Lake Water Chemistry
Every year, the single greatest impact on water quality in Kalamalka Lake is the size ofthe freshet, affecting nitrogen-N, phosphorus-P, pH, calcium, sulphate andorganic/inorganic particulate inputs. Low inflow years import far less phosphorus toKalamalka Lake since P adheres to soil particles. Modest freshet flows result in smallmicrofloral densities. In general, nutrient concentrations at the North and South sites onKalamalka Lake move in concert, indicating whole-lake influences such as freshet (P) orgroundwater (N) nutrient inflow.
pH During the course of this study, pH appears be in slow decline. The trend towardlower pH may signal a reduction in the intensity of the marl precipitation events.Overall, the linear regression lines still show decreasing pH but there is considerable pHoscillation shown in the lines with markers in Figure 2.4.
FIGURE 2.4: Growing Season pH in Kalamalka Lake 1981- 2009
NOTE: This graph emphasizes data from 2000 to present
If the lower pH trend detected in this data is genuine, it could have repercussions on thesummer marl precipitation events and ultimately increase the nutrient balance ofKalamalka Lake. pH is usually higher during a wet, high productivity year.
Sodium and Chloride Sodium and chloride give an indication of animal, human, andstorm water impact on a lake system, although in Kalamalka’s case, donation of thesemetals from marine shales in the Noble Canyon section of the Coldstream Valley is anadditional natural source. Sodium averaged 16.1 mg/L in the MoE 1970-1988 data setand is still near that concentration today. Unlike sodium, chloride concentrationsincreased three-fold since 1970 – 1988 when it averaged 1.88 – 2.01 mg/L (Larratt, 2008).
Dissolved sodium and chloride ion concentrations are increasing in Kalamalka Lake,pointing to human impact on water quality as opposed to climatic factors (Ashley et al.,1998).
Growing Season pH in Kalamalka Lake
7.6
7.8
8
8.2
8.4
8.6
8.8
1981
1983
1985
1987
1989
1999
2000
2001
2002
2003
2004
2005
2006
2007
2008
2009
pH
N Kal 0 m
N Kal 20m
S Kal 0 m
S Kal 20 m
Linear (N Kal 20m)
Linear (S Kal 0 m)
Linear (N Kal 0 m)
Linear (S Kal 20 m)
20
Marl Precipitation Every summer, a spike in bottom water turbidity, alkalinity,conductivity and calcium concentrations and increased surface water clarity herald themarl (calcium carbonate + gypsum) precipitation. The timing of the marl precipitationdepends on water temperature, calcium concentrations and pH. The dates ranged fromJuly 20 1998 to August 6 2008. A gradual reduction in marl precipitation may beindicated over the past 20 years, but the data from this study are inconclusive and arecomplicated by freshet impacts. The carbonate/marl cycle in Kalamalka Lake protectsthis lake from nutrient enrichment and raises its sedimentation rate to 2.9 mm/yr (Dill,
1972). It also probably explains why Kalamalka has lower algal production thanOkanagan Lake despite their similar nutrient concentrations
Water Transparency Historic secchi depths measured 6 – 7 m in 1935 and 3.8 – 10.7m (avg 6.5 m) from 1975 – 1988 (Bryan, 1990). Within this study, growing season secchidepths ranged from 2.8 m during spring freshet algae production to 10.1 m post-marlprecipitation – a similar range to Bryan’s work. The average growing season secchidepth reacts to the size of the freshet. Large freshet years such as 2008 had loweroverall secchi depths, particularly at the North end (Figure 2.5).
Figure 2.5: Secchi Depth Range and Average in North andSouth Kalamalka Lake 2000 - 2009
Total Organic Carbon (TOC) Total organic carbon measures microflora and dissolvedorganic molecules and for that reason, TOC concentrations move in concert with algaegrowth. TOC will react with chlorine, absorbing it and increasing the production oftrihalomethanes. Historic TOC’s are comparable to recent TOC measurements. In the1980’s, TOC averaged 6.2 mg/L in the South end of Kalamalka Lake, and 2.6 mg/L inthe main section of the lake (Bryan, 1990). Organic carbon concentrations exceeded theB.C.WQ criteria of 4.0 mg/L through most of the growing season, particularly in surfacesamples because algae concentrate where light intensity is high and because pollen,leaf debris etc., accumulate on the surface. In all cases, TOC decreased with depth,however, the water quality advantage of a 30 m intake over the existing 22 m intakewould be minor i.e. a 0.1 – 0.2 mg/L TOC difference.
Secchi depth ranges in N and S Kalamalka Lake
2000 - 2009
2
3
4
5
6
7
8
9
10
11
20
00
N
20
05
N
20
06
N
20
07
N
20
08
N
20
09
N
20
00
S
20
05
S
20
06
S
20
07
S
20
08
S
20
09
S
sec
ch
id
ep
thm
21
Nutrients The main body of Kalamalka Lake is currently oligotrophic. Availablephosphorus concentrations control the growth of algae in the lake, according to theformula that P is limiting when the nitrogen to phosphorus ratio falls below 15:1 (Nordin,
1985). Although Kalamalka Lake is phosphorus-limited, co-limitation with nitrogen wasalso possible as the greatest algae growth was obtained in test cultures by adding bothnitrogen and phosphorus (OBA,1973).
Nutrients are important to water quality because they direct microfloral production. Theirconcentrations at the North and South ends of Kalamalka Lake move in concert,indicating whole-lake influences such as freshet nutrient inflow via Coldstream Creek(80%) and inflows from Wood Lake (20%). The direction of flow in the Wood-Kal channelis dependent on Wood Lake and Kalamalka Lake levels. Wood Lake is a periodicsource of organic nitrogen and phosphorus to Kalamalka Lake. Small peaks in SKalamalka nutrients over N Kalamalka nutrients in Figure 2.6 may relate to greater inflowfrom Wood Lake during those years (Appendix 1). Within Kalamalka Lake, the arms aremore productive than the main body of the lake.
Spring nutrient concentrations in Kalamalka Lake provide a good forecast of thenutrients available to support plant growth during the growing season. High run-offyears import more total phosphorus to Kalamalka Lake, often as a result of particulatephosphorus inputs. Damaged riparian areas in the Coldstream watershed acceleratethe nutrient loading in wet years. For example, the early 1980's were wet years andphosphorus concentrations were higher (Ashley et al., 1999). High freshet years also act toincrease N concentrations because N is poorly retained by Okanagan soils and nitratemigrates with groundwater (Dill, 1972). High runoff years with more groundwater input aremore likely boost Kalamalka Lake’s nitrogen content than low runoff years. The largefreshets of 1999 and 2000 resulted in nutrient peaks that were not repeated in thefollowing years (Figure 2.6). The current decline in nutrient concentrations is highlydesirable.
FIGURE 2.6: Average Total N and P In Kalamalka Lake 1975 - 2008
MoE objective = 0.008 mg/L TP for Kalamalka Lake;0.015 mg/L TP for Wood Lake (Nordin et al, 1988)
The goal for Kalamalka Lake is to restrict nutrient loading, even in wet years. This willrequire riparian restoration along Coldstream Creek and proper manurehandling/storage, particularly by Panoramic Farms and Coldstream Ranch.
Average Total Nitrogen in Kalamalka Lake
0.15
0.2
0.25
0.3
0.35
0.4
0.45
0.5
75
76
77
78
79
80
81
82
83
84
85
86
87
88
89
90
91
92
93
94
95
96
97
98
99
20
00
20
01
20
02
20
03
20
04
20
05
20
06
20
07
20
08
To
talN
mg
/L
North end
South end
Average Total Phosphorus in Kalamalka Lake
0
0.002
0.004
0.006
0.008
0.01
0.012
0.014
0.016
75
76
77
78
79
80
81
82
83
84
85
86
87
88
89
90
91
92
93
94
95
96
97
98
99
20
00
20
01
20
02
20
03
20
04
20
05
20
06
20
07
20
08
To
talP
mg
/L
North endSouth end
22
Since marl co-precipitates phosphorous, the timing of the marl precipitation in KalamalkaLake affects algae growth. Ironically, algae growth also influences the marl precipitationby raising pH. The other trigger for marl precipitation is water temperature. Warm, dryyears such as 2002-2004 favour earlier and larger marl precipitation (Walker et al., 1993).Marl precipitation not only limits phosphorus availability, it also shades the water columnand removes B12 vitamins. These all act to limit algae production in Kalamalka Lakerelative to Okanagan Lake, despite their similar summer nutrient concentrations.
With full lake mixing, nitrate concentrations are restored in December to the wintermaxima and trigger increased blue-green algae growth each year. Over the pastcentury, water quality was relatively stable in Kalamalka Lake (Bryan, 1980). Its uniquemarl precipitation protects Kalamalka Lake from phosphorus loading arising from humanactivities.
Chlorophyll-a Analysis Chlorophyll-a concentrations increased over 1971–1998 (MoEdatabase), paralleling an increase in phosphorus concentrations. Figure 2.7 showsannual spring peaks in microfloral production as measured by chlorophyll-a. Algaeproduction stalls after the annual marl precipitation removes phosphorus from solution.
FIGURE 2.7: Chlorophyll-a in Kalamalka Lake 1999 - 2009
Figure 2.7 was highlighted to show the similarities between the N and S ends ofKalamalka Lake. There is far more correlation by depth than by location. On mostdates, the productivity of the 20 m bottom water was far higher than the surface water
near both intakes. Samples collected from 30 and 40 m contained less chlorophyll-athan samples from 20 m (Larratt, 2008). To realize the benefit of lower algae production atthe 30 or 40 m sites, a new intake should be positioned at least 3 m above the substrate.Historically, chlorophyll-a measured 1.80 ug/L at S Kalamalka, 1.26 ug/L in Kalamalkamain basin and 4.42 ug/L in Wood Lake (Bryan, 1990). Kalamalka Lake samples areslightly elevated today above the historic norm.
Chlorophyll-a in Kalamalka Lake
0
1
2
3
4
5
6
1999 S O
2000 J
Jy A S O
2001 J
Jy A S
2002 J
Jy A S
2003 J
Jy A S
2004 J
Jy A S
2005 J
Jy A S
2006 J
Jy A S
2007 J
Jy A S
2008 J
Jy A S
2009 J
Jy A S
chlo
r-a
ug/L
N Kal 0 m N Kal 20m S Kal 0 m S Kal 20 m
23
Figure 2.8 Average Growing Season Chlorophyll-a 1999-2009
2.5 Water Chemistry Relevant to Drinking Water Safety
Algae Analyses Kalamalka Lake experiences a spring diatom/blue green bloom, asummer lull and a smaller fall bloom led by blue-green algae (cyanobacteria). Within thisgeneral pattern, there is considerable year-to-year variation.
Study since 2000 to present shows that the prevalence of blue-green algae appears tobe increasing. MoE data also shows a gradual increase in the blue-green componentsince the 1970's. A total of 15 blue-green genera including Lyngbya were observed inKalamalka Lake. In order of prevalence during 2008 they were: (Lyngbya limnetica >>Anacystis cyanea > Gomphosphaeria lacustris > Synechocystis > Chroococcusdispersus >> Dactylococcopsis sp > Aphanocapsa elachista > Chroococcus Prescotti >Planktothrix anghardii > Anabaena circinalis > Anabaena planktonica > Aphanizomenonsp (solitary) > Microcystis aeruginosa > Oscillatoria spp > Lyngbya Birgea).
Several of these genera are known to produce toxins but were not present in amountssufficient to impair water quality. Algae density near the Lake Country intake tends to belarger when Kalamalka Lake receives Wood Lake water. The Lake Country intake hassmaller algae counts and is spaced 2 m from the bottom versus GVW’s intake that isonly 0.6 – 0.7 m from the substrate and has large algae counts.
In the South Kalamalka algae samples, the 30 m samples showed a distinct advantageover the surface and 20 m samples. On average, the 20 m samples contained morechlorophyll-a than the surface samples because dying algae settle to the bottom andbecause storms and seiches create turbulence that suspend microflora from thesediments. For example, the 2008 average chlorophyll-a at the surface was 1.4 ug/L butincreased to 2.4 ug/L at S-20 m and was only 1.8 ug/L at S-30 m. It is important to notethat summer samples from 30 and 40 m in Kalamalka Lake still contained 200 – 800cells/mL of cyanobacteria (Larratt, 2008). Samples for chlorophyll-a will be collected fromS-40 m in 2010.
Overall, samples collected from 30 and 40 m contained less chlorophyll-a than samplesfrom 20 m (Larratt, 2009). To realize the benefit of lower algae production at the deeperproposed intake sites, a new intake should be positioned at least 3 m above thesubstrate.
Taste and Odor High algae counts and complaints of fishy or musty taste and odor inKalamalka Lake water are correlated. Blue-green cyanobacteria and other algaeproduce a musty, decaying taste and odour when they are decomposed byActinomycetes. During the lake-wide 1999 taste and odor event, cyanobacteria countsexceeded 1700 cells/mL at the intakes. The periodic taste and odour problem occurringin Kalamalka Lake are usually caused by unusually high cyanobacteria concentrations,possibly made worse by Actinomycetes decomposers and re-suspended detritus.
Less frequently, a seiche-induced turbidity/odor event can occur as on the week ofSeptember 22 2007. In this case, the turbidity particles were primarily detritus andbacteria, rather than algae. An intake right on the bottom of Kalamalka Lake would bemuch more vulnerable to taste and odor events. The minimum intake clearance shouldbe 3 meters. Rate payers appear to be reluctant to call about mild taste and odor eventsand they may be under-reported. Most complaint calls are from end-of-line areas andthey trigger a line flushing (Hansen, pers comm.).
Total Organic Carbon (TOC) Total organic carbon measures microflora and dissolvedorganic molecules and for that reason, TOC concentrations move in concert with algaegrowth. Historic TOC’s are comparable to recent TOC measurements. In the 1980’s,TOC averaged 6.2 mg/L in the South end of Kalamalka Lake, and 2.6 mg/L in the mainsection of the lake (Bryan, 1990). Organic carbon concentrations exceeded the B.C.WQcriteria of 4.0 mg/L through most of the growing season, particularly in surface samplesbecause algae concentrate where light intensity is high and because pollen, leaf debrisetc., accumulate on the surface (Figure 2.9). In all cases, TOC decreased with depth,however, the water quality advantage of a 30 m intake over the existing 22 m intakewould be minor i.e. a 0.1 – 0.2 mg/L TOC difference.
Figure 2.9: Average Total Organic Carbon in Kalamalka and Wood LakesTOC in Kalamalka and Wood Lakes 2000 - 2009
3
4
5
6
7
8
9
10
2000 2001 2002 2003 2004 2005 2006 2007 2008 2009
TO
Cm
g/L
Wood
S 0m
S 20m
S 30m
N 0m
N 20m
N 30m
N 40m
25
Turbidity Turbidity is naturally high in Kalamalka Lake, near 0.4 – 1.2 NTU from July toOctober due in part to the marl precipitation (Figure 2.10). Other natural sources ofturbidity include freshet plumes, seiches, lake overturn and algae pulses. Annualturbidity averaged 0.73 NTU in Kalamalka from 1973 – 1989. Average Kalamalka Laketurbidity appears to be relatively steady since 1990 but has decreased slightly since2004 (Figure 2.12).
While freshet caused brief turbidity spikes, summer turbidity exceeding 1.0 NTU wasmeasured at all Kalamalka Lake intakes in the July to September period during mostsummers (Figure 2.10). The 20 m summer samples with turbidity exceeding 1 NTUcontained precipitated marl and also contained higher concentrations of blue-green algaLyngbya limnetica and detritus. Turbidity generally decreased with depth i.e. a 30 or 40m intake would have lower turbidity than the existing intake.
Figure 2.10: Turbidity at South Kalamalka Lake Country Intake 2008
IHA requires a Water Quality Advisory when turbidity exceeds 1 NTU, but posting theAdvisory can be avoided based on IHA’s decision tree.
Some summers are worse for turbidity than others (Figure 2.10). 2005 and 2006 wereparticularly high due to seiches, extensive marling and algae production. Generally,years with large freshets have higher turbidity throughout the summer because of the“ripple effect” of the larger nutrient donation.
Turbidity at Kalamalka Lake Intake 2008
0.00
0.20
0.40
0.60
0.80
1.00
1.20
1.40
1.60
1.80
2.00
3-J
an
14-J
an
29-J
an
11-F
eb
26-M
ar
15-A
pr
30-A
pr
13-M
ay
27-M
ay
3-J
un
16-J
un
3-J
ul
14-J
ul
28-J
ul
7-A
ug
20-A
ug
2-S
ep
16-S
ep
2-O
ct
20-O
ct
3-N
ov
17-N
ov
MIN
ME
AN
Tu
rbid
ity
NT
U
26
Figure 2.11: Annual Average Turbidity at DLC Kalamalka Lake Intake
Measurements of turbidity collected from several points in the Oyama water systemranged from 0.24 to 2.36 with an average of 0.72 NTU. These elevated turbiditiesgenerally occurred at the end- of- line sites, but in 2007 and 2008, elevated turbidityoccurred throughout the system especially after the marl precipitation developed inKalamalka Lake. Flushing and/or additional chlorine is required to maintain residualswhen marl or aquatic organic matter (algae; detritus) becomes a problem (Hansen, 2008).Turbidity was slightly higher in Wood Lake over South Kalamalka, with a turbidity patternopposite to that of Kalamalka Lake (Figure 2.12). The reason for the opposing turbiditytrends in Kalamalka and Wood Lakes is not known.
Figure 2:12: Average Turbidity at South Kalamalka and Wood Lakes
IHA has a Turbidity Decision Tree (Apr 27/09) that suggests a water quality advisorywhen turbidity exceeds 1.0 NTU unless DLC can provide scientific evidence as to thesafety of the water. Without a raw water line, the scientific evidence cannot be provided,hence turbidity exceeding 1 NTU currently triggers a Water Quality Advisory.
Turbidity at Kalamalka Lake Intake
0.00
0.50
1.00
1.50
2.00
2.50
3.00
3.50
2004 2005 2006 2007 2008 2009
turb
idit
yN
TU
min
max
mean
Turbidity in South Kalamalka and Wood Lakes 2004 - 2009
0
0.2
0.4
0.6
0.8
1
1.2
1.4
2004 2005 2006 2007 2008 2009
Tu
rbid
ity
NT
U
Wood
S 0m
S 20m
S 30m
27
UV Transmissivity Measurements of turbidity and transmissivity are not a matchbecause dissolved organic molecules lower transmissivity but do not affect turbidity.Most sample sites on Kalamalka Lake had their lowest transmissivity in June andOctober. Spring transmissivity is lowered by the freshet to as little as 66% in the surfacewater. UV transmissivity ranged from 86 – 94 % in Kalamalka Lake with an average atthe intakes of 90-91%. For example, in 2009 intake UV transmissivity ranged from 88 –95% with an average of 91% at LC Kalamalka Intake (LC reports).
In the turbidity range of 0.35 to 0.80 NTU, Kalamalka Lake UV transmissivity was stableat 88% - 94%. Unlike turbidity, there was no significant difference between transmissivityat the 20 m, 30 m and 40 m depths during 2006 through 2008. Kalamalka Lake UVtransmissivity was not adversely affected by the marl precipitation because algae countsdecline as marl particles increase.
2.6 Calculation of Intake Protection Zone for DLC Kalamalka Lk Intake
An intake protection zone defines the area where the intake should take precedenceover every other use or consideration and defines the areas of land and waterwhere special care must be taken in the use and handling of potential contaminants toprevent them from accidentally entering the lake and affecting the intake.
The decision on the size of an intake protection zone should be based on the existing andpotential hazards, and on the speed with which they can be transported to the intake, bothhorizontally and vertically. Vertical transport is dominated by fall rates and seiches whilehorizontal movement in lakes is dominated by wind-driven currents and inflow plumes. Thedefault intake protection zone defined by IHA is a 100 m radius around the end of theintake. The protection zone should be modified from a circle to reflect consistent influenceson water travel near the intake such as stream inflows, water currents and seiche patterns.A second layer of protection zone could be imposed on adjacent land development wheresubsurface (waste water; irrigation water management) and surface (storm water) flowsdelivered to the intake protection zone would be significantly impacted by the landdevelopment.
The minimum intake protection zone safety factor recorded in the Lake Ontario Source toTap Study is 2 hours and 1 km radius (Stantec, ,2007). Lake Ontario is a large lake withheavy industrial use; and not analogous to Kalamalka Lake. None the less, a decision mustbe made on the acceptable time-safety factor that would give DLC a reasonable timeframeto react to an emergency such as a spill. The maximum speed of water transport at thesurface and at the intake depth both vertically and horizontally were then used to estimatethe intake protection zone.
Vertical Transport – Fall Velocity When solutions are introduced to a lake, thedissolved material remains suspended indefinitely and diffuses, while the particulatematerial settles out according to its fall velocity. April/May 2005/6 samples from KalamalkaLake’s North end were sent to UBC Mining Lab for particle size analysis on an Elzone 280PC. Particle sizes were generally small with all particles from Kalamalka Lake reported asless than 75 microns in diameter. All samples exhibited a bimodal size distribution wherethe smallest particles of marl peaked below the detection limit of 1.1 micron diameter (Larratt,
28
2005). The second peak recorded larger particles carried by freshet flows and large algaefrom the lake. Very fine (<1.5 microns) particles of marl are abundant and increase theturbidity and sedimentation rate of Kalamalka Lake.
Large particles of sand introduced from creek or storm water outfall plumes settle outalmost immediately while finer sand/silt is transported further into Kalamalka Lake. Verysmall particles remain suspended, including algae and microbes such as Cryptosporidiumand Giardia cysts. Both cyst types and E. coli have been detected in the North Arm ofKalamalka Lake and the probable source is Coldstream Creek inflows (Clarke & Brett, 2005).The potential for plume-introduced contaminants to remain suspended in the South end ofKalamalka Lake is the same as it is in the North end.
The fall velocity of fine clay is small 0.0011cm/s (0.04 m/hr or about 1 m/day); for marl it isabout 0.6 m/day and for E. coli bacteria it is far smaller at 0.00000410 cm/s (0.00354m/day) (Hayco, 2009; USGS 2007). It will take several weeks for clay to settle through thewater column; less as it clumps with other materials (larger sediment particles, organics).Marl particulates are in the same size-range as bacteria but they readily clump with bacteriaand other organics, and settle out of the water column gradually over a period of months. Itcould take years for bacteria to settle out based strictly on fall velocity. Their fall velocitywill be accelerated by clumping with other suspended materials. Bacteria can also be
consumed by zooplankton and deactivated by sunlight or aging (Wetzel, 2007).
A fall-rate experiment was conducted on material rinsed from filters collecting material fromthe GVWU Kal-North intake (Table 2.1). Particulates were suspended in a 1 L 75 cm tallgraduated cylinder. The solution was allowed to settle and microscope samples weredrawn off at 1 minute, 1 hour, 12 hours, 70 hours and 150 hours (Figure 2.13). The largeclumps of organic material settled within an hour, leaving marl, bacteria, filamentouscyanobacteria flagellates and small diatoms. After 70 hours of settling, bacteria and finefilamentous cyanobacteria (Lyngbya sp.) were still suspended. Finally, after 150 hours ofsettling, marl filamentous were still suspended and bacteria were growing. Table 2.1summarizes fall velocities from this experiment with established fall rates in 10-20 oC water.
Table 2.1: Size and Fall Velocity Estimates for Kalamalka Lake ParticulatesMaterial Size Fall velocity estimateInorganicSand >63 – 100 microns > 100 m/daySilt 4 – 63 microns 21 m/dayClay 0.1 – 4 microns 1 m/dayMarl <1.5 microns 0.6 m/day
Vertical Transport - Vertical Currents Vertical currents generated by a strong windevent can theoretically reach 5 m/sec with a seiche, however, with a typical maximalvertical velocity of 0.08 cm/sec (3 m/hr) for a water current after a strong wind, fine materialsuspended in the water or disturbed from the sediments could potentially be transported tothe surface in 8 hours from a depth of 25 m (the depth near the LC intake). There are nopersistent vertical currents in a lake; the direction of vertical currents oscillates following theupward and downward water motions in the lake (Hayco, 2009). Vertical currents are capableof transporting materials from the bottom up 2 m to the intake for brief periods.
Vertical Transport - Seiche Transport and Autumn Overturn TurbulenceDuring the summer stratified period with no seiche activity, sediment fall in the epilimnionwould be in proportion to depth. In practice, waves erode the shallows and mixing transferssediment to deeper water. A storm therefore can increase sediment concentrations at anintake by seiche disturbance and by wave turbulence-mixing transfer. Rapid currentreversals and increased velocity at the thermocline occurs during a seiche and cansuspend sediments. Seiche-driven sediment re-suspension decreases linearly with depth(Hilton et al., 1986). Normal wind-driven currents in deep areas of a lake are unlikely to createsufficient turbulence to destroy the boundary layer near the sediment surface and bring thesediment into suspension.
During the autumn overturn, near-bottom sediments traps catch 2-4 times more materialthan shallow traps due to re-suspension from all over the lake bed. During spring and fallhigh seiche periods, over half of the material in traps was re-suspended material. Thegreatest turbulence is associated with the fall overturn (destratification).
30
The height to which the settled materials can be re-suspended depends on their particlesize. Because substrate materials tend to clump, the height of re-suspension is usuallyonly a few meters and the rate of return to the substrate is rapid – a matter of hours (Table
2.1). Finer material such as marl and bacteria that become re-suspended from thesediments will travel further and remain suspended longer.
Water Currents (Horizontal Transport) Like most lakes, currents in Kalamalka Lakeshow a seasonal variability that is strongly related to wind speed. Horizontal water currentsare strongest in the top 5 meters of most lakes. There was no existing water currentinformation for the south end of Kalamalka Lake and a drogue study was undertaken.
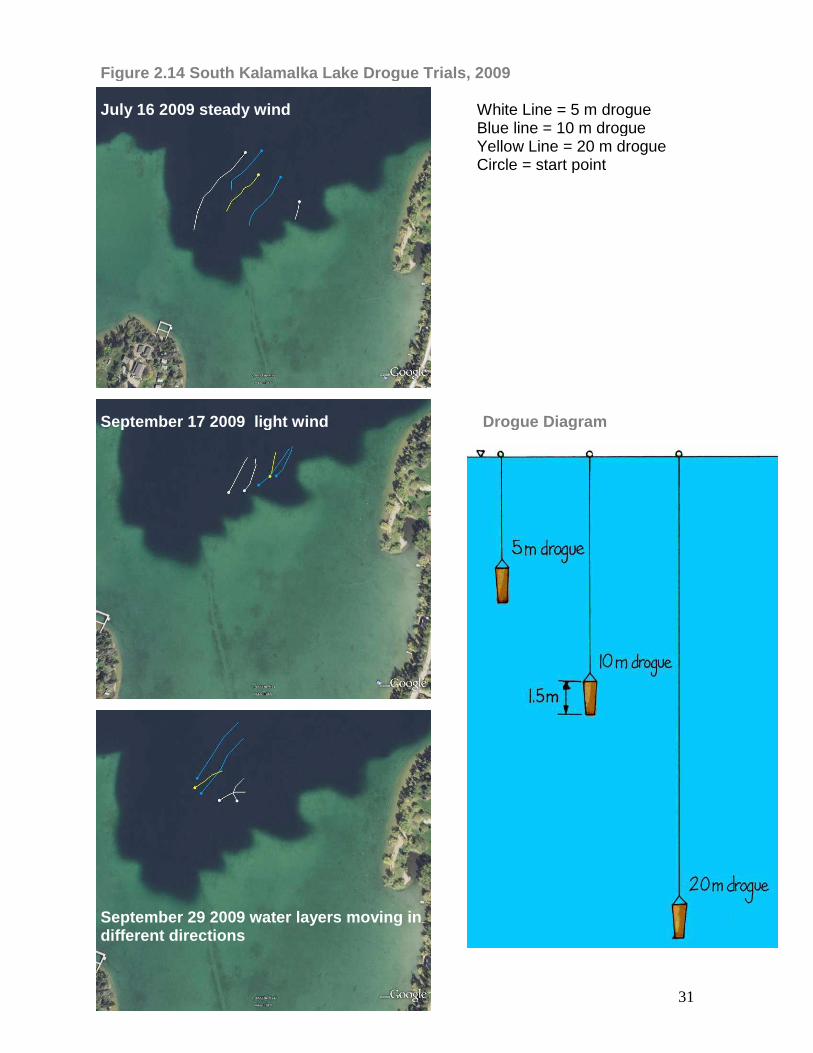
The drogue studies conducted as part of this report measured water currents in theimmediate vicinity of the intake. Drogues were deployed at the South end of KalamalkaLake on July 16, Sept 17 and Sept 29, 2009 (Table 2.2). The thermocline over these datesranged from 11-14 m. Wind speeds were average, ranging from 0 – 10 km/hr. Therelationship between wind speed and water current speed as measured by the drogues andwas similar to the energy transfer estimate of 2-3% used in Hayco’s modeling.
Water movement followed the general direction of the wind and more specifically traveledparallel to the shoreline of Kaloya Park – an example of long-shore currents. Often therewas no significant difference in speeds at various depths. However on Sept 29, 2009, waterspeed at 10 m was more than twice the speed of the water at 5 m and at 20 m. On this dateone 5 m drogue traveled ENE while the other traveled NNE. Speeds on this date at 5 mwere 27-54 m/hr, at 10 m were 98-128 m/hr and at 20 m were 44-60 m/hr. The slowestspeeds were on the surface, where the direction was less consistent. On the other twodrogue sampling dates, water current speeds were more typical and ranged from 35-80m/hr with the fastest currents measured in the surface water (Figure 2.14; Table 2.2).
31
Figure 2.14 South Kalamalka Lake Drogue Trials, 2009
July 16 2009 steady wind White Line = 5 m drogueBlue line = 10 m drogueYellow Line = 20 m drogueCircle = start point
September 17 2009 light wind Drogue Diagram
September 29 2009 water layers moving indifferent directions
32
The direction of travel of the drogues was scattered, reflecting the effect of the bays, pointsand shallows deflecting the wind-driven currents (Figure 2.14). Contradictory travel in differentwater layers was often observed and was the result of seiches, deflected currents or achange in wind direction. The surface 5 m of the lake can change directions and velocityfaster than deeper water can.
Table 2.2: Drogue Results for Lake Country Kalamalka Lake Intake 2009July 16 Sept 17 Sept 29
Depth m m/hr direction m/hr direction m/hr direction5 80 SSW 49 N 40 ENE5 57 SSW 53 NNE 42 NNE
10 45 SSW 59 N 111 NE10 50 SSW 47 NNE 116 NE20 44 SSW 36 N 49 NE
The drogues were not used during an intense storm, but currents are estimated to reachsurface speeds of up to 9.5 cm/s (342 m/hr) in the open reaches of Kalamalka Lake. Thecurrents would slow and deflect as they reached the south end shallows. Both the drogueand thermistor studies confirm that extensive mixing and turbulence occurs as currentstraveling south slam into the end of the lake.
Calculation of the Intake Protection Zone The minimum intake safety factor recorded inthe Lake Ontario Source to Tap Study is two hours (Stantec, 2007). The speed of travel forsurface contaminants is important because materials can fall vertically or be transporteddownward by the South end’s powerful seiches. Doubling the wind speeds that weremeasured by the drogues covers 80% of the wind events expected in a year. Doubling thefastest drogue indicates that a surface contaminant could traverse a 100 m intakeprotection zone in 20 minutes. Conversely, to achieve the two hour guideline, the intakeprotection zone radius would have to be 464 m (Figure 2.15). The shape of the intakeprotection zone should be modified from a circle by prevailing directions of water travel andthe locations of potential contaminant introduction. In the case of the South end ofKalamalka Lake, the turbulence was very random, suggesting that the IPZ should beroughly circular. The IPZ would diminish in size if the intake was deeper.
Long-shore water currents driven by wave action are temporary and frequently reverse theangle that they are striking the shore, making them a weak transporter of potentialcontaminants over long distances of shoreline (Hayco, 1999). The DLC intake is 440 m off-shore because of the wide littoral shelf and this long intake is protected from wave-generated long shore currents.
33
Figure 2.15 Proposed DLC Kalamalka Lake Intake Protection Zone
The white circle encompasses the area that the fastest drogues traveled in twohours with light winds.
The black modified circle encompasses the area water currents can travel in twohours with 80 % of the wind events that occur on Kalamalka Lake and is therecommended Intake Protection Zone (IPZ) (464 m radius).
An Intake Protection Zone that included the area water currents can travel in windstorm events within two hours would include the entire southern end of KalamalkaLake.
The intake protection zone does not encompass the entire area capable of impacting theintake, rather it delineates the “highest risk” area. In a severe storm, a spill anywhere onKalamalka Lake could theoretically impact DLC’s intake. An intake protection zone basedon two hours of water travel under normal wind conditions represents the minimum safetyfactor recommended in this study. An IPZ should be understood as a critical protectionarea nested into a larger area of concern (South end) and finally into the entire area ofconcern – Kalamalka Lake and Wood Lake and their watersheds.
34
2.7 Hazards Impacting the Intake Protection Zone
Contaminants that can affect the intake that are injected within the intake protectionzone have the greatest potential to impact the intake water quality and the leastavailable dilution.
2.7.1 Fecal Bacteria and E. coliTotal coliforms are a broad category of bacteria that include soil bacteria and along withbackground colonies, they indicate the amount of bacterial loading in the water. Fecalcoliforms are found in warm-blooded animal wastes and they serve as an indicator ofrecent fecal contamination (WSDH, N.D.). Unfortunately, there are non-fecal bacteria thatcan give false positive fecal readings such as Klebsiella, Enterobacter and Citrobacter,
leading to declining reliance on the fecal coliform assay in the water industry (Doyle et al.,
2006). E. coli (Escherichia coli) are the most common type of true fecal coliforms. Only afew of the thousands of E. coli strains are disease-causing, however, if E. coli arepresent, recent fecal contamination is probable. The presence of other pathogenicbacteria such as Campylobacter may be correlated, while E. coli counts do not correlatewell with viruses or other pathogens (Carter et al. 1986; Keith et a, 1999).
The criteria set by IHA for source/raw water is (1) No more than 10% of source/rawwater E. coli samples exceed 20 cfu/100 mL E. coli within any 6 month period. (2) Nomore than 10% of source/raw water total coliform samples exceed 100 cfu/100 mL totalcoliform within any 6 month period (Filtration Deferral Document, IHA).
Lake Country collects bimonthly bacterial samples from the intake (Samples from yearswhere there was no unchlorinated raw water sampling line were not considered in thissummary). The highest peaks in fecal bacteria and E. coli counts in the South DLCKalamalka Intake occurred in January and February each year when the lake was notstratified. Peaks also occurred with severe storms. For example, a storm with a seicheon August 22, 2006 had 300 fecal mpn/100 mL and 25 E. coli mpn/100 mL. A severestorm on October 19, 2009 caused a fecal count of “overgrown without fecal bacteria”and 1 mpn/100 mL E. coli. Both storms must have introduced storm water to the intakearea and kicked up bottom sediments. All of these peaks occurred when surface watercan access the intake; in winter when the entire water column is circulating and insummer when seiches transport surface water to the intake depth.
Bacterial samples are also collected weekly from the DLC Kal Lk intake. In 2006, out of17 intake samples, two had detectable E. coli; one sample with 25 E. coli per 100 mLand one sample with 1 E. coli per 100 mL (Meger et al., 2006). In 2007, all 47 watersamples had 0 detectable total coliforms and 0 E. coli (Meger et.al., 2007). These are typicalresults for DLC’s Kalamalka Intake and indicate low bacterial loading rates except duringstorms. May to October in-lake samples from the South end of Kalamalka Lake were all<1 cfu/mL during 2008 and 2009 (Table 2.3). Further sampling will occur at 0, 20, 30, and40 m in 2010.
35
Table 2.3: Kalamalka Lake South Bacterial Water Quality 2009
NOTE: DGT=greater than TNTC= too numerous to count RDL=reported detection limitOG=overgrown With = with total coliforms
IHA’s proposed guidelines for filtration deferral states: No more than 10% of raw source water E. coli samples should exceed
20 CFU/100mL in any 6 month period (consecutive weekly sampling preferred). and No more than 10% of raw source water total coliform samples should exceed
100 CFU/100 mL in any 6 month period (consecutive weekly sampling preferred).
2.7.2 Sediment Contaminants – MetalsAt an estimated sediment accumulation rate of 2.9 mm/yr in Kalamalka Lake, it wouldtake a decade for 3 cm of new sediments to “seal over” contaminated sediments,assuming no sediment disturbance. This is fortunate because some pesticides used inthe past are dangerous and persistent. For example, Walker et al. (1994) found a peak inarsenic and lead in Wood Lake sediments deposited in the 1940’s that can be attributedto the use of lead arsenate as a pesticide to control coddling moth damage to fruitorchards. The use of these heavy metals as well as the use of DDT after World War II –1960’s may also explain the decimation of the benthic community of Wood Lake whichwent from “abundant” (Clemens et al., 1939) to non-existent by 1969 (Saether and McLean,
1972). There was similar tree fruit production around the south end of Kalamalka Lakeduring 1940 to present, and extensive agriculture was conducted throughout theColdstream Valley, making it likely that some herbicide/pesticide contamination ofKalamalka Lake sediments occurred.
The contact between the water column and these contaminated sediments that will beburied by approximately >10 cm of recent sediment, should be minimal under normalcircumstances. Burrowing fish (e.g. carp) and aquatic insects (e.g.Mysis) could disturbthese sediments, as could wave and seiche turbulence in shallow areas.
In another study, Walker found slightly increased mercury in recent surface sediments inthe Kalamalka-Wood Lake area (Walker et al., 2003). Having re-suspended sediment enterthe intake is undesirable. It increases turbidity and possibly introduces smallconcentrations of contaminants.
The OUC remote sediment sampler was available in 2001, allowing the collection oftriplicate cores from 20 m in front of the Lake Country intake and in front of the GVW N-Kal intake. Kalamalka Lake 20 m sediments are a fine silt/clay with moderate organiccarbon contents. Recent 0-5 cm sediments contained more phosphorus and organicmaterial than deeper sediments, suggesting increased algal productivity (Table 2.3).
Kalamalka Lake South Bacterial Water Quality 2009Parametermg/L 1m 20m 30m 1m 20m 30m 1m 20m 30m
Total Coliforms CFU/100 mL 2 400 43 1 55 20 TNTCWithout <1Background Colonies DGT200 DGT200 DGT200 DGT200 <200 DGT200E.coli CFU/100 mL <1 <1 <1 1 <1 <1 <1 <1 <1
Total Coliforms CFU/100 mL 56 DGT2 O.G. with O.G. with 13 O.G. with DGT2 DGT1 DGT1Background Colonies DGT200 DGT200 DGT200 DGT200 DGT200 DGT200E.coli CFU/100 mL 1 <1 1 <1 <1 <1 <1 1 <1
20-Oct-09
19-May-09 16-Jun-09 16-Jul-09
29-Sep-09
36
All anthropogenic metals (Zn, Al, Pb, As) in North Arm sediments were 2-3 times theconcentration in sediments near the DLC intake because of the greater urbandevelopment and agriculture through the Coldstream Valley. They also showed arsenicand lead enrichment, perhaps due to agriculture and the use of leaded gasoline. Zincwas also enriched in surface sediments and serves as a marker for storm water(galvanized pipe is Zn coated) (Table 2.4). Because deeper sediments contain morecalcium, it is inferred that marl precipitation events have become less intense in recentyears.
Sediment Contaminants – Bacteria On September 17, 2009 a remote sampler wasrepeatedly dropped into the sediment near the intake before retrieving a sample 1 mabove the substrate. The intent was to mimic seiche turbulence to see if the samplewould account for the turbidity spike that accompanies a seiche. Like the sedimentsamples from Okanagan Lake, the sediment that is easily stirred up near the DLCKalamalka intake contained uncountable numbers of coliform bacteria, and non-detectable E. coli (Table 2.5). These results indicate that the risk of E. coli loading fromsouth end sediments is not significant. Re-suspended sediments do increase turbidity,THM precursors and lower UV transmissivity. The high E. coli count in the DLC intakewater noted during storms may be the result of storm water entering the southern end ofKalamalka Lake.
Table 2.4 Sediment Under Kalamalka Lake Intake and Sediment Trap Data
Sediment Sampling Under Intakes for Sediment Trap Samples 2009-2010Microflora - 2009 Deployed Sept 14/09 - Collected May 25/10
14-Sep 14-Sep 17-Sep (15 cm dia; 175 cm2 surface area)frequency data Ok Lk LC Kal-GVW Kal-LC Ok Lk LC Kal-GVW Kal-LC
DIATOMS % solids 0.1 0.7 0.2
Asterionella formosa L (dead) L (dead) % volatile solids 19.6 13.1 15.2Cocconeis PCyclotella C C-D dry weight (g) 0.222 7.250 2.503Cymbella sp L (dead) L (dead) L (dead) volatile weight (g) 0.038 0.859 0.320Fragilaria capucina VL (dead)
Fragilaria crotonensis VL (dead) M (dead) L (dead) accum rate g/m2/yr 1.9 62 21
Melosira italica P (dead) L C (dead) volatile accum g/m2/yr 0.33 7.4 2.7
Navicula sp. L L (dead) PStephanodiscus niagarae VL (dead) L (dead) L (dead)Synedra acus var radiansSynedra ulna P (dead)Siruriella elegans L (dead)Tabellaria fenestrata L (dead) P (dead)
TOXINS BLUE-GREEN ALGAE
x Aphanocapsa sp. P
x Anacystis cyanea C-D
X Aphanocapsa sp. C
X Planktolyngbya limnetica M
Limnothrix redekeiix Oscillatoria sp. smooth L
OTHER
micro-flagellates M L VLLarge flagellates L Cbacteria D D C
detritus M L Lsilt L C D
SUM
P=Present L= Low M=Moderate C=Common D=Dominant
37
Photo of Sediment Trap Material from Kalamalka Lake
Kalamalka Lake South Kalamalka Lake NorthSediment Trap near Sediment Trap nearDLC – Kal Intake 22 m GVW – N Kal Intake 20mOct 2009 – May 2010 Oct 2009 – May 2010
The South Kalamalka Lake sediment trap showed a moderate sediment accumulationrate because there was no sediment source such as a stream or a storm water outfallnearby (Table 2.4). The trapped material demonstrated an accumulation rate of 21 g/m2/yrof which 15.2% was volatile (organic). The sedimentation rate at this site was one thirdof the rate at the GVW intake in the North Arm because the north site is influenced bythe riparian damage along Coldstream Creek.
2.7.3 Trihalomethanes THMTrihalomethanes (THMs) are generated when combinations of total organic carbon,water temperature, contact time and chlorine dose are high (Larratt, 2007). There are manyOkanagan water supplies that do not meet the THM criteria. THM’s are higher during thesummer months when microfloral production is high than they are in the winter months.Almost all of the THM produced in the distribution system will be chloroform (CHCl3).None of the LC Kalamalka Lake intake samples collected to date exceeded the 0.10mg/L total THM guideline. Total THM samples collected from a “continuous run” site onthe Kalamalka Lake source had a total THM of 0.036 mg/L on Nov 9 2006 and 0.042mg/L on June 12 2007 (Meger et al., 2006; 2007). Further sampling during the three seasonswhere THM precursors are most likely to occur (spring, summer, fall), taken atlocation(s) furthest from treatment would confirm the low total THM potential ofKalamalka Lake water and meet filtration deferral requirements.
THM - chloroform
Table 2.5: Triplicate Sediment Core Results from 20 m Near South Kalamalka DLC Intake 2001
Table 2.5:Suspended Sediment beneath South Kalamalka DLC Intake
2.7.4 CyanobacteriaBlue-green algae are also called cyanobacteria and they are wide-spread andproblematic. With climate change and eutrophication, the frequency and intensity ofcyanobacteria growth is increasing in Canada. Many of these genera are known toproduce toxins but were not present in Kalamalka Lake in amounts sufficient to causecyanotoxicity threat (Table 2.6). Like Okanagan Lake, the intake depths are oftendominated by low light tolerant filamentous cyanobacteria of the Lyngbya, Oscillatoriaand Planktothrix genera. At least one of the toxins produced by these cyanobacteria(Microcystin) can be degraded by chlorine under specific conditions. The risks fromchronic low-dose exposure to cyanotoxins is the subject of much international and localstudy (Larratt, 2009). In general, Kalamalka Lake should be managed to minimize nutrientloading and intakes should be sited to minimize the quantities of cyanobacteria extractedin the raw water.
Table 2.6: Toxins Produced by Blue-green Algae (Cyanobacteria)
NOTE: Yes-? = Not all authors list this toxin for the cyanobacteria species
Over 2000 – 2009, chlorophyll-a at the surface averaged 1.2 ug/L but at the 20 m intakedepth, it doubled to average 2.1 ug/L due to the greater densities of cyanobacteriagrowing at depth and re-suspension of algal material from the sediments (LC reports).
Total Algae counts from LC Kalamalka averaged 400 – 900 cells/mL May-October.
2.7.5 Sewage/SeptageSeptage routinely carries pathogens, organic matter, nitrates, heavy metals, inorganicsalts, pharmaceuticals & personal care products (PPCPs), cleaners, paints, auto wastes,hydrocarbon PAHs and more, hence the need to isolate it from drinking water sources .
Caffeine can be used as a marker for human sewage and septage because no otheranimal excretes it. A caffeine sample was collected from the intake depth near theKalamalka Lake intake on September 29 and shipped to ALS Labs Edmonton. Theresults were below the detection limit of <0.20 ug/L caffeine and suggest that there is nodiscernable threat from human sewage/septage in the vicinity of the intake under normallake conditions.
As the septic systems are removed from service by the municipal sewer system, theirimpact on subsurface drainage should diminish. Hatikvah summer camp and T’weenLakes campground are on septic tanks/disposal fields. While few problems areanticipated with the Camp Hatikvah system, the T’ween Lake septic system has seriousflaws. It is situated on a former wetland infill that causes a high water table. DLC staffhave witnessed and documented an incident in 2009 when a motor-home emptied itsholding tank into T’ween Lakes septic tank when the tanks and field were underwaterduring high lake levels. This site is susceptible to flooding during a high water year andservicing traveller’s motor-homes raises the risk of pathogen introduction to the lakesystem. Connection of the T’ween Lakes Campground to the municipal sewer systemwould be highly desirable.
Flooding events are rare on Kalamalka Lake because the water level is regulated by thecontrol structure in the North Arm. They do occur in years with high freshet and a wetspring when water “backs up” in the lake system. Flooding can increase the impact fromold septic fields or informal disposal sites at farms or residences. .
A new sewage lift station and sewer main are located within 100 m of the S-Kal intake.The need for a Gen-set in case of power failures can be determined by DLC EngineeringDLC staff are working on updating the District of Lake Country’s Liquid Waste WaterManagement Plan. Currently there is on-site disposal in the area which is not expectedto change in the near future.
2.7.6 Storm Water LocationsStorm water routinely carries hydrocarbon PAHs, road surface contaminants, salt,pathogens, pesticides and nitrates. It may also carry other contaminants when peopleillegally dispose of materials down the storm drains. Outfall locations must be distantfrom the intake and preferably, they should be replaced with soak-away zones. The highE. coli count detected during the August 22 2006 storm could well be caused by stormwater washing pet and avian feces off adjacent streets and parking lots.
For example, Trask Road that travels up to Kaloya Park is within 11 – 14 m of thelakeshore and has shallow ditches along some stretches. Most road drainage sheets offthe road and into the vegetated band separating the road from the lake. This “greenbelt” offers most of the storm water treatment available. Unfortunately, most land-owners have opened the vegetation to accommodate stairs to a dock or raft. Theshorelines have been modified and vegetation cleared, reducing the effectiveness of theinfiltration/green belt interception of infiltrated water from the ditches and road flows.
41
2.7.7 Biofilm DevelopmentWarm lake water rich in organic material will develop biofilm in a distribution system.Biofilms in distribution pipelines contain a build-up of precipitated material andmicroorganisms (bacteria, fungi, yeasts). Biofilms are dislodged from pipe walls duringperiods of high flow. Most Okanagan water supplies develop biofilms during the summerwhen the warmer water accelerates bacterial growth.
From 2004 to 2009, the maximum summer temperatures within the DLC distributionsystem ranged from 10 – 17 oC and the normal annual averages ranged from 7.5 – 8.5oC. In a warm summer, the annual average temperature can reach 11 oC. Thetemperatures within the distribution system meet the 15oC CDWG guideline except inJuly. Water temperatures usually rise in October over September because of autumnoverturn and reached 16oC at the Oyama Office in October 2006 (Hansen et al., 2006).
These temperatures are moderate and although Kalamalka Lake water contains morethan 4.0 mg/L TOC, biofilm is not a significant problem in the Lake Country distributionsystem fed from Kalamalka Lake. Although not strictly a biofilm, the reservoirs needregular cleaning because of a red sediment that accumulates, presumably iron-relatedbacteria (IRB).
2.7.8 Water InfrastructureLow water levels could theoretically strand the intake’s wet well and disrupt service.Because Kalamalka Lake levels are regulated, this could only occur in an extremedrought and is unlikely.
The Kalamalka Lake system was built in 1995/6 and is relatively young. It requires verylittle maintenance. This system has the added protection of a back-up water supply fromOyama Creek that can supply domestic and limited irrigation water.
2.7.9 Monitoring Routine and Emergency PlanningRoutine sampling by Lake Country Staff includes sampling for total and free chlorine,conductivity, hardness, pH, color temperature, turbidity, UV transmissivity as well as totalcoliforms and E. coli but these bacterial parameters are invalidated by the chlorinealready in the water. A true estimate of the raw water bacterial counts can only beobtained by using a raw water line. Although this intake was equipped with a raw watersample line in the past, it failed and needs replacing. Currently sampling is awkwardwithout the sample line and is conducted once or twice monthly instead of the preferableweekly format.
Monthly monitoring reports are e-mailed to the Interior Health Drinking Water Officer
District of Lake Country has plans in place for releasing water quality advisories and boilwater alerts but they do not have a formal emergency response plan that detailscontacts and procedures in the event of a water emergency. The plan should bedeveloped and could use the GVWU plan as a template.
Vernon’s All Hazards Emergency Response Plan was prepared by: Public SafetyConsultants Northwest, LLC Seattle, Washington. Vernon’s plan follows the guidelinesof the BCERMS standards for response and incident management using the IncidentCommand System. The water utility manager is responsible to review the entire plan on
42
an annual basis, co-ordinating the revision of the plan as needed, maintaining records ofthe revisions, and administering the overall plan. The emergency plan must include:emergency contact numbers, steps to follow, agencies to notify, protocols to follow forpublic notice, etc., as per IHA directions.
2.8 MODULE 1: Hazard and Contaminant Table – DLC Kalamalka Lake Intake
Reportsection
Drinking WaterHazard/Contaminant
Possible Effects Existing PreventativeMeasures/Barriers
Physical2.33.1.1
Creek plumes Introduction of TSS, pathogens,nutrients, PPCP, PAHs
Riparian protection throughwatershed
2.7.2 Sediment re-suspensionfrom the substrate
Increased turbidity can compromisedisinfection treatment potentiallycausing illness if pathogens, heavymetals are present
2 m clearance of intakefrom Kalamalka Lakesubstrate
2.7.8 Drought low water levelsand shoreline flooding
Wet well stranding is possible if waterlevels drop below el.389.39; Floodingof septic fields, yards, causesintroduction of contaminants
Drought planning outlet flowcontrol, emergencyalteration of works if wetwell is stranded
Chemical2.7.6 Storm water Transport of nitrogen, pesticides road
surface contaminants, pathogens, saltDistant from intake,educated residents
Exposure to: pathogens, organic matter,nitrates, heavy metals, inorganic salts,personal care products cleaners, paints,medications, auto wastes, PAHs
Caffeine analysis wasnegative
3.1.4 Hydrocarbons PAHs Deliberate or accidental spill or use ofgas-powered boats, boat launch
Dilution; depth of intake;location of intake
2.5 Turbidity Interferes with disinfection; highduring marl precipitation
None
2.52.7.4
Taste/odor chemicals Reduced aesthetic; periodic problemusually caused by algae
Increase chlorination
2.7.33.1.5
Heavy metals Bioaccumulation through chronicexposure
None
Biological2.7.4 Cyanobacteria Chronic low-dose exposure to
cyanotoxin; health impacts vary withtoxin type, can include hepatic cancer
Depth of intake; chlorinationprovides some protection;minimize nutrient loading
2.7.3 THM precursors (algae,organic material)
Organic material (TOC) can react withchlorine to create THMs that arecarcinogenic
TOC load is moderate inKalamalka Lake – never haveexceeded 0.1 mg/L Total THM(IMAC) no excessive chlorine.
2.7.53.1.3
Viruses –pathogenic Acute Illness through water-borneexposure
Chlorination
2.7.12.7.5
Bacteria (E. coli, fecal) Illness through water-borne exposure Chlorination
2.7.12.7.5
Protozoa -pathogenic Illness through water-borne exposure Chlorination
2.7.7 Biofilm Shields pathogens from disinfection Pipeline flushing
43
3.0 Kalamalka Lake Intake Module 2 Contaminant Inventory
3.1 Anthropogenic Potential Water-Borne Hazards to LC Intake
A wide range of human activity occurs within the vicinity of the Lake Country Intake onKalamalka Lake, including camping, boat-based recreation, lakeshore residential,orchards, a railway, a major highway and low-density residential subdivisions. Thedegree to which they can affect the intake is based on their proximity and their potentialto generate an emergency. The aerial photo in Figure 3.1 has the following featuresmarked: Oyama Canal, a creek plume, LC intake pipeline, LC pipe line inlet, 30 mproposed extended intake site, Hatikvah summer camp, T’ween lakes campground,Highway 97 and the railway.
Figure 3.1 Features of the South Kalamalka Lake Basin
30 m siterailway
Hwy 97
Existing intake inletplume
LC pipeline
Summer stormCamp water
RV campmoorage Private septic
Oyama Canal Industrial Park
Road and railroad
44
3.1.1 Major InflowsTransport for discrete inflows such as creeks or the Oyama Canal enter the layer inKalamalka Lake with a matching density. Larger inflows such as Coldstream Creektravel as a plume that is still “intact” several kilometres into Kalamalka Lake from thecreek mouth. The distance from Coldstream Creek mouth and the LC intake is 14 kmand allows extensive dilution of introduced contaminants. Whole-lake effects such asnutrient loading and non-settling particulates such as viruses and bacteria fromColdstream Creek theoretically have the potential to affect the LC Intake.
Figure 3.1 shows a small creek plume in the spring with a deflection to the right (the Nhemisphere counter-clockwise Coriolis default direction in the absence of other watercurrents). Most years, there is only surface inflow during the spring and it is very turbidand probably nutrient-rich. Since it is in an isolated bay from the intake and flowvolumes are small, no measurable impact of contaminants on the intake from thiswetland creek is expected.
Although it is hard to detect, the Oyama Canal inflow from Wood Lake will also form aplume that seeks the water depth with matching density in Kalamalka Lake (B.C. Research,
1974). For most of the year, the canal inflow is slightly warmer and the conductivity islower (Table 3.1). The Canal inflow should be buoyant and therefore travel in the uppermeters of Kalamalka Lake, affording the intake some protection from this inflow exceptduring seiches. At 20% of the total annual water input to southern Kalamalka Lake,Wood Lake inflow is significant source of nutrients, TOC, chlorophyll-a andcyanobacteria and possibly dilute contaminants (Table 3.1). Algae density near the LakeCountry intake tends to be larger when Kalamalka Lake receives large Wood Lakeinflows. The volume and direction of the Oyama Canal varies with the water level in bothlakes and with wind-induced seiching.
Table 3.1: Annual Average Water Quality in Wood Lake and South Kalamalka Lake
The Oyama Canal inflow from Wood Lake could also be a significant source of cyanotoxinsduring a surface algae bloom. These surface blooms occur annually in Wood Lake (but noton Kalamalka Lake) and are occasionally severe. For example, a bloom developed in
northern Wood Lake in mid-May 2009 and measured 15.3 ug/L. Accumulated cyanobacterialscums have been measured near the canal that exceed 50 ug/L chlor-a and toxin presence isprobable at those densities.
Less likely contaminants that could be transported to the intake area from Wood Lake includere-suspension of toxic materials found in Wood Lake sediments predating 1970’s andaccidental spills from the railway or Oyama Road that are both immediately adjacent to theWood Lake shoreline and traverse the canal (Figure 3.1). Boat storage and re-fueling in thecanal itself could be a dilute source of PAH hydrocarbons to the Lake Country Intake.
A final method of water-borne contaminant introduction to Kalamalka Lake is via overland flowand subsurface drainage. Land use within several hundred meters of Kalamalka Lake has thehighest potential to impact water quality and is covered in Section 3.1-5. Contaminants suchas heavy metals, pesticides, PAHs, nutrients and accidental spills can impact the intake area.
3.1.2 Storm Water OutfallsTransport for distributed shoreline sources such as local runoff or storm water outfallswould behave similarly to a creek input (Hayco, 2000). Inflows can pool as a water parceland travel as a discrete packet of water, diffusing as it travels. Storm water can travel asa unit to the intake depth, particularly during the unstratified winter period. It is thereforenot wise to count on dilution with the full volume of the intake bay when water-bornecontaminants are considered.
Storm water in the Okanagan region routinely carries large loads of hydrocarbons PAHsand materials released from the paving materials, road salt, pathogens as indicated byE. coli and landscaping chemicals including fertilizer and pesticides. Pathogens are aparticularly high concern because bacteria levels in stormwater runoff appear to begreater in urban areas than in natural areas and even commercial or industrial zones.One cause may be the high concentration of pets or waterfowl, such as Canada geese,associated with residential areas. Frequently, pets are walked along roadways or nearwaterways. From such locations, the next rainstorm will quickly flush the animal wastesinto the nearest storm sewer (NI-DEP, ND; USEPA 2006). Additionally, some peoplefeel that it is fine to directly dispose of materials into a storm drain and these can includesolvents, paint, detergents, waste automotive products, and drug products. Education onthe hazards of illegal disposal, landscaping run-off, washing down driveways and notpicking up after pets has improved storm water quality in the Kelowna area (M. Toma pers.
comm.). Creeks receiving storm water in the City of Kelowna contained E. coli from ducks,dogs, songbirds, deer, humans, cows, horses, gulls, and Canada geese (Appendix 3).
The location of storm outfall(s) in the vicinity of the intake is not known. DLC does nothave a comprehensive Storm Water Master Plan but they have commissioned stormwater studies of discrete areas. There is no formal treatment of storm water, rather, likemost locales, it is ditched and infiltrates to the nearest water course. No storm wateroutfalls should occur that discharge within the Intake Protection Zone. The storm waterfrom paved parking at Kayola Park should be routed away from the intake bay or at leastmanaged by a soak-away treatment. It currently enters the small bay on Kaloya Point.
Historically, very little storm water treatment was developed in the Oyama area. Moststorm water from older developments reports to the nearest watercourse withouttreatment. Localized on-site soak-away disposal is now required by DLC. All newdevelopment permits require that, “all storm water must be kept on-site”. Usually Frenchdrains and swales are used to direct storm water to ground and helps preserve pre-
46
development ground water recharge. Refitting the older developments with swales andwith rainwater barrels for roof drains would help limit storm water volumes. OyamaRoad (nearest to Wood Lake) has been re-fitted with catch basins and dry wells,replacing the older storm water release to Wood Lake.
Storm Water Run-off Storm water runoff will flow directly from the rail line to KalamalkaLake. The railway is still active and is currently leased to Knighthawk Rail Ltd. Itconnects with the CN Kamloops Yard. The line carries primarily wood products butchemicals and grain are also hauled. It is common practice for the rail company to storechemical cars on the siding on the Wood Lake and Kalamalka Lake shoreline sidings.Locomotive fuels, oils and lubricants would also be a risk in the event of a derailment onareas of the track that are within 10 meters of Kalamalka Lake. Unpreserved woodproducts and grain present no threat to water quality, but chemicals could. Depending onthe density of the chemical spilled, it could be carried into water deeper than the intakeand be diluted before it reached the intake via water currents. The exact behavior of thematerial would depend on water temperature, winds, recent seiches, etc. and would beimpossible to predict the threat it could present to the DLC intake and on what time-frame. For this reason, no poisonous chemicals should ever be transported on this railline without extensive precautions. A containment boom/cleanup kit suitable for themost deleterious product hauled by train could be purchased by the Railway and theappropriate planning put in place, including track maintenance.
The rail line itself is within 10 m of the water’s edge in several places along the southernend of Kalamalka Lake. The entire line is within the riparian area of Kalamalka andWood Lakes. Direct runoff from the rail bed including creosote is probable. Although ameasurable impact on intake water quality is unlikely, it should be noted that positioninga rail bed within 10 m of a lake would never be approved today.
Highway 97 represents a large impervious surface and the storm water from it will carrythe same contaminants as municipal storm water, with additional salt from winterabrasive. It also presents the risk of spills and it is located within 150 – 200 m of thelakeshore. This risk of spills will decrease significantly when Hwy 97 is re-routed awayfrom the lake and the current route carries local traffic only. One outfall connectingrailway ditching and possibly Hwy 97 runoff to Kalamalka Lake was located. Most runofffrom the highway is directed to ditches on both sides of the highway. Seepage to groundfrom ditches will allow pathogen deactivation and can remove some PAHs but chlorideand spilled contaminants may persist.
Figure 3.2: Sodium and Chloride in Kalamalka Lake
Sodium and Chloride in N and S Kalamalka Lake 2005 - 2009
1970 - 1988
average for Na
and Cl
15
15.5
16
16.5
17
17.5
18
18.5
19
2005 2006 2007 2008 2009
Na
mg
/L
0
1
2
3
4
5
6
7
Clm
g/L
N 1 m Na
N 20 m Na
S 1 m Na
S 20 m Na
N 1 m Cl
N 20 m Cl
S 1 m Cl
S 20 m Cl
47
3.1.3 Sewer Infrastructure and Septic FieldsLake Country has embarked on a sewer system that replaces aging individual residentialseptic systems. With the high water table in the Oyama area, this is a vital step towardsprotecting Wood Lake, Kalamalka Lake and the DLC intake.
Sewer infrastructure Although sewer is a significant and necessary improvement tothe Kalamalka-Wood Lake aquatic ecosystem with the ever-increasing populationpressure, the unlikely but the catastrophic consequence of a sewer main or lift stationfailure to the DLC intake must be considered. The closest lift station to the intake isimmediately adjacent to the Kalamalka Lake pump house and wet well (within 100 m).These systems can fail. The Coldstream Creek Sewage Lift Station experienced a powerfailure, allowing a small raw sewage spill into Kalamalka Lake on February 11, 2009. Aback-up generator has since been installed in the lift station.Appropriate containmentstrategies should be included in the Emergency Response Plan. Consideration shouldbe given to providing back-up power to this lift station given its proximity to the DLC KalLk wet well.
The main sewage treatment facility for City of Vernon is the Spray Irrigation programfrom McKay Reservoir. There may be subsurface flows exiting McKay Reservoir thatholds treated sewage effluent. Aspens in wetted hollows have now died back frompersistent water-logged soil conditions suggesting increased seepage in recent years.Samples collected by LAC on April 6, 2010 from Bailey Creek in Kekuli Park thatreceives drainage from the spray effluent program and possibly McKay Reservoirmeasured 4.16 mg/L nitrate as N and 182 mg/L chloride. Another sample collected fromseepage that emerges at the Kekuli Park boat launch measured 11.9 mg/L nitrate as Nand 236 mg/L chloride. Both samples indicate significant loading and are well aboveconcentrations found in local natural drainage systems. The risk of effluent seepagereaching the S-Kal intake is very low, however, increasing the nutrient status of the lakecon increase algae density.
Septic Fields and Private Septic Treatment Facilities According to real estateinformation, numerous residences around southern Kalamalka Lake are still on septicfields.
A satellite wastewater treatment plant and ground disposal system to service a 27 lotresidential subdivision overlooking Kalamalka Lake in was installed recently in Oyamafor Amry Developments. It has a similar, low potential for failure like any other septicstorage. Their drainage field is tested twice yearly via two monitoring wells as per themunicipal sewer regulation. The plant should last a minimum of five years and is at fullbuild-out although only a small number of homes are connected. The future plan is tomothball that plant and bring a line to Winfield wastewater treatment plant (Larsen, pers
comm., 2010). Based on the monitoring results supplied to DLC, nutrient and bacterialcounts are climbing in Amry effluent and are elevated compared to historic sampling thatpredates the development (Table 3.2 data supplied by Amry).
48
Table 3.2: Amry Effluent Data 2009-2010 and Monitoring Well Data
NOTE: Amry Monitoring well 1 is beside the disposal field and well 2 is adjacent to the DLC pumphouse
Properly functioning fields should not release pathogens but they will release nutrientsand pharmaceuticals and personal care products (PPCPs) to the groundwater orsubsurface flow. Recent research has shown that wastewater treatment plants andseptic systems only partially remove pharmaceuticals, so these chemicals end up ingroundwater and have been measured in adjacent rivers and lakes (Knox County, ND) Inaddition to functioning systems, improperly functioning septic systems will allow evengreater concentrations of PPCPs to pass. Septic system contamination can severelyimpact surface and ground water (USEPA, 2007).
Ascertaining the risk from septic systems to the DLC intake would be prohibitivelycomplex and beyond the scope of this report. The best option is to continue on thecourse of replacing and decommissioning all septic fields with the potential to impactKalamalka Lake or Wood Lake.
Caffeine can be used as a marker for human sewage and septage because no otheranimal excretes it. This test is much more definitive if caffeine is detected than if it isbelow detection because caffeine is broken down by bacteria (Seiler et al., 1999). Acaffeine sample was collected from the intake depth near the Kalamalka Lake intake onSeptember 29 and shipped to ALS Labs Edmonton. The results were below thedetection limit of <0.20 ug/L caffeine and indicate that there is a low likelihood of threatfrom human sewage/septage in the vicinity of the intake under normal lake conditions.As the septic systems are removed from service by the municipal sewer system, theirimpact on subsurface drainage should diminish. A caffeine test was not performed understorm conditions.
NO2 + Total FecalDate and Sample Location BOD NO3 Ammonia Total P Coliforms Coliforms
Amry effluent Jan 2010 10 34.11 1.36 4.42 24000 430Amry effluent Feb 2010 10 30.43 1.11 4.96 24000 24000Amry effluent Mar 2010 10 32.25 1.31 5.07 11000 46000
49
3.1.4 Moorage, Docks and Powerboat RecreationIncreasing boat traffic on Kalamalka Lake increases the contribution of PAHs includingmotor oil, gasoline and lubricants. Occasionally the boat traffic near the intake is intenseduring July and August. A liter of gasoline can contaminate 750,000 liters of water (Kerr
Wood Leidel, 2008). Low viscosity fuels such as gasoline can spread rapidly and dispersionis dependent upon temperature and turbulence. Evaporation is less effective on heavierPAHs but remains the single most important weathering process in the first few daysfollowing a spill that is not cleaned up appropriately.
Accidental spills during refueling are routine and PAHs accumulate in the sedimentsnear docks, moorage, boat launches and marinas. Because Kalamalka Lake does nothave a large public marina (there are 7 “marinas” with more than 6 boat slips onKalamalka Lake), the risk presented by PAHs to the DLC intake is minimal. Nomoorage, marinas, boat launches or large dock facilities should ever be contemplatedwithin the Intake Protection Zone. The risks presented by a marina on Wood orKalamalka Lake must be weighed carefully against the benefits of such a project andinclude: Increased introduction of PAHs during normal motor operation and by accidental
spills; Increased use of the lakes with boats equipped with on-board septic holding tanks
(many of which can be opened at will and verified reports of human feces washed upon shore near houseboat moorage have occurred in the Okanagan);
Seasonal pump-out stations at marinas can fail – for example the August 14, 2009spill of raw sewage from the Westbank Yacht Club into Gellatly Bay, OkanaganLake. Storm water deluged a manhole and overflow of storm water and raw sewageflowed into the lake for 45 minutes (Appendix 1).
A clean-up kit for a PAH spill into Kalamalka Lake should be stored with the LakeCountry Fire Department. Spills should be reported and cleaned up in accordance withthe Spill Reporting Regulation (B.C. Reg.263/90). Lake Country may wish to considerencouraging non-motorized recreation by planning facilities that promote sailing,kayaking, canoeing, all of which have far less potential to impact intake water quality.
3.1.5 Adjacent Land UseLand use within several hundred meters of Kalamalka Lake has a greater potential toimpact water quality than land use distant from the lake. Shoreline properties have thehighest potential to impact the lake. Overland flow from these properties is the mostserious, followed by subsurface drainage which is slower and offers some in-situtreatment. Both of these routes for contaminant travel are diffuse and are unlikely toimpact the intake water quality directly, however, overland flow and groundwatercontamination both contribute to the contaminant and nutrient loads reaching the lake.Although shoreline flooding is rare on this regulated lake, toxic materials should not beshored near the high water mark without adequate containment facilities.
Although they do not “grand-father” to older properties, DLC has Development PermitAreas which gives DLC the power to “require works to be constructed to preserve,protect restore or enhance natural water courses or other specified natural features ofthe environment.” A large portion of the Development Permit is an environmentalassessment that complies with Riparian Areas Regulations. There should beenforceable (no-build, no-disturb) set-backs from the high water mark and a pesticideban on lakeshore properties. There are serious examples of private intrusion on
50
Southern Kalamalka Lake foreshore including in-filling, retaining walls, building cabinson piles over the water and inappropriate storage near the high water mark. Trask Roadhas many examples of modified shorelines and the shoreline below Hwy 97 has manyexamples of informal camping or permanent residences on the shoreline. A more recentexample was reported by residents as occurring at Crystal Waters where shorefronthomes are being built in 20’ long creosote-treated pilings (resident, pers. comm.). Reports ofhot tubs and swimming pools being drained directly to the lake were also received at theMarch 25th LC open house. Avenues to encourage private correction of these invasionsof the public trust should be considered.
Fortunately, there is no industrial land use and limited commercial land use on theperiphery of southern Kalamalka Lake. Near-shore land use is dominated by:residential, tree fruit culture, parks/beaches, Hatikvah children’s summer camp andT’ween Lakes RV campgrounds (Figure 3.1). There is a small sawmill-gravel pit complexcalled the Oyama Industrial Park but it is a kilometer away from the intake.
Like the storm water generated from residential properties, overland flow and seepage toground can carry fertilizers, pesticides, pathogens, detergents and solvents fromresidential properties bordering the lake. The impact would be determined by the typevolume and the location of the contaminant introduction. Lakeshore owners should beencouraged to preserve a shrub belt between their properties and the lake to interceptdrainage. It is illegal to modify the natural shoreline because of its protective value andfisheries value. Best practices management of properties within the Intake ProtectionZone is more important to the DLC intake than management of properties remote fromthe intake, but all are important.
Similarly, parks with lawn areas can also release fertilizers and pesticides to the lake viaoverland flow in storms or through seepage to groundwater. Washrooms should beconnected to sewer or employ small holding facilities. The largest park in the vicinity ofthe intake is 4.7 ha Kaloya Park and its location on a narrow peninsula near the DLCintake makes proper septage management imperative. The smaller Pioneer Park islocated on the shoreline between the pump-house and the intake. Its pit-style outhouselocated 45 m from the shoreline has a holding tank that is a fully contained pump-outsystem.
Tree fruit culture is dependent on a number of sprays and in the past, these haveincluded some very dangerous and currently banned substances including lead arsenateand DDT. The closest orchard is 40 m from Kalamalka Lake and approximately 26hectares of the lake’s western periphery are dedicated to tree fruits (Figure 3.1). Again, therisk posed by this agriculture is proportional to the amount of overland flow, seepage ordrift of applied chemicals that reaches the lake and their fate there. Some agriculturalchemicals are photo-degraded in lake water, others are persistent. Fertilizer and othersoil amendments may also be required periodically. Excess irrigation will increase thesubsurface flow reporting to the lake from these orchards. A green belt of riparian treesbetween the lake and the orchards would be an asset to the lake.
Overall the 10 ha Hatikvah children’s summer camp is an asset to Kalamalka Lake.Unlike other forms of development, this camp has preserved the vast majority of itsshoreline in pristine condition. Shoreline modification and development has beenminimal. Camp Hatikvah is equipped with a tank/disposal field system for septagemanagement. There are extensive grassed areas totaling 8.5 ha of which only a fewacres are irrigated. They may donate fertilizer or pesticides to the lake. The seasonaluse of this facility further reduces its potential impact.
51
T’ween Lakes Campground has been built on a former wetland; the water table can beexpected to be high on the property. Infilling of the wetland is on-going to provide furtherboat storage. Casual and semi-permanent RV camping is provided on its 1.4 hectares.Some of the trailers actually overhang the high water mark along a low retaining wall.The campground road network is gravel and rainfall infiltrates. Septage from thecampground washrooms and pump-out station is managed by a septic tank/disposalfield that can be flooded and the system has been used while flooded. Since individualRV’s have their own holding tanks, spills should be unlikely but are not impossible. Alarge dock and moorage slips in the Oyama Canal provide motor boat moorage and bothcontribute to the potential issues outlined in Sec. 3.1-4 A small boat launch and re-fueling station (fed by a large fuel tank within 10 m of the shoreline) are located at thedock. Fuel storage is protected by a small enclosure with signage, but no otherprotective measures were apparent.
One gravel pit is located within 250 m of the lakeshore above Hwy 97 but is unlikely toimpact the intake. A second gravel development by Pier Mac Sand and Gravel on theEast side is 500 m from the water but a 80 m2 area has been cleared and leveled on theshore of Kalamalka Lake.
Much of the eastern shore of the lake is protected by the 3700 ha Kalamalka LakeProtected Area, however there are some large undeveloped lots opposite Kaloya Park.There is an old, active sawmill in that area located within 380 m of the lake in what iscalled Oyama Industrial Park. The extent of other industrial activities on this property isnot known. Should this property be re-developed, detailed impact studies would beneeded. Typically, the land under these old sawmills is contaminated.
3.1.6 VandalismDeliberate spills into Okanagan lakes through ignorance or spite are recorded (Appendix1).
For example, 20 gallon pails of hydraulic oil and motor oil were deliberately spilled intoOkanagan Lake near Poplar Point in 2009, necessitating an expensive clean-up. Whilevandalism can be difficult to predict, obvious hazardous targets such as fuel storage orportable outhouses should be protected. The risk of human activity to Kalamalka Lake isdependent upon the behavior of all Kalamalka Lake residents and users.
3.1.7 Open House Public InputThe views of the participants at the DLC open house on lake intakes can be summed upas restricting access. They identified motor craft of all kinds, and run-off from localdeveloped areas as their key areas of concern. Many people thought that the waterquality on Kalamalka Lake was excellent except for occasional late summer odor, butpublic confidence in the quality of Okanagan Lake water was lower. Several people feltthat basin-wide education on source protection and water conservation was important.
52
3.2 Natural Contaminants or Factors that Influence Susceptibility ofKalamalka Lake to Contamination
Not even pristine watersheds and lakes provide completely risk-free drinking water.Natural conditions in and near Kalamalka Lake also affect the water quality it provides.The most important of these are covered in this section.
3.2.1 Kalamalka Lake MarlingThe annual marl events in Kalamalka Lake each summer curb algae production but theyalso increase turbidity. Turbidity attributable to marl exceeds 1 NTU for more than amonth every summer and can reach 2 NTU. Even though this turbidity source is “clean”in the sense that it does not include pathogens, it can still interfere with disinfection.
3.2.2 Cyanobacteria in Kalamalka Lake and Imported from Wood LakeWhile cyanobacteria densities in the DLC intake water never exceed the WHO andAWWA recommended guidelines, they still allow a chronic low dose exposure tocyanotoxins. Fortunately, one of the most likely cyanotoxins that can be produced bycyanobacteria in Kalamalka Lake is degraded by chlorine but at twice the dose requiredfor disinfection and pH must be near neutral (Hitzfield et al., 2000). UV disinfection is alsohelpful but again, the UV dose to deactivate microcystins is greater than the dose forwater disinfection (Hudnell (ed) 2007).
A larger but infrequent threat is posed by the surface cyanobacteria blooms thatperiodically develop on Wood Lake. These severe blooms are dominated by Anabaena,Anacystis, Aphanizomenon, and Gomphosphaeria (Larratt, 2009). Anabaena, Anacystisand Aphanizomenon produce a range of undesirable cyanotoxins (Table 2.5).
Severe blooms on Wood Lake are most common in May and November/December.These late fall blooms are unusual, but bloom densities were encountered in December2006, 2007 and 2008. These very late blooms were probably triggered by the sharpincrease in circulating nutrients after the overturn mixed bottom water into the entirewater column. Near the Oyama canal, blue-green algae cells accumulate to dangerouslevels in the fall based on a chlorophyll-a of 35 ug/L-2006, 10 ug/L-2007 and 2.6 ug/L-2008. (At 50 ug/L chlorophyll-a, the cell count approaches 100,000 cells/mL andcyanotoxicity is probable). The cyanobacteria density in the May 2008 exceeded100,000 cells/mL where it accumulated along shorelines and that prompted IHA to postsigns at beaches and MoE conducted sampling.
These blooms should become less frequent as the nutrient loading to Wood Lakediminishes with the conversion of septic systems to sewer connections. The importanceof this program to the ecology of Wood Lake and Kalamalka Lake cannot be overstated.
3.2.3 Benthic AlgaeNo direct research has been completed on the algae that covers rocks on Kalamalka orWood Lakes, however, a long-time resident reported to the March 25th open house thatWood Lake used to grow attached filamentous green algae and that has graduallyshifted to a brown slime (probably diatoms) as the nutrient status of Wood Lakeimproves. Neither of these algae pose a toxin threat but both are an aesthetic concern.
53
3.2.4 Kalamalka Lake Protected Area – WildlifeWildlife are less likely to introduce pathogens to a watershed than humans and theirdomestic animals, but they can become infected and make an introduced pathogenendemic. The majority of the pathogens donated to watercourses were originallyintroduced by humans and their pets/domestic animals. Through travel people areexposed to a far wider range of pathogens than animals that live in one locale. Oftenpathogen and fecal indicator concentrations are higher in domestic animal feces than inwildlife feces (Cox et al, 2005).
Wildlife, particularly rodents, are known carriers of the protozoans Cryptosporidium andGiardia, and less frequently Toxoplasma is encountered. Other infections are possibleand every effort should be made to prevent their introduction.
Wildlife that habituate the shoreline such as muskrat, pose the largest risk of sheddingpathogens into Kalamalka Lake. Wildlife may contribute to Cryptosporidiumcontamination in the water but may not have major public health significance becausethey are generally infected with non-human-pathogenic species and genotypes (Feng et
al., 2007). However, infectivity studies have demonstrated the potential for cross-transmission exists between rodents and cattle (Donskow et al., 2005). Rodents, because oftheir close proximity to humans and livestock, pose a potential threat as a maintenancereservoir for Cryptosporidium (Zeigler et al., 2007)..
750 m fuel storageRV septic storagefertilizers pesticides
Overland flowsubsurfaceseepage
High water table;fuels, trailerswithin 8 m of lake
Orchards various W of intake 700 m+
fertilizers pesticidesPAHs fuels
Overland flowsubsurfaceseepage
Historic pesticidesmay still be insubsurface
NaturalKal Lake marl BC throughout
laken/a turbidity particulates vertical
transportCan exceed 1NTU
Cyanobacteria BC throughout n/a cyanotoxins seiches May, Nov/DecReserve Park MoTCA E of intake 1 km wildlife pathogens currents Low risk
Pesticides includes: herbicides, insecticides, fungicides, rodenticides, and avicides; Many pesticides are highlytoxic and are mobile in sub-surface flows
Eliminate use of hazardousmaterials; riparian buffersproper fuel storage precautions
Orchard(s) fertilizers pesticidesPAH’s, fuels
None known Restrict use to biodegradablematerials; secure storage
NaturalKal Lake marl turbidity particulates Particulate monitoring None possibleCyanobacteria cyanotoxins Monthly and emergency
monitoring in placeContinue with sewer system;limit nutrient sources
Flooding fertilizers pesticides Control structure Automatic lake level monitoringReserve Park wildlife pathogens Riparian Preservation Riparian Preservation
Pesticides includes: herbicides, insectides, fungicides, rodenticides, and avicides; Many pesticides are highlytoxic and are mobile in sub-surface flowsPAHs includes: fuels, oil, grease, asphalt (auto wastes also include: transmission fluid, antifreeze, battery acid)Sewage includes: pathogens, organic matter, nitrates, heavy metals, inorganic salts, personal care productscleaners, paints, medications, auto wastes, PAHsPathogens includes: bacteria, viruses, fungi, protozoan parasites
56
4.0 Kalamalka Lk Intake Module 7: Risk Characterization and Analysis
The intent of Module 7 is to connect the contaminant hazards identified in Modules 1 and2 with an evaluation of the existing source protection and water treatment barriers. Thefocus of this report is on the Kalamalka Lake water source itself. Module 7 uses thefollowing set of tables to assign risk.
Table 4.1: IHA Module 7 Hazard and Risk Tables
Qualitative Measures of HazardLevelofRisk
Descriptor Description Probability ofoccurrence withinnext 10 years
A Almost certain Is expected to occur in most circumstances >90%B Likely Will probably occur in most circumstances 71-90%C Possible Will probably occur at some time 31-70%D Unlikely Could occur at some time 10-30%E Rare May only occur in exceptional circumstances <10%
Qualitative Measures of ConsequenceLevel Descriptor Description1 Insignificant Insignificant impact, no illness, little disruption to normal
operation, little or no increase in operating cost
2 Minor Minor impact for small population, mild illness moderatelylikely, some manageable operation disruption, small increasein operating costs
3 Moderate Minor impact for large population, mild to moderate illnessprobable, significant modifications to normal operation butmanageable, operating costs increase, increased monitoring
4 Major Major impact for small populations, severe illness probable,systems significantly compromised and abnormal operation ifat all, high level of monitoring required
5 Catastrophic Major impact for large population, severe illness probable,complete failure of systems
A almost certain Moderate High Very High Very High Very High
B likely Moderate High High Very High Very High
C possible Low Moderate High Very High Very High
D unlikely Low Low Moderate High Very High
E rare Low Low Moderate High High
57
Risk Characterization and AnalysisThe immediacy of the Kalamalka intake makes it vulnerable to contamination. The riskswithin the intake protection zone (IPZ) are generally higher than the risks presented bythe same hazard occurring outside the IPZ. Tables 4.2 and 4.3 summarize the hazardsand assign a risk level based on likelihood and consequence of each hazard, along withexisting and proposed improvements to the barrier(s) guarding the DLC Oyama systemfed by the Kalamalka Lake Intake. For ease of assessment, the hazards have beengrouped as physical, chemical, biological and water system risks. An overview of theprotective barriers is presented in the SWOT analysis found in Table 4.4.
Physical Risks The physical risks presented by Kalamalka Lake include inflows thatcan carry contaminants, transport of contaminants within the lake and re-suspension ofsettled contaminants.
Chemical Risks Naturally occurring chemical risks to Kalamalka Lake and the watersystem involve the marl events that both protect the lake and increase turbidity.Inevitable anthropogenic risks are caused by: storm water, septage and PAHs.Preventable anthropogenic risks include pesticides, fertilizers, manure and accidentalspills. Hopefully increasing societal awareness will continue to diminish the riskpresented by these chemicals. The most catastrophic human impact on DLC’s intake isfortunately extremely unlikely and that is a spill of sewage or toxic chemical within theIPZ.
Biological Risks The naturally occurring biological risks to the intake occur throughoutKalamalka Lake and they involve algae blooms and cyanobacterial blooms. Thesenaturally occurring threats are exacerbated by human activities that add nutrients to thelake system. Pathogens are also naturally occurring, but human travel has greatlyincreased the range of pathogens and their frequency in the Okanagan region.
Water System Risks After water from the 22 m depth in Kalamalka Lake enters theOyama system, it is chlorinated and monitored. All distribution systems are subject toaging, settling of suspended materials, or accidental line breaks. On-goingmaintenance, repairs and monitoring are vital to any water distribution system. Becausethis system was constructed in 1995/6 and is relatively new, repairs are minimal. Anemergency response plan aids in providing an appropriate and swift response to anemergency.
58
Risk Characterization Table: MODULE 7 Part 1: Risks Within Intake Protection Zone
Table 4.2 Risks Inside Intake Protection Zone (IPZ) with the Potential to Impact the DLC Kalamalka Intake
Drinking Water Hazard LikelihoodLevel
ConsequenceLevel
RiskLevel
Comments/ Assumptions
Physical1 Sediment re-suspension A 1 Mod Common during seiches; no E. coli found in sediment under intake
2 Flooding and subsurface inflow D 3 Mod Kal Lk control structure prevents flooding; subsurface flow more probable
3 Adjacent land use impacts A 2 High Building/storing materials below high water line should be corrected
Chemical4 Natural marl event in summer A 2 High Turbidity will exceed 1 NTU at intake after summer marl event
5 Storm water plume to intake C 3 High Storm water carries many contaminants, no outfalls should occur in IPZ
6 Septage / sewage spill to intake E 4 High Unlikely event but major impact expected when spill occurs within IPZ
7 Hydrocarbons PAHs spill D 3 Mod Unlikely event with moderate impact expected when spill occurs within IPZ
8 THM precursors >0.10 mg/L D 3 Mod All results to date are less than 0.100 mg/L T-THM
9 Heavy Metals (from sediments) C 2 Mod Rototilling or seiche disturbance can release metals to lake water
10 Pesticides (overland /seepage) D 3 Mod Toxicity and persistence of pesticides varies; no storage within IPZ rec’d
11 Fertilizers (overland / seepage) C 2 Mod Localized algae bloom may result, trace metal contamination is possible
12 Accidental spills (rail, boats, homes) E 4 High Depending on spill location and type, emergency response may be needed
Biological13 Algae blooms A 2 High Algae increase TOC, THM precursors, odor, chlorine consumption
14 Cyanobacteria blooms B 2 High Chronic low-dose exposure to cyanotoxins >2000 cells/mL undesirable
15 Viruses- pathogenic D 3 Mod Protect IPZ from septage or boater holding tank spill. Viruses do not settle
16 Bacteria- pathogenic D 3 Mod Protect IPZ from septage or boater holding tank spill. Bacteria slow to settle
17 Protozoa – pathogenic E 4 High Protozoan cysts > 5 microns will settle in calm conditions
Water System18 Physical system failure E 3 Mod Disruption of service probable; may have break/spill reach the lake with Cl
19 Treatment / Monitoring failure E 3 Mod Water quality advisory probable
20 Emergency response planfailure
B 3 High No formal Emergency Response Plan is in place; DLC relies on skill ofoperators to handle and notify appropriate authorities
60
Table 4.3: Risks Outside the Intake Protection Zone (IPZ) with the Potential to Impact the DLC Kalamalka Intake
Drinking Water Hazard LikelihoodLevel
ConsequenceLevel
RiskLevel
Comments/ Assumptions
Physical21 Creek Plumes C 2 Mod Coldstream Creek is 14 km away; Kayola Ck is very small and seasonal
22 Adjacent land use impacts A 1 Mod All Okanagan residents must recognize their responsibility
23 Oyama Canal inflows A 2 High Greater risk of seiche transport of cyanobacteria to the intake in spring/fall
24 Sediment re-suspension A 1 Mod Sediment re-suspension is common but exerts minor impact
25 Flooding / subsurface inflow D 2 Low Flooding, subsurface inflow remote from IPZ is unlikely to exert impact
Chemical26 Natural summer marl event A 2 High Turbidity will exceed 1 NTU at intake after summer marl event
27 Storm water plume to intake C 2 Mod Current transport of storm-water packet to the intake is possible
28 Septage and sewage spill C 3 High Seepage from Tween Lakes would be diluted with pathogen deactivation
29 Hydrocarbons PAHs spill C 2 Mod Fuel tank at Tween Lakes should be relocated; on-water fueling protected
30 THM precursors D 2 Low All results to date are less than 0.100 mg/L T-THM
31 Heavy Metals (from sediments) C 1 Low Sediment disturbance outside IPZ unlike to create measurable impact
32 Pesticides (overland or seepage) D 2 Low Toxicity and persistence of pesticides varies; orchards may donate these
33 Fertilizers (overland or seepage) C 1 Low Large nutrient inflows could increase the algae production of Kal Lake
34 Spills (Hwy 97 railway) D 4 High Depending on contaminant spilled, emergency clean-up needed ASAP
Biological35 Algae blooms A 1 Mod Algae blooms can be transported around lake by currents
36 Cyanobacteria blooms C 2 Mod Concentrated cyanobacteria may travel in from Wood Lake with seiche
37 Viruses – pathogenic D 2 Low Low volume of viral introduction unlikely to impact intake
38 Bacteria- pathogenic C 2 Mod Bacteria can be deactivated or consumed as they travel in lake water
39 Protozoa- pathogenic E 3 Mod Vertical settling of 1 m/day - transport of cysts from N end is unlikely
Water System40 Physical system failure E 3 Mod Disruption of service probable to small population
41 Treatment / monitoring failure E 2 Low Water quality advisory probable
42 Emerg. response plan failure B 2 High No formal Emergency Response Plan is in place
4.1 Condition of SourceKalamalka Lake provides excellent quality drinking water with no color, moderatehardness, and very rare taste and odor events. Kalamalka Lake is not under the controlof the District of Lake Country, but water quality relies on every user of the resource.Moderate population densities and the absence of industrial uses has helped restrict therange of potential contaminants that can reach Kalamalka Lake. Oyama Creek watersystem represents an alternate supply in the unlikely event that Kalamalka Lakebecomes contaminated.
4.2 Physical Integrity of Intake, Treatment and Distribution SystemThe Kalamalka Lake intake was completed in 1995/6 and serves 307 domesticconnections and 339 acres of irrigated land. The distribution system is robust and needslittle maintenance. Upgrades to the system are performed based on priority. In 2006,the pumps at the Kalamalka Lake pump house were re-packed and new hypo lines wereinstalled. In 2007, the 50 hp pump was removed and rebuilt and the other pumpsmaintained.
End-of-line low chlorine residuals were resolved with flushing to restore residuals.High iron “color” clears out of the mains during high velocity flushing despite the low ironconcentrations in Kalamalka Lake water.
Maintenance involves draining cleaning and chlorine- shocking balancing reservoirs,proactive line flushing, connection checks, etc. DLC employs full-time operators withLevel I and Level II training and the water manager has Water Distribution Level III.Operators have additional certifications and receive on-going training from DLC (Meger etal., 2006, 2007).
4.3 Risk Assessment for Healthy and Health-compromised IndividualsOn the whole, water quality from Kalamalka Lake is enviable and meets the needs ofhealthy individuals. People with compromised immune systems could profit fromanother pathogen barrier such as UV disinfection or boiling their drinking water. Onearea of concern would be the chronic low dose exposure to cyanotoxins for peoplebattling cancer, those with neurological conditions or those with hepatic/renal conditions.Based on in-place monitoring of pathogens and THMs the risk posed by these materialsis below the guidelines that themselves usually have a ten-fold safety margin built intothem.
62
4.4 Strength/Weakness Opportunities/Threats [SWOT] AnalysisA SWOT analysis provides a summary overview of the balance between the majorpositive and negative aspects of the DLC Kalamalka Lake Intake as identified in Module7. Only those aspects with the greatest potential to influence DLC water quality atpresent and into the future are considered in Table 4.4.
Table 4.4: Strength/Weakness Opportunities/Threats Analysis Summaryof the DLC Kalamalka Lake IntakeStrengths Weaknesses
The large size and depth of oligotrophicKalamalka Lake helps maintains constantwater quality
Low concentrations of cyanobacteria mostof the year;
Urban areas are not close to the intake;land use near IPZ is low-intensity
SCADA system includes turbidity (under
repair) temperature, free Cl, low wet well etc. Water operators have appropriate training
levels and training is on-going Appropriate IHA directed water quality
monitoring is reported Alternate supply in Oyama Creek Dedicated DLC staff and council Co-ordination of Kal Lk study between DLC
GVWU and MoE, IHA, OBWB Ongoing replacement of septic with sewer
esp. important on near-lake properties FIM Foreshore Inventory mapping and
SHIM Sensitive Habitat Inventory Mappingare underway for Kal Lk and Coldstream Ck
The 22 m depth of the intake providessome protection from surface contaminantsbut seiches regularly deliver surface waterto the intake depth in the spring and fall
Natural turbidity caused by the marlprecipitation interferes with disinfection anddeposits in water mains
Lack of DLC and GVW control overKalamalka Lake and adjacent land use
Lack of DLC control over materials hauledon rail line and Hwy 97
Recreational and land developmentpressures on Wood-Kalamalka Lakes areincreasing
Small number of connections (307) limitsavailable funds for system improvements
Second disinfection barrier not in place
Opportunities Threats Apply for License of Occupation over Intake
Protection Zone from ILMB Enter into discussions with rail line on
chemicals hauled Install raw water sample line on intake Establish no-build, no-disturb setback bylaw
for foreshore protection from futuredevelopment based on 1-100yr storm
Develop storm water master plan – relocateuntreated storm water from IPZ
Funding from grants are available Public Education about Kal Lk as a water
source Develop emergency response plan UV disinfection would be effective on this
high-quality water Extending the Intake to 30 m would provide
better water quality and be more remotefrom sources of contamination
Cyanobacteria counts exceeded 2000cells/mL in the spring and may beincreasing with climate change
Wood Lake surface cyanobacterial blooms Increasing population pressures for lake
recreation, particularly motorized craft Full inventory of storm water outfalls in IPZ
is not known Impact of remaining septic systems is not
known Inadequate enforcement of recreation
polluters and foreshore violations
63
5.0 Kalamalka Lake Intake Module 8: Recommendations
The summation of Modules 1, 2 and 7 lead to the recommendations to improve DLCKalamalka Lake Intake – Oyama Water System presented here as Module 8. Thissection presents three action plans addressing; source protection, the existing watertreatment system, and finally future large expenditure system improvements. Thehazards from Table 4.2 and 4.3 addressed by each recommendation are shown in theRisk box attached to each recommendation below.
5.1 Source Protection Action PlanThe only items worth placing into a source protection action plan are those that can berealistically achieved both from a financial and practical standpoint. Improvements thatprovide the best cost-benefit for risk reduction are itemized below. Additional protectionmeasures intended to protect unimpaired areas are also provided.
As the License Holder/Owner of a Drinking Water Intake, DLC could apply to IntegratedLand Management Bureau (ILMB) through Front Counter BC for a License ofOccupation over the Intake Protection Zone. This License would pre-empt or placelimits on future developments (e.g. marinas, house boat moorage) and proposedadjacent uses would be flagged for DLC comment. The License would be in addition tothe W1-recreation and W2-marina restrictions in place now. Sections 878 (planningOCP) and 938 (storm water engineering bylaw) of the Local Government Act may alsobe relevant. The IPZ could be added to the Official Community Plan (OCP) for DLC andthat would give the intake further protection.
The DLC land use planning department has Environmental Development Permit areas inplace to protect the foreshore but could also could use other jurisdiction’s foreshorepolicies to draft enforceable (no-build, no-disturb) set-backs from the high water markand a pesticide ban on lakeshore properties. There are serious examples of privateintrusion on Southern Kalamalka Lake foreshore including in-filling, retaining walls,building cabins on piles over the water and inappropriate storage of fuel and landscapingmaterials near the high water mark. Assist adjacent owners with dismantling structuresremoving risks, correcting septic problems especially at T’ween Lakes Campground.Sections 878 (planning OCP) and 938 (storm water engineering bylaw) of the Local Government Act may also be relevant.
Suggested Buffers 10 m no-build no disturb15-30 m retain natural vegetation (follow Riparian Areas Regulations)100 m restrict disturbance; septic storage or disposal300 m restrict development
Ideally no known storm water outfalls should discharge within the intake protection zoneor within two hour’s transport during maximum current velocity, whichever is greater.The DLC may need to map the storm water facilities adjacent to the IPZ; currently nooutfalls are known in the Trask Road area (e.g. The Kaloya Park parking lot run-offshould be directed to swales before it reaches the lake)
On-going Position infrastructure toprotect DLC intake
If it is not available, a storm water master plan that would identify all storm water outfallsto Kalamalka Lake is needed. Outfalls within the IPZ (if any) should be replaced withsoak-away zones, swales etc. first, followed by the replacement of storm water outfallsoutside the IPZ.
5.1.5 Mitigate Potential for Sewage/Septage Spill near DLC Pumphouse
Consideration should be given to providing back-up power to the DLC lift station given itsproximity to the Kalamalka Lk wet well. Appropriate containment strategies should beincluded in the Emergency Response Plan.
low On-going Better voluntary control ofcontaminants to Kal Lk
Public education through open houses, e-mailings, bill stuffers and other initiatives canhelp encourage responsible public behaviour and is key to preserving Kalamalka Lakewater quality. The newly-formed Society for the Protection of Kalamalka Lake (SPKL) isan example of a focussed, well-organized group that DLC could co-operate with. OBWBprovides basin-wide education through their Water Wise program. DLC and OBWBcould co-operate to get intake protection better understood by local residents. Signageincluding maps of the Intake and the IPZ could be posted at parks and boat launches toremind residents that Kalamalka Lake is a drinking water supply.
5.1.7 Annual Overview of Changes to South Kalamalka Lake
RRRiiissskkk AAAccctttiiiooonnn WWWhhhooo??? CCCooosssttt TTTiiimmmeeefffrrraaammmeee OOOuuutttcccooommmeee3 12 1 day survey, update DLC Staff time annual Knowledge of changes
A brief annual survey of South Kalamalka Lake from a boat and an update from theplanning department would allow an annual overview of changes to the lake andadjacent land use that have the potential to impact water quality at the intake. They canbase their observations on the FIM work completed by Ecoscape, 2010.
65
5.1.8 Maintain Kalamalka Protected Area
RRRiiissskkk AAAccctttiiiooonnn WWWhhhooo??? CCCooosssttt TTTiiimmmeeefffrrraaammmeee OOOuuutttcccooommmeee3 13 Maintain park status Prov of BC None to LC On-going Shoreline protection
District of Lake Country should petition the Province to encourage the Protected Area’sstatus as a natural park and to encourage a zero-tolerance policy to recreational or landdevelopment activities within its boundaries that have the potential to adversely impactwater quality.
5.1.9 Discussions with Railway on Goods Transported
DLC should open discussions with Knighthawk Rail on what they carry on the lineparalleling Kalamalka Lake shoreline. There may be opportunity to limit what is carriedor have the appropriate spill containment measures provided to DLC.
5.2 Water Treatment and System Protection PlanPreventative measures and corrective action for critical hazards to the Kalamalka LakeIntake - Oyama water system are laid out in this section.
DLC $15,000 2010 Compliance with IHAfiltration deferral
DLC needs a raw water sample line on the intake for accurate raw water bacteriologicalsampling and to meet IHA’s filtration deferral requirements. It would also allow DLC tonot post a Water Quality Advisory when turbidity exceeds 1 NTU provided bacterialcounts are acceptable. The intake was originally equipped with this line but it has sincefailed.
20Plan preparation DLC student wages Start in 2010 Better reaction to emerg.
Lake Country needs an All Hazards Emergency Response Plan. The plan should includeemergency contact numbers, steps to follow, agencies to notify, protocols to follow forpublic notice, etc. This could be prepared by a Water Quality Tech. summer studentusing the GVW plan as a guide.
The Kalamalka Pump-house SCADA system could be upgraded to include continuoustemperature (and possibly pH) as well as turbidity monitoring. These SCADA systems
66
are robust. Water temperature will show the correlation between seiches and turbidity.On-line continuous monitoring of turbidity will fulfill IHA’s filtration deferral criteria andprovide data on all turbidity events. This monitoring will also demonstrate the correlationbetween marling and turbidity exceeding 1 NTU in a 30 day period during late summer(with UV and chlorine disinfection, GVW is allowed to reach 3.5 NTU without calling awater quality advisory). Currently, monthly turbidity reports are sent to IHA.
filtration deferralSeasonal THM samples should be collected for three years and then dropped down toonce annually during the season when the highest total THMs are expected: Spring,Summer and Fall THM samples should be collected from a location furthest fromtreatment. (Alternately a sample could be collected during a bloom and chlorinated tonormal DLC concentrations and allowed to stand for 7 days in a THM-potential test.(This sampling is expected to meet all criteria i.e. generate a good news outcome.)Additionally THM-potential tests could be added to 20 30 and 40 m for 2010 only.
5.2.5 Enhanced water quality sampling at Intake and System
RRRiiissskkk AAAccctttiiiooonnn WWWhhhooo??? CCCooosssttt TTTiiimmmeeefffrrraaammmeee OOOuuutttcccooommmeee19 More WQ sampling DLC (see below)
Approx4100.002010 Compliance with IHA
filtration deferralUpgrade current routine sampling to include:Yearly, schedule A comprehensive ($ 148.00)Quarterly T-THM ($112.50)Monthly – protozoa Cryptosporidium and Giardia (may not need to continue thissampling intensity indefinitely, based on results) $181.90 (MB Labs Richmond 279-0666)
(required for filtration deferral but under review, test not fully reliable)Bi-weekly – alkalinity ($11.70) hardness (in-house), TOC ($36.00)Weekly - true color ($7.20), UV transmissivity ($10.80) Total & E. coli (25.00)as per the IHA Filtration Deferral Guidelines - Costs from Caro Labs, Kelowna
RRRiiissskkk AAAccctttiiiooonnn WWWhhhooo??? CCCooosssttt TTTiiimmmeeefffrrraaammmeee OOOuuutttcccooommmeee6 28 Monitoring of high
risk activitiesOwner unknown 2010 Leads to corrective action
e.g. sewer hook-upThere is significant risk posed by the T’ween Lakes septic system that is prone toflooding and will report to Kalamalka Lk and the Amry private system on Trask Road thatis apparently not dealing with nitrates adequately. Amry has indicated that they will bediscontinuing the use of this system. In both cases, the owners should embark on furthermonitoring and research alternatives, possibly with help from Lake Country and IHAstaff.
67
5.3 Future Large Expenditure Improvements to Lake Country SystemThis final section of recommendations covers the large expenditure items that requireextensive preparation and planning.
5.3.1 Intake ExtensionWhen all measured physical, chemical and biological parameters are considered, from2000 to present, the advantages of a 30 m intake extension from the current 22 m intakeare:
Reduced seiche impact, transport of surface contaminants Maximum temperature deviation during a seiche would be lowered to <4 – 6 oC Lower overall water temperature Lower turbidity (range in 2008 = 0.1 – 0.7 NTU vs 0.6 – 0.8 NTU at 22 m) Lower transmissivity during fall overturn Lower algae production (range of chlor-a in 2008 = 1.2 – 2.4 ug/L vs 1.1 – 4.1
ug/L at 22 m) Lower total coliforms and possibly pathogens Lower pH (range in 2008 = 7.6 – 7.9 versus 7.8 – 8.0 at 20 m) A theoretically lower risk of contaminants from land-based activities or Wood
Lake input Smaller IPZ because lake currents travel slower at 30 m Opportunity to give intake better clearance from substrate (minimum 3 m
vertically above substrate)
Further water quality improvement would result from extending the intake to 40 m depthand samples will be collected on 6 occasions in 2010. Quantifiable water qualitychanges are summarized in Table 5.3.
Table 5.3: Water Quality Change with Current and Extended Intakes - 2009
Kalamalka Lake South20 m
South30 m
South40 m
Distance to pumphouse m 550 755 1810# of seiches exceeding 2 oC/yrMax seiche temp.fluctuation oC
The largest disadvantage to extended intakes is their cost of installation. The distancesto a 40 m depth are large, but the distance to 30 m depth for DLC is only 205 m.
Kalamalka Lake N end S endIntake extension to 30 m 553 m 205 mIntake extension to 40 m 1510 m 1175 m(minimum distance to proposed intake depth; engineered location may vary slightly)
68
There is a substantial reduction of risk resulting from an increase in the depth of theintakes (Hayco, 2000). The area that can contribute contaminants to an intake shrinks asthe intake depth increases and the Intake Protection Zone would also shrink.
5.3.2 Addition of UV DisinfectionThe IHA Filtration Deferral document calls for another method of disinfection in additionto chlorination. UV disinfection would be appropriate because the UV transmissivitiesmeasured thus far have all been in the acceptable range for UV disinfection. UV-basedsystems adapt well to small water systems and are cost-effective. The system used byGVW for their Kalamalka Lake Intake could be reviewed for efficiency and costs. WithUV and chlorine disinfection, GVW is allowed to reach 3.5 NTU without calling a waterquality advisory. UV treatment may also help deactivate several cyanotoxins.
5.3.3 Additional RecommendationsContinuing with the replacement of septic fields within 200 m of Kalamalka and WoodLakes is vital to the long-term health of these important water bodies.
69
Overview of Kalamalka Lake Intakes, their Depth and InfluencesThe first two columns provide the depths of the Large Kalamalka intakes by sub-basinThe last four columns demonstrate the approximate thermal, pathogen, cyanobacterialand turbidity risks as intake depth changes
South North Depth Thermal Risk of Cyano- Turbiditysub-basin Arm (m) Zones pathogen bacteria
1 warm highest risk high risk
2 surface of surface turbidity >1
3 water high risk for cyanobacteria in freshet
4 surface water and marl
o East GVW Kal 5 contamination events
6 lower risk
7 of surface
8 moderate risk cyanotoxins
9 for surface
10 water layer
11 summer contamination
12 thermocline average
13 zone significant turbidity
14 growth of 0.75 - 1 NTU
15 contamination low light
16 active seiches risk is lower cyanobacteria
17 (two per week) below the
18 thermocline
19 15o C guideline exceeded above this depth
20
o North GVW Kal 21
o DLC South Kal 22 avg turbidity
23 seiches 0.75 NTU
24 diminish lower riisk
25 5 - 10 oC of
26 temp range cyanotoxins
27 (10-12/yr)
28
29
30 low risk
31 of pathogens
32
33
34 seiches low risk >30 m
35 diminish of cyanotoxins best range
36 4 -10 oC to avoid
37 temp range turbidity
38 (4-10/yr)
39
40
41 very low
42 low seiche risk best range
43 risk temp of pathogens for intakes
44 range <5oC to avoid
45 (1-4/yr) cyanobacteria
46
47 maximum depth for divers
48
49
50
minimal low riisk
60 seiche of
penetrations cyanotoxins
70
re-suspension
80 suspended high risk of very high
>>> detritus benthic cyanob turbidity spikes
COMMENTS: The thermal, pathogen and cyanobacterial risks depicted in this chart are generalized;every intake is affected by sub-basin and location ( proximity to creek plumes, outfalls, storm water etc.)
70
Literature Cited or Consulted
Anderson, Des, 2009. 2009 Water Supply Outlook and Okanagan Lake Operation.Water Stewardship Division BC Ministry of Environment
Ashley, K., MacGregor, B., Shepard, B., Sebastian, D., Matthews, S., Vidmanic, L.,Ward, P., Yassien, H., McEachern, L., Andrusak, H., Lasenby, D., Quirt, J., Whall, J.,Taylor, E., Kuiper, P., Troffe, M., Wong, C., Scholten, G., Zimmerman, M., Epp, P.,Jensen, V., and Finnegan, R. Okanagan Lake Action Plan Year 3 (1998) Plan. B.C.Fisheries Report Number RD 78 1999.
BC Ministry of Environment, 1975. Synopsis of Kalamalka –Wood Lake Study
Bitto, Adenike and Abdalla Aldras, 2009. Prevalence of Giardia and Cryptosporidium inMuskrats in Northeastern Pennsylvania and New York, Journal of Environmental Health,April 2009. Bryan, J.E., 1990. Water Quality of Okanagan, Kalamalka and Wood Lakes.B.C. Ministry of Environment.
Bryan, J. and Jensen, V. 1996. Review of Okanagan Lake Physical and ChemicalLimnology. Pp 44-56 In Andrusak, H. S. Matthews, I McGregor, K Ashley, R. Rae, A.Wilson, J. Webster, G Andrusak, L. Vidmanic, J Stockner, D. Sebastian, G. Scholten, P.Woodruff, B. Jantz, D. Bennett, H. Wright, R. Withler, S. Harris. 2005. Okanagan LakeAction Plan Year 9 (2004) Report
Carter, A.M., R. E. Pacha, G. W. Clark, and E. A. Williams, 1987. Seasonal Occurrenceof Campylobacter spp. in Surface Waters and Their Correlation with Standard IndicatorBacteria. Applied and Environmental Microbiology, Mar. 1987, p. 523-526 Vol. 53, No. 3
City of Kelowna, 1998. Okanagan Lake Water Quality Intake Study June – August,1998. City of Kelowna Water Operations 951 Raymer Ave., Kelowna, B.C.
Chorus, I. and Bartram, J. (1999) Toxic Cyanobacteria in Water: a Guide to PublicHealth Significance, Monitoring and Management. Für WHO durch E & FN Spon/Chapman & Hall, London, 416 pp.
Clements, W.A. Rawson D.S. McHugh, J.L. 1939. A Biological Survey of OkanaganLake. B.C. Fisheries Research Board of Canada Bulletin No. LVI
Cohen, S., and T. Neale, eds. 2006. Participatory Integrated Assessment of WaterManagement and Climate Change in the Okanagan Basin, British Columbia. Vancouver:Environment Canada and University of British Columbia
Cooke G.D. and Kennedy, R.H. 2001. Managing Drinking Water Supplies. Lake andRes. Management Vol 17, No3, September 2001.
Cox, Peter, Merran Griffith, Mark Angles, Daniel Deere, and Christobel Ferguson,2005. Concentrations of Pathogens and Indicators in Animal Feces in the SydneyWatershed Applied and Environmental Microbiology, October 2005, p. 5929-5934, Vol.71, No. 10 0099-2240/05/$08.00+0 doi:10.1128/AEM.71.10.5929-5934.2005
71
Dai, X. and J. Boll, 2006. Settling Velocity of Cryptosporidium parvum and Giardialamblia. Water Research, Vol 40 Issue 6 pp 1321 – 1325.
Department of Natural Science, 2003, Density of Goose Feces in Vilas Parkhttp://natsci.edgewood.edu/wingra/wingra_goosefeces.htm (Accessed January 11, 2008).
Dill, Peter, 1972. Geology of the Main Okanagan Lakes (chpt 4)
Donskow, K., A. Bajer, M. Bednarska, and E. Sinski. 2005. Experimental transmission ofCryptosporidium parvum isolates from wild rodents and calves to laboratory bredcommon voles (Microtus arvalis). Acta Parasitologica 50: 19–24.
Dougherty, Jennifer A. 2005. Septic System Effluent, an Unconstrained Source forPharmaceuticals and Personal Care Products (PPCPs) in Ground and Surface WaterUS EPA Grant Number: F5B20266
Feng, Yaoyu, Kerri A. Alderisio, Wenli Yang, Lisa A. Blancero, William G. Kuhne,Christopher A. Nadareski, Michael Reid, and Lihua Xiao , 2007. CryptosporidiumGenotypes in Wildlife from a New York Watershed Microbiology, October 2007, p. 6475-6483, Vol. 73, No. 20 0099-2240/07/$08.00+0 doi:10.1128/AEM.01034-07
Fisher, M.M., R.R. Reddy and R.T. James, 2001. Long-Term Changes in the SedimentChemistry of a Large Shallow Subtropical Lake. Lake and Res. Management Vol 17,No3, September 2001.
Godshalk, G.L. and R.G. Wetzel, 1977 Decomposition of macrophytes and themetabolism of organic matter in sediments p. 258-265 IN Interactions betweensediments and freshwaters Proc. Int. Symp. Junk.
Hansen, Patti and Jack Allingham, 2006. District of Lake Country’s Water Systems 2006Water Operations Report. D of LC 10150 Bottom Wood Lake Road Lake Country BCV4V 2M1 www.lakecountry.bc.ca
Hansen, Patti and Jack Allingham, 2007. District of Lake Country’s Water Systems 2006Water Operations Report. D of LC 10150 Bottom Wood Lake Road Lake Country BCV4V 2M1 www.lakecountry.bc.ca
Hayco (Hay and Company Consultants Inc.) 2002. Okanagan Lake Limnology Study -Helping to Improve Water Quality and Safety IN Innovation November 2002.
Hay and Company, 2009. Kelowna Old Floating Bridge Pontoon Sinking – TechnicalMemo January 12, 2009 File V13201134 and February 13, 2009 File V13201184Hayco (Hay and Company Consultants Inc.) 2000. Okanagan Lake Limnology Study.
Health and Welfare Canada 1992. Guidelines for Canadian Recreational Water QualityCanada.Prepared by the Federal-Provincial Working Group on RecreationalWater Quality of the Federal-Provincial Advisory Committee on Environmentaland Occupational Health
72
Hilton, J,, J.P. Lishman and P.V. Allen, 1986. The Dominant processes of sedimentdistribution and focusing in a small eutrophic, monomictic lakeHoward, T.E., 1971. Report on Okanagan Lake Nutrient, Dissolved Oxygen andTransparency in Spring, 1970. B.C. Research, Division of Applied Biology
Hitzfeld et.al: 2000. Cyanobacterial Toxins: Removal during Drinking Water Treatment,and Human Risk Assessment, Environmental Health Perspectives, Vol 1 08,Supplement 1, March 2000.
Hudnell, Kenneth H 2008. Cyanobacterial Harmful Algal Blooms: State of the Scienceand Research Needs. Springer Science, 2008.
Hudnell, Kenneth, H. (ed.): 2007. Proceedings of the Interagency, InternationalSymposium on Cyanobacterial Harmful Algal Blooms Advances in ExperimentalMedicine & Biology, i-x, 2007.
Kerr Wood Leidal and Dobson Engineering, 2008. Duteau Creek Watershed Assesmentand Recommendations for Source Protection. KWL File 773.052
Knox County Website ND, www.knoxcounty.org/health/pharmaceutical_waste.phpAccessed on Feb 14, 2010.
Larratt, H.M., 2007. Biological Enhancement of Mine Ponds and Assessment ofAdjacent Natural Lakes – Highland Valley Copper, 2006 Annual Report.
Larratt H.M. 2008, Kalamalka Lake Water Quality Study; Microflora, Water Chemistryand Thermal Profiles Report for GVW DLC MoE.
Larratt, H.M., 2009 Deep Okanagan Lake Biology Report Research funded by OBWB
LeChevallier, Mark, W., and Kwok-Keung Au, 2004. Water Treatment and PathogenControl – Process Efficiency on Achieving Safe Drinking Water, World HealthOrganization, IWA Publishers, London. Pp 53-55.
Mallevaille, J., and Suffet, I.H., 1987. Identification and Treatment of Tastes and Odoursin Drinking Water, AWWA.
NJ-DEP New Jersey Department of Environmental Protection Division of WatershedManagement, No Date. http://www.state.nj.us/dep/watershedmgt/waterbook_chp5.htm
Nordin, R.N., 1985. Water Quality Criteria for Nutrients and Algae Technical Appendix.B.C. Ministry of Environment, Water Management Branch, 104 p.
Nordin, R.N. , Swain, L., Nyman, R., Rocchini, R., Wetter, D. 1988. Phosphorus in theOkanagan Valley Lakes; Sources, Water Quality Objectives and Control Possibilities. 71
OBA Canada – British Columbia Okanagan Basin Agreement, 1973. The Final Reportof the Consultative Board. Office of the Study Director, Penticton BC; available on-lineat www.env.gov.bc.ca/wat/wq/studies/oklimnology.pdf
73
Palmer, M.C., 1980. Algae in Water Supplies. U.S. Dept. of Health, Education andWelfare.
Schleppe, J., 2009. Okanagan Lake South Foreshore Inventory and Mapping. EcoscapeEnvironmental Consultants Ltd.. Project File: 09-371. July, 2009. Prepared for: RegionalDistrict Okanagan Similkameen.
Seiler, Ralph L., Steven D. Zaugg, James M. Thomas and Darcy L. Houcroft, 1999.Caffeine and Pharmaceuticals as Indicators of Wastewater Contamination in Wells.USGS Vol 37 No3 GROUND WATER May/June 1999. pg 405 – 410.
Sokal, Mike, 2010. Coldstream Creek and Kalamalka Lake PP Presentation BCMinistry of Environment, Penticton, BC
Stantec, 2007. Lake Ontario Intake Assessments. PowerPoint prepared by JohnLangan of Stantec
U.S. Environmental Protection Agency, 2006. Draft Pathogen TMDL for theConcord River Watershed. http://www.mass.gov/dep/water/resources/concord1.pdf
U.S. Geological Survey, 2007.Modeling Hydrodynamics, Water Temperature andSuspended Sediment. http://pubs.usgs.gov/sir/2007/5008/section5.html
Van Gemert, L.J. and Nettenbreijer, A.H. 1977. Compilation of Odour Theshold Valuesin Air and Water. Natl. Inst. for Wtr. Supply, Voorburg, Netherlands.
Walker, I.R., E.D. Reavle, S. Palmer and R.N. Nordin, 1994. A PalaeoenvironmentalAssessment of Human Impact on Wood Lake, Okanagan Valley, British Columbia,Canada. Quarternary International Vol.14 pp 58 – 70.
Wetzel, Robert, G., 2001 Limnology, Lake and River Systems, Third Edition. AcademicPress, San Diego.
Ziegler, Peter E., Susan E. Wade, Stephanie L. Schaaf, Yung-Fu Chang and Hussni O.Mohammed, 2007. CRYPTOSPORIDIUM SPP. FROM SMALL MAMMALS IN THENEW YORK CITY WATERSHED Department of Population Medicine and DiagnosticSciences, College of Veterinary Medicine, Cornell University, Ithaca, New York 14853,USA
74
Appendix 1: Supporting Documentation
75
Fire-Fighting Stormwater Contaminates Mill Creek and City Beach, Kelowna
76
Appendix 2: Activities Impacting the Intake Protection Zone Checklist
Municipal Minimize shoreline clearing for beaches especially with adjacent grassed areas
(attracts geese) Re-locate storm water outfalls to discharge outside of intake protection zone Encourage developers to capture and use storm water on their properties Stop or limit the use of fertilizers, pesticides on municipal spaces
Residential Yard Maintenance, Landscaping & Gardening• Minimize the disturbance of shoreline areas by maintaining natural vegetation cover.• Minimize high-maintenance grassed areas.• Replant lakeside grassed areas with native vegetation. Do not import fine fill or sand for beaches.• Use paving stones instead of pavement.• Stop or limit the use of fertilizers, pesticides.• Don’t use fertilizers in areas where the potential for water contamination is high, suchas sandy soils, steep slopes, or compacted soils.
Agriculture• Locate confined animal facilities away from water bodies and storm water system.
Divert incoming water and treat outgoing effluent from these facilities.• Construct adequate manure storage facilities.• Do not spread manure during wet weather, on frozen ground, in low-lying areas proneto flooding, within 3 m of ditches, 5 m of streams, 30 m of wells, or on land where runoffis likely to occur.• Install barrier fencing to prevent livestock from grazing on stream banks.• If livestock cross streams, provide graveled or hardened access points.• Provide alternate watering systems, such as troughs, dugouts, or nose pumps forlivestock.• Maintain or create a buffer zone of vegetation along a stream bank, river or lakeshoreand avoid planting crops right up to the edge of a water body.• Limit the use of fertilizers and pesticides
Onsite Sewage Systems• Inspect your system yearly, and have the septic tank pumped every 2 to 5 years• Use phosphate-free soaps and detergents.• Avoid septic additives and house-hold cleaning chemicals• Don’t put toxic chemicals (paints, varnishes, thinners,waste oils, photographicsolutions, or pesticides) down the drain because they can kill the bacteria at work in youronsite sewage system and can contaminatewaterbodies.• Conserve water: run the washing machine and dishwasher only when full and use onlylow-flowshowerheads and toilets.
77
Auto Maintenance• Use a drop cloth if you fix problems yourself.• Recycle used motor oil, antifreeze, and batteries.• Use phosphate-free biodegradable products to cleanyour car. Wash your car overgravel or grassy areas, but not over sewage systems.
Boating• Do not throw trash overboard or use lakes or other water bodies as toilets.• Use biodegradable, phosphate-free cleaners instead of harmful chemicals.• Conduct major maintenance chores on land.• Use four stroke engines, which are less polluting than two stroke engines, wheneverpossible. Use an electric motor where practical.• Keep motors well maintained and tuned to prevent fuel and lubricant leaks.• Use absorbent bilge pads to soak up minor oil and fuel leaks or spills.• Recycle used lubricating oil and left over paints.• Check for and remove all aquatic plant fragments from boats and trailers beforeentering or leaving a lake.• Do not use metal drums in dock construction. They rust, sink and become unwanteddebris. Usepolystyrene (completely contained and sealed in UV-treated material) or washed plasticbarrel floats.• When within 150 m of shore adjust your speed accordingly to prevent waves fromeroding banks. Adhere to British Columbia’s Universal Shoreline Speed Restrictionwhich limits all power-driven vessels to 10 km/hr within 30 m of shore. Exceptions to thisrestriction include:• vessels traveling perpendicularly to shore when towing a skier,wakeboard, etc.
-After BC Lake Stewardship Society 2008
78
Appendix 3: E. coli Source Tracking in City of Kelowna Creeks ReceivingStorm Water and at Beaches
City of Kelowna Creeks with Storm Water 2006 City of Kelowna Creeks and Beaches 2006E. coli Bacterial Source Tracking E. coli Bacterial Source Tracking
City of Kelowna Creeks with Storm Water 2008 City of Kelowna Creeks and Beaches 2008E. coli Bacterial Source Tracking E. coli Bacterial Source Tracking