20
DISTRICT PROFILE KILLA ABDULLAH

DISTRICT PROFILE KILLA ABDULLAH
Written by
Asmat Kakar, Monitoring and Evaluation Officer, BRDCEP, RSPN
©2017 Rural Support Programmes Network (RSPN), Balochistan Rural Support
Programme (BRSP), and National Rural Support Programme (NRSP). All rights Reserved.
www.rspn.org; www.brsp.org.pk; www.nrsp.org.pk
“This publication has been produced with the assistance of the European
Union. The contents of this publication are the sole responsibility of Rural
Support Programmes Network (RSPN), Balochistan Rural Support
Programme (BRSP), and National Rural Support Programme (NRSP) and can in no way
be taken to reflect the views of the European Union.”
More information about the European Union is available on:
Web: http://eeas.europa.eu/delegations/pakistan/
Facebook: European-Union-in-Pakistan/269745043207452

CONTENTS
Acronyms and Abbreviations .............................................................. 1
1. District Profile Brief ................................................................. 2
2. Demography and Population ........................................................ 4
3. District Administration .............................................................. 5
4. Agriculture and Horticulture........................................................ 8
5. Gender and Women Empowerment ................................................. 9
6. Health and WASH ................................................................. 10
7. Education ........................................................................... 12
Community Institutions of BRSP ........................................................ 15
Bibliography .............................................................................. 16
List of Figures and Tables
Figure 1: District Map ............................................... Error! Bookmark not defined.
Figure 2: Local Government Administration Organogram (Administrative Setup) ..................... 6
Figure 3: Stage wise Enrolment 2016-17 ...................................................................... 9
Figure 4: Person Collecting Water in Killa Abdullah (%) ................................................ 10
Figure 5: Rural Children Immunized aged 12-23 months (%) ........................................... 10
Figure 6: Health Facilities 2014-15 ........................................................................... 11
Figure 8: Drinking Water Sources ........................................................................... 12
Figure 9: Number of Schools 2016-17 ....................................................................... 13
Figure 10: Total School by Level 2016-17 ................................................................... 13
Figure 11: Functional and Non Functional Schools 2016-17 .............................................. 13
Figure 12: Sanctioned and Appointed Staff in Schools 2016-17 .......................................... 13
Figure 13: Student Teacher Ratio 2016-17 .................................................................. 13
Figure 14: Rural Gross Enrolment Ratio at Primary Level (age 5-9) ................................... 13
Figure 15: Available Facilities in Schools 2016-17 ......................................................... 14
Table 1: Demography and Population Patterns .............................................................. 4
Table 2: Poverty Status in Killa Abdullah .................................................................... 5
Table 3: Tehsils and Union Councils........................................................................... 6
Table 4: Federal and Provincial Government Departments in Killa Abdullah ........................... 7
Table 5: NGOs working in Killa Abdullah .................................................................... 7
Table 6: Land Utilization 2014-15 (area in hectares) ........................................................ 8
Table 7: Area Irrigated by different Sources of Irrigation 2014-15 (area in hectares) .................. 8
Table 8: Member of Household Own Land in Rural Areas ................................................. 8
Table 9: Number of Tube-wells 2014-15....................................................................... 9
Table 10: Number of Government & Private Tube-wells 2014-15 ......................................... 9
Table 11: Health Facilities 2014-15 .......................................................................... 10
Table 12: Number of Health Practitioners 2014-15 ........................................................ 11

Table 13: Water and Sanitation Indicators (%) ............................................................ 11
Table 14: Distribution of Rural Household by Source of Drinking Water (%)......................... 12
Table 15: Distribution of Rural Households by Type of Toilet (%) ...................................... 12
Table 16: Rural Education Indicators (%) .................................................................. 14
ACRONYMS AND ABBREVIATIONS
AIDS Acquired Immune Deficiency Syndrome
ANC Antenatal Care
ARI Acute Respiratory Infection
BHU Basic Health Unit
BLGO Balochistan Local Government Ordinance
BRDCEP Balochistan Rural Development and Community Empowerment
Porgramme
BRSP Balochistan Rural Support Programme
DC Deputy Commissioner
DEWS Disease Early Warning System
DHIS District Health Information Software
EPI Expanded Programme on Immunization
EU European Union
GoB Government of Balochistan
HH Household
HMIS Health Management Information Systems
Km Kilometer
LG Local Government
LSO Local Support Organisation
MICS Multiple Indicators Cluster Survey
MNCH Maternal, Newborn and Child Health
NADRA National Database and Registration Authority
NGO Non-Governmental Organisation
PBS Pakistan Bureau of Statistics
PDMA Provincial Disaster Management Authority
P&D Planning and Development
PSDP Public Sector Development Programme
PSLM Pakistan Social and Living Standards Measurement
RHC Rural Health Clinics
RMC Regional Metrological Centre
RSP Rural Support Programme
RSPN Rural Support Programmes Network
SBA Skilled Birth Attendant
TB Tuberculosis
TBA Traditional Birth Attendance
LHV Lady Health Visitor
LHW Lady Health Worker
LHW-MIS Lady Health Worker - Management Information Systems

2
1. DISTRICT PROFILE BRIEF
Major Factors
District Status: 14 June, 1993
Geographical Area: 5,263 Square km
Administrative Units: 4 Tehsils and 25 Union Councils (LG Balochistan)
Major Ethnic Groups: Pashtun, Kakar, Achakzai
Languages: Pashto, Urdu
Climate: Dry winter, Scanty rainfall, dry summer
Demography
District Population: 757,578 (2017)
Rural Population: 608,236 (80.29%)
Population Growth Rate: 3.97 (average annual 1998-2017)
Household Size: 7.79 persons
Law & Order:
3 Police Stations, 7 Levies Thanas (GoB, 2014-15)
Productive Sector
Agriculture Ecological Zone: Very cold
Agriculture Land Area (hectares): Cultivated area Net sown: 9,360
Area not available for cultivation: 0
Culturable waste: 0 (GoB, 2014-15)
Major Crops: Rabi Crops: Wheat, Barley, Cumin, Vegetables, Fodder
Kharif Crops: Fruits, Melons, Tobacco, Potato, Fodder,
Onion, Vegetables
Major Fruits: Apple, Apricot, Peach, Plum Grapes, Pomegranate
Livestock Population:
Livestock 630,566
Domestic poultry 366,695 (GoB, 2014-15)
Veterinary Institutions: 4 Veterinary Hospitals, 28 Veterinary Dispensaries
Telecommunications: 8 Telephone exchanges, 3647 Landlines
Post offices: 7 Post Offices (GoB, 2014-15)
Social Sector
Drinking Water Sources: 99% Improved, 1% Un-improved (MICS, 2010)
Sanitation Facilities: 96% Improved, 4% Un-improved (MICS, 2010)

3
Health Facilities: 1 Hospital (Public Sector)
6 Rural Health Centres RHC
9 Dispensaries (GoB, 2014-15)
Pre-Natal consultation: 21% (% of cases) (PSLM, 2014-15)
Major Diseases: ARI, Diarrhea, Malaria, Gastrointestinal diseases,
Respiratory diseases
Special Health Programmes: Expanded Program on Immunization, TB Control Program,
Malaria Control Program, Hepatitis Prevention and Control
Program, MNCH Program, National Program for Family
Planning & Primary Health Care, AIDS Control Program
Reporting and Surveillance Systems: HMIS and DHIS, Disease Early Warning System,
LHW-MIS
Number of Schools: Girls 16%, Boys 83%, Co-education 3%
Primary level Rural Gross Enrolment Ratio (age 5-9): Female 14, Male 50
GEOGRAPHIC MAPS
Killa Abdullah district is located, 1,205-2,675 meter above sea level, in the north of
Balochistan province. It is bordered with Afghanistan to the north, Pishin to the east Quetta
to the east south.

4
HISTORY, TRIBES AND LANGUAGES
Killa Abdullah is a historical town located in northern Balochistan. It was given district
status in 1993. Kakar, Achakzai, Syed and Tareen are the main tribes living in the district.
Mostly inhabitants are Pashtuns and speak Pashto.
2. DEMOGRAPHY AND POPULATION
Total population of district Killa Abdullah is 757,578 (Census PBS, 2017) as compared to
360,724 in 1998; 52.48% is male population and 47.52% is female population in 2017.
Male-female sex ratio is 110.45 and population growth rate is 3.97% per year. Urban
population of the district is 149,342 (19.71%) and rural population is 608,236 (80.29%).
Distrcit household size is 7.79, urban household size is 7.74 and rural household size is
7.80.
Table 1: Demography and Population Patterns
INDICATOR NUMBER
Total Population 757,578
-Male 397,591 (52.48%)
-Female 359,982 (47.52%)
-Urban 149,342 (19.71%)
-Rural 608,236 (80.29%)
Transgender 5
-Urban 0
-Rural 5
Sex Ratio 110.45
-Urban 111.42
-Rural 110.21
Households 97,210
-Urban 19,291
-Rural 77,919
Household size 7.79
-Urban 7.74
-Rural 7.80 Source: Census PBS, 2017

5
District Killa Abdullah’s Poverty Status
Killa Abdulla is the poorest district among eight BRDCE Programme districts in
multidimensional poverty (MP) index ranking (also poorest in Balochistan province), MPI
is based on 15 indicators of PSLM survey on education, health and standard of living
(Planning Commission, UNDP and OPHI, 2016). According to PPAF and SDPI (2016)
Killa Abdullah is ranked second poorest district in BRDCEP area, based on 27 indicators
of PSLM survey pertaining to education, health, living conditions, and assets ownership.
Table 2: Poverty Status in Killa Abdullah
Planning
Commission,
UNDP, OPHI,
2016
Multidimensional
Poverty (MP)
Index
Incidence of
Poverty (%)
Intensity of
Poverty (%)
Category of
Incidence of
Poverty
2014-15 0.641 96.9 66.2 70% and above
PPAF & SDPI,
2016
MP Population Share MP Headcount Ratio
2012-2013 0.34 85.1
3. DISTRICT ADMINISTRATION
Balochistan Local Government Ordinance (BLGO, 1980) was replaced by BLGO, 2001
with a concept of district’s Government. The district Killa Abdullah was administrated by
the single line of administration covering rural and urban parts. The earlier system worked
for two tenures, hence changed into BLGA 2010. Current Local Government Act 2010 is
similar to BLGO (1980) and works in rural urban settings separately. Local Government
Institutions of the district include Municipal Committees which is headed by the Chairman
and relevant ward members, this depends on the number of population living in the area.
District Council Chief Officer assists Chairman and members in Government set up; in the
district Government, women, workers, and minorities are represented. Administrative set
up of Local Government Administration is further explained in organogram given below:

6
Figure 1: Local Government Administration Organogram (Administrative Setup)
Union Council
Source: P&D, GoB, 2011
TEHSILS AND UNION COUNCILS
There are four Tehsils and 33 Union Councils (UCs) in Killa Abdullah district. Below given table
and map show tehsil wise listing and geographical location of UCs.
Table 3: Tehsils and Union Councils
TEHSIL UNION COUNCIL
Chaman
Boghra, Chaman, Daman Ashezai, Daman Miralzai, Eid Gah, Girdi Pinki,
Mehmood Abad, Purana Chaman, Roghani-I, Roghani-II, Sirki Talri
Dobandi Aghbarg, Jilga
Gulistan Abdul Rehmanzai, Darozai, Gulistan-I, Gulistan-II, Segi
Killa
Abdullah
Habibzai, Jani Deh, Killa Abdullah-I, Killa Abdullah-II, Maizai, Masezai,
Pir Alizai
Chairman
Local Government
Asst: Director Local Govt.
Assistant Engineer
Sub Engineer
Superintendent
Assistant
Junoir Clerk
Senior Clerk
District Council Chief Officer
Assistant
Junior Clerk
Senior Clerk
Chairman
Secretary
Allied Staff

7
Source: UNOCHA, 2017
Table 4: Federal and Provincial Government Departments in Killa Abdullah
Table 5: NGOs working in Killa Abdullah
Education Department Agriculture Department
Health Department Livestock Department
Local Government and Rural Development Social Welfare Department
Forest Department Irrigation Department
Public Health Engineering Department Population Welfare Department
National Database and Registration Authority
Balochistan Rural Support Programme
UNDP – RAHAs
MSF
ASD
WESS
PIDS
Koshan
CTC
World Health Organisation
Agha Khan Foundation
PPHI

8
4. AGRICULTURE AND HORTICULTURE
The district falls in very cold zone, with total cultivated area is 15,122 hectares, the
potential major crops are wheat, barley, fodder, onion, vegetables, melons, tobacco, cumin,
and potato. The potential fruits in the districts are apple, apricot, peach, plum grapes, and
pomegranate. Tube wells and Karezes (springs) are commonly used main sources of
irrigation for agriculture and others. Private sector dominates with key responsibility to
own and maintain tube wells and Karezes. Details of agriculture land, land ownership, and
irrigation given in tables below:
Table-6 shows land utilization statistics. Table-7 shows area irrigated by different sources of
irrigation. Table-8 shows number of household own land in rural areas. Table-9 shows number of
government & private tube-wells in the district.
Table 8: Land Utilization 2014-15 (area in hectares)
Reported
area
Cultivated area Cropped area Un-cultivated area
Total Current
fallow
Net
sown
Total Area sown
more than
once
Total Cultivable
waste
Forest
area
Area not available
for cultivation
15735 15122 5762 9360 9439 79 613 0 613 0
Source: GoB, 2014-15
Table 9: Area Irrigated by different Sources of Irrigation 2014-15 (area in hectares)
Irrigated area Canal Tube-well Well Karezes,
springs &
others Govt. Private
9222 0 0 8300 43 879
Source: GoB, 2014-15
Table 10: Member of Household Own Land in Rural Areas
Ownership Percentage
Owner 56
Landless 44
Total 100 Source: MICS, 2010
9
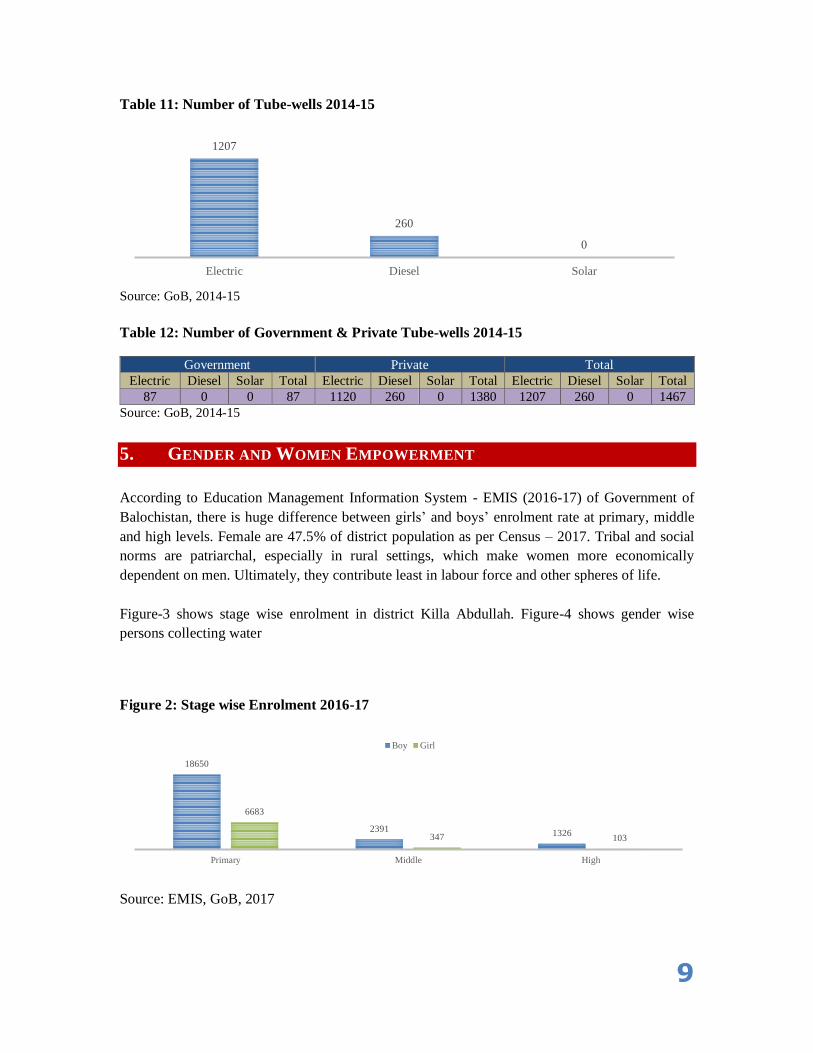
Table 11: Number of Tube-wells 2014-15
Source: GoB, 2014-15
Table 12: Number of Government & Private Tube-wells 2014-15
Government Private Total
Electric Diesel Solar Total Electric Diesel Solar Total Electric Diesel Solar Total
87 0 0 87 1120 260 0 1380 1207 260 0 1467
Source: GoB, 2014-15
5. GENDER AND WOMEN EMPOWERMENT
According to Education Management Information System - EMIS (2016-17) of Government of
Balochistan, there is huge difference between girls’ and boys’ enrolment rate at primary, middle
and high levels. Female are 47.5% of district population as per Census – 2017. Tribal and social
norms are patriarchal, especially in rural settings, which make women more economically
dependent on men. Ultimately, they contribute least in labour force and other spheres of life.
Figure-3 shows stage wise enrolment in district Killa Abdullah. Figure-4 shows gender wise
persons collecting water
Figure 2: Stage wise Enrolment 2016-17
Source: EMIS, GoB, 2017
1207
260
0
Electric Diesel Solar
18650
23911326
6683
347 103
Primary Middle High
Boy Girl

10
Figure 3: Person Collecting Water in Killa Abdullah (%)
Source: MICS, 2010
6. HEALTH AND WASH
Figure-6 shows the percentage of children immunized aged 12-23 months in rural areas of Killa
Abdullah district. Table-10 shows status of health facilities. Figure-7 shows the number of BHUs,
MCHs and TB clinics. Table-11 shows the number of health practitioners. Table-12 shows water
and sanitation indicators. Figure-8 shows drinking water sources. Table-13 shows distribution of
rural household by source of drinking water. Table-14 shows distribution of rural households by
type of toilet.
Detailed statistics related to immunization, health facilities, practitioners, and water, sanitation &
hygiene (WASH) are given in tables below:
Figure 4: Rural Children Immunized aged 12-23 months (%)
Source: PSLM, Pakistan Bureau of Statistics, 2014-15
Table 13: Health Facilities 2014-15
Public Private
Hospital 1 2
Dispensaries 9 0
RHC 6 .. Source: GoB, 2014-15
Adult woman
38%
Adult man
44%
Female child
11%
Male child
7%
18
8
11
Male Female Total

11
Figure 5: Health Facilities 2014-15
Source: GoB, 2014-15
Table 14: Number of Health Practitioners 2014-15
PRACTITIONERS NUMBER
Doctors (total) 68
-Male 55
-Female 13
Nurses (total) 13
-Male 3
-Female 10
Pharmacist 17
Drug Inspector 4
Health Education Officer 0
LHV 25
Dias/Mid Wives 51
Malaria cases (2013-14) 1016 Source: GoB, 2014-15
Table 15: Water and Sanitation Indicators (%)
Indicator 2004 2010
Use of improved water sources 40 99
Access to safe means of excreta disposal 23 96 Source: MICS, 2004 & 2010
39
2 1
BHU MCH TB Clinic

12
Figure 6: Drinking Water Sources
Source: MICS, 2010
Table 16: Distribution of Rural Household by Source of Drinking Water (%)
Tap Water 13 Hand Pump 0 Motor Pump 23 Dug Well 12 Others 51 Total 100
Source: PSLM, Pakistan Bureau of Statistics, 2014-15
Table 17: Distribution of Rural Households by Type of Toilet (%)
Flush 6
Non flush 70
No Toilet 24 Source: PSLM, Pakistan Bureau of Statistics, 2014-15
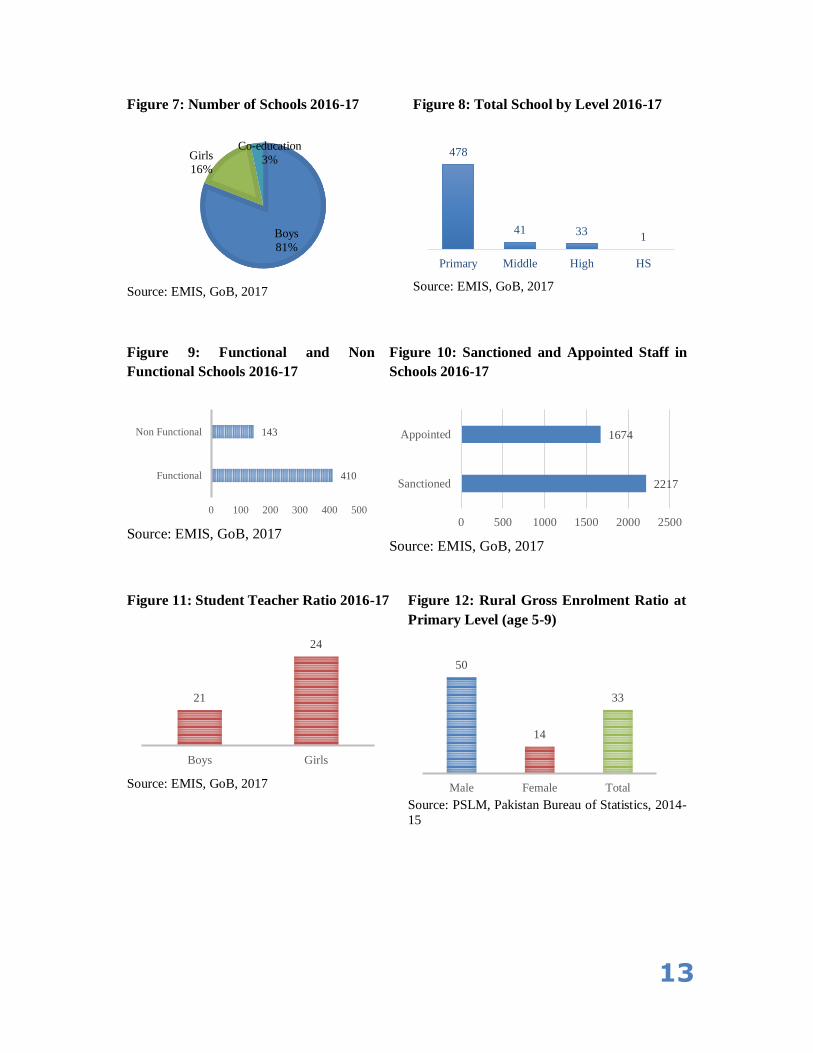
7. EDUCATION
According to recent data from GoB and EMIS sources below given figure-9 shows gender wise
number of schools in district Killa Abdullah. Figure-10 shows the total number of schools by level.
Figure-11 shows the number of functional and nonfunctional schools. Figure-12 shows the number
of sanctioned and appointed staff in Schools. Figure-13 shows student teacher ratio. Figure-14
shows available facilities in schools. Figure-15 shows rural gross enrolment ratio at primary level
(age 5-9). Figure-16 shows rural education indicators.
Pipe water
53%Tube well,
Borehole
25%
Protected well
21%
Others
1%
13
Figure 7: Number of Schools 2016-17
Source: EMIS, GoB, 2017
Figure 8: Total School by Level 2016-17
Source: EMIS, GoB, 2017
Figure 9: Functional and Non
Functional Schools 2016-17
Source: EMIS, GoB, 2017
Figure 10: Sanctioned and Appointed Staff in
Schools 2016-17
Source: EMIS, GoB, 2017
Figure 11: Student Teacher Ratio 2016-17
Source: EMIS, GoB, 2017
Figure 12: Rural Gross Enrolment Ratio at
Primary Level (age 5-9)
Source: PSLM, Pakistan Bureau of Statistics, 2014-
15
Boys
81%
Girls
16%
Co-education
3%478
41 331
Primary Middle High HS
410
143
0 100 200 300 400 500
Functional
Non Functional
2217
1674
0 500 1000 1500 2000 2500
Sanctioned
Appointed
21
24
Boys Girls
50
14
33
Male Female Total

14
Figure 13: Available Facilities in Schools 2016-17
Source: EMIS, GoB, 2017
Table 18: Rural Education Indicators (%)
Indicators Male Female Total Gross Enrolment Ratio at Primary level
(age 5-9)
50 14 33
Gross Enrolment Ratio at Primary level
(age 4-9)
56 12 35
Net Enrolment Rate at Primary level (age
6-10)
50 14 34
Net Enrolment rate at Primary level (age
5-9)
42 11 28
Net Enrolment Rate at Primary level (age
4-9)
39 9 25
Primary level Enrolment in Government
Schools a percentage of total Enrolment
82 94 84
Primary level Enrolment in Government
Schools a percentage of total Primary
Enrolment
82 94 84
Gross Enrolment Ratio at Middle level
(age 11-13)
60 9 40
Gross Enrolment Ratio at Middle level
(age 10-12)
47 7 32
Net Enrolment rate at Middle level (age
11-13)
17 5 12
Net Enrolment rate at Middle level (age
10-12)
6 3 5
Gross Enrolment Ratio at Matric level (age
14-15)
36 4 23
Gross Enrolment Ratio at Matric level (age
13-14)
34 4 23
Net Enrolment rate at Matric level (age 14-
15 )
12 0 8
Literacy-Population 10 years and older 38 5 24
532
310
110 103 117 111
193
773
Building Boundry wall Seprate teacher for kachi
Seprate room for kachi Electricity Water tank
PTSMC Water facility in toilet Natural gas

15
Adult Literacy-population 15 years and
older
33 3 19
Source: PSLM, Pakistan Bureau of Statistics, 2014-15
COMMUNITY INSTITUTIONS OF BRSP
Under BRDCEP, around 62,263 rural households in Killa Abdullah district will be mobilised and
capacitated through three-tiered federated community organisations. Community members in the
33 rural union councils of the entire district Killa Abdullah, particularly women and marginalized,
will be capacitated and assisted so that they can mobilise and form active operational and mature
organisations, from COs to VOs, then LSOs and LSOs’ networks. Following given figure shows
number of COs, VOs and LSOs formed in the district till Jun 2017.
16
BIBLIOGRAPHY
1. EMIS. (2017). Education Management Information System, Education Department,
Government of Balochistan.
2. MICS. (2010). Multiple Indicator Cluster Survey (MICS). Planning and Development
Department, Government of Balochistan.
3. PBS. (2017). Census - 2017, Pakistan Bureau of Statistics, Government of Pakistan,
Islamabad.
4. PSLM. (2014-15). Pakistan Social and Living Standards Measurement Survey
(PSLM) 2014-15. Statistics Division, Government of Pakistan, Statistics Division,
Pakistan Bureau of Statistics, Islamabad.
5. P&D. (2011). District Development Profile, Planning and Development Department
(P&D), Government of Balochistan and United Nations Children’s Fund (UNICEF).
6. P&D. (2014-15). Development Statistics of Balochistan, Bureau of Statistics,
Planning and Development Department (P&D), Government of Balochistan, Quetta.
7. UNOCHA. (2017). MapAction, United Nations Office for the Coordination of
Humanitarian Affairs (UNOCHA), MapAction Version 2, downloaded from QGIS.


![Note: This sheet is applicable for uploading the ... · RAJESH SITARAM KAKAR SITARAM KAKAR 10-A, NIDHIVAN NR HOL-INN,, UMRA [N], ATHWA LINES,, , SURAT GUJARAT INDIAINDIA Gujarat Surat](https://static.documents.pub/doc/80x56/5e5f5ef67de8a313be4065e2/note-this-sheet-is-applicable-for-uploading-the-rajesh-sitaram-kakar-sitaram.jpg)


