Page 1
District Profiles and
Election ResultsThe following section contains a district profile and election results for all 59 Legislative Assembly electoral districts.
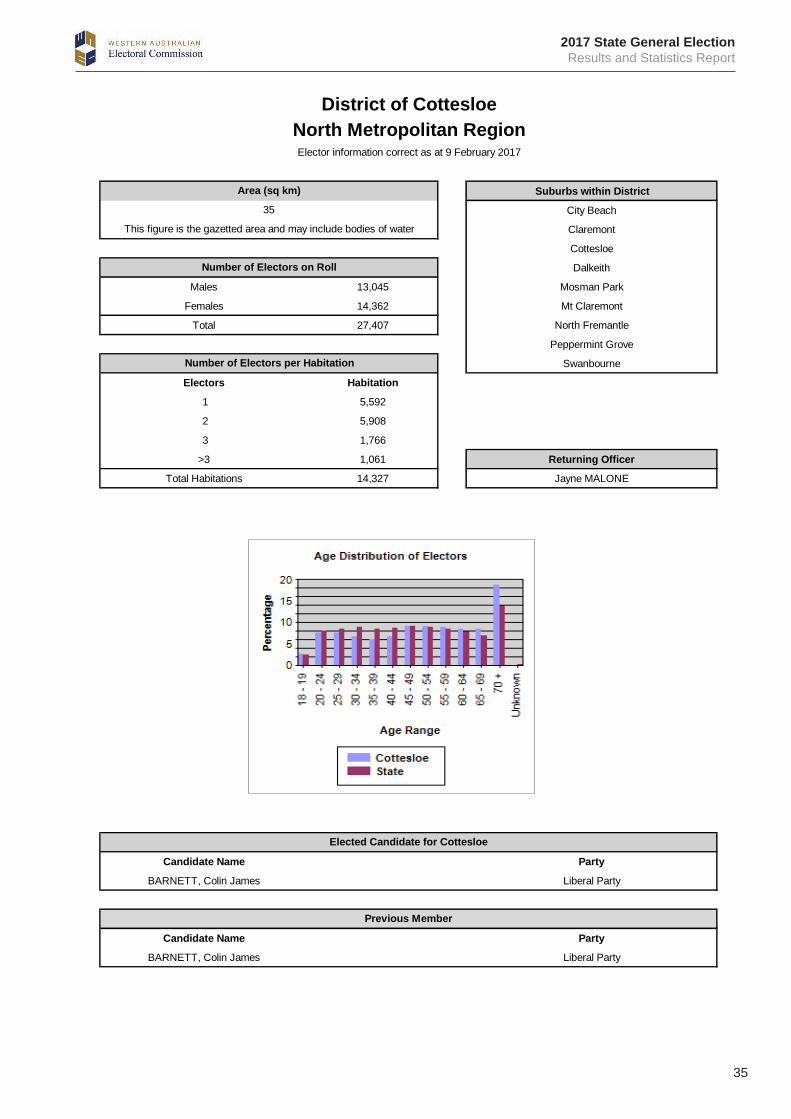
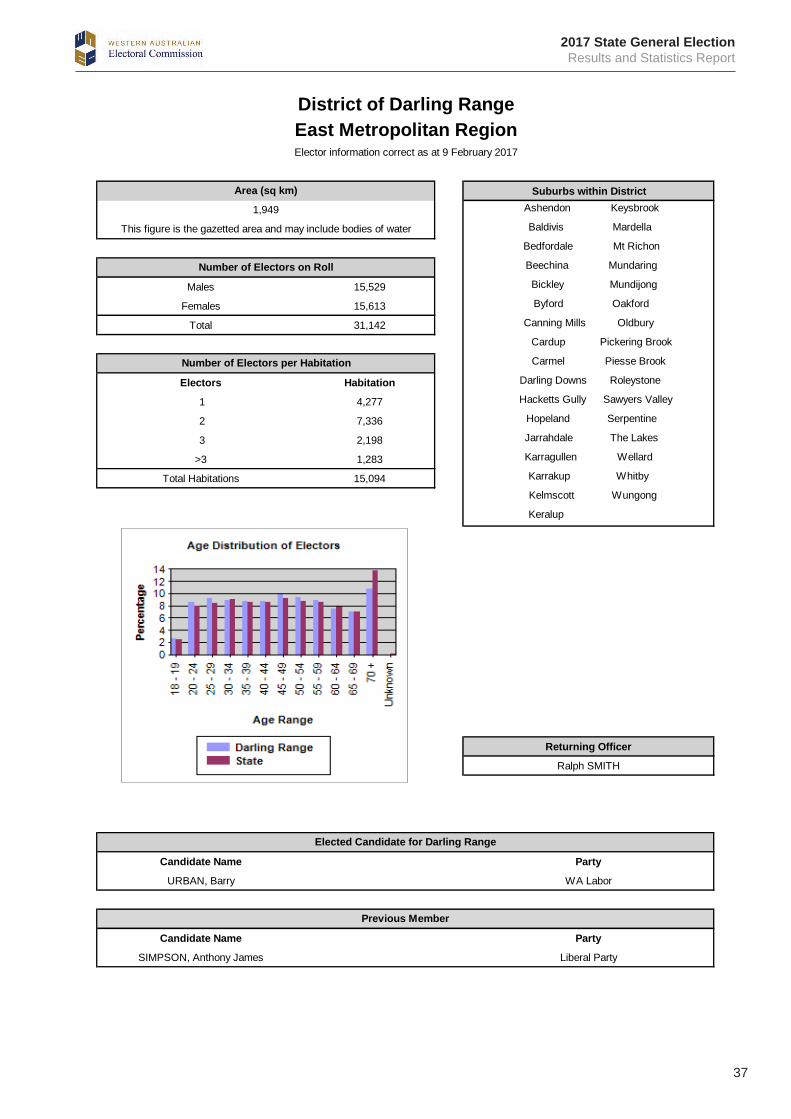
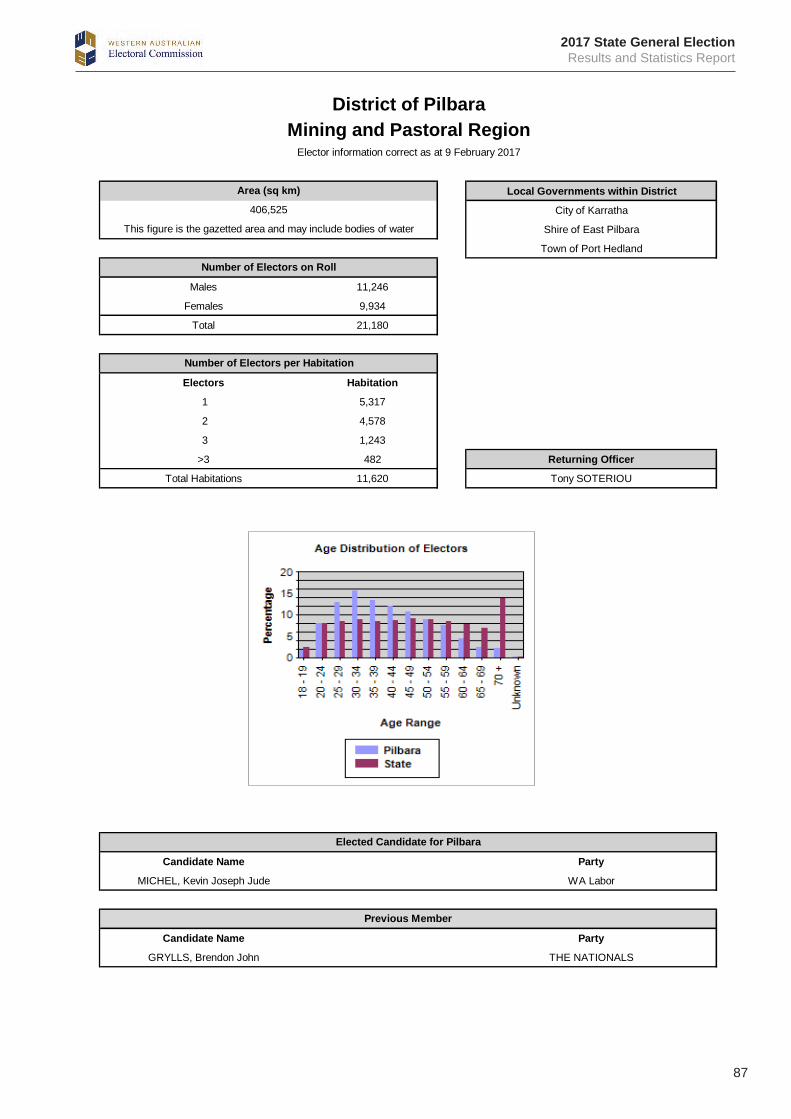
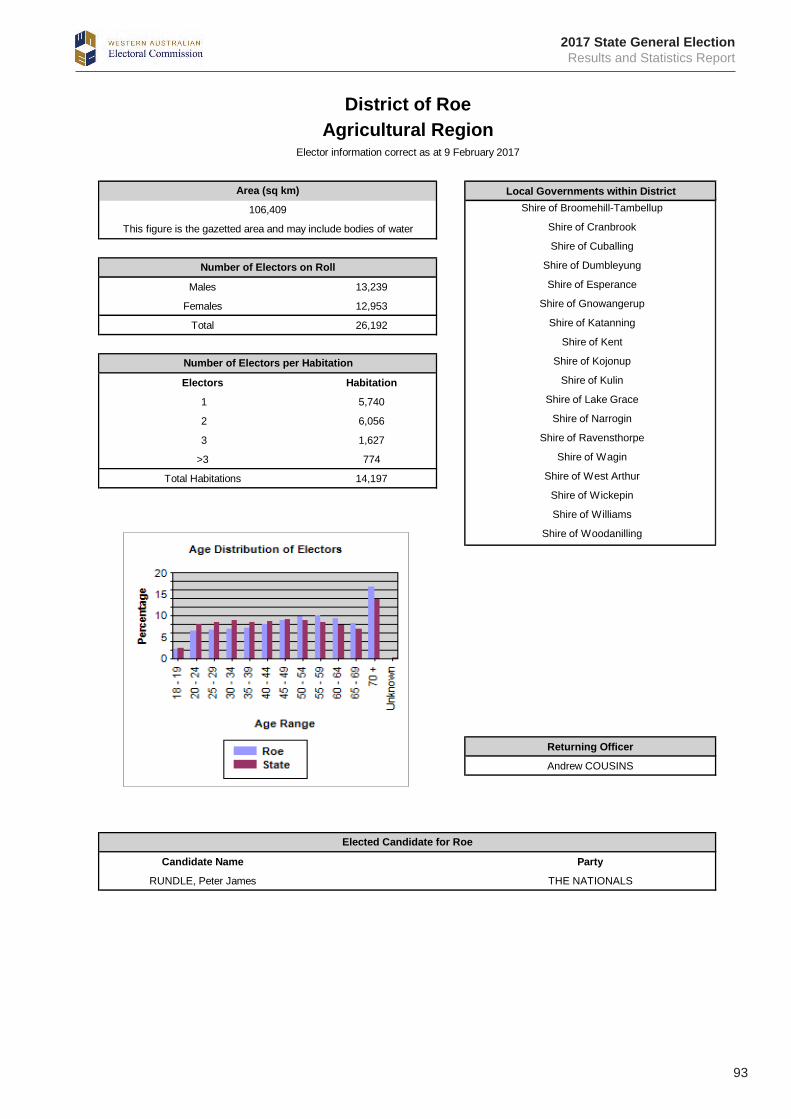
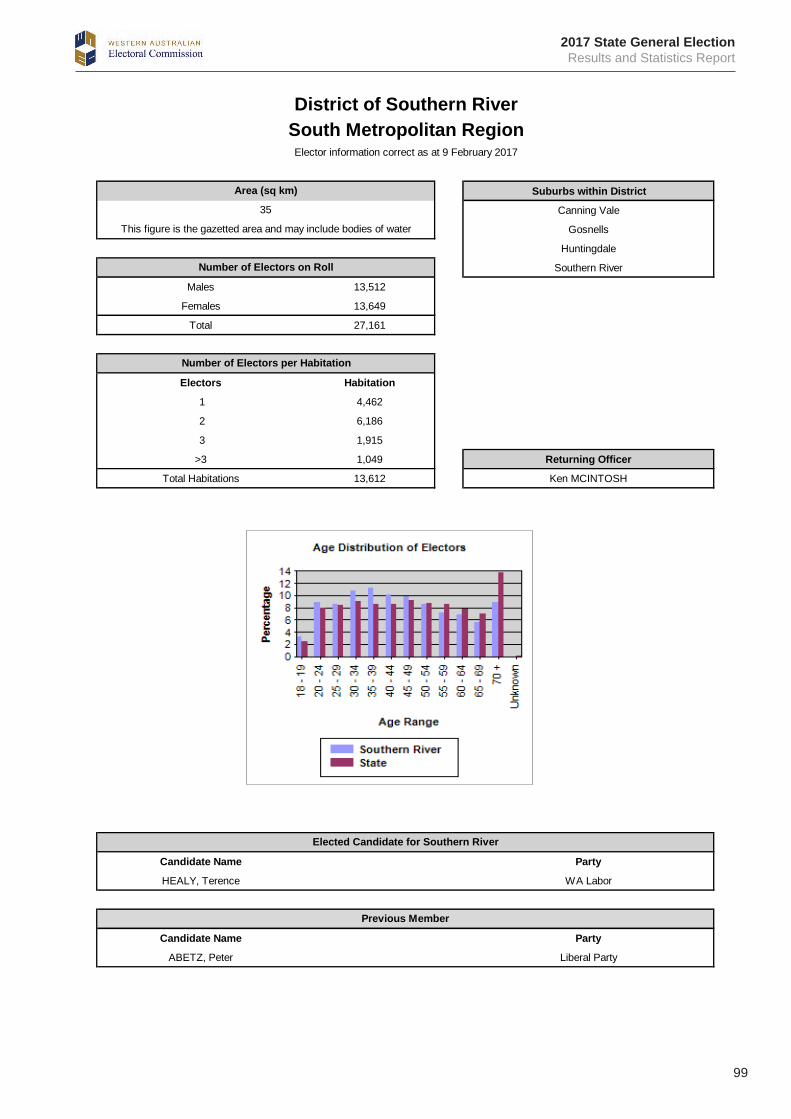
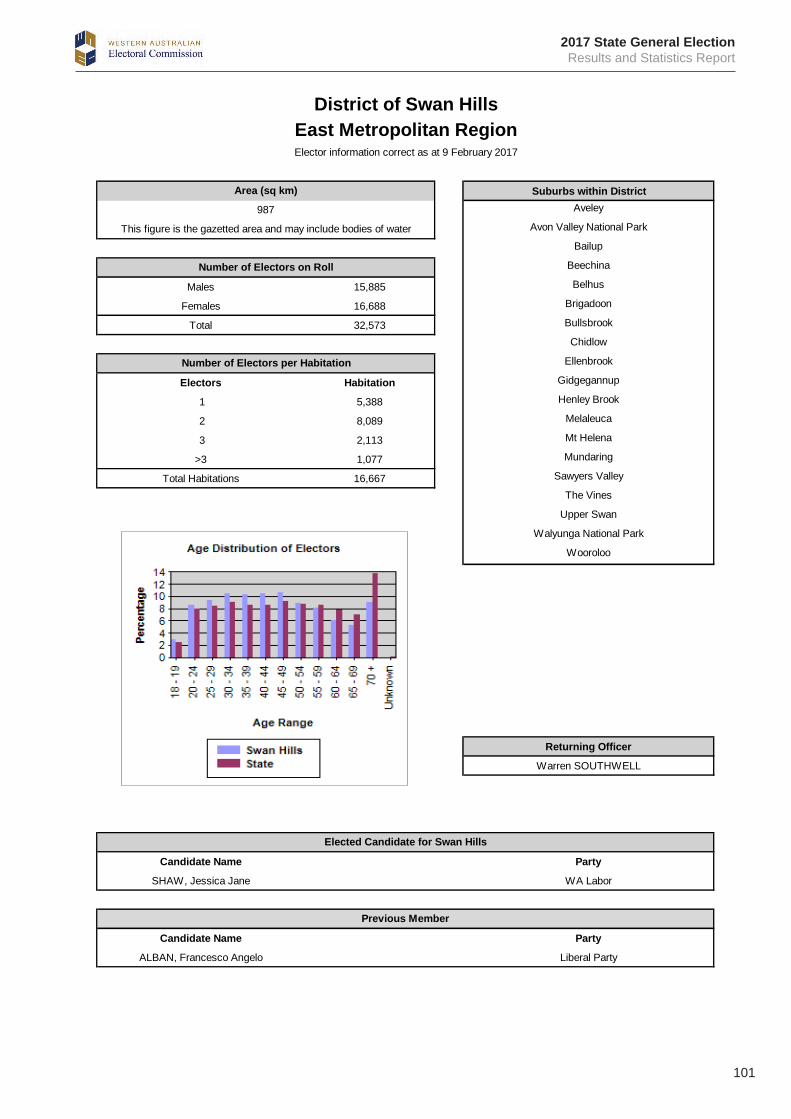
Each profile includes the following information:• area in square kilometres• suburbs or local governments within district (the list of suburbs is indicative only)• number and gender of electors as at close of roll• age break-up of electors• number of electors per habitation• name of Returning Officer• name of elected member and the previous member.
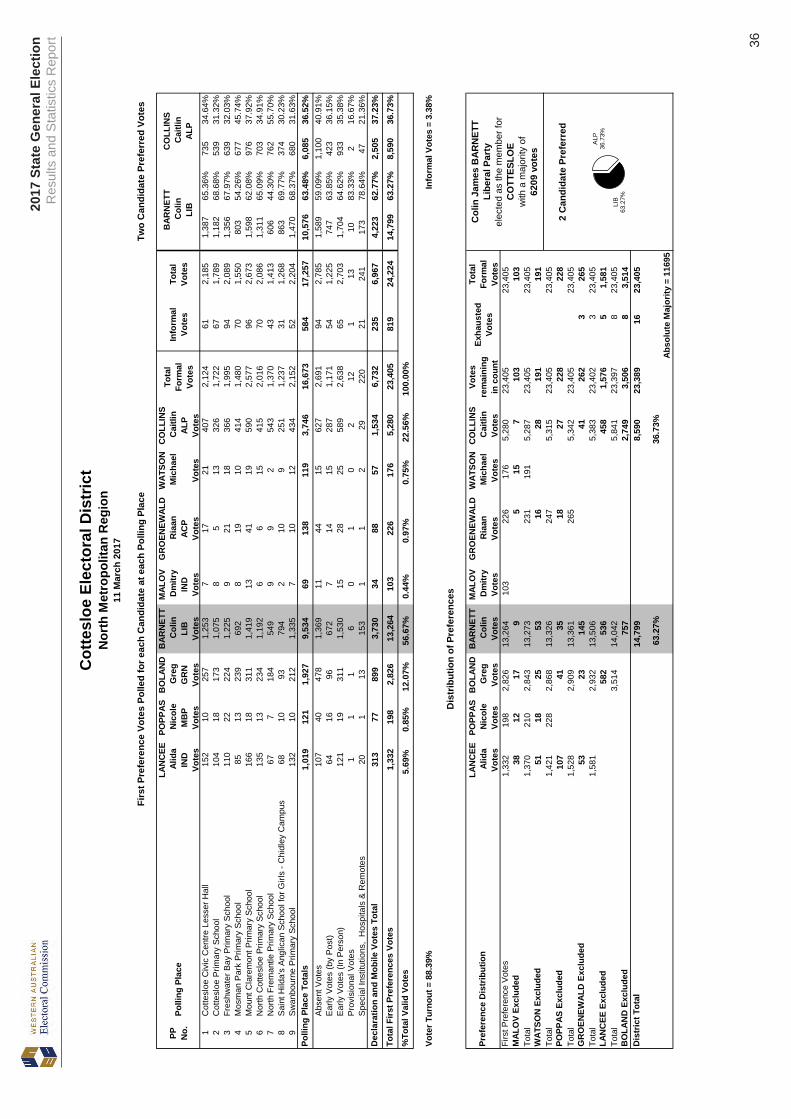
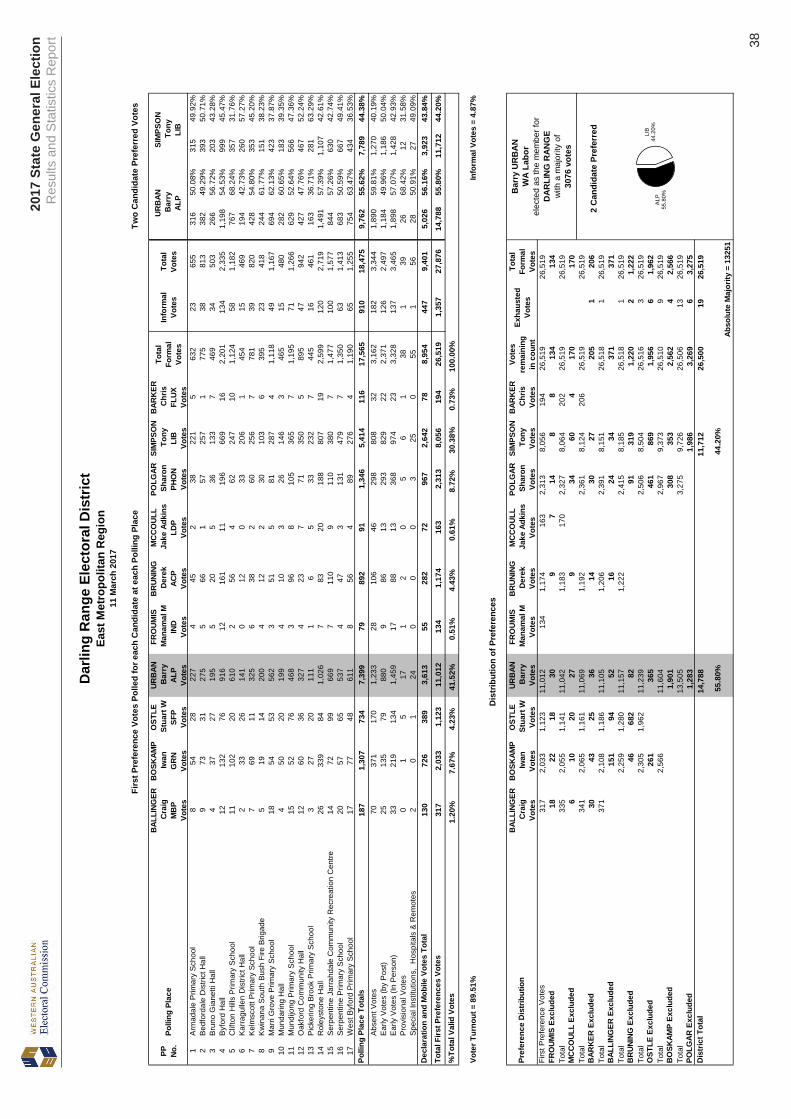
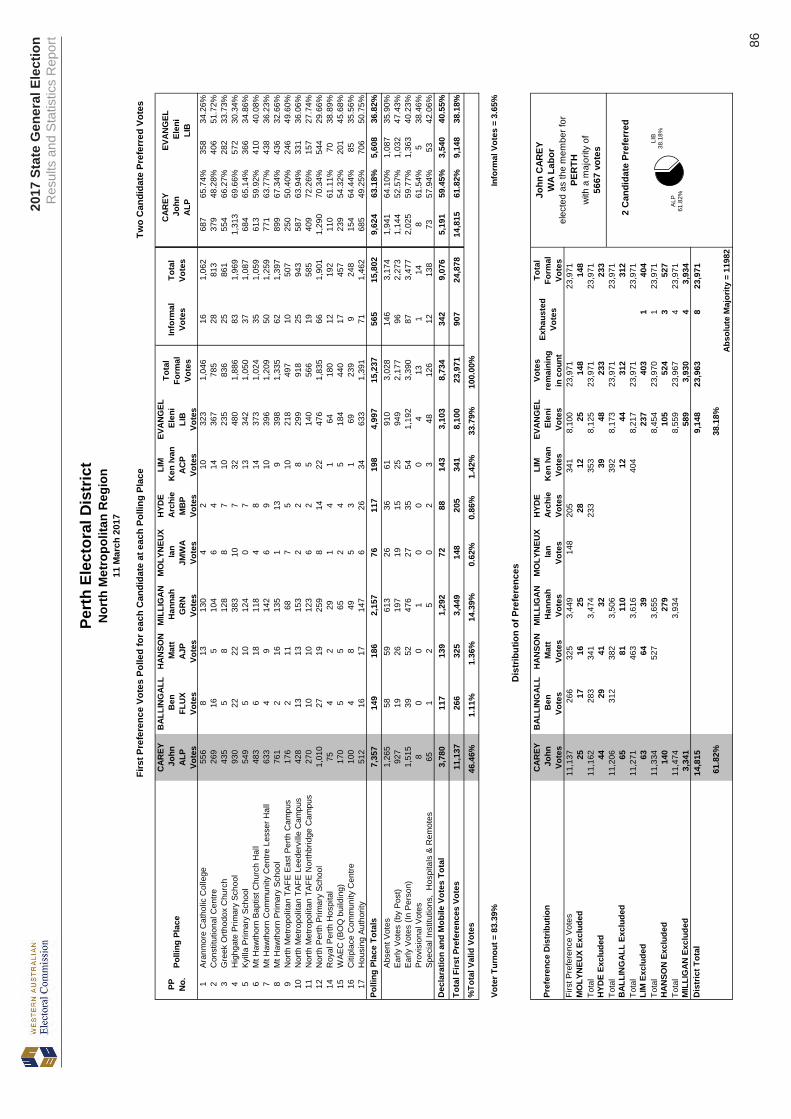
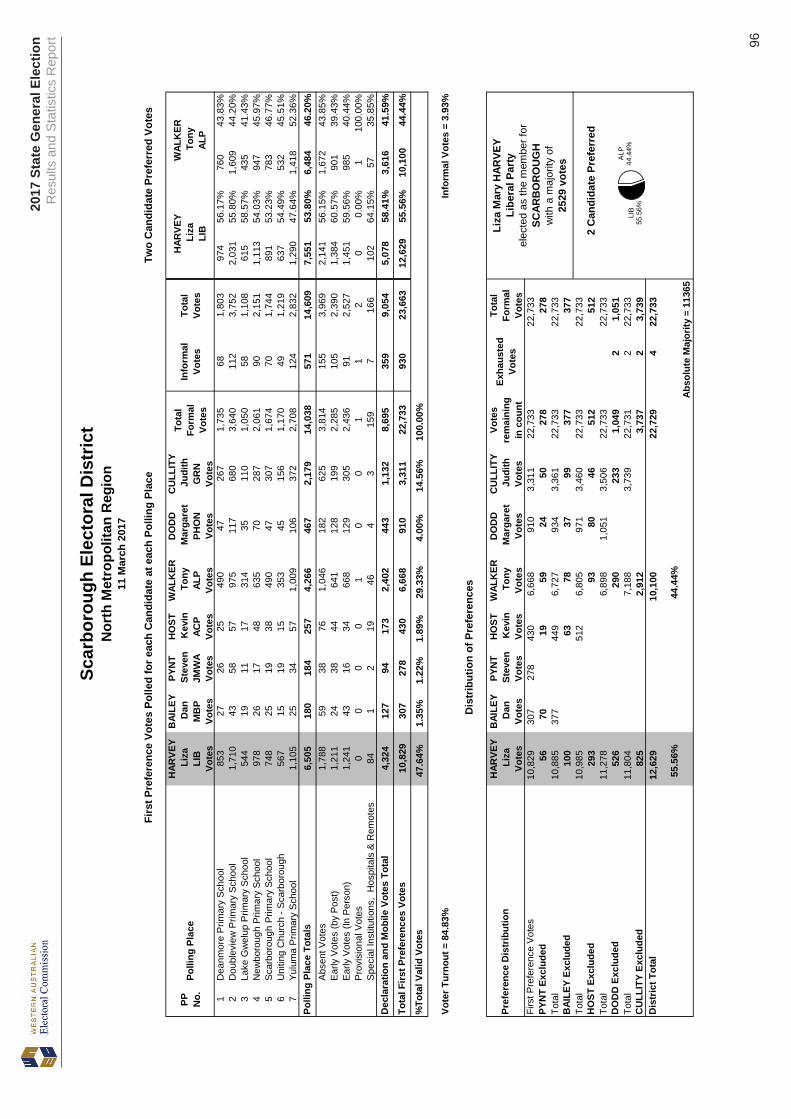
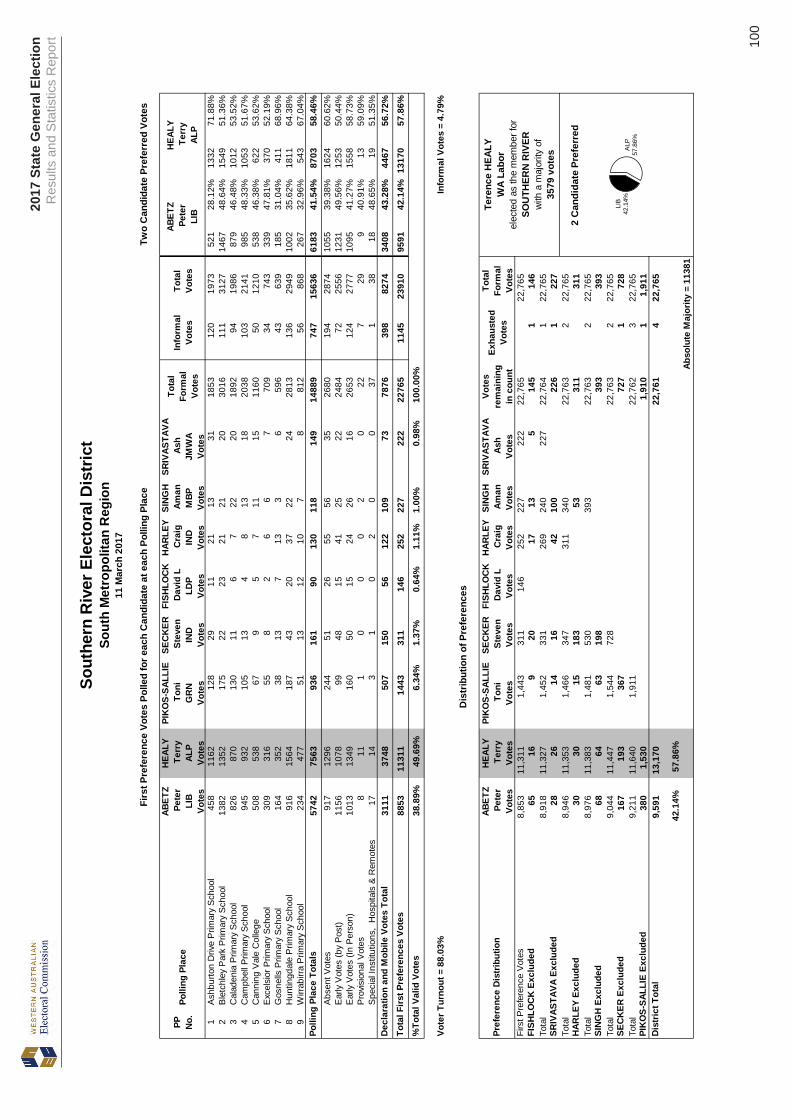
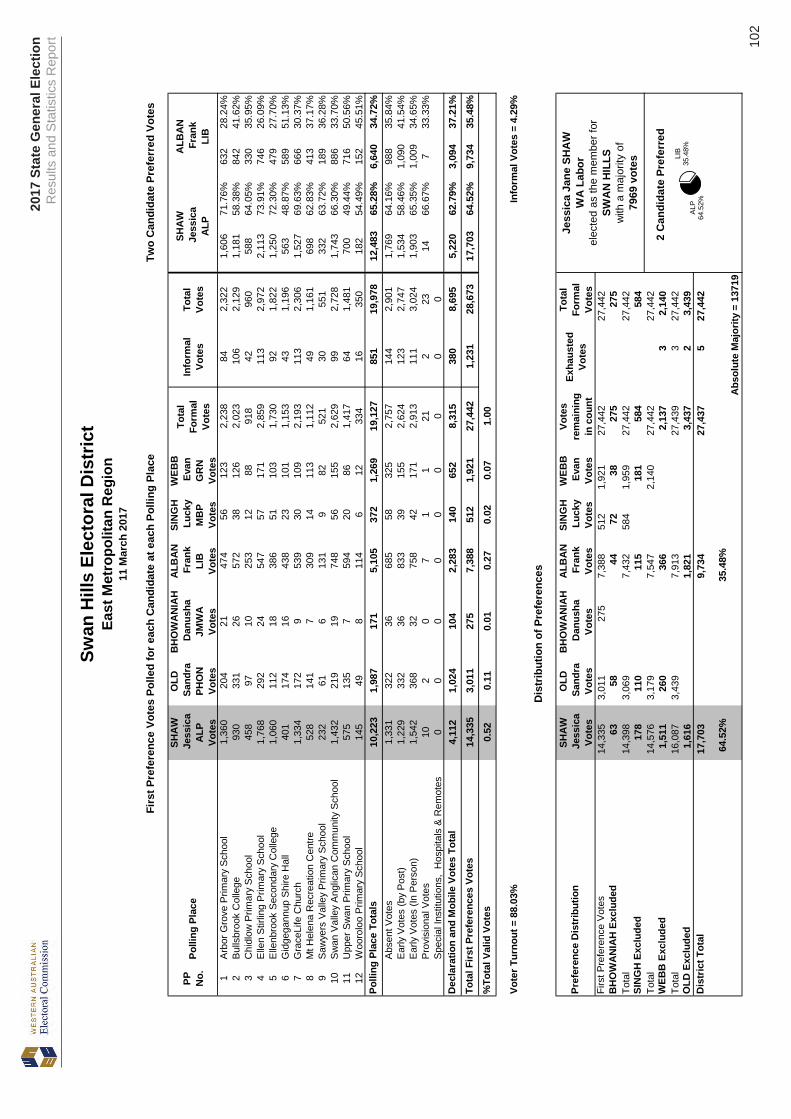
The election results show the first preference votes and the two-party preferred results at polling place level as well as the distribution of preferences at district level.
Albany – Willagee .................................................................................... 1‒118
Page 2
2017 State General ElectionResults and Statistics Report
1
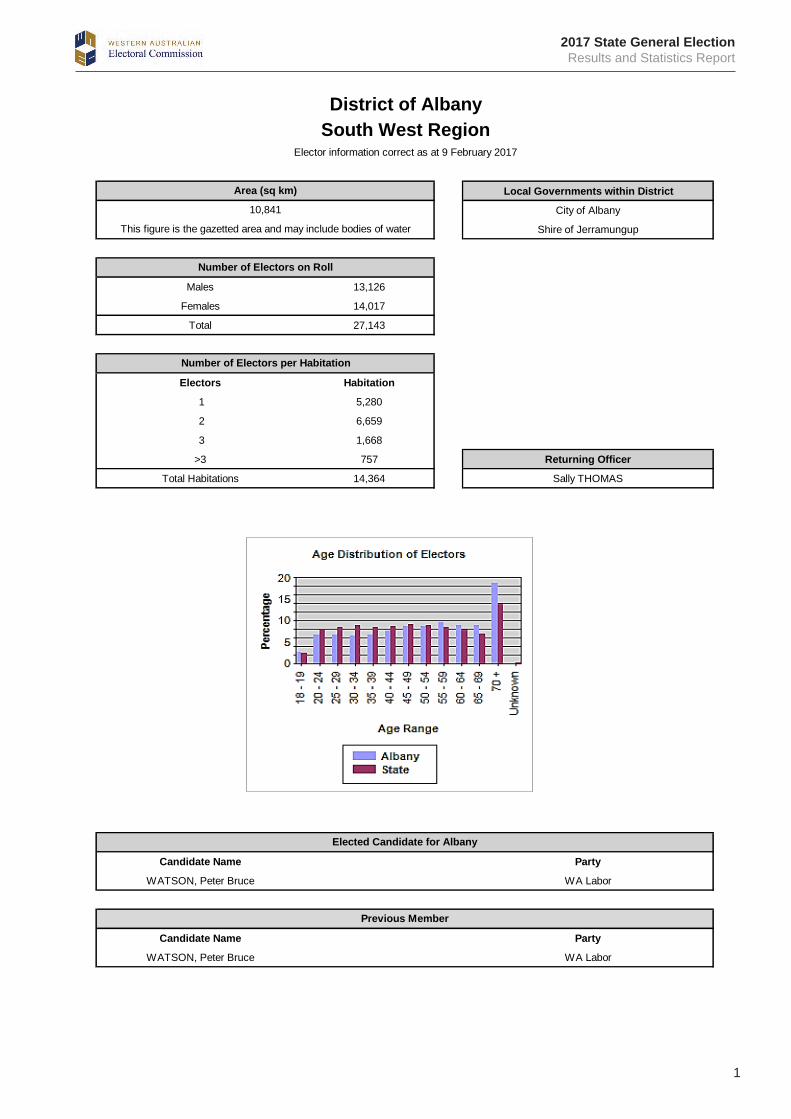
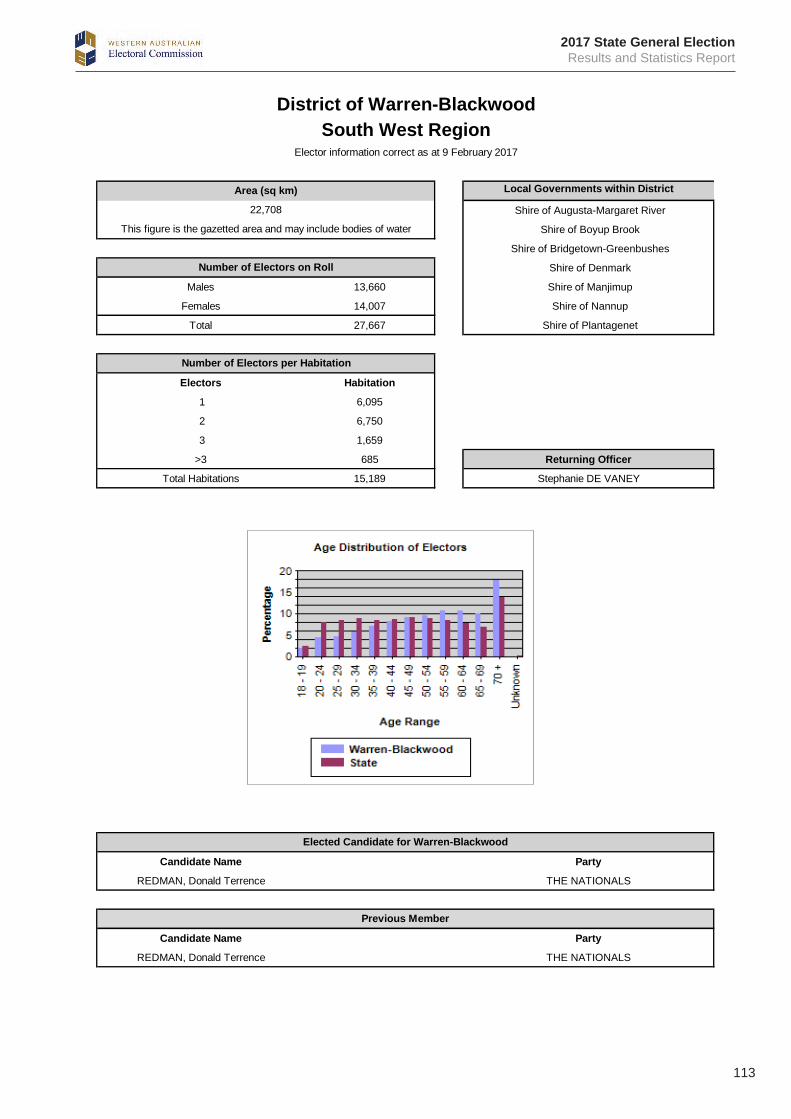
Local Governments within District
City of Albany
Shire of Jerramungup
Males 13,126
Females 14,017
Total 27,143
Electors Habitation
1 5,280
2 6,659
3 1,668
>3 757 Returning Officer
Total Habitations 14,364 Sally THOMAS
Candidate Name Party
WATSON, Peter Bruce WA Labor
Candidate Name Party
WATSON, Peter Bruce WA Labor
Number of Electors on Roll
Number of Electors per Habitation
Elected Candidate for Albany
Previous Member
District of AlbanySouth West Region
Elector information correct as at 9 February 2017
Area (sq km)
10,841
This figure is the gazetted area and may include bodies of water
Page 3
2017
Sta
te G
ener
al E
lect
ion
Res
ults
and
Sta
tistic
s R
epor
t 2
2714
3
PP No.
Polli
ng P
lace
RA
STR
ICK
Dav
idG
RN
Vote
s
't H
AR
T Ia
nA
CP
Vote
s
SUTT
ON
Rob
ert
NA
TVo
tes
WA
TSO
N P
eter
ALP
Vote
s
STO
CK
S G
reg
LIB
Vote
s
GR
IFFI
THS
Ant
hony
PHO
NVo
tes
Tota
lFo
rmal
Vote
s
Info
rmal
Vote
sTo
tal
Vote
s
1Al
bany
PC
YC58
6717
342
814
546
917
4396
037
641
.00%
541
59.0
0%2
Alba
ny P
rimar
y Sc
hool
6635
116
352
127
4874
420
764
287
38.5
8%45
761
.42%
3Al
bany
Sea
Res
cue
Hal
l25
2410
715
388
3042
718
445
144
33.7
2%28
366
.28%
4Al
bany
Sen
ior C
itize
ns C
entre
135
5923
157
120
965
1,27
026
1,29
653
942
.51%
729
57.4
9%5
Alba
ny S
urf L
ife S
avin
g C
lub
4622
108
194
136
2453
014
544
287
54.1
5%24
345
.85%
6Br
emer
Bay
Com
mun
ity R
esou
rce
Cen
tre6
271
4158
1919
79
206
144
73.1
0%53
26.9
0%7
Elle
ker H
all
3929
101
184
6622
441
1045
120
646
.71%
235
53.2
9%8
Flin
ders
Par
k Pr
imar
y Sc
hool
6359
233
538
215
731,
181
411,
222
526
44.5
4%65
555
.46%
9G
reat
Sou
ther
n G
ram
mar
4527
133
219
126
4559
522
617
304
51.0
9%29
148
.91%
10Je
rram
ungu
p D
istri
ct H
igh
Scho
ol7
572
2937
1916
913
182
125
73.9
6%44
26.0
4%11
King
Riv
er H
all
2335
121
178
105
4450
615
521
288
56.9
2%21
843
.08%
12Li
ttle
Gro
ve P
rimar
y Sc
hool
6333
191
411
160
6592
332
955
414
44.9
0%50
855
.10%
13M
t Loc
kyer
Prim
ary
Scho
ol93
100
265
803
168
125
1,55
492
1,64
657
336
.87%
981
63.1
3%14
Mt M
anyp
eaks
Prim
ary
Scho
ol3
025
2013
768
472
4058
.82%
2841
.18%
15N
apie
r Hal
l4
450
4019
1012
75
132
8062
.99%
4737
.01%
16N
orth
Alb
any
Seni
or H
igh
Scho
ol30
8012
734
191
5772
626
752
304
41.8
7%42
258
.13%
17R
edm
ond
Hal
l6
1536
4820
813
35
138
7556
.39%
5843
.61%
18Sp
ence
r Par
k Pr
imar
y Sc
hool
8382
222
669
208
931,
357
801,
437
551
40.6
0%80
659
.40%
19W
ells
tead
Com
mun
ity R
esou
rce
Cen
tre9
153
2513
1311
42
116
8271
.93%
3228
.07%
20Ya
kam
ia P
rimar
y Sc
hool
6811
325
561
017
887
1,31
152
1,36
359
345
.23%
718
54.7
7%21
Youn
gs S
idin
g H
all
639
6810
268
3134
19
350
182
53.3
7%15
946
.63%
935
801
2,75
85,
956
2,25
093
113
,631
538
14,1
696,
120
44.9
1%7,
508
55.0
9%Ab
sent
Vot
es18
155
282
529
192
101
1,34
040
1,38
056
742
.35%
772
57.6
5%Ea
rly V
otes
(by
Post
)68
5231
964
336
212
81,
572
841,
656
784
49.8
7%78
850
.13%
Early
Vot
es (I
n Pe
rson
)35
725
01,
366
3,12
11,
296
459
6,84
916
57,
014
3,03
044
.30%
3,81
055
.70%
Prov
isio
nal V
otes
11
29
00
131
143
23.0
8%10
76.9
2%Sp
ecia
l Ins
titut
ions
, H
ospi
tals
& R
emot
es5
823
9149
518
110
191
8144
.75%
100
55.2
5%61
236
61,
992
4,39
31,
899
693
9,95
530
010
,255
4,46
544
.90%
5,48
055
.10%
1,54
71,
167
4,75
010
,349
4,14
91,
624
23,5
8683
824
,424
10,5
8544
.90%
12,9
8855
.10%
6.56
%4.
95%
20.1
4%43
.88%
17.5
9%6.
89%
100.
00%
RA
STR
ICK
Dav
idVo
tes
't H
AR
T Ia
nVo
tes
SUTT
ON
Rob
ert
Vote
s
WA
TSO
N P
eter
Vote
s
STO
CK
S G
reg
Vote
s
GR
IFFI
THS
Ant
hony
Vote
s
Vote
sre
mai
ning
in c
ount
Exha
uste
dVo
tes
Tota
lFo
rmal
Vote
s1,
547
1,16
74,
750
10,3
494,
149
1,62
423
,586
23,5
8635
199
106
703
122
1,16
52
1,16
7To
tal
1,58
24,
949
10,4
554,
852
1,74
623
,584
223
,586
338
1,07
076
951,
579
31,
582
Tota
l5,
287
11,5
254,
928
1,84
123
,581
523
,586
697
475
667
1,83
92
1,84
1To
tal
5,98
412
,000
5,59
523
,579
723
,586
4,60
198
85,
589
65,
595
10,5
8512
,988
23,5
7313
23,5
86
44.9
0%55
.10%
Abs
olut
e M
ajor
ity =
117
87
Dis
tric
t Tot
al
Firs
t Pre
fere
nce
Vote
s't
HA
RT
Excl
uded
RA
STR
ICK
Exc
lude
d
GR
IFFI
THS
Excl
uded
STO
CK
S Ex
clud
ed
Tota
l Firs
t Pre
fere
nces
Vot
es%
Tota
l Val
id V
otes
SUTT
ON
Rob
ert
NA
T
WA
TSO
N P
eter
ALP
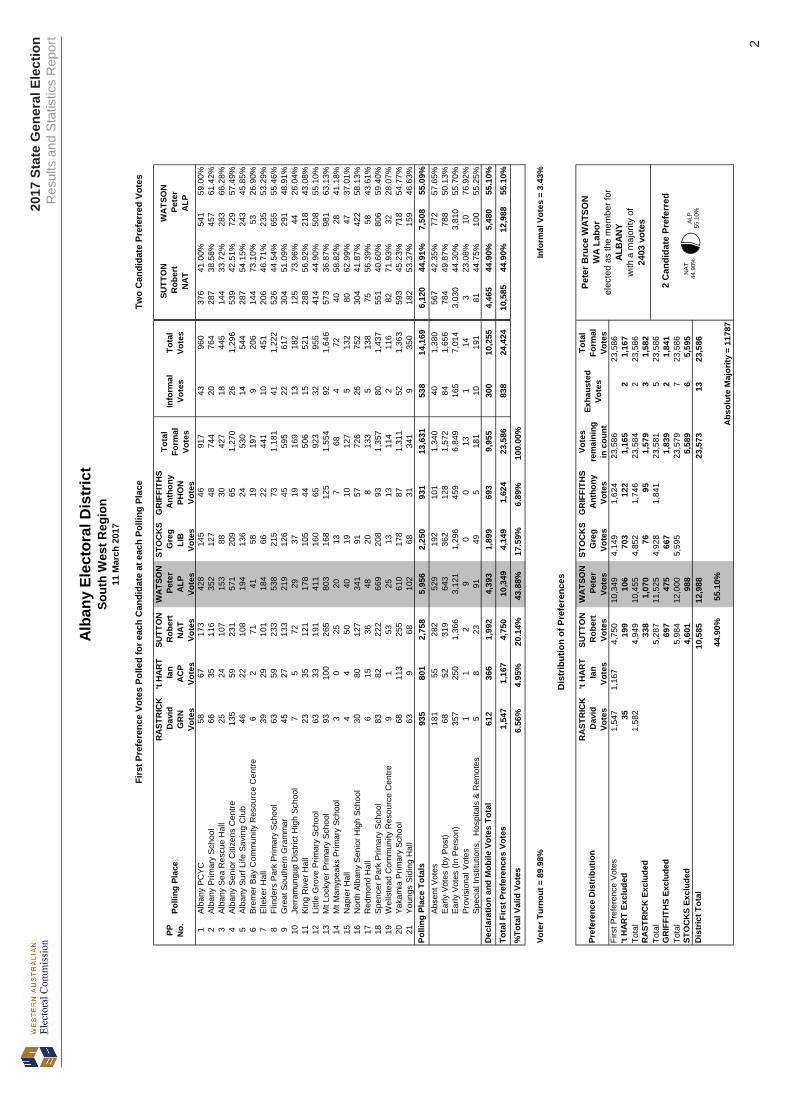
Alb
any
Elec
tora
l Dis
tric
t
11 M
arch
201
7So
uth
Wes
t Reg
ion
Two
Can
dida
te P
refe
rred
Vot
es
Pref
eren
ce D
istr
ibut
ion
Pete
r Bru
ce W
ATSO
NW
A La
bor
elec
ted
as th
e m
embe
r for
ALB
ANY
with
a m
ajor
ity o
f24
03 v
otes
Firs
t Pre
fere
nce
Vote
s Po
lled
for e
ach
Can
dida
te a
t eac
h Po
lling
Pla
ce
Vote
r Tur
nout
= 8
9.98
%In
form
al V
otes
= 3
.43%
Polli
ng P
lace
Tot
als
Dis
trib
utio
n of
Pre
fere
nces
Dec
lara
tion
and
Mob
ile V
otes
Tot
al
ALP
55
.10%
NA
T 44
.90%
2 C
andi
date
Pre
ferr
ed
Page 4
2017 State General ElectionResults and Statistics Report
3
Suburbs within District
Armadale
Brookdale
Camillo
Champion Lakes
Males 14,027 Haynes
Females 14,296 Hilbert
Total 28,323 Kelmscott
Mt Nasura
Mt Richon
Electors Habitation Seville Grove
1 6,843 Wungong
2 6,366
3 1,751
>3 798 Returning Officer
Total Habitations 15,758 Neil WHITELEY
Candidate Name Party
BUTI, Antonio De Paulo WA Labor
Candidate Name Party
BUTI, Antonio De Paulo WA Labor
District of ArmadaleEast Metropolitan Region
Elector information correct as at 9 February 2017
Elected Candidate for Armadale
Previous Member
This figure is the gazetted area and may include bodies of water
Number of Electors on Roll
Number of Electors per Habitation
Area (sq km)
47
Page 5
2017
Sta
te G
ener
al E
lect
ion
Res
ults
and
Sta
tistic
s R
epor
t 4
2832
3
PP No.
Polli
ng P
lace
BU
TI T
ony
ALP
Vote
s
JEFF
ERY
Wen
dyLI
BVo
tes
FLAH
ERTY
Edw
ard
MB
PVo
tes
NAI
DU
Nita
sha
ACP
Vote
s
PYLE
Ant
hony
GR
NVo
tes
HU
YNH
Cam
eron
IND
Vote
s
Tota
lFo
rmal
Vote
s
Info
rmal
Vote
sTo
tal
Vote
s
1Ar
mad
ale
Prim
ary
Scho
ol77
330
215
8890
241,
292
641,
356
889
68.8
6%40
231
.14%
2C
ecil
Andr
ews
Seni
or H
igh
Scho
ol1,
586
379
2715
013
765
2,34
414
42,
488
1,78
376
.10%
560
23.9
0%3
Cha
llis P
rimar
y Sc
hool
1,46
125
623
151
137
442,
072
115
2,18
71,
636
78.9
6%43
621
.04%
4Fr
ee R
efor
med
Chu
rch
502
9212
199
4817
870
5292
257
566
.09%
295
33.9
1%6
Gro
vela
nds
Prim
ary
Scho
ol98
820
420
5368
341,
367
114
1,48
11,
085
79.3
7%28
220
.63%
7G
wyn
ne P
ark
Prim
ary
Scho
ol1,
301
288
2411
914
261
1,93
512
52,
060
1,47
276
.07%
463
23.9
3%8
Kelm
scot
t Prim
ary
Scho
ol44
516
96
5565
1175
146
797
519
69.1
1%23
230
.89%
9Ke
lmsc
ott S
enio
r Hig
h Sc
hool
984
229
1476
8928
1,42
084
1,50
41,
089
76.7
4%33
023
.26%
10Ki
ngsl
ey P
rimar
y Sc
hool
624
142
1070
5619
921
5897
970
276
.30%
218
23.7
0%11
Wes
tfiel
d Pa
rk P
rimar
y Sc
hool
785
179
1577
6031
1,14
767
1,21
487
075
.85%
277
24.1
5%12
Arm
adal
e Se
nior
Hig
h Sc
hool
292
917
2727
645
034
484
330
73.3
3%12
026
.67%
9,74
12,
331
173
1,06
591
934
014
,569
903
15,4
7210
,950
75.1
8%3,
615
24.8
2%Ab
sent
Vot
es1,
212
332
3411
623
069
1,99
312
92,
122
1,47
874
.20%
514
25.8
0%Ea
rly V
otes
(by
Post
)1,
079
374
1872
7338
1,65
482
1,73
61,
194
72.1
9%46
027
.81%
Early
Vot
es (I
n Pe
rson
)2,
944
750
4419
023
110
74,
266
203
4,46
93,
266
76.5
9%99
823
.41%
Prov
isio
nal V
otes
273
01
00
311
3228
90.3
2%3
9.68
%Sp
ecia
l Ins
titut
ions
, H
ospi
tals
& R
emot
es88
240
43
212
17
128
9276
.03%
2923
.97%
5,35
01,
483
9638
353
721
68,
065
422
8,48
76,
058
75.1
4%2,
004
24.8
6%
15,0
913,
814
269
1,44
81,
456
556
22,6
341,
325
23,9
5917
,008
75.1
7%5,
619
24.8
3%
66.6
7%16
.85%
1.19
%6.
40%
6.43
%2.
46%
100.
00%
BU
TI T
ony
Vote
s
JEFF
ERY
Wen
dyVo
tes
FLAH
ERTY
Edw
ard
Vote
s
NAI
DU
Nita
sha
Vote
s
PYLE
Ant
hony
Vote
s
HU
YNH
Cam
eron
Vote
s
Vote
sre
mai
ning
in c
ount
Exha
uste
dVo
tes
Tota
lFo
rmal
Vote
s15
,091
3,81
426
91,
448
1,45
655
622
,634
22,6
3449
4850
4181
269
269
Tota
l15
,140
3,86
21,
498
1,49
763
722
,634
22,6
3417
372
183
207
635
263
7To
tal
15,3
133,
934
1,68
11,
704
22,6
322
22,6
3426
31,
187
228
1,67
83
1,68
1To
tal
15,5
765,
121
1,93
222
,629
522
,634
1,43
249
81,
930
21,
932
17,0
085,
619
22,6
277
22,6
34
75.1
7%24
.83%
Abso
lute
Maj
ority
= 1
1314
Dis
tric
t Tot
al
Firs
t Pre
fere
nce
Vote
sFL
AHER
TY E
xclu
ded
HU
YNH
Exc
lude
d
NAI
DU
Exc
lude
d
PYLE
Exc
lude
d
Tota
l Firs
t Pre
fere
nces
Vot
es
%To
tal V
alid
Vot
es
BU
TI T
ony
ALP
JEFF
ERY
Wen
dyLI
B
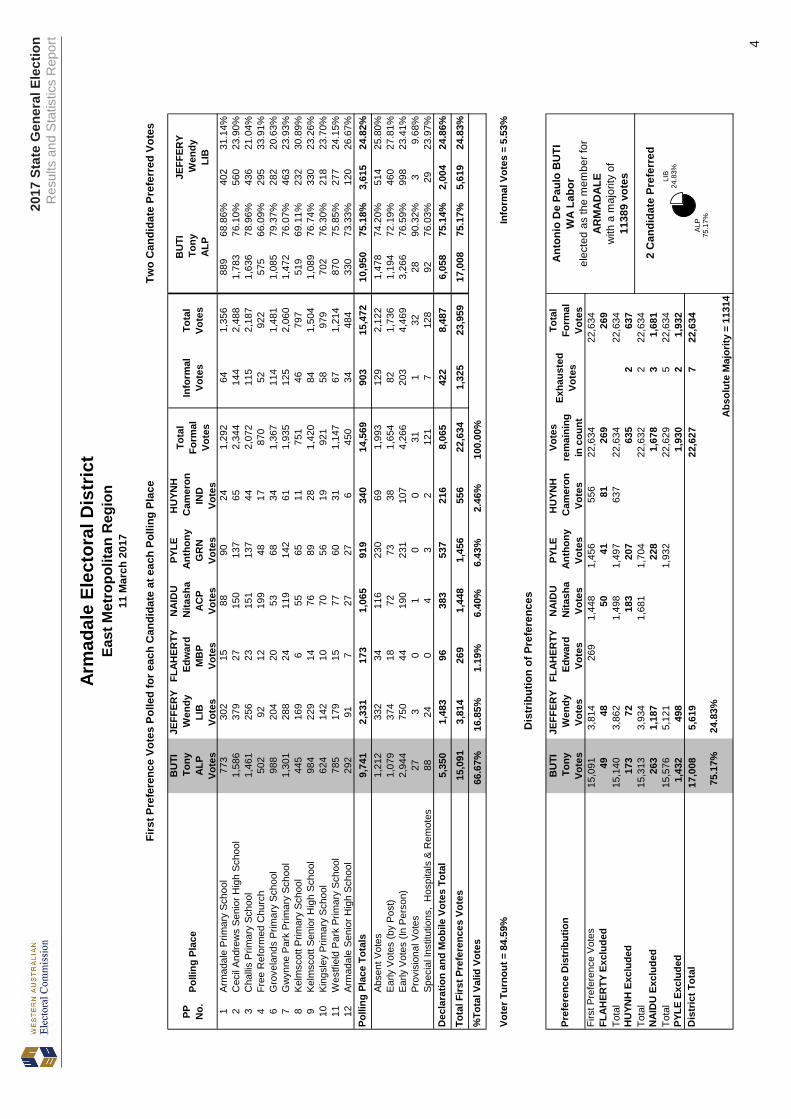
Arm
adal
e El
ecto
ral D
istr
ict
11 M
arch
201
7Ea
st M
etro
polit
an R
egio
n
Two
Can
dida
te P
refe
rred
Vot
es
Pref
eren
ce D
istr
ibut
ion
Ant
onio
De
Paul
o B
UTI
WA
Lab
orel
ecte
d as
the
mem
ber f
orA
RM
AD
ALE
with
a m
ajor
ity o
f11
389
vote
s
Firs
t Pre
fere
nce
Vote
s Po
lled
for e
ach
Can
dida
te a
t eac
h Po
lling
Pla
ce
Vote
r Tur
nout
= 8
4.59
%In
form
al V
otes
= 5
.53%
Polli
ng P
lace
Tot
als
Dis
trib
utio
n of
Pre
fere
nces
Dec
lara
tion
and
Mob
ile V
otes
Tot
al
LIB
24
.83%
ALP
75
.17%
2 C
andi
date
Pre
ferr
ed
Page 6
2017 State General ElectionResults and Statistics Report
5
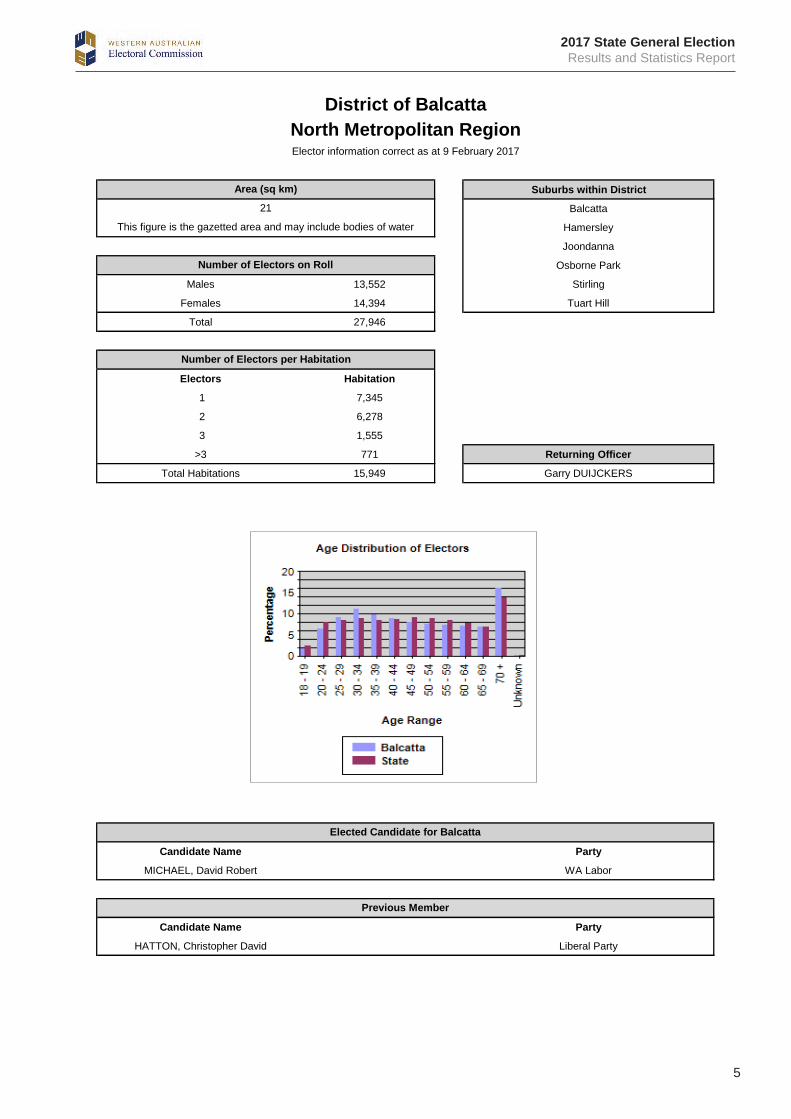
Suburbs within District
Balcatta
Hamersley
Joondanna
Osborne Park
Males 13,552 Stirling
Females 14,394 Tuart Hill
Total 27,946
Electors Habitation
1 7,345
2 6,278
3 1,555
>3 771 Returning Officer
Total Habitations 15,949 Garry DUIJCKERS
Candidate Name Party
MICHAEL, David Robert WA Labor
Candidate Name Party
HATTON, Christopher David Liberal Party
Number of Electors on Roll
Number of Electors per Habitation
Elected Candidate for Balcatta
Previous Member
District of BalcattaNorth Metropolitan RegionElector information correct as at 9 February 2017
Area (sq km)
21
This figure is the gazetted area and may include bodies of water
Page 7
2017
Sta
te G
ener
al E
lect
ion
Res
ults
and
Sta
tistic
s R
epor
t 6
2794
6
PP No.
Polli
ng P
lace
McE
NC
RO
E K
eith
Joh
nAC
PVo
tes
HAT
TON
Chr
isLI
BVo
tes
TAIT
Ric
hard
LDP
Vote
s
MIC
HAE
L D
avid
ALP
Vote
s
NAS
TESK
I M
ileM
BP
Vote
s
HAR
VEY
Nic
ole
GR
NVo
tes
Tota
lFo
rmal
Vote
s
Info
rmal
Vote
sTo
tal
Vote
s
1B
alca
tta P
rimar
y S
choo
l68
736
161,
004
3617
92,
039
185
2,22
485
041
.69%
1,18
958
.31%
2B
alca
tta S
enio
r Hig
h S
choo
l72
961
141,
042
6413
82,
291
188
2,47
91,
072
46.8
1%1,
218
53.1
9%3
Eas
t Ham
ersl
ey P
rimar
y S
choo
l27
324
1036
217
9183
145
876
366
44.0
4%46
555
.96%
4G
lend
ale
Prim
ary
Sch
ool
4455
622
596
3717
31,
428
641,
492
641
44.8
9%78
755
.11%
5O
sbor
ne P
ark
Com
mun
ity C
entre
3941
311
604
2215
21,
241
871,
328
485
39.0
8%75
660
.92%
6O
sbor
ne P
ark
Hos
pita
l24
422
939
022
8495
147
998
466
49.0
5%48
450
.95%
7O
sbor
ne P
rimar
y S
choo
l64
750
2478
740
226
1,89
111
62,
007
876
46.3
2%1,
015
53.6
8%8
St D
enis
Sch
ool
4256
816
587
2522
91,
467
831,
550
652
44.4
4%81
555
.56%
9Ta
kari
Prim
ary
Sch
ool
4574
615
860
6613
01,
862
127
1,98
983
244
.68%
1,03
055
.32%
10Tu
art H
ill P
rimar
y S
choo
l44
506
1680
036
250
1,65
298
1,75
060
336
.52%
1,04
863
.48%
469
5,98
215
37,
032
365
1,65
215
,653
1,04
016
,693
6,84
343
.73%
8,80
756
.27%
Abs
ent V
otes
110
839
391,
020
7141
12,
490
137
2,62
71,
049
42.1
6%1,
439
57.8
4%E
arly
Vot
es (b
y P
ost)
8193
726
946
5216
02,
202
136
2,33
81,
058
48.0
5%1,
144
51.9
5%E
arly
Vot
es (I
n P
erso
n)78
1,06
431
1,21
256
277
2,71
810
02,
818
1,21
944
.87%
1,49
855
.13%
Pro
visi
onal
Vot
es0
20
110
215
116
213
.33%
1386
.67%
Spe
cial
Inst
itutio
ns,
Hos
pita
ls &
Rem
otes
1161
344
06
125
1213
776
60.8
0%49
39.2
0%28
02,
903
993,
233
179
856
7,55
038
67,
936
3,40
445
.10%
4,14
354
.90%
749
8,88
525
210
,265
544
2,50
823
,203
1,42
624
,629
10,2
4744
.17%
12,9
5055
.83%
3.23
%38
.29%
1.09
%44
.24%
2.34
%10
.81%
100.
00%
McE
NC
RO
E K
eith
Joh
nVo
tes
HAT
TON
Chr
isVo
tes
TAIT
Ric
hard
Vote
s
MIC
HAE
L D
avid
Vote
s
NAS
TESK
I M
ileVo
tes
HAR
VEY
Nic
ole
Vote
s
Vote
sre
mai
ning
in c
ount
Exha
uste
dVo
tes
Tota
lFo
rmal
Vote
s74
98,
885
252
10,2
6554
42,
508
23,2
0323
,203
3011
546
3228
251
125
2To
tal
779
9,00
010
,311
576
2,53
623
,202
123
,203
121
129
177
149
576
576
Tota
l90
09,
129
10,4
882,
685
23,2
021
23,2
0359
118
512
389
91
900
Tota
l9,
720
10,6
732,
808
23,2
012
23,2
0352
72,
277
2,80
44
2,80
810
,247
12,9
5023
,197
623
,203
44.1
7%55
.83%
Abso
lute
Maj
ority
= 1
1599
Dis
tric
t Tot
al
Firs
t Pre
fere
nce
Vot
esTA
IT E
xclu
ded
NAS
TESK
I Exc
lude
d
McE
NC
RO
E Ex
clud
ed
HAR
VEY
Excl
uded
Tota
l Firs
t Pre
fere
nces
Vot
es
%To
tal V
alid
Vot
es
HAT
TON
Chr
isLI
B
MIC
HAE
L D
avid
ALP
Bal
catta
Ele
ctor
al D
istr
ict
11 M
arch
201
7N
orth
Met
ropo
litan
Reg
ion
Two
Can
dida
te P
refe
rred
Vot
es
Pref
eren
ce D
istr
ibut
ion
Dav
id R
ober
t MIC
HAE
LW
A La
bor
elec
ted
as th
e m
embe
r for
BAL
CAT
TAw
ith a
maj
ority
of
2703
vot
es
Firs
t Pre
fere
nce
Vote
s Po
lled
for e
ach
Can
dida
te a
t eac
h Po
lling
Pla
ce
Vote
r Tur
nout
= 8
8.13
%In
form
al V
otes
= 5
.79%
Polli
ng P
lace
Tot
als
Dis
trib
utio
n of
Pre
fere
nces
Dec
lara
tion
and
Mob
ile V
otes
Tot
al
ALP
55
.83%
LIB
44
.17%
2 C
andi
date
Pre
ferr
ed
Page 8
2017 State General ElectionResults and Statistics Report
7
Suburbs within District
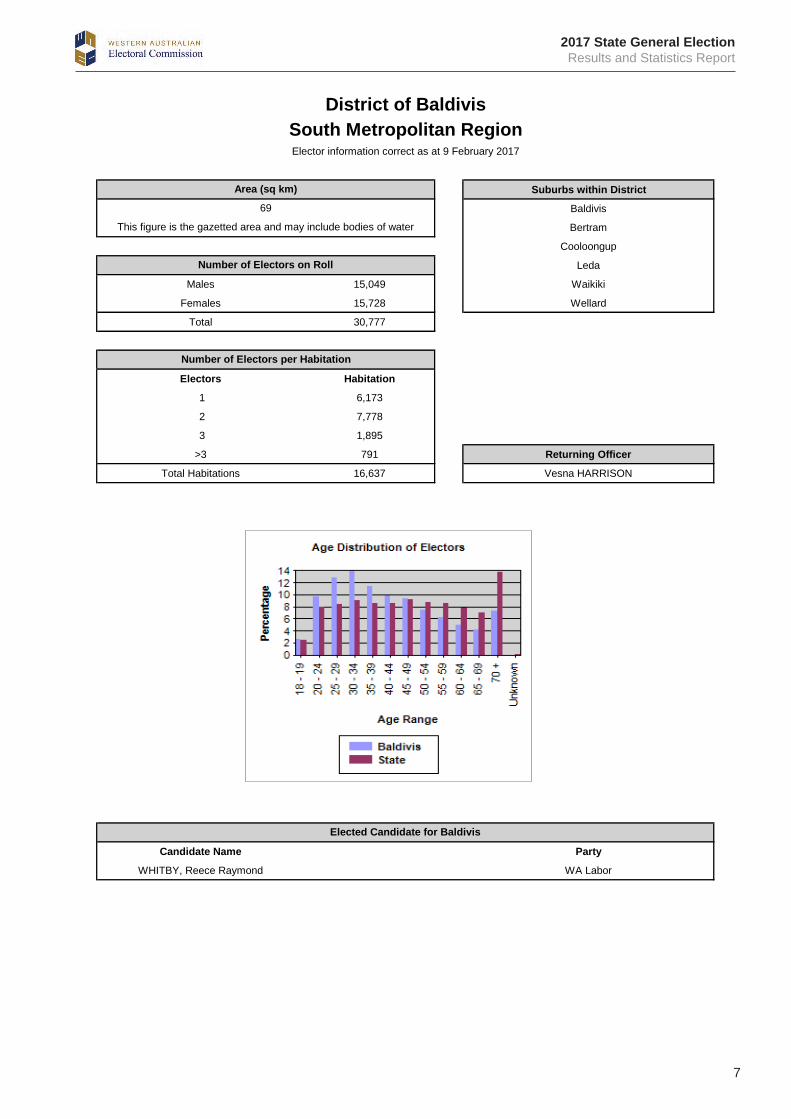
Baldivis
Bertram
Cooloongup
Leda
Males 15,049 Waikiki
Females 15,728 Wellard
Total 30,777
Electors Habitation
1 6,173
2 7,778
3 1,895
>3 791 Returning Officer
Total Habitations 16,637 Vesna HARRISON
Candidate Name Party
WHITBY, Reece Raymond WA Labor
Number of Electors on Roll
Number of Electors per Habitation
Elected Candidate for Baldivis
District of BaldivisSouth Metropolitan RegionElector information correct as at 9 February 2017
Area (sq km)
69
This figure is the gazetted area and may include bodies of water
Page 9
2017
Sta
te G
ener
al E
lect
ion
Res
ults
and
Sta
tistic
s R
epor
t 8
3077
7
PP No.
Polli
ng P
lace
GEO
RG
E M
alco
lmLI
BVo
tes
SUM
MER
S K
ath
IND
Vote
s
FEG
EBA
NK
Chr
istin
eG
RN
Vote
s
WH
ITFI
ELD
Mat
tIN
DVo
tes
ZUR
AK
OW
SKI
Joh
n C
arl
PHO
NVo
tes
WH
ITB
Y R
eece
ALP
Vote
s
HO
LMES
Yve
tteA
CP
Vote
s
MA
KK
AR
Pra
bhpr
eet S
ingh
MB
PVo
tes
HA
MER
SLEY
Cra
igIN
DVo
tes
Tota
lFo
rmal
Vote
s
Info
rmal
Vote
sTo
tal
Vote
s
1Ba
ldiv
is P
rimar
y Sc
hool
296
2410
555
612
981
846
1639
2,02
999
2,12
899
949
.26%
1,02
950
.74%
2Be
rtram
Prim
ary
Scho
ol29
832
146
170
119
1,00
445
4725
1,88
611
82,
004
583
30.9
3%1,
302
69.0
7%3
East
Wai
kiki
Prim
ary
Scho
ol38
720
8129
272
82
746
419
483
152
32.7
6%31
267
.24%
4Le
da P
rimar
y Sc
hool
133
1282
109
6355
734
911
1,01
058
1,06
829
629
.34%
713
70.6
6%5
Mak
ybe
Ris
e Pr
imar
y Sc
hool
184
858
471
8352
329
1429
1,39
944
1,44
375
153
.68%
648
46.3
2%6
Pete
r Car
nley
Ang
lican
Com
mun
ity S
choo
l14
28
7714
248
382
1916
1084
428
872
337
39.9
3%50
760
.07%
7R
iver
gum
s Pr
imar
y Sc
hool
865
3528
527
272
227
1575
441
795
405
53.7
1%34
946
.29%
8R
ocki
ngha
m J
ohn
Cal
vin
Scho
ol40
15
527
8078
32
268
1027
817
766
.04%
9133
.96%
9So
uth
Coa
st B
aptis
t Col
lege
156
465
182
9566
934
517
1,22
771
1,29
842
234
.45%
803
65.5
5%10
The
King
s C
olle
ge73
325
4528
165
1812
537
419
393
149
39.8
4%22
560
.16%
11Tr
anby
Col
lege
381
2210
767
821
899
860
737
2,50
895
2,60
31,
266
50.5
8%1,
237
49.4
2%12
Tuar
t Ris
e Pr
imar
y Sc
hool
807
4741
652
322
142
894
842
990
551
58.1
2%39
741
.88%
13W
aiki
ki P
rimar
y Sc
hool
404
2113
519
221
84
445
629
485
209
45.8
3%24
754
.17%
1,94
713
779
33,
322
917
6,28
341
514
420
914
,167
673
14,8
406,
297
44.4
8%7,
860
55.5
2%Ab
sent
Vot
es54
248
320
357
313
1,88
785
4270
3,66
425
33,
917
1,16
931
.91%
2,49
568
.09%
Early
Vot
es (b
y Po
st)
298
1474
405
200
735
3217
221,
797
451,
842
834
46.4
1%96
353
.59%
Early
Vot
es (I
n Pe
rson
)77
738
222
1,25
842
12,
411
8243
885,
340
215
5,55
52,
382
44.6
1%2,
958
55.3
9%Pr
ovis
iona
l Vot
es2
03
12
80
30
191
205
27.7
8%13
72.2
2%Sp
ecia
l Ins
titut
ions
, H
ospi
tals
& R
emot
es5
00
31
150
01
251
268
32.0
0%17
68.0
0%1,
624
100
619
2,02
493
75,
056
199
105
181
10,8
4551
511
,360
4,39
840
.56%
6,44
659
.44%
3,57
123
71,
412
5,34
61,
854
11,3
3961
424
939
025
,012
1,18
826
,200
10,6
9542
.78%
14,3
0657
.22%
14.2
8%0.
95%
5.65
%21
.37%
7.41
%45
.33%
2.45
%1.
00%
1.56
%10
0.00
%
GEO
RG
E M
alco
lmVo
tes
SUM
MER
S K
ath
Vote
s
FEG
EBA
NK
Chr
istin
eVo
tes
WH
ITFI
ELD
Mat
tVo
tes
ZUR
AK
OW
SKI
Joh
n C
arl
Vote
s
WH
ITB
Y R
eece
Vote
s
HO
LMES
Yve
tteVo
tes
MA
KK
AR
Pra
bhpr
eet S
ingh
Vote
s
HA
MER
SLEY
Cra
igVo
tes
Vote
sre
mai
ning
in c
ount
Exha
uste
dVo
tes
Tota
lFo
rmal
Vote
s3,
571
237
1,41
25,
346
1,85
411
,339
614
249
390
25,0
1225
,012
3233
948
186
343
237
237
Tota
l3,
603
1,44
55,
440
1,86
211
,357
620
252
433
25,0
1225
,012
4017
4014
8221
3825
225
2To
tal
3,64
31,
462
5,48
01,
876
11,4
3964
147
125
,012
25,0
1251
4916
025
121
6547
147
1To
tal
3,69
41,
511
5,64
01,
901
11,5
6070
625
,012
25,0
1230
234
142
8114
770
670
6To
tal
3,99
61,
545
5,78
21,
982
11,7
0725
,012
25,0
1214
943
592
868
1,54
41
1,54
5To
tal
4,14
56,
217
2,07
412
,575
25,0
111
25,0
1271
578
057
82,
073
12,
074
Tota
l4,
860
6,99
713
,153
25,0
102
25,0
123,
698
1,15
34,
851
94,
860
10,6
9514
,306
25,0
0111
25,0
12
42.7
8%57
.22%
Abs
olut
e M
ajor
ity =
125
01
Dis
tric
t Tot
alG
EOR
GE
Excl
uded
ZUR
AK
OW
SKI E
xclu
ded
Firs
t Pre
fere
nce
Vote
sSU
MM
ERS
Excl
uded
MA
KK
AR
Exc
lude
d
HA
MER
SLEY
Exc
lude
d
HO
LMES
Exc
lude
d
Tota
l Firs
t Pre
fere
nces
Vot
es%
Tota
l Val
id V
otes
WH
ITFI
ELD
Mat
tIN
D
FEG
EBA
NK
Exc
lude
d
WH
ITB
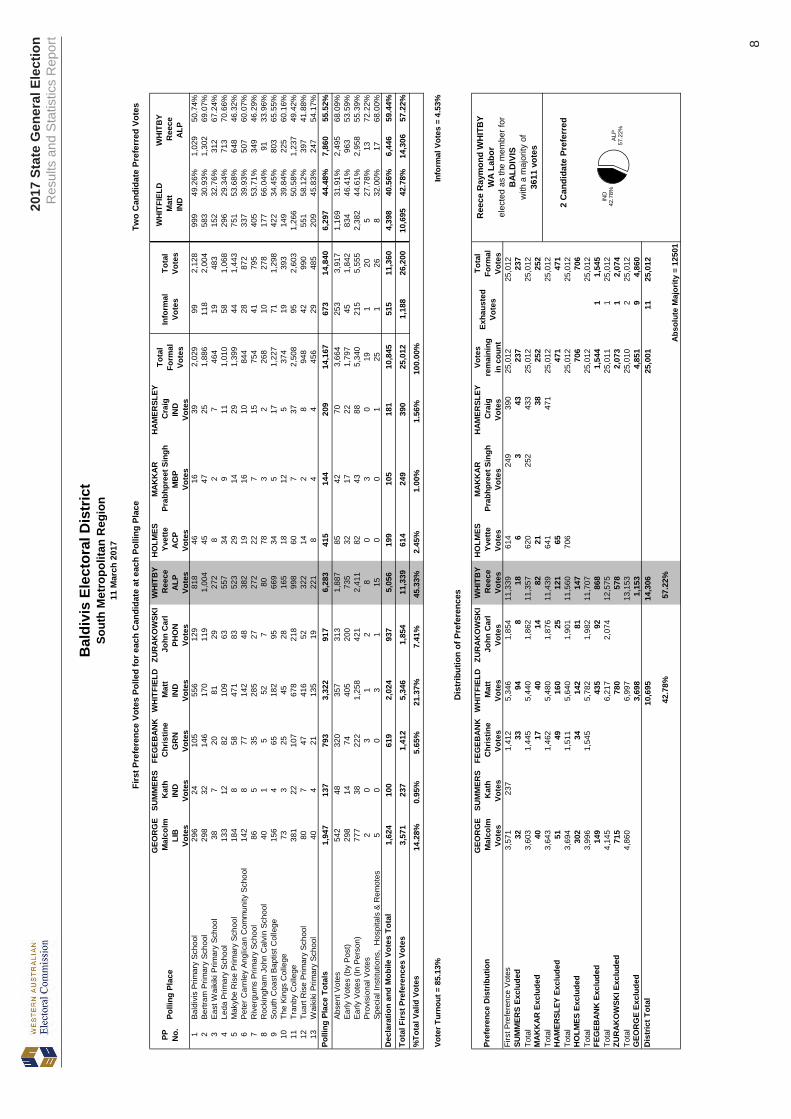
Y R
eece
ALP
Bal
divi
s El
ecto
ral D
istr
ict
11 M
arch
201
7So
uth
Met
ropo
litan
Reg
ion
Two
Can
dida
te P
refe
rred
Vot
es
Pref
eren
ce D
istr
ibut
ion
Ree
ce R
aym
ond
WH
ITB
YW
A La
bor
elec
ted
as th
e m
embe
r for
BAL
DIV
ISw
ith a
maj
ority
of
3611
vot
es
Firs
t Pre
fere
nce
Vote
s Po
lled
for e
ach
Can
dida
te a
t eac
h Po
lling
Pla
ce
Vote
r Tur
nout
= 8
5.13
%In
form
al V
otes
= 4
.53%
Polli
ng P
lace
Tot
als
Dis
trib
utio
n of
Pre
fere
nces
Dec
lara
tion
and
Mob
ile V
otes
Tot
al
ALP
57
.22%
IND
42
.78%
2 C
andi
date
Pre
ferr
ed
Page 10
2017 State General ElectionResults and Statistics Report
9
Suburbs within District
Ashfield
Bassendean
Bayswater
Beechboro
Males 13,430 Eden Hill
Females 13,849 Embleton
Total 27,279 Kiara
Lockridge
Morley
Electors Habitation
1 5,515
2 5,917
3 1,854
>3 1,006 Returning Officer
Total Habitations 14,292 Mark DUCKSBURY
Candidate Name Party
KELLY, David WA Labor
Candidate Name Party
KELLY, David WA Labor
Number of Electors on Roll
Number of Electors per Habitation
Elected Candidate for Bassendean
Previous Member
District of BassendeanEast Metropolitan RegionElector information correct as at 9 February 2017
Area (sq km)
24
This figure is the gazetted area and may include bodies of water
Page 11
2017
Sta
te G
ener
al E
lect
ion
Res
ults
and
Sta
tistic
s R
epor
t 10
2727
9
PP No.
Polli
ng P
lace
MA
RTI
N G
raem
eM
BP
Vote
s
SETH
Jim LIB
Vote
s
KEL
LY D
ave
ALP
Vote
s
MEW
HO
R P
aul W
illia
mA
CP
Vote
s
QU
INTO
N S
arah
GR
NVo
tes
Tota
lFo
rmal
Vote
s
Info
rmal
Vote
sTo
tal
Vote
s
1A
nzac
Ter
race
Prim
ary
Sch
ool
4441
184
945
263
1,61
210
41,
716
524
32.5
3%1,
087
67.4
7%2
Ash
field
Prim
ary
Sch
ool
2925
354
830
137
997
301,
027
299
30.0
5%69
669
.95%
3B
asse
ndea
n P
rimar
y S
choo
l48
582
1,03
954
387
2,11
082
2,19
269
132
.76%
1,41
867
.24%
4B
eech
boro
Prim
ary
Sch
ool
4923
189
538
801,
293
130
1,42
330
923
.90%
984
76.1
0%5
Eas
t Bee
chbo
ro P
rimar
y S
choo
l54
262
834
4310
01,
293
112
1,40
532
625
.23%
966
74.7
7%6
Ede
n H
ill P
rimar
y S
choo
l49
410
1,10
384
243
1,88
911
32,
002
481
25.4
8%1,
407
74.5
2%7
Ham
pton
Sen
ior H
igh
Sch
ool
3438
091
854
114
1,50
082
1,58
244
829
.87%
1,05
270
.13%
8Jo
hn S
eptim
us R
oe A
nglic
an C
omm
unity
Sch
ool
3033
790
051
112
1,43
011
71,
547
399
27.9
0%1,
031
72.1
0%9
Kia
ra C
olle
ge46
274
781
4089
1,23
012
01,
350
346
28.1
3%88
471
.87%
10Lo
ckrid
ge P
rimar
y S
choo
l39
154
812
3710
41,
146
961,
242
211
18.4
4%93
381
.56%
422
3,29
48,
679
476
1,62
914
,500
986
15,4
864,
034
27.8
4%10
,458
72.1
6%A
bsen
t Vot
es10
154
41,
313
8640
72,
451
184
2,63
571
529
.18%
1,73
570
.82%
Ear
ly V
otes
(by
Pos
t)46
413
885
6015
51,
559
871,
646
498
31.9
4%1,
061
68.0
6%E
arly
Vot
es (I
n P
erso
n)10
891
02,
289
113
341
3,76
119
33,
954
1,08
628
.88%
2,67
471
.12%
Pro
visi
onal
Vot
es1
32
00
60
63
50.0
0%3
50.0
0%S
peci
al In
stitu
tions
, H
ospi
tals
& R
emot
es2
2835
00
655
7029
44.6
2%36
55.3
8%25
81,
898
4,52
425
990
37,
842
469
8,31
12,
331
29.7
3%5,
509
70.2
7%
680
5,19
213
,203
735
2,53
222
,342
1,45
523
,797
6,36
528
.50%
15,9
6771
.50%
3.04
%23
.24%
59.0
9%3.
29%
11.3
3%10
0.00
%
MA
RTI
N G
raem
eVo
tes
SETH
Jim
Vote
s
KEL
LY D
ave
Vote
s
MEW
HO
R P
aul W
illia
mVo
tes
QU
INTO
N S
arah
Vote
s
Vote
sre
mai
ning
in c
ount
Exha
uste
dVo
tes
Tota
lFo
rmal
Vote
s68
05,
192
13,2
0373
52,
532
22,3
4222
,342
251
174
134
119
678
268
0To
tal
5,44
313
,377
869
2,65
122
,340
222
,342
406
289
171
866
386
9To
tal
5,84
913
,666
2,82
222
,337
522
,342
516
2,30
12,
817
52,
822
6,36
515
,967
22,3
3210
22,3
42
28.5
0%71
.50%
Abs
olut
e M
ajor
ity =
111
67
Dis
tric
t Tot
al
Firs
t Pre
fere
nce
Vot
esM
AR
TIN
Exc
lude
d
MEW
HO
R E
xclu
ded
QU
INTO
N E
xclu
ded
Tota
l Firs
t Pre
fere
nces
Vot
es
%To
tal V
alid
Vot
es
SETH
Jim LIB
KEL
LY D
ave
ALP
Bas
send
ean
Elec
tora
l Dis
tric
t
11 M
arch
201
7Ea
st M
etro
polit
an R
egio
n
Two
Can
dida
te P
refe
rred
Vot
es
Pref
eren
ce D
istr
ibut
ion
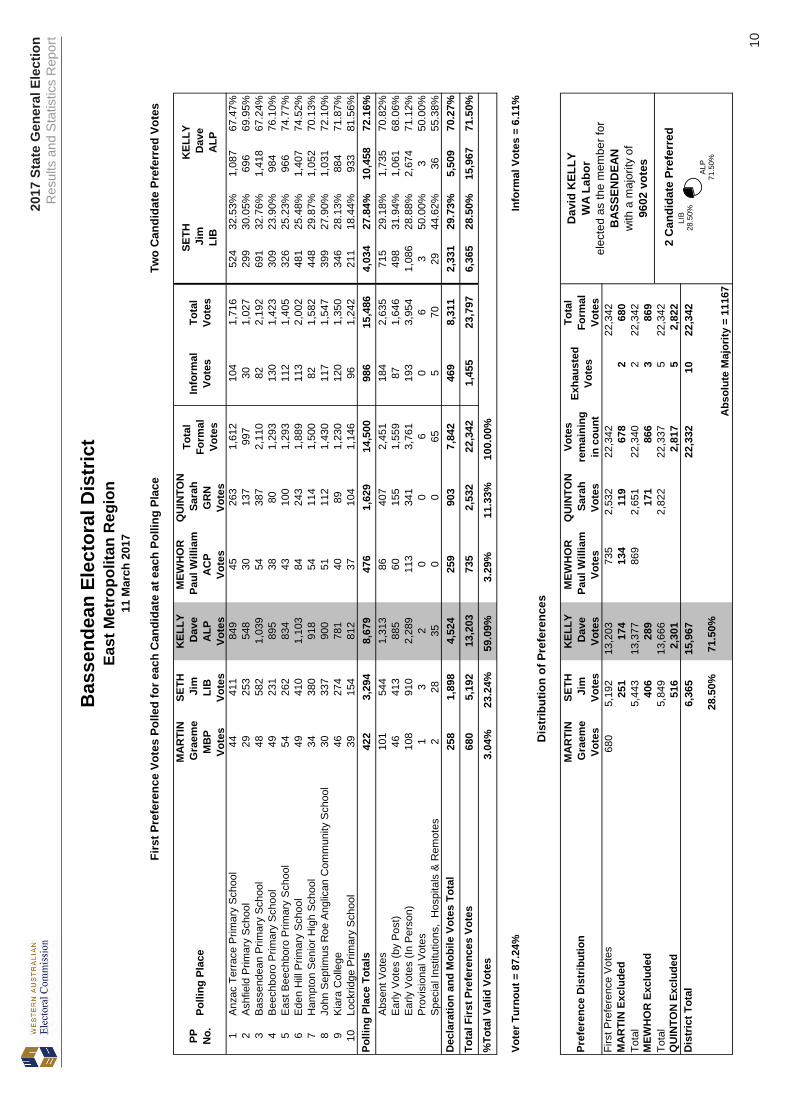
Dav
id K
ELLY
WA
Labo
rel
ecte
d as
the
mem
ber f
orB
ASSE
ND
EAN
with
a m
ajor
ity o
f96
02 v
otes
Firs
t Pre
fere
nce
Vote
s Po
lled
for e
ach
Can
dida
te a
t eac
h Po
lling
Pla
ce
Vote
r Tur
nout
= 8
7.24
%In
form
al V
otes
= 6
.11%
Polli
ng P
lace
Tot
als
Dis
trib
utio
n of
Pre
fere
nces
Dec
lara
tion
and
Mob
ile V
otes
Tot
al
ALP
71
.50%
LIB
28
.50%
2 C
andi
date
Pre
ferr
ed
Page 12
2017 State General ElectionResults and Statistics Report
11
Suburbs within District
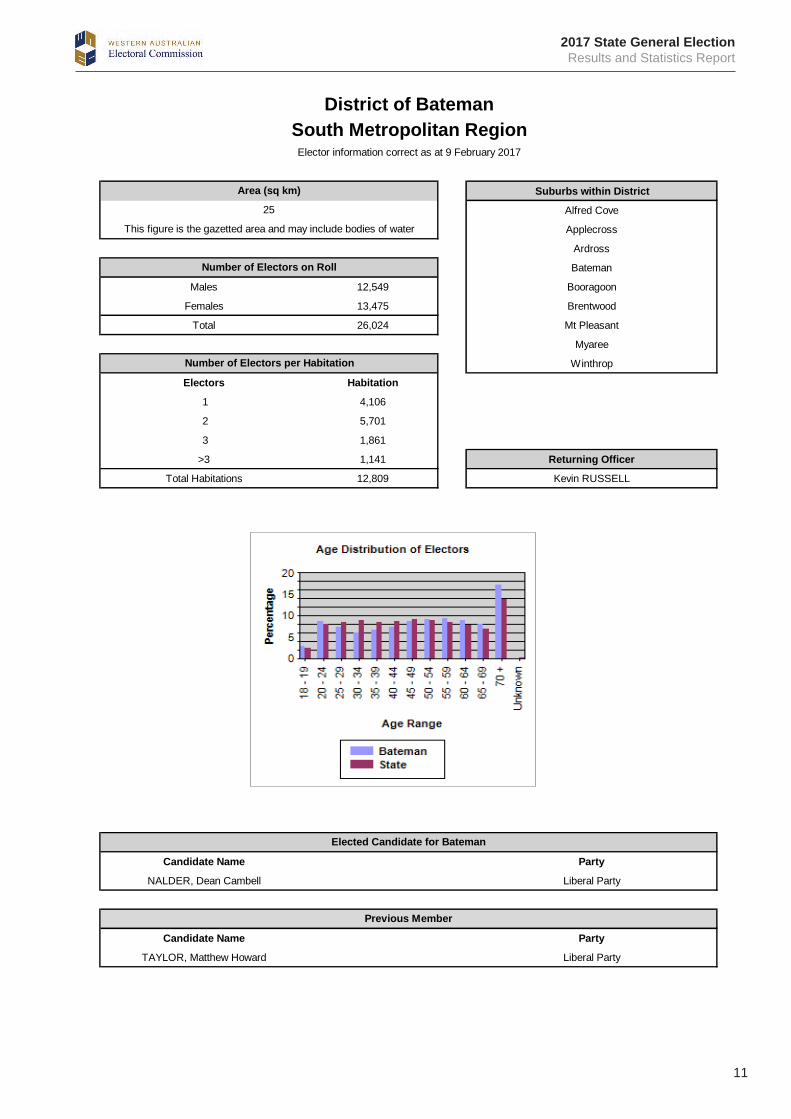
Alfred Cove
Applecross
Ardross
Bateman
Males 12,549 Booragoon
Females 13,475 Brentwood
Total 26,024 Mt Pleasant
Myaree
Winthrop
Electors Habitation
1 4,106
2 5,701
3 1,861
>3 1,141 Returning Officer
Total Habitations 12,809 Kevin RUSSELL
Candidate Name Party
NALDER, Dean Cambell Liberal Party
Candidate Name Party
TAYLOR, Matthew Howard Liberal Party
Number of Electors on Roll
Number of Electors per Habitation
Elected Candidate for Bateman
Previous Member
District of BatemanSouth Metropolitan Region
Elector information correct as at 9 February 2017
Area (sq km)
25
This figure is the gazetted area and may include bodies of water
Page 13
2017
Sta
te G
ener
al E
lect
ion
Res
ults
and
Sta
tistic
s R
epor
t 12
2602
4
PP No.
Polli
ng P
lace
NA
LDER
Dea
nLI
BVo
tes
HU
GG
INS
Don
AC
PVo
tes
MA
SIH
Jon
atha
nM
BP
Vote
s
MEY
ERS
Mic
helle
PHO
NVo
tes
FITZ
GER
ALD
Tom
asA
LPVo
tes
AR
NO
LD A
dria
nJM
WA
Vote
s
WIL
MO
T A
die
GR
NVo
tes
Tota
lFo
rmal
Vote
s
Info
rmal
Vote
sTo
tal
Vote
s
1A
pple
cros
s P
rimar
y S
choo
l1,
829
7544
121
634
2328
73,
013
100
3,11
32,
062
68.4
8%94
931
.52%
2A
rdro
ss P
rimar
y S
choo
l47
838
2154
327
1013
61,
064
371,
101
593
55.7
3%47
144
.27%
3B
atem
an P
rimar
y S
choo
l65
575
1563
548
1412
41,
494
451,
539
783
52.4
1%71
147
.59%
4B
oora
goon
Prim
ary
Sch
ool
739
4432
5750
614
210
1,60
259
1,66
185
953
.65%
742
46.3
5%5
Bre
ntw
ood
Prim
ary
Sch
ool
882
7129
7764
211
223
1,93
573
2,00
81,
049
54.2
1%88
645
.79%
6C
orpu
s C
hris
ti C
olle
ge12
310
18
815
1824
66
252
142
57.7
2%10
442
.28%
7Le
n S
hear
er P
avili
on25
810
816
111
166
470
1248
229
562
.77%
175
37.2
3%8
Mt P
leas
ant P
rimar
y S
choo
l1,
354
5940
9965
322
233
2,46
090
2,55
01,
546
62.8
5%91
437
.15%
9S
t Ben
edic
t's H
all
586
3419
4625
55
921,
037
261,
063
677
65.2
8%36
034
.72%
10W
inth
rop
Prim
ary
Sch
ool
1,26
810
443
8593
125
206
2,66
210
92,
771
1,48
855
.90%
1,17
444
.10%
8,17
252
025
262
64,
688
130
1,59
515
,983
557
16,5
409,
494
59.4
1%6,
486
40.5
9%A
bsen
t Vot
es95
358
2412
560
118
347
2,12
610
92,
235
1,14
954
.05%
977
45.9
5%E
arly
Vot
es (b
y P
ost)
1,15
666
2514
252
634
145
2,09
474
2,16
81,
350
64.4
7%74
435
.53%
Ear
ly V
otes
(In
Per
son)
1,10
546
3313
460
321
219
2,16
146
2,20
71,
283
59.3
7%87
840
.63%
Pro
visi
onal
Vot
es3
00
04
01
80
83
37.5
0%5
62.5
0%S
peci
al In
stitu
tions
, H
ospi
tals
& R
emot
es12
68
05
473
819
76
203
139
70.5
6%58
29.4
4%3,
343
178
8240
61,
781
7672
06,
586
235
6,82
13,
924
59.5
8%2,
662
40.4
2%
11,5
1569
833
41,
032
6,46
920
62,
315
22,5
6979
223
,361
13,4
1859
.46%
9,14
840
.54%
51.0
2%3.
09%
1.48
%4.
57%
28.6
6%0.
91%
10.2
6%10
0.00
%
NA
LDER
Dea
nVo
tes
HU
GG
INS
Don
Vote
s
MA
SIH
Jon
atha
nVo
tes
MEY
ERS
Mic
helle
Vote
s
FITZ
GER
ALD
Tom
asVo
tes
AR
NO
LD A
dria
nVo
tes
WIL
MO
T A
die
Vote
s
Vote
sre
mai
ning
in c
ount
Exha
uste
dVo
tes
Tota
lFo
rmal
Vote
s11
,515
698
334
1,03
26,
469
206
2,31
522
,569
22,5
6940
1644
1638
5220
620
6To
tal
11,5
5571
437
81,
048
6,50
72,
367
22,5
6922
,569
104
7652
8165
378
378
Tota
l11
,659
790
1,10
06,
588
2,43
222
,569
22,5
6947
210
313
778
790
790
Tota
l12
,131
1,20
36,
725
2,51
022
,569
22,5
6977
122
620
51,
202
11,
203
Tota
l12
,902
6,95
12,
715
22,5
681
22,5
6951
62,
197
2,71
32
2,71
513
,418
9,14
822
,566
322
,569
59.4
6%40
.54%
Abs
olut
e M
ajor
ity =
112
84
Dis
tric
t Tot
al
Firs
t Pre
fere
nce
Vot
esA
RN
OLD
Exc
lude
d
MA
SIH
Exc
lude
d
HU
GG
INS
Excl
uded
MEY
ERS
Excl
uded
Tota
l Firs
t Pre
fere
nces
Vot
es
%To
tal V
alid
Vot
es
NA
LDER
Dea
nLI
B
WIL
MO
T Ex
clud
ed
FITZ
GER
ALD
Tom
asA
LP
Bat
eman
Ele
ctor
al D
istr
ict
11 M
arch
201
7So
uth
Met
ropo
litan
Reg
ion
Two
Can
dida
te P
refe
rred
Vot
es
Pref
eren
ce D
istr
ibut
ion
Dea
n C
ambe
ll N
ALD
ERLi
bera
l Par
tyel
ecte
d as
the
mem
ber f
orB
ATE
MA
Nw
ith a
maj
ority
of
4270
vot
es
Firs
t Pre
fere
nce
Vote
s Po
lled
for e
ach
Can
dida
te a
t eac
h Po
lling
Pla
ce
Vote
r Tur
nout
= 8
9.77
%In
form
al V
otes
= 3
.39%
Polli
ng P
lace
Tot
als
Dis
trib
utio
n of
Pre
fere
nces
Dec
lara
tion
and
Mob
ile V
otes
Tot
al
ALP
40
.54%
LI
B
59.4
6%
2 C
andi
date
Pre
ferr
ed
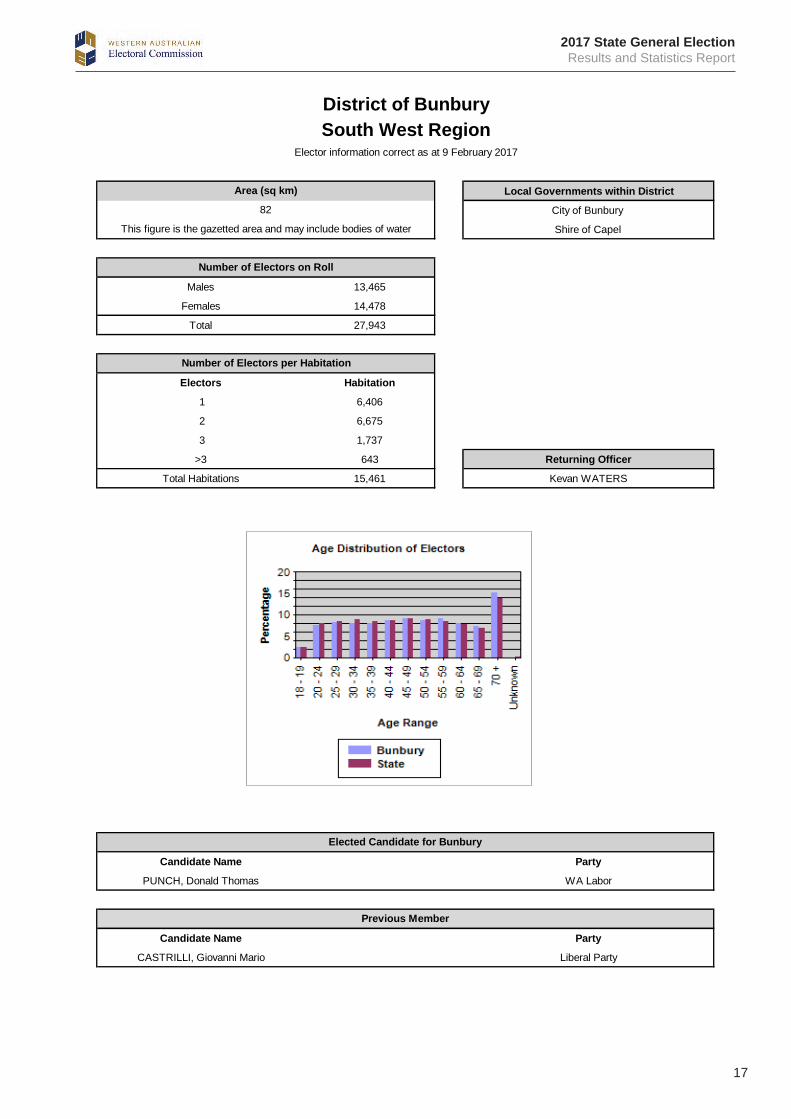
Page 14
2017 State General ElectionResults and Statistics Report
13
Suburbs within District
Ascot
Belmont
Burswood
Cloverdale
Males 13,627 Hazelmere
Females 13,146 Kewdale
Total 26,773 Redcliffe
Rivervale
South Guildford
Electors Habitation Welshpool
1 7,330
2 5,973
3 1,507
>3 685 Returning Officer
Total Habitations 15,495 Barry SHELTON
Candidate Name Party
ROWE, Cassandra Michelle WA Labor
Candidate Name Party
GODFREY, Glenys Jenolan Liberal Party
Number of Electors on Roll
Number of Electors per Habitation
Elected Candidate for Belmont
Previous Member
District of BelmontEast Metropolitan RegionElector information correct as at 9 February 2017
Area (sq km)
70
This figure is the gazetted area and may include bodies of water
Page 15
2017
Sta
te G
ener
al E
lect
ion
Res
ults
and
Sta
tistic
s R
epor
t 14
2677
3
PP No.
Polli
ng P
lace
RO
WE
Cas
sie
ALP
Vote
s
GO
DFR
EY G
leny
sLI
BVo
tes
AND
ERSO
N B
rigit
AJP
Vote
s
FRAS
ER S
ueAC
PVo
tes
SOB
OH
Mira
lM
BP
Vote
s
KH
ADK
A B
huw
anG
RN
Vote
s
MIT
CH
ELL
Jul
iePH
ON
Vote
s
BLE
VIN
Ian
SFP
Vote
s
Tota
lFo
rmal
Vote
s
Info
rmal
Vote
sTo
tal
Vote
s
1Be
lmon
t City
Col
lege
1,15
052
337
3438
143
100
302,
055
169
2,22
41,
403
68.2
7%65
231
.73%
2Be
lmon
t Par
k Te
nnis
Clu
b42
620
48
117
5437
1175
834
792
504
66.4
9%25
433
.51%
3Be
lmon
t Prim
ary
Scho
ol63
952
425
2718
8593
161,
427
511,
478
784
54.9
8%64
245
.02%
4C
arlis
le P
rimar
y Sc
hool
798
452
2835
3013
470
201,
567
144
1,71
197
962
.48%
588
37.5
2%5
Haz
elm
ere
Com
mun
ity H
all
527
335
1518
710
876
211,
107
591,
166
679
61.4
5%42
638
.55%
6Ke
wda
le P
rimar
y Sc
hool
790
376
2715
1784
7125
1,40
572
1,47
793
266
.43%
471
33.5
7%7
Nat
ions
Chu
rch
1,18
449
924
4417
114
125
372,
044
112
2,15
61,
400
68.5
9%64
131
.41%
8R
edcl
iffe
Prim
ary
Scho
ol57
133
713
3310
8670
81,
128
571,
185
697
61.7
9%43
138
.21%
9R
iver
vale
Prim
ary
Scho
ol60
144
820
2019
103
5611
1,27
810
51,
383
737
57.7
1%54
042
.29%
10St
Aug
ustin
e's
Scho
ol44
438
314
1113
103
4111
1,02
045
1,06
557
256
.08%
448
43.9
2%7,
130
4,08
121
124
817
61,
014
739
190
13,7
8984
814
,637
8,68
763
.04%
5,09
336
.96%
Abse
nt V
otes
1,13
472
957
5246
324
241
852,
668
144
2,81
21,
615
60.6
2%1,
049
39.3
8%Ea
rly V
otes
(by
Post
)1,
133
894
3841
2296
209
352,
468
852,
553
1,38
256
.00%
1,08
644
.00%
Early
Vot
es (I
n Pe
rson
)1,
116
766
4951
3418
520
546
2,45
290
2,54
21,
439
58.7
1%1,
012
41.2
9%Pr
ovis
iona
l Vot
es3
30
01
22
011
213
545
.45%
654
.55%
Spec
ial I
nstit
utio
ns,
Hos
pita
ls &
Rem
otes
3127
02
10
10
620
6234
55.7
4%27
44.2
6%3,
417
2,41
914
414
610
460
765
816
67,
661
321
7,98
24,
475
58.4
6%3,
180
41.5
4%
10,5
476,
500
355
394
280
1,62
11,
397
356
21,4
501,
169
22,6
1913
,162
61.4
0%8,
273
38.6
0%
49.1
7%30
.30%
1.66
%1.
84%
1.31
%7.
56%
6.51
%1.
66%
100.
00%
RO
WE
Cas
sie
Vote
s
GO
DFR
EY G
leny
sVo
tes
AND
ERSO
N B
rigit
Vote
s
FRAS
ER S
ueVo
tes
SOB
OH
Mira
lVo
tes
KH
ADK
A B
huw
anVo
tes
MIT
CH
ELL
Jul
ieVo
tes
BLE
VIN
Ian
Vote
s
Vote
sre
mai
ning
in c
ount
Exha
uste
dVo
tes
Tota
lFo
rmal
Vote
s10
,547
6,50
035
539
428
01,
621
1,39
735
621
,450
21,4
5087
3621
1460
2734
279
128
0To
tal
10,6
346,
536
376
408
1,68
11,
424
390
21,4
491
21,4
5086
4632
136
3442
376
376
Tota
l10
,720
6,58
244
01,
817
1,45
843
221
,449
121
,450
8979
4390
130
431
143
2To
tal
10,8
096,
661
483
1,90
71,
588
21,4
482
21,4
5093
214
9382
482
148
3To
tal
10,9
026,
875
2,00
01,
670
21,4
473
21,4
5048
483
634
11,
661
91,
670
Tota
l11
,386
7,71
12,
341
21,4
3812
21,4
501,
776
562
2,33
83
2,34
113
,162
8,27
321
,435
1521
,450
61.4
0%38
.60%
Abso
lute
Maj
ority
= 1
0718
Dis
tric
t Tot
alK
HAD
KA
Excl
uded
Firs
t Pre
fere
nce
Vote
sSO
BO
H E
xclu
ded
AND
ERSO
N E
xclu
ded
BLE
VIN
Exc
lude
d
FRAS
ER E
xclu
ded
Tota
l Firs
t Pre
fere
nces
Vot
es
%To
tal V
alid
Vot
es
RO
WE
Cas
sie
ALP
MIT
CH
ELL
Excl
uded
GO
DFR
EY G
leny
sLI
B
Bel
mon
t Ele
ctor
al D
istr
ict
11 M
arch
201
7Ea
st M
etro
polit
an R
egio
n
Two
Can
dida
te P
refe
rred
Vot
es
Pref
eren
ce D
istr
ibut
ion
Cas
sand
ra M
iche
lle R
OW
EW
A La
bor
elec
ted
as th
e m
embe
r for
BEL
MO
NT
with
a m
ajor
ity o
f48
89 v
otes
Firs
t Pre
fere
nce
Vote
s Po
lled
for e
ach
Can
dida
te a
t eac
h Po
lling
Pla
ce
Vote
r Tur
nout
= 8
4.48
%In
form
al V
otes
= 5
.17%
Polli
ng P
lace
Tot
als
Dis
trib
utio
n of
Pre
fere
nces
Dec
lara
tion
and
Mob
ile V
otes
Tot
al
LIB
38
.60%
A
LP
61.4
0%
2 C
andi
date
Pre
ferr
ed
Page 16
2017 State General ElectionResults and Statistics Report
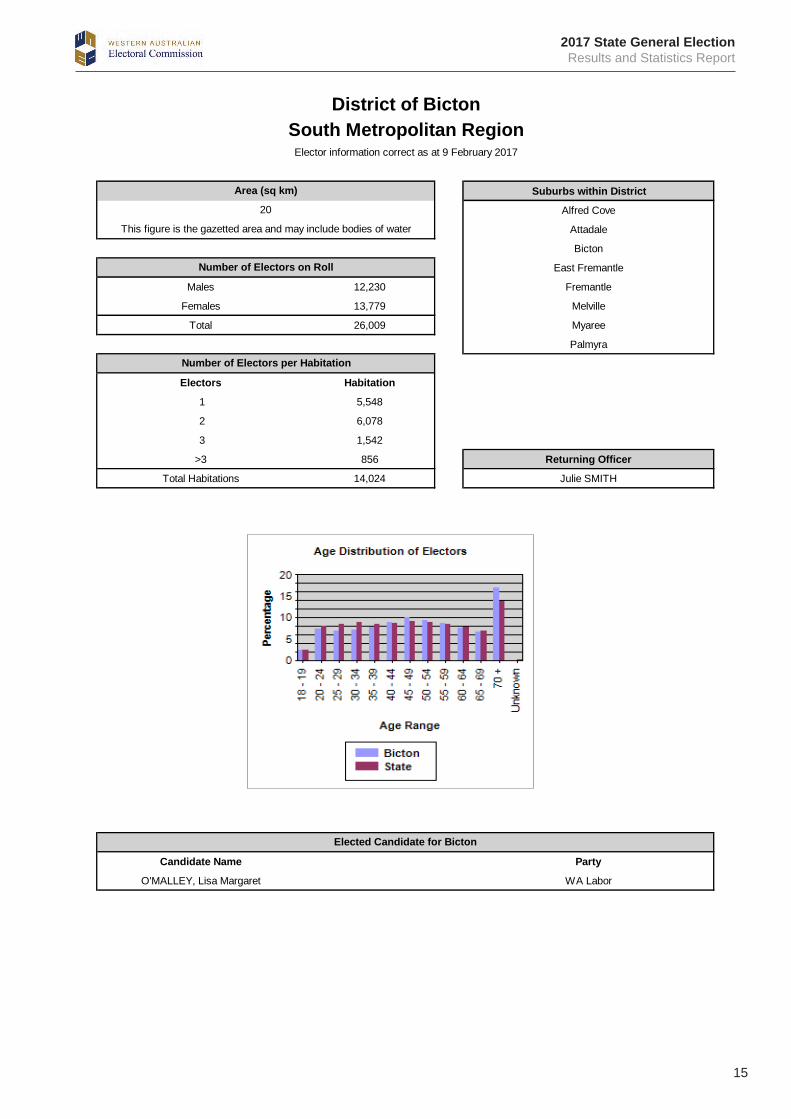
15
Suburbs within District
Alfred Cove
Attadale
Bicton
East Fremantle
Males 12,230 Fremantle
Females 13,779 Melville
Total 26,009 Myaree
Palmyra
Electors Habitation
1 5,548
2 6,078
3 1,542
>3 856 Returning Officer
Total Habitations 14,024 Julie SMITH
Candidate Name Party
O'MALLEY, Lisa Margaret WA Labor
Number of Electors on Roll
Number of Electors per Habitation
Elected Candidate for Bicton
District of BictonSouth Metropolitan Region
Elector information correct as at 9 February 2017
Area (sq km)
20
This figure is the gazetted area and may include bodies of water
Page 17
2017
Sta
te G
ener
al E
lect
ion
Res
ults
and
Sta
tistic
s R
epor
t 16
2600
9
PP No.
Polli
ng P
lace
DIC
KM
ANN
Lou
ise
GR
NVo
tes
O'M
ALLE
Y L
isa
ALP
Vote
s
KO
RFA
NTY
Ric
hard
MB
PVo
tes
KEP
ERT
Ste
veIN
DVo
tes
SAPO
RIT
A C
olle
enAJ
PVo
tes
WA
RD
ELL-
JOH
NSO
N S
teph
enAC
PVo
tes
TAYL
OR
Mat
tLI
BVo
tes
Tota
lFo
rmal
Vote
s
Info
rmal
Vote
sTo
tal
Vote
s
1At
tada
le P
rimar
y Sc
hool
187
800
2066
3929
1,56
52,
706
722,
778
1,02
938
.03%
1,67
761
.97%
2Bi
cton
Prim
ary
Scho
ol22
895
533
8434
211,
121
2,47
671
2,54
71,
267
51.1
9%1,
208
48.8
1%3
Mel
ville
Prim
ary
Scho
ol19
785
831
9726
2493
12,
164
782,
242
1,13
552
.47%
1,02
847
.53%
4M
elvi
lle R
ecre
atio
n C
entre
9648
712
6213
1552
61,
211
351,
246
623
51.4
5%58
848
.55%
5M
elvi
lle S
enio
r Hig
h Sc
hool
6227
811
1412
931
970
534
739
364
51.6
3%34
148
.37%
6Pa
lmyr
a Pr
imar
y Sc
hool
286
1,09
912
7628
2064
02,
161
812,
242
1,44
066
.67%
720
33.3
3%7
Ric
hmon
d Pr
imar
y Sc
hool
156
520
736
188
551
1,29
620
1,31
670
854
.63%
588
45.3
7%8
St P
eter
's A
nglic
an C
hurc
h H
all
131
587
1327
1015
394
1,17
751
1,22
873
962
.89%
436
37.1
1%9
Tric
olor
e C
omm
unity
Cen
tre69
277
917
95
423
809
1782
636
144
.62%
448
55.3
8%1,
412
5,86
114
847
918
914
66,
470
14,7
0545
915
,164
7,66
652
.15%
7,03
447
.85%
Abse
nt V
otes
499
983
3559
5430
866
2,52
611
62,
642
1,52
960
.55%
996
39.4
5%Ea
rly V
otes
(by
Post
)19
091
423
8042
271,
192
2,46
852
2,52
01,
178
47.7
5%1,
289
52.2
5%Ea
rly V
otes
(In
Pers
on)
301
1,15
218
112
3932
1,14
92,
803
672,
870
1,54
054
.96%
1,26
245
.04%
Prov
isio
nal V
otes
21
10
00
59
09
444
.44%
555
.56%
Spec
ial I
nstit
utio
ns,
Hos
pita
ls &
Rem
otes
244
14
12
5210
61
107
5148
.11%
5551
.89%
994
3,09
478
255
136
913,
264
7,91
223
68,
148
4,30
254
.39%
3,60
745
.61%
2,40
68,
955
226
734
325
237
9,73
422
,617
695
23,3
1211
,968
52.9
3%10
,641
47.0
7%
10.6
4%39
.59%
1.00
%3.
25%
1.44
%1.
05%
43.0
4%10
0.00
%
DIC
KM
ANN
Lou
ise
Vote
s
O'M
ALLE
Y L
isa
Vote
s
KO
RFA
NTY
Ric
hard
Vote
s
KEP
ERT
Ste
veVo
tes
SAPO
RIT
A C
olle
enVo
tes
WA
RD
ELL-
JOH
NSO
N S
teph
enVo
tes
TAYL
OR
Mat
tVo
tes
Vote
sre
mai
ning
in c
ount
Exha
uste
dVo
tes
Tota
lFo
rmal
Vote
s2,
406
8,95
522
673
432
523
79,
734
22,6
1722
,617
2532
6926
2450
226
226
Tota
l2,
431
8,98
780
335
126
19,
784
22,6
1722
,617
1336
6224
125
260
126
1To
tal
2,44
49,
023
865
375
9,90
922
,616
122
,617
123
7911
557
374
137
5To
tal
2,56
79,
102
980
9,96
622
,615
222
,617
349
358
272
979
198
0To
tal
2,91
69,
460
10,2
3822
,614
322
,617
2,50
840
32,
911
52,
916
11,9
6810
,641
22,6
098
22,6
17
52.9
3%47
.07%
Abso
lute
Maj
ority
= 1
1305
Dis
tric
t Tot
al
Firs
t Pre
fere
nce
Vote
sK
OR
FAN
TY E
xclu
ded
WA
RD
ELL-
JOH
NSO
N E
xclu
ded
SAPO
RIT
A Ex
clud
ed
KEP
ERT
Excl
uded
Tota
l Firs
t Pre
fere
nces
Vot
es
%To
tal V
alid
Vot
es
O'M
ALLE
Y L
isa
ALP
DIC
KM
ANN
Exc
lude
d
TAYL
OR
Mat
tLI
B
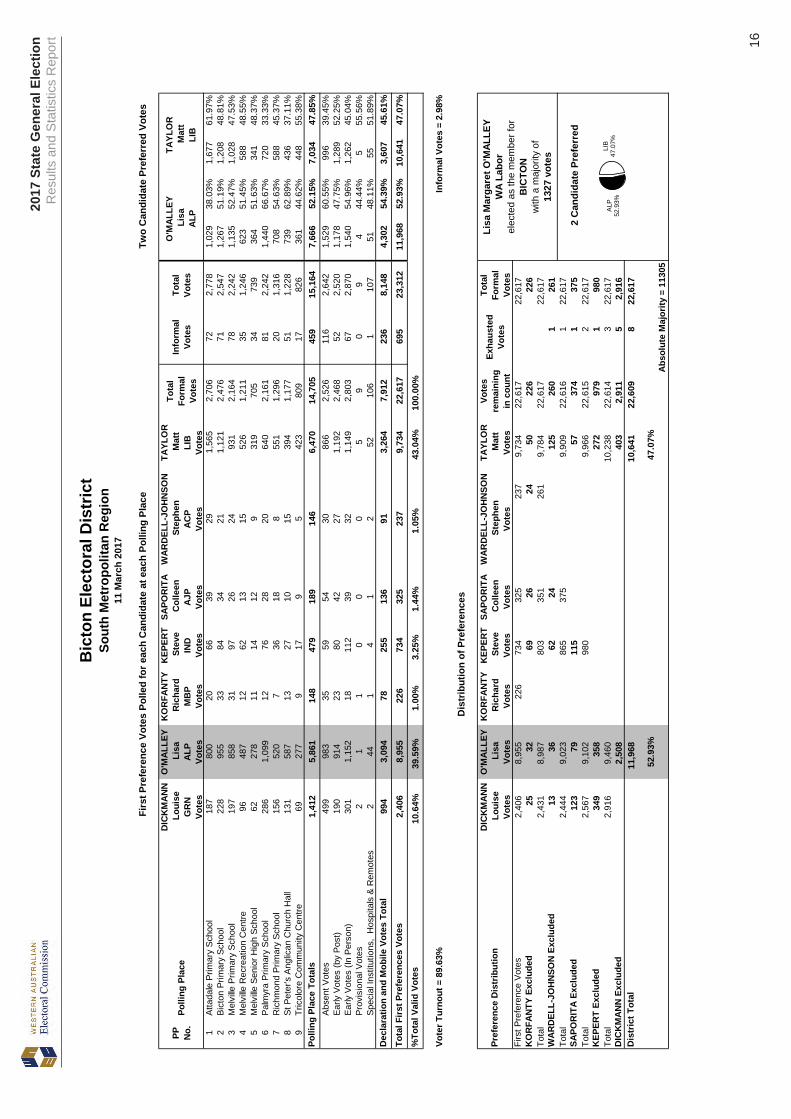
Bic
ton
Elec
tora
l Dis
tric
t
11 M
arch
201
7So
uth
Met
ropo
litan
Reg
ion
Two
Can
dida
te P
refe
rred
Vot
es
Pref
eren
ce D
istr
ibut
ion
Lisa
Mar
gare
t O'M
ALLE
YW
A La
bor
elec
ted
as th
e m
embe
r for
BIC
TON
with
a m
ajor
ity o
f13
27 v
otes
Firs
t Pre
fere
nce
Vote
s Po
lled
for e
ach
Can
dida
te a
t eac
h Po
lling
Pla
ce
Vote
r Tur
nout
= 8
9.63
%In
form
al V
otes
= 2
.98%
Polli
ng P
lace
Tot
als
Dis
trib
utio
n of
Pre
fere
nces
Dec
lara
tion
and
Mob
ile V
otes
Tot
al
LIB
47
.07%
A
LP
52.9
3%
2 C
andi
date
Pre
ferr
ed
Page 18
2017 State General ElectionResults and Statistics Report
17
Local Governments within District
City of Bunbury
Shire of Capel
Males 13,465
Females 14,478
Total 27,943
Electors Habitation
1 6,406
2 6,675
3 1,737
>3 643 Returning Officer
Total Habitations 15,461 Kevan WATERS
Candidate Name Party
PUNCH, Donald Thomas WA Labor
Candidate Name Party
CASTRILLI, Giovanni Mario Liberal Party
Number of Electors on Roll
Number of Electors per Habitation
Elected Candidate for Bunbury
Previous Member
District of BunburySouth West Region
Elector information correct as at 9 February 2017
Area (sq km)
82
This figure is the gazetted area and may include bodies of water
Page 19
2017
Sta
te G
ener
al E
lect
ion
Res
ults
and
Sta
tistic
s R
epor
t 18
2794
3
PP No.
Polli
ng P
lace
MO
RIS
ON
Ian
LIB
Vote
s
BR
OW
N S
amue
l Jew
ell
PHO
NVo
tes
SHA
NN
ON
Ant
hony
GFL
UX
Vote
s
BA
LDO
CK
Mic
hael
GR
NVo
tes
DEL
PO
POLO
Ald
oM
BP
Vote
s
HA
YWA
RD
Jam
esN
AT
Vote
s
PUN
CH
Don
ALP
Vote
s
MA
STER
S B
erni
eSF
PVo
tes
Tota
lFo
rmal
Vote
s
Info
rmal
Vote
sTo
tal
Vote
s
1Ad
am R
oad
Prim
ary
Scho
ol33
313
112
103
724
575
256
1,63
995
1,73
461
637
.70%
1,01
862
.30%
2Bu
nbur
y C
atho
lic C
olle
ge16
266
554
311
034
325
768
3680
428
637
.24%
482
62.7
6%3
Bunb
ury
CBD
259
5010
823
122
317
1886
136
897
405
47.0
4%45
652
.96%
4Bu
nbur
y Pr
e-Pr
imar
y C
entre
268
4313
102
315
735
416
956
3499
043
845
.82%
518
54.1
8%5
Car
ey P
ark
Prim
ary
Scho
ol15
711
914
101
715
462
152
1,22
592
1,31
733
627
.43%
889
72.5
7%6
Coo
inda
Prim
ary
Scho
ol27
487
1181
418
859
749
1,29
187
1,37
848
037
.24%
809
62.7
6%7
Dal
yellu
p Pr
imar
y Sc
hool
486
217
917
13
331
1,18
195
2,49
310
72,
600
909
36.4
6%1,
584
63.5
4%8
Mai
dens
Par
k Pr
imar
y Sc
hool
143
111
1176
614
965
047
1,19
375
1,26
832
226
.99%
871
73.0
1%9
Milli
gan
Hou
se C
hild
Car
e C
entre
122
943
381
8043
441
813
5586
824
430
.09%
567
69.9
1%10
Pict
on P
rimar
y Sc
hool
218
874
473
126
503
361,
024
391,
063
378
36.9
5%64
563
.05%
11So
uth
Bunb
ury
Pre-
Prim
ary
Cen
tre26
310
25
712
124
474
251,
066
511,
117
434
40.7
1%63
259
.29%
12So
uth
Wes
t Hea
lth C
ampu
s94
334
291
5319
212
418
2744
515
436
.84%
264
63.1
6%2,
779
1,14
010
195
543
1,83
96,
418
472
13,7
4773
414
,481
5,00
236
.41%
8,73
563
.59%
Abse
nt V
otes
454
184
2923
612
217
782
121
2,03
510
42,
139
780
38.3
3%1,
255
61.6
7%Ea
rly V
otes
(by
Post
)51
522
813
843
273
630
281,
774
116
1,89
084
147
.43%
932
52.5
7%Ea
rly V
otes
(In
Pers
on)
1,28
048
828
278
781
12,
187
176
5,25
518
45,
439
2,27
243
.28%
2,97
856
.72%
Prov
isio
nal V
otes
30
02
01
51
120
125
41.6
7%7
58.3
3%Sp
ecia
l Ins
titut
ions
, H
ospi
tals
& R
emot
es87
101
40
2177
620
612
218
110
53.4
0%96
46.6
0%2,
339
910
7160
422
1,32
33,
681
332
9,28
241
69,
698
4,00
843
.21%
5,26
856
.79%
5,11
82,
050
172
1,55
965
3,16
210
,099
804
23,0
291,
150
24,1
799,
010
39.1
5%14
,003
60.8
5%
22.2
2%8.
90%
0.75
%6.
77%
0.28
%13
.73%
43.8
5%3.
49%
100.
00%
MO
RIS
ON
Ian
Vote
s
BR
OW
N S
amue
l Jew
ell
Vote
s
SHA
NN
ON
Ant
hony
GVo
tes
BA
LDO
CK
Mic
hael
Vote
s
DEL
PO
POLO
Ald
oVo
tes
HA
YWA
RD
Jam
esVo
tes
PUN
CH
Don
Vote
s
MA
STER
S B
erni
eVo
tes
Vote
sre
mai
ning
in c
ount
Exha
uste
dVo
tes
Tota
lFo
rmal
Vote
s5,
118
2,05
017
21,
559
653,
162
10,0
9980
423
,029
23,0
297
512
167
612
6565
Tota
l5,
125
2,05
518
41,
575
3,16
910
,105
816
23,0
2923
,029
1529
5419
2641
184
184
Tota
l5,
140
2,08
41,
629
3,18
810
,131
857
23,0
2923
,029
150
213
111
112
267
853
485
7To
tal
5,29
02,
297
1,74
03,
300
10,3
9823
,025
423
,029
159
158
362
1,06
01,
739
11,
740
Tota
l5,
449
2,45
53,
662
11,4
5823
,024
523
,029
883
876
688
2,44
78
2,45
5To
tal
6,33
24,
538
12,1
4623
,016
1323
,029
2,67
81,
857
4,53
53
4,53
89,
010
14,0
0323
,013
1623
,029
39.1
5%60
.85%
Abs
olut
e M
ajor
ity =
115
07
Dis
tric
t Tot
alH
AYW
AR
D E
xclu
ded
Firs
t Pre
fere
nce
Vote
sD
EL P
OPO
LO E
xclu
ded
SHA
NN
ON
Exc
lude
d
MA
STER
S Ex
clud
ed
BA
LDO
CK
Exc
lude
d
Tota
l Firs
t Pre
fere
nces
Vot
es
%To
tal V
alid
Vot
es
MO
RIS
ON
Ian
LIB
BR
OW
N E
xclu
ded
PUN
CH
Don
ALP
Bun
bury
Ele
ctor
al D
istr
ict
11 M
arch
201
7So
uth
Wes
t Reg
ion
Two
Can
dida
te P
refe
rred
Vot
es
Pref
eren
ce D
istr
ibut
ion
Don
ald
Thom
as P
UN
CH
WA
Lab
orel
ecte
d as
the
mem
ber f
orB
UN
BU
RY
with
a m
ajor
ity o
f49
93 v
otes
Firs
t Pre
fere
nce
Vote
s Po
lled
for e
ach
Can
dida
te a
t eac
h Po
lling
Pla
ce
Vote
r Tur
nout
= 8
6.53
%In
form
al V
otes
= 4
.76%
Polli
ng P
lace
Tot
als
Dis
trib
utio
n of
Pre
fere
nces
Dec
lara
tion
and
Mob
ile V
otes
Tot
al
ALP
60
.85%
LIB
39
.15%
2 C
andi
date
Pre
ferr
ed
Page 20
2017 State General ElectionResults and Statistics Report
19
Suburbs within District
Burns Beach
Clarkson
Currambine
Iluka
Males 14,122 Joondalup
Females 14,657 Kinross
Total 28,779 Mindarie
Neerabup
Electors Habitation
1 3,924
2 6,384
3 2,219
>3 1,275 Returning Officer
Total Habitations 13,802 Lisa WILKINSON
Candidate Name Party
FOLKARD, Mark James WA Labor
Number of Electors on Roll
Number of Electors per Habitation
Elected Candidate for Burns Beach
District of Burns BeachNorth Metropolitan RegionElector information correct as at 9 February 2017
Area (sq km)
40
This figure is the gazetted area and may include bodies of water
Page 21
2017
Sta
te G
ener
al E
lect
ion
Res
ults
and
Sta
tistic
s R
epor
t 20
2877
9
PP No.
Polli
ng P
lace
MAD
DO
X C
arl
JMW
AVo
tes
JAC
OB
Alb
ert
LIB
Vote
s
CU
LUM
-BU
ZAK
San
dyM
BP
Vote
s
FOLK
ARD
Mar
kAL
PVo
tes
CR
OU
S R
udol
ph J
ohan
nes
ACP
Vote
s
CO
OPE
R M
ark
GR
NVo
tes
DR
ENN
AN J
oyFF
PVo
tes
Tota
lFo
rmal
Vote
s
Info
rmal
Vote
sTo
tal
Vote
s
1Br
amst
on P
ark
Com
mun
ity S
porti
ng F
acilit
y30
1,08
514
710
2411
915
1,99
766
2,06
31,
155
57.8
4%84
242
.16%
2C
lark
son
Com
mun
ity H
igh
Scho
ol39
414
1193
434
181
421,
655
153
1,80
852
531
.72%
1,13
068
.28%
3C
omet
Sch
ool
1619
26
247
1656
1855
138
589
237
43.0
1%31
456
.99%
4C
urra
mbi
ne P
rimar
y Sc
hool
2366
518
647
4612
236
1,55
799
1,65
676
849
.36%
788
50.6
4%5
Fran
cis
Jord
an C
atho
lic S
choo
l15
290
1126
618
448
652
4269
432
850
.38%
323
49.6
2%6
Joon
dalu
p Pr
imar
y Sc
hool
4662
816
765
4216
345
1,70
511
51,
820
738
43.3
1%96
656
.69%
7Ki
nros
s Pr
imar
y Sc
hool
3798
827
1,10
943
233
432,
480
143
2,62
31,
129
45.5
2%1,
351
54.4
8%8
Mac
Nau
ghto
n C
lubr
oom
s7
163
017
90
397
395
2441
917
644
.56%
219
55.4
4%9
Min
darie
Prim
ary
Scho
ol38
1,23
418
876
4020
725
2,43
810
42,
542
1,35
855
.70%
1,08
044
.30%
10M
inda
rie S
enio
r Col
lege
421
75
167
1243
845
628
484
248
54.5
1%20
745
.49%
11So
mer
ly P
rimar
y Sc
hool
1733
931
597
2613
519
1,16
472
1,23
640
835
.08%
755
64.9
2%27
26,
215
157
6,49
730
11,
342
266
15,0
5088
415
,934
7,07
046
.99%
7,97
553
.01%
Abse
nt V
otes
801,
121
501,
270
5935
092
3,02
221
53,
237
1,35
744
.92%
1,66
455
.08%
Early
Vot
es (b
y Po
st)
501,
026
2583
043
159
622,
195
108
2,30
31,
174
53.4
9%1,
021
46.5
1%Ea
rly V
otes
(In
Pers
on)
691,
398
341,
464
7020
883
3,32
611
63,
442
1,59
547
.97%
1,73
052
.03%
Prov
isio
nal V
otes
08
08
31
121
223
1152
.38%
1047
.62%
Spec
ial I
nstit
utio
ns,
Hos
pita
ls &
Rem
otes
00
00
00
00
00
199
3,55
310
93,
572
175
718
238
8,56
444
19,
005
4,13
748
.32%
4,42
551
.68%
471
9,76
826
610
,069
476
2,06
050
423
,614
1,32
524
,939
11,2
0747
.47%
12,4
0052
.53%
1.99
%41
.37%
1.13
%42
.64%
2.02
%8.
72%
2.13
%10
0.00
%
MAD
DO
X C
arl
Vote
s
JAC
OB
Alb
ert
Vote
s
CU
LUM
-BU
ZAK
San
dyVo
tes
FOLK
ARD
Mar
kVo
tes
CR
OU
S R
udol
ph J
ohan
nes
Vote
s
CO
OPE
R M
ark
Vote
s
DR
ENN
AN J
oyVo
tes
Vote
sre
mai
ning
in c
ount
Exha
uste
dVo
tes
Tota
lFo
rmal
Vote
s47
19,
768
266
10,0
6947
62,
060
504
23,6
1423
,614
4764
5320
3349
266
266
Tota
l51
89,
832
10,1
2249
62,
093
553
23,6
1423
,614
1817
047
3622
449
51
496
Tota
l53
610
,002
10,1
692,
129
777
23,6
131
23,6
1421
112
168
136
536
536
Tota
l10
,213
10,2
902,
197
913
23,6
131
23,6
1436
020
934
391
21
913
Tota
l10
,573
10,4
992,
540
23,6
122
23,6
1463
41,
901
2,53
55
2,54
011
,207
12,4
0023
,607
723
,614
47.4
7%52
.53%
Abso
lute
Maj
ority
= 1
1804
Dis
tric
t Tot
al
Firs
t Pre
fere
nce
Vote
sC
ULU
M-B
UZA
K E
xclu
ded
CR
OU
S Ex
clud
ed
MAD
DO
X Ex
clud
ed
DR
ENN
AN E
xclu
ded
Tota
l Firs
t Pre
fere
nces
Vot
es
%To
tal V
alid
Vot
es
JAC
OB
Alb
ert
LIB
CO
OPE
R E
xclu
ded
FOLK
ARD
Mar
kAL
P
Bur
ns B
each
Ele
ctor
al D
istr
ict
11 M
arch
201
7N
orth
Met
ropo
litan
Reg
ion
Two
Can
dida
te P
refe
rred
Vot
es
Pref
eren
ce D
istr
ibut
ion
Mar
k Ja
mes
FO
LKAR
DW
A La
bor
elec
ted
as th
e m
embe
r for
BU
RN
S B
EAC
Hw
ith a
maj
ority
of
1193
vot
es
Firs
t Pre
fere
nce
Vote
s Po
lled
for e
ach
Can
dida
te a
t eac
h Po
lling
Pla
ce
Vote
r Tur
nout
= 8
6.66
%In
form
al V
otes
= 5
.31%
Polli
ng P
lace
Tot
als
Dis
trib
utio
n of
Pre
fere
nces
Dec
lara
tion
and
Mob
ile V
otes
Tot
al
ALP
52
.53%
LIB
47
.47%
2 C
andi
date
Pre
ferr
ed
Page 22
2017 State General ElectionResults and Statistics Report
21
Suburbs within District
Alkimos
Butler
Carabooda
Eglinton
Males 14,643 Jindalee
Females 15,738 Merriwa
Total 30,381 Quinns Rocks
Ridgewood
Two Rocks
Electors Habitation Yanchep
1 6,521
2 7,446
3 1,908
>3 749 Returning Officer
Total Habitations 16,624 Amber COOPER
Candidate Name Party
QUIGLEY, John Robert WA Labor
Candidate Name Party
QUIGLEY, John Robert WA Labor
Number of Electors on Roll
Number of Electors per Habitation
Elected Candidate for Butler
Previous Member
District of ButlerNorth Metropolitan RegionElector information correct as at 9 February 2017
Area (sq km)
163
This figure is the gazetted area and may include bodies of water
Page 23
2017
Sta
te G
ener
al E
lect
ion
Res
ults
and
Sta
tistic
s R
epor
t 22
3038
1
PP No.
Polli
ng P
lace
VAN
NIE
KER
K J
anSF
PVo
tes
SOM
MER
Ola
MB
PVo
tes
QU
IGLE
Y J
ohn
ALP
Vote
s
AITK
EN L
inda
LIB
Vote
s
JOU
BER
T R
yno
Fred
eric
kAC
PVo
tes
HO
DD
INO
TT S
usan
PHO
NVo
tes
SMIT
H R
onJM
WA
Vote
s
WEB
STER
Tom
GR
NVo
tes
Tota
lFo
rmal
Vote
s
Info
rmal
Vote
sTo
tal
Vote
s
1B
utle
r Prim
ary
Sch
ool
101
272,
066
707
6826
844
233
3,51
422
83,
742
2,50
671
.36%
1,00
628
.64%
2E
ast B
utle
r Prim
ary
Sch
ool
7423
1,32
142
354
154
1014
52,
204
107
2,31
11,
609
73.0
0%59
527
.00%
3G
umbl
osso
m C
omm
unity
Cen
tre41
2354
728
635
8912
122
1,15
569
1,22
473
463
.60%
420
36.4
0%4
Mer
riwa
Prim
ary
Sch
ool
9153
1,28
643
532
210
2515
72,
289
121
2,41
01,
624
70.9
5%66
529
.05%
5Q
uinn
s B
each
Prim
ary
Sch
ool
5919
931
419
4315
126
150
1,79
885
1,88
31,
200
66.7
4%59
833
.26%
6R
AA
FA E
stat
e - M
erriw
a32
1056
728
027
625
421,
025
531,
078
659
64.2
9%36
635
.71%
7Tw
o R
ocks
Prim
ary
Sch
ool
665
665
234
1212
72
501,
161
211,
182
798
68.7
9%36
231
.21%
8Ya
nche
p B
each
Prim
ary
Sch
ool
252
728
187
1586
1147
1,10
149
1,15
081
874
.30%
283
25.7
0%9
Yanc
hep
Dis
trict
Hig
h S
choo
l69
41,
226
358
3314
214
132
1,97
894
2,07
21,
468
74.2
2%51
025
.78%
558
166
9,33
73,
329
319
1,28
914
91,
078
16,2
2582
717
,052
11,4
1670
.38%
4,80
529
.62%
Abs
ent V
otes
162
341,
426
522
5028
233
307
2,81
618
83,
004
1,96
769
.85%
849
30.1
5%E
arly
Vot
es (b
y P
ost)
6011
1,07
751
448
249
2310
02,
082
962,
178
1,32
863
.78%
754
36.2
2%E
arly
Vot
es (I
n P
erso
n)10
020
1,45
060
321
299
1716
62,
676
104
2,78
01,
817
67.9
0%85
932
.10%
Pro
visi
onal
Vot
es2
020
60
20
333
235
2369
.70%
1030
.30%
Spe
cial
Inst
itutio
ns,
Hos
pita
ls &
Rem
otes
20
8232
110
25
134
914
390
67.1
6%44
32.8
4%32
665
4,05
51,
677
120
842
7558
17,
741
399
8,14
05,
225
67.5
0%2,
516
32.5
0%
884
231
13,3
925,
006
439
2,13
122
41,
659
23,9
661,
226
25,1
9216
,641
69.4
5%7,
321
30.5
5%
3.69
%0.
96%
55.8
8%20
.89%
1.83
%8.
89%
0.93
%6.
92%
100.
00%
VAN
NIE
KER
K J
anVo
tes
SOM
MER
Ola
Vote
s
QU
IGLE
Y J
ohn
Vote
s
AITK
EN L
inda
Vote
s
JOU
BER
T R
yno
Fred
eric
kVo
tes
HO
DD
INO
TT S
usan
Vote
s
SMIT
H R
onVo
tes
WEB
STER
Tom
Vote
s
Vote
sre
mai
ning
in c
ount
Exha
uste
dVo
tes
Tota
lFo
rmal
Vote
s88
423
113
,392
5,00
643
92,
131
224
1,65
923
,966
23,9
6627
2854
1813
3846
224
224
Tota
l91
125
913
,446
5,02
445
22,
169
1,70
523
,966
23,9
6675
7040
1126
3725
925
9To
tal
986
13,5
165,
064
463
2,19
51,
742
23,9
6623
,966
6267
227
6343
462
146
3To
tal
1,04
813
,583
5,29
12,
258
1,78
523
,965
123
,966
413
159
294
181
1,04
71
1,04
8To
tal
13,9
965,
450
2,55
21,
966
23,9
642
23,9
661,
357
273
336
1,96
61,
966
Tota
l15
,353
5,72
32,
888
23,9
642
23,9
661,
288
1,59
82,
886
22,
888
16,6
417,
321
23,9
624
23,9
66
69.4
5%30
.55%
Abso
lute
Maj
ority
= 1
1982
Dis
tric
t Tot
alH
OD
DIN
OTT
Exc
lude
d
Firs
t Pre
fere
nce
Vot
esSM
ITH
Exc
lude
d
SOM
MER
Exc
lude
d
JOU
BER
T Ex
clud
ed
VAN
NIE
KER
K E
xclu
ded
Tota
l Firs
t Pre
fere
nces
Vot
es
%To
tal V
alid
Vot
es
QU
IGLE
Y J
ohn
ALP
WEB
STER
Exc
lude
d
AITK
EN L
inda
LIB
But
ler E
lect
oral
Dis
tric
t
11 M
arch
201
7N
orth
Met
ropo
litan
Reg
ion
Two
Can
dida
te P
refe
rred
Vot
es
Pref
eren
ce D
istr
ibut
ion
John
Rob
ert Q
UIG
LEY
WA
Labo
rel
ecte
d as
the
mem
ber f
orB
UTL
ERw
ith a
maj
ority
of
9320
vot
es
Firs
t Pre
fere
nce
Vote
s Po
lled
for e
ach
Can
dida
te a
t eac
h Po
lling
Pla
ce
Vote
r Tur
nout
= 8
2.92
%In
form
al V
otes
= 4
.87%
Polli
ng P
lace
Tot
als
Dis
trib
utio
n of
Pre
fere
nces
Dec
lara
tion
and
Mob
ile V
otes
Tot
al
LIB
30
.55%
ALP
69
.45%
2 C
andi
date
Pre
ferr
ed
Page 24
2017 State General ElectionResults and Statistics Report
23
Suburbs within District
Beckenham
Bentley
Cannington
East Cannington
Males 13,043 Ferndale
Females 12,691 Langford
Total 25,734 Lynwood
Parkwood
Queens Park
Electors Habitation Riverton
1 6,263 Welshpool
2 5,427
3 1,718
>3 801 Returning Officer
Total Habitations 14,209 Cornel SCHEIBLING
Candidate Name Party
JOHNSTON, William Joseph WA Labor
Candidate Name Party
JOHNSTON, William Joseph WA Labor
Number of Electors on Roll
Number of Electors per Habitation
Elected Candidate for Armadale
Previous Member
District of CanningtonSouth Metropolitan Region
Elector information correct as at 9 February 2017
Area (sq km)
30
This figure is the gazetted area and may include bodies of water
Page 25
2017
Sta
te G
ener
al E
lect
ion
Res
ults
and
Sta
tistic
s R
epor
t 24
2573
4
PP No.
Polli
ng P
lace
JAC
OB
S J
esse
LIB
Vote
s
THO
MPS
ON
Elli
otG
RN
Vote
s
SMIT
H G
ary
ACP
Vote
s
VIR
K M
ohsi
n
Vote
s
RIH
ANI
Zen
aM
BP
Vote
s
JOH
NST
ON
Bill
ALP
Vote
s
BEZ
UID
ENH
OU
T R
ozan
ePH
ON
Vote
s
Tota
lFo
rmal
Vote
s
Info
rmal
Vote
sTo
tal
Vote
s
1Ba
nnis
ter C
reek
Prim
ary
Scho
ol30
613
443
917
636
751,
220
621,
282
403
33.0
6%81
666
.94%
2Be
cken
ham
Com
mun
ity C
hurc
h40
714
172
1929
1,01
816
31,
849
112
1,96
159
031
.93%
1,25
868
.07%
3Br
ookm
an P
rimar
y Sc
hool
259
122
4519
211,
057
631,
586
751,
661
359
22.6
5%1,
226
77.3
5%4
Foun
tain
Col
lege
201
8113
813
377
5975
228
780
262
34.8
9%48
965
.11%
5G
ibbs
Stre
et P
rimar
y Sc
hool
440
165
5129
381,
168
141
2,03
212
82,
160
601
29.6
1%1,
429
70.3
9%6
Lynw
ood
Chr
istia
n C
hurc
h27
195
526
342
256
905
3594
035
839
.60%
546
60.4
0%7
Park
woo
d Pr
imar
y Sc
hool
612
187
8715
241,
243
116
2,28
411
32,
397
783
34.2
8%1,
501
65.7
2%8
Seve
noak
s Se
nior
Col
lege
326
166
4623
2077
675
1,43
210
01,
532
434
30.3
3%99
769
.67%
9St
Nor
bert
Col
lege
234
7936
1721
593
391,
019
441,
063
296
29.2
5%71
670
.75%
3,05
61,
170
445
145
186
7,29
078
713
,079
697
13,7
764,
086
31.2
8%8,
978
68.7
2%Ab
sent
Vot
es67
334
997
2758
1,34
119
32,
738
183
2,92
194
534
.53%
1,79
265
.47%
Early
Vot
es (b
y Po
st)
444
106
5815
1792
315
81,
721
621,
783
592
34.4
2%1,
128
65.5
8%Ea
rly V
otes
(In
Pers
on)
786
225
9023
421,
908
234
3,30
814
33,
451
1,02
731
.06%
2,27
968
.94%
Prov
isio
nal V
otes
00
10
03
04
15
125
.00%
375
.00%
Spec
ial I
nstit
utio
ns,
Hos
pita
ls &
Rem
otes
110
10
09
021
021
1152
.38%
1047
.62%
1,91
468
024
765
117
4,18
458
57,
792
389
8,18
12,
576
33.0
8%5,
212
66.9
2%
4,97
01,
850
692
210
303
11,4
741,
372
20,8
711,
086
21,9
576,
662
31.9
5%14
,190
68.0
5%
23.8
1%8.
86%
3.32
%1.
01%
1.45
%54
.98%
6.57
%10
0.00
%
JAC
OB
S J
esse
Vote
s
THO
MPS
ON
Elli
otVo
tes
SMIT
H G
ary
Vote
s
VIR
K M
ohsi
nVo
tes
RIH
ANI
Zen
aVo
tes
JOH
NST
ON
Bill
Vote
s
BEZ
UID
ENH
OU
T R
ozan
eVo
tes
Vote
sre
mai
ning
in c
ount
Exha
uste
dVo
tes
Tota
lFo
rmal
Vote
s4,
970
1,85
069
221
030
311
,474
1,37
220
,871
20,8
7125
2436
5956
920
91
210
Tota
l4,
995
1,87
472
836
211
,530
1,38
120
,870
120
,871
6480
5711
145
357
536
2To
tal
5,05
91,
954
785
11,6
411,
426
20,8
656
20,8
7134
412
420
011
678
41
785
Tota
l5,
403
2,07
811
,841
1,54
220
,864
720
,871
760
249
524
1,53
39
1,54
2To
tal
6,16
32,
327
12,3
6520
,855
1620
,871
499
1,82
52,
324
32,
327
6,66
214
,190
20,8
5219
20,8
71
31.9
5%68
.05%
Abso
lute
Maj
ority
= 1
0427
Dis
tric
t Tot
al
Firs
t Pre
fere
nce
Vote
sVI
RK
Exc
lude
d
RIH
ANI E
xclu
ded
SMIT
H E
xclu
ded
BEZ
UID
ENH
OU
T Ex
clud
ed
Tota
l Firs
t Pre
fere
nces
Vot
es
%To
tal V
alid
Vot
es
JAC
OB
S J
esse
LIB
THO
MPS
ON
Exc
lude
d
JOH
NST
ON
Bill
ALP
Can
ning
ton
Elec
tora
l Dis
tric
t
11 M
arch
201
7So
uth
Met
ropo
litan
Reg
ion
Two
Can
dida
te P
refe
rred
Vot
es
Pref
eren
ce D
istr
ibut
ion
Will
iam
Jos
eph
JOH
NST
ON
WA
Lab
orel
ecte
d as
the
mem
ber f
orC
AN
NIN
GTO
Nw
ith a
maj
ority
of
7528
vot
es
Firs
t Pre
fere
nce
Vote
s Po
lled
for e
ach
Can
dida
te a
t eac
h Po
lling
Pla
ce
Vote
r Tur
nout
= 8
5.32
%In
form
al V
otes
= 4
.95%
Polli
ng P
lace
Tot
als
Dis
trib
utio
n of
Pre
fere
nces
Dec
lara
tion
and
Mob
ile V
otes
Tot
al
ALP
68
.05%
LIB
31
.95%
2 C
andi
date
Pre
ferr
ed
Page 26
2017 State General ElectionResults and Statistics Report
25
Suburbs within District
Carine
Duncraig
Gwelup
Karrinyup
Males 13,398 Marmion
Females 14,122 North Beach
Total 27,520 Sorrento
Trigg
Watermans Bay
Electors Habitation
1 3,613
2 6,791
3 1,893
>3 1,077 Returning Officer
Total Habitations 13,374 Martin BROWN
Candidate Name Party
KRSTICEVIC, Antonio Liberal Party
Candidate Name Party
KRSTICEVIC, Antonio Liberal Party
Number of Electors on Roll
Number of Electors per Habitation
Elected Candidate for Carine
Previous Member
District of CarineNorth Metropolitan RegionElector information correct as at 9 February 2017
Area (sq km)
23
This figure is the gazetted area and may include bodies of water
Page 27
2017
Sta
te G
ener
al E
lect
ion
Res
ults
and
Sta
tistic
s R
epor
t 26
2752
0
PP No.
Polli
ng P
lace
TSIR
IGO
TIS
Ath
anM
BP
Vote
s
POPH
AM T
erry
PHO
NVo
tes
ALM
ON
D A
nnet
teJM
WA
Vote
s
KR
STIC
EVIC
Ton
yLI
BVo
tes
REE
VES-
HEN
NES
SEY
Nad
ine
GR
NVo
tes
OW
ENS
And
rew
ALP
Vote
s
MO
RAN
Ray
ACP
Vote
s
Tota
lFo
rmal
Vote
s
Info
rmal
Vote
sTo
tal
Vote
s
1C
arin
e S
enio
r Hig
h S
choo
l38
133
371,
494
304
785
482,
839
772,
916
1,75
461
.78%
1,08
538
.22%
2D
aval
lia P
rimar
y S
choo
l23
6024
845
190
431
491,
622
551,
677
998
61.5
3%62
438
.47%
3D
uncr
aig
Prim
ary
Sch
ool
2997
2173
919
759
748
1,72
870
1,79
892
053
.27%
807
46.7
3%4
Dun
crai
g S
enio
r Hig
h S
choo
l7
186
176
4412
314
388
1740
520
653
.09%
182
46.9
1%5
Gle
ngar
ry P
rimar
y S
choo
l17
101
1578
620
361
743
1,78
288
1,87
093
652
.55%
845
47.4
5%6
Kar
rinyu
p P
rimar
y S
choo
l78
8633
1,04
929
257
548
2,16
165
2,22
61,
247
57.7
0%91
442
.30%
7M
arm
ion
Prim
ary
Sch
ool
3355
1279
615
439
516
1,46
146
1,50
788
760
.71%
574
39.2
9%8
Nor
th B
each
Com
mun
ity C
entre
832
744
395
165
975
918
777
495
65.2
2%26
434
.78%
9N
orth
Bea
ch P
rimar
y S
choo
l25
8118
866
218
453
441,
705
591,
764
1,02
660
.18%
679
39.8
2%10
Poy
nter
Prim
ary
Sch
ool
2880
211,
002
192
433
351,
791
701,
861
1,12
762
.93%
664
37.0
7%28
674
319
48,
196
1,88
94,
574
354
16,2
3656
516
,801
9,59
659
.11%
6,63
840
.89%
Abs
ent V
otes
7416
825
1,30
441
791
855
2,96
115
03,
111
1,60
154
.09%
1,35
945
.91%
Ear
ly V
otes
(by
Pos
t)21
137
381,
131
175
596
432,
141
105
2,24
61,
331
62.2
5%80
737
.75%
Ear
ly V
otes
(In
Per
son)
4318
130
1,38
924
273
547
2,66
762
2,72
91,
631
61.1
8%1,
035
38.8
2%P
rovi
sion
al V
otes
01
010
35
120
020
1365
.00%
735
.00%
Spe
cial
Inst
itutio
ns,
Hos
pita
ls &
Rem
otes
01
253
223
586
389
6170
.93%
2529
.07%
138
488
953,
887
839
2,27
715
17,
875
320
8,19
54,
637
58.9
2%3,
233
41.0
8%
424
1,23
128
912
,083
2,72
86,
851
505
24,1
1188
524
,996
14,2
3359
.05%
9,87
140
.95%
1.76
%5.
11%
1.20
%50
.11%
11.3
1%28
.41%
2.09
%10
0.00
%
TSIR
IGO
TIS
Ath
anVo
tes
POPH
AM T
erry
Vote
s
ALM
ON
D A
nnet
teVo
tes
KR
STIC
EVIC
Ton
yVo
tes
REE
VES-
HEN
NES
SEY
Nad
ine
Vote
s
OW
ENS
And
rew
Vote
s
MO
RAN
Ray
Vote
s
Vote
sre
mai
ning
in c
ount
Exha
uste
dVo
tes
Tota
lFo
rmal
Vote
s42
41,
231
289
12,0
832,
728
6,85
150
524
,111
24,1
1154
3366
5853
2328
72
289
Tota
l47
81,
264
12,1
492,
786
6,90
452
824
,109
224
,111
122
123
7693
6447
847
8To
tal
1,38
612
,272
2,86
26,
997
592
24,1
092
24,1
1111
732
362
8859
02
592
Tota
l1,
503
12,5
952,
924
7,08
524
,107
424
,111
968
254
279
1,50
12
1,50
3To
tal
13,5
633,
178
7,36
424
,105
624
,111
670
2,50
73,
177
13,
178
14,2
339,
871
24,1
047
24,1
11
59.0
5%40
.95%
Abso
lute
Maj
ority
= 1
2053
Dis
tric
t Tot
al
Firs
t Pre
fere
nce
Vot
esAL
MO
ND
Exc
lude
d
TSIR
IGO
TIS
Excl
uded
MO
RAN
Exc
lude
d
POPH
AM E
xclu
ded
Tota
l Firs
t Pre
fere
nces
Vot
es
%To
tal V
alid
Vot
es
KR
STIC
EVIC
Ton
yLI
B
REE
VES-
HEN
NES
SEY
Excl
uded
OW
ENS
And
rew
ALP
Car
ine
Elec
tora
l Dis
tric
t
11 M
arch
201
7N
orth
Met
ropo
litan
Reg
ion
Two
Can
dida
te P
refe
rred
Vot
es
Pref
eren
ce D
istr
ibut
ion
Anto
nio
KR
STIC
EVIC
Libe
ral P
arty
elec
ted
as th
e m
embe
r for
CAR
INE
with
a m
ajor
ity o
f43
62 v
otes
Firs
t Pre
fere
nce
Vote
s Po
lled
for e
ach
Can
dida
te a
t eac
h Po
lling
Pla
ce
Vote
r Tur
nout
= 9
0.83
%In
form
al V
otes
= 3
.54%
Polli
ng P
lace
Tot
als
Dis
trib
utio
n of
Pre
fere
nces
Dec
lara
tion
and
Mob
ile V
otes
Tot
al
ALP
40
.95%
LI
B
59.0
5%
2 C
andi
date
Pre
ferr
ed
Page 28
2017 State General ElectionResults and Statistics Report
27
Local Governments within District
Males 13,333
Females 13,001
Total 26,334
Electors Habitation
1 6,161
2 6,266
3 1,534
>3 681
Total Habitations 14,642
Shire of Beverley
Shire of Boddington
Shire of Brookton
Shire of Bruce Rock
Shire of Corrigin
Shire of Cunderdin
Shire of Dowerin
Shire of Goomalling
Shire of Kellerberrin
Shire of Kondinin
Shire of Koorda
Shire of Merredin
Shire of Mount Marshall
Shire of Mukinbudin
Shire of Narembeen
Shire of Northam
Shire of Nungarin
Shire of Pingelly
Shire of Quairading
Shire of Tammin
Shire of Trayning
Shire of Wandering
Shire of Westonia
Shire of Wongan-Ballidu
Shire of Wyalkatchem
Shire of Yilgarn
Shire of York
Returning Officer
Martin MORRIS
Candidate Name Party
DAVIES, Mia Jane THE NATIONALS
Candidate Name Party
DAVIES, Mia Jane THE NATIONALS
Number of Electors on Roll
Number of Electors per Habitation
Elected Candidate for Armadale
Previous Member
District of Central WheatbeltAgricultural Region
Elector information correct as at 9 February 2017
Area (sq km)
101,240
This figure is the gazetted area and may include bodies of water
Page 29
2017
Sta
te G
ener
al E
lect
ion
Res
ults
and
Sta
tistic
s R
epor
t 28
2633
4
PP No.
Polli
ng P
lace
REI
D S
haun
PHO
NVo
tes
DA
VIES
Mia
NA
TVo
tes
PEA
SE D
enni
sA
CP
Vote
s
GO
M E
stel
leIN
DVo
tes
TEM
PLEM
AN
Gar
yA
LPVo
tes
CR
AB
TREE
Bill
LIB
Vote
s
FOO
TE A
udre
yG
RN
Vote
s
REY
ND
ERS
Diff
SFP
Vote
s
Tota
lFo
rmal
Vote
s
Info
rmal
Vote
sTo
tal
Vote
s
1Ba
kers
Hill
Prim
ary
Scho
ol89
138
65
223
9925
3261
718
635
328
53.1
6%28
946
.84%
2Be
acon
Com
mun
ity R
esou
rce
Cen
tre5
350
05
91
358
058
5187
.93%
712
.07%
3Be
ncub
bin
Com
mun
ity R
esou
rce
Cen
tre9
886
18
52
412
34
127
110
89.4
3%13
10.5
7%4
Beve
rley
Less
er H
all
7938
013
715
368
2848
776
2580
156
372
.65%
212
27.3
5%5
Bodd
ingt
on S
hire
Cha
mbe
rs94
231
86
133
7322
4060
723
630
399
65.8
4%20
734
.16%
6Br
ookt
on D
istri
ct H
igh
Scho
ol36
204
152
7345
828
411
2743
830
173
.24%
110
26.7
6%7
Bruc
e R
ock
Shire
Hal
l18
200
72
4057
611
341
1936
027
680
.94%
6519
.06%
8C
orrig
in S
enio
r Citi
zens
Cen
tre41
359
31
4151
128
525
2254
746
788
.95%
5811
.05%
9C
unde
rdin
Dis
trict
Hig
h Sc
hool
4919
23
155
636
2839
710
407
318
80.1
0%79
19.9
0%10
Dow
erin
Les
ser H
all
2321
48
038
192
1832
220
342
267
82.9
2%55
17.0
8%11
Goo
mal
ling
Com
mun
ity R
esou
rce
Cen
tre34
209
34
4847
1111
367
2739
429
279
.56%
7520
.44%
12G
rass
Val
ley
Hal
l14
681
120
81
311
60
116
9380
.17%
2319
.83%
13G
reen
hills
Hal
l14
851
117
213
1315
56
161
126
81.2
9%29
18.7
1%14
Hyd
en C
omm
unity
Res
ourc
e C
entre
2813
82
016
216
1322
45
229
202
90.1
8%22
9.82
%15
Kelle
rber
rin M
emor
ial H
all
6530
39
111
345
625
567
2158
841
473
.02%
153
26.9
8%16
Kond
inin
Prim
ary
Scho
ol12
954
033
44
916
19
170
117
72.6
7%44
27.3
3%17
Koor
da E
mer
genc
y C
entre
1813
61
025
104
820
24
206
169
83.6
6%33
16.3
4%18
Mec
kerin
g Pr
imar
y Sc
hool
1040
01
1214
03
802
8266
82.5
0%14
17.5
0%19
Mer
redi
n C
omm
unity
Res
ourc
e C
entre
4520
84
374
4115
3742
715
442
318
74.4
7%10
925
.53%
20M
erre
din
Seni
or C
entre
1159
100
239
33
118
612
492
77.9
7%26
22.0
3%21
Muk
inbu
din
Shire
Cha
mbe
rs18
135
310
1320
1311
241
925
021
489
.17%
2610
.83%
22N
arem
been
Dis
trict
Hig
h Sc
hool
5015
26
127
471
1429
87
305
253
85.4
7%43
14.5
3%23
Nor
tham
Mem
oria
l Hal
l11
531
911
630
968
4044
912
5496
651
856
.86%
393
43.1
4%24
Nor
tham
Prim
ary
Scho
ol85
324
347
255
7033
5085
857
915
520
60.6
8%33
739
.32%
25N
unga
rin P
rimar
y Sc
hool
553
00
90
14
721
7361
84.7
2%11
15.2
8%26
Ping
elly
Tow
n H
all
4823
05
398
5213
2847
721
498
334
70.0
2%14
329
.98%
27Q
uaira
ding
Tow
n H
all
3827
04
067
488
2445
912
471
370
80.7
9%88
19.2
1%28
Sout
hern
Cro
ss C
omm
unity
Cen
tre69
155
12
6152
243
385
2340
829
576
.62%
9023
.38%
29Ta
mm
in L
esse
r Hal
l18
104
10
2411
35
166
817
413
581
.33%
3118
.67%
30Tr
ayni
ng C
omm
unity
Cen
tre9
792
233
94
714
510
155
104
71.7
2%41
28.2
8%31
Wan
derin
g Pr
imar
y Sc
hool
1297
73
1821
617
181
1920
014
580
.11%
3619
.89%
32W
esto
nia
Shire
Offi
ce2
671
114
61
294
498
7882
.98%
1617
.02%
33W
onga
n H
ills
Com
mun
ity R
esou
rce
Cen
tre57
353
74
5575
1231
594
2962
349
282
.83%
102
17.1
7%34
Wun
dow
ie P
rimar
y Sc
hool
7587
118
222
7541
3355
246
598
241
43.6
6%31
156
.34%
35W
yalk
atch
em C
omm
unity
Res
ourc
e C
entre
1915
57
032
124
1324
212
254
196
80.9
9%46
19.0
1%36
York
Dis
trict
Hig
h Sc
hool
155
566
468
363
221
7149
1,47
975
1,55
498
766
.78%
491
33.2
2%1,
469
6,52
827
881
2,75
01,
496
407
740
13,7
4965
014
,399
9,91
272
.14%
3,82
827
.86%
Abse
nt V
otes
251
1,02
357
1844
029
511
915
22,
355
842,
439
1,66
670
.77%
688
29.2
3%Ea
rly V
otes
(by
Post
)27
993
730
1727
524
448
821,
912
731,
985
1,49
178
.10%
418
21.9
0%Ea
rly V
otes
(In
Pers
on)
558
1,96
975
3480
744
510
617
54,
169
143
4,31
23,
029
72.7
1%1,
137
27.2
9%Pr
ovis
iona
l Vot
es6
103
04
31
330
232
2376
.67%
723
.33%
Spec
ial I
nstit
utio
ns,
Hos
pita
ls &
Rem
otes
822
50
2113
36
782
8045
57.6
9%33
42.3
1%1,
102
3,96
117
069
1,54
71,
000
277
418
8,54
430
48,
848
6,25
473
.26%
2,28
326
.74%
2,57
110
,489
448
150
4,29
72,
496
684
1,15
822
,293
954
23,2
4716
,166
72.5
7%6,
111
27.4
3%
11.5
3%47
.05%
2.01
%0.
67%
19.2
8%11
.20%
3.07
%5.
19%
100.
00%
REI
D S
haun
Vote
s
DA
VIES
Mia
Vote
s
PEA
SE D
enni
sVo
tes
GO
M E
stel
leVo
tes
TEM
PLEM
AN
Gar
yVo
tes
CR
AB
TREE
Bill
Vote
s
FOO
TE A
udre
yVo
tes
REY
ND
ERS
Diff
Vote
s
Vote
sre
mai
ning
in c
ount
Exha
uste
dVo
tes
Tota
lFo
rmal
Vote
s2,
571
10,4
8944
815
04,
297
2,49
668
41,
158
22,2
9322
,293
1821
2035
525
2615
015
0To
tal
2,58
910
,510
468
4,33
22,
501
709
1,18
422
,293
22,2
9374
142
3814
319
5246
846
8To
tal
2,66
310
,652
4,37
02,
644
728
1,23
622
,293
22,2
9344
156
354
4113
272
71
728
Tota
l2,
707
10,8
084,
724
2,68
51,
368
22,2
921
22,2
9346
039
227
224
31,
367
11,
368
Tota
l3,
167
11,2
004,
996
2,92
822
,291
222
,293
637
2,01
926
92,
925
32,
928
Tota
l3,
804
13,2
195,
265
22,2
885
22,2
932,
947
846
3,79
311
3,80
416
,166
6,11
122
,277
1622
,293
72.5
7%27
.43%
Abs
olut
e M
ajor
ity =
111
39
Dis
tric
t Tot
alR
EID
Exc
lude
d
Firs
t Pre
fere
nce
Vote
sG
OM
Exc
lude
d
PEA
SE E
xclu
ded
FOO
TE E
xclu
ded
REY
ND
ERS
Excl
uded
Tota
l Firs
t Pre
fere
nces
Vot
es
%To
tal V
alid
Vot
es
DA
VIES
Mia
NA
T
CR
AB
TREE
Exc
lude
d
TEM
PLEM
AN
Gar
yA
LP
Cen
tral
Whe
atbe
lt El
ecto
ral D
istr
ict
11 M
arch
201
7Ag
ricul
tura
l Reg
ion
Two
Can
dida
te P
refe
rred
Vot
es
Pref
eren
ce D
istr
ibut
ion
Mia
Jan
e D
AVIE
STH
E N
ATIO
NAL
Sel
ecte
d as
the
mem
ber f
orC
ENTR
AL W
HEA
TBEL
Tw
ith a
maj
ority
of
1005
5 vo
tes
Firs
t Pre
fere
nce
Vote
s Po
lled
for e
ach
Can
dida
te a
t eac
h Po
lling
Pla
ce
Vote
r Tur
nout
= 8
8.28
%In
form
al V
otes
= 4
.1%
Polli
ng P
lace
Tot
als
Dis
trib
utio
n of
Pre
fere
nces
Dec
lara
tion
and
Mob
ile V
otes
Tot
al
ALP
27
.43%
NA
T 72
.57%
2 C
andi
date
Pre
ferr
ed
Page 30
2017 State General ElectionResults and Statistics Report
29
Suburbs within District
Churchlands
City Beach
Floreat
Glendalough
Males 13,030 Wembley
Females 13,835 Wembley Downs
Total 26,865 West Leederville
Woodlands
Electors Habitation
1 4,886
2 6,088
3 1,651
>3 1,113 Returning Officer
Total Habitations 13,738 Julieen DUNGEY
Candidate Name Party
L'ESTRANGE, Sean Kimberley Liberal Party
Candidate Name Party
L'ESTRANGE, Sean Kimberley Liberal Party
Number of Electors on Roll
Number of Electors per Habitation
Elected Candidate for Churchlands
Previous Member
District of ChurchlandsNorth Metropolitan RegionElector information correct as at 9 February 2017
Area (sq km)
25
This figure is the gazetted area and may include bodies of water
Page 31
2017
Sta
te G
ener
al E
lect
ion
Res
ults
and
Sta
tistic
s R
epor
t 30
2686
5
PP No.
Polli
ng P
lace
L'ES
TRAN
GE
Sea
nLI
BVo
tes
BIV
OLT
SIS
Jim IND
Vote
s
PHIL
LIPS
Pau
lAC
PVo
tes
GU
RAK
Joa
nna
GR
NVo
tes
GAR
BER
Jac
kJM
WA
Vote
s
GIL
L D
alje
etM
BP
Vote
s
LILB
UR
NE
Pau
lAL
PVo
tes
Tota
lFo
rmal
Vote
s
Info
rmal
Vote
sTo
tal
Vote
s
1C
hurc
hlan
ds P
rimar
y S
choo
l1,
183
9652
227
2547
430
2,06
070
2,13
01,
363
66.1
7%69
733
.83%
2C
ity B
each
Prim
ary
Sch
ool
894
489
115
1312
197
1,28
846
1,33
497
175
.45%
316
24.5
5%3
Flor
eat P
ark
Prim
ary
Sch
ool
857
908
172
319
222
1,37
135
1,40
698
371
.70%
388
28.3
0%4
Flor
eat P
rimar
y - E
arly
Edu
catio
n C
entre
476
5611
7210
1113
276
826
794
540
70.4
0%22
729
.60%
5K
apin
ara
Prim
ary
Sch
ool
958
6818
147
1517
163
1,38
636
1,42
21,
073
77.4
2%31
322
.58%
6La
ke M
onge
r Prim
ary
Sch
ool
456
5028
199
819
428
1,18
855
1,24
354
645
.96%
642
54.0
4%7
Wem
bley
Dow
ns P
rimar
y S
choo
l1,
133
8653
278
3436
480
2,10
070
2,17
01,
304
62.1
0%79
637
.90%
8W
embl
ey P
rimar
y S
choo
l1,
026
133
3133
712
3749
02,
066
622,
128
1,22
759
.42%
838
40.5
8%9
Wes
t Lee
derv
ille
Prim
ary
Sch
ool
727
4831
284
1523
393
1,52
149
1,57
086
757
.00%
654
43.0
0%10
Wes
tCity
Chu
rch
- Wem
bley
450
5112
112
715
195
842
2586
752
562
.35%
317
37.6
5%11
Woo
dlan
ds P
rimar
y S
choo
l1,
087
116
5223
930
3050
92,
063
672,
130
1,27
962
.00%
784
38.0
0%9,
247
842
305
2,18
217
226
63,
639
16,6
5354
117
,194
10,6
7864
.13%
5,97
235
.87%
Abs
ent V
otes
1,06
058
6448
418
3459
92,
317
932,
410
1,23
353
.26%
1,08
246
.74%
Ear
ly V
otes
(by
Pos
t)1,
287
7944
198
3622
468
2,13
488
2,22
21,
447
67.8
7%68
532
.13%
Ear
ly V
otes
(In
Per
son)
1,00
047
5622
415
2452
91,
895
551,
950
1,13
359
.79%
762
40.2
1%P
rovi
sion
al V
otes
70
12
00
414
014
857
.14%
642
.86%
Spe
cial
Inst
itutio
ns,
Hos
pita
ls &
Rem
otes
240
3011
134
271
371
1038
127
975
.20%
9224
.80%
3,59
421
417
692
173
821,
671
6,73
124
66,
977
4,10
060
.95%
2,62
739
.05%
12,8
411,
056
481
3,10
324
534
85,
310
23,3
8478
724
,171
14,7
7863
.22%
8,59
936
.78%
54.9
1%4.
52%
2.06
%13
.27%
1.05
%1.
49%
22.7
1%10
0.00
%
L'ES
TRAN
GE
Sea
nVo
tes
BIV
OLT
SIS
Jim
Vote
s
PHIL
LIPS
Pau
lVo
tes
GU
RAK
Joa
nna
Vote
s
GAR
BER
Jac
kVo
tes
GIL
L D
alje
etVo
tes
LILB
UR
NE
Pau
lVo
tes
Vote
sre
mai
ning
in c
ount
Exha
uste
dVo
tes
Tota
lFo
rmal
Vote
s12
,841
1,05
648
13,
103
245
348
5,31
023
,384
23,3
8445
5614
3659
3524
524
5To
tal
12,8
861,
112
495
3,13
940
75,
345
23,3
8423
,384
7312
838
9078
407
407
Tota
l12
,959
1,24
053
33,
229
5,42
323
,384
23,3
8429
512
935
7253
12
533
Tota
l13
,254
1,36
93,
264
5,49
523
,382
223
,384
765
337
265
1,36
72
1,36
9To
tal
14,0
193,
601
5,76
023
,380
423
,384
759
2,83
93,
598
33,
601
14,7
788,
599
23,3
777
23,3
84
63.2
2%36
.78%
Abso
lute
Maj
ority
= 1
1689
Dis
tric
t Tot
al
Firs
t Pre
fere
nce
Vot
esG
ARB
ER E
xclu
ded
GIL
L Ex
clud
ed
PHIL
LIPS
Exc
lude
d
BIV
OLT
SIS
Excl
uded
Tota
l Firs
t Pre
fere
nces
Vot
es
%To
tal V
alid
Vot
es
L'ES
TRAN
GE
Sea
nLI
B
GU
RAK
Exc
lude
d
LILB
UR
NE
Pau
lAL
P
Chu
rchl
ands
Ele
ctor
al D
istr
ict
11 M
arch
201
7N
orth
Met
ropo
litan
Reg
ion
Two
Can
dida
te P
refe
rred
Vot
es
Pref
eren
ce D
istr
ibut
ion
Sean
Kim
berle
y L'
ESTR
ANG
ELi
bera
l Par
tyel
ecte
d as
the
mem
ber f
orC
HU
RC
HLA
ND
Sw
ith a
maj
ority
of
6179
vot
es
Firs
t Pre
fere
nce
Vote
s Po
lled
for e
ach
Can
dida
te a
t eac
h Po
lling
Pla
ce
Vote
r Tur
nout
= 8
9.97
%In
form
al V
otes
= 3
.26%
Polli
ng P
lace
Tot
als
Dis
trib
utio
n of
Pre
fere
nces
Dec
lara
tion
and
Mob
ile V
otes
Tot
al
ALP
36
.78%
LI
B
63.2
2%
2 C
andi
date
Pre
ferr
ed
Page 32
2017 State General ElectionResults and Statistics Report
31
Suburbs within District
Beeliar
Cockburn Central
Coogee
Munster
Males 13,733 South Lake
Females 14,181 Spearwood
Total 27,914 Success
Yangebup
Electors Habitation
1 4,889
2 6,446
3 1,923
>3 1,010 Returning Officer
Total Habitations 14,268 Jeff CLARK
Candidate Name Party
LOGAN, Francis Michael WA Labor
Candidate Name Party
LOGAN, Francis Michael WA Labor
Number of Electors on Roll
Number of Electors per Habitation
Elected Candidate for Cockburn
Previous Member
District of CockburnSouth Metropolitan Region
Elector information correct as at 9 February 2017
Area (sq km)
45
This figure is the gazetted area and may include bodies of water
Page 33
2017
Sta
te G
ener
al E
lect
ion
Res
ults
and
Sta
tistic
s R
epor
t 32
2791
4
PP No.
Polli
ng P
lace
RAJ
A-YO
GAM
Lav
inLI
BVo
tes
RO
OSE
Edw
ard
ACP
Vote
s
POR
TELL
I S
teve
IND
Vote
s
LOG
AN F
ran
ALP
Vote
s
McH
UG
H C
onno
rM
BP
Vote
s
STAN
FIEL
D E
rinn
FLU
XVo
tes
HEW
ITT
Sha
nnon
GR
NVo
tes
Tota
lFo
rmal
Vote
s
Info
rmal
Vote
sTo
tal
Vote
s
1B
eelia
r Prim
ary
Sch
ool
413
3775
855
1433
135
1,56
294
1,65
650
832
.56%
1,05
267
.44%
2C
ooge
e P
rimar
y S
choo
l84
841
881,
128
2727
177
2,33
618
12,
517
987
42.2
5%1,
349
57.7
5%3
Jand
akot
Prim
ary
Sch
ool
447
4999
1,01
512
1616
51,
803
601,
863
565
31.3
4%1,
238
68.6
6%4
Mat
er C
hris
ti C
atho
lic P
rimar
y S
choo
l11
85
2223
06
428
413
2043
313
231
.96%
281
68.0
4%5
New
ton
Prim
ary
Sch
ool
458
3366
1,05
330
1414
61,
800
152
1,95
254
630
.33%
1,25
469
.67%
6S
outh
Coo
gee
Prim
ary
Sch
ool
528
4114
51,
049
1715
107
1,90
212
32,
025
659
34.6
5%1,
243
65.3
5%7
Spe
arw
ood
Prim
ary
Sch
ool
157
719
405
24
8968
371
754
177
25.9
2%50
674
.08%
8S
t Jer
ome'
s S
choo
l27
550
2844
25
460
864
6092
433
538
.77%
529
61.2
3%9
St M
icha
el C
hurc
h18
310
1224
06
741
499
3453
321
543
.09%
284
56.9
1%10
Suc
cess
Prim
ary
Sch
ool
398
5110
168
416
1714
01,
407
771,
484
530
37.6
7%87
762
.33%
11Ya
ngeb
up P
rimar
y S
choo
l38
160
931,
121
3431
209
1,92
911
32,
042
504
26.1
5%1,
423
73.8
5%4,
206
384
748
8,22
216
917
21,
297
15,1
9898
516
,183
5,15
833
.95%
10,0
3666
.05%
Abs
ent V
otes
710
8211
51,
346
4627
367
2,69
318
52,
878
919
34.1
8%1,
770
65.8
2%E
arly
Vot
es (b
y P
ost)
456
3210
379
515
1911
01,
530
401,
570
567
37.0
8%96
262
.92%
Ear
ly V
otes
(In
Per
son)
1,00
792
228
2,08
534
4529
53,
786
139
3,92
51,
255
33.1
6%2,
530
66.8
4%P
rovi
sion
al V
otes
00
03
00
25
38
00.
00%
310
0.00
%S
peci
al In
stitu
tions
, H
ospi
tals
& R
emot
es10
20
90
10
222
2412
54.5
5%10
45.4
5%2,
183
208
446
4,23
895
9277
48,
036
369
8,40
52,
753
34.2
9%5,
275
65.7
1%
6,38
959
21,
194
12,4
6026
426
42,
071
23,2
341,
354
24,5
887,
911
34.0
7%15
,311
65.9
3%
27.5
0%2.
55%
5.14
%53
.63%
1.14
%1.
14%
8.91
%10
0.00
%
RAJ
A-YO
GAM
Lav
inVo
tes
RO
OSE
Edw
ard
Vote
s
POR
TELL
I S
teve
Vote
s
LOG
AN F
ran
Vote
s
McH
UG
H C
onno
rVo
tes
STAN
FIEL
D E
rinn
Vote
s
HEW
ITT
Sha
nnon
Vote
s
Vote
sre
mai
ning
in c
ount
Exha
uste
dVo
tes
Tota
lFo
rmal
Vote
s6,
389
592
1,19
412
,460
264
264
2,07
123
,234
23,2
3420
1635
4469
7926
31
264
Tota
l6,
409
608
1,22
912
,504
333
2,15
023
,233
123
,234
5422
116
7962
333
333
Tota
l6,
463
630
1,34
512
,583
2,21
223
,233
123
,234
273
161
136
5862
82
630
Tota
l6,
736
1,50
612
,719
2,27
023
,231
323
,234
679
489
334
1,50
24
1,50
6To
tal
7,41
513
,208
2,60
423
,227
723
,234
496
2,10
32,
599
52,
604
7,91
115
,311
23,2
2212
23,2
34
34.0
7%65
.93%
Abso
lute
Maj
ority
= 1
1612
Dis
tric
t Tot
al
Firs
t Pre
fere
nce
Vot
esST
ANFI
ELD
Exc
lude
d
McH
UG
H E
xclu
ded
RO
OSE
Exc
lude
d
POR
TELL
I Exc
lude
d
Tota
l Firs
t Pre
fere
nces
Vot
es
%To
tal V
alid
Vot
es
RAJ
A-YO
GAM
Lav
inLI
B
HEW
ITT
Excl
uded
LOG
AN F
ran
ALP
Coc
kbur
n El
ecto
ral D
istr
ict
11 M
arch
201
7So
uth
Met
ropo
litan
Reg
ion
Two
Can
dida
te P
refe
rred
Vot
es
Pref
eren
ce D
istr
ibut
ion
Fran
cis
Mic
hael
LO
GAN
WA
Labo
rel
ecte
d as
the
mem
ber f
orC
OC
KB
UR
Nw
ith a
maj
ority
of
7400
vot
es
Firs
t Pre
fere
nce
Vote
s Po
lled
for e
ach
Can
dida
te a
t eac
h Po
lling
Pla
ce
Vote
r Tur
nout
= 8
8.08
%In
form
al V
otes
= 5
.51%
Polli
ng P
lace
Tot
als
Dis
trib
utio
n of
Pre
fere
nces
Dec
lara
tion
and
Mob
ile V
otes
Tot
al
ALP
65
.93%
LIB
34
.07%
2 C
andi
date
Pre
ferr
ed
Page 34
2017 State General ElectionResults and Statistics Report
33
Local Governments within District
Males 14,226
Shire of Capel
Shire of Collie
Shire of Dardanup
Shire of Donnybrook-Balingup
Shire of Harvey
Females 14,510
Total 28,736
Electors Habitation
1 4,936
2 7,170
3 1,954
>3 797 Returning Officer
Total Habitations 14,857 Wayne WEBSTER
Candidate Name Party
MURRAY, Michael Philip WA Labor
Candidate Name Party
MURRAY, Michael Philip WA Labor
Number of Electors on Roll
Number of Electors per Habitation
Elected Candidate for Collie-Preston
Previous Member
District of Collie-PrestonSouth West Region
Elector information correct as at 9 February 2017
Area (sq km)
4,344
This figure is the gazetted area and may include bodies of water
Page 35
2017
Sta
te G
ener
al E
lect
ion
Res
ults
and
Sta
tistic
s R
epor
t 34
2873
6
PP No.
Polli
ng P
lace
HYL
AND
Don
IND
Vote
s
TAYL
ER G
ordo
nG
RN
Vote
s
WAR
NO
CK
Mon
ique
NAT
Vote
s
HAR
VER
SON
Ely
sia
LIB
Vote
s
THO
MAS
Clin
ton
SFP
Vote
s
MU
RR
AY M
ick
ALP
Vote
s
SCIB
ILIA
Lou
ieIN
DVo
tes
MIL
LER
Dav
idPH
ON
Vote
s
Tota
lFo
rmal
Vote
s
Info
rmal
Vote
sTo
tal
Vote
s
1A
llans
on P
rimar
y S
choo
l2
620
64
181
15
225
523
031
13.7
8%19
486
.22%
2A
ustra
lind
Com
mun
ity H
all
1453
148
243
4550
810
911,
112
461,
158
443
39.8
7%66
860
.13%
3B
alin
gup
Prim
ary
Sch
ool
374
8070
1410
67
2037
47
381
149
39.8
4%22
560
.16%
4B
oyan
up P
rimar
y S
choo
l5
4712
917
642
345
966
819
3385
234
942
.61%
470
57.3
9%5
Cap
el C
omm
unity
Cen
tre17
113
225
284
7767
324
138
1,55
171
1,62
256
736
.63%
981
63.3
7%6
Clif
ton
Par
k P
rimar
y S
choo
l1
3090
107
1523
63
4853
035
565
219
41.3
2%31
158
.68%
7C
ollie
Sen
ior H
igh
Sch
ool
06
2428
1025
92
1234
123
364
4713
.78%
294
86.2
2%8
Dar
danu
p H
all
444
188
234
2728
012
5284
133
874
436
51.8
4%40
548
.16%
9D
onny
broo
k S
oldi
ers
Mem
oria
l Hal
l32
9328
342
486
594
7118
01,
763
611,
824
848
48.2
1%91
151
.79%
10E
aton
Com
mun
ity C
olle
ge19
8027
637
712
61,
139
2122
12,
259
111
2,37
075
833
.58%
1,49
966
.42%
11E
aton
Hal
l18
5418
225
056
704
1514
51,
424
731,
497
511
35.9
1%91
264
.09%
12Fe
rgus
on H
all
14
6931
735
09
156
816
493
59.6
2%63
40.3
8%13
Gel
orup
Com
mun
ity C
entre
1182
206
316
5942
010
871,
191
511,
242
574
48.1
9%61
751
.81%
14K
irup
Hal
l4
2149
6416
7815
1426
111
272
123
47.1
3%13
852
.87%
15M
arga
retta
Wils
on C
entre
416
6354
1876
38
6198
768
1,05
512
212
.37%
864
87.6
3%16
Nor
th C
ollie
Hal
l1
845
457
588
328
725
3175
699
13.6
6%62
686
.34%
17R
iver
Val
ley
Prim
ary
Sch
ool
618
8282
2117
61
3442
016
436
171
40.7
1%24
959
.29%
18W
ilson
Par
k P
rimar
y S
choo
l0
37
62
101
15
125
813
313
10.4
8%11
189
.52%
19Ya
bber
up H
all
19
4042
810
244
1526
111
272
100
38.4
6%16
061
.54%
143
761
2,20
62,
839
640
7,28
825
71,
231
15,3
6570
216
,067
5,65
336
.82%
9,69
863
.18%
Abs
ent V
otes
4019
426
344
612
71,
028
3222
42,
354
982,
452
859
36.5
2%1,
493
63.4
8%E
arly
Vot
es (b
y P
ost)
1456
217
323
4150
218
128
1,29
974
1,37
359
645
.88%
703
54.1
2%E
arly
Vot
es (I
n P
erso
n)31
154
606
776
166
3,37
940
481
5,63
320
85,
841
1,57
427
.96%
4,05
572
.04%
Pro
visi
onal
Vot
es2
41
41
120
428
432
1346
.43%
1553
.57%
Spe
cial
Inst
itutio
ns,
Hos
pita
ls &
Rem
otes
01
1320
037
01
720
7233
45.8
3%39
54.1
7%87
409
1,10
01,
569
335
4,95
890
838
9,38
638
49,
770
3,07
532
.78%
6,30
567
.22%
230
1,17
03,
306
4,40
897
512
,246
347
2,06
924
,751
1,08
625
,837
8,72
835
.29%
16,0
0364
.71%
0.93
%4.
73%
13.3
6%17
.81%
3.94
%49
.48%
1.40
%8.
36%
100.
00%
HYL
AND
Don
Vote
s
TAYL
ER G
ordo
nVo
tes
WAR
NO
CK
Mon
ique
Vote
s
HAR
VER
SON
Ely
sia
Vote
s
THO
MAS
Clin
ton
Vote
s
MU
RR
AY M
ick
Vote
s
SCIB
ILIA
Lou
ieVo
tes
MIL
LER
Dav
idVo
tes
Vote
sre
mai
ning
in c
ount
Exha
uste
dVo
tes
Tota
lFo
rmal
Vote
s23
01,
170
3,30
64,
408
975
12,2
4634
72,
069
24,7
5124
,751
7723
1515
3052
1722
91
230
Tota
l1,
247
3,32
94,
423
990
12,2
7639
92,
086
24,7
501
24,7
5179
4637
7396
6639
72
399
Tota
l1,
326
3,37
54,
460
1,06
312
,372
2,15
224
,748
324
,751
113
141
129
344
333
1,06
03
1,06
3To
tal
1,43
93,
516
4,58
912
,716
2,48
524
,745
624
,751
403
9387
070
1,43
63
1,43
9To
tal
3,91
94,
682
13,5
862,
555
24,7
429
24,7
5191
876
985
92,
546
92,
555
Tota
l4,
837
5,45
114
,445
24,7
3318
24,7
513,
277
1,55
84,
835
24,
837
8,72
816
,003
24,7
3120
24,7
51
35.2
9%64
.71%
Abso
lute
Maj
ority
= 1
2366
Dis
tric
t Tot
alW
ARN
OC
K E
xclu
ded
Firs
t Pre
fere
nce
Vot
esH
YLAN
D E
xclu
ded
SCIB
ILIA
Exc
lude
d
THO
MAS
Exc
lude
d
TAYL
ER E
xclu
ded
Tota
l Firs
t Pre
fere
nces
Vot
es
%To
tal V
alid
Vot
es
HAR
VER
SON
Ely
sia
LIB
MIL
LER
Exc
lude
d
MU
RR
AY M
ick
ALP
Col
lie-P
rest
on E
lect
oral
Dis
tric
t
11 M
arch
201
7So
uth
Wes
t Reg
ion
Two
Can
dida
te P
refe
rred
Vot
es
Pref
eren
ce D
istr
ibut
ion
Mic
hael
Phi
lip M
UR
RAY
WA
Labo
rel
ecte
d as
the
mem
ber f
orC
OLL
IE-P
RES
TON
with
a m
ajor
ity o
f72
75 v
otes
Firs
t Pre
fere
nce
Vote
s Po
lled
for e
ach
Can
dida
te a
t eac
h Po
lling
Pla
ce
Vote
r Tur
nout
= 8
9.91
%In
form
al V
otes
= 4
.2%
Polli
ng P
lace
Tot
als
Dis
trib
utio
n of
Pre
fere
nces
Dec
lara
tion
and
Mob
ile V
otes
Tot
al
ALP
64
.71%
LIB
35
.29%
2 C
andi
date
Pre
ferr
ed
Page 36
2017 State General ElectionResults and Statistics Report
35
Suburbs within District
City Beach
Claremont
Cottesloe
Dalkeith
Males 13,045 Mosman Park
Females 14,362 Mt Claremont
Total 27,407 North Fremantle
Peppermint Grove
Swanbourne
Electors Habitation
1 5,592
2 5,908
3 1,766
>3 1,061 Returning Officer
Total Habitations 14,327 Jayne MALONE
Candidate Name Party
BARNETT, Colin James Liberal Party
Candidate Name Party
BARNETT, Colin James Liberal Party
Number of Electors on Roll
Number of Electors per Habitation
Elected Candidate for Cottesloe
Previous Member
District of CottesloeNorth Metropolitan RegionElector information correct as at 9 February 2017
Area (sq km)
35
This figure is the gazetted area and may include bodies of water
Page 37
2017
Sta
te G
ener
al E
lect
ion
Res
ults
and
Sta
tistic
s R
epor
t 36
2740
7
PP No.
Polli
ng P
lace
LAN
CEE
Alid
aIN
DVo
tes
POPP
AS N
icol
eM
BP
Vote
s
BO
LAN
D G
reg
GR
NVo
tes
BAR
NET
T C
olin
LIB
Vote
s
MAL
OV
Dm
itry
IND
Vote
s
GR
OEN
EWAL
D R
iaan
ACP
Vote
s
WAT
SON
Mic
hael
Vote
s
CO
LLIN
S C
aitli
nAL
PVo
tes
Tota
lFo
rmal
Vote
s
Info
rmal
Vote
sTo
tal
Vote
s
1C
otte
sloe
Civ
ic C
entre
Les
ser H
all
152
1025
71,
253
717
2140
72,
124
612,
185
1,38
765
.36%
735
34.6
4%2
Cot
tesl
oe P
rimar
y S
choo
l10
418
173
1,07
58
513
326
1,72
267
1,78
91,
182
68.6
8%53
931
.32%
3Fr
eshw
ater
Bay
Prim
ary
Sch
ool
110
2222
41,
225
921
1836
61,
995
942,
089
1,35
667
.97%
639
32.0
3%4
Mos
man
Par
k P
rimar
y S
choo
l85
1323
969
28
1910
414
1,48
070
1,55
080
354
.26%
677
45.7
4%5
Mou
nt C
lare
mon
t Prim
ary
Sch
ool
166
1831
11,
419
1341
1959
02,
577
962,
673
1,59
862
.08%
976
37.9
2%6
Nor
th C
otte
sloe
Prim
ary
Sch
ool
135
1323
41,
192
66
1541
52,
016
702,
086
1,31
165
.09%
703
34.9
1%7
Nor
th F
rem
antle
Prim
ary
Sch
ool
677
184
549
99
254
31,
370
431,
413
606
44.3
0%76
255
.70%
8S
aint
Hild
a's
Ang
lican
Sch
ool f
or G
irls
- Chi
dley
Cam
pus
6810
9379
42
109
251
1,23
731
1,26
886
369
.77%
374
30.2
3%9
Sw
anbo
urne
Prim
ary
Sch
ool
132
1021
21,
335
710
1243
42,
152
522,
204
1,47
068
.37%
680
31.6
3%1,
019
121
1,92
79,
534
6913
811
93,
746
16,6
7358
417
,257
10,5
7663
.48%
6,08
536
.52%
Abs
ent V
otes
107
4047
81,
369
1144
1562
72,
691
942,
785
1,58
959
.09%
1,10
040
.91%
Ear
ly V
otes
(by
Pos
t)64
1696
672
714
1528
71,
171
541,
225
747
63.8
5%42
336
.15%
Ear
ly V
otes
(In
Per
son)
121
1931
11,
530
1528
2558
92,
638
652,
703
1,70
464
.62%
933
35.3
8%P
rovi
sion
al V
otes
11
16
01
02
121
1310
83.3
3%2
16.6
7%S
peci
al In
stitu
tions
, H
ospi
tals
& R
emot
es20
113
153
11
229
220
2124
117
378
.64%
4721
.36%
313
7789
93,
730
3488
571,
534
6,73
223
56,
967
4,22
362
.77%
2,50
537
.23%
1,33
219
82,
826
13,2
6410
322
617
65,
280
23,4
0581
924
,224
14,7
9963
.27%
8,59
036
.73%
5.69
%0.
85%
12.0
7%56
.67%
0.44
%0.
97%
0.75
%22
.56%
100.
00%
LAN
CEE
Alid
aVo
tes
POPP
AS N
icol
eVo
tes
BO
LAN
D G
reg
Vote
s
BAR
NET
T C
olin
Vote
s
MAL
OV
Dm
itry
Vote
s
GR
OEN
EWAL
D R
iaan
Vote
s
WAT
SON
Mic
hael
Vote
s
CO
LLIN
S C
aitli
nVo
tes
Vote
sre
mai
ning
in c
ount
Exha
uste
dVo
tes
Tota
lFo
rmal
Vote
s1,
332
198
2,82
613
,264
103
226
176
5,28
023
,405
23,4
0538
1217
95
157
103
103
Tota
l1,
370
210
2,84
313
,273
231
191
5,28
723
,405
23,4
0551
1825
5316
2819
119
1To
tal
1,42
122
82,
868
13,3
2624
75,
315
23,4
0523
,405
107
4135
1827
228
228
Tota
l1,
528
2,90
913
,361
265
5,34
223
,405
23,4
0553
2314
541
262
326
5To
tal
1,58
12,
932
13,5
065,
383
23,4
023
23,4
0558
253
645
81,
576
51,
581
Tota
l3,
514
14,0
425,
841
23,3
978
23,4
0575
72,
749
3,50
68
3,51
414
,799
8,59
023
,389
1623
,405
63.2
7%36
.73%
Abso
lute
Maj
ority
= 1
1695
Dis
tric
t Tot
alB
OLA
ND
Exc
lude
d
Firs
t Pre
fere
nce
Vot
esM
ALO
V Ex
clud
ed
WAT
SON
Exc
lude
d
POPP
AS E
xclu
ded
GR
OEN
EWAL
D E
xclu
ded
Tota
l Firs
t Pre
fere
nces
Vot
es
%To
tal V
alid
Vot
es
BAR
NET
T C
olin
LIB
LAN
CEE
Exc
lude
d
CO
LLIN
S C
aitli
nAL
P
Cot
tesl
oe E
lect
oral
Dis
tric
t
11 M
arch
201
7N
orth
Met
ropo
litan
Reg
ion
Two
Can
dida
te P
refe
rred
Vot
es
Pref
eren
ce D
istr
ibut
ion
Col
in J
ames
BAR
NET
TLi
bera
l Par
tyel
ecte
d as
the
mem
ber f
orC
OTT
ESLO
Ew
ith a
maj
ority
of
6209
vot
es
Firs
t Pre
fere
nce
Vote
s Po
lled
for e
ach
Can
dida
te a
t eac
h Po
lling
Pla
ce
Vote
r Tur
nout
= 8
8.39
%In
form
al V
otes
= 3
.38%
Polli
ng P
lace
Tot
als
Dis
trib
utio
n of
Pre
fere
nces
Dec
lara
tion
and
Mob
ile V
otes
Tot
al
ALP
36
.73%
LIB
63
.27%
2 C
andi
date
Pre
ferr
ed
Page 38
2017 State General ElectionResults and Statistics Report
37
Suburbs within District Ashendon Keysbrook
Baldivis Mardella
Bedfordale Mt Richon
Beechina Mundaring
Males 15,529 Bickley Mundijong
Females 15,613 Byford Oakford
Total 31,142 Canning Mills Oldbury
Cardup Pickering Brook
Carmel Piesse Brook
Electors Habitation Darling Downs Roleystone
1 4,277 Hacketts Gully Sawyers Valley
2 7,336 Hopeland Serpentine
3 2,198 Jarrahdale The Lakes
>3 1,283 Karragullen Wellard
Total Habitations 15,094 Karrakup Whitby
Kelmscott Wungong
Keralup
Returning Officer
Ralph SMITH
Candidate Name Party
URBAN, Barry WA Labor
Candidate Name Party
SIMPSON, Anthony James Liberal Party
Number of Electors on Roll
Number of Electors per Habitation
Elected Candidate for Darling Range
Previous Member
1,949
This figure is the gazetted area and may include bodies of water
District of Darling RangeEast Metropolitan RegionElector information correct as at 9 February 2017
Area (sq km)
Page 39
2017
Sta
te G
ener
al E
lect
ion
Res
ults
and
Sta
tistic
s R
epor
t 38
3114
2
PP No.
Polli
ng P
lace
BAL
LING
ER C
raig
MB
PVo
tes
BO
SKAM
P Iw
anG
RN
Vote
s
OST
LE S
tuar
t WSF
PVo
tes
URB
AN B
arry
ALP
Vote
s
FRO
UMIS
Man
amal
MIN
DVo
tes
BR
UNIN
G D
erek
ACP
Vote
s
MC
CO
ULL
Jak
e Ad
kins
LDP
Vote
s
POLG
AR S
haro
nPH
ON
Vote
s
SIM
PSO
N T
ony
LIB
Vote
s
BAR
KER
Chr
isFL
UXVo
tes
Tota
lFo
rmal
Vote
s
Info
rmal
Vote
sTo
tal
Vote
s
1A
rmad
ale
Prim
ary
Sch
ool
854
2822
74
452
3822
15
632
2365
531
650
.08%
315
49.9
2%2
Bed
ford
ale
Dis
trict
Hal
l9
7331
275
566
157
257
177
538
813
382
49.2
9%39
350
.71%
3B
runo
Gia
netti
Hal
l4
3727
195
520
536
133
746
934
503
266
56.7
2%20
343
.28%
4B
yfor
d H
all
1213
276
916
1216
111
196
669
162,
201
134
2,33
51,
198
54.5
3%99
945
.47%
5C
lifto
n H
ills P
rimar
y S
choo
l11
102
2061
02
564
6224
710
1,12
458
1,18
276
768
.24%
357
31.7
6%6
Kar
ragu
llen
Dis
trict
Hal
l2
3326
141
012
033
206
145
415
469
194
42.7
3%26
057
.27%
7K
elm
scot
t Prim
ary
Sch
ool
769
1132
56
382
6025
67
781
3982
042
854
.80%
353
45.2
0%8
Kw
inan
a S
outh
Bus
h Fi
re B
rigad
e5
1914
200
412
230
103
639
523
418
244
61.7
7%15
138
.23%
9M
arri
Gro
ve P
rimar
y S
choo
l18
5453
562
351
581
287
41,
118
491,
167
694
62.1
3%42
337
.87%
10M
unda
ring
Hal
l4
5020
199
410
326
146
346
515
480
282
60.6
5%18
339
.35%
11M
undi
jong
Prim
ary
Sch
ool
1552
7646
83
968
105
365
71,
195
711,
266
629
52.6
4%56
647
.36%
12O
akfo
rd C
omm
unity
Hal
l12
6036
327
423
771
350
589
547
942
427
47.7
6%46
752
.24%
13P
icke
ring
Bro
ok P
rimar
y S
choo
l3
2720
111
16
533
232
744
516
461
163
36.7
1%28
163
.29%
14R
oley
ston
e H
all
2633
984
1,02
67
8320
188
807
192,
599
120
2,71
91,
491
57.3
9%1,
107
42.6
1%15
Ser
pent
ine
Jarra
hdal
e C
omm
unity
Rec
reat
ion
Cen
tre14
7299
669
711
09
110
380
71,
477
100
1,57
784
457
.26%
630
42.7
4%16
Ser
pent
ine
Prim
ary
Sch
ool
2057
6553
74
473
131
479
71,
350
631,
413
683
50.5
9%66
749
.41%
17W
est B
yfor
d P
rimar
y S
choo
l17
7748
611
856
489
276
41,
190
651,
255
754
63.4
7%43
436
.53%
187
1,30
773
47,
399
7989
291
1,34
65,
414
116
17,5
6591
018
,475
9,76
255
.62%
7,78
944
.38%
Abs
ent V
otes
7037
117
01,
233
2810
646
298
808
323,
162
182
3,34
41,
890
59.8
1%1,
270
40.1
9%E
arly
Vot
es (b
y P
ost)
2513
579
880
986
1329
382
922
2,37
112
62,
497
1,18
449
.96%
1,18
650
.04%
Ear
ly V
otes
(In
Per
son)
3321
913
41,
459
1788
1336
897
423
3,32
813
73,
465
1,89
857
.07%
1,42
842
.93%
Pro
visi
onal
Vot
es0
15
171
20
56
138
139
2668
.42%
1231
.58%
Spe
cial
Inst
itutio
ns,
Hos
pita
ls &
Rem
otes
20
124
00
03
250
551
5628
50.9
1%27
49.0
9%13
072
638
93,
613
5528
272
967
2,64
278
8,95
444
79,
401
5,02
656
.16%
3,92
343
.84%
317
2,03
31,
123
11,0
1213
41,
174
163
2,31
38,
056
194
26,5
191,
357
27,8
7614
,788
55.8
0%11
,712
44.2
0%
1.20
%7.
67%
4.23
%41
.52%
0.51
%4.
43%
0.61
%8.
72%
30.3
8%0.
73%
100.
00%
BAL
LING
ER C
raig
Vote
s
BO
SKAM
P Iw
anVo
tes
OST
LE S
tuar
t WVo
tes
URB
AN B
arry
Vote
s
FRO
UMIS
Man
amal
MVo
tes
BR
UNIN
G D
erek
Vote
s
MC
CO
ULL
Jak
e Ad
kins
Vote
s
POLG
AR S
haro
nVo
tes
SIM
PSO
N T
ony
Vote
s
BAR
KER
Chr
isVo
tes
Vote
sre
mai
ning
in c
ount
Exha
uste
dVo
tes
Tota
lFo
rmal
Vote
s31
72,
033
1,12
311
,012
134
1,17
416
32,
313
8,05
619
426
,519
26,5
1918
2218
309
714
88
134
134
Tota
l33
52,
055
1,14
111
,042
1,18
317
02,
327
8,06
420
226
,519
26,5
196
1020
279
3460
417
017
0To
tal
341
2,06
51,
161
11,0
691,
192
2,36
18,
124
206
26,5
1926
,519
3043
2536
1430
2720
51
206
Tota
l37
12,
108
1,18
611
,105
1,20
62,
391
8,15
126
,518
126
,519
151
9452
1624
3437
137
1To
tal
2,25
91,
280
11,1
571,
222
2,41
58,
185
26,5
181
26,5
1946
682
8291
319
1,22
02
1,22
2To
tal
2,30
51,
962
11,2
392,
506
8,50
426
,516
326
,519
261
365
461
869
1,95
66
1,96
2To
tal
2,56
611
,604
2,96
79,
373
26,5
109
26,5
191,
901
308
353
2,56
24
2,56
6To
tal
13,5
053,
275
9,72
626
,506
1326
,519
1,28
31,
986
3,26
96
3,27
514
,788
11,7
1226
,500
1926
,519
55.8
0%44
.20%
Abso
lute
Maj
ority
= 1
3251
Dis
tric
t Tot
al
BO
SKAM
P Ex
clud
ed
POLG
AR E
xclu
ded
OST
LE E
xclu
ded
Firs
t Pre
fere
nce
Vot
esFR
OUM
IS E
xclu
ded
MC
CO
ULL
Excl
uded
BAR
KER
Exc
lude
d
BAL
LING
ER E
xclu
ded
Tota
l Firs
t Pre
fere
nces
Vot
es
%To
tal V
alid
Vot
es
URB
AN B
arry
ALP
BR
UNIN
G E
xclu
ded
SIM
PSO
N T
ony
LIB
Dar
ling
Ran
ge E
lect
oral
Dis
tric
t
11 M
arch
201
7Ea
st M
etro
polit
an R
egio
n
Two
Can
dida
te P
refe
rred
Vot
es
Pref
eren
ce D
istr
ibut
ion
Bar
ry U
RB
AN
WA
Lab
orel
ecte
d as
the
mem
ber f
orD
AR
LIN
G R
AN
GE
with
a m
ajor
ity o
f30
76 v
otes
Firs
t Pre
fere
nce
Vote
s Po
lled
for e
ach
Can
dida
te a
t eac
h Po
lling
Pla
ce
Vote
r Tur
nout
= 8
9.51
%In
form
al V
otes
= 4
.87%
Polli
ng P
lace
Tot
als
Dis
trib
utio
n of
Pre
fere
nces
Dec
lara
tion
and
Mob
ile V
otes
Tot
al
LIB
44
.20%
A
LP
55.8
0%
2 C
andi
date
Pre
ferr
ed
Page 40
2017 State General ElectionResults and Statistics Report
39
Local Governments within District
City of Mandurah
Males 14,445
Females 15,166
Total 29,611
Electors Habitation
1 5,689
2 7,866
3 1,732
>3 683 Returning Officer
Total Habitations 15,970 Ronald O'CONNOR
Candidate Name Party
KIRKUP, Zak Richard Francis Liberal Party
Candidate Name Party
HAMES, Kim Desmond Liberal Party
Number of Electors on Roll
Number of Electors per Habitation
Elected Candidate for Dawesville
Previous Member
District of DawesvilleSouth West Region
Elector information correct as at 9 February 2017
Area (sq km)
168
This figure is the gazetted area and may include bodies of water
Page 41
2017
Sta
te G
ener
al E
lect
ion
Res
ults
and
Sta
tistic
s R
epor
t 40
2961
1
PP No.
Polli
ng P
lace
SCH
UM
AC
HER
Dav
eIN
DVo
tes
KIR
KU
P Z
ak LIB
Vote
s
WO
OD
AG
E A
dam
ALP
Vote
s
SHA
VE L
awre
nce
PHO
NVo
tes
SPEN
CE
Lia
mFL
UX
Vote
s
BLU
ND
ELL-
CA
MD
EN A
eron
GR
NVo
tes
PILK
ING
TON
Luk
eN
AT
Vote
s
SVIL
ICIC
Ala
nM
BP
Vote
s
McC
AR
THY
Rus
sell
SFP
Vote
s
Tota
lFo
rmal
Vote
s
Info
rmal
Vote
sTo
tal
Vote
s
1C
ooda
nup
Com
mun
ity C
olle
ge83
215
207
756
358
614
649
3067
930
547
.00%
344
53.0
0%2
Dud
ley
Par
k P
rimar
y S
choo
l92
323
390
853
4832
225
1,00
048
1,04
846
246
.29%
536
53.7
1%3
Falc
on P
rimar
y S
choo
l77
253
192
441
489
322
649
1966
834
753
.47%
302
46.5
3%4
Falc
on R
eser
ve F
ootb
all P
avilio
n19
478
666
513
312
126
4715
502,
028
136
2,16
41,
057
52.1
2%97
147
.88%
5G
lenc
oe P
rimar
y S
choo
l17
270
656
713
59
7928
743
1,74
667
1,81
394
554
.15%
800
45.8
5%6
Hal
ls H
ead
Prim
ary
Sch
ool
229
543
679
131
983
3811
441,
767
111
1,87
879
044
.78%
974
55.2
2%7
Man
dura
h Ya
cht C
lub
1911
651
121
97
010
225
322
814
664
.89%
7935
.11%
8M
etro
Chu
rch
Hal
l20
552
346
193
974
325
311,
433
581,
491
735
51.2
9%69
848
.71%
9O
cean
Roa
d P
rimar
y S
choo
l69
202
232
605
3713
1525
658
2768
529
645
.05%
361
54.9
5%10
Sou
th H
alls
Hea
d P
rimar
y S
choo
l72
139
176
262
1917
718
476
2149
720
943
.91%
267
56.0
9%11
Sou
ther
n E
stua
ry P
rogr
ess
Ass
ocia
tion
Hal
l15
763
459
312
79
7860
743
1,70
867
1,77
589
452
.37%
813
47.6
3%1,
369
4,44
04,
213
921
6663
629
178
325
12,3
3958
712
,926
6,18
650
.17%
6,14
549
.83%
Abs
ent V
otes
207
621
751
161
1717
262
1311
12,
115
150
2,26
595
745
.27%
1,15
754
.73%
Ear
ly V
otes
(by
Pos
t)25
81,
138
827
370
2061
559
542,
792
134
2,92
61,
543
55.3
0%1,
247
44.7
0%E
arly
Vot
es (I
n P
erso
n)65
52,
859
2,46
085
023
213
148
6915
07,
427
395
7,82
23,
821
51.4
7%3,
603
48.5
3%P
rovi
sion
al V
otes
04
31
01
00
09
09
555
.56%
444
.44%
Spe
cial
Inst
itutio
ns,
Hos
pita
ls &
Rem
otes
528
368
02
30
183
184
3542
.17%
4857
.83%
1,12
54,
650
4,07
71,
390
6044
926
891
316
12,4
2668
013
,106
6,36
151
.22%
6,05
948
.78%
2,49
49,
090
8,29
02,
311
126
1,08
555
916
964
124
,765
1,26
726
,032
12,5
4750
.69%
12,2
0449
.31%
10.0
7%36
.71%
33.4
7%9.
33%
0.51
%4.
38%
2.26
%0.
68%
2.59
%10
0.00
%
SCH
UM
AC
HER
Dav
eVo
tes
KIR
KU
P Z
akVo
tes
WO
OD
AG
E A
dam
Vote
s
SHA
VE L
awre
nce
Vote
s
SPEN
CE
Lia
mVo
tes
BLU
ND
ELL-
CA
MD
EN A
eron
Vote
s
PILK
ING
TON
Luk
eVo
tes
SVIL
ICIC
Ala
nVo
tes
McC
AR
THY
Rus
sell
Vote
s
Vote
sre
mai
ning
in c
ount
Exha
uste
dVo
tes
Tota
lFo
rmal
Vote
s2,
494
9,09
08,
290
2,31
112
61,
085
559
169
641
24,7
6524
,765
2112
1614
247
923
126
126
Tota
l2,
515
9,10
28,
306
2,32
51,
109
566
178
664
24,7
6524
,765
7617
1114
1912
2917
817
8To
tal
2,59
19,
119
8,31
72,
339
1,12
857
869
324
,765
24,7
6566
294
4960
6346
578
578
Tota
l2,
657
9,41
38,
366
2,39
91,
191
739
24,7
6524
,765
160
9314
220
313
973
72
739
Tota
l2,
817
9,50
68,
508
2,60
21,
330
24,7
632
24,7
6530
713
970
817
61,
330
1,33
0To
tal
3,12
49,
645
9,21
62,
778
24,7
632
24,7
651,
074
886
811
2,77
17
2,77
8To
tal
4,19
810
,531
10,0
2724
,756
924
,765
2,01
62,
177
4,19
35
4,19
812
,547
12,2
0424
,751
1424
,765
50.6
9%49
.31%
Abs
olut
e M
ajor
ity =
123
76
Dis
tric
t Tot
alSC
HU
MA
CH
ER E
xclu
ded
SHA
VE E
xclu
ded
Firs
t Pre
fere
nce
Vot
esSP
ENC
E Ex
clud
ed
SVIL
ICIC
Exc
lude
d
PILK
ING
TON
Exc
lude
d
McC
AR
THY
Excl
uded
Tota
l Firs
t Pre
fere
nces
Vot
es
%To
tal V
alid
Vot
es
KIR
KU
P Z
ak LIB
BLU
ND
ELL-
CA
MD
EN E
xclu
ded
WO
OD
AG
E A
dam
ALP
Daw
esvi
lle E
lect
oral
Dis
tric
t
11 M
arch
201
7So
uth
Wes
t Reg
ion
Two
Can
dida
te P
refe
rred
Vot
es
Pref
eren
ce D
istr
ibut
ion
Zak
Ric
hard
Fra
ncis
KIR
KU
PLi
bera
l Par
tyel
ecte
d as
the
mem
ber f
orD
AW
ESVI
LLE
with
a m
ajor
ity o
f34
3 vo
tes
Firs
t Pre
fere
nce
Vote
s Po
lled
for e
ach
Can
dida
te a
t eac
h Po
lling
Pla
ce
Vote
r Tur
nout
= 8
7.91
%In
form
al V
otes
= 4
.87%
Polli
ng P
lace
Tot
als
Dis
trib
utio
n of
Pre
fere
nces
Dec
lara
tion
and
Mob
ile V
otes
Tot
al
ALP
49
.31%
LI
B
50.6
9%
2 C
andi
date
Pre
ferr
ed
Page 42
2017 State General ElectionResults and Statistics Report
41
Suburbs within District
Forrestfield
Gooseberry Hill
High Wycombe
Kenwick
Males 13,504 Kewdale
Females 13,490 Maddington
Total 26,994 Maida Vale
Orange Grove
Wattle Grove
Electors Habitation
1 4,953
2 6,067
3 1,937
>3 937 Returning Officer
Total Habitations 13,894 Jeff SOLLISS
Candidate Name Party
PRICE, Stephen James WA Labor
Candidate Name Party
MORTON, Nathan Wray Liberal Party
Number of Electors on Roll
Number of Electors per Habitation
Elected Candidate for Forrestfield
Previous Member
District of ForrestfieldEast Metropolitan RegionElector information correct as at 9 February 2017
Area (sq km)
59
This figure is the gazetted area and may include bodies of water
Page 43
2017
Sta
te G
ener
al E
lect
ion
Res
ults
and
Sta
tistic
s R
epor
t 42
2699
4
PP No.
Polli
ng P
lace
JAG
O A
shle
yAJ
PVo
tes
PRIC
E S
teph
enAL
PVo
tes
CR
OO
K B
rett
ACP
Vote
s
MO
RTO
N N
atha
nLI
BVo
tes
SHAH
ALAM
M MB
PVo
tes
BEN
NET
T J
enny
PHO
NVo
tes
MAR
SHAL
L E
ugen
eG
RN
Vote
s
Tota
lFo
rmal
Vote
s
Info
rmal
Vote
sTo
tal
Vote
s
1D
arlin
g R
ange
Spo
rts C
olle
ge55
865
5960
017
167
121
1,88
488
1,97
21,
087
57.7
3%79
642
.27%
2D
awso
n P
ark
Prim
ary
Sch
ool
4974
950
446
1117
311
51,
593
711,
664
969
60.8
7%62
339
.13%
3E
ast K
enw
ick
Prim
ary
Sch
ool
5798
360
413
2014
710
71,
787
861,
873
1,20
167
.21%
586
32.7
9%4
Edn
ey P
rimar
y S
choo
l72
952
4759
919
211
115
2,01
512
62,
141
1,21
660
.35%
799
39.6
5%5
Forr
estfi
eld
Prim
ary
Sch
ool
771,
066
6955
318
148
112
2,04
311
52,
158
1,30
163
.68%
742
36.3
2%6
Hig
h W
ycom
be P
rimar
y S
choo
l80
1,29
560
774
2424
917
82,
660
206
2,86
61,
627
61.1
7%1,
033
38.8
3%7
Mai
da V
ale
Prim
ary
Sch
ool
6070
457
690
2019
012
11,
842
131
1,97
393
850
.95%
903
49.0
5%8
Wat
tle G
rove
Prim
ary
Sch
ool
4988
972
629
4115
312
81,
961
842,
045
1,12
757
.47%
834
42.5
3%49
97,
503
474
4,70
417
01,
438
997
15,7
8590
716
,692
9,46
659
.98%
6,31
640
.02%
Abs
ent V
otes
122
895
7055
925
250
225
2,14
612
02,
266
1,31
361
.21%
832
38.7
9%E
arly
Vot
es (b
y P
ost)
5392
547
735
1427
211
22,
158
100
2,25
81,
197
55.4
9%96
044
.51%
Ear
ly V
otes
(In
Per
son)
7199
837
679
1327
910
62,
183
822,
265
1,26
357
.86%
920
42.1
4%P
rovi
sion
al V
otes
13
02
01
18
08
562
.50%
337
.50%
Spe
cial
Inst
itutio
ns,
Hos
pita
ls &
Rem
otes
133
330
04
273
881
3750
.68%
3649
.32%
248
2,85
415
72,
005
5280
644
66,
568
310
6,87
83,
815
58.1
0%2,
751
41.9
0%
747
10,3
5763
16,
709
222
2,24
41,
443
22,3
531,
217
23,5
7013
,281
59.4
3%9,
067
40.5
7%
3.34
%46
.33%
2.82
%30
.01%
0.99
%10
.04%
6.46
%10
0.00
%
JAG
O A
shle
yVo
tes
PRIC
E S
teph
enVo
tes
CR
OO
K B
rett
Vote
s
MO
RTO
N N
atha
nVo
tes
SHAH
ALAM
MVo
tes
BEN
NET
T J
enny
Vote
s
MAR
SHAL
L E
ugen
eVo
tes
Vote
sre
mai
ning
in c
ount
Exha
uste
dVo
tes
Tota
lFo
rmal
Vote
s74
710
,357
631
6,70
922
22,
244
1,44
322
,353
22,3
5338
5015
4235
4222
222
2To
tal
785
10,4
0764
66,
751
2,27
91,
485
22,3
5322
,353
5386
398
9019
646
646
Tota
l83
810
,493
7,14
92,
369
1,50
422
,353
22,3
5331
194
129
303
837
183
8To
tal
10,8
047,
243
2,49
81,
807
22,3
521
22,3
531,
282
239
282
1,80
34
1,80
7To
tal
12,0
867,
482
2,78
022
,348
522
,353
1,19
51,
585
2,78
02,
780
13,2
819,
067
22,3
485
22,3
53
59.4
3%40
.57%
Abso
lute
Maj
ority
= 1
1175
Dis
tric
t Tot
al
Firs
t Pre
fere
nce
Vot
esSH
AHAL
AM E
xclu
ded
CR
OO
K E
xclu
ded
JAG
O E
xclu
ded
MAR
SHAL
L Ex
clud
ed
Tota
l Firs
t Pre
fere
nces
Vot
es
%To
tal V
alid
Vot
es
PRIC
E S
teph
enAL
P
BEN
NET
T Ex
clud
ed
MO
RTO
N N
atha
nLI
B
Forr
estfi
eld
Elec
tora
l Dis
tric
t
11 M
arch
201
7Ea
st M
etro
polit
an R
egio
n
Two
Can
dida
te P
refe
rred
Vot
es
Pref
eren
ce D
istr
ibut
ion
Step
hen
Jam
es P
RIC
EW
A La
bor
elec
ted
as th
e m
embe
r for
FOR
RES
TFIE
LDw
ith a
maj
ority
of
4214
vot
es
Firs
t Pre
fere
nce
Vote
s Po
lled
for e
ach
Can
dida
te a
t eac
h Po
lling
Pla
ce
Vote
r Tur
nout
= 8
7.32
%In
form
al V
otes
= 5
.16%
Polli
ng P
lace
Tot
als
Dis
trib
utio
n of
Pre
fere
nces
Dec
lara
tion
and
Mob
ile V
otes
Tot
al
LIB
40
.57%
A
LP
59.4
3%
2 C
andi
date
Pre
ferr
ed
Page 44
2017 State General ElectionResults and Statistics Report
43
Suburbs within DistrictBeaconsfield
Coogee
East Fremantle
Fremantle
Males 14,004 Hamilton Hill
Females 14,761 Hilton
Total 28,765 North Coogee
O'connor
Rottnest Island
Electors Habitation South Fremantle
1 7,056 Spearwood
2 6,364 White Gum Valley
3 1,785
>3 776 Returning Officer
Total Habitations 15,981 Callum WEBSTER
Candidate Name Party
MCGURK, Simone Frances WA Labor
Candidate Name Party
MCGURK, Simone Frances WA Labor
Number of Electors on Roll
Number of Electors per Habitation
Elected Candidate for Fremantle
Previous Member
District of FremantleSouth Metropolitan Region
Elector information correct as at 9 February 2017
Area (sq km)
47
This figure is the gazetted area and may include bodies of water
Page 45
2017
Sta
te G
ener
al E
lect
ion
Res
ults
and
Sta
tistic
s R
epor
t 44
2876
5
PP No.
Polli
ng P
lace
van
der L
IND
E G
abrie
lleA
CP
Vote
s
JEN
KIN
S C
hris
SA Vote
s
SHEN
TON
Hay
den
LIB
Vote
s
KN
APP
Jan
etia
JMW
AVo
tes
SPEN
CER
Mar
tinG
RN
Vote
s
AYR
E A
ndre
wM
BP
Vote
s
DU
FFY
War
ren
PHO
NVo
tes
McG
UR
K S
imon
eA
LPVo
tes
Tota
lFo
rmal
Vote
s
Info
rmal
Vote
sTo
tal
Vote
s
1Be
acon
sfie
ld P
rimar
y Sc
hool
2139
435
1135
811
6696
31,
904
711,
975
537
28.2
0%1,
367
71.8
0%2
Chr
ist T
he K
ing
Scho
ol35
3838
015
314
1073
965
1,83
011
41,
944
512
27.9
9%1,
317
72.0
1%3
East
Fre
man
tle P
rimar
y Sc
hool
1430
237
929
89
2063
51,
252
411,
293
303
24.2
0%94
975
.80%
4Ea
st H
amilt
on H
ill Pr
imar
y Sc
hool
3929
192
1019
29
4670
71,
224
851,
309
280
22.8
8%94
477
.12%
5Fr
eman
tle P
rimar
y Sc
hool
1435
305
437
57
3671
51,
491
531,
544
371
24.9
0%1,
119
75.1
0%6
Frem
antle
Tow
n H
all
619
160
716
15
1631
368
729
716
200
29.1
1%48
770
.89%
7H
ilton
Prim
ary
Scho
ol34
6219
04
394
848
860
1,60
063
1,66
327
817
.39%
1,32
182
.61%
8Ph
oeni
x Pr
imar
y Sc
hool
5412
349
919
313
9391
71,
640
116
1,75
648
829
.77%
1,15
170
.23%
9R
ottn
est I
slan
d Pi
ctur
e H
all
01
241
130
232
731
7426
35.6
2%47
64.3
8%10
Sout
hwel
l Prim
ary
Scho
ol14
2178
165
329
328
539
3857
711
621
.52%
423
78.4
8%11
Spea
rwoo
d Pr
imar
y Sc
hool
2423
239
810
110
6256
01,
027
881,
115
322
31.4
1%70
368
.59%
12W
hite
Gum
Val
ley
Prim
ary
Scho
ol16
4124
88
365
532
806
1,52
168
1,58
931
120
.45%
1,21
079
.55%
271
350
2,83
787
2,82
990
523
7,80
114
,788
767
15,5
553,
744
25.3
3%11
,038
74.6
7%Ab
sent
Vot
es76
4555
318
628
2014
31,
134
2,61
714
22,
759
784
29.9
9%1,
830
70.0
1%Ea
rly V
otes
(by
Post
)36
2251
424
233
814
21,
013
1,99
277
2,06
965
933
.08%
1,33
366
.92%
Early
Vot
es (I
n Pe
rson
)57
6083
130
708
2419
01,
948
3,84
811
43,
962
1,04
827
.25%
2,79
872
.75%
Prov
isio
nal V
otes
31
40
50
226
410
4111
26.8
3%30
73.1
7%Sp
ecia
l Ins
titut
ions
, H
ospi
tals
& R
emot
es10
460
15
24
8617
212
184
7242
.35%
9857
.65%
182
132
1,96
273
1,57
954
481
4,20
78,
670
345
9,01
52,
574
29.7
1%6,
089
70.2
9%
453
482
4,79
916
04,
408
144
1,00
412
,008
23,4
581,
112
24,5
706,
318
26.9
5%17
,127
73.0
5%
1.93
%2.
05%
20.4
6%0.
68%
18.7
9%0.
61%
4.28
%51
.19%
100.
00%
van
der L
IND
E G
abrie
lleVo
tes
JEN
KIN
S C
hris
Vote
s
SHEN
TON
Hay
den
Vote
s
KN
APP
Jan
etia
Vote
s
SPEN
CER
Mar
tinVo
tes
AYR
E A
ndre
wVo
tes
DU
FFY
War
ren
Vote
s
McG
UR
K S
imon
eVo
tes
Vote
sre
mai
ning
in c
ount
Exha
uste
dVo
tes
Tota
lFo
rmal
Vote
s45
348
24,
799
160
4,40
814
41,
004
12,0
0823
,458
23,4
5818
626
1629
2128
144
144
Tota
l47
148
84,
825
176
4,43
71,
025
12,0
3623
,458
23,4
5820
1840
4117
3917
51
176
Tota
l49
150
64,
865
4,47
81,
042
12,0
7523
,457
123
,458
182
162
2648
6648
47
491
Tota
l68
85,
027
4,50
41,
090
12,1
4123
,450
823
,458
193
353
2511
568
62
688
Tota
l5,
220
4,85
71,
115
12,2
5623
,448
1023
,458
613
177
324
1,11
41
1,11
5To
tal
5,83
35,
034
12,5
8023
,447
1123
,458
485
4,54
75,
032
25,
034
6,31
817
,127
23,4
4513
23,4
58
26.9
5%73
.05%
Abs
olut
e M
ajor
ity =
117
23
Dis
tric
t Tot
alSP
ENC
ER E
xclu
ded
Firs
t Pre
fere
nce
Vote
sA
YRE
Excl
uded
KN
APP
Exc
lude
d
van
der L
IND
E Ex
clud
ed
JEN
KIN
S Ex
clud
ed
Tota
l Firs
t Pre
fere
nces
Vot
es
%To
tal V
alid
Vot
es
SHEN
TON
Hay
den
LIB
DU
FFY
Excl
uded
McG
UR
K S
imon
eA
LP
Frem
antle
Ele
ctor
al D
istr
ict
11 M
arch
201
7So
uth
Met
ropo
litan
Reg
ion
Two
Can
dida
te P
refe
rred
Vot
es
Pref
eren
ce D
istr
ibut
ion
Sim
one
Fran
ces
MC
GU
RK
WA
Lab
orel
ecte
d as
the
mem
ber f
orFR
EMA
NTL
Ew
ith a
maj
ority
of
1080
9 vo
tes
Firs
t Pre
fere
nce
Vote
s Po
lled
for e
ach
Can
dida
te a
t eac
h Po
lling
Pla
ce
Vote
r Tur
nout
= 8
5.42
%In
form
al V
otes
= 4
.53%
Polli
ng P
lace
Tot
als
Dis
trib
utio
n of
Pre
fere
nces
Dec
lara
tion
and
Mob
ile V
otes
Tot
al
ALP
73
.05%
LIB
26
.95%
2 C
andi
date
Pre
ferr
ed
Page 46
2017 State General ElectionResults and Statistics Report
45
Local Governments within District
City of Greater Geraldton
Males 12,637
Females 13,004
Total 25,641
Electors Habitation
1 5,353
2 5,915
3 1,706
>3 731 Returning Officer
Total Habitations 13,705 Michelle HARVEY
Candidate Name Party
BLAYNEY, Ian Charles Liberal Party
Candidate Name Party
BLAYNEY, Ian Charles Liberal Party
Number of Electors on Roll
Number of Electors per Habitation
Elected Candidate for Geraldton
Previous Member
District of GeraldtonAgricultural Region
Elector information correct as at 9 February 2017
Area (sq km)
1,798
This figure is the gazetted area and may include bodies of water
Page 47
2017
Sta
te G
ener
al E
lect
ion
Res
ults
and
Sta
tistic
s R
epor
t 46
2564
1
PP No.
Polli
ng P
lace
CO
NN
OLL
Y P
aul
GR
NVo
tes
BR
OW
N P
aul
NAT
Vote
s
CAU
DW
ELL
Dav
idSF
PVo
tes
BLA
YNEY
Ian
LIB
Vote
s
DAL
TON
Lar
aAL
PVo
tes
MAR
TIN
Way
nePH
ON
Vote
s
HAL
L G
reg
ACP
Vote
s
TAN
TI V
icto
rIN
DVo
tes
Tota
lFo
rmal
Vote
s
Info
rmal
Vote
sTo
tal
Vote
s
1A
llend
ale
Prim
ary
Sch
ool
5321
890
359
472
125
2918
1,36
444
1,40
862
545
.89%
737
54.1
1%2
Blu
ff P
oint
Prim
ary
Sch
ool
4521
744
341
402
9721
181,
185
671,
252
623
52.5
7%56
247
.43%
3C
ape
Bur
ney
Vol
unte
er F
ire B
rigad
e9
627
4280
245
523
414
248
117
50.0
0%11
750
.00%
4D
urla
cher
Stre
et49
148
3423
529
285
3513
891
4893
945
651
.18%
435
48.8
2%5
Ger
aldt
on P
rimar
y S
choo
l85
165
4429
146
585
2720
1,18
260
1,24
252
344
.28%
658
55.7
2%6
Ger
aldt
on S
enio
r Col
lege
2263
1390
157
2214
1039
119
410
169
43.2
2%22
256
.78%
7Jo
hn B
atte
n D
rum
mon
d C
ove
Com
mun
ity C
entre
1911
520
115
126
349
644
415
459
242
54.5
0%20
245
.50%
8M
oony
oono
oka
Pol
ocro
sse
Clu
b2
5810
9741
263
424
112
253
178
73.8
6%63
26.1
4%9
Mt T
arco
ola
Prim
ary
Sch
ool
4720
340
407
468
111
2418
1,31
848
1,36
668
551
.97%
633
48.0
3%10
Ran
gew
ay P
rimar
y S
choo
l47
158
7016
353
211
516
241,
125
741,
199
397
35.3
2%72
764
.68%
11S
pald
ing
Fam
ily C
entre
2068
1914
526
656
1511
600
4564
525
943
.24%
340
56.7
6%12
Wag
grak
ine
Prim
ary
Sch
ool
5223
176
333
485
143
2725
1,37
276
1,44
868
049
.60%
691
50.4
0%13
Wal
kaw
ay P
rimar
y S
choo
l13
669
8856
274
626
910
279
184
68.4
0%85
31.6
0%14
Wan
dina
Prim
ary
Sch
ool
1613
410
196
171
4611
1259
618
614
348
58.3
9%24
841
.61%
479
1,90
648
62,
902
4,01
399
624
019
011
,212
550
11,7
625,
486
48.9
6%5,
720
51.0
4%A
bsen
t Vot
es99
159
6629
238
711
127
321,
173
611,
234
572
48.8
1%60
051
.19%
Ear
ly V
otes
(by
Pos
t)36
191
4046
431
413
025
411,
241
461,
287
743
59.9
2%49
740
.08%
Ear
ly V
otes
(In
Per
son)
225
1,38
718
92,
076
2,26
072
211
111
37,
083
260
7,34
33,
835
54.1
9%3,
242
45.8
1%P
rovi
sion
al V
otes
41
00
01
00
60
63
50.0
0%3
50.0
0%S
peci
al In
stitu
tions
, H
ospi
tals
& R
emot
es6
2510
7497
1910
1825
920
279
120
46.3
3%13
953
.67%
370
1,76
330
52,
906
3,05
898
317
320
49,
762
387
10,1
495,
273
54.0
6%4,
481
45.9
4%
849
3,66
979
15,
808
7,07
11,
979
413
394
20,9
7493
721
,911
10,7
5951
.33%
10,2
0148
.67%
4.05
%17
.49%
3.77
%27
.69%
33.7
1%9.
44%
1.97
%1.
88%
100.
00%
CO
NN
OLL
Y P
aul
Vote
s
BR
OW
N P
aul
Vote
s
CAU
DW
ELL
Dav
idVo
tes
BLA
YNEY
Ian
Vote
s
DAL
TON
Lar
aVo
tes
MAR
TIN
Way
neVo
tes
HAL
L G
reg
Vote
s
TAN
TI V
icto
rVo
tes
Vote
sre
mai
ning
in c
ount
Exha
uste
dVo
tes
Tota
lFo
rmal
Vote
s84
93,
669
791
5,80
87,
071
1,97
941
339
420
,974
20,9
7452
5938
6293
5831
393
139
4To
tal
901
3,72
882
95,
870
7,16
42,
037
444
20,9
731
20,9
7417
6331
231
3567
444
444
Tota
l91
83,
791
860
6,10
17,
199
2,10
420
,973
120
,974
111
213
112
145
277
858
286
0To
tal
1,02
94,
004
6,21
37,
344
2,38
120
,971
320
,974
347
116
482
821,
027
21,
029
Tota
l4,
351
6,32
97,
826
2,46
320
,969
520
,974
991
821
649
2,46
12
2,46
3To
tal
5,34
27,
150
8,47
520
,967
720
,974
3,60
91,
726
5,33
57
5,34
210
,759
10,2
0120
,960
1420
,974
51.3
3%48
.67%
Abso
lute
Maj
ority
= 1
0481
Dis
tric
t Tot
alB
RO
WN
Exc
lude
d
Firs
t Pre
fere
nce
Vot
esTA
NTI
Exc
lude
d
HAL
L Ex
clud
ed
CAU
DW
ELL
Excl
uded
CO
NN
OLL
Y Ex
clud
ed
Tota
l Firs
t Pre
fere
nces
Vot
es
%To
tal V
alid
Vot
es
BLA
YNEY
Ian
LIB
MAR
TIN
Exc
lude
d
DAL
TON
Lar
aAL
P
Ger
aldt
on E
lect
oral
Dis
tric
t
11 M
arch
201
7A
gric
ultu
ral R
egio
n
Two
Can
dida
te P
refe
rred
Vot
es
Pref
eren
ce D
istr
ibut
ion
Ian
Cha
rles
BLA
YNEY
Libe
ral P
arty
elec
ted
as th
e m
embe
r for
GER
ALD
TON
with
a m
ajor
ity o
f55
8 vo
tes
Firs
t Pre
fere
nce
Vote
s Po
lled
for e
ach
Can
dida
te a
t eac
h Po
lling
Pla
ce
Vote
r Tur
nout
= 8
5.45
%In
form
al V
otes
= 4
.28%
Polli
ng P
lace
Tot
als
Dis
trib
utio
n of
Pre
fere
nces
Dec
lara
tion
and
Mob
ile V
otes
Tot
al
ALP
48
.67%
LI
B
51.3
3%
2 C
andi
date
Pre
ferr
ed
Page 48
2017 State General ElectionResults and Statistics Report
47
Suburbs within District
Darch
Girrawheen
Landsdale
Madeley
Males 14,030 Marangaroo
Females 14,392
Total 28,422
Electors Habitation
1 4,168
2 6,203
3 2,113
>3 1,267 Returning Officer
Total Habitations 13,751 Lincoln CAMPBELL
Candidate Name Party
QUIRK, Margaret Mary WA Labor
Candidate Name Party
QUIRK, Margaret Mary WA Labor
Number of Electors on Roll
Number of Electors per Habitation
Elected Candidate for Girrawheen
Previous Member
District of GirrawheenNorth Metropolitan RegionElector information correct as at 9 February 2017
Area (sq km)
22
This figure is the gazetted area and may include bodies of water
Page 49
2017
Sta
te G
ener
al E
lect
ion
Res
ults
and
Sta
tistic
s R
epor
t 48
2842
2
PP No.
Polli
ng P
lace
QU
IRK
Mar
gare
tAL
PVo
tes
SIN
GH
Sah
ajM
BP
Vote
s
SHAH
Mus
hfiq
GR
NVo
tes
PHIL
LIPS
Dav
idAC
PVo
tes
NG
UYE
N C
he T
amFF
PVo
tes
RO
ACH
Ray
mon
dSF
PVo
tes
KR
CO
SKI
Dam
eLI
BVo
tes
Tota
lFo
rmal
Vote
s
Info
rmal
Vote
sTo
tal
Vote
s
1A
shda
le P
rimar
y S
choo
l1,
482
5217
913
187
531,
125
3,10
919
63,
305
1,76
856
.87%
1,34
143
.13%
2H
udso
n P
ark
Prim
ary
Sch
ool
1,06
014
9848
4738
226
1,53
110
61,
637
1,23
580
.67%
296
19.3
3%3
Land
sdal
e P
rimar
y S
choo
l2,
230
8125
615
610
894
1,31
64,
241
194
4,43
52,
663
62.8
1%1,
577
37.1
9%4
Mad
eley
Prim
ary
Sch
ool
994
3493
8924
4591
72,
196
912,
287
1,15
452
.57%
1,04
147
.43%
5M
aran
garo
o Fa
mily
Cen
tre1,
109
2075
5460
4432
51,
687
128
1,81
51,
274
75.5
2%41
324
.48%
6M
aran
garo
o P
rimar
y S
choo
l1,
098
1390
5451
4640
61,
758
147
1,90
51,
273
72.4
9%48
327
.51%
7R
awlin
son
Prim
ary
Sch
ool
1,26
824
9565
4635
373
1,90
613
32,
039
1,43
675
.34%
470
24.6
6%8
Ros
ewor
th P
rimar
y S
choo
l66
16
5964
1625
122
953
471,
000
791
83.0
0%16
217
.00%
9,90
224
494
566
143
938
04,
810
17,3
811,
042
18,4
2311
,594
66.7
2%5,
783
33.2
8%A
bsen
t Vot
es1,
357
6321
110
611
211
256
32,
524
166
2,69
01,
733
68.7
7%78
731
.23%
Ear
ly V
otes
(by
Pos
t)94
125
8367
4852
491
1,70
785
1,79
21,
103
64.6
2%60
435
.38%
Ear
ly V
otes
(In
Per
son)
1,23
024
114
7163
6361
32,
178
792,
257
1,43
165
.73%
746
34.2
7%P
rovi
sion
al V
otes
120
00
00
113
316
1292
.31%
17.
69%
Spe
cial
Inst
itutio
ns,
Hos
pita
ls &
Rem
otes
100
00
00
616
016
1062
.50%
637
.50%
3,55
011
240
824
422
322
71,
674
6,43
833
36,
771
4,28
966
.67%
2,14
433
.33%
13,4
5235
61,
353
905
662
607
6,48
423
,819
1,37
525
,194
15,8
8366
.71%
7,92
733
.29%
56.4
8%1.
49%
5.68
%3.
80%
2.78
%2.
55%
27.2
2%10
0.00
%
QU
IRK
Mar
gare
tVo
tes
SIN
GH
Sah
ajVo
tes
SHAH
Mus
hfiq
Vote
s
PHIL
LIPS
Dav
idVo
tes
NG
UYE
N C
he T
amVo
tes
RO
ACH
Ray
mon
dVo
tes
KR
CO
SKI
Dam
eVo
tes
Vote
sre
mai
ning
in c
ount
Exha
uste
dVo
tes
Tota
lFo
rmal
Vote
s13
,452
356
1,35
390
566
260
76,
484
23,8
1923
,819
128
7032
3922
6535
635
6To
tal
13,5
801,
423
937
701
629
6,54
923
,819
23,8
1917
574
6416
015
662
962
9To
tal
13,7
551,
497
1,00
186
16,
705
23,8
1923
,819
272
187
237
162
858
386
1To
tal
14,0
271,
684
1,23
86,
867
23,8
163
23,8
1938
023
062
61,
236
21,
238
Tota
l14
,407
1,91
47,
493
23,8
145
23,8
191,
476
434
1,91
04
1,91
415
,883
7,92
723
,810
923
,819
66.7
1%33
.29%
Abso
lute
Maj
ority
= 1
1906
Dis
tric
t Tot
al
Firs
t Pre
fere
nce
Vot
esSI
NG
H E
xclu
ded
RO
ACH
Exc
lude
d
NG
UYE
N E
xclu
ded
PHIL
LIPS
Exc
lude
d
Tota
l Firs
t Pre
fere
nces
Vot
es
%To
tal V
alid
Vot
es
QU
IRK
Mar
gare
tAL
P
SHAH
Exc
lude
d
KR
CO
SKI
Dam
eLI
B
Girr
awhe
en E
lect
oral
Dis
tric
t
11 M
arch
201
7N
orth
Met
ropo
litan
Reg
ion
Two
Can
dida
te P
refe
rred
Vot
es
Pref
eren
ce D
istr
ibut
ion
Mar
gare
t Mar
y Q
UIR
KW
A La
bor
elec
ted
as th
e m
embe
r for
GIR
RAW
HEE
Nw
ith a
maj
ority
of
7956
vot
es
Firs
t Pre
fere
nce
Vote
s Po
lled
for e
ach
Can
dida
te a
t eac
h Po
lling
Pla
ce
Vote
r Tur
nout
= 8
8.64
%In
form
al V
otes
= 5
.46%
Polli
ng P
lace
Tot
als
Dis
trib
utio
n of
Pre
fere
nces
Dec
lara
tion
and
Mob
ile V
otes
Tot
al
LIB
33
.29%
ALP
66
.71%
2 C
andi
date
Pre
ferr
ed
Page 50
2017 State General ElectionResults and Statistics Report
49
Suburbs within District
Beldon
Craigie
Hillarys
Kallaroo
Males 13,646 Marmion
Females 13,915 Padbury
Total 27,561 Sorrento
Electors Habitation
1 3,814
2 6,328
3 2,064
>3 1,152 Returning Officer
Total Habitations 13,358 Leonie VEITCH
Candidate Name Party
KATSAMBANIS, Peter Argyris Liberal Party
Candidate Name Party
JOHNSON, Robert Frank Liberal Party
Number of Electors on Roll
Number of Electors per Habitation
Elected Candidate for Hillarys
Previous Member
District of HillarysNorth Metropolitan RegionElector information correct as at 9 February 2017
Area (sq km)
24
This figure is the gazetted area and may include bodies of water
Page 51
2017
Sta
te G
ener
al E
lect
ion
Res
ults
and
Sta
tistic
s R
epor
t 50
2756
1
PP No.
Polli
ng P
lace
KAT
SAM
BAN
IS P
eter
LIB
Vote
s
JOH
NSO
N R
obIN
DVo
tes
RIT
CH
IE T
eres
aAL
PVo
tes
LLO
YD L
ouah
naG
RN
Vote
s
RO
BIN
SON
Elis
abet
eAC
PVo
tes
Tota
lFo
rmal
Vote
s
Info
rmal
Vote
sTo
tal
Vote
s
1C
raig
ie H
eigh
ts P
rimar
y Sc
hool
456
410
762
244
481,
920
842,
004
706
36.7
7%1,
214
63.2
3%2
Hilla
rys
Prim
ary
Scho
ol1,
278
560
776
229
712,
914
118
3,03
21,
696
58.2
0%1,
218
41.8
0%3
Padb
ury
Prim
ary
Scho
ol42
337
859
818
124
1,60
473
1,67
763
139
.36%
972
60.6
4%4
Sacr
ed H
eart
Col
lege
1,15
637
633
495
502,
011
912,
102
1,44
271
.71%
569
28.2
9%5
Sorr
ento
Prim
ary
Scho
ol62
630
037
313
734
1,47
057
1,52
787
059
.18%
600
40.8
2%6
Sout
h Pa
dbur
y Pr
imar
y Sc
hool
767
489
794
261
682,
379
104
2,48
31,
093
45.9
4%1,
286
54.0
6%7
Sprin
gfie
ld P
rimar
y Sc
hool
820
466
592
190
612,
129
832,
212
1,14
453
.78%
983
46.2
2%8
St M
ark'
s An
glic
an C
omm
unity
Sch
ool
886
380
352
135
351,
788
351,
823
1,17
365
.64%
614
34.3
6%6,
412
3,35
94,
581
1,47
239
116
,215
645
16,8
608,
755
54.0
1%7,
456
45.9
9%Ab
sent
Vot
es1,
069
331
976
347
922,
815
138
2,95
31,
371
48.7
4%1,
442
51.2
6%Ea
rly V
otes
(by
Post
)85
158
649
911
660
2,11
288
2,20
01,
284
60.8
0%82
839
.20%
Early
Vot
es (I
n Pe
rson
)1,
007
466
716
188
472,
424
672,
491
1,33
455
.03%
1,09
044
.97%
Prov
isio
nal V
otes
43
11
09
09
555
.56%
444
.44%
Spec
ial I
nstit
utio
ns,
Hos
pita
ls &
Rem
otes
00
00
00
00
2,93
11,
386
2,19
265
219
97,
360
293
7,65
33,
994
54.2
8%3,
364
45.7
2%
9,34
34,
745
6,77
32,
124
590
23,5
7593
824
,513
12,7
4954
.09%
10,8
2045
.91%
39.6
3%20
.13%
28.7
3%9.
01%
2.50
%10
0.00
%
KAT
SAM
BAN
IS P
eter
Vote
s
JOH
NSO
N R
obVo
tes
RIT
CH
IE T
eres
aVo
tes
LLO
YD L
ouah
naVo
tes
RO
BIN
SON
Elis
abet
eVo
tes
Vote
sre
mai
ning
in c
ount
Exha
uste
dVo
tes
Tota
lFo
rmal
Vote
s9,
343
4,74
56,
773
2,12
459
023
,575
23,5
7529
414
870
7758
91
590
Tota
l9,
637
4,89
36,
843
2,20
123
,574
123
,575
266
571
1,36
22,
199
22,
201
Tota
l9,
903
5,46
48,
205
23,5
723
23,5
752,
846
2,61
55,
461
35,
464
12,7
4910
,820
23,5
696
23,5
75
54.0
9%45
.91%
Abso
lute
Maj
ority
= 1
1785
Dis
tric
t Tot
al
Firs
t Pre
fere
nce
Vote
sR
OB
INSO
N E
xclu
ded
LLO
YD E
xclu
ded
JOH
NSO
N E
xclu
ded
Tota
l Firs
t Pre
fere
nces
Vot
es
%To
tal V
alid
Vot
es
KAT
SAM
BAN
IS P
eter
LIB
RIT
CH
IE T
eres
aAL
P
Hill
arys
Ele
ctor
al D
istr
ict
11 M
arch
201
7N
orth
Met
ropo
litan
Reg
ion
Two
Can
dida
te P
refe
rred
Vot
es
Pref
eren
ce D
istr
ibut
ion
Pete
r Arg
yris
KAT
SAM
BAN
ISLi
bera
l Par
tyel
ecte
d as
the
mem
ber f
orH
ILLA
RYS
with
a m
ajor
ity o
f19
29 v
otes
Firs
t Pre
fere
nce
Vote
s Po
lled
for e
ach
Can
dida
te a
t eac
h Po
lling
Pla
ce
Vote
r Tur
nout
= 8
8.94
%In
form
al V
otes
= 3
.83%
Polli
ng P
lace
Tot
als
Dis
trib
utio
n of
Pre
fere
nces
Dec
lara
tion
and
Mob
ile V
otes
Tot
al
ALP
45
.91%
LI
B
54.0
9%
2 C
andi
date
Pre
ferr
ed
Page 52
2017 State General ElectionResults and Statistics Report
51
Suburbs within District
Canning Vale
Forrestdale
Harrisdale
Jandakot
Males 14,439 Leeming
Females 14,609 Piara Waters
Total 29,048 Treeby
Electors Habitation
1 3,822
2 6,667
3 2,131
>3 1,289 Returning Officer
Total Habitations 13,909 Michelle BINGHAM
Candidate Name Party
MUBARAKAI, Shahyaz Yezdi WA Labor
Candidate Name Party
FRANCIS, Joseph Michael Liberal Party
Number of Electors on Roll
Number of Electors per Habitation
Elected Candidate for Jandakot
Previous Member
District of JandakotSouth Metropolitan Region
Elector information correct as at 9 February 2017
Area (sq km)
94
This figure is the gazetted area and may include bodies of water
Page 53
2017
Sta
te G
ener
al E
lect
ion
Res
ults
and
Sta
tistic
s R
epor
t 52
2904
8
PP No.
Polli
ng P
lace
MU
BAR
AKAI
Yaz
ALP
Vote
s
GO
BB
ERT
Fra
nces
caAJ
PVo
tes
SPYK
ER W
arna
rAC
PVo
tes
FRAN
CIS
Joe LIB
Vote
s
CO
X D
orin
daG
RN
Vote
s
MU
RPH
Y J
ohn
Man
fred
PHO
NVo
tes
SAM
RA
Sat
MB
PVo
tes
Tota
lFo
rmal
Vote
s
Info
rmal
Vote
sTo
tal
Vote
s
1Ba
nksi
a Pa
rk P
rimar
y Sc
hool
510
4051
815
146
8538
1,68
571
1,75
669
841
.42%
987
58.5
8%2
Can
ning
Val
e Pr
imar
y Sc
hool
970
5784
914
144
155
522,
376
922,
468
1230
51.7
7%1,
146
48.2
3%3
Forr
estd
ale
Prim
ary
Scho
ol24
118
3119
338
8113
615
4265
732
753
.26%
287
46.7
4%4
Har
risda
le P
rimar
y Sc
hool
1,11
960
103
788
176
131
752,
452
942,
546
1426
58.1
6%1,
026
41.8
4%5
Lake
land
Sen
ior H
igh
Scho
ol27
316
1236
541
6915
791
3382
436
045
.51%
431
54.4
9%6
Leem
ing
Prim
ary
Scho
ol69
027
6096
614
298
282,
011
762,
087
879
43.7
1%1,
132
56.2
9%7
Piar
a W
ater
s Pr
imar
y Sc
hool
1,21
347
122
830
164
160
582,
594
108
2,70
215
1058
.21%
1,08
441
.79%
8R
anfo
rd P
rimar
y Sc
hool
981
4111
298
013
113
629
2,41
091
2,50
111
9549
.63%
1,21
350
.37%
9W
est L
eem
ing
Prim
ary
Scho
ol60
651
5592
415
758
241,
875
761,
951
815
43.4
7%1,
060
56.5
3%6,
603
357
630
6,77
51,
139
973
332
16,8
0968
317
,492
8440
50.2
2%8,
366
49.7
8%Ab
sent
Vot
es1,
340
106
123
984
315
266
483,
182
182
3,36
418
1757
.10%
1,36
542
.90%
Early
Vot
es (b
y Po
st)
820
5260
923
103
184
292,
171
722,
243
1022
47.1
2%1,
147
52.8
8%Ea
rly V
otes
(In
Pers
on)
1,20
172
851,
143
175
257
452,
978
933,
071
1542
51.7
8%1,
436
48.2
2%Pr
ovis
iona
l Vot
es9
03
53
12
230
2314
60.8
7%9
39.1
3%Sp
ecia
l Ins
titut
ions
, H
ospi
tals
& R
emot
es0
00
00
00
00
03,
370
230
271
3,05
559
670
812
48,
354
347
8,70
143
9552
.62%
3,95
747
.38%
9,97
358
790
19,
830
1,73
51,
681
456
25,1
631,
030
26,1
9312
835
51.0
2%12
,323
48.9
8%
39.6
3%2.
33%
3.58
%39
.07%
6.90
%6.
68%
1.81
%10
0.00
%
MU
BAR
AKAI
Yaz
Vote
s
GO
BB
ERT
Fra
nces
caVo
tes
SPYK
ER W
arna
rVo
tes
FRAN
CIS
Joe
Vote
s
CO
X D
orin
daVo
tes
MU
RPH
Y J
ohn
Man
fred
Vote
s
SAM
RA
Sat
Vote
s
Vote
sre
mai
ning
in c
ount
Exha
uste
dVo
tes
Tota
lFo
rmal
Vote
s9,
973
587
901
9,83
01,
735
1,68
145
625
,163
25,1
6315
139
5491
7150
456
456
Tota
l10
,124
626
955
9,92
11,
806
1,73
125
,163
25,1
6318
084
7123
655
626
626
Tota
l10
,304
1,03
99,
992
2,04
21,
786
25,1
6325
,163
196
603
146
941,
039
1,03
9To
tal
10,5
0010
,595
2,18
81,
880
25,1
6325
,163
483
1,03
835
61,
877
31,
880
Tota
l10
,983
11,6
332,
544
25,1
603
25,1
631,
852
690
2,54
22
2,54
412
,835
12,3
2325
,158
525
,163
51.0
2%48
.98%
Abso
lute
Maj
ority
= 1
2580
Dis
tric
t Tot
al
Firs
t Pre
fere
nce
Vote
sSA
MR
A Ex
clud
ed
GO
BB
ERT
Excl
uded
SPYK
ER E
xclu
ded
MU
RPH
Y Ex
clud
ed
Tota
l Firs
t Pre
fere
nces
Vot
es
%To
tal V
alid
Vot
es
MU
BAR
AKAI
Yaz
ALP
CO
X Ex
clud
ed
FRAN
CIS
Joe LIB
Jand
akot
Ele
ctor
al D
istr
ict
11 M
arch
201
7So
uth
Met
ropo
litan
Reg
ion
Two
Can
dida
te P
refe
rred
Vot
es
Pref
eren
ce D
istr
ibut
ion
Shah
yaz
Yezd
i MU
BA
RA
KA
IW
A L
abor
elec
ted
as th
e m
embe
r for
JAN
DA
KO
Tw
ith a
maj
ority
of
512
vote
s
Firs
t Pre
fere
nce
Vote
s Po
lled
for e
ach
Can
dida
te a
t eac
h Po
lling
Pla
ce
Vote
r Tur
nout
= 9
0.17
%In
form
al V
otes
= 3
.93%
Polli
ng P
lace
Tot
als
Dis
trib
utio
n of
Pre
fere
nces
Dec
lara
tion
and
Mob
ile V
otes
Tot
al
LIB
48
.98%
A
LP
51.0
2%
2 C
andi
date
Pre
ferr
ed
Page 54
2017 State General ElectionResults and Statistics Report
53
Suburbs within District
Beldon
Connolly
Currambine
Edgewater
Males 13,673 Heathridge
Females 13,822 Joondalup
Total 27,495 Mullaloo
Ocean Reef
Electors Habitation
1 4,014
2 6,064
3 2,109
>3 1,164 Returning Officer
Total Habitations 13,351 Noel MCAULIFFE
Candidate Name Party
HAMILTON, Emily Louise WA Labor
Candidate Name Party
NORBERGER, Jan-Henrik Liberal Party
Number of Electors on Roll
Number of Electors per Habitation
Elected Candidate for Joondalup
Previous Member
District of JoondalupNorth Metropolitan RegionElector information correct as at 9 February 2017
Area (sq km)
32
This figure is the gazetted area and may include bodies of water
Page 55
2017
Sta
te G
ener
al E
lect
ion
Res
ults
and
Sta
tistic
s R
epor
t 54
2749
5
PP No.
Polli
ng P
lace
NO
RB
ERG
ER J
an LIB
Vote
s
HAR
T N
icho
las
FFP
Vote
s
HO
ST R
exAC
PVo
tes
WEB
B L
isa
GR
NVo
tes
MAR
TIN
Pet
erM
BP
Vote
s
HAM
ILTO
N E
mily
ALP
Vote
s
MAL
LOY
Aar
onJM
WA
Vote
s
BR
IGH
TMAN
Bria
nIN
DVo
tes
Tota
lFo
rmal
Vote
s
Info
rmal
Vote
sTo
tal
Vote
s
1Be
aum
aris
Com
mun
ity C
entre
860
1028
117
961
611
471,
698
691,
767
953
56.1
2%74
543
.88%
2Be
ldon
Prim
ary
Scho
ol42
313
1692
860
011
301,
193
801,
273
477
39.9
8%71
660
.02%
3Be
ldon
Prim
ary
Scho
ol (D
rive-
in)
631
119
112
82
822
311
234
7634
.08%
147
65.9
2%4
Con
nolly
Prim
ary
Scho
ol97
120
3717
810
818
2141
2,09
694
2,19
01,
097
52.3
4%99
947
.66%
5Ed
dyst
one
Prim
ary
Scho
ol37
220
1287
757
04
351,
107
731,
180
424
38.3
4%68
261
.66%
6Ed
gew
ater
Prim
ary
Scho
ol78
711
4219
55
787
952
1,88
884
1,97
289
947
.62%
989
52.3
8%7
Joon
dalu
p Pu
blic
Lib
rary
382
1412
119
1140
99
3098
653
1,03
944
845
.44%
538
54.5
6%8
Mul
lalo
o H
eigh
ts P
rimar
y Sc
hool
1,04
916
5317
419
849
1565
2,24
090
2,33
01,
180
52.7
0%1,
059
47.3
0%9
Oce
an R
eef S
enio
r Hig
h Sc
hool
1,02
017
2312
317
688
1160
1,95
988
2,04
71,
123
57.3
8%83
442
.62%
10Po
seid
on P
rimar
y Sc
hool
618
2331
154
1480
29
791,
730
701,
800
755
43.6
9%97
356
.31%
6,54
514
525
51,
258
101
6,26
710
244
715
,120
712
15,8
327,
432
49.1
7%7,
682
50.8
3%Ab
sent
Vot
es97
944
6737
831
1,12
015
692,
703
163
2,86
61,
176
43.5
1%1,
527
56.4
9%Ea
rly V
otes
(by
Post
)88
234
2511
923
685
3360
1,86
187
1,94
81,
000
53.7
3%86
146
.27%
Early
Vot
es (I
n Pe
rson
)1,
613
5340
254
301,
339
3212
73,
488
107
3,59
51,
833
52.5
7%1,
654
47.4
3%Pr
ovis
iona
l Vot
es2
10
00
30
06
06
350
.00%
350
.00%
Spec
ial I
nstit
utio
ns,
Hos
pita
ls &
Rem
otes
160
00
09
10
261
2716
61.5
4%10
38.4
6%3,
492
132
132
751
843,
156
8125
68,
084
358
8,44
24,
028
49.8
3%4,
055
50.1
7%
10,0
3727
738
72,
009
185
9,42
318
370
323
,204
1,07
024
,274
11,4
6049
.40%
11,7
3750
.60%
43.2
6%1.
19%
1.67
%8.
66%
0.80
%40
.61%
0.79
%3.
03%
100.
00%
NO
RB
ERG
ER J
anVo
tes
HAR
T N
icho
las
Vote
s
HO
ST R
exVo
tes
WEB
B L
isa
Vote
s
MAR
TIN
Pet
erVo
tes
HAM
ILTO
N E
mily
Vote
s
MAL
LOY
Aar
onVo
tes
BR
IGH
TMAN
Bria
nVo
tes
Vote
sre
mai
ning
in c
ount
Exha
uste
dVo
tes
Tota
lFo
rmal
Vote
s10
,037
277
387
2,00
918
59,
423
183
703
23,2
0423
,204
3515
610
2038
5818
21
183
Tota
l10
,072
292
393
2,01
920
59,
461
761
23,2
031
23,2
0431
3212
3041
5820
41
205
Tota
l10
,103
324
405
2,04
99,
502
819
23,2
022
23,2
0471
7373
4660
323
132
4To
tal
10,1
7447
82,
122
9,54
887
923
,201
323
,204
266
4072
100
478
478
Tota
l10
,440
2,16
29,
620
979
23,2
013
23,2
0443
828
525
597
81
979
Tota
l10
,878
2,44
79,
875
23,2
004
23,2
0458
21,
862
2,44
43
2,44
711
,460
11,7
3723
,197
723
,204
49.4
0%50
.60%
Abso
lute
Maj
ority
= 1
1599
Dis
tric
t Tot
alW
EBB
Exc
lude
d
Firs
t Pre
fere
nce
Vote
sM
ALLO
Y Ex
clud
ed
MAR
TIN
Exc
lude
d
HAR
T Ex
clud
ed
HO
ST E
xclu
ded
Tota
l Firs
t Pre
fere
nces
Vot
es
%To
tal V
alid
Vot
es
NO
RB
ERG
ER J
an LIB
BR
IGH
TMAN
Exc
lude
d
HAM
ILTO
N E
mily
ALP
Joon
dalu
p El
ecto
ral D
istr
ict
11 M
arch
201
7N
orth
Met
ropo
litan
Reg
ion
Two
Can
dida
te P
refe
rred
Vot
es
Pref
eren
ce D
istr
ibut
ion
Emily
Lou
ise
HAM
ILTO
NW
A La
bor
elec
ted
as th
e m
embe
r for
JOO
ND
ALU
Pw
ith a
maj
ority
of
277
vote
s
Firs
t Pre
fere
nce
Vote
s Po
lled
for e
ach
Can
dida
te a
t eac
h Po
lling
Pla
ce
Vote
r Tur
nout
= 8
8.29
%In
form
al V
otes
= 4
.41%
Polli
ng P
lace
Tot
als
Dis
trib
utio
n of
Pre
fere
nces
Dec
lara
tion
and
Mob
ile V
otes
Tot
al
ALP
50
.60%
LI
B
49.4
0%
2 C
andi
date
Pre
ferr
ed
Page 56
2017 State General ElectionResults and Statistics Report
55
Suburbs within DistrictBickley
Canning Mills
Carmel
Darlington
Males 13,290 Glen Forrest
Females 13,616 Gooseberry Hill
Total 26,906 Hovea
Kalamunda
Lesmurdie
Electors Habitation Mahogany Creek
1 3,316 Maida Vale
2 6,383 Martin
3 1,984 Mundaring
>3 1,134 Orange Grove
Total Habitations 12,817 Parkerville
Paulls Valley
Piesse Brook
Stoneville
Walliston
Returning Officer
Pamela MCCORMICK
Candidate Name Party
HUGHES, Matthew WA Labor
Candidate Name Party
DAY, John Howard Dadley Liberal Party
Number of Electors on Roll
Number of Electors per Habitation
Elected Candidate for Kalamunda
Previous Member
District of KalamundaEast Metropolitan RegionElector information correct as at 9 February 2017
Area (sq km)
244
This figure is the gazetted area and may include bodies of water
Page 57
2017
Sta
te G
ener
al E
lect
ion
Res
ults
and
Sta
tistic
s R
epor
t 56
2690
6
PP No.
Polli
ng P
lace
HU
GH
ES M
atth
ewAL
PVo
tes
MIL
ES L
ee-A
nne
GR
NVo
tes
BO
WYE
R M
urra
yJM
WA
Vote
s
CO
LYVA
S E
vaze
liaM
BP
Vote
s
DAY
Joh
nLI
BVo
tes
WIL
LIAM
S B
rady
Joh
nAC
PVo
tes
GO
ULD
Ray
PHO
NVo
tes
Tota
lFo
rmal
Vote
s
Info
rmal
Vote
sTo
tal
Vote
s
1C
arm
el H
all
9417
74
127
216
267
1828
511
944
.57%
148
55.4
3%2
Dar
lingt
on P
rimar
y S
choo
l56
433
311
1451
353
751,
563
411,
604
903
57.7
7%66
042
.23%
3Fa
lls R
oad
Prim
ary
Sch
ool
481
160
815
512
3064
1,27
044
1,31
465
551
.57%
615
48.4
3%4
Gle
n Fo
rrest
Prim
ary
Sch
ool
559
229
1711
379
4096
1,33
146
1,37
783
562
.73%
496
37.2
7%5
Goo
sebe
rry H
ill P
rimar
y S
choo
l46
221
434
1060
728
731,
428
411,
469
690
48.3
2%73
851
.68%
6K
alam
unda
Prim
ary
Sch
ool
606
174
2012
713
5166
1,64
253
1,69
580
248
.84%
840
51.1
6%7
Kal
amun
da S
enio
r Hig
h S
choo
l57
316
322
1565
346
841,
556
731,
629
781
50.1
9%77
549
.81%
8Le
smur
die
Prim
ary
Sch
ool
651
193
1219
838
5912
01,
892
771,
969
869
45.9
3%1,
023
54.0
7%9
Mah
ogan
y C
reek
Hal
l25
874
49
184
1746
592
2161
334
658
.45%
246
41.5
5%10
Mun
darin
g P
rimar
y S
choo
l26
899
87
175
2446
627
2865
539
162
.36%
236
37.6
4%11
Par
kerv
ille P
rimar
y S
choo
l38
916
019
1337
230
731,
056
471,
103
568
53.7
9%48
846
.21%
12S
tone
ville
Pla
ygro
up C
entre
418
108
129
262
3098
937
3196
857
361
.15%
364
38.8
5%13
Wal
listo
n P
rimar
y S
choo
l68
117
424
2262
333
118
1,67
583
1,75
890
053
.73%
775
46.2
7%6,
004
2,09
819
816
05,
958
443
975
15,8
3660
316
,439
8,43
253
.25%
7,40
446
.75%
Abs
ent V
otes
1,00
848
239
3189
110
128
32,
835
134
2,96
91,
577
55.7
0%1,
254
44.3
0%E
arly
Vot
es (b
y P
ost)
788
197
4625
1,02
362
202
2,34
310
12,
444
1,06
445
.43%
1,27
854
.57%
Ear
ly V
otes
(In
Per
son)
848
255
2117
860
4422
62,
271
100
2,37
11,
153
50.7
7%1,
118
49.2
3%P
rovi
sion
al V
otes
21
00
20
05
05
360
.00%
240
.00%
Spe
cial
Inst
itutio
ns,
Hos
pita
ls &
Rem
otes
336
11
343
583
184
3946
.99%
4453
.01%
2,67
994
110
774
2,81
021
071
67,
537
336
7,87
33,
836
50.9
3%3,
696
49.0
7%
8,68
33,
039
305
234
8,76
865
31,
691
23,3
7393
924
,312
12,2
6852
.50%
11,1
0047
.50%
37.1
5%13
.00%
1.30
%1.
00%
37.5
1%2.
79%
7.23
%10
0.00
%
HU
GH
ES M
atth
ewVo
tes
MIL
ES L
ee-A
nne
Vote
s
BO
WYE
R M
urra
yVo
tes
CO
LYVA
S E
vaze
liaVo
tes
DAY
Joh
nVo
tes
WIL
LIAM
S B
rady
Joh
nVo
tes
GO
ULD
Ray
Vote
s
Vote
sre
mai
ning
in c
ount
Exha
uste
dVo
tes
Tota
lFo
rmal
Vote
s8,
683
3,03
930
523
48,
768
653
1,69
123
,373
23,3
7330
3664
3825
4123
423
4To
tal
8,71
33,
075
369
8,80
667
81,
732
23,3
7323
,373
5310
871
7661
369
369
Tota
l8,
766
3,18
38,
877
754
1,79
323
,373
23,3
7387
8831
726
175
31
754
Tota
l8,
853
3,27
19,
194
2,05
423
,372
123
,373
466
368
1,21
82,
052
22,
054
Tota
l9,
319
3,63
910
,412
23,3
703
23,3
732,
949
688
3,63
72
3,63
912
,268
11,1
0023
,368
523
,373
52.5
0%47
.50%
Abso
lute
Maj
ority
= 1
1685
Dis
tric
t Tot
al
Firs
t Pre
fere
nce
Vot
esC
OLY
VAS
Excl
uded
BO
WYE
R E
xclu
ded
WIL
LIAM
S Ex
clud
ed
GO
ULD
Exc
lude
d
Tota
l Firs
t Pre
fere
nces
Vot
es
%To
tal V
alid
Vot
es
HU
GH
ES M
atth
ewAL
P
MIL
ES E
xclu
ded
DAY
Joh
nLI
B
Kal
amun
da E
lect
oral
Dis
tric
t
11 M
arch
201
7Ea
st M
etro
polit
an R
egio
n
Two
Can
dida
te P
refe
rred
Vot
es
Pref
eren
ce D
istr
ibut
ion
Mat
thew
HU
GH
ESW
A La
bor
elec
ted
as th
e m
embe
r for
KAL
AMU
ND
Aw
ith a
maj
ority
of
1168
vot
es
Firs
t Pre
fere
nce
Vote
s Po
lled
for e
ach
Can
dida
te a
t eac
h Po
lling
Pla
ce
Vote
r Tur
nout
= 9
0.36
%In
form
al V
otes
= 3
.86%
Polli
ng P
lace
Tot
als
Dis
trib
utio
n of
Pre
fere
nces
Dec
lara
tion
and
Mob
ile V
otes
Tot
al
LIB
47
.50%
A
LP
52.5
0%
2 C
andi
date
Pre
ferr
ed
Page 58
2017 State General ElectionResults and Statistics Report
57
Local Governments within District
Males 10,446
Females 9,578
City of Kalgoorlie-Boulder
Shire of Coolgardie
Shire of Dundas
Shire of Laverton
Shire of Leonora
Shire of Menzies
Total 20,024
Electors Habitation
1 4,854
2 4,488
3 1,207
>3 477 Returning Officer
Total Habitations 11,026 Ken ROGERS
Candidate Name Party
O'DONNELL, Kyran Martin Liberal Party
Candidate Name Party
DUNCAN, Wendy Maxine THE NATIONALS
Number of Electors on Roll
Number of Electors per Habitation
Elected Candidate for Kalgoorlie
Previous Member
District of KalgoorlieMining and Pastoral Region
Elector information correct as at 9 February 2017
Area (sq km)
555,448
This figure is the gazetted area and may include bodies of water
Page 59
2017
Sta
te G
ener
al E
lect
ion
Res
ults
and
Sta
tistic
s R
epor
t 58
2002
4
PP No.
Polli
ng P
lace
O'D
ON
NEL
L K
yran
LIB
Vote
s
CR
OO
K T
ony
NA
TVo
tes
BO
LTO
N R
icha
rdPH
ON
Vote
s
SPU
RLI
NG
Jac
quel
ine
GR
NVo
tes
LUC
AS
Mik
eSF
PVo
tes
FOR
STER
Dar
ren
ALP
Vote
s
ERW
IN J
ames
FLU
XVo
tes
Tota
lFo
rmal
Vote
s
Info
rmal
Vote
sTo
tal
Vote
s
1Bo
ulde
r Prim
ary
Scho
ol32
630
018
277
6645
120
1,42
277
1,49
970
849
.79%
714
50.2
1%2
Coo
lgar
die
Com
mun
ity R
ecre
atio
n C
entre
4267
3911
1910
24
284
1830
211
741
.20%
167
58.8
0%3
Gol
dfie
lds
Arts
Cen
tre22
423
785
4430
185
1081
530
845
477
58.5
3%33
841
.47%
4H
anna
ns P
rimar
y Sc
hool
233
252
6431
3318
16
800
3183
149
662
.00%
304
38.0
0%5
John
Pau
l Col
lege
343
290
174
5461
345
121,
279
781,
357
697
54.6
2%57
945
.38%
6Ka
lgoo
rlie
Hea
lth C
ampu
s13
511
655
2820
132
449
038
528
253
51.6
3%23
748
.37%
7Ka
mba
lda
Prim
ary
Scho
ol23
3137
64
404
145
615
156
38.6
2%89
61.3
8%8
Kam
bald
a W
est D
istri
ct H
igh
Scho
ol80
120
100
2026
185
753
830
568
224
41.6
4%31
458
.36%
9La
verto
n Pr
imar
y Sc
hool
931
129
444
010
92
111
4238
.53%
6761
.47%
10Le
inst
er C
omm
unity
Hal
l18
1819
67
271
965
101
5052
.08%
4647
.92%
11Le
onor
a R
ecre
atio
n C
entre
4445
1817
2145
119
17
198
103
53.9
3%88
46.0
7%12
Nor
sem
an T
own
Hal
l26
5329
710
108
523
814
252
7732
.49%
160
67.5
1%13
Nor
th K
algo
orlie
Prim
ary
Scho
ol38
644
712
641
3631
926
1,38
146
1,42
783
860
.68%
543
39.3
2%14
O'C
onno
r Prim
ary
Scho
ol48
235
214
550
5428
65
1,37
459
1,43
388
364
.31%
490
35.6
9%2,
371
2,35
91,
085
401
391
2,45
010
59,
162
441
9,60
35,
021
54.8
3%4,
136
45.1
7%Ab
sent
Vot
es26
317
113
164
3724
49
919
3995
847
351
.47%
446
48.5
3%Ea
rly V
otes
(by
Post
)24
115
311
226
3515
66
729
3176
042
558
.38%
303
41.6
2%Ea
rly V
otes
(In
Pers
on)
1,34
699
650
411
215
21,
029
284,
167
129
4,29
62,
526
60.6
5%1,
639
39.3
5%Pr
ovis
iona
l Vot
es8
24
22
70
252
2714
56.0
0%11
44.0
0%Sp
ecia
l Ins
titut
ions
, H
ospi
tals
& R
emot
es27
3210
415
791
195
720
274
37.9
5%12
162
.05%
1,88
51,
354
761
245
231
1,51
544
6,03
520
86,
243
3,51
258
.22%
2,52
041
.78%
4,25
63,
713
1,84
664
662
23,
965
149
15,1
9764
915
,846
8,53
356
.18%
6,65
643
.82%
28.0
1%24
.43%
12.1
5%4.
25%
4.09
%26
.09%
0.98
%10
0.00
%
O'D
ON
NEL
L K
yran
Vote
s
CR
OO
K T
ony
Vote
s
BO
LTO
N R
icha
rdVo
tes
SPU
RLI
NG
Jac
quel
ine
Vote
s
LUC
AS
Mik
eVo
tes
FOR
STER
Dar
ren
Vote
s
ERW
IN J
ames
Vote
s
Vote
sre
mai
ning
in c
ount
Exha
uste
dVo
tes
Tota
lFo
rmal
Vote
s4,
256
3,71
31,
846
646
622
3,96
514
915
,197
15,1
9712
2316
2041
3714
914
9To
tal
4,26
83,
736
1,86
266
666
34,
002
15,1
9715
,197
9613
125
655
125
663
663
Tota
l4,
364
3,86
72,
118
721
4,12
715
,197
15,1
9712
213
178
390
721
721
Tota
l4,
486
3,99
82,
196
4,51
715
,197
15,1
9779
281
458
52,
191
52,
196
Tota
l5,
278
4,81
25,
102
15,1
925
15,1
973,
255
1,55
44,
809
34,
812
8,53
36,
656
15,1
898
15,1
97
56.1
8%43
.82%
Abs
olut
e M
ajor
ity =
759
5
Dis
tric
t Tot
al
Firs
t Pre
fere
nce
Vote
sER
WIN
Exc
lude
d
LUC
AS
Excl
uded
SPU
RLI
NG
Exc
lude
d
BO
LTO
N E
xclu
ded
Tota
l Firs
t Pre
fere
nces
Vot
es
%To
tal V
alid
Vot
es
O'D
ON
NEL
L K
yran
LIB
CR
OO
K E
xclu
ded
FOR
STER
Dar
ren
ALP
Kal
goor
lie E
lect
oral
Dis
tric
t
11 M
arch
201
7M
inin
g an
d Pa
stor
al R
egio
n
Two
Can
dida
te P
refe
rred
Vot
es
Pref
eren
ce D
istr
ibut
ion
Kyr
an M
artin
O'D
ON
NEL
LLi
bera
l Par
tyel
ecte
d as
the
mem
ber f
orK
ALG
OO
RLI
Ew
ith a
maj
ority
of
1877
vot
es
Firs
t Pre
fere
nce
Vote
s Po
lled
for e
ach
Can
dida
te a
t eac
h Po
lling
Pla
ce
Vote
r Tur
nout
= 7
9.14
%In
form
al V
otes
= 4
.1%
Polli
ng P
lace
Tot
als
Dis
trib
utio
n of
Pre
fere
nces
Dec
lara
tion
and
Mob
ile V
otes
Tot
al
ALP
43
.82%
LI
B
56.1
8%
2 C
andi
date
Pre
ferr
ed
Page 60
2017 State General ElectionResults and Statistics Report
59
Local Governments within District
Shire of Broome
Shire of Derby-West Kimberley
Shire of Halls Creek
Shire of Wyndham-East Kimberley
Males 8,105
Females 8,739
Total 16,844
Electors Habitation
1 3,407
2 2,322
3 748
>3 441 Returning Officer
Total Habitations 6,918 Garry WALDRON
Candidate Name Party
FARRER, Josephine WA Labor
Candidate Name Party
FARRER, Josephine WA Labor
Number of Electors on Roll
Number of Electors per Habitation
Elected Candidate for Kimberley
Previous Member
District of KimberleyMining and Pastoral Region
Elector information correct as at 9 February 2017
Area (sq km)
421,011
This figure is the gazetted area and may include bodies of water
Page 61
2017
Sta
te G
ener
al E
lect
ion
Res
ults
and
Sta
tistic
s R
epor
t 60
1684
4
PP No.
Polli
ng P
lace
JON
ES K
aiIN
DVo
tes
CH
APM
AN G
raha
mIN
DVo
tes
ALB
REY
Rya
nFL
UX
Vote
s
VAU
GH
AN L
izG
RN
Vote
s
WR
IGH
T K
eith
Dav
idPH
ON
Vote
s
GR
EATO
REX
War
ren
LIB
Vote
s
FAR
RER
Jos
ieAL
PVo
tes
HO
UST
ON
Rob
NAT
Vote
s
Tota
lFo
rmal
Vote
s
Info
rmal
Vote
sTo
tal
Vote
s
1B
room
e P
rimar
y S
choo
l29
1414
162
7816
454
816
31,
172
421,
214
362
30.8
9%81
069
.11%
2C
able
Bea
ch P
rimar
y S
choo
l12
3814
9943
9935
311
677
425
799
228
29.4
6%54
670
.54%
3D
erby
Dis
trict
Hig
h S
choo
l14
83
4960
138
381
111
764
3579
926
034
.03%
504
65.9
7%4
Fitz
roy
Val
ley
Dis
trict
Hig
h S
choo
l10
40
2011
2527
122
363
1637
949
13.5
0%31
486
.50%
5H
alls
Cre
ek D
istri
ct H
igh
Sch
ool
54
011
1870
258
2739
323
416
105
26.7
9%28
773
.21%
6K
unun
urra
Lei
sure
Cen
tre13
1110
7515
417
536
528
51,
088
581,
146
527
48.4
8%56
051
.52%
7R
oebu
ck B
ay P
rimar
y S
choo
l10
1111
9452
198
261
182
819
3385
236
844
.99%
450
55.0
1%8
War
mun
Cou
ncil
Cha
mbe
rs2
10
21
896
211
26
118
1210
.71%
100
89.2
9%9
Wyn
dham
Dis
trict
Hig
h S
choo
l7
20
624
4516
514
263
2328
681
30.8
0%18
269
.20%
102
9352
518
441
922
2,69
892
25,
748
261
6,00
91,
992
34.6
7%3,
753
65.3
3%A
bsen
t Vot
es19
412
7160
136
234
9362
923
652
272
43.2
4%35
756
.76%
Ear
ly V
otes
(by
Pos
t)7
73
2968
121
8783
405
1441
924
760
.99%
158
39.0
1%E
arly
Vot
es (I
n P
erso
n)60
4920
400
356
614
1,07
872
83,
305
122
3,42
71,
480
44.8
1%1,
823
55.1
9%P
rovi
sion
al V
otes
10
00
30
90
130
133
23.0
8%10
76.9
2%S
peci
al In
stitu
tions
, H
ospi
tals
& R
emot
es33
125
6724
245
1,14
489
1,61
978
1,69
733
920
.94%
1,28
079
.06%
120
7240
567
511
1,11
62,
552
993
5,97
123
76,
208
2,34
139
.22%
3,62
860
.78%
222
165
921,
085
952
2,03
85,
250
1,91
511
,719
498
12,2
174,
333
36.9
9%7,
381
63.0
1%
1.89
%1.
41%
0.79
%9.
26%
8.12
%17
.39%
44.8
0%16
.34%
100.
00%
JON
ES K
aiVo
tes
CH
APM
AN G
raha
mVo
tes
ALB
REY
Rya
nVo
tes
VAU
GH
AN L
izVo
tes
WR
IGH
T K
eith
Dav
idVo
tes
GR
EATO
REX
War
ren
Vote
s
FAR
RER
Jos
ieVo
tes
HO
UST
ON
Rob
Vote
s
Vote
sre
mai
ning
in c
ount
Exha
uste
dVo
tes
Tota
lFo
rmal
Vote
s22
216
592
1,08
595
22,
038
5,25
01,
915
11,7
1911
,719
1818
2110
115
992
92To
tal
240
183
1,10
696
22,
049
5,25
51,
924
11,7
1911
,719
8216
1919
2819
183
183
Tota
l32
21,
122
981
2,06
85,
283
1,94
311
,719
11,7
1915
146
3348
4332
11
322
Tota
l1,
273
1,02
72,
101
5,33
11,
986
11,7
181
11,7
1916
741
015
828
81,
023
41,
027
Tota
l1,
440
2,51
15,
489
2,27
411
,714
511
,719
217
898
325
1,44
01,
440
Tota
l2,
728
6,38
72,
599
11,7
145
11,7
191,
605
994
2,59
92,
599
4,33
37,
381
11,7
145
11,7
19
36.9
9%63
.01%
Abso
lute
Maj
ority
= 5
858
Dis
tric
t Tot
alH
OU
STO
N E
xclu
ded
Firs
t Pre
fere
nce
Vot
esAL
BR
EY E
xclu
ded
CH
APM
AN E
xclu
ded
JON
ES E
xclu
ded
WR
IGH
T Ex
clud
ed
Tota
l Firs
t Pre
fere
nces
Vot
es
%To
tal V
alid
Vot
es
GR
EATO
REX
War
ren
LIB
VAU
GH
AN E
xclu
ded
FAR
RER
Jos
ieAL
P
Kim
berle
y El
ecto
ral D
istr
ict
11 M
arch
201
7M
inin
g an
d Pa
stor
al R
egio
n
Two
Can
dida
te P
refe
rred
Vot
es
Pref
eren
ce D
istr
ibut
ion
Jose
phin
e FA
RR
ERW
A La
bor
elec
ted
as th
e m
embe
r for
KIM
BER
LEY
with
a m
ajor
ity o
f30
48 v
otes
Firs
t Pre
fere
nce
Vote
s Po
lled
for e
ach
Can
dida
te a
t eac
h Po
lling
Pla
ce
Vote
r Tur
nout
= 7
2.53
%In
form
al V
otes
= 4
.08%
Polli
ng P
lace
Tot
als
Dis
trib
utio
n of
Pre
fere
nces
Dec
lara
tion
and
Mob
ile V
otes
Tot
al
ALP
63
.01%
LIB
36
.99%
2 C
andi
date
Pre
ferr
ed
Page 62
2017 State General ElectionResults and Statistics Report
61
Suburbs within District
Greenwood
Kingsley
Warwick
Woodvale
Males 12,758
Females 13,338
Total 26,096
Electors Habitation
1 3,452
2 6,057
3 1,916
>3 1,101 Returning Officer
Total Habitations 12,526 Steve MACCORA
Candidate Name Party
STOJKOVSKI, Jessica Mary Christine WA Labor
Candidate Name Party
MITCHELL, Andrea Ruth Liberal Party
Number of Electors on Roll
Number of Electors per Habitation
Elected Candidate for Kingsley
Previous Member
District of KingsleyNorth Metropolitan RegionElector information correct as at 9 February 2017
Area (sq km)
23
This figure is the gazetted area and may include bodies of water
Page 63
2017
Sta
te G
ener
al E
lect
ion
Res
ults
and
Sta
tistic
s R
epor
t 62
2609
6
PP No.
Polli
ng P
lace
McN
AIR
Joh
nJM
WA
Vote
s
STAL
TAR
I D
omin
icM
BP
Vote
s
MIT
CH
ELL
And
rea
LIB
Vote
s
BU
RN
SID
E G
ilber
t Gra
eme
ACP
Vote
s
WAR
D M
atth
ewG
RN
Vote
s
STO
JKO
VSK
I J
essi
caAL
PVo
tes
Tota
lFo
rmal
Vote
s
Info
rmal
Vote
sTo
tal
Vote
s
1C
hurc
h of
Chr
ist W
arw
ick
1911
387
3887
433
975
491,
024
451
46.2
6%52
453
.74%
2C
rean
ey P
rimar
y S
choo
l58
421,
155
9229
81,
135
2,78
012
32,
903
1,33
948
.17%
1,44
151
.83%
3G
oolle
lal P
rimar
y S
choo
l25
1779
558
166
684
1,74
562
1,80
788
950
.95%
856
49.0
5%4
Gre
enw
ood
Col
lege
3924
989
109
289
1,07
02,
520
105
2,62
51,
166
46.2
7%1,
354
53.7
3%5
Gre
enw
ood
Prim
ary
Sch
ool
3129
658
4020
082
01,
778
821,
860
777
43.7
3%1,
000
56.2
7%6
Hal
idon
Prim
ary
Sch
ool
2520
748
3313
455
81,
518
451,
563
831
54.7
4%68
745
.26%
7H
awke
r Par
k P
rimar
y S
choo
l16
937
728
8040
491
431
945
424
46.3
9%49
053
.61%
8N
orth
Woo
dval
e P
rimar
y S
choo
l48
401,
237
6722
91,
125
2,74
611
62,
862
1,39
550
.82%
1,35
049
.18%
9W
oodv
ale
Sec
onda
ry C
olle
ge20
1972
830
137
648
1,58
276
1,65
880
350
.76%
779
49.2
4%28
121
17,
074
495
1,62
06,
877
16,5
5868
917
,247
8,07
548
.77%
8,48
151
.23%
Abs
ent V
otes
4933
615
5026
571
31,
725
100
1,82
576
144
.14%
963
55.8
6%E
arly
Vot
es (b
y P
ost)
5936
959
4911
469
71,
914
100
2,01
41,
068
55.8
0%84
644
.20%
Ear
ly V
otes
(In
Per
son)
7143
1,11
561
207
981
2,47
868
2,54
61,
267
51.1
3%1,
211
48.8
7%P
rovi
sion
al V
otes
00
20
14
71
82
28.5
7%5
71.4
3%S
peci
al In
stitu
tions
, H
ospi
tals
& R
emot
es13
049
01
3396
510
161
63.5
4%35
36.4
6%19
211
22,
740
160
588
2,42
86,
220
274
6,49
43,
159
50.8
0%3,
060
49.2
0%
473
323
9,81
465
52,
208
9,30
522
,778
963
23,7
4111
,234
49.3
3%11
,541
50.6
7%
2.08
%1.
42%
43.0
9%2.
88%
9.69
%40
.85%
100.
00%
McN
AIR
Joh
nVo
tes
STAL
TAR
I D
omin
icVo
tes
MIT
CH
ELL
And
rea
Vote
s
BU
RN
SID
E G
ilber
t Gra
eme
Vote
s
WAR
D M
atth
ewVo
tes
STO
JKO
VSK
I J
essi
caVo
tes
Vote
sre
mai
ning
in c
ount
Exha
uste
dVo
tes
Tota
lFo
rmal
Vote
s47
332
39,
814
655
2,20
89,
305
22,7
7822
,778
110
6732
4766
322
132
3To
tal
583
9,88
168
72,
255
9,37
122
,777
122
,778
228
148
8412
358
358
3To
tal
10,1
0983
52,
339
9,49
422
,777
122
,778
542
154
139
835
835
Tota
l10
,651
2,49
39,
633
22,7
771
22,7
7858
31,
908
2,49
12
2,49
311
,234
11,5
4122
,775
322
,778
49.3
3%50
.67%
Abso
lute
Maj
ority
= 1
1388
Dis
tric
t Tot
al
Firs
t Pre
fere
nce
Vot
esST
ALTA
RI E
xclu
ded
McN
AIR
Exc
lude
d
BU
RN
SID
E Ex
clud
ed
WAR
D E
xclu
ded
Tota
l Firs
t Pre
fere
nces
Vot
es
%To
tal V
alid
Vot
es
MIT
CH
ELL
And
rea
LIB
STO
JKO
VSK
I J
essi
caAL
P
Kin
gsle
y El
ecto
ral D
istr
ict
11 M
arch
201
7N
orth
Met
ropo
litan
Reg
ion
Two
Can
dida
te P
refe
rred
Vot
es
Pref
eren
ce D
istr
ibut
ion
Jess
ica
Mar
y C
hris
tine
STO
JKO
VSK
IW
A La
bor
elec
ted
as th
e m
embe
r for
KIN
GSL
EYw
ith a
maj
ority
of
307
vote
s
Firs
t Pre
fere
nce
Vote
s Po
lled
for e
ach
Can
dida
te a
t eac
h Po
lling
Pla
ce
Vote
r Tur
nout
= 9
0.98
%In
form
al V
otes
= 4
.06%
Polli
ng P
lace
Tot
als
Dis
trib
utio
n of
Pre
fere
nces
Dec
lara
tion
and
Mob
ile V
otes
Tot
al
ALP
50
.67%
LI
B
49.3
3%
2 C
andi
date
Pre
ferr
ed
Page 64
2017 State General ElectionResults and Statistics Report
63
Suburbs within DistrictAnketell
Atwell
Aubin Grove
Banjup
Males 12,633 Calista
Females 13,077 Casuarina
Total 25,710 Hammond Park
Henderson
Hope Valley
Electors Habitation Kwinana Beach
1 4,965 Kwinana Town Centre
2 6,228 Leda
3 1,644 Mandogalup
>3 773 Medina
Total Habitations 13,610 Naval Base
Orelia
Parmelia
Postans
The Spectacles
Wandi
Wattleup
Returning Officer
Tim BERRYMAN
Candidate Name Party
COOK, Roger Hugh WA Labor
Candidate Name Party
COOK, Roger Hugh WA Labor
Number of Electors on Roll
Number of Electors per Habitation
Elected Candidate for Kwinana
Previous Member
District of KwinanaSouth Metropolitan Region
Elector information correct as at 9 February 2017
Area (sq km)
142
This figure is the gazetted area and may include bodies of water
Page 65
2017
Sta
te G
ener
al E
lect
ion
Res
ults
and
Sta
tistic
s R
epor
t 64
2571
0
PP No.
Polli
ng P
lace
CO
OK
Rog
erAL
PVo
tes
TALB
OT
Bia
nca
LIB
Vote
s
TAYL
OR
Tim
PHO
NVo
tes
MO
REL
Ele
anor
Cha
rmai
neAC
PVo
tes
FREE
MAN
Jod
yG
RN
Vote
s
HYD
E J
oshu
aM
BP
Vote
s
Tota
lFo
rmal
Vote
s
Info
rmal
Vote
sTo
tal
Vote
s
1At
wel
l Prim
ary
Scho
ol1,
165
688
188
6624
838
2,39
313
32,
526
1,51
063
.10%
883
36.9
0%2
Aubi
n G
rove
Prim
ary
Scho
ol78
859
414
159
116
211,
719
761,
795
966
56.2
0%75
343
.80%
3C
alis
ta P
rimar
y Sc
hool
1,03
715
813
937
9910
1,48
092
1,57
21,
207
81.5
5%27
318
.45%
4H
amm
ond
Park
Prim
ary
Scho
ol63
037
481
2585
211,
216
501,
266
750
61.6
8%46
638
.32%
5H
arm
ony
Prim
ary
Scho
ol74
557
111
225
113
141,
580
891,
669
902
57.0
9%67
842
.91%
6Le
da P
rimar
y Sc
hool
389
5270
2172
1061
434
648
502
81.7
6%11
218
.24%
7M
edin
a Pr
imar
y Sc
hool
976
122
138
1712
817
1,39
897
1,49
51,
166
83.4
0%23
216
.60%
8N
orth
Par
mel
ia P
rimar
y Sc
hool
1,05
214
812
833
9822
1,48
189
1,57
01,
224
82.6
5%25
717
.35%
9Pe
ter C
arnl
ey A
nglic
an C
omm
unity
Sch
ool
161
2419
1221
123
811
249
190
79.8
3%48
20.1
7%10
St V
ince
nt's
Sch
ool
302
4124
532
240
617
423
352
86.7
0%54
13.3
0%11
Wan
di P
avilio
n41
833
791
2386
1196
645
1,01
152
454
.30%
441
45.7
0%7,
663
3,10
91,
131
323
1,09
816
713
,491
733
14,2
249,
293
68.8
9%4,
197
31.1
1%Ab
sent
Vot
es1,
391
615
286
8733
257
2,76
817
32,
941
1,84
866
.81%
918
33.1
9%Ea
rly V
otes
(by
Post
)81
036
818
346
8729
1,52
353
1,57
698
364
.59%
539
35.4
1%Ea
rly V
otes
(In
Pers
on)
1,68
671
036
260
222
453,
085
102
3,18
72,
082
67.5
3%1,
001
32.4
7%Pr
ovis
iona
l Vot
es13
43
00
020
525
1365
.00%
735
.00%
Spec
ial I
nstit
utio
ns,
Hos
pita
ls &
Rem
otes
2918
30
30
5312
6532
60.3
8%21
39.6
2%3,
929
1,71
583
719
364
413
17,
449
345
7,79
44,
958
66.6
0%2,
486
33.4
0%
11,5
924,
824
1,96
851
61,
742
298
20,9
401,
078
22,0
1814
,251
68.0
8%6,
683
31.9
2%
55.3
6%23
.04%
9.40
%2.
46%
8.32
%1.
42%
100.
00%
CO
OK
Rog
erVo
tes
TALB
OT
Bia
nca
Vote
s
TAYL
OR
Tim
Vote
s
MO
REL
Ele
anor
Cha
rmai
neVo
tes
FREE
MAN
Jod
yVo
tes
HYD
E J
oshu
aVo
tes
Vote
sre
mai
ning
in c
ount
Exha
uste
dVo
tes
Tota
lFo
rmal
Vote
s11
,592
4,82
41,
968
516
1,74
229
820
,940
20,9
4069
3649
4599
298
298
Tota
l11
,661
4,86
02,
017
561
1,84
120
,940
20,9
4014
922
097
9556
156
1To
tal
11,8
105,
080
2,11
41,
936
20,9
4020
,940
1,41
527
424
41,
933
31,
936
Tota
l13
,225
5,35
42,
358
20,9
373
20,9
401,
026
1,32
92,
355
32,
358
14,2
516,
683
20,9
346
20,9
40
68.0
8%31
.92%
Abso
lute
Maj
ority
= 1
0468
Dis
tric
t Tot
al
Firs
t Pre
fere
nce
Vote
sH
YDE
Excl
uded
MO
REL
Exc
lude
d
FREE
MAN
Exc
lude
d
TAYL
OR
Exc
lude
d
Tota
l Firs
t Pre
fere
nces
Vot
es
%To
tal V
alid
Vot
es
CO
OK
Rog
erAL
P
TALB
OT
Bia
nca
LIB
Kw
inan
a El
ecto
ral D
istr
ict
11 M
arch
201
7So
uth
Met
ropo
litan
Reg
ion
Two
Can
dida
te P
refe
rred
Vot
es
Pref
eren
ce D
istr
ibut
ion
Rog
er H
ugh
CO
OK
WA
Lab
orel
ecte
d as
the
mem
ber f
orK
WIN
AN
Aw
ith a
maj
ority
of
7568
vot
es
Firs
t Pre
fere
nce
Vote
s Po
lled
for e
ach
Can
dida
te a
t eac
h Po
lling
Pla
ce
Vote
r Tur
nout
= 8
5.64
%In
form
al V
otes
= 4
.9%
Polli
ng P
lace
Tot
als
Dis
trib
utio
n of
Pre
fere
nces
Dec
lara
tion
and
Mob
ile V
otes
Tot
al
LIB
31
.92%
ALP
68
.08%
2 C
andi
date
Pre
ferr
ed
Page 66
2017 State General ElectionResults and Statistics Report
65
Local Governments within District
City of Mandurah
Shire of Murray
Males 13,922
Females 15,055
Total 28,977
Electors Habitation
1 6,906
2 6,936
3 1,664
>3 712 Returning Officer
Total Habitations 16,218 Tracey FORD
Candidate Name Party
TEMPLEMAN, David Alan WA Labor
Candidate Name Party
TEMPLEMAN, David Alan WA Labor
Number of Electors on Roll
Number of Electors per Habitation
Elected Candidate for Mandurah
Previous Member
District of MandurahSouth West Region
Elector information correct as at 9 February 2017
Area (sq km)
74
This figure is the gazetted area and may include bodies of water
Page 67
2017
Sta
te G
ener
al E
lect
ion
Res
ults
and
Sta
tistic
s R
epor
t 66
2897
7
PP No.
Polli
ng P
lace
CAR
RIE
-WIL
SON
Seb
FLU
XVo
tes
RO
WLA
ND
S L
ynne
LIB
Vote
s
SHAW
Dou
gPH
ON
Vote
s
BAT
SIO
UD
IS P
aul
MB
PVo
tes
TUR
NER
Jas
onN
ATVo
tes
TEM
PLEM
AN D
avid
ALP
Vote
s
MO
FFAT
Jod
ieG
RN
Vote
s
Tota
lFo
rmal
Vote
s
Info
rmal
Vote
sTo
tal
Vote
s
1A
ssum
ptio
n C
atho
lic P
rimar
y S
choo
l17
323
183
1220
818
931,
466
771,
543
480
32.7
4%98
667
.26%
2B
illy
Dow
er Y
outh
Cen
tre10
112
807
1540
248
674
3871
218
327
.15%
491
72.8
5%3
Coo
danu
p C
omm
unity
Col
lege
1614
696
1117
487
3981
246
858
224
27.5
9%58
872
.41%
4Fo
unda
tion
Chr
istia
n C
olle
ge23
283
215
1326
915
771,
552
831,
635
474
30.5
4%1,
078
69.4
6%5
Mad
ora
Bay
Com
mun
ity H
all
820
579
214
495
5986
237
899
269
31.2
1%59
368
.79%
6M
andu
rah
Bap
tist C
olle
ge28
342
197
731
979
961,
680
771,
757
515
30.6
9%1,
163
69.3
1%7
Man
dura
h P
rimar
y S
choo
l14
253
9310
2461
462
1,07
063
1,13
334
932
.62%
721
67.3
8%8
RAA
FA E
stat
e - M
eado
w S
prin
gs9
251
853
3242
626
832
4087
234
241
.16%
489
58.8
4%9
Riv
ersi
de P
rimar
y S
choo
l12
147
111
520
580
5793
251
983
232
24.8
9%70
075
.11%
10W
est M
urra
y C
omm
unity
Hal
l3
132
733
2930
114
555
2658
121
238
.20%
343
61.8
0%14
02,
194
1,21
273
228
6,01
757
110
,435
538
10,9
733,
280
31.4
4%7,
152
68.5
6%A
bsen
t Vot
es46
317
265
1661
795
168
1,66
888
1,75
654
932
.95%
1,11
767
.05%
Ear
ly V
otes
(by
Pos
t)16
476
245
1137
899
431,
727
121
1,84
865
337
.81%
1,07
462
.19%
Ear
ly V
otes
(In
Per
son)
781,
981
1,25
855
160
5,45
728
29,
271
502
9,77
32,
902
31.3
1%6,
366
68.6
9%P
rovi
sion
al V
otes
11
20
120
025
328
28.
00%
2392
.00%
Spe
cial
Inst
itutio
ns,
Hos
pita
ls &
Rem
otes
446
260
085
816
910
179
6538
.46%
104
61.5
4%14
52,
821
1,79
682
259
7,25
650
112
,860
724
13,5
844,
171
32.4
5%8,
684
67.5
5%
285
5,01
53,
008
155
487
13,2
731,
072
23,2
951,
262
24,5
577,
451
32.0
0%15
,836
68.0
0%
1.22
%21
.53%
12.9
1%0.
67%
2.09
%56
.98%
4.60
%10
0.00
%
CAR
RIE
-WIL
SON
Seb
Vote
s
RO
WLA
ND
S L
ynne
Vote
s
SHAW
Dou
gVo
tes
BAT
SIO
UD
IS P
aul
Vote
s
TUR
NER
Jas
onVo
tes
TEM
PLEM
AN D
avid
Vote
s
MO
FFAT
Jod
ieVo
tes
Vote
sre
mai
ning
in c
ount
Exha
uste
dVo
tes
Tota
lFo
rmal
Vote
s28
55,
015
3,00
815
548
713
,273
1,07
223
,295
23,2
9538
1539
1931
1315
515
5To
tal
323
5,03
03,
047
506
13,3
041,
085
23,2
9523
,295
107
6732
5263
321
232
3To
tal
5,13
73,
114
538
13,3
561,
148
23,2
932
23,2
9525
390
128
6553
62
538
Tota
l5,
390
3,20
413
,484
1,21
323
,291
423
,295
157
174
880
1,21
12
1,21
3To
tal
5,54
73,
378
14,3
6423
,289
623
,295
1,90
41,
472
3,37
62
3,37
87,
451
15,8
3623
,287
823
,295
32.0
0%68
.00%
Abso
lute
Maj
ority
= 1
1644
Dis
tric
t Tot
al
Firs
t Pre
fere
nce
Vot
esB
ATSI
OU
DIS
Exc
lude
d
CAR
RIE
-WIL
SON
Exc
lude
d
TUR
NER
Exc
lude
d
MO
FFAT
Exc
lude
d
Tota
l Firs
t Pre
fere
nces
Vot
es
%To
tal V
alid
Vot
es
RO
WLA
ND
S L
ynne
LIB
SHAW
Exc
lude
d
TEM
PLEM
AN D
avid
ALP
Man
dura
h El
ecto
ral D
istr
ict
11 M
arch
201
7So
uth
Wes
t Reg
ion
Two
Can
dida
te P
refe
rred
Vot
es
Pref
eren
ce D
istr
ibut
ion
Dav
id A
lan
TEM
PLEM
ANW
A La
bor
elec
ted
as th
e m
embe
r for
MAN
DU
RAH
with
a m
ajor
ity o
f83
85 v
otes
Firs
t Pre
fere
nce
Vote
s Po
lled
for e
ach
Can
dida
te a
t eac
h Po
lling
Pla
ce
Vote
r Tur
nout
= 8
4.75
%In
form
al V
otes
= 5
.14%
Polli
ng P
lace
Tot
als
Dis
trib
utio
n of
Pre
fere
nces
Dec
lara
tion
and
Mob
ile V
otes
Tot
al
ALP
68
.00%
LIB
32
.00%
2 C
andi
date
Pre
ferr
ed
Page 68
2017 State General ElectionResults and Statistics Report
67
Suburbs within District
Bayswater
Bedford
Embleton
Inglewood
Males 13,624 Maylands
Females 14,073 Morley
Total 27,697
Electors Habitation
1 7,522
2 6,322
3 1,486
>3 710 Returning Officer
Total Habitations 16,040 Andrew WILSON
Candidate Name Party
BAKER, Lisa Loraine WA Labor
Candidate Name Party
BAKER, Lisa Loraine WA Labor
Number of Electors on Roll
Number of Electors per Habitation
Elected Candidate for Maylands
Previous Member
District of MaylandsEast Metropolitan RegionElector information correct as at 9 February 2017
Area (sq km)
21
This figure is the gazetted area and may include bodies of water
Page 69
2017
Sta
te G
ener
al E
lect
ion
Res
ults
and
Sta
tistic
s R
epor
t 68
2769
7
PP No.
Polli
ng P
lace
SMIT
H G
reg
JMW
AVo
tes
PER
KS
Car
olin
eG
RN
Vote
s
BAK
ER L
isa
ALP
Vote
s
FEN
SOM
E B
enny
MB
PVo
tes
KLE
YN M
att
ACP
Vote
s
MAD
DEN
Am
anda
LIB
Vote
s
Tota
lFo
rmal
Vote
s
Info
rmal
Vote
sTo
tal
Vote
s
1B
aysw
ater
Sen
ior C
itize
ns C
entre
7843
81,
122
4842
530
2,25
814
92,
407
1,61
271
.39%
646
28.6
1%2
Bea
ufor
t Par
k H
all
1919
565
913
1639
31,
295
821,
377
856
66.2
0%43
733
.80%
3E
mbl
eton
Prim
ary
Sch
ool
2012
950
217
2219
588
546
931
645
72.9
6%23
927
.04%
4H
illcr
est P
rimar
y S
choo
l39
254
876
2637
396
1,62
880
1,70
81,
154
70.9
3%47
329
.07%
5In
glew
ood
Mas
onic
Hal
l25
281
594
721
307
1,23
553
1,28
888
071
.26%
355
28.7
4%6
Ingl
ewoo
d P
rimar
y S
choo
l43
406
1,07
824
2972
62,
306
120
2,42
61,
463
63.4
4%84
336
.56%
7M
ayla
nds
Pen
insu
la P
rimar
y S
choo
l34
418
906
1739
541
1,95
574
2,02
91,
320
67.5
2%63
532
.48%
8S
choo
l of I
nstru
men
tal M
usic
3230
268
920
4040
01,
483
831,
566
999
67.3
6%48
432
.64%
9S
t Pet
ers
Par
ish
Hal
l9
8127
55
414
852
228
550
353
67.6
2%16
932
.38%
299
2,50
46,
701
177
250
3,63
613
,567
715
14,2
829,
282
68.4
4%4,
281
31.5
6%A
bsen
t Vot
es74
622
1,25
639
7470
12,
766
155
2,92
11,
911
69.1
1%85
430
.89%
Ear
ly V
otes
(by
Pos
t)51
244
920
3647
629
1,92
799
2,02
61,
193
61.9
1%73
438
.09%
Ear
ly V
otes
(In
Per
son)
106
546
2,39
864
801,
217
4,41
119
64,
607
3,01
068
.27%
1,39
931
.73%
Pro
visi
onal
Vot
es0
14
00
16
06
583
.33%
116
.67%
Spe
cial
Inst
itutio
ns,
Hos
pita
ls &
Rem
otes
93
990
271
184
619
010
858
.70%
7641
.30%
240
1,41
64,
677
139
203
2,61
99,
294
456
9,75
06,
227
67.0
2%3,
064
32.9
8%
539
3,92
011
,378
316
453
6,25
522
,861
1,17
124
,032
15,5
0967
.86%
7,34
532
.14%
2.36
%17
.15%
49.7
7%1.
38%
1.98
%27
.36%
100.
00%
SMIT
H G
reg
Vote
s
PER
KS
Car
olin
eVo
tes
BAK
ER L
isa
Vote
s
FEN
SOM
E B
enny
Vote
s
KLE
YN M
att
Vote
s
MAD
DEN
Am
anda
Vote
s
Vote
sre
mai
ning
in c
ount
Exha
uste
dVo
tes
Tota
lFo
rmal
Vote
s53
93,
920
11,3
7831
645
36,
255
22,8
6122
,861
7361
7048
6331
51
316
Tota
l61
23,
981
11,4
4850
16,
318
22,8
601
22,8
6111
155
8924
449
92
501
Tota
l72
34,
036
11,5
376,
562
22,8
583
22,8
6131
521
918
772
12
723
Tota
l4,
351
11,7
566,
749
22,8
565
22,8
613,
753
596
4,34
92
4,35
115
,509
7,34
522
,854
722
,861
67.8
6%32
.14%
Abso
lute
Maj
ority
= 1
1428
Dis
tric
t Tot
al
Firs
t Pre
fere
nce
Vot
esFE
NSO
ME
Excl
uded
KLE
YN E
xclu
ded
SMIT
H E
xclu
ded
PER
KS
Excl
uded
Tota
l Firs
t Pre
fere
nces
Vot
es
%To
tal V
alid
Vot
es
BAK
ER L
isa
ALP
MAD
DEN
Am
anda
LIB
May
land
s El
ecto
ral D
istr
ict
11 M
arch
201
7Ea
st M
etro
polit
an R
egio
n
Two
Can
dida
te P
refe
rred
Vot
es
Pref
eren
ce D
istr
ibut
ion
Lisa
Lor
aine
BAK
ERW
A La
bor
elec
ted
as th
e m
embe
r for
MAY
LAN
DS
with
a m
ajor
ity o
f81
64 v
otes
Firs
t Pre
fere
nce
Vote
s Po
lled
for e
ach
Can
dida
te a
t eac
h Po
lling
Pla
ce
Vote
r Tur
nout
= 8
6.77
%In
form
al V
otes
= 4
.87%
Polli
ng P
lace
Tot
als
Dis
trib
utio
n of
Pre
fere
nces
Dec
lara
tion
and
Mob
ile V
otes
Tot
al
LIB
32
.14%
ALP
67
.86%
2 C
andi
date
Pre
ferr
ed
Page 70
2017 State General ElectionResults and Statistics Report
69
Suburbs within District
Bellevue
Boya
Caversham
Darlington
Males 14,659 Greenmount
Females 14,944 Guildford
Total 29,603 Hazelmere
Helena Valley
Jane Brook
Electors Habitation Koongamia
1 6,307 Middle Swan
2 6,581 Midland
3 1,972 Midvale
>3 934 Red Hill
Total Habitations 15,794 South Guildford
Stratton
Swan View
Viveash
West Swan
Woodbridge
Returning Officer
Adrian MALKOVIC
Candidate Name Party
ROBERTS, Michelle Hopkins WA Labor
Candidate Name Party
ROBERTS, Michelle Hopkins WA Labor
Number of Electors on Roll
Number of Electors per Habitation
Elected Candidate for Midland
Previous Member
District of MidlandEast Metropolitan RegionElector information correct as at 9 February 2017
Area (sq km)
67
This figure is the gazetted area and may include bodies of water
Page 71
2017
Sta
te G
ener
al E
lect
ion
Res
ults
and
Sta
tistic
s R
epor
t 70
2960
3
PP No.
Polli
ng P
lace
PAR
ASIL
ITI
Dan
iel
LIB
Vote
s
BIL
TOFT
Joh
nM
BP
Vote
s
RO
BER
TS M
iche
lleAL
PVo
tes
D'A
NG
ELO
Ton
yPH
ON
Vote
s
BIG
GS
Mat
thew
GR
NVo
tes
PASS
MO
RE
Tre
ntSF
PVo
tes
RO
SS G
reg
JMW
AVo
tes
Tota
lFo
rmal
Vote
s
Info
rmal
Vote
sTo
tal
Vote
s
1B
elle
vue
Hal
l13
78
362
4779
187
658
4270
019
629
.79%
462
70.2
1%2
Cla
yton
Vie
w P
rimar
y S
choo
l12
98
241
2965
177
496
2251
817
735
.69%
319
64.3
1%3
Eas
t Bee
chbo
ro P
rimar
y S
choo
l13
12
326
3633
142
544
2957
317
331
.80%
371
68.2
0%4
Goo
dsta
rt E
arly
Lea
rnin
g S
tratto
n47
715
585
9484
337
1,29
565
1,36
057
344
.25%
722
55.7
5%5
Gre
enm
ount
Prim
ary
Sch
ool
460
965
011
214
645
71,
429
701,
499
578
40.4
5%85
159
.55%
6G
uild
ford
Tow
n H
all
355
1049
759
157
1621
1,11
538
1,15
343
539
.05%
679
60.9
5%7
Hel
ena
Val
ley
Prim
ary
Sch
ool
713
1772
311
816
843
121,
794
701,
864
851
47.4
4%94
352
.56%
8M
idla
nd T
own
Hal
l34
714
707
9716
043
141,
382
671,
449
459
33.2
4%92
266
.76%
9N
orth
Met
ropo
litan
TA
FE M
idla
nd C
ampu
s27
420
594
8481
4010
1,10
390
1,19
335
131
.85%
751
68.1
5%10
Stra
tton
Com
mun
ity H
all
279
1591
011
712
454
161,
515
971,
612
393
25.9
6%1,
121
74.0
4%11
Sw
an V
iew
Sen
ior H
igh
Sch
ool
795
151,
159
180
210
8015
2,45
412
32,
577
976
39.7
9%1,
477
60.2
1%4,
097
133
6,75
497
31,
307
403
118
13,7
8571
314
,498
5,16
237
.46%
8,61
862
.54%
Abs
ent V
otes
749
451,
305
251
359
114
242,
847
162
3,00
91,
003
35.2
8%1,
840
64.7
2%E
arly
Vot
es (b
y P
ost)
611
2787
623
597
4735
1,92
810
02,
028
806
41.8
5%1,
120
58.1
5%E
arly
Vot
es (I
n P
erso
n)1,
533
413,
088
452
364
124
525,
654
212
5,86
61,
960
34.6
7%3,
693
65.3
3%P
rovi
sion
al V
otes
41
70
01
013
013
430
.77%
969
.23%
Spe
cial
Inst
itutio
ns,
Hos
pita
ls &
Rem
otes
382
304
01
176
884
4153
.95%
3546
.05%
2,93
511
65,
306
942
820
287
112
10,5
1848
211
,000
3,81
436
.29%
6,69
763
.71%
7,03
224
912
,060
1,91
52,
127
690
230
24,3
031,
195
25,4
988,
976
36.9
5%15
,315
63.0
5%
28.9
3%1.
02%
49.6
2%7.
88%
8.75
%2.
84%
0.95
%10
0.00
%
PAR
ASIL
ITI
Dan
iel
Vote
s
BIL
TOFT
Joh
nVo
tes
RO
BER
TS M
iche
lleVo
tes
D'A
NG
ELO
Ton
yVo
tes
BIG
GS
Mat
thew
Vote
s
PASS
MO
RE
Tre
ntVo
tes
RO
SS G
reg
Vote
s
Vote
sre
mai
ning
in c
ount
Exha
uste
dVo
tes
Tota
lFo
rmal
Vote
s7,
032
249
12,0
601,
915
2,12
769
023
024
,303
24,3
0329
3249
2238
5922
91
230
Tota
l7,
061
281
12,1
091,
937
2,16
574
924
,302
124
,303
5576
4145
6428
128
1To
tal
7,11
612
,185
1,97
82,
210
813
24,3
021
24,3
0316
716
825
722
081
21
813
Tota
l7,
283
12,3
532,
235
2,43
024
,301
224
,303
1,09
964
148
72,
227
82,
235
Tota
l8,
382
12,9
942,
917
24,2
9310
24,3
0359
42,
321
2,91
52
2,91
78,
976
15,3
1524
,291
1224
,303
36.9
5%63
.05%
Abso
lute
Maj
ority
= 1
2146
Dis
tric
t Tot
al
Firs
t Pre
fere
nce
Vot
esR
OSS
Exc
lude
d
BIL
TOFT
Exc
lude
d
PASS
MO
RE
Excl
uded
D'A
NG
ELO
Exc
lude
d
Tota
l Firs
t Pre
fere
nces
Vot
es
%To
tal V
alid
Vot
es
PAR
ASIL
ITI
Dan
iel
LIB
BIG
GS
Excl
uded
RO
BER
TS M
iche
lleAL
P
Mid
land
Ele
ctor
al D
istr
ict
11 M
arch
201
7Ea
st M
etro
polit
an R
egio
n
Two
Can
dida
te P
refe
rred
Vot
es
Pref
eren
ce D
istr
ibut
ion
Mic
helle
Hop
kins
RO
BER
TSW
A La
bor
elec
ted
as th
e m
embe
r for
MID
LAN
Dw
ith a
maj
ority
of
6339
vot
es
Firs
t Pre
fere
nce
Vote
s Po
lled
for e
ach
Can
dida
te a
t eac
h Po
lling
Pla
ce
Vote
r Tur
nout
= 8
6.13
%In
form
al V
otes
= 4
.69%
Polli
ng P
lace
Tot
als
Dis
trib
utio
n of
Pre
fere
nces
Dec
lara
tion
and
Mob
ile V
otes
Tot
al
ALP
63
.05%
LIB
36
.95%
2 C
andi
date
Pre
ferr
ed
Page 72
2017 State General ElectionResults and Statistics Report
71
Suburbs within District
Alexander Heights
Balga
Ballajura
Dianella
Males 13,908 Koondoola
Females 13,890 Mirrabooka
Total 27,798 Westminster
Electors Habitation
1 5,805
2 5,417
3 1,975
>3 1,209 Returning Officer
Total Habitations 14,406 Tony THOMPSON
Candidate Name Party
FREEMAN, Janine Marie WA Labor
Candidate Name Party
FREEMAN, Janine Marie WA Labor
Number of Electors on Roll
Number of Electors per Habitation
Elected Candidate for Mirrabooka
Previous Member
District of MirrabookaEast Metropolitan RegionElector information correct as at 9 February 2017
Area (sq km)
22
This figure is the gazetted area and may include bodies of water
Page 73
2017
Sta
te G
ener
al E
lect
ion
Res
ults
and
Sta
tistic
s R
epor
t 72
2779
8
PP No.
Polli
ng P
lace
MU
BAR
AK K
imIN
DVo
tes
CH
EN L
ilyLI
BVo
tes
IGB
OK
WE
Chu
kwud
umeb
i Syd
ney
ACP
Vote
s
DO
OB
REE
Sar
eeta
MB
PVo
tes
FREE
MAN
Jan
ine
ALP
Vote
s
ISM
AIL
Raf
eif
GR
NVo
tes
LUK
E M
atue
ny M
aria
lIN
DVo
tes
Tota
lFo
rmal
Vote
s
Info
rmal
Vote
sTo
tal
Vote
s
1A
lexa
nder
Hei
ghts
Com
mun
ity H
all
2332
739
1980
075
201,
303
911,
394
404
31.0
1%89
968
.99%
2A
linja
rra
Prim
ary
Sch
ool
4257
557
291,
031
146
271,
907
149
2,05
668
535
.94%
1,22
164
.06%
3B
alga
Prim
ary
Sch
ool
4831
251
3093
311
425
1,51
315
71,
670
413
27.3
3%1,
098
72.6
7%4
Boy
are
Prim
ary
Sch
ool
3828
642
2585
494
101,
349
188
1,53
736
727
.21%
982
72.7
9%5
Dry
andr
a P
rimar
y S
choo
l24
229
366
890
8615
1,28
617
81,
464
286
22.2
4%1,
000
77.7
6%6
Illaw
arra
Prim
ary
Sch
ool
3136
235
3081
191
271,
387
781,
465
461
33.2
4%92
666
.76%
7K
oond
oola
Prim
ary
Sch
ool
3621
057
2684
574
141,
262
127
1,38
928
022
.22%
980
77.7
8%8
Nor
th B
alga
Prim
ary
Sch
ool
4228
443
1877
912
68
1,30
014
91,
449
363
27.9
7%93
572
.03%
9S
t And
rew
's G
ram
mar
Sch
ool
2358
826
3259
354
81,
324
133
1,45
764
548
.79%
677
51.2
1%10
Wes
tmin
ster
Prim
ary
Sch
ool
3536
346
2897
412
124
1,59
119
11,
782
440
27.6
6%1,
151
72.3
4%34
23,
536
432
243
8,51
098
117
814
,222
1,44
115
,663
4,34
430
.56%
9,86
969
.44%
Abs
ent V
otes
119
717
115
841,
708
335
713,
149
304
3,45
399
131
.50%
2,15
568
.50%
Ear
ly V
otes
(by
Pos
t)30
444
4122
1,06
887
241,
716
118
1,83
452
230
.42%
1,19
469
.58%
Ear
ly V
otes
(In
Per
son)
5563
381
371,
398
171
352,
410
137
2,54
776
331
.67%
1,64
668
.33%
Pro
visi
onal
Vot
es0
22
010
01
159
244
26.6
7%11
73.3
3%S
peci
al In
stitu
tions
, H
ospi
tals
& R
emot
es0
40
04
10
90
95
55.5
6%4
44.4
4%20
41,
800
239
143
4,18
859
413
17,
299
568
7,86
72,
285
31.3
2%5,
010
68.6
8%
546
5,33
667
138
612
,698
1,57
530
921
,521
2,00
923
,530
6,62
930
.82%
14,8
7969
.18%
2.54
%24
.79%
3.12
%1.
79%
59.0
0%7.
32%
1.44
%10
0.00
%
MU
BAR
AK K
imVo
tes
CH
EN L
ilyVo
tes
IGB
OK
WE
Chu
kwud
umeb
i Syd
ney
Vote
s
DO
OB
REE
Sar
eeta
Vote
s
FREE
MAN
Jan
ine
Vote
s
ISM
AIL
Raf
eif
Vote
s
LUK
E M
atue
ny M
aria
lVo
tes
Vote
sre
mai
ning
in c
ount
Exha
uste
dVo
tes
Tota
lFo
rmal
Vote
s54
65,
336
671
386
12,6
981,
575
309
21,5
2121
,521
135
2711
2053
6330
930
9To
tal
681
5,36
368
240
612
,751
1,63
821
,521
21,5
2195
5648
140
6740
640
6To
tal
776
5,41
973
012
,891
1,70
521
,521
21,5
2112
138
915
762
729
173
0To
tal
897
5,80
813
,048
1,76
721
,520
121
,521
387
235
269
891
689
7To
tal
6,19
513
,283
2,03
621
,514
721
,521
434
1,59
62,
030
62,
036
6,62
914
,879
21,5
0813
21,5
21
30.8
2%69
.18%
Abso
lute
Maj
ority
= 1
0755
Dis
tric
t Tot
al
Firs
t Pre
fere
nce
Vot
esLU
KE
Excl
uded
DO
OB
REE
Exc
lude
d
IGB
OK
WE
Excl
uded
MU
BAR
AK E
xclu
ded
Tota
l Firs
t Pre
fere
nces
Vot
es
%To
tal V
alid
Vot
es
CH
EN L
ilyLI
B
ISM
AIL
Excl
uded
FREE
MAN
Jan
ine
ALP
Mirr
aboo
ka E
lect
oral
Dis
tric
t
11 M
arch
201
7Ea
st M
etro
polit
an R
egio
n
Two
Can
dida
te P
refe
rred
Vot
es
Pref
eren
ce D
istr
ibut
ion
Jani
ne M
arie
FR
EEM
ANW
A La
bor
elec
ted
as th
e m
embe
r for
MIR
RAB
OO
KA
with
a m
ajor
ity o
f82
50 v
otes
Firs
t Pre
fere
nce
Vote
s Po
lled
for e
ach
Can
dida
te a
t eac
h Po
lling
Pla
ce
Vote
r Tur
nout
= 8
4.65
%In
form
al V
otes
= 8
.54%
Polli
ng P
lace
Tot
als
Dis
trib
utio
n of
Pre
fere
nces
Dec
lara
tion
and
Mob
ile V
otes
Tot
al
ALP
69
.18%
LIB
30
.82%
2 C
andi
date
Pre
ferr
ed
Page 74
2017 State General ElectionResults and Statistics Report
73
Local Governments within District
Males 12,675
Females 11,906
Total 24,581
Electors Habitation
1 4,933
2 6,029
3 1,458
>3 706
Total Habitations 13,126
City of Greater Geraldton
Shire of Carnamah
Shire of Chapman Valley
Shire of Chittering
Shire of Coorow
Shire of Dalwallinu
Shire of Dandaragan
Shire of Gingin
Shire of Irwin
Shire of Mingenew
Shire of Moora
Shire of Morawa
Shire of Northampton
Shire of Perenjori
Shire of Three Springs
Shire of Toodyay
Shire of Victoria Plains
Returning Officer
Robert DEW
Candidate Name Party
LOVE, Ronald Shane THE NATIONALS
Candidate Name Party
LOVE, Ronald Shane THE NATIONALS
Number of Electors on Roll
Number of Electors per Habitation
Elected Candidate for Moore
Previous Member
District of MooreAgricultural Region
Elector information correct as at 9 February 2017
Area (sq km)
71,817
This figure is the gazetted area and may include bodies of water
Page 75
2017
Sta
te G
ener
al E
lect
ion
Res
ults
and
Sta
tistic
s R
epor
t 74
2458
1
PP No.
Polli
ng P
lace
POR
TER
Wes
AC
PVo
tes
KEL
LY J
ames
Jos
eph
PHO
NVo
tes
WIL
LIA
MSO
N R
oss
SFP
Vote
s
LEA
M P
eter
GR
NVo
tes
SLYN
S D
arre
nLI
BVo
tes
LOVE
Sha
neN
AT
Vote
s
NO
RTO
N B
arni
ALP
Vote
s
Tota
lFo
rmal
Vote
s
Info
rmal
Vote
sTo
tal
Vote
s
1Ba
dgin
garr
a C
omm
unity
Cen
tre1
610
215
895
128
313
121
16.4
1%10
783
.59%
2Bi
ndoo
n Pr
imar
y Sc
hool
1513
738
4715
026
019
484
132
873
330
39.3
3%50
960
.67%
3Bo
lgar
t Prim
ary
Scho
ol2
105
129
4816
111
311
437
33.3
3%74
66.6
7%4
Cal
ingi
ri Pr
imar
y Sc
hool
017
131
3276
1315
25
157
4529
.61%
107
70.3
9%5
Car
nam
ah D
istri
ct H
igh
Scho
ol3
1610
345
8718
182
1119
354
29.6
7%12
870
.33%
6C
erva
ntes
Rec
reat
ion
Cen
tre3
6017
660
110
4730
37
310
108
35.6
4%19
564
.36%
7C
ooro
w C
omm
unity
Cen
tre2
167
127
6412
129
213
138
29.4
6%91
70.5
4%8
Dal
wal
linu
Dis
trict
Hig
h Sc
hool
2028
176
5917
839
347
2737
494
27.0
9%25
372
.91%
9D
anda
raga
n Pr
imar
y Sc
hool
112
1810
3711
115
204
721
160
29.5
6%14
370
.44%
10En
eabb
a Pr
imar
y Sc
hool
010
50
1070
2011
54
119
2622
.61%
8977
.39%
11G
ranv
ille
Cen
tre13
118
4431
174
274
140
794
2882
230
638
.54%
488
61.4
6%12
Gre
en H
ead
Com
mun
ity C
entre
227
61
5753
2617
212
184
7744
.77%
9555
.23%
13G
uild
erto
n H
all
1344
1318
6881
8632
310
333
139
43.0
3%18
456
.97%
14H
orro
cks
Com
mun
ity R
ecre
atio
n C
entre
08
00
830
955
156
1425
.45%
4174
.55%
15Im
mac
ulat
e H
eart
Col
lege
2312
038
4416
211
624
775
034
784
357
47.6
6%39
252
.34%
16Irw
in R
ecre
atio
n C
entre
1416
188
5530
164
533
01,
594
691,
663
564
35.3
8%1,
030
64.6
2%17
Jurie
n Ba
y D
istri
ct H
igh
Scho
ol9
114
3627
152
306
156
800
3583
529
436
.80%
505
63.2
0%18
Kala
nnie
Prim
ary
Scho
ol1
95
210
402
693
7211
15.9
4%58
84.0
6%19
Kalb
arri
Dis
trict
Hig
h Sc
hool
579
2425
8229
515
766
736
703
184
27.5
9%48
372
.41%
20La
ncel
in S
t Joh
n Am
bula
nce
Subc
entre
663
4126
131
156
140
563
2358
626
346
.71%
300
53.2
9%21
Ledg
e Po
int C
omm
unity
Hal
l1
137
235
3927
124
412
856
45.1
6%68
54.8
4%22
Leem
an P
rimar
y Sc
hool
428
203
3363
3718
810
198
6232
.98%
126
67.0
2%23
Mili
ng P
rimar
y Sc
hool
35
31
1852
688
290
2427
.27%
6472
.73%
24M
inge
new
Prim
ary
Scho
ol1
1415
245
115
2021
213
225
6430
.19%
148
69.8
1%25
Moo
ra P
erfo
rmin
g Ar
ts C
entre
3810
045
1913
031
612
477
220
792
256
33.2
0%51
566
.80%
26M
oraw
a Sh
ire C
ounc
il C
ham
bers
221
137
3212
749
251
625
762
24.8
0%18
875
.20%
27M
uche
a C
omm
unity
Hal
l16
9637
2714
889
180
593
3562
830
451
.26%
289
48.7
4%28
Mul
lew
a D
istri
ct H
igh
Scho
ol4
218
515
7539
167
817
532
19.2
8%13
480
.72%
29N
abaw
a C
omm
unity
Hal
l1
1013
630
7029
159
316
245
28.3
0%11
471
.70%
30N
ew N
orci
a In
stitu
te S
tudy
Hal
l7
76
030
5012
112
111
341
36.6
1%71
63.3
9%31
Nor
tham
pton
RSL
Hal
l17
7539
1392
260
127
623
3265
517
728
.41%
446
71.5
9%32
Pere
njor
i Prim
ary
Scho
ol3
811
133
6312
131
413
546
35.1
1%85
64.8
9%33
Seab
ird C
omm
unity
Hal
l1
87
216
2919
824
8630
36.5
9%52
63.4
1%34
Thre
e Sp
rings
Prim
ary
Scho
ol4
1926
718
8633
193
1520
838
19.9
0%15
380
.10%
35To
odya
y Sh
ow G
roun
ds P
avili
on42
162
5889
231
412
376
1,37
072
1,44
252
238
.13%
847
61.8
7%36
Wat
hero
o Pr
imar
y Sc
hool
112
32
968
398
199
1212
.24%
8687
.76%
37W
oodr
idge
Com
mun
ity C
entre
962
2927
9284
149
452
3048
219
042
.04%
262
57.9
6%28
71,
716
775
519
2,61
65,
087
2,91
413
,914
612
14,5
264,
983
35.8
4%8,
920
64.1
6%Ab
sent
Vot
es62
406
224
187
603
793
686
2,96
112
73,
088
1,18
540
.12%
1,76
959
.88%
Early
Vot
es (b
y Po
st)
2827
195
7141
078
231
91,
976
722,
048
640
32.4
2%1,
334
67.5
8%Ea
rly V
otes
(In
Pers
on)
4235
613
684
433
718
488
2,25
761
2,31
879
635
.31%
1,45
864
.69%
Prov
isio
nal V
otes
04
10
30
614
115
964
.29%
535
.71%
Spec
ial I
nstit
utio
ns,
Hos
pita
ls &
Rem
otes
39
73
1426
1173
376
2534
.25%
4865
.75%
135
1,04
646
334
51,
463
2,31
91,
510
7,28
126
47,
545
2,65
536
.52%
4,61
463
.48%
422
2,76
21,
238
864
4,07
97,
406
4,42
421
,195
876
22,0
717,
638
36.0
8%13
,534
63.9
2%
1.99
%13
.03%
5.84
%4.
08%
19.2
5%34
.94%
20.8
7%10
0.00
%
POR
TER
Wes
Vote
s
KEL
LY J
ames
Jos
eph
Vote
s
WIL
LIA
MSO
N R
oss
Vote
s
LEA
M P
eter
Vote
s
SLYN
S D
arre
nVo
tes
LOVE
Sha
neVo
tes
NO
RTO
N B
arni
Vote
s
Vote
sre
mai
ning
in c
ount
Exha
uste
dVo
tes
Tota
lFo
rmal
Vote
s42
22,
762
1,23
886
44,
079
7,40
64,
424
21,1
9521
,195
166
5516
5296
3441
93
422
Tota
l2,
928
1,29
388
04,
131
7,50
24,
458
21,1
923
21,1
9579
103
8019
742
087
91
880
Tota
l3,
007
1,39
64,
211
7,69
94,
878
21,1
914
21,1
9552
318
043
525
61,
394
21,
396
Tota
l3,
530
4,39
18,
134
5,13
421
,189
621
,195
1,49
21,
392
638
3,52
28
3,53
0To
tal
5,88
39,
526
5,77
221
,181
1421
,195
1,75
54,
008
5,76
39
5,77
27,
638
13,5
3421
,172
2321
,195
36.0
8%63
.92%
Abs
olut
e M
ajor
ity =
105
87
Dis
tric
t Tot
al
Firs
t Pre
fere
nce
Vote
sPO
RTE
R E
xclu
ded
LEA
M E
xclu
ded
WIL
LIA
MSO
N E
xclu
ded
KEL
LY E
xclu
ded
Tota
l Firs
t Pre
fere
nces
Vot
es
%To
tal V
alid
Vot
es
SLYN
S D
arre
nLI
B
NO
RTO
N E
xclu
ded
LOVE
Sha
neN
AT
Moo
re E
lect
oral
Dis
tric
t
11 M
arch
201
7Ag
ricul
tura
l Reg
ion
Two
Can
dida
te P
refe
rred
Vot
es
Pref
eren
ce D
istr
ibut
ion
Ron
ald
Shan
e LO
VETH
E N
ATIO
NAL
Sel
ecte
d as
the
mem
ber f
orM
OO
RE
with
a m
ajor
ity o
f58
96 v
otes
Firs
t Pre
fere
nce
Vote
s Po
lled
for e
ach
Can
dida
te a
t eac
h Po
lling
Pla
ce
Vote
r Tur
nout
= 8
9.79
%In
form
al V
otes
= 3
.97%
Polli
ng P
lace
Tot
als
Dis
trib
utio
n of
Pre
fere
nces
Dec
lara
tion
and
Mob
ile V
otes
Tot
al
NA
T 63
.92%
LIB
36.0
8%
2 C
andi
date
Pre
ferr
ed
Page 76
2017 State General ElectionResults and Statistics Report
75
Suburbs within District
Dianella
Morley
Nollamara
Noranda
Males 12,634
Females 13,062
Total 25,696
Electors Habitation
1 5,425
2 5,743
3 1,660
>3 887 Returning Officer
Total Habitations 13,715 Jim PETROVSKI
Candidate Name Party
SANDERSON, Amber-Jade WA Labor
Candidate Name Party
BRITZA, Ian Maxwell Liberal Party
Number of Electors on Roll
Number of Electors per Habitation
Elected Candidate for Morley
Previous Member
District of MorleyEast Metropolitan RegionElector information correct as at 9 February 2017
Area (sq km)
18
This figure is the gazetted area and may include bodies of water
Page 77
2017
Sta
te G
ener
al E
lect
ion
Res
ults
and
Sta
tistic
s R
epor
t 76
2569
6
PP No.
Polli
ng P
lace
RIC
CIA
RD
I A
nne-
Mar
ieG
RN
Vote
s
BO
KSM
ATI
Nas
imM
BP
Vote
s
BR
ITZA
Ian
LIB
Vote
s
HO
ST L
ois
ACP
Vote
s
SAN
DER
SON
Am
ber-
Jade
ALP
Vote
s
LON
GO
Pau
lSF
PVo
tes
Tota
lFo
rmal
Vote
s
Info
rmal
Vote
sTo
tal
Vote
s
1C
ambo
on P
rimar
y S
choo
l15
227
652
5999
450
1,93
412
42,
058
757
39.2
0%1,
174
60.8
0%2
Crim
ea P
ark
Hal
l43
1113
812
282
649
217
509
163
33.1
3%32
966
.87%
3D
iane
lla H
eigh
ts P
rimar
y S
choo
l13
226
533
2855
831
1,30
845
1,35
361
747
.21%
690
52.7
9%4
Dia
nella
Sec
onda
ry C
olle
ge14
415
284
3574
426
1,24
811
91,
367
376
30.1
5%87
169
.85%
5H
ampt
on P
ark
Prim
ary
Sch
ool
8010
231
2146
424
830
4587
528
634
.46%
544
65.5
4%6
Mor
ley
Prim
ary
Sch
ool
111
1628
542
579
221,
055
751,
130
346
32.8
0%70
967
.20%
7N
olla
mar
a P
rimar
y S
choo
l25
433
432
571,
000
341,
810
901,
900
541
29.8
9%1,
269
70.1
1%8
Nor
anda
Prim
ary
Sch
ool
9529
490
5895
039
1,66
184
1,74
560
236
.24%
1,05
963
.76%
9N
orth
Mor
ley
Prim
ary
Sch
ool
166
1971
737
894
461,
879
123
2,00
281
843
.56%
1,06
056
.44%
1,17
718
63,
762
349
6,46
527
812
,217
722
12,9
394,
506
36.9
0%7,
705
63.1
0%A
bsen
t Vot
es37
059
727
521,
196
972,
501
210
2,71
195
238
.10%
1,54
761
.90%
Ear
ly V
otes
(by
Pos
t)13
537
866
511,
031
462,
166
145
2,31
196
444
.53%
1,20
155
.47%
Ear
ly V
otes
(In
Per
son)
331
681,
485
126
2,23
199
4,34
026
34,
603
1,75
540
.45%
2,58
459
.55%
Pro
visi
onal
Vot
es2
13
05
011
011
436
.36%
763
.64%
Spe
cial
Inst
itutio
ns,
Hos
pita
ls &
Rem
otes
20
172
183
420
4222
52.3
8%20
47.6
2%84
016
53,
098
231
4,48
124
59,
060
618
9,67
83,
697
40.8
2%5,
359
59.1
8%
2,01
735
16,
860
580
10,9
4652
321
,277
1,34
022
,617
8,20
338
.57%
13,0
6461
.43%
9.48
%1.
65%
32.2
4%2.
73%
51.4
5%2.
46%
100.
00%
RIC
CIA
RD
I A
nne-
Mar
ieVo
tes
BO
KSM
ATI
Nas
imVo
tes
BR
ITZA
Ian
Vote
s
HO
ST L
ois
Vote
s
SAN
DER
SON
Am
ber-
Jade
Vote
s
LON
GO
Pau
lVo
tes
Vote
sre
mai
ning
in c
ount
Exha
uste
dVo
tes
Tota
lFo
rmal
Vote
s2,
017
351
6,86
058
010
,946
523
21,2
7721
,277
4611
536
114
3935
01
351
Tota
l2,
063
6,97
561
611
,060
562
21,2
761
21,2
7773
186
8021
755
66
562
Tota
l2,
136
7,16
169
611
,277
21,2
707
21,2
7790
421
184
695
169
6To
tal
2,22
67,
582
11,4
6121
,269
821
,277
621
1,60
32,
224
22,
226
8,20
313
,064
21,2
6710
21,2
77
38.5
7%61
.43%
Abso
lute
Maj
ority
= 1
0634
Dis
tric
t Tot
al
Firs
t Pre
fere
nce
Vot
esB
OK
SMAT
I Exc
lude
d
LON
GO
Exc
lude
d
HO
ST E
xclu
ded
RIC
CIA
RD
I Exc
lude
d
Tota
l Firs
t Pre
fere
nces
Vot
es
%To
tal V
alid
Vot
es
BR
ITZA
Ian
LIB
SAN
DER
SON
Am
ber-
Jade
ALP
Mor
ley
Elec
tora
l Dis
tric
t
11 M
arch
201
7Ea
st M
etro
polit
an R
egio
n
Two
Can
dida
te P
refe
rred
Vot
es
Pref
eren
ce D
istr
ibut
ion
Ambe
r-Ja
de S
AND
ERSO
NW
A La
bor
elec
ted
as th
e m
embe
r for
MO
RLE
Yw
ith a
maj
ority
of
4861
vot
es
Firs
t Pre
fere
nce
Vote
s Po
lled
for e
ach
Can
dida
te a
t eac
h Po
lling
Pla
ce
Vote
r Tur
nout
= 8
8.02
%In
form
al V
otes
= 5
.92%
Polli
ng P
lace
Tot
als
Dis
trib
utio
n of
Pre
fere
nces
Dec
lara
tion
and
Mob
ile V
otes
Tot
al
ALP
61
.43%
LIB
38
.57%
2 C
andi
date
Pre
ferr
ed
Page 78
2017 State General ElectionResults and Statistics Report
77
Suburbs within District
Coolbinia
Dianella
East Perth
Inglewood
Males 13,515 Maylands
Females 14,560 Menora
Total 28,075 Morley
Mt Lawley
Yokine
Electors Habitation
1 7,108
2 6,220
3 1,580
>3 832 Returning Officer
Total Habitations 15,740 Eric NOYENS
Candidate Name Party
MILLMAN, Simon Alexander WA Labor
Candidate Name Party
SUTHERLAND, Michael William Liberal Party
Number of Electors on Roll
Number of Electors per Habitation
Elected Candidate for Mount Lawley
Previous Member
District of Mount LawleyEast Metropolitan RegionElector information correct as at 9 February 2017
Area (sq km)
18
This figure is the gazetted area and may include bodies of water
Page 79
2017
Sta
te G
ener
al E
lect
ion
Res
ults
and
Sta
tistic
s R
epor
t 78
2807
5
PP No.
Polli
ng P
lace
VAN
BU
RG
EL J
anel
leAC
PVo
tes
SUTH
ERLA
ND
Mic
hael
LIB
Vote
s
RO
BER
TS M
att
GR
NVo
tes
REV
IAN
Kan
diAJ
PVo
tes
FAR
SALA
S A
lexa
ndra
MB
PVo
tes
MIL
LMAN
Sim
onAL
PVo
tes
Tota
lFo
rmal
Vote
s
Info
rmal
Vote
sTo
tal
Vote
s
1Au
stra
lian
Isla
mic
Col
lege
- D
iane
lla26
358
6713
3043
993
342
975
435
46.6
2%49
853
.38%
2C
entra
l Met
ropo
litan
Col
lege
of T
AFE
- Mt L
awle
y C
ampu
s14
311
146
106
311
798
2181
934
443
.16%
453
56.8
4%3
Coo
lbin
ia P
rimar
y Sc
hool
2179
017
827
2254
91,
587
511,
638
852
53.6
9%73
546
.31%
4C
oolb
inia
Prim
ary
Scho
ol (D
rive-
in)
026
50
126
582
6026
44.8
3%32
55.1
7%5
Dia
nella
Com
mun
ity C
entre
3641
311
523
2361
91,
229
681,
297
467
38.0
0%76
262
.00%
6M
ount
Law
ley
Prim
ary
Scho
ol16
538
250
2615
526
1,37
134
1,40
560
444
.06%
767
55.9
4%7
RSL
Age
d C
are
Men
ora
Gar
dens
Villa
ge7
148
92
010
927
511
286
153
55.6
4%12
244
.36%
8St
Pat
rick'
s An
glic
an C
hurc
h23
318
196
1610
312
875
3190
637
442
.74%
501
57.2
6%9
St P
aul's
Prim
ary
Scho
ol11
510
114
1512
311
973
271,
000
552
56.7
3%42
143
.27%
10Su
ther
land
Dia
nella
Prim
ary
Scho
ol33
509
8221
2242
51,
092
491,
141
564
51.7
0%52
748
.30%
11Ve
dant
a C
hurc
h28
508
133
2522
505
1,22
181
1,30
256
746
.44%
654
53.5
6%12
Wes
t Mor
ley
Prim
ary
Scho
ol36
292
7816
1040
483
645
881
338
40.4
8%49
759
.52%
13Yo
kine
Com
mun
ity P
layg
roup
3451
313
346
2158
51,
332
751,
407
586
44.0
3%74
555
.97%
14Yo
kine
Prim
ary
Scho
ol26
447
126
3422
527
1,18
272
1,25
450
442
.68%
677
57.3
2%31
15,
681
1,63
227
421
65,
648
13,7
6260
914
,371
6,36
646
.27%
7,39
153
.73%
Abse
nt V
otes
101
1,06
569
097
631,
486
3,50
220
83,
710
1,31
437
.52%
2,18
862
.48%
Early
Vot
es (b
y Po
st)
571,
252
195
5220
889
2,46
513
32,
598
1,34
954
.75%
1,11
545
.25%
Early
Vot
es (I
n Pe
rson
)10
71,
514
405
7252
1,52
93,
679
137
3,81
61,
711
46.5
3%1,
966
53.4
7%Pr
ovis
iona
l Vot
es0
33
10
411
112
327
.27%
872
.73%
Spec
ial I
nstit
utio
ns,
Hos
pita
ls &
Rem
otes
710
613
11
8621
411
225
115
53.7
4%99
46.2
6%27
23,
940
1,30
622
313
63,
994
9,87
149
010
,361
4,49
245
.52%
5,37
654
.48%
583
9,62
12,
938
497
352
9,64
223
,633
1,09
924
,732
10,8
5845
.96%
12,7
6754
.04%
2.47
%40
.71%
12.4
3%2.
10%
1.49
%40
.80%
100.
00%
VAN
BU
RG
EL J
anel
leVo
tes
SUTH
ERLA
ND
Mic
hael
Vote
s
RO
BER
TS M
att
Vote
s
REV
IAN
Kan
diVo
tes
FAR
SALA
S A
lexa
ndra
Vote
s
MIL
LMAN
Sim
onVo
tes
Vote
sre
mai
ning
in c
ount
Exha
uste
dVo
tes
Tota
lFo
rmal
Vote
s58
39,
621
2,93
849
735
29,
642
23,6
3323
,633
5868
5273
100
351
135
2To
tal
641
9,68
92,
990
570
9,74
223
,632
123
,633
8487
260
138
569
157
0To
tal
725
9,77
63,
250
9,88
023
,631
223
,633
426
155
140
721
472
5To
tal
10,2
023,
405
10,0
2023
,627
623
,633
656
2,74
73,
403
23,
405
10,8
5812
,767
23,6
258
23,6
33
45.9
6%54
.04%
Abso
lute
Maj
ority
= 1
1813
Dis
tric
t Tot
al
Firs
t Pre
fere
nce
Vote
sFA
RSA
LAS
Excl
uded
REV
IAN
Exc
lude
d
VAN
BU
RG
EL E
xclu
ded
RO
BER
TS E
xclu
ded
Tota
l Firs
t Pre
fere
nces
Vot
es
%To
tal V
alid
Vot
es
SUTH
ERLA
ND
Mic
hael
LIB
MIL
LMAN
Sim
onAL
P
Mou
nt L
awle
y El
ecto
ral D
istr
ict
11 M
arch
201
7Ea
st M
etro
polit
an R
egio
n
Two
Can
dida
te P
refe
rred
Vot
es
Pref
eren
ce D
istr
ibut
ion
Sim
on A
lexa
nder
MIL
LMAN
WA
Labo
rel
ecte
d as
the
mem
ber f
orM
OU
NT
LAW
LEY
with
a m
ajor
ity o
f19
09 v
otes
Firs
t Pre
fere
nce
Vote
s Po
lled
for e
ach
Can
dida
te a
t eac
h Po
lling
Pla
ce
Vote
r Tur
nout
= 8
8.09
%In
form
al V
otes
= 4
.44%
Polli
ng P
lace
Tot
als
Dis
trib
utio
n of
Pre
fere
nces
Dec
lara
tion
and
Mob
ile V
otes
Tot
al
ALP
54
.04%
LIB
45
.96%
2 C
andi
date
Pre
ferr
ed
Page 80
2017 State General ElectionResults and Statistics Report
79
Local Governments within District
Shire of Harvey
Shire of Murray
Shire of Waroona
Males 13,980
Females 14,032
Total 28,012
Electors Habitation
1 4,756
2 7,129
3 1,833
>3 800 Returning Officer
Total Habitations 14,518 Kathy GECAN
Candidate Name Party
CLARKE, Robyn Marjorie Jane WA Labor
Candidate Name Party
COWPER, Murray John Liberal Party
Number of Electors on Roll
Number of Electors per Habitation
Elected Candidate for Murray-Wellington
Previous Member
District of Murray-WellingtonSouth West Region
Elector information correct as at 9 February 2017
Area (sq km)
4,320
This figure is the gazetted area and may include bodies of water
Page 81
2017
Sta
te G
ener
al E
lect
ion
Res
ults
and
Sta
tistic
s R
epor
t 80
2801
2
PP No.
Polli
ng P
lace
RA
DLE
Y D
anie
lFL
UX
Vote
s
BU
RW
OO
D C
allu
mG
RN
Vote
s
GIL
LETT
Pau
lN
AT
Vote
s
CO
WPE
R M
urra
yLI
BVo
tes
CLA
RK
E R
obyn
ALP
Vote
s
McC
ALL
Mar
kSF
PVo
tes
SLA
TER
Ros
sPH
ON
Vote
s
Tota
lFo
rmal
Vote
s
Info
rmal
Vote
sTo
tal
Vote
s
1Au
stin
Cov
e Ba
ptis
t Col
lege
1041
5347
849
243
139
1,25
656
1,31
265
051
.75%
606
48.2
5%2
Aust
ralin
d C
omm
unity
Hal
l24
8225
643
758
769
167
1,62
292
1,71
479
048
.74%
831
51.2
6%3
Binn
ingu
p C
omm
unity
Hal
l9
2615
618
623
241
6671
629
745
354
49.4
4%36
250
.56%
4Br
unsw
ick
Tow
n H
all
732
171
222
214
5655
757
3579
243
056
.80%
327
43.2
0%5
Car
cool
a Pr
imar
y Sc
hool
625
1511
525
239
5250
439
543
187
37.1
0%31
762
.90%
6C
oolu
p C
omm
unity
Hal
l1
956
192
8329
3540
518
423
284
70.1
2%12
129
.88%
7D
wel
lingu
p Pr
imar
y Sc
hool
630
4678
111
2027
318
1933
713
040
.88%
188
59.1
2%8
King
ston
Prim
ary
Scho
ol12
3868
103
276
6296
655
3969
422
834
.81%
427
65.1
9%9
Lake
Clif
ton
Com
mun
ity C
entre
312
1780
9625
1925
211
263
111
44.2
2%14
055
.78%
10N
orth
Dan
dalu
p C
omm
unity
Hal
l3
2036
124
140
3134
388
1940
718
748
.20%
201
51.8
0%11
Nor
th Y
unde
rup
CW
A C
entre
818
1516
318
622
5947
130
501
225
47.7
7%24
652
.23%
12Pa
rkfie
ld P
rimar
y Sc
hool
1348
124
210
387
6210
995
344
997
408
42.8
6%54
457
.14%
13Pi
njar
ra S
enio
r Hig
h Sc
hool
1861
7948
962
790
172
1,53
610
11,
637
711
46.3
2%82
453
.68%
14Pr
esto
n Be
ach
Com
mun
ity C
entre
14
1142
503
711
85
123
5849
.15%
6050
.85%
15R
iver
links
Com
mun
ity C
entre
1045
132
260
390
3891
966
401,
006
453
46.8
9%51
353
.11%
16Se
ttler
s H
all
451
162
204
291
4787
846
3488
040
848
.23%
438
51.7
7%17
St A
nne'
s Pr
imar
y Sc
hool
2984
257
594
689
121
165
1,93
916
52,
104
990
51.1
1%94
748
.89%
18W
aroo
na S
enio
r Citi
zens
Cen
tre20
3812
243
942
718
915
31,
388
701,
458
727
52.3
8%66
147
.62%
19Ya
rloop
Prim
ary
Scho
ol3
748
9078
2128
275
2129
615
154
.91%
124
45.0
9%18
767
11,
824
4,50
65,
608
1,00
81,
561
15,3
6586
716
,232
7,48
248
.71%
7,87
751
.29%
Abse
nt V
otes
3920
521
868
394
022
433
22,
641
157
2,79
81,
135
42.9
9%1,
505
57.0
1%Ea
rly V
otes
(by
Post
)11
5616
451
742
677
186
1,43
770
1,50
782
857
.62%
609
42.3
8%Ea
rly V
otes
(In
Pers
on)
3512
637
61,
086
1,38
720
055
53,
765
170
3,93
51,
813
48.2
2%1,
947
51.7
8%Pr
ovis
iona
l Vot
es0
02
011
24
191
203
15.7
9%16
84.2
1%Sp
ecia
l Ins
titut
ions
, H
ospi
tals
& R
emot
es2
344
118
112
514
298
1030
816
956
.90%
128
43.1
0%87
390
804
2,40
42,
876
508
1,09
18,
160
408
8,56
83,
948
48.4
2%4,
205
51.5
8%27
41,
061
2,62
86,
910
8,48
41,
516
2,65
223
,525
1,27
524
,800
11,4
3048
.61%
12,0
8251
.39%
1.16
%4.
51%
11.1
7%29
.37%
36.0
6%6.
44%
11.2
7%10
0.00
%
RA
DLE
Y D
anie
lVo
tes
BU
RW
OO
D C
allu
mVo
tes
GIL
LETT
Pau
lVo
tes
CO
WPE
R M
urra
yVo
tes
CLA
RK
E R
obyn
Vote
s
McC
ALL
Mar
kVo
tes
SLA
TER
Ros
sVo
tes
Vote
sre
mai
ning
in c
ount
Exha
uste
dVo
tes
Tota
lFo
rmal
Vote
s27
41,
061
2,62
86,
910
8,48
41,
516
2,65
223
,525
23,5
2511
431
1734
4728
271
327
4To
tal
1,17
52,
659
6,92
78,
518
1,56
32,
680
23,5
223
23,5
2530
883
606
116
611,
174
11,
175
Tota
l2,
967
7,01
09,
124
1,67
92,
741
23,5
214
23,5
2527
638
440
261
61,
678
11,
679
Tota
l3,
243
7,39
49,
526
3,35
723
,520
523
,525
1,90
674
459
03,
240
33,
243
Tota
l9,
300
10,2
703,
947
23,5
178
23,5
252,
130
1,81
23,
942
53,
947
11,4
3012
,082
23,5
1213
23,5
25
48.6
1%51
.39%
Abs
olut
e M
ajor
ity =
117
57
Dis
tric
t Tot
al
Firs
t Pre
fere
nce
Vote
sR
AD
LEY
Excl
uded
BU
RW
OO
D E
xclu
ded
McC
ALL
Exc
lude
d
GIL
LETT
Exc
lude
d
Tota
l Firs
t Pre
fere
nces
Vot
es%
Tota
l Val
id V
otes
CO
WPE
R M
urra
yLI
B
SLA
TER
Exc
lude
d
CLA
RK
E R
obyn
ALP
Mur
ray-
Wel
lingt
on E
lect
oral
Dis
tric
t
11 M
arch
201
7So
uth
Wes
t Reg
ion
Two
Can
dida
te P
refe
rred
Vot
es
Pref
eren
ce D
istr
ibut
ion
Rob
yn M
arjo
rie J
ane
CLA
RK
EW
A La
bor
elec
ted
as th
e m
embe
r for
MU
RR
AY-W
ELLI
NG
TON
with
a m
ajor
ity o
f65
2 vo
tes
Firs
t Pre
fere
nce
Vote
s Po
lled
for e
ach
Can
dida
te a
t eac
h Po
lling
Pla
ce
Vote
r Tur
nout
= 8
8.53
%In
form
al V
otes
= 5
.14%
Polli
ng P
lace
Tot
als
Dis
trib
utio
n of
Pre
fere
nces
Dec
lara
tion
and
Mob
ile V
otes
Tot
al
ALP
51
.39%
LIB
48
.61%
2 C
andi
date
Pre
ferr
ed
Page 82
2017 State General ElectionResults and Statistics Report
81
Suburbs within DistrictClaremont
Crawley
Daglish
Dalkeith
Males 13,236 Floreat
Females 14,112 Jolimont
Total 27,348 Karrakatta
Mt Claremont
Nedlands
Electors Habitation Shenton Park
1 5,860 Subiaco
2 5,888 Wembley
3 1,622 West Leederville
>3 993
Total Habitations 14,363 Returning Officer
Kelly DANSIE
Candidate Name Party
MARMION, William Richard Liberal Party
Candidate Name Party
MARMION, William Richard Liberal Party
Number of Electors on Roll
Number of Electors per Habitation
Elected Candidate for Nedlands
Previous Member
District of NedlandsNorth Metropolitan RegionElector information correct as at 9 February 2017
Area (sq km)
30
This figure is the gazetted area and may include bodies of water
Page 83
2017
Sta
te G
ener
al E
lect
ion
Res
ults
and
Sta
tistic
s R
epor
t 82
2734
8
PP No.
Polli
ng P
lace
SHA
W C
hris
toph
erA
CP
Vote
s
TAYL
OR
Pen
nyA
LPVo
tes
GIN
BEY
Kei
thM
BP
Vote
s
MA
NG
AN
O A
ndre
wJM
WA
Vote
s
GR
OSS
O D
anie
lG
RN
Vote
s
MA
RM
ION
Bill
LIB
Vote
s
Tota
lFo
rmal
Vote
s
Info
rmal
Vote
sTo
tal
Vote
s
1D
alke
ith P
rimar
y S
choo
l54
367
1546
168
1,56
62,
216
832,
299
533
24.0
5%1,
683
75.9
5%2
Fres
hwat
er B
ay P
rimar
y S
choo
l8
121
47
9244
567
728
705
207
30.5
8%47
069
.42%
3H
olly
woo
d P
rimar
y S
choo
l27
411
1825
244
641
1,36
650
1,41
664
847
.44%
718
52.5
6%4
Jolim
ont P
rimar
y S
choo
l44
617
3970
350
1,12
32,
243
652,
308
981
43.7
6%1,
261
56.2
4%5
Ned
land
s P
rimar
y S
choo
l43
418
2139
255
1,00
61,
782
451,
827
649
36.4
2%1,
133
63.5
8%6
She
nton
Par
k C
omm
unity
Cen
tre29
757
2853
346
950
2,16
367
2,23
01,
118
51.6
9%1,
045
48.3
1%7
Sir
Cha
rles
Gai
rdne
r Hos
pita
l2
210
230
3489
089
4853
.93%
4146
.07%
8S
t And
rew
's C
hurc
h H
all -
Ned
land
s15
118
811
8824
848
812
500
201
41.2
7%28
658
.73%
9S
ubia
co C
omm
unity
Cen
tre24
440
1774
237
674
1,46
665
1,53
169
747
.54%
769
52.4
6%10
Sub
iaco
Prim
ary
Sch
ool
4255
719
6031
884
61,
842
641,
906
864
46.9
1%97
853
.09%
11Tr
esill
ian
Com
mun
ity C
entre
1414
19
1282
373
631
1064
122
235
.18%
409
64.8
2%12
Uni
vers
ity o
f Wes
tern
Aus
tralia
- N
edla
nds
Cam
pus
1816
46
713
424
056
917
586
292
51.3
2%27
748
.68%
320
4,13
218
440
62,
344
8,14
615
,532
506
16,0
386,
460
41.6
0%9,
070
58.4
0%A
bsen
t Vot
es84
936
6471
745
1,57
53,
475
128
3,60
31,
640
47.1
9%1,
835
52.8
1%E
arly
Vot
es (b
y P
ost)
6150
448
6722
61,
196
2,10
282
2,18
474
535
.48%
1,35
564
.52%
Ear
ly V
otes
(In
Per
son)
4749
531
5831
41,
039
1,98
451
2,03
580
940
.80%
1,17
459
.20%
Pro
visi
onal
Vot
es0
30
03
28
19
675
.00%
225
.00%
Spe
cial
Inst
itutio
ns,
Hos
pita
ls &
Rem
otes
1355
26
913
522
012
232
6830
.91%
152
69.0
9%20
51,
993
145
202
1,29
73,
947
7,78
927
48,
063
3,26
841
.97%
4,51
858
.03%
525
6,12
532
960
83,
641
12,0
9323
,321
780
24,1
019,
728
41.7
2%13
,588
58.2
8%
2.25
%26
.26%
1.41
%2.
61%
15.6
1%51
.85%
100.
00%
SHA
W C
hris
toph
erVo
tes
TAYL
OR
Pen
nyVo
tes
GIN
BEY
Kei
thVo
tes
MA
NG
AN
O A
ndre
wVo
tes
GR
OSS
O D
anie
lVo
tes
MA
RM
ION
Bill
Vote
s
Vote
sre
mai
ning
in c
ount
Exha
uste
dVo
tes
Tota
lFo
rmal
Vote
s52
56,
125
329
608
3,64
112
,093
23,3
2123
,321
4157
9250
8932
932
9To
tal
566
6,18
270
03,
691
12,1
8223
,321
23,3
2112
711
757
264
565
156
6To
tal
6,30
981
73,
748
12,4
4623
,320
123
,321
218
240
357
815
281
7To
tal
6,52
73,
988
12,8
0323
,318
323
,321
3,20
178
53,
986
23,
988
9,72
813
,588
23,3
165
23,3
21
41.7
2%58
.28%
Abs
olut
e M
ajor
ity =
116
59
Dis
tric
t Tot
al
Firs
t Pre
fere
nce
Vot
esG
INB
EY E
xclu
ded
SHA
W E
xclu
ded
MA
NG
AN
O E
xclu
ded
GR
OSS
O E
xclu
ded
Tota
l Firs
t Pre
fere
nces
Vot
es
%To
tal V
alid
Vot
es
TAYL
OR
Pen
nyA
LP
MA
RM
ION
Bill
LIB
Ned
land
s El
ecto
ral D
istr
ict
11 M
arch
201
7N
orth
Met
ropo
litan
Reg
ion
Two
Can
dida
te P
refe
rred
Vot
es
Pref
eren
ce D
istr
ibut
ion
Will
iam
Ric
hard
MA
RM
ION
Libe
ral P
arty
elec
ted
as th
e m
embe
r for
NED
LAN
DS
with
a m
ajor
ity o
f38
60 v
otes
Firs
t Pre
fere
nce
Vote
s Po
lled
for e
ach
Can
dida
te a
t eac
h Po
lling
Pla
ce
Vote
r Tur
nout
= 8
8.13
%In
form
al V
otes
= 3
.24%
Polli
ng P
lace
Tot
als
Dis
trib
utio
n of
Pre
fere
nces
Dec
lara
tion
and
Mob
ile V
otes
Tot
al
LIB
58
.28%
ALP
41
.72%
2 C
andi
date
Pre
ferr
ed
Page 84
2017 State General ElectionResults and Statistics Report
83
Local Governments within District
Males 5,428
Females 5,004
Total 10,432
Electors Habitation
1 2,513
2 2,020
3 501
>3 273
Shire of Ashburton
Shire of Carnarvon
Shire of Cue
Shire of Exmouth
Shire of Meekatharra
Shire of Mount Magnet
Shire of Murchison
Shire of Ngaanyatjarraku
Shire of Northampton
Shire of Sandstone
Shire of Shark Bay
Shire of Upper Gascoyne
Shire of Wiluna
Shire of Yalgoo
Total Habitations 5,307
Returning Officer
Brian ROBARTSON
Candidate Name Party
CATANIA, Vincent Alexander THE NATIONALS
Candidate Name Party
CATANIA, Vincent Alexander THE NATIONALS
Number of Electors on Roll
Number of Electors per Habitation
Elected Candidate for North West Central
Previous Member
District of North West CentralMining and Pastoral Region
Elector information correct as at 9 February 2017
Area (sq km)
817,103
This figure is the gazetted area and may include bodies of water
Page 85
2017
Sta
te G
ener
al E
lect
ion
Res
ults
and
Sta
tistic
s R
epor
t 84
1043
2
PP No.
Polli
ng P
lace
HIL
L S
hane
ALP
Vote
s
CAT
ANIA
Vin
ceN
ATVo
tes
SOR
ENSE
N D
ane
PHO
NVo
tes
GR
EEN
Car
olG
RN
Vote
s
DAV
IES
San
dyIN
DVo
tes
WES
TCO
TT J
ulee
LIB
Vote
s
HO
OPE
R A
ngel
aM
BP
Vote
s
D'C
UN
HA
Adr
ian
FLU
XVo
tes
Tota
lFo
rmal
Vote
s
Info
rmal
Vote
sTo
tal
Vote
s
1C
arna
rvon
Com
mun
ity C
olle
ge (M
arm
ion
Stre
et C
ampu
s)10
825
129
1018
109
03
528
2655
414
828
.03%
380
71.9
7%2
Car
narv
on C
omm
unity
Col
lege
(Cle
aver
Stre
et C
ampu
s)12
221
034
714
580
645
112
463
162
36.0
0%28
864
.00%
3C
oral
Bay
Lea
rnin
g C
entre
1612
813
19
11
612
6332
52.4
6%29
47.5
4%4
Cue
Prim
ary
Sch
ool
439
73
06
11
617
688
13.1
1%53
86.8
9%5
Den
ham
Hal
l85
128
1714
1138
13
297
1130
810
635
.81%
190
64.1
9%6
Exm
outh
Shi
re H
all
257
335
100
101
1315
33
2198
356
1,03
939
239
.88%
591
60.1
2%7
Mee
kath
arra
Shi
re H
all
4058
83
309
00
148
1216
062
42.1
8%85
57.8
2%8
Mou
nt M
agne
t Anz
ac M
emor
ial H
all
4165
213
810
10
149
515
451
34.2
3%98
65.7
7%9
Ons
low
Prim
ary
Sch
ool
6086
1211
218
24
195
820
374
37.9
5%12
162
.05%
10P
anna
won
ica
Prim
ary
Sch
ool
6526
2914
722
03
166
817
410
060
.24%
6639
.76%
11P
arab
urdo
o P
rimar
y S
choo
l11
353
6315
736
03
290
2031
016
757
.59%
123
42.4
1%12
Tom
Pric
e R
ecre
atio
n C
entre
285
121
109
7010
107
17
710
4175
142
960
.42%
281
39.5
8%13
Wilu
na R
emot
e C
omm
unity
Sch
ool
128
33
54
00
353
3816
47.0
6%18
52.9
4%14
Yalg
oo P
rimar
y S
choo
l11
142
23
50
037
037
1540
.54%
2259
.46%
1,21
91,
406
442
269
129
584
1052
4,11
121
14,
322
1,76
242
.90%
2,34
557
.10%
Abs
ent V
otes
235
208
104
7922
150
66
810
4085
039
448
.64%
416
51.3
6%E
arly
Vot
es (b
y P
ost)
143
249
136
2918
144
24
725
3576
023
732
.69%
488
67.3
1%E
arly
Vot
es (I
n P
erso
n)32
660
512
738
4429
14
91,
444
461,
490
478
33.1
3%96
566
.87%
Pro
visi
onal
Vot
es3
10
01
01
06
06
466
.67%
233
.33%
Spe
cial
Inst
itutio
ns,
Hos
pita
ls &
Rem
otes
5310
29
117
101
219
517
212
7237
.31%
121
62.6
9%76
01,
165
376
157
9259
514
213,
180
138
3,31
81,
185
37.3
0%1,
992
62.7
0%
1,97
92,
571
818
426
221
1,17
924
737,
291
349
7,64
02,
947
40.4
6%4,
337
59.5
4%
27.1
4%35
.26%
11.2
2%5.
84%
3.03
%16
.17%
0.33
%1.
00%
100.
00%
HIL
L S
hane
Vote
s
CAT
ANIA
Vin
ceVo
tes
SOR
ENSE
N D
ane
Vote
s
GR
EEN
Car
olVo
tes
DAV
IES
San
dyVo
tes
WES
TCO
TT J
ulee
Vote
s
HO
OPE
R A
ngel
aVo
tes
D'C
UN
HA
Adr
ian
Vote
s
Vote
sre
mai
ning
in c
ount
Exha
uste
dVo
tes
Tota
lFo
rmal
Vote
s1,
979
2,57
181
842
622
11,
179
2473
7,29
17,
291
12
26
67
2424
Tota
l1,
980
2,57
381
842
822
71,
185
807,
291
7,29
112
98
1125
1580
80To
tal
1,99
22,
582
826
439
252
1,20
07,
291
7,29
178
4436
6329
250
225
2To
tal
2,07
02,
626
862
502
1,22
97,
289
27,
291
275
125
5050
500
250
2To
tal
2,34
52,
751
912
1,27
97,
287
47,
291
232
375
304
911
191
2To
tal
2,57
73,
126
1,58
37,
286
57,
291
370
1,21
11,
581
21,
583
2,94
74,
337
7,28
47
7,29
1
40.4
6%59
.54%
Abso
lute
Maj
ority
= 3
643
Dis
tric
t Tot
alW
ESTC
OTT
Exc
lude
d
Firs
t Pre
fere
nce
Vot
esH
OO
PER
Exc
lude
d
D'C
UN
HA
Excl
uded
DAV
IES
Excl
uded
GR
EEN
Exc
lude
d
Tota
l Firs
t Pre
fere
nces
Vot
es
%To
tal V
alid
Vot
es
HIL
L S
hane
ALP
SOR
ENSE
N E
xclu
ded
CAT
ANIA
Vin
ceN
AT
Nor
th W
est C
entr
al E
lect
oral
Dis
tric
t
11 M
arch
201
7M
inin
g an
d Pa
stor
al R
egio
n
Two
Can
dida
te P
refe
rred
Vot
es
Pref
eren
ce D
istr
ibut
ion
Vinc
ent A
lexa
nder
CAT
ANIA
THE
NAT
ION
ALS
elec
ted
as th
e m
embe
r for
NO
RTH
WES
T C
ENTR
ALw
ith a
maj
ority
of
1390
vot
es
Firs
t Pre
fere
nce
Vote
s Po
lled
for e
ach
Can
dida
te a
t eac
h Po
lling
Pla
ce
Vote
r Tur
nout
= 7
3.24
%In
form
al V
otes
= 4
.57%
Polli
ng P
lace
Tot
als
Dis
trib
utio
n of
Pre
fere
nces
Dec
lara
tion
and
Mob
ile V
otes
Tot
al
NA
T 59
.54%
ALP
40
.46%
2 C
andi
date
Pre
ferr
ed
Page 86
2017 State General ElectionResults and Statistics Report
85
Suburbs within DistrictCoolbinia
Crawley
East Perth
Highgate
Males 15,596 Kings Park
Females 14,237 Leederville
Total 29,833 Mt Hawthorn
Mt Lawley
North Perth
Electors Habitation Northbridge
1 9,375 Perth
2 6,598 West Perth
3 1,428
>3 646 Returning Officer
Total Habitations 18,047 Nicole MENCSHELYI
Candidate Name Party
CAREY, John WA Labor
Candidate Name Party
EVANGEL, Helen Liberal Party
Number of Electors on Roll
Number of Electors per Habitation
Elected Candidate for Perth
Previous Member
District of PerthNorth Metropolitan RegionElector information correct as at 9 February 2017
Area (sq km)
25
This figure is the gazetted area and may include bodies of water
Page 87
2017
Sta
te G
ener
al E
lect
ion
Res
ults
and
Sta
tistic
s R
epor
t 86
2983
3
PP No.
Polli
ng P
lace
CA
REY
Joh
nA
LPVo
tes
BA
LLIN
GA
LL B
enFL
UX
Vote
s
HA
NSO
N M
att
AJP
Vote
s
MIL
LIG
AN
Han
nah
GR
NVo
tes
MO
LYN
EUX
Ian
JMW
AVo
tes
HYD
E A
rchi
eM
BP
Vote
s
LIM
Ken
Ivan
AC
PVo
tes
EVA
NG
EL E
leni
LIB
Vote
s
Tota
lFo
rmal
Vote
s
Info
rmal
Vote
sTo
tal
Vote
s
1Ar
anm
ore
Cat
holic
Col
lege
556
813
130
42
1032
31,
046
161,
062
687
65.7
4%35
834
.26%
2C
onst
itutio
nal C
entre
269
165
104
64
1436
778
528
813
379
48.2
8%40
651
.72%
3G
reek
Orth
odox
Chu
rch
435
58
128
87
1023
583
625
861
554
66.2
7%28
233
.73%
4H
ighg
ate
Prim
ary
Scho
ol93
022
2238
310
732
480
1,88
683
1,96
91,
313
69.6
6%57
230
.34%
5Ky
illa
Prim
ary
Scho
ol54
95
1012
40
713
342
1,05
037
1,08
768
465
.14%
366
34.8
6%6
Mt H
awth
orn
Bapt
ist C
hurc
h H
all
483
618
118
48
1437
31,
024
351,
059
613
59.9
2%41
040
.08%
7M
t Haw
thor
n C
omm
unity
Cen
tre L
esse
r Hal
l63
34
914
26
910
396
1,20
950
1,25
977
163
.77%
438
36.2
3%8
Mt H
awth
orn
Prim
ary
Scho
ol76
12
1613
51
139
398
1,33
562
1,39
789
967
.34%
436
32.6
6%9
Nor
th M
etro
polit
an T
AFE
East
Per
th C
ampu
s17
62
1168
75
1021
849
710
507
250
50.4
0%24
649
.60%
10N
orth
Met
ropo
litan
TAF
E Le
eder
ville
Cam
pus
428
1313
153
22
829
991
825
943
587
63.9
4%33
136
.06%
11N
orth
Met
ropo
litan
TAF
E N
orth
brid
ge C
ampu
s27
010
1012
36
25
140
566
1958
540
972
.26%
157
27.7
4%12
Nor
th P
erth
Prim
ary
Scho
ol1,
010
2719
259
814
2247
61,
835
661,
901
1,29
070
.34%
544
29.6
6%14
Roy
al P
erth
Hos
pita
l75
42
291
41
6418
012
192
110
61.1
1%70
38.8
9%15
WAE
C (B
OQ
bui
ldin
g)17
05
565
24
518
444
017
457
239
54.3
2%20
145
.68%
16C
itipl
ace
Com
mun
ity C
entre
100
48
495
31
6923
99
248
154
64.4
4%85
35.5
6%17
Hou
sing
Aut
horit
y51
216
1714
76
2634
633
1,39
171
1,46
268
549
.25%
706
50.7
5%7,
357
149
186
2,15
776
117
198
4,99
715
,237
565
15,8
029,
624
63.1
8%5,
608
36.8
2%Ab
sent
Vot
es1,
265
5859
613
2636
6191
03,
028
146
3,17
41,
941
64.1
0%1,
087
35.9
0%Ea
rly V
otes
(by
Post
)92
719
2619
719
1525
949
2,17
796
2,27
31,
144
52.5
7%1,
032
47.4
3%Ea
rly V
otes
(In
Pers
on)
1,51
539
5247
627
3554
1,19
23,
390
873,
477
2,02
559
.77%
1,36
340
.23%
Prov
isio
nal V
otes
80
01
00
04
131
148
61.5
4%5
38.4
6%Sp
ecia
l Ins
titut
ions
, H
ospi
tals
& R
emot
es65
12
50
23
4812
612
138
7357
.94%
5342
.06%
3,78
011
713
91,
292
7288
143
3,10
38,
734
342
9,07
65,
191
59.4
5%3,
540
40.5
5%
11,1
3726
632
53,
449
148
205
341
8,10
023
,971
907
24,8
7814
,815
61.8
2%9,
148
38.1
8%
46.4
6%1.
11%
1.36
%14
.39%
0.62
%0.
86%
1.42
%33
.79%
100.
00%
CA
REY
Joh
nVo
tes
BA
LLIN
GA
LL B
enVo
tes
HA
NSO
N M
att
Vote
s
MIL
LIG
AN
Han
nah
Vote
s
MO
LYN
EUX
Ian
Vote
s
HYD
E A
rchi
eVo
tes
LIM
Ken
Ivan
Vote
s
EVA
NG
EL E
leni
Vote
s
Vote
sre
mai
ning
in c
ount
Exha
uste
dVo
tes
Tota
lFo
rmal
Vote
s11
,137
266
325
3,44
914
820
534
18,
100
23,9
7123
,971
2517
1625
2812
2514
814
8To
tal
11,1
6228
334
13,
474
233
353
8,12
523
,971
23,9
7144
2941
3239
4823
323
3To
tal
11,2
0631
238
23,
506
392
8,17
323
,971
23,9
7165
8111
012
4431
231
2To
tal
11,2
7146
33,
616
404
8,21
723
,971
23,9
7163
6439
237
403
140
4To
tal
11,3
3452
73,
655
8,45
423
,970
123
,971
140
279
105
524
352
7To
tal
11,4
743,
934
8,55
923
,967
423
,971
3,34
158
93,
930
43,
934
14,8
159,
148
23,9
638
23,9
71
61.8
2%38
.18%
Abs
olut
e M
ajor
ity =
119
82
Dis
tric
t Tot
alM
ILLI
GA
N E
xclu
ded
Firs
t Pre
fere
nce
Vote
sM
OLY
NEU
X Ex
clud
ed
HYD
E Ex
clud
ed
BA
LLIN
GA
LL E
xclu
ded
LIM
Exc
lude
d
Tota
l Firs
t Pre
fere
nces
Vot
es
%To
tal V
alid
Vot
es
CA
REY
Joh
nA
LP
HA
NSO
N E
xclu
ded
EVA
NG
EL E
leni
LIB
Pert
h El
ecto
ral D
istr
ict
11 M
arch
201
7N
orth
Met
ropo
litan
Reg
ion
Two
Can
dida
te P
refe
rred
Vot
es
Pref
eren
ce D
istr
ibut
ion
John
CAR
EYW
A La
bor
elec
ted
as th
e m
embe
r for
PER
THw
ith a
maj
ority
of
5667
vot
es
Firs
t Pre
fere
nce
Vote
s Po
lled
for e
ach
Can
dida
te a
t eac
h Po
lling
Pla
ce
Vote
r Tur
nout
= 8
3.39
%In
form
al V
otes
= 3
.65%
Polli
ng P
lace
Tot
als
Dis
trib
utio
n of
Pre
fere
nces
Dec
lara
tion
and
Mob
ile V
otes
Tot
al
LIB
38
.18%
ALP
61
.82%
2 C
andi
date
Pre
ferr
ed
Page 88
2017 State General ElectionResults and Statistics Report
87
Local Governments within District
City of Karratha
Shire of East Pilbara
Town of Port Hedland
Males 11,246
Females 9,934
Total 21,180
Electors Habitation
1 5,317
2 4,578
3 1,243
>3 482 Returning Officer
Total Habitations 11,620 Tony SOTERIOU
Candidate Name Party
MICHEL, Kevin Joseph Jude WA Labor
Candidate Name Party
GRYLLS, Brendon John THE NATIONALS
Number of Electors on Roll
Number of Electors per Habitation
Elected Candidate for Pilbara
Previous Member
District of PilbaraMining and Pastoral Region
Elector information correct as at 9 February 2017
Area (sq km)
406,525
This figure is the gazetted area and may include bodies of water
Page 89
2017
Sta
te G
ener
al E
lect
ion
Res
ults
and
Sta
tistic
s R
epor
t 88
2118
0
PP No.
Polli
ng P
lace
ALC
HIN
Mar
kLI
BVo
tes
WH
ITE-
HA
RTI
G F
iona
SFP
Vote
s
MIC
HEL
Kev
inA
LPVo
tes
GR
YLLS
Bre
ndon
NA
TVo
tes
McK
ENN
A B
rent
GR
NVo
tes
AR
CH
IBA
LD D
avid
PHO
NVo
tes
DU
NN
Mar
k A
FLU
XVo
tes
HO
OPE
R D
avyd
Cam
eron
MB
PVo
tes
Tota
lFo
rmal
Vote
s
Info
rmal
Vote
sTo
tal
Vote
s
1Ba
ler P
rimar
y Sc
hool
157
6849
929
949
136
810
1,22
676
1,30
271
157
.99%
515
42.0
1%2
Dam
pier
Pre
-Prim
ary
Scho
ol46
4185
167
1541
42
401
1241
315
037
.41%
251
62.5
9%3
Hed
land
Sen
ior H
igh
Scho
ol70
4318
511
324
595
450
329
532
278
55.2
7%22
544
.73%
4Ka
rrat
ha P
rimar
y Sc
hool
5673
130
165
1065
31
503
3153
423
947
.51%
264
52.4
9%5
Mar
ble
Bar C
omm
unity
Res
ourc
e C
entre
82
2523
24
20
662
6835
53.0
3%31
46.9
7%6
Milla
rs W
ell P
rimar
y Sc
hool
131
130
273
315
4281
115
988
561,
044
459
46.4
6%52
953
.54%
7N
ewm
an P
rimar
y Sc
hool
190
4216
285
2973
43
588
2561
336
261
.56%
226
38.4
4%8
New
man
Sen
ior H
igh
Scho
ol13
935
134
5329
725
647
337
510
312
65.9
6%16
134
.04%
9PC
YC R
oebo
urne
835
7614
65
130
157
2017
712
478
.98%
3321
.02%
10Po
rt H
edla
nd P
rimar
y Sc
hool
183
4027
630
833
100
196
965
441,
009
458
47.4
6%50
752
.54%
11Ta
mbr
ey P
rimar
y Sc
hool
205
147
455
602
4816
114
11,
633
681,
701
701
42.9
3%93
257
.07%
12W
ickh
am P
rimar
y Sc
hool
6219
913
191
2499
101
617
3465
137
861
.26%
239
38.7
4%1,
255
855
2,43
12,
235
311
896
9839
8,12
043
48,
554
4,20
751
.81%
3,91
348
.19%
Abse
nt V
otes
185
8237
026
180
101
812
1,09
951
1,15
057
252
.14%
525
47.8
6%Ea
rly V
otes
(by
Post
)18
172
177
198
2612
36
378
639
825
406
51.6
5%38
048
.35%
Early
Vot
es (I
n Pe
rson
)49
132
41,
183
1,12
614
647
021
93,
770
128
3,89
81,
917
50.8
6%1,
852
49.1
4%Pr
ovis
iona
l Vot
es2
17
32
20
017
219
1376
.47%
423
.53%
Spec
ial I
nstit
utio
ns,
Hos
pita
ls &
Rem
otes
4418
218
3719
140
235
223
375
278
78.9
8%74
21.0
2%90
349
71,
955
1,62
527
371
035
266,
024
243
6,26
73,
186
52.9
1%2,
835
47.0
9%
2,15
81,
352
4,38
63,
860
584
1,60
613
365
14,1
4467
714
,821
7,39
352
.28%
6,74
847
.72%
15.2
6%9.
56%
31.0
1%27
.29%
4.13
%11
.35%
0.94
%0.
46%
100.
00%
ALC
HIN
Mar
kVo
tes
WH
ITE-
HA
RTI
G F
iona
Vote
s
MIC
HEL
Kev
inVo
tes
GR
YLLS
Bre
ndon
Vote
s
McK
ENN
A B
rent
Vote
s
AR
CH
IBA
LD D
avid
Vote
s
DU
NN
Mar
k A
Vote
s
HO
OPE
R D
avyd
Cam
eron
Vote
s
Vote
sre
mai
ning
in c
ount
Exha
uste
dVo
tes
Tota
lFo
rmal
Vote
s2,
158
1,35
24,
386
3,86
058
41,
606
133
6514
,144
14,1
4412
711
39
419
6565
Tota
l2,
170
1,35
94,
397
3,86
359
31,
610
152
14,1
4414
,144
1641
2219
2826
152
152
Tota
l2,
186
1,40
04,
419
3,88
262
11,
636
14,1
4414
,144
5377
283
158
5062
162
1To
tal
2,23
91,
477
4,70
24,
040
1,68
614
,144
14,1
4425
439
830
252
21,
476
11,
477
Tota
l2,
493
5,10
04,
342
2,20
814
,143
114
,144
739
675
793
2,20
71
2,20
8To
tal
3,23
25,
775
5,13
514
,142
214
,144
1,61
81,
613
3,23
11
3,23
27,
393
6,74
814
,141
314
,144
52.2
8%47
.72%
Abs
olut
e M
ajor
ity =
707
1
Dis
tric
t Tot
alA
LCH
IN E
xclu
ded
Firs
t Pre
fere
nce
Vote
sH
OO
PER
Exc
lude
d
DU
NN
Exc
lude
d
McK
ENN
A E
xclu
ded
WH
ITE-
HA
RTI
G E
xclu
ded
Tota
l Firs
t Pre
fere
nces
Vot
es
%To
tal V
alid
Vot
es
MIC
HEL
Kev
inA
LP
AR
CH
IBA
LD E
xclu
ded
GR
YLLS
Bre
ndon
NA
T
Pilb
ara
Elec
tora
l Dis
tric
t
11 M
arch
201
7M
inin
g an
d Pa
stor
al R
egio
n
Two
Can
dida
te P
refe
rred
Vot
es
Pref
eren
ce D
istr
ibut
ion
Kev
in J
osep
h Ju
de M
ICH
ELW
A L
abor
elec
ted
as th
e m
embe
r for
PILB
AR
Aw
ith a
maj
ority
of
645
vote
s
Firs
t Pre
fere
nce
Vote
s Po
lled
for e
ach
Can
dida
te a
t eac
h Po
lling
Pla
ce
Vote
r Tur
nout
= 6
9.98
%In
form
al V
otes
= 4
.57%
Polli
ng P
lace
Tot
als
Dis
trib
utio
n of
Pre
fere
nces
Dec
lara
tion
and
Mob
ile V
otes
Tot
al
NA
T 47
.72%
A
LP
52.2
8%
2 C
andi
date
Pre
ferr
ed
Page 90
2017 State General ElectionResults and Statistics Report
89
Suburbs within District
Brentwood
Bull Creek
Mt Pleasant
Riverton
Males 12,317 Rossmoyne
Females 13,069 Shelley
Total 25,386 Willetton
Electors Habitation
1 3,742
2 5,297
3 2,016
>3 1,165 Returning Officer
Total Habitations 12,220 Shaun MAJOR
Candidate Name Party
NAHAN, Michael Dennis Liberal Party
Candidate Name Party
NAHAN, Michael Dennis Liberal Party
Number of Electors on Roll
Number of Electors per Habitation
Elected Candidate for Riverton
Previous Member
District of RivertonSouth Metropolitan Region
Elector information correct as at 9 February 2017
Area (sq km)
20
This figure is the gazetted area and may include bodies of water
Page 91
2017
Sta
te G
ener
al E
lect
ion
Res
ults
and
Sta
tistic
s R
epor
t 90
2538
6
PP No.
Polli
ng P
lace
REG
NA
RD
Sus
anA
CP
Vote
s
BO
SWEL
L M
ario
nA
LPVo
tes
PASH
A Z
eesh
anM
BP
Vote
s
WA
UG
H G
avin
JMW
AVo
tes
KER
R T
hor
GR
NVo
tes
NA
HA
N M
ike
LIB
Vote
s
CH
AN
G T
shun
g-H
uiPH
ON
Vote
s
Tota
lFo
rmal
Vote
s
Info
rmal
Vote
sTo
tal
Vote
s
1B
ull C
reek
Prim
ary
Sch
ool
5046
114
1212
264
065
1,36
450
1,41
459
743
.77%
767
56.2
3%2
Her
ald
Ave
nue
Sen
ior C
itize
ns C
entre
6646
511
1610
056
267
1,28
773
1,36
061
347
.63%
674
52.3
7%3
Obe
rthur
Prim
ary
Sch
ool
4840
610
2311
756
551
1,22
035
1,25
555
445
.41%
666
54.5
9%4
RA
AFA
Est
ate
- Bul
l Cre
ek49
312
615
7853
543
1,03
842
1,08
041
039
.54%
627
60.4
6%5
Riv
erto
n P
rimar
y S
choo
l94
570
811
143
577
651,
468
541,
522
744
50.7
2%72
349
.28%
6R
ossm
oyne
Prim
ary
Sch
ool
9238
220
1815
189
464
1,62
144
1,66
558
636
.15%
1,03
563
.85%
7R
ostra
ta P
rimar
y S
choo
l12
192
914
2621
799
196
2,39
411
52,
509
1,18
349
.48%
1,20
850
.52%
8S
helle
y P
rimar
y S
choo
l66
438
2013
130
800
681,
535
351,
570
598
38.9
6%93
761
.04%
9W
illet
ton
Prim
ary
Sch
ool
9775
919
2325
585
812
22,
133
832,
216
1,06
349
.86%
1,06
950
.14%
10W
illet
ton
Sen
ior H
igh
Sch
ool
113
813
1529
203
908
109
2,19
093
2,28
31,
081
49.3
6%1,
109
50.6
4%79
65,
535
137
186
1,51
67,
330
750
16,2
5062
416
,874
7,42
945
.73%
8,81
554
.27%
Abs
ent V
otes
9562
430
2728
569
988
1,84
888
1,93
694
951
.35%
899
48.6
5%E
arly
Vot
es (b
y P
ost)
102
662
1937
129
1,08
013
22,
161
612,
222
875
40.4
9%1,
286
59.5
1%E
arly
Vot
es (I
n P
erso
n)56
617
1720
154
856
110
1,83
064
1,89
483
145
.41%
999
54.5
9%P
rovi
sion
al V
otes
05
00
17
114
317
750
.00%
750
.00%
Spe
cial
Inst
itutio
ns,
Hos
pita
ls &
Rem
otes
949
14
575
514
810
158
6241
.89%
8658
.11%
262
1,95
767
8857
42,
717
336
6,00
122
66,
227
2,72
445
.39%
3,27
754
.61%
1,05
87,
492
204
274
2,09
010
,047
1,08
622
,251
850
23,1
0110
,153
45.6
4%12
,092
54.3
6%
4.75
%33
.67%
0.92
%1.
23%
9.39
%45
.15%
4.88
%10
0.00
%
REG
NA
RD
Sus
anVo
tes
BO
SWEL
L M
ario
nVo
tes
PASH
A Z
eesh
anVo
tes
WA
UG
H G
avin
Vote
s
KER
R T
hor
Vote
s
NA
HA
N M
ike
Vote
s
CH
AN
G T
shun
g-H
uiVo
tes
Vote
sre
mai
ning
in c
ount
Exha
uste
dVo
tes
Tota
lFo
rmal
Vote
s1,
058
7,49
220
427
42,
090
10,0
471,
086
22,2
5122
,251
2245
3935
5013
204
204
Tota
l1,
080
7,53
731
32,
125
10,0
971,
099
22,2
5122
,251
4970
8167
4631
331
3To
tal
1,12
97,
607
2,20
610
,164
1,14
522
,251
22,2
5125
511
164
711
31,
126
31,
129
Tota
l7,
862
2,31
710
,811
1,25
822
,248
322
,251
301
208
747
1,25
62
1,25
8To
tal
8,16
32,
525
11,5
5822
,246
522
,251
1,99
053
42,
524
12,
525
10,1
5312
,092
22,2
456
22,2
51
45.6
4%54
.36%
Abs
olut
e M
ajor
ity =
111
23
Dis
tric
t Tot
al
Firs
t Pre
fere
nce
Vot
esPA
SHA
Exc
lude
d
WA
UG
H E
xclu
ded
REG
NA
RD
Exc
lude
d
CH
AN
G E
xclu
ded
Tota
l Firs
t Pre
fere
nces
Vot
es
%To
tal V
alid
Vot
es
BO
SWEL
L M
ario
nA
LP
KER
R E
xclu
ded
NA
HA
N M
ike
LIB
Riv
erto
n El
ecto
ral D
istr
ict
11 M
arch
201
7So
uth
Met
ropo
litan
Reg
ion
Two
Can
dida
te P
refe
rred
Vot
es
Pref
eren
ce D
istr
ibut
ion
Mic
hael
Den
nis
NA
HA
NLi
bera
l Par
tyel
ecte
d as
the
mem
ber f
orR
IVER
TON
with
a m
ajor
ity o
f19
39 v
otes
Firs
t Pre
fere
nce
Vote
s Po
lled
for e
ach
Can
dida
te a
t eac
h Po
lling
Pla
ce
Vote
r Tur
nout
= 9
1.00
%In
form
al V
otes
= 3
.68%
Polli
ng P
lace
Tot
als
Dis
trib
utio
n of
Pre
fere
nces
Dec
lara
tion
and
Mob
ile V
otes
Tot
al
LIB
54
.36%
ALP
45
.64%
2 C
andi
date
Pre
ferr
ed
Page 92
2017 State General ElectionResults and Statistics Report
91
Suburbs within District
Cooloongup
East Rockingham
Garden Island
Hillman
Males 13,294 Peron
Females 13,649 Rockingham
Total 26,943 Safety Bay
Shoalwater
Waikiki
Electors Habitation
1 6,314
2 6,273
3 1,700
>3 645 Returning Officer
Total Habitations 14,932 Norman JOHNSON
Candidate Name Party
MCGOWAN, Mark WA Labor
Candidate Name Party
MCGOWAN, Mark WA Labor
Number of Electors on Roll
Number of Electors per Habitation
Elected Candidate for Rockingham
Previous Member
District of RockinghamSouth Metropolitan Region
Elector information correct as at 9 February 2017
Area (sq km)
48
This figure is the gazetted area and may include bodies of water
Page 93
2017
Sta
te G
ener
al E
lect
ion
Res
ults
and
Sta
tistic
s R
epor
t 92
2694
3
PP No.
Polli
ng P
lace
BA
UM
AN
N W
endy
LIB
Vote
s
MU
MM
E J
ames
GR
NVo
tes
OM
ALL
EY J
ames
PHO
NVo
tes
BU
CH
AN
AN
Cra
igIN
DVo
tes
STO
NEH
OU
SE S
ylvi
aA
CP
Vote
s
CH
AR
LES
Mar
kM
BP
Vote
s
McG
OW
AN
Mar
kA
LPVo
tes
Tota
lFo
rmal
Vote
s
Info
rmal
Vote
sTo
tal
Vote
s
1B
unga
ree
Prim
ary
Sch
ool
9273
5520
215
664
930
3896
815
316
.45%
777
83.5
5%2
Cha
rthou
se P
rimar
y S
choo
l33
212
215
343
3713
1,13
31,
833
921,
925
499
27.2
4%1,
333
72.7
6%3
Coo
loon
gup
Prim
ary
Sch
ool
110
7385
2227
472
81,
049
501,
099
186
17.7
3%86
382
.27%
4E
ast W
aiki
ki P
rimar
y S
choo
l10
1012
03
196
132
313
520
15.1
5%11
284
.85%
5H
illm
an P
rimar
y S
choo
l10
959
6720
215
574
855
3689
117
420
.37%
680
79.6
3%6
Roc
king
ham
Aut
umn
Cen
tre (D
rive-
in)
196
92
30
100
139
314
230
21.5
8%10
978
.42%
7R
ocki
ngha
m B
each
Prim
ary
Sch
ool
300
129
125
2430
595
11,
564
751,
639
444
28.4
1%1,
119
71.5
9%8
Roc
king
ham
Sen
ior H
igh
Sch
ool
232
103
142
2320
121,
016
1,54
894
1,64
237
224
.03%
1,17
675
.97%
9S
afet
y B
ay P
rimar
y S
choo
l44
924
918
655
5914
1,39
72,
409
115
2,52
466
127
.46%
1,74
672
.54%
10S
afet
y B
ay S
enio
r Hig
h S
choo
l30
714
513
226
2911
901
1,55
163
1,61
443
928
.34%
1,11
071
.66%
1,96
096
996
623
525
070
7,56
012
,010
569
12,5
792,
978
24.8
1%9,
025
75.1
9%A
bsen
t Vot
es28
520
716
954
4019
1,07
81,
852
971,
949
480
25.9
3%1,
371
74.0
7%E
arly
Vot
es (b
y P
ost)
498
8823
433
4012
1,22
12,
126
682,
194
695
32.7
1%1,
430
67.2
9%E
arly
Vot
es (I
n P
erso
n)1,
190
334
545
110
8145
3,65
35,
958
249
6,20
71,
676
28.1
4%4,
280
71.8
6%P
rovi
sion
al V
otes
24
00
00
1319
322
421
.05%
1578
.95%
Spe
cial
Inst
itutio
ns,
Hos
pita
ls &
Rem
otes
303
11
21
5189
1210
136
40.4
5%53
59.5
5%2,
005
636
949
198
163
776,
016
10,0
4442
910
,473
2,89
128
.79%
7,14
971
.21%
3,96
51,
605
1,91
543
341
314
713
,576
22,0
5499
823
,052
5,86
926
.63%
16,1
7473
.37%
17.9
8%7.
28%
8.68
%1.
96%
1.87
%0.
67%
61.5
6%10
0.00
%
BA
UM
AN
N W
endy
Vote
s
MU
MM
E J
ames
Vote
s
OM
ALL
EY J
ames
Vote
s
BU
CH
AN
AN
Cra
igVo
tes
STO
NEH
OU
SE S
ylvi
aVo
tes
CH
AR
LES
Mar
kVo
tes
McG
OW
AN
Mar
kVo
tes
Vote
sre
mai
ning
in c
ount
Exha
uste
dVo
tes
Tota
lFo
rmal
Vote
s3,
965
1,60
51,
915
433
413
147
13,5
7622
,054
22,0
5411
1913
4530
2914
714
7To
tal
3,97
61,
624
1,92
847
844
313
,605
22,0
5422
,054
190
1871
7884
441
244
3To
tal
4,16
61,
642
1,99
955
613
,689
22,0
522
22,0
5412
114
613
415
555
655
6To
tal
4,28
71,
788
2,13
313
,844
22,0
522
22,0
5422
328
31,
279
1,78
53
1,78
8To
tal
4,51
02,
416
15,1
2322
,049
522
,054
1,35
91,
051
2,41
06
2,41
65,
869
16,1
7422
,043
1122
,054
26.6
3%73
.37%
Abs
olut
e M
ajor
ity =
110
22
Dis
tric
t Tot
al
Firs
t Pre
fere
nce
Vot
esC
HA
RLE
S Ex
clud
ed
STO
NEH
OU
SE E
xclu
ded
BU
CH
AN
AN
Exc
lude
d
MU
MM
E Ex
clud
ed
Tota
l Firs
t Pre
fere
nces
Vot
es
%To
tal V
alid
Vot
es
BA
UM
AN
N W
endy
LIB
OM
ALL
EY E
xclu
ded
McG
OW
AN
Mar
kA
LP
Roc
king
ham
Ele
ctor
al D
istr
ict
11 M
arch
201
7So
uth
Met
ropo
litan
Reg
ion
Two
Can
dida
te P
refe
rred
Vot
es
Pref
eren
ce D
istr
ibut
ion
Mar
k M
CG
OW
AN
WA
Lab
orel
ecte
d as
the
mem
ber f
orR
OC
KIN
GH
AM
with
a m
ajor
ity o
f10
305
vote
s
Firs
t Pre
fere
nce
Vote
s Po
lled
for e
ach
Can
dida
te a
t eac
h Po
lling
Pla
ce
Vote
r Tur
nout
= 8
5.56
%In
form
al V
otes
= 4
.33%
Polli
ng P
lace
Tot
als
Dis
trib
utio
n of
Pre
fere
nces
Dec
lara
tion
and
Mob
ile V
otes
Tot
al
ALP
73
.37%
LIB
26
.63%
2 C
andi
date
Pre
ferr
ed
Page 94
2017 State General ElectionResults and Statistics Report
93
Local Governments within District
Males 13,239
Females 12,953
Total 26,192
Electors Habitation
1 5,740
2 6,056
3 1,627
>3 774
Total Habitations 14,197
Shire of Broomehill-Tambellup
Shire of Cranbrook
Shire of Cuballing
Shire of Dumbleyung
Shire of Esperance
Shire of Gnowangerup
Shire of Katanning
Shire of Kent
Shire of Kojonup
Shire of Kulin
Shire of Lake Grace
Shire of Narrogin
Shire of Ravensthorpe
Shire of Wagin
Shire of West Arthur
Shire of Wickepin
Shire of Williams
Shire of Woodanilling
Returning Officer
Andrew COUSINS
Candidate Name Party
RUNDLE, Peter James THE NATIONALS
Number of Electors on Roll
Number of Electors per Habitation
Elected Candidate for Roe
District of RoeAgricultural Region
Elector information correct as at 9 February 2017
Area (sq km)
106,409
This figure is the gazetted area and may include bodies of water
Page 95
2017 State General ElectionResults and Statistics Report
94
26192
PPNo.
Polling Place
JACOBS Graham
LIBVotes
STACEY PeterSFP
Votes
FELS Tony
Votes
ZACKLOVA Eketerina
PHONVotes
RUNDLE PeterNAT
Votes
MCINNES Simone
GRNVotes
WILLIS Bradley
ALPVotes
KELLY Cathie
ACPVotes
TotalFormalVotes
InformalVotes
TotalVotes
1 Arthur River Hall 10 2 0 1 33 3 0 1 50 2 52 10 20.00% 40 80.00%2 Borden Primary School 5 2 0 1 42 2 7 0 59 2 61 9 15.25% 50 84.75%3 Broomehill Town Hall 32 6 0 10 105 6 29 3 191 9 200 49 25.65% 142 74.35%4 Castletown Primary School 470 65 7 142 458 40 184 27 1,393 55 1,448 679 48.78% 713 51.22%5 Condingup Primary School 36 8 1 7 23 1 3 3 82 2 84 44 53.66% 38 46.34%6 Cranbrook Memorial Hall 33 21 1 25 136 9 73 17 315 12 327 69 21.90% 246 78.10%7 Cuballing Agricultural Hall 45 11 1 23 120 14 35 4 253 13 266 70 27.67% 183 72.33%8 Darkan Town Hall 36 13 0 10 100 6 23 1 189 9 198 48 25.67% 139 74.33%9 Dumbleyung Primary School 27 11 0 21 126 5 34 1 225 5 230 37 16.44% 188 83.56%10 Duranillin Hall 9 6 1 6 64 0 7 1 94 3 97 16 17.02% 78 82.98%11 East Narrogin Primary School 26 21 2 15 85 15 55 7 226 19 245 60 26.55% 166 73.45%12 Esperance Senior Citizens Centre 425 43 3 76 462 66 249 24 1,348 58 1,406 615 45.62% 733 54.38%13 Frankland River Community Centre 31 7 0 10 92 7 16 0 163 6 169 41 25.15% 122 74.85%14 Gibson Football Club 72 9 0 12 49 0 18 3 163 2 165 93 57.41% 69 42.59%15 Gnowangerup Community Resource Centre 56 16 1 20 129 8 47 18 295 13 308 98 33.22% 197 66.78%16 Harrismith Community Hall 12 7 1 6 57 3 2 1 89 1 90 16 17.98% 73 82.02%17 Highbury Hall 26 8 0 8 76 5 13 2 138 4 142 34 24.64% 104 75.36%18 Hopetoun Community Centre 90 26 0 32 107 7 58 3 323 23 346 138 42.72% 185 57.28%19 Katanning Leisure and Function Centre 100 37 1 75 317 20 179 28 757 42 799 225 29.76% 531 70.24%20 Kojonup RSL Hall 136 47 1 51 358 19 66 17 695 37 732 203 29.21% 492 70.79%21 Kulin Resource Centre 26 17 1 20 168 1 27 5 265 6 271 50 18.87% 215 81.13%22 Lake Grace Community Resource Centre 84 40 0 23 170 3 28 4 352 6 358 122 34.66% 230 65.34%23 Lake King Primary School 34 4 0 9 52 1 4 0 104 2 106 41 39.42% 63 60.58%24 Munglinup Primary School 35 7 0 9 38 1 3 0 93 1 94 40 43.01% 53 56.99%25 Muradup Hall 13 3 0 9 84 1 6 0 116 4 120 18 15.52% 98 84.48%26 Narrogin Senior Citizens Centre 202 92 5 114 428 39 203 31 1,114 77 1,191 360 32.35% 753 67.65%27 Newdegate Community Resource Centre 28 18 0 11 86 4 10 2 159 9 168 40 25.16% 119 74.84%28 Nulsen Primary School 289 42 6 74 305 78 181 25 1,000 46 1,046 468 46.80% 532 53.20%29 Nyabing Town Hall 23 5 0 7 79 2 11 2 129 3 132 31 24.03% 98 75.97%30 Ongerup Primary School 14 6 0 16 36 2 7 1 82 1 83 27 33.33% 54 66.67%31 Popanyinning Agricultural Hall 13 5 0 10 36 2 27 7 100 1 101 23 23.00% 77 77.00%32 Quindanning Community Hall 10 3 1 4 16 0 2 0 36 3 39 10 27.78% 26 72.22%33 Ravensthorpe District High School 69 15 0 15 87 8 24 6 224 14 238 91 40.63% 133 59.38%34 Salmon Gums Primary School 15 2 0 10 26 1 4 0 58 1 59 21 36.21% 37 63.79%35 Tambellup Shire Lesser Hall 24 10 0 7 150 3 40 5 239 13 252 39 16.32% 200 83.68%36 Uniting Church - Wagin 101 26 1 46 221 16 112 6 529 52 581 145 27.51% 382 72.49%37 Wickepin Primary School 54 14 4 22 102 5 22 6 229 7 236 75 32.75% 154 67.25%38 Williams RSL Hall 85 26 3 23 208 8 41 1 395 27 422 116 29.37% 279 70.63%39 Woodanilling Shire Hall 17 5 1 11 61 3 30 9 137 7 144 39 28.47% 98 71.53%40 Woolorama Wagin Show Grounds 87 44 2 37 295 7 31 19 522 11 533 140 26.82% 382 73.18%41 Yealering Hall 6 9 1 2 14 0 5 1 38 1 39 14 36.84% 24 63.16%
2,906 759 45 1,030 5,601 421 1,916 291 12,969 609 13,578 4,464 34.44% 8,496 65.56%Absent Votes 472 118 10 137 692 113 333 52 1,927 65 1,992 716 37.21% 1,208 62.79%Early Votes (by Post) 545 103 6 197 947 69 221 61 2,149 48 2,197 766 35.66% 1,382 64.34%Early Votes (In Person) 1,403 199 15 418 2,268 155 710 131 5,299 153 5,452 1,977 37.31% 3,322 62.69%Provisional Votes 5 0 0 1 2 1 1 0 10 0 10 7 70.00% 3 30.00%Special Institutions, Hospitals & Remotes 52 3 0 9 43 0 22 1 130 8 138 67 51.54% 63 48.46%
2,477 423 31 762 3,952 338 1,287 245 9,515 274 9,789 3,533 37.15% 5,978 62.85%
5,383 1,182 76 1,792 9,553 759 3,203 536 22,484 883 23,367 7,997 35.59% 14,474 64.41%
23.94% 5.26% 0.34% 7.97% 42.49% 3.38% 14.25% 2.38% 100.00%
JACOBS Graham
Votes
STACEY PeterVotes
FELS TonyVotes
ZACKLOVA Eketerina
Votes
RUNDLE PeterVotes
MCINNES Simone
Votes
WILLIS Bradley
Votes
KELLY CathieVotes
Votesremainingin count
ExhaustedVotes
TotalFormalVotes
5,383 1,182 76 1,792 9,553 759 3,203 536 22,484 22,48413 21 12 11 8 8 3 76 76
Total 5,396 1,203 1,804 9,564 767 3,211 539 22,484 22,484245 45 52 122 24 50 538 1 539
Total 5,641 1,248 1,856 9,686 791 3,261 22,483 1 22,48474 70 52 227 366 789 2 791
Total 5,715 1,318 1,908 9,913 3,627 22,481 3 22,484260 471 388 197 1,316 2 1,318
Total 5,975 2,379 10,301 3,824 22,479 5 22,484850 1,128 398 2,376 3 2,379
Total 6,825 11,429 4,222 22,476 8 22,4841,172 3,045 4,217 5 4,2227,997 14,474 22,471 13 22,484
35.59% 64.41%Absolute Majority = 11236
District TotalWILLIS Excluded
First Preference VotesFELS Excluded
KELLY Excluded
MCINNES Excluded
STACEY Excluded
Total First Preferences Votes
%Total Valid Votes
JACOBS Graham
LIB
ZACKLOVA Excluded
RUNDLE PeterNAT
Roe Electoral District
11 March 2017Agricultural Region
Two Candidate Preferred Votes
Preference DistributionPeter James RUNDLE
THE NATIONALSelected as the member for
ROEwith a majority of
6477 votes
First Preference Votes Polled for each Candidate at each Polling Place
Voter Turnout = 89.21% Informal Votes = 3.78%
Polling Place Totals
Distribution of Preferences
Declaration and Mobile Votes Total
NAT 64.41%
LIB 35.59%
2 Candidate Preferred
Page 96
2017 State General ElectionResults and Statistics Report
95
Suburbs within District
Doubleview
Gwelup
Innaloo
Karrinyup
Males 13,377 Osborne Park
Females 14,516 Scarborough
Total 27,893 Trigg
Woodlands
Electors Habitation
1 7,130
2 6,443
3 1,553
>3 733 Returning Officer
Total Habitations 15,859 Louise FOPPOLI
Candidate Name Party
HARVEY, Liza Mary Liberal Party
Candidate Name Party
HARVEY, Liza Mary Liberal Party
Number of Electors on Roll
Number of Electors per Habitation
Elected Candidate for Scarborough
Previous Member
District of ScarboroughNorth Metropolitan RegionElector information correct as at 9 February 2017
Area (sq km)
20
This figure is the gazetted area and may include bodies of water
Page 97
2017
Sta
te G
ener
al E
lect
ion
Res
ults
and
Sta
tistic
s R
epor
t 96
2789
3
PP No.
Polli
ng P
lace
HAR
VEY
Liz
aLI
BVo
tes
BAI
LEY
Dan
MB
PVo
tes
PYN
T S
teve
nJM
WA
Vote
s
HO
ST K
evin
ACP
Vote
s
WAL
KER
Ton
yAL
PVo
tes
DO
DD
Mar
gare
tPH
ON
Vote
s
CU
LLIT
Y J
udith
GR
NVo
tes
Tota
lFo
rmal
Vote
s
Info
rmal
Vote
sTo
tal
Vote
s
1D
eanm
ore
Prim
ary
Sch
ool
853
2726
2549
047
267
1,73
568
1,80
397
456
.17%
760
43.8
3%2
Dou
blev
iew
Prim
ary
Sch
ool
1,71
043
5857
975
117
680
3,64
011
23,
752
2,03
155
.80%
1,60
944
.20%
3La
ke G
wel
up P
rimar
y S
choo
l54
419
1117
314
3511
01,
050
581,
108
615
58.5
7%43
541
.43%
4N
ewbo
roug
h P
rimar
y S
choo
l97
826
1748
635
7028
72,
061
902,
151
1,11
354
.03%
947
45.9
7%5
Sca
rbor
ough
Prim
ary
Sch
ool
748
2519
3849
047
307
1,67
470
1,74
489
153
.23%
783
46.7
7%6
Uni
ting
Chu
rch
- Sca
rbor
ough
567
1519
1535
345
156
1,17
049
1,21
963
754
.49%
532
45.5
1%7
Yulu
ma
Prim
ary
Sch
ool
1,10
525
3457
1,00
910
637
22,
708
124
2,83
21,
290
47.6
4%1,
418
52.3
6%6,
505
180
184
257
4,26
646
72,
179
14,0
3857
114
,609
7,55
153
.80%
6,48
446
.20%
Abs
ent V
otes
1,78
859
3876
1,04
618
262
53,
814
155
3,96
92,
141
56.1
5%1,
672
43.8
5%E
arly
Vot
es (b
y P
ost)
1,21
124
3844
641
128
199
2,28
510
52,
390
1,38
460
.57%
901
39.4
3%E
arly
Vot
es (I
n P
erso
n)1,
241
4316
3466
812
930
52,
436
912,
527
1,45
159
.56%
985
40.4
4%P
rovi
sion
al V
otes
00
00
10
01
12
00.
00%
110
0.00
%S
peci
al In
stitu
tions
, H
ospi
tals
& R
emot
es84
12
1946
43
159
716
610
264
.15%
5735
.85%
4,32
412
794
173
2,40
244
31,
132
8,69
535
99,
054
5,07
858
.41%
3,61
641
.59%
10,8
2930
727
843
06,
668
910
3,31
122
,733
930
23,6
6312
,629
55.5
6%10
,100
44.4
4%
47.6
4%1.
35%
1.22
%1.
89%
29.3
3%4.
00%
14.5
6%10
0.00
%
HAR
VEY
Liz
aVo
tes
BAI
LEY
Dan
Vote
s
PYN
T S
teve
nVo
tes
HO
ST K
evin
Vote
s
WAL
KER
Ton
yVo
tes
DO
DD
Mar
gare
tVo
tes
CU
LLIT
Y J
udith
Vote
s
Vote
sre
mai
ning
in c
ount
Exha
uste
dVo
tes
Tota
lFo
rmal
Vote
s10
,829
307
278
430
6,66
891
03,
311
22,7
3322
,733
5670
1959
2450
278
278
Tota
l10
,885
377
449
6,72
793
43,
361
22,7
3322
,733
100
6378
3799
377
377
Tota
l10
,985
512
6,80
597
13,
460
22,7
3322
,733
293
9380
4651
251
2To
tal
11,2
786,
898
1,05
13,
506
22,7
3322
,733
526
290
233
1,04
92
1,05
1To
tal
11,8
047,
188
3,73
922
,731
222
,733
825
2,91
23,
737
23,
739
12,6
2910
,100
22,7
294
22,7
33
55.5
6%44
.44%
Abso
lute
Maj
ority
= 1
1365
Dis
tric
t Tot
al
Firs
t Pre
fere
nce
Vot
esPY
NT
Excl
uded
BAI
LEY
Excl
uded
HO
ST E
xclu
ded
DO
DD
Exc
lude
d
Tota
l Firs
t Pre
fere
nces
Vot
es
%To
tal V
alid
Vot
es
HAR
VEY
Liz
aLI
B
CU
LLIT
Y Ex
clud
ed
WAL
KER
Ton
yAL
P
Scar
boro
ugh
Elec
tora
l Dis
tric
t
11 M
arch
201
7N
orth
Met
ropo
litan
Reg
ion
Two
Can
dida
te P
refe
rred
Vot
es
Pref
eren
ce D
istr
ibut
ion
Liza
Mar
y H
ARVE
YLi
bera
l Par
tyel
ecte
d as
the
mem
ber f
orSC
ARB
OR
OU
GH
with
a m
ajor
ity o
f25
29 v
otes
Firs
t Pre
fere
nce
Vote
s Po
lled
for e
ach
Can
dida
te a
t eac
h Po
lling
Pla
ce
Vote
r Tur
nout
= 8
4.83
%In
form
al V
otes
= 3
.93%
Polli
ng P
lace
Tot
als
Dis
trib
utio
n of
Pre
fere
nces
Dec
lara
tion
and
Mob
ile V
otes
Tot
al
ALP
44
.44%
LI
B
55.5
6%
2 C
andi
date
Pre
ferr
ed
Page 98
2017 State General ElectionResults and Statistics Report
97
Suburbs within District
Como
Karawara
Kensington
Manning
Males 13,807 Salter Point
Females 14,670 South Perth
Total 28,477 Victoria Park
Waterford
Electors Habitation
1 6,945
2 6,346
3 1,675
>3 869 Returning Officer
Total Habitations 15,835 Peter ZAIKOS
Candidate Name Party
MCGRATH, John Edwin Liberal Party
Candidate Name Party
MCGRATH, John Edwin Liberal Party
Number of Electors on Roll
Number of Electors per Habitation
Elected Candidate for South Perth
Previous Member
District of South PerthSouth Metropolitan Region
Elector information correct as at 9 February 2017
Area (sq km)
28
This figure is the gazetted area and may include bodies of water
Page 99
2017
Sta
te G
ener
al E
lect
ion
Res
ults
and
Sta
tistic
s R
epor
t 98
2847
7
PP No.
Polli
ng P
lace
ST M
ARTI
N J
ason
Bre
ttM
BP
Vote
s
FRAN
CIS
M IND
Vote
s
BR
OG
AN M
ark
GR
NVo
tes
McG
RAT
H J
ohn
LIB
Vote
s
REI
D F
iona
IND
Vote
s
STEI
NEC
K R
osem
ary
Fran
ces
Cap
onAC
PVo
tes
VOR
OS
Mic
hael
ALP
Vote
s
Tota
lFo
rmal
Vote
s
Info
rmal
Vote
sTo
tal
Vote
s
1C
halle
nger
Res
erve
209
136
714
4823
418
1,36
851
1,41
979
558
.11%
573
41.8
9%2
Col
lier P
rimar
y S
choo
l20
1714
953
490
2432
81,
162
351,
197
648
55.8
1%51
344
.19%
3C
omo
Prim
ary
Sch
ool
3719
380
1,26
385
5678
52,
625
116
2,74
11,
455
55.4
5%1,
169
44.5
5%4
Cur
tin P
rimar
y S
choo
l19
3013
049
243
3853
11,
283
661,
349
583
45.4
8%69
954
.52%
5E
rnes
t Joh
nson
Ova
l Pav
ilion
1611
7041
332
220
074
432
776
464
62.4
5%27
937
.55%
6K
ensi
ngto
n P
rimar
y S
choo
l32
1128
784
379
4458
91,
885
721,
957
985
52.2
5%90
047
.75%
7K
ent S
treet
Sen
ior H
igh
Sch
ool
31
1447
60
3510
67
113
5350
.00%
5350
.00%
8S
outh
Per
th P
rimar
y S
choo
l48
1325
21,
412
117
3167
52,
548
802,
628
1,57
861
.93%
970
38.0
7%9
St A
ugus
tine'
s C
hurc
h H
all
87
9953
632
2130
21,
005
231,
028
592
58.9
6%41
241
.04%
10S
t Piu
s X
Par
ish
Hal
l43
1016
01,
040
4531
626
1,95
585
2,04
01,
145
58.6
0%80
941
.40%
11U
nitin
g C
hurc
h - S
outh
Per
th18
1516
897
768
2142
21,
689
591,
748
1,08
564
.28%
603
35.7
2%26
414
31,
845
8,27
164
529
14,
911
16,3
7062
616
,996
9,38
357
.34%
6,98
042
.66%
Abs
ent V
otes
7337
477
1,11
863
6485
32,
685
124
2,80
91,
355
50.4
7%1,
330
49.5
3%E
arly
Vot
es (b
y P
ost)
6226
208
1,29
887
4657
62,
303
662,
369
1,45
963
.35%
844
36.6
5%E
arly
Vot
es (I
n P
erso
n)41
3426
91,
129
8534
681
2,27
366
2,33
91,
290
56.7
5%98
343
.25%
Pro
visi
onal
Vot
es0
02
30
15
113
145
45.4
5%6
54.5
5%S
peci
al In
stitu
tions
, H
ospi
tals
& R
emot
es3
45
804
536
137
1214
993
67.8
8%44
32.1
2%17
910
196
13,
628
239
150
2,15
17,
409
271
7,68
04,
202
56.7
1%3,
207
43.2
9%
443
244
2,80
611
,899
884
441
7,06
223
,779
897
24,6
7613
,585
57.1
5%10
,187
42.8
5%
1.86
%1.
03%
11.8
0%50
.04%
3.72
%1.
85%
29.7
0%10
0.00
%
ST M
ARTI
N J
ason
Bre
ttVo
tes
FRAN
CIS
MVo
tes
BR
OG
AN M
ark
Vote
s
McG
RAT
H J
ohn
Vote
s
REI
D F
iona
Vote
s
STEI
NEC
K R
osem
ary
Fran
ces
Cap
onVo
tes
VOR
OS
Mic
hael
Vote
s
Vote
sre
mai
ning
in c
ount
Exha
uste
dVo
tes
Tota
lFo
rmal
Vote
s44
324
42,
806
11,8
9988
444
17,
062
23,7
7923
,779
4331
3799
727
244
244
Tota
l48
62,
837
11,9
3698
344
87,
089
23,7
7923
,779
4436
231
6968
448
448
Tota
l53
02,
873
12,1
671,
052
7,15
723
,779
23,7
7916
712
716
668
528
253
0To
tal
3,04
012
,294
1,21
87,
225
23,7
772
23,7
7939
244
138
21,
215
31,
218
Tota
l3,
432
12,7
357,
607
23,7
745
23,7
7985
02,
580
3,43
02
3,43
213
,585
10,1
8723
,772
723
,779
57.1
5%42
.85%
Abso
lute
Maj
ority
= 1
1887
Dis
tric
t Tot
al
Firs
t Pre
fere
nce
Vot
esFR
ANC
IS E
xclu
ded
STEI
NEC
K E
xclu
ded
ST M
ARTI
N E
xclu
ded
REI
D E
xclu
ded
Tota
l Firs
t Pre
fere
nces
Vot
es
%To
tal V
alid
Vot
es
McG
RAT
H J
ohn
LIB
BR
OG
AN E
xclu
ded
VOR
OS
Mic
hael
ALP
Sout
h Pe
rth
Elec
tora
l Dis
tric
t
11 M
arch
201
7So
uth
Met
ropo
litan
Reg
ion
Two
Can
dida
te P
refe
rred
Vot
es
Pref
eren
ce D
istr
ibut
ion
John
Edw
in M
CG
RAT
HLi
bera
l Par
tyel
ecte
d as
the
mem
ber f
orSO
UTH
PER
THw
ith a
maj
ority
of
3398
vot
es
Firs
t Pre
fere
nce
Vote
s Po
lled
for e
ach
Can
dida
te a
t eac
h Po
lling
Pla
ce
Vote
r Tur
nout
= 8
6.65
%In
form
al V
otes
= 3
.64%
Polli
ng P
lace
Tot
als
Dis
trib
utio
n of
Pre
fere
nces
Dec
lara
tion
and
Mob
ile V
otes
Tot
al
ALP
42
.85%
LI
B
57.1
5%
2 C
andi
date
Pre
ferr
ed
Page 100
2017 State General ElectionResults and Statistics Report
99
Suburbs within District
Canning Vale
Gosnells
Huntingdale
Southern River
Males 13,512
Females 13,649
Total 27,161
Electors Habitation
1 4,462
2 6,186
3 1,915
>3 1,049 Returning Officer
Total Habitations 13,612 Ken MCINTOSH
Candidate Name Party
HEALY, Terence WA Labor
Candidate Name Party
ABETZ, Peter Liberal Party
Number of Electors on Roll
Number of Electors per Habitation
Elected Candidate for Southern River
Previous Member
District of Southern RiverSouth Metropolitan Region
Elector information correct as at 9 February 2017
Area (sq km)
35
This figure is the gazetted area and may include bodies of water
Page 101
2017
Sta
te G
ener
al E
lect
ion
Res
ults
and
Sta
tistic
s R
epor
t 100
2716
1
PP No.
Polli
ng P
lace
ABET
Z P
eter
LIB
Vote
s
HEA
LY T
erry
ALP
Vote
s
PIK
OS-
SALL
IE T
oni
GR
NVo
tes
SEC
KER
Ste
ven
IND
Vote
s
FISH
LOC
K D
avid
LLD
PVo
tes
HAR
LEY
Cra
igIN
DVo
tes
SIN
GH
Am
anM
BPVo
tes
SRIV
ASTA
VA A
shJM
WA
Vote
s
Tota
lFo
rmal
Vote
s
Info
rmal
Vote
sTo
tal
Vote
s
1A
shbu
rton
Driv
e P
rimar
y S
choo
l45
811
6212
829
1121
1331
1853
120
1973
521
28.1
2%13
3271
.88%
2B
letc
hley
Par
k P
rimar
y S
choo
l13
8213
5217
522
2321
2120
3016
111
3127
1467
48.6
4%15
4951
.36%
3C
alad
enia
Prim
ary
Sch
ool
826
870
130
116
722
2018
9294
1986
879
46.4
8%10
1253
.52%
4C
ampb
ell P
rimar
y S
choo
l94
593
210
513
48
1318
2038
103
2141
985
48.3
3%10
5351
.67%
5C
anni
ng V
ale
Col
lege
508
538
679
57
1115
1160
5012
1053
846
.38%
622
53.6
2%6
Exc
elsi
or P
rimar
y S
choo
l30
931
655
82
66
770
934
743
339
47.8
1%37
052
.19%
7G
osne
lls P
rimar
y S
choo
l16
435
238
137
133
659
643
639
185
31.0
4%41
168
.96%
8H
untin
gdal
e P
rimar
y S
choo
l91
615
6418
743
2037
2224
2813
136
2949
1002
35.6
2%18
1164
.38%
9W
irrab
irra
Prim
ary
Sch
ool
234
477
5113
1210
78
812
5686
826
732
.96%
543
67.0
4%57
4275
6393
616
190
130
118
149
1488
974
715
636
6183
41.5
4%87
0358
.46%
Abs
ent V
otes
917
1296
244
5126
5556
3526
8019
428
7410
5539
.38%
1624
60.6
2%E
arly
Vot
es (b
y P
ost)
1156
1078
9948
1541
2522
2484
7225
5612
3149
.56%
1253
50.4
4%E
arly
Vot
es (I
n P
erso
n)10
1313
4916
050
1524
2616
2653
124
2777
1095
41.2
7%15
5858
.73%
Pro
visi
onal
Vot
es8
111
00
02
022
729
940
.91%
1359
.09%
Spe
cial
Inst
itutio
ns,
Hos
pita
ls &
Rem
otes
1714
31
02
00
371
3818
48.6
5%19
51.3
5%31
1137
4850
715
056
122
109
7378
7639
882
7434
0843
.28%
4467
56.7
2%
8853
1131
114
4331
114
625
222
722
222
765
1145
2391
095
9142
.14%
1317
057
.86%
38.8
9%49
.69%
6.34
%1.
37%
0.64
%1.
11%
1.00
%0.
98%
100.
00%
ABET
Z P
eter
Vote
s
HEA
LY T
erry
Vote
s
PIK
OS-
SALL
IE T
oni
Vote
s
SEC
KER
Ste
ven
Vote
s
FISH
LOC
K D
avid
LVo
tes
HAR
LEY
Cra
igVo
tes
SIN
GH
Am
anVo
tes
SRIV
ASTA
VA A
shVo
tes
Vote
sre
mai
ning
in c
ount
Exha
uste
dVo
tes
Tota
lFo
rmal
Vote
s8,
853
11,3
111,
443
311
146
252
227
222
22,7
6522
,765
6516
920
1713
514
51
146
Tota
l8,
918
11,3
271,
452
331
269
240
227
22,7
641
22,7
6528
2614
1642
100
226
122
7To
tal
8,94
611
,353
1,46
634
731
134
022
,763
222
,765
3030
1518
353
311
311
Tota
l8,
976
11,3
831,
481
530
393
22,7
632
22,7
6568
6463
198
393
393
Tota
l9,
044
11,4
471,
544
728
22,7
632
22,7
6516
719
336
772
71
728
Tota
l9,
211
11,6
401,
911
22,7
623
22,7
6538
01,
530
1,91
01
1,91
19,
591
13,1
7022
,761
422
,765
42.1
4%57
.86%
Abso
lute
Maj
ority
= 1
1381
Dis
tric
t Tot
alPI
KO
S-SA
LLIE
Exc
lude
d
Firs
t Pre
fere
nce
Vot
esFI
SHLO
CK
Exc
lude
d
SRIV
ASTA
VA E
xclu
ded
HAR
LEY
Excl
uded
SIN
GH
Exc
lude
d
Tota
l Firs
t Pre
fere
nces
Vot
es
%To
tal V
alid
Vot
es
ABET
Z P
eter
LIB
SEC
KER
Exc
lude
d
HEA
LY T
erry
ALP
Sout
hern
Riv
er E
lect
oral
Dis
tric
t
11 M
arch
201
7So
uth
Met
ropo
litan
Reg
ion
Two
Can
dida
te P
refe
rred
Vot
es
Pref
eren
ce D
istr
ibut
ion
Tere
nce
HEA
LYW
A L
abor
elec
ted
as th
e m
embe
r for
SOU
THER
N R
IVER
with
a m
ajor
ity o
f35
79 v
otes
Firs
t Pre
fere
nce
Vote
s Po
lled
for e
ach
Can
dida
te a
t eac
h Po
lling
Pla
ce
Vote
r Tur
nout
= 8
8.03
%In
form
al V
otes
= 4
.79%
Polli
ng P
lace
Tot
als
Dis
trib
utio
n of
Pre
fere
nces
Dec
lara
tion
and
Mob
ile V
otes
Tot
al
ALP
57
.86%
LIB
42
.14%
2 C
andi
date
Pre
ferr
ed
Page 102
2017 State General ElectionResults and Statistics Report
101
Suburbs within DistrictAveley
Avon Valley National Park
Bailup
Beechina
Males 15,885 Belhus
Females 16,688 Brigadoon
Total 32,573 Bullsbrook
Chidlow
Ellenbrook
Electors Habitation Gidgegannup
1 5,388 Henley Brook
2 8,089 Melaleuca
3 2,113 Mt Helena
>3 1,077 Mundaring
Total Habitations 16,667 Sawyers Valley
The Vines
Upper Swan
Walyunga National Park
Wooroloo
Returning Officer
Warren SOUTHWELL
Candidate Name Party
SHAW, Jessica Jane WA Labor
Candidate Name Party
ALBAN, Francesco Angelo Liberal Party
Number of Electors on Roll
Number of Electors per Habitation
Elected Candidate for Swan Hills
Previous Member
District of Swan HillsEast Metropolitan RegionElector information correct as at 9 February 2017
Area (sq km)
987
This figure is the gazetted area and may include bodies of water
Page 103
2017
Sta
te G
ener
al E
lect
ion
Res
ults
and
Sta
tistic
s R
epor
t 102
3257
3
PP No.
Polli
ng P
lace
SHA
W J
essi
caA
LPVo
tes
OLD
San
dra
PHO
NVo
tes
BH
OW
AN
IAH
Dan
usha
JMW
AVo
tes
ALB
AN
Fra
nkLI
BVo
tes
SIN
GH
Luc
kyM
BP
Vote
s
WEB
B E
van
GR
NVo
tes
Tota
lFo
rmal
Vote
s
Info
rmal
Vote
sTo
tal
Vote
s
1A
rbor
Gro
ve P
rimar
y S
choo
l1,
360
204
2147
456
123
2,23
884
2,32
21,
606
71.7
6%63
228
.24%
2B
ulls
broo
k C
olle
ge93
033
126
572
3812
62,
023
106
2,12
91,
181
58.3
8%84
241
.62%
3C
hidl
ow P
rimar
y S
choo
l45
897
1025
312
8891
842
960
588
64.0
5%33
035
.95%
4E
llen
Stir
ling
Prim
ary
Sch
ool
1,76
829
224
547
5717
12,
859
113
2,97
22,
113
73.9
1%74
626
.09%
5E
llenb
rook
Sec
onda
ry C
olle
ge1,
060
112
1838
651
103
1,73
092
1,82
21,
250
72.3
0%47
927
.70%
6G
idge
gann
up S
hire
Hal
l40
117
416
438
2310
11,
153
431,
196
563
48.8
7%58
951
.13%
7G
race
Life
Chu
rch
1,33
417
29
539
3010
92,
193
113
2,30
61,
527
69.6
3%66
630
.37%
8M
t Hel
ena
Rec
reat
ion
Cen
tre52
814
17
309
1411
31,
112
491,
161
698
62.8
3%41
337
.17%
9S
awye
rs V
alle
y P
rimar
y S
choo
l23
261
613
19
8252
130
551
332
63.7
2%18
936
.28%
10S
wan
Val
ley
Ang
lican
Com
mun
ity S
choo
l1,
432
219
1974
856
155
2,62
999
2,72
81,
743
66.3
0%88
633
.70%
11U
pper
Sw
an P
rimar
y S
choo
l57
513
57
594
2086
1,41
764
1,48
170
049
.44%
716
50.5
6%12
Woo
rolo
o P
rimar
y S
choo
l14
549
811
46
1233
416
350
182
54.4
9%15
245
.51%
10,2
231,
987
171
5,10
537
21,
269
19,1
2785
119
,978
12,4
8365
.28%
6,64
034
.72%
Abs
ent V
otes
1,33
132
236
685
5832
52,
757
144
2,90
11,
769
64.1
6%98
835
.84%
Ear
ly V
otes
(by
Pos
t)1,
229
332
3683
339
155
2,62
412
32,
747
1,53
458
.46%
1,09
041
.54%
Ear
ly V
otes
(In
Per
son)
1,54
236
832
758
4217
12,
913
111
3,02
41,
903
65.3
5%1,
009
34.6
5%P
rovi
sion
al V
otes
102
07
11
212
2314
66.6
7%7
33.3
3%S
peci
al In
stitu
tions
, H
ospi
tals
& R
emot
es0
00
00
00
00
4,11
21,
024
104
2,28
314
065
28,
315
380
8,69
55,
220
62.7
9%3,
094
37.2
1%
14,3
353,
011
275
7,38
851
21,
921
27,4
421,
231
28,6
7317
,703
64.5
2%9,
734
35.4
8%
0.52
0.11
0.01
0.27
0.02
0.07
1.00
SHA
W J
essi
caVo
tes
OLD
San
dra
Vote
s
BH
OW
AN
IAH
Dan
usha
Vote
s
ALB
AN
Fra
nkVo
tes
SIN
GH
Luc
kyVo
tes
WEB
B E
van
Vote
s
Vote
sre
mai
ning
in c
ount
Exha
uste
dVo
tes
Tota
lFo
rmal
Vote
s14
,335
3,01
127
57,
388
512
1,92
127
,442
27,4
4263
5844
7238
275
275
Tota
l14
,398
3,06
97,
432
584
1,95
927
,442
27,4
4217
811
011
518
158
458
4To
tal
14,5
763,
179
7,54
72,
140
27,4
4227
,442
1,51
126
036
62,
137
32,
140
Tota
l16
,087
3,43
97,
913
27,4
393
27,4
421,
616
1,82
13,
437
23,
439
17,7
039,
734
27,4
375
27,4
42
64.5
2%35
.48%
Abs
olut
e M
ajor
ity =
137
19
Dis
tric
t Tot
al
Firs
t Pre
fere
nce
Vot
esB
HO
WA
NIA
H E
xclu
ded
SIN
GH
Exc
lude
d
WEB
B E
xclu
ded
OLD
Exc
lude
d
Tota
l Firs
t Pre
fere
nces
Vot
es
%To
tal V
alid
Vot
es
SHA
W J
essi
caA
LP
ALB
AN
Fra
nkLI
B
Swan
Hill
s El
ecto
ral D
istr
ict
11 M
arch
201
7Ea
st M
etro
polit
an R
egio
n
Two
Can
dida
te P
refe
rred
Vot
es
Pref
eren
ce D
istr
ibut
ion
Jess
ica
Jane
SH
AW
WA
Lab
orel
ecte
d as
the
mem
ber f
orSW
AN
HIL
LSw
ith a
maj
ority
of
7969
vot
es
Firs
t Pre
fere
nce
Vote
s Po
lled
for e
ach
Can
dida
te a
t eac
h Po
lling
Pla
ce
Vote
r Tur
nout
= 8
8.03
%In
form
al V
otes
= 4
.29%
Polli
ng P
lace
Tot
als
Dis
trib
utio
n of
Pre
fere
nces
Dec
lara
tion
and
Mob
ile V
otes
Tot
al
LIB
35
.48%
A
LP
64.5
2%
2 C
andi
date
Pre
ferr
ed
Page 104
2017 State General ElectionResults and Statistics Report
103
Suburbs within District
Gosnells
Kenwick
Maddington
Martin
Males 14,060 Thornlie
Females 14,209
Total 28,269
Electors Habitation
1 6,135
2 6,097
3 1,910
>3 973 Returning Officer
Total Habitations 15,115 Linda SCOTT
Candidate Name Party
TALLENTIRE, Christopher John WA Labor
Number of Electors on Roll
Number of Electors per Habitation
Elected Candidate for Thornlie
District of ThornlieEast Metropolitan RegionElector information correct as at 9 February 2017
Area (sq km)
28
This figure is the gazetted area and may include bodies of water
Page 105
2017
Sta
te G
ener
al E
lect
ion
Res
ults
and
Sta
tistic
s R
epor
t 104
2826
9
PP No.
Polli
ng P
lace
CO
ALES
Rob LIB
Vote
s
BAR
AIO
LO S
andy
PHO
NVo
tes
VAN
DAM
And
rew
FLU
XVo
tes
BEN
NET
T S
ibel
MB
PVo
tes
HAM
MO
ND
Gar
ySF
PVo
tes
GO
IRAN
Mad
elei
neAC
PVo
tes
TALL
ENTI
RE
Chr
isAL
PVo
tes
McA
LEES
E D
onna
GR
NVo
tes
Tota
lFo
rmal
Vote
s
Info
rmal
Vote
sTo
tal
Vote
s
1A
ddie
Mills
Cen
tre19
349
66
2634
371
4873
369
802
264
36.0
2%46
963
.98%
2A
ddie
Mills
Cen
tre (D
rive
In)
495
10
19
638
136
1515
165
47.7
9%71
52.2
1%3
Eas
t Mad
ding
ton
Prim
ary
Sch
ool
410
140
1125
5062
1,06
711
91,
884
164
2,04
857
330
.45%
1,30
969
.55%
4Fo
rest
Cre
scen
t Prim
ary
Sch
ool
650
138
1018
4092
1,19
513
12,
274
982,
372
860
37.8
9%1,
410
62.1
1%5
Gos
nells
Prim
ary
Sch
ool
281
896
2229
4357
078
1,11
880
1,19
838
033
.99%
738
66.0
1%6
Mad
ding
ton
Prim
ary
Sch
ool
109
254
310
1124
429
435
3046
514
032
.18%
295
67.8
2%7
Thor
nlie
Prim
ary
Sch
ool
406
829
4730
7190
115
71,
703
130
1,83
352
931
.15%
1,16
968
.85%
8Th
ornl
ie S
enio
r Hig
h S
choo
l71
219
113
2635
103
1,36
116
42,
605
140
2,74
593
035
.76%
1,67
164
.24%
9W
irrab
irra
Prim
ary
Sch
ool
246
107
1612
4646
756
791,
308
105
1,41
336
628
.00%
941
72.0
0%10
Yale
Prim
ary
Sch
ool
406
114
1234
4363
878
134
1,68
411
11,
795
554
32.9
4%1,
128
67.0
6%11
Yule
Bro
ok C
olle
ge19
663
524
2444
684
711,
111
941,
205
286
25.7
7%82
474
.23%
3,65
81,
003
9321
733
457
88,
090
1,01
814
,991
1,03
616
,027
4,94
733
.04%
10,0
2566
.96%
Abs
ent V
otes
458
222
2830
8459
1,08
026
32,
224
148
2,37
272
132
.45%
1,50
167
.55%
Ear
ly V
otes
(by
Pos
t)61
724
620
2547
631,
055
107
2,18
013
02,
310
851
39.0
4%1,
329
60.9
6%E
arly
Vot
es (I
n P
erso
n)85
226
719
3761
801,
646
170
3,13
212
23,
254
1,14
036
.41%
1,99
163
.59%
Pro
visi
onal
Vot
es6
30
00
112
123
225
1043
.48%
1356
.52%
Spe
cial
Inst
itutio
ns,
Hos
pita
ls &
Rem
otes
916
00
017
100
421
813
231
112
51.3
8%10
648
.62%
2,02
474
467
9219
222
03,
893
545
7,77
741
58,
192
2,83
436
.45%
4,94
063
.55%
5,68
21,
747
160
309
526
798
11,9
831,
563
22,7
681,
451
24,2
197,
781
34.2
1%14
,965
65.7
9%
24.9
6%7.
67%
0.70
%1.
36%
2.31
%3.
50%
52.6
3%6.
86%
100.
00%
CO
ALES
Rob
Vote
s
BAR
AIO
LO S
andy
Vote
s
VAN
DAM
And
rew
Vote
s
BEN
NET
T S
ibel
Vote
s
HAM
MO
ND
Gar
yVo
tes
GO
IRAN
Mad
elei
neVo
tes
TALL
ENTI
RE
Chr
isVo
tes
McA
LEES
E D
onna
Vote
s
Vote
sre
mai
ning
in c
ount
Exha
uste
dVo
tes
Tota
lFo
rmal
Vote
s5,
682
1,74
716
030
952
679
811
,983
1,56
322
,768
22,7
6814
1937
307
1734
158
216
0To
tal
5,69
61,
766
346
556
805
12,0
001,
597
22,7
662
22,7
6852
2964
2911
258
344
234
6To
tal
5,74
81,
795
620
834
12,1
121,
655
22,7
644
22,7
6875
175
100
171
9661
73
620
Tota
l5,
823
1,97
093
412
,283
1,75
122
,761
722
,768
496
151
181
102
930
493
4To
tal
6,31
92,
121
12,4
641,
853
22,7
5711
22,7
6820
222
81,
419
1,84
94
1,85
3To
tal
6,52
12,
349
13,8
8322
,753
1522
,768
1,26
01,
082
2,34
27
2,34
97,
781
14,9
6522
,746
2222
,768
34.2
1%65
.79%
Abso
lute
Maj
ority
= 1
1374
Dis
tric
t Tot
alB
ARAI
OLO
Exc
lude
d
Firs
t Pre
fere
nce
Vot
esVA
N D
AM E
xclu
ded
BEN
NET
T Ex
clud
ed
HAM
MO
ND
Exc
lude
d
GO
IRAN
Exc
lude
d
Tota
l Firs
t Pre
fere
nces
Vot
es
%To
tal V
alid
Vot
es
CO
ALES
Rob LIB
McA
LEES
E Ex
clud
ed
TALL
ENTI
RE
Chr
isAL
P
Thor
nlie
Ele
ctor
al D
istr
ict
11 M
arch
201
7Ea
st M
etro
polit
an R
egio
n
Two
Can
dida
te P
refe
rred
Vot
es
Pref
eren
ce D
istr
ibut
ion
Chr
isto
pher
Joh
n TA
LLEN
TIR
EW
A La
bor
elec
ted
as th
e m
embe
r for
THO
RN
LIE
with
a m
ajor
ity o
f71
84 v
otes
Firs
t Pre
fere
nce
Vote
s Po
lled
for e
ach
Can
dida
te a
t eac
h Po
lling
Pla
ce
Vote
r Tur
nout
= 8
5.67
%In
form
al V
otes
= 5
.99%
Polli
ng P
lace
Tot
als
Dis
trib
utio
n of
Pre
fere
nces
Dec
lara
tion
and
Mob
ile V
otes
Tot
al
ALP
65
.79%
LIB
34
.21%
2 C
andi
date
Pre
ferr
ed
Page 106
2017 State General ElectionResults and Statistics Report
105
Local Governments within District
City of Busselton
Shire of Augusta-Margaret River
Males 13,577
Females 14,385
Total 27,962
Electors Habitation
1 5,219
2 7,164
3 1,678
>3 735 Returning Officer
Total Habitations 14,796 Catherine SMALLWOOD
Candidate Name Party
METTAM-KNARHOI, Elizabeth Liberal Party
Candidate Name Party
METTAM-KNARHOI, Elizabeth Liberal Party
Number of Electors on Roll
Number of Electors per Habitation
Elected Candidate for Vasse
Previous Member
District of VasseSouth West Region
Elector information correct as at 9 February 2017
Area (sq km)
2,542
This figure is the gazetted area and may include bodies of water
Page 107
2017
Sta
te G
ener
al E
lect
ion
Res
ults
and
Sta
tistic
s R
epor
t 106
2796
2
PP No.
Polli
ng P
lace
O'C
ON
NEL
L L
uke
GR
NVo
tes
MET
TAM
Lib
byLI
BVo
tes
GO
RD
ON
Pet
erN
AT
Vote
s
HA
RTL
EY W
esA
LPVo
tes
Tota
lFo
rmal
Vote
s
Info
rmal
Vote
sTo
tal
Vote
s
1A
cton
Par
k H
all
2917
110
128
329
1033
926
881
.46%
6118
.54%
2B
usse
lton
Prim
ary
Sch
ool
133
568
268
266
1,23
561
1,29
679
564
.42%
439
35.5
8%3
Bus
selto
n S
enio
r Hig
h S
choo
l28
093
438
455
62,
154
114
2,26
81,
298
60.2
9%85
539
.71%
4C
ape
Nat
ural
iste
Col
lege
223
827
296
292
1,63
880
1,71
81,
121
68.4
4%51
731
.56%
5C
hurc
hill
Par
k H
all
103
358
157
169
787
4883
549
162
.39%
296
37.6
1%6
Cow
aram
up P
rimar
y S
choo
l26
835
721
118
61,
022
321,
054
574
56.1
6%44
843
.84%
7D
unsb
orou
gh H
all
130
335
111
104
680
1769
745
066
.18%
230
33.8
2%8
Geo
rgia
na M
ollo
y A
nglic
an S
choo
l71
341
140
132
684
2270
646
367
.69%
221
32.3
1%9
Nat
ural
iste
Com
mun
ity C
entre
403
959
284
350
1,99
677
2,07
31,
294
64.8
3%70
235
.17%
10R
osa
Bro
ok H
all
4870
6746
231
1424
513
458
.01%
9741
.99%
11W
est B
usse
lton
Prim
ary
Sch
ool
224
937
324
454
1,93
982
2,02
11,
249
64.4
1%69
035
.59%
12Y
allin
gup
Hal
l22
832
911
812
880
324
827
468
58.2
8%33
541
.72%
2,14
06,
186
2,46
12,
711
13,4
9858
114
,079
8,60
563
.76%
4,89
136
.24%
Abs
ent V
otes
381
743
276
424
1,82
478
1,90
21,
036
56.8
0%78
843
.20%
Ear
ly V
otes
(by
Pos
t)21
51,
011
399
323
1,94
812
52,
073
1,37
870
.74%
570
29.2
6%E
arly
Vot
es (I
n P
erso
n)53
82,
993
1,44
21,
389
6,36
219
56,
557
4,27
967
.27%
2,08
232
.73%
Pro
visi
onal
Vot
es1
20
03
03
266
.67%
133
.33%
Spe
cial
Inst
itutio
ns,
Hos
pita
ls &
Rem
otes
2297
2871
218
1323
112
959
.17%
8940
.83%
1,15
74,
846
2,14
52,
207
10,3
5541
110
,766
6,82
465
.91%
3,53
034
.09%
3,29
711
,032
4,60
64,
918
23,8
5399
224
,845
15,4
2964
.69%
8,42
135
.31%
13.8
2%46
.25%
19.3
1%20
.62%
100.
00%
O'C
ON
NEL
L L
uke
Vote
s
MET
TAM
Lib
byVo
tes
GO
RD
ON
Pet
erVo
tes
HA
RTL
EY W
esVo
tes
Vote
sre
mai
ning
in c
ount
Exha
uste
dVo
tes
Tota
lFo
rmal
Vote
s3,
297
11,0
324,
606
4,91
823
,853
23,8
5365
489
41,
746
3,29
43
3,29
7To
tal
11,6
865,
500
6,66
423
,850
323
,853
3,74
31,
757
5,50
05,
500
15,4
298,
421
23,8
503
23,8
53
64.6
9%35
.31%
Abs
olut
e M
ajor
ity =
119
26
Dis
tric
t Tot
al
Firs
t Pre
fere
nce
Vot
esO
'CO
NN
ELL
Excl
uded
GO
RD
ON
Exc
lude
d
Tota
l Firs
t Pre
fere
nces
Vot
es
%To
tal V
alid
Vot
es
MET
TAM
Lib
byLI
B
HA
RTL
EY W
esA
LP
Vass
e El
ecto
ral D
istr
ict
11 M
arch
201
7So
uth
Wes
t Reg
ion
Two
Can
dida
te P
refe
rred
Vot
es
Pref
eren
ce D
istr
ibut
ion
Eliz
abet
h M
ETTA
M-K
NAR
HO
ILi
bera
l Par
tyel
ecte
d as
the
mem
ber f
orVA
SSE
with
a m
ajor
ity o
f70
08 v
otes
Firs
t Pre
fere
nce
Vote
s Po
lled
for e
ach
Can
dida
te a
t eac
h Po
lling
Pla
ce
Vote
r Tur
nout
= 8
8.85
%In
form
al V
otes
= 3
.99%
Polli
ng P
lace
Tot
als
Dis
trib
utio
n of
Pre
fere
nces
Dec
lara
tion
and
Mob
ile V
otes
Tot
al
ALP
35
.31%
LI
B
64.6
9%
2 C
andi
date
Pre
ferr
ed
Page 108
2017 State General ElectionResults and Statistics Report
107
Suburbs within District
Bentley
Burswood
Carlisle
East Victoria Park
Males 14,220 Lathlain
Females 13,959 St James
Total 28,179 Victoria Park
Welshpool
Wilson
Electors Habitation
1 8,187
2 6,214
3 1,534
>3 631 Returning Officer
Total Habitations 16,566 Gladys DEMISSIE
Candidate Name Party
WYATT, Benjamin Sana WA Labor
Candidate Name Party
WYATT, Benjamin Sana WA Labor
Number of Electors on Roll
Number of Electors per Habitation
Elected Candidate for Victoria Park
Previous Member
District of Victoria ParkSouth Metropolitan Region
Elector information correct as at 9 February 2017
Area (sq km)
24
This figure is the gazetted area and may include bodies of water
Page 109
2017
Sta
te G
ener
al E
lect
ion
Res
ults
and
Sta
tistic
s R
epor
t 108
2817
9
PP No.
Polli
ng P
lace
STAE
R M
ark
Roh
anAC
PVo
tes
QU
INN
Rya
nG
RN
Vote
s
NO
YE J
enni
fer
MB
PVo
tes
WYA
TT B
enAL
PVo
tes
JAC
OB
S J
ulia
nLI
BVo
tes
Tota
lFo
rmal
Vote
s
Info
rmal
Vote
sTo
tal
Vote
s
1B
entle
y B
aptis
t Chu
rch
9116
028
701
367
1,34
788
1,43
589
766
.59%
450
33.4
1%2
Ben
tley
Com
mun
ity C
entre
3860
623
958
401
3543
630
375
.75%
9724
.25%
3C
arlis
le M
emor
ial H
all
3513
917
659
284
1,13
442
1,17
680
270
.72%
332
29.2
8%4
Con
nect
Vic
toria
Par
k In
c56
211
5179
540
01,
513
691,
582
1,02
367
.61%
490
32.3
9%5
Eas
t Vic
toria
Par
k P
rimar
y S
choo
l53
345
411,
025
511
1,97
595
2,07
01,
376
69.6
7%59
930
.33%
6H
anda
Hal
l (w
ithin
Per
ron
Cen
tre)
344
611
567
235
1224
716
269
.53%
7130
.47%
7La
thla
in P
rimar
y S
choo
l43
251
5396
359
71,
907
721,
979
1,23
965
.01%
667
34.9
9%8
Leis
urel
ife C
entre
4436
041
1,04
361
52,
103
912,
194
1,39
566
.33%
708
33.6
7%9
Mill
en P
rimar
y S
choo
l42
283
3887
142
81,
662
461,
708
1,17
070
.52%
489
29.4
8%10
Sw
an V
illag
e O
f Car
e11
3511
268
193
518
2454
231
059
.85%
208
40.1
5%11
Wils
on P
rimar
y S
choo
l14
918
128
802
486
1,64
669
1,71
599
860
.74%
645
39.2
6%56
52,
069
320
7,48
14,
006
14,4
4164
315
,084
9,67
567
.04%
4,75
632
.96%
Abs
ent V
otes
145
672
711,
457
841
3,18
616
33,
349
2,13
366
.99%
1,05
133
.01%
Ear
ly V
otes
(by
Pos
t)67
166
4397
357
31,
822
791,
901
1,17
164
.27%
651
35.7
3%E
arly
Vot
es (I
n P
erso
n)11
234
672
1,48
983
12,
850
952,
945
1,86
765
.58%
980
34.4
2%P
rovi
sion
al V
otes
13
720
536
339
2877
.78%
822
.22%
Spe
cial
Inst
itutio
ns,
Hos
pita
ls &
Rem
otes
2516
715
414
034
242
384
190
56.0
5%14
943
.95%
350
1,20
320
04,
093
2,39
08,
236
382
8,61
85,
389
65.5
0%2,
839
34.5
0%
915
3,27
252
011
,574
6,39
622
,677
1,02
523
,702
15,0
6466
.48%
7,59
533
.52%
4.03
%14
.43%
2.29
%51
.04%
28.2
0%10
0.00
%
STAE
R M
ark
Roh
anVo
tes
QU
INN
Rya
nVo
tes
NO
YE J
enni
fer
Vote
s
WYA
TT B
enVo
tes
JAC
OB
S J
ulia
nVo
tes
Vote
sre
mai
ning
in c
ount
Exha
uste
dVo
tes
Tota
lFo
rmal
Vote
s91
53,
272
520
11,5
746,
396
22,6
7722
,677
109
139
141
129
518
252
0To
tal
1,02
43,
411
11,7
156,
525
22,6
752
22,6
7726
918
656
11,
016
81,
024
Tota
l3,
680
11,9
017,
086
22,6
6710
22,6
773,
163
509
3,67
28
3,68
015
,064
7,59
522
,659
1822
,677
66.4
8%33
.52%
Abso
lute
Maj
ority
= 1
1330
Dis
tric
t Tot
al
Firs
t Pre
fere
nce
Vot
esN
OYE
Exc
lude
d
STAE
R E
xclu
ded
QU
INN
Exc
lude
d
Tota
l Firs
t Pre
fere
nces
Vot
es
%To
tal V
alid
Vot
es
WYA
TT B
enAL
P
JAC
OB
S J
ulia
nLI
B
Vict
oria
Par
k El
ecto
ral D
istr
ict
11 M
arch
201
7So
uth
Met
ropo
litan
Reg
ion
Two
Can
dida
te P
refe
rred
Vot
es
Pref
eren
ce D
istr
ibut
ion
Ben
jam
in S
ana
WYA
TTW
A La
bor
elec
ted
as th
e m
embe
r for
VIC
TOR
IA P
ARK
with
a m
ajor
ity o
f74
69 v
otes
Firs
t Pre
fere
nce
Vote
s Po
lled
for e
ach
Can
dida
te a
t eac
h Po
lling
Pla
ce
Vote
r Tur
nout
= 8
4.11
%In
form
al V
otes
= 4
.32%
Polli
ng P
lace
Tot
als
Dis
trib
utio
n of
Pre
fere
nces
Dec
lara
tion
and
Mob
ile V
otes
Tot
al
LIB
33
.52%
A
LP
66.4
8%
2 C
andi
date
Pre
ferr
ed
Page 110
2017 State General ElectionResults and Statistics Report
109
Suburbs within DistrictAshby
Carabooda
Carramar
Hocking
Males 13,541 Neerabup
Females 14,080 Nowergup
Total 27,621 Pearsall
Pinjar
Sinagra
Electors Habitation Tapping
1 4,374 Wanneroo
2 6,748
3 1,803
>3 994 Returning Officer
Total Habitations 13,919 Brian MCNAMARA
Candidate Name Party
WINTON, Sabine Elisabeth WA Labor
Candidate Name Party
MILES, Paul Liberal Party
Number of Electors on Roll
Number of Electors per Habitation
Elected Candidate for Wanneroo
Previous Member
District of WannerooNorth Metropolitan RegionElector information correct as at 9 February 2017
Area (sq km)
389
This figure is the gazetted area and may include bodies of water
Page 111
2017
Sta
te G
ener
al E
lect
ion
Res
ults
and
Sta
tistic
s R
epor
t 110
2762
1
PP No.
Polli
ng P
lace
WIL
SON
Max
IND
Vote
s
TREA
CY
Rob
ynG
RN
Vote
s
DAR
CY
Jos
eph
Laur
ence
PHO
NVo
tes
PASS
Lin
ley
Anne
ACP
Vote
s
RO
SEN
GR
AVE
Pet
er W
MB
PVo
tes
MAC
PHER
SON
Gre
gJM
WA
Vote
s
MIL
ES P
aul
LIB
Vote
s
WIN
TON
Sab
ine
ALP
Vote
s
Tota
lFo
rmal
Vote
s
Info
rmal
Vote
sTo
tal
Vote
s
1C
arra
mar
Prim
ary
Sch
ool
5615
023
163
1516
698
1,19
62,
425
112
2,53
799
040
.84%
1,43
459
.16%
2C
ross
way
s U
nitin
g C
hurc
h22
5510
424
39
425
413
1,05
525
1,08
055
552
.61%
500
47.3
9%3
Hoc
king
Prim
ary
Sch
ool
5813
418
567
1611
594
982
2,04
787
2,13
487
542
.75%
1,17
257
.25%
4P
ears
all P
rimar
y S
choo
l38
120
149
7313
1851
988
71,
817
771,
894
750
41.3
0%1,
066
58.7
0%5
Spr
ing
Hill
Prim
ary
Sch
ool
2178
6429
94
304
447
956
3499
040
542
.36%
551
57.6
4%6
St A
ntho
ny's
Sch
ool
3411
416
459
99
539
826
1,75
499
1,85
375
643
.13%
997
56.8
7%7
Tapp
ing
Prim
ary
Sch
ool
6214
620
957
198
606
1,00
22,
109
802,
189
863
40.9
4%1,
245
59.0
6%8
Wan
nero
o R
ecre
atio
n C
entre
2697
110
342
933
566
91,
282
471,
329
468
36.5
1%81
463
.49%
9W
anne
roo
Sec
onda
ry C
olle
ge58
141
218
3919
1452
61,
068
2,08
313
02,
213
808
38.8
1%1,
274
61.1
9%37
51,
035
1,43
444
510
598
4,54
67,
490
15,5
2869
116
,219
6,47
041
.68%
9,05
358
.32%
Abs
ent V
otes
7122
922
086
3225
604
983
2,25
013
92,
389
968
43.0
6%1,
280
56.9
4%E
arly
Vot
es (b
y P
ost)
6610
829
841
1421
831
934
2,31
395
2,40
81,
122
48.5
1%1,
191
51.4
9%E
arly
Vot
es (I
n P
erso
n)81
176
331
5722
141,
001
1,48
13,
163
693,
232
1,37
543
.49%
1,78
756
.51%
Pro
visi
onal
Vot
es2
22
00
15
921
021
733
.33%
1466
.67%
Spe
cial
Inst
itutio
ns,
Hos
pita
ls &
Rem
otes
02
30
01
3033
692
7133
47.8
3%36
52.1
7%22
051
785
418
468
622,
471
3,44
07,
816
305
8,12
13,
505
44.8
6%4,
308
55.1
4%
595
1,55
22,
288
629
173
160
7,01
710
,930
23,3
4499
624
,340
9,97
542
.75%
13,3
6157
.25%
2.55
%6.
65%
9.80
%2.
69%
0.74
%0.
69%
30.0
6%46
.82%
100.
00%
WIL
SON
Max
Vote
s
TREA
CY
Rob
ynVo
tes
DAR
CY
Jos
eph
Laur
ence
Vote
s
PASS
Lin
ley
Anne
Vote
s
RO
SEN
GR
AVE
Pet
er W
Vote
s
MAC
PHER
SON
Gre
gVo
tes
MIL
ES P
aul
Vote
s
WIN
TON
Sab
ine
Vote
s
Vote
sre
mai
ning
in c
ount
Exha
uste
dVo
tes
Tota
lFo
rmal
Vote
s59
51,
552
2,28
862
917
316
07,
017
10,9
3023
,344
23,3
4436
1516
823
2636
160
160
Tota
l63
11,
567
2,30
463
719
67,
043
10,9
6623
,344
23,3
4451
3031
2816
3819
42
196
Tota
l68
21,
597
2,33
566
57,
059
11,0
0423
,342
223
,344
7239
124
357
7266
41
665
Tota
l75
41,
636
2,45
97,
416
11,0
7623
,341
323
,344
297
172
152
132
753
175
4To
tal
1,93
32,
631
7,56
811
,208
23,3
404
23,3
4443
738
81,
105
1,93
03
1,93
3To
tal
3,06
87,
956
12,3
1323
,337
723
,344
2,01
91,
048
3,06
71
3,06
89,
975
13,3
6123
,336
823
,344
42.7
5%57
.25%
Abso
lute
Maj
ority
= 1
1669
Dis
tric
t Tot
alD
ARC
Y Ex
clud
ed
Firs
t Pre
fere
nce
Vot
esM
ACPH
ERSO
N E
xclu
ded
RO
SEN
GR
AVE
Excl
uded
PASS
Exc
lude
d
WIL
SON
Exc
lude
d
Tota
l Firs
t Pre
fere
nces
Vot
es
%To
tal V
alid
Vot
es
MIL
ES P
aul
LIB
TREA
CY
Excl
uded
WIN
TON
Sab
ine
ALP
Wan
nero
o El
ecto
ral D
istr
ict
11 M
arch
201
7N
orth
Met
ropo
litan
Reg
ion
Two
Can
dida
te P
refe
rred
Vot
es
Pref
eren
ce D
istr
ibut
ion
Sabi
ne E
lisab
eth
WIN
TON
WA
Lab
orel
ecte
d as
the
mem
ber f
orW
AN
NER
OO
with
a m
ajor
ity o
f33
86 v
otes
Firs
t Pre
fere
nce
Vote
s Po
lled
for e
ach
Can
dida
te a
t eac
h Po
lling
Pla
ce
Vote
r Tur
nout
= 8
8.12
%In
form
al V
otes
= 4
.09%
Polli
ng P
lace
Tot
als
Dis
trib
utio
n of
Pre
fere
nces
Dec
lara
tion
and
Mob
ile V
otes
Tot
al
ALP
57
.25%
LIB
42
.75%
2 C
andi
date
Pre
ferr
ed
Page 112
2017 State General ElectionResults and Statistics Report
111
Suburbs within District
Baldivis
Golden Bay
Karnup
Port Kennedy
Males 13,944 Secret Harbour
Females 14,107 Singleton
Total 28,051 Waikiki
Warnbro
Electors Habitation
1 4,616
2 6,564
3 2,040
>3 975 Returning Officer
Total Habitations 14,195 Martin ROWLES
Candidate Name Party
PAPALIA, Paul WA Labor
Candidate Name Party
PAPALIA, Paul WA Labor
Number of Electors on Roll
Number of Electors per Habitation
Elected Candidate for Warnbro
Previous Member
District of WarnbroSouth Metropolitan Region
Elector information correct as at 9 February 2017
Area (sq km)
92
This figure is the gazetted area and may include bodies of water
Page 113
2017
Sta
te G
ener
al E
lect
ion
Res
ults
and
Sta
tistic
s R
epor
t 112
2805
1
PP No.
Polli
ng P
lace
SCH
OLZ
Ale
xand
er J
PHO
NVo
tes
MU
SCED
ERE
Luk
eLI
BVo
tes
KIN
GSF
OR
D D
eonn
eA
CP
Vote
s
HU
NTE
R T
hom
asJM
WA
Vote
s
PAPA
LIA
Pau
lA
LPVo
tes
CA
IN J
illia
nG
RN
Vote
s
FIG
GIN
S S
aman
tha
MB
PVo
tes
Tota
lFo
rmal
Vote
s
Info
rmal
Vote
sTo
tal
Vote
s
1C
oast
al C
omm
unity
Cen
tre10
919
031
1266
261
71,
072
451,
117
296
27.6
1%77
672
.39%
2C
omet
Bay
Col
lege
159
285
3824
1,00
410
712
1,62
971
1,70
043
726
.84%
1,19
173
.16%
3K
oora
na P
rimar
y S
choo
l18
413
934
171,
044
117
141,
549
102
1,65
128
618
.46%
1,26
381
.54%
4P
ort K
enne
dy P
rimar
y S
choo
l25
630
850
331,
408
150
202,
225
922,
317
551
24.7
9%1,
672
75.2
1%5
Roc
king
ham
Lak
es P
rimar
y S
choo
l15
820
041
2081
379
171,
328
661,
394
340
25.6
0%98
874
.40%
6S
ecre
t Har
bour
Com
mun
ity H
all
166
362
4123
1,28
212
610
2,01
087
2,09
752
626
.17%
1,48
473
.83%
7S
ingl
eton
Prim
ary
Sch
ool
153
294
3814
978
130
101,
617
531,
670
427
26.4
2%1,
189
73.5
8%8
War
nbro
Com
mun
ity H
igh
Sch
ool
206
290
5715
1,20
414
020
1,93
269
2,00
149
425
.57%
1,43
874
.43%
9W
arnb
ro P
rimar
y S
choo
l59
8115
841
179
565
845
703
142
21.5
8%51
678
.42%
1,45
02,
149
345
166
8,80
698
911
514
,020
630
14,6
503,
499
24.9
6%10
,517
75.0
4%A
bsen
t Vot
es37
037
579
421,
438
278
512,
633
163
2,79
670
126
.65%
1,92
973
.35%
Ear
ly V
otes
(by
Pos
t)27
331
138
3196
789
131,
722
701,
792
546
31.7
1%1,
176
68.2
9%E
arly
Vot
es (I
n P
erso
n)61
876
071
442,
546
224
394,
302
153
4,45
51,
195
27.8
0%3,
103
72.2
0%P
rovi
sion
al V
otes
30
00
171
021
122
00.
00%
2110
0.00
%S
peci
al In
stitu
tions
, H
ospi
tals
& R
emot
es7
367
347
10
101
510
647
46.5
3%54
53.4
7%1,
271
1,48
219
512
05,
015
593
103
8,77
939
29,
171
2,48
928
.37%
6,28
371
.63%
2,72
13,
631
540
286
13,8
211,
582
218
22,7
991,
022
23,8
215,
988
26.2
8%16
,800
73.7
2%
11.9
3%15
.93%
2.37
%1.
25%
60.6
2%6.
94%
0.96
%10
0.00
%
SCH
OLZ
Ale
xand
er J
Vote
s
MU
SCED
ERE
Luk
eVo
tes
KIN
GSF
OR
D D
eonn
eVo
tes
HU
NTE
R T
hom
asVo
tes
PAPA
LIA
Pau
lVo
tes
CA
IN J
illia
nVo
tes
FIG
GIN
S S
aman
tha
Vote
s
Vote
sre
mai
ning
in c
ount
Exha
uste
dVo
tes
Tota
lFo
rmal
Vote
s2,
721
3,63
154
028
613
,821
1,58
221
822
,799
22,7
9925
1919
4236
7621
71
218
Tota
l2,
746
3,65
055
932
813
,857
1,65
822
,798
122
,799
6237
6296
7032
71
328
Tota
l2,
808
3,68
762
113
,953
1,72
822
,797
222
,799
135
297
111
7661
92
621
Tota
l2,
943
3,98
414
,064
1,80
422
,795
422
,799
226
228
1,34
71,
801
31,
804
Tota
l3,
169
4,21
215
,411
22,7
927
22,7
991,
776
1,38
93,
165
43,
169
5,98
816
,800
22,7
8811
22,7
99
26.2
8%73
.72%
Abs
olut
e M
ajor
ity =
113
95
Dis
tric
t Tot
al
Firs
t Pre
fere
nce
Vot
esFI
GG
INS
Excl
uded
HU
NTE
R E
xclu
ded
KIN
GSF
OR
D E
xclu
ded
CA
IN E
xclu
ded
Tota
l Firs
t Pre
fere
nces
Vot
es
%To
tal V
alid
Vot
es
MU
SCED
ERE
Luk
eLI
B
SCH
OLZ
Exc
lude
d
PAPA
LIA
Pau
lA
LP
War
nbro
Ele
ctor
al D
istr
ict
11 M
arch
201
7So
uth
Met
ropo
litan
Reg
ion
Two
Can
dida
te P
refe
rred
Vot
es
Pref
eren
ce D
istr
ibut
ion
Paul
PA
PALI
AW
A L
abor
elec
ted
as th
e m
embe
r for
WA
RN
BR
Ow
ith a
maj
ority
of
1081
2 vo
tes
Firs
t Pre
fere
nce
Vote
s Po
lled
for e
ach
Can
dida
te a
t eac
h Po
lling
Pla
ce
Vote
r Tur
nout
= 8
4.92
%In
form
al V
otes
= 4
.29%
Polli
ng P
lace
Tot
als
Dis
trib
utio
n of
Pre
fere
nces
Dec
lara
tion
and
Mob
ile V
otes
Tot
al
ALP
73
.72%
LIB
26
.28%
2 C
andi
date
Pre
ferr
ed
Page 114
2017 State General ElectionResults and Statistics Report
113
Local Governments within District
Males 13,660
Females 14,007
Total 27,667
Shire of Augusta-Margaret River
Shire of Boyup Brook
Shire of Bridgetown-Greenbushes
Shire of Denmark
Shire of Manjimup
Shire of Nannup
Shire of Plantagenet
Electors Habitation
1 6,095
2 6,750
3 1,659
>3 685 Returning Officer
Total Habitations 15,189 Stephanie DE VANEY
Candidate Name Party
REDMAN, Donald Terrence THE NATIONALS
Candidate Name Party
REDMAN, Donald Terrence THE NATIONALS
Number of Electors on Roll
Number of Electors per Habitation
Elected Candidate for Warren-Blackwood
Previous Member
District of Warren-BlackwoodSouth West Region
Elector information correct as at 9 February 2017
Area (sq km)
22,708
This figure is the gazetted area and may include bodies of water
Page 115
2017
Sta
te G
ener
al E
lect
ion
Res
ults
and
Sta
tistic
s R
epor
t 114
2766
7
PP No.
Polli
ng P
lace
DEA
S M
arc
SFP
Vote
s
RED
MA
N T
erry
NA
TVo
tes
MO
RO
NEY
Gre
gPH
ON
Vote
s
HU
NTL
EY A
ndre
wG
RN
Vote
s
LITS
ON
Hug
hA
LPVo
tes
WO
OD
HO
USE
Ros
sLI
BVo
tes
Tota
lFo
rmal
Vote
s
Info
rmal
Vote
sTo
tal
Vote
s
1Au
gust
a C
omm
unity
Res
ourc
e C
entre
2441
553
6913
914
784
751
898
628
74.2
3%21
825
.77%
2Bo
yup
Broo
k Am
bula
nce
Cen
tre82
225
4714
116
8957
324
597
409
71.5
0%16
328
.50%
3Br
idge
tow
n Le
sser
Hal
l75
539
114
173
351
195
1,44
768
1,51
589
661
.92%
551
38.0
8%4
Den
mar
k R
ecre
atio
n C
entre
5771
283
434
396
182
1,86
469
1,93
31,
054
56.5
8%80
943
.42%
5Ea
st M
anjim
up P
rimar
y Sc
hool
5535
471
2610
411
072
046
766
572
79.4
4%14
820
.56%
6Fr
ost P
ark
Pavi
lion
9356
710
784
285
138
1,27
448
1,32
286
267
.66%
412
32.3
4%7
Gre
enbu
shes
Prim
ary
Scho
ol33
123
2032
117
5137
620
396
220
58.5
1%15
641
.49%
8Ka
rrid
ale
Prim
ary
Scho
ol26
101
1636
4110
832
812
340
240
73.1
7%88
26.8
3%9
Kend
enup
Prim
ary
Scho
ol51
195
3728
111
4646
818
486
306
65.3
8%16
234
.62%
10M
anjim
up T
own
Hal
l10
571
414
182
329
269
1,64
011
11,
751
1,18
272
.12%
457
27.8
8%11
Mar
gare
t Riv
er S
enio
r Hig
h Sc
hool
102
511
114
796
643
561
2,72
716
02,
887
1,27
946
.90%
1,44
853
.10%
12M
ayan
up H
all
1573
54
726
130
313
311
588
.46%
1511
.54%
13N
annu
p R
SL H
all
3021
337
119
147
110
656
3068
638
758
.99%
269
41.0
1%14
Nar
rikup
Dis
trict
Hal
l12
8927
1524
3420
13
204
159
79.1
0%42
20.9
0%15
Nor
thcl
iffe
Dis
trict
Hig
h Sc
hool
3213
519
5069
3834
324
367
229
66.7
6%11
433
.24%
16Pa
rryv
ille H
all
1388
1567
3527
245
424
913
856
.33%
107
43.6
7%17
Pem
berto
n Sp
orts
Clu
b44
289
3141
106
133
644
1966
347
673
.91%
168
26.0
9%18
Poro
ngur
up D
istri
ct H
all
675
629
1728
161
716
811
873
.29%
4326
.71%
19Q
uinn
inup
Com
mun
ity C
entre
047
710
214
894
9357
64.0
4%32
35.9
6%20
Scot
sdal
e H
all
1616
218
9171
6141
914
433
261
62.2
9%15
837
.71%
21Ti
ngle
dale
Hal
l8
7016
2519
1915
72
159
113
71.9
7%44
28.0
3%22
Wal
pole
Com
mun
ity C
entre
2717
213
5270
3536
919
388
249
67.4
8%12
032
.52%
23W
itchc
liffe
Dru
ids
Hal
l26
200
3219
817
416
879
836
834
430
53.8
8%36
846
.12%
24Yo
rnup
Hal
l17
9515
1544
5424
011
251
170
70.8
3%70
29.1
7%94
96,
164
1,04
42,
490
3,43
62,
633
16,7
1680
317
,519
10,5
5063
.13%
6,16
236
.87%
Abse
nt V
otes
163
767
160
448
540
348
2,42
676
2,50
21,
395
57.5
3%1,
030
42.4
7%Ea
rly V
otes
(by
Post
)98
660
202
186
354
321
1,82
195
1,91
61,
249
68.6
3%57
131
.37%
Early
Vot
es (I
n Pe
rson
)13
41,
022
231
263
504
391
2,54
510
62,
651
1,71
067
.24%
833
32.7
6%Pr
ovis
iona
l Vot
es0
31
11
17
07
457
.14%
342
.86%
Spec
ial I
nstit
utio
ns,
Hos
pita
ls &
Rem
otes
023
33
199
570
5734
59.6
5%23
40.3
5%39
52,
475
597
901
1,41
81,
070
6,85
627
77,
133
4,39
264
.10%
2,46
035
.90%
1,34
48,
639
1,64
13,
391
4,85
43,
703
23,5
721,
080
24,6
5214
,942
63.4
1%8,
622
36.5
9%
5.70
%36
.65%
6.96
%14
.39%
20.5
9%15
.71%
100.
00%
DEA
S M
arc
Vote
s
RED
MA
N T
erry
Vote
s
MO
RO
NEY
Gre
gVo
tes
HU
NTL
EY A
ndre
wVo
tes
LITS
ON
Hug
hVo
tes
WO
OD
HO
USE
Ros
sVo
tes
Vote
sre
mai
ning
in c
ount
Exha
uste
dVo
tes
Tota
lFo
rmal
Vote
s1,
344
8,63
91,
641
3,39
14,
854
3,70
323
,572
23,5
7243
642
512
720
814
61,
342
21,
344
Tota
l9,
075
2,06
63,
518
5,06
23,
849
23,5
702
23,5
7296
329
231
249
52,
062
42,
066
Tota
l10
,038
3,81
05,
374
4,34
423
,566
623
,572
998
2,59
721
33,
808
23,
810
Tota
l11
,036
7,97
14,
557
23,5
648
23,5
723,
906
651
4,55
74,
557
14,9
428,
622
23,5
648
23,5
72
63.4
1%36
.59%
Abs
olut
e M
ajor
ity =
117
83
Dis
tric
t Tot
al
Firs
t Pre
fere
nce
Vote
sD
EAS
Excl
uded
MO
RO
NEY
Exc
lude
d
HU
NTL
EY E
xclu
ded
WO
OD
HO
USE
Exc
lude
d
Tota
l Firs
t Pre
fere
nces
Vot
es
%To
tal V
alid
Vot
es
RED
MA
N T
erry
NA
T
LITS
ON
Hug
hA
LP
War
ren-
Bla
ckw
ood
Elec
tora
l Dis
tric
t
11 M
arch
201
7So
uth
Wes
t Reg
ion
Two
Can
dida
te P
refe
rred
Vot
es
Pref
eren
ce D
istr
ibut
ion
Don
ald
Terr
ence
RED
MAN
THE
NAT
ION
ALS
elec
ted
as th
e m
embe
r for
WAR
REN
-BLA
CK
WO
OD
with
a m
ajor
ity o
f63
20 v
otes
Firs
t Pre
fere
nce
Vote
s Po
lled
for e
ach
Can
dida
te a
t eac
h Po
lling
Pla
ce
Vote
r Tur
nout
= 8
9.10
%In
form
al V
otes
= 4
.38%
Polli
ng P
lace
Tot
als
Dis
trib
utio
n of
Pre
fere
nces
Dec
lara
tion
and
Mob
ile V
otes
Tot
al
ALP
36
.59%
N
AT
63.4
1%
2 C
andi
date
Pre
ferr
ed
Page 116
2017 State General ElectionResults and Statistics Report
115
Suburbs within DistrictBallajura
Banksia Grove
Baskerville
Belhus
Males 14,128 Bennett Springs
Females 14,195 Brabham
Total 28,323 Cullacabardee
Dayton
Gnangara
Electors Habitation Henley Brook
1 4,293 Herne Hill
2 6,048 Jandabup
3 2,078 Lexia
>3 1,299 Madeley
Total Habitations 13,718 Malaga
Mariginiup
Middle Swan
Millendon
Upper Swan
Wangara
Wanneroo
West Swan
Whiteman
Returning Officer
Wayne HOWELLS
Candidate Name Party
SAFFIOTI, Rita WA Labor
Candidate Name Party
SAFFIOTI, Rita WA Labor
Number of Electors on Roll
Number of Electors per Habitation
Elected Candidate for West Swan
Previous Member
District of West SwanEast Metropolitan RegionElector information correct as at 9 February 2017
Area (sq km)
246
This figure is the gazetted area and may include bodies of water
Page 117
2017
Sta
te G
ener
al E
lect
ion
Res
ults
and
Sta
tistic
s R
epor
t 116
2832
3
PP No.
Polli
ng P
lace
LAW
REN
CE
Jam
esJM
WA
Vote
s
McM
ULL
AN B
eth
GR
NVo
tes
MO
RAN
Isaa
cAC
PVo
tes
HEN
DER
SON
Rod
LIB
Vote
s
SAFF
IOTI
Rita
ALP
Vote
s
RU
WO
LDT
Tre
vor
SFP
Vote
s
Tota
lFo
rmal
Vote
s
Info
rmal
Vote
sTo
tal
Vote
s
1B
alla
jura
Com
mun
ity C
olle
ge40
123
6759
11,
392
652,
278
163
2,44
172
131
.68%
1,55
568
.32%
2B
alla
jura
Prim
ary
Sch
ool
4314
054
545
1,36
259
2,20
311
92,
322
655
29.7
5%1,
547
70.2
5%3
Ban
ksia
Gro
ve P
rimar
y S
choo
l31
128
5137
672
774
1,38
710
61,
493
496
35.7
9%89
064
.21%
4C
aver
sham
Prim
ary
Sch
ool
765
3024
271
033
1,08
752
1,13
929
326
.95%
794
73.0
5%5
Cra
covi
a C
lub
2110
162
344
1,10
937
1,67
414
01,
814
435
25.9
9%1,
239
74.0
1%6
Her
ne H
ill P
rimar
y S
choo
l20
6828
393
527
801,
116
551,
171
483
43.2
8%63
356
.72%
7Jo
seph
Ban
ks S
econ
dary
Col
lege
1710
837
236
542
3797
744
1,02
131
632
.34%
661
67.6
6%8
Sou
th B
alla
jura
Prim
ary
Sch
ool
5211
057
318
1,40
261
2,00
016
72,
167
426
21.3
2%1,
572
78.6
8%9
Wes
t Sw
an H
all
2636
2531
641
242
857
3389
037
543
.76%
482
56.2
4%25
787
941
13,
361
8,18
348
813
,579
879
14,4
584,
200
30.9
4%9,
373
69.0
6%A
bsen
t Vot
es15
650
016
11,
412
2,51
926
85,
016
377
5,39
31,
843
36.7
7%3,
169
63.2
3%E
arly
Vot
es (b
y P
ost)
6594
4650
691
396
1,72
092
1,81
262
136
.13%
1,09
863
.87%
Ear
ly V
otes
(In
Per
son)
9024
476
860
1,83
313
33,
236
122
3,35
81,
077
33.2
9%2,
158
66.7
1%P
rovi
sion
al V
otes
14
22
80
173
203
17.6
5%14
82.3
5%
312
842
285
2,78
05,
273
497
9,98
959
410
,583
3,54
435
.50%
6,43
964
.50%
569
1,72
169
66,
141
13,4
5698
523
,568
1,47
325
,041
7,74
432
.87%
15,8
1267
.13%
2.41
%7.
30%
2.95
%26
.06%
57.0
9%4.
18%
100.
00%
LAW
REN
CE
Jam
esVo
tes
McM
ULL
AN B
eth
Vote
s
MO
RAN
Isaa
cVo
tes
HEN
DER
SON
Rod
Vote
s
SAFF
IOTI
Rita
Vote
s
RU
WO
LDT
Tre
vor
Vote
s
Vote
sre
mai
ning
in c
ount
Exha
uste
dVo
tes
Tota
lFo
rmal
Vote
s56
91,
721
696
6,14
113
,456
985
23,5
6823
,568
213
7572
7712
856
54
569
Tota
l1,
934
771
6,21
313
,533
1,11
323
,564
423
,568
118
377
159
117
771
771
Tota
l2,
052
6,59
013
,692
1,23
023
,564
423
,568
287
426
514
1,22
73
1,23
0To
tal
2,33
97,
016
14,2
0623
,561
723
,568
728
1,60
62,
334
52,
339
7,74
415
,812
23,5
5612
23,5
68
32.8
7%67
.13%
Abso
lute
Maj
ority
= 1
1779
Dis
tric
t Tot
al
Firs
t Pre
fere
nce
Vot
esLA
WR
ENC
E Ex
clud
ed
MO
RAN
Exc
lude
d
RU
WO
LDT
Excl
uded
McM
ULL
AN E
xclu
ded
Tota
l Firs
t Pre
fere
nces
Vot
es
%To
tal V
alid
Vot
es
HEN
DER
SON
Rod
LIB
SAFF
IOTI
Rita
ALP
Wes
t Sw
an E
lect
oral
Dis
tric
t
11 M
arch
201
7Ea
st M
etro
polit
an R
egio
n
Two
Can
dida
te P
refe
rred
Vot
es
Pref
eren
ce D
istr
ibut
ion
Rita
SAF
FIO
TIW
A La
bor
elec
ted
as th
e m
embe
r for
WES
T SW
ANw
ith a
maj
ority
of
8068
vot
es
Firs
t Pre
fere
nce
Vote
s Po
lled
for e
ach
Can
dida
te a
t eac
h Po
lling
Pla
ce
Vote
r Tur
nout
= 8
8.41
%In
form
al V
otes
= 5
.88%
Polli
ng P
lace
Tot
als
Dis
trib
utio
n of
Pre
fere
nces
Dec
lara
tion
and
Mob
ile V
otes
Tot
al
ALP
67
.13%
LIB
32
.87%
2 C
andi
date
Pre
ferr
ed
Page 118
2017 State General ElectionResults and Statistics Report
117
Suburbs within District
Bibra Lake
Coolbellup
Kardinya
Murdoch
Males 12,059 North Lake
Females 13,088 O'connor
Total 25,147 Samson
South Lake
Willagee
Electors Habitation
1 4,969
2 5,553
3 1,693
>3 908 Returning Officer
Total Habitations 13,123 Vern MCKAY
Candidate Name Party
TINLEY, Peter Charles WA Labor
Candidate Name Party
TINLEY, Peter Charles WA Labor
Number of Electors on Roll
Number of Electors per Habitation
Elected Candidate for Armadale
Previous Member
District of WillageeSouth Metropolitan Region
Elector information correct as at 9 February 2017
Area (sq km)
34
This figure is the gazetted area and may include bodies of water
Page 119
2017
Sta
te G
ener
al E
lect
ion
Res
ults
and
Sta
tistic
s R
epor
t 118
2514
7
PP No.
Polli
ng P
lace
McG
EOR
GE
Fel
icity
GR
NVo
tes
TIN
LEY
Pet
erAL
PVo
tes
POTT
ER P
aul J
ohn
MB
PVo
tes
ABR
AHAM
Cor
ina
SA Vote
s
HO
SKIN
G R
obin
ACP
Vote
s
AUB
REY
Reb
ecca
LIB
Vote
s
Tota
lFo
rmal
Vote
s
Info
rmal
Vote
sTo
tal
Vote
s
1B
ibra
Lak
e P
rimar
y S
choo
l20
596
822
2040
398
1,65
359
1,71
21,
199
72.5
8%45
327
.42%
2C
aral
ee C
omm
unity
Sch
ool
176
764
1919
2251
21,
512
531,
565
945
62.5
0%56
737
.50%
3C
oolb
ellu
p C
omm
unity
Sch
ool
253
1,18
719
2639
310
1,83
497
1,93
11,
469
80.1
0%36
519
.90%
4K
ardi
nya
Prim
ary
Sch
ool
252
985
3013
7493
02,
284
972,
381
1,23
954
.27%
1,04
445
.73%
5La
kela
nd S
enio
r Hig
h S
choo
l75
377
83
2513
862
641
667
450
71.8
8%17
628
.12%
6N
orth
Lak
e S
enio
r Cam
pus
141
566
1810
2729
21,
054
591,
113
724
68.6
9%33
031
.31%
7S
amso
n P
rimar
y S
choo
l17
486
525
1729
505
1,61
574
1,68
91,
066
66.0
5%54
833
.95%
8S
outh
Lak
e P
rimar
y S
choo
l11
668
316
2429
260
1,12
873
1,20
183
774
.20%
291
25.8
0%9
Sou
ther
n D
istri
cts
Sen
ior C
entre
129
628
207
2146
91,
274
591,
333
762
59.8
1%51
240
.19%
10S
outh
ern
Dis
trict
s S
enio
r Cen
tre (D
rive-
in)
237
00
213
540
5438
70.3
7%16
29.6
3%1,
523
7,06
017
713
930
83,
827
13,0
3461
213
,646
8,72
966
.99%
4,30
233
.01%
Abs
ent V
otes
470
1,42
465
2779
901
2,96
616
53,
131
1,92
364
.90%
1,04
035
.10%
Ear
ly V
otes
(by
Pos
t)12
798
733
1063
659
1,87
954
1,93
31,
149
61.1
5%73
038
.85%
Ear
ly V
otes
(In
Per
son)
335
1,62
255
3160
866
2,96
911
33,
082
1,99
267
.09%
977
32.9
1%P
rovi
sion
al V
otes
18
01
10
110
1110
90.9
1%1
9.09
%S
peci
al In
stitu
tions
, H
ospi
tals
& R
emot
es14
128
44
329
444
713
460
145
32.5
1%30
167
.49%
947
4,16
915
773
206
2,72
08,
272
345
8,61
75,
219
63.1
2%3,
049
36.8
8%
2,47
011
,229
334
212
514
6,54
721
,306
957
22,2
6313
,948
65.4
9%7,
351
34.5
1%
11.5
9%52
.70%
1.57
%1.
00%
2.41
%30
.73%
100.
00%
McG
EOR
GE
Fel
icity
Vote
s
TIN
LEY
Pet
erVo
tes
POTT
ER P
aul J
ohn
Vote
s
ABR
AHAM
Cor
ina
Vote
s
HO
SKIN
G R
obin
Vote
s
AUB
REY
Reb
ecca
Vote
s
Vote
sre
mai
ning
in c
ount
Exha
uste
dVo
tes
Tota
lFo
rmal
Vote
s2,
470
11,2
2933
421
251
46,
547
21,3
0621
,306
108
4432
226
212
212
Tota
l2,
578
11,2
7336
653
66,
553
21,3
0621
,306
9110
194
8036
636
6To
tal
2,66
911
,374
630
6,63
321
,306
21,3
0611
914
436
662
91
630
Tota
l2,
788
11,5
186,
999
21,3
051
21,3
062,
430
352
2,78
26
2,78
813
,948
7,35
121
,299
721
,306
65.4
9%34
.51%
Abso
lute
Maj
ority
= 1
0650
Dis
tric
t Tot
al
Firs
t Pre
fere
nce
Vot
esAB
RAH
AM E
xclu
ded
POTT
ER E
xclu
ded
HO
SKIN
G E
xclu
ded
McG
EOR
GE
Excl
uded
Tota
l Firs
t Pre
fere
nces
Vot
es
%To
tal V
alid
Vot
es
TIN
LEY
Pet
erAL
P
AUB
REY
Reb
ecca
LIB
Will
agee
Ele
ctor
al D
istr
ict
11 M
arch
201
7So
uth
Met
ropo
litan
Reg
ion
Two
Can
dida
te P
refe
rred
Vot
es
Pref
eren
ce D
istr
ibut
ion
Pete
r Cha
rles
TIN
LEY
WA
Labo
rel
ecte
d as
the
mem
ber f
orW
ILLA
GEE
with
a m
ajor
ity o
f65
97 v
otes
Firs
t Pre
fere
nce
Vote
s Po
lled
for e
ach
Can
dida
te a
t eac
h Po
lling
Pla
ce
Vote
r Tur
nout
= 8
8.53
%In
form
al V
otes
= 4
.3%
Polli
ng P
lace
Tot
als
Dis
trib
utio
n of
Pre
fere
nces
Dec
lara
tion
and
Mob
ile V
otes
Tot
al
LIB
34
.51%
A
LP
65.4
9%
2 C
andi
date
Pre
ferr
ed