33
DISCUSSION PAPER SERIES IZA DP No. 12527 Michael White Alex Bryson The Impact of High-Performance Work Systems on Employees: A Sectoral Comparison AUGUST 2019

DISCUSSION PAPER SERIES
IZA DP No. 12527
Michael WhiteAlex Bryson
The Impact of High-Performance Work Systems on Employees: A Sectoral Comparison
AUGUST 2019

Any opinions expressed in this paper are those of the author(s) and not those of IZA. Research published in this series may include views on policy, but IZA takes no institutional policy positions. The IZA research network is committed to the IZA Guiding Principles of Research Integrity.The IZA Institute of Labor Economics is an independent economic research institute that conducts research in labor economics and offers evidence-based policy advice on labor market issues. Supported by the Deutsche Post Foundation, IZA runs the world’s largest network of economists, whose research aims to provide answers to the global labor market challenges of our time. Our key objective is to build bridges between academic research, policymakers and society.IZA Discussion Papers often represent preliminary work and are circulated to encourage discussion. Citation of such a paper should account for its provisional character. A revised version may be available directly from the author.
Schaumburg-Lippe-Straße 5–953113 Bonn, Germany
Phone: +49-228-3894-0Email: [email protected] www.iza.org
IZA – Institute of Labor Economics
DISCUSSION PAPER SERIES
ISSN: 2365-9793
IZA DP No. 12527
The Impact of High-Performance Work Systems on Employees: A Sectoral Comparison
AUGUST 2019
Michael WhiteUniversity of Westminster
Alex BrysonUCL and IZA
ABSTRACT
IZA DP No. 12527 AUGUST 2019
The Impact of High-Performance Work Systems on Employees: A Sectoral Comparison1
Using nationally representative linked employer-employee surveys of workplaces with 50
or more employees we find the adoption of High-Performance Work Systems (HPWS) in
the private sector is largely positively correlated with employee job attitudes pre-recession.
However, high intensity HPWS has partly adverse consequences for private sector employees
in the post-recession period. In contrast, there are no indications of public sector employees
responding positively or negatively to HPWS and HPWS is not associated with adverse
effects post-recession. The sectoral difference in results is interpreted in terms of different
employment relationships and different sources of employee motivation.
JEL Classification: I31, J45, M5
Keywords: high performance work systems, public sector, organizational commitment, intrinsic job satisfaction, well-being
Corresponding author:Alex BrysonUniversity College London20 Bedford WayLondon WC1H 0ALUnited Kingdom
E-mail: [email protected]
1 We would like to thank participants at the 2019 Royal Economics Society and a seminar at the University of Cardiff
for comments on an earlier version of this paper.

2
1. Introduction Despite a large literature establishing links between employers’ use of high-performance work
systems (HPWS) and employees’ job attitudes, none to our knowledge have compared these
effects across the public and private sectors. This study using linked employer-employee data for
Britain is the first to do so. The motivation comes from some recent reviews of HPWS research
(or more generally of human resource management (HRM) research) that have emphasized the
value of developing a contextual awareness (see, for instance, Boxall, 2013; Gould-Williams and
Gatenby, 2010). ‘Universalist’ claims concerning impacts of HRM/HPWS, and perhaps
especially the claims that such impacts are generally positive, may have been premature since
little effort has been devoted to the investigation of varying contexts that are likely to moderate
such impacts. By incorporating a contextual perspective into research, one hopes to progress
toward a more differentiated and nuanced account of HRM/HPWS.
Our examination of context focuses on the nature of the employment relationship and of
employee motivation in the public and private sectors, and on changing conditions that have
faced managements in the two sectors as they attempt to develop HRM/HPWS to serve their
organizational goals. We stress the importance of background (pre-HRM) conditions, that would
either raise or lower the base level of employee motivation. One conjecture is that the scope for
HRM/HPWS to influence employees’ motivations in a positive way is greater when the initial
level is relatively low.
As HRM/HPWS develop, they themselves become part of the context that affects both
employees and employers. This is reflected in the notion of a threshold effect, whereby
HRM/HPWS have large effects only once a certain implementation threshold has been reached
(e.g. Becker and Huselid, 2006) , and also in the ‘strong system’ theory of Bowen and Ostroff
(2004), who argue that HRM needs to be developed in a multitude of ways in order to ‘signal’
effectively to employees.
Some other authors have conversely argued that there may be an HRM/HPWS intensity
threshold beyond which effects on employees taper off or even turn negative, especially through
3
overwork demands and work-strain (Godard, 2001; Kroon et al., 2009; Ramsay et al., 2000;
Spector, 2016). A contextualized perspective additionally suggests that HRM/HPWS effects on
employees may be time-contingent, for instance interacting with short-run economic
developments (e.g., business cycles or public sector funding policies) (Zatzick and Iverson,
2006).
The research with which we pursue these ideas has the following parameters. We use national
surveys of British workplaces at two times, 2004 and 2011. Analysis is at the workplace level
and thus primarily reflects the management perspective on HRM/HPWS effects. The
comparisons are between the private and public sectors. We exclude from analysis any
workplace that has less than 50 employees; we believe that small workplaces require a different
theoretical approach (Storey et al., 2010). The outcomes we focus on are organizational
commitment, intrinsic job satisfaction, well-being, and perceived communications with
management. We analyse the effects on these attitudes of a measure of HPWS, comprising five
main practice-domains . We reduce omitted variable bias (Gerhart, 2013) partly by using a large
number of items in the construction of the HPWS variable, and partly by exploiting linked
employer-employee data so as to average out (much of the) individual heterogeneity in employee
attitudes. The linked data also help to minimize common method artefact (Gerhart, 2013;
Podsakoff et al., 2005) since we can use management informants to define the HPWS measures
and employee responses to define the attitudinal responses.
The remaining sections of this article are as follows. Section 2 conceptualizes how HPWS
affect employee outcomes, while section 3 addresses contextual variations. Section 4 specifies
hypotheses, section 5 the data and research methods. Section 6 presents results, and section 7
offers conclusions and some further implications of the research.
There are two main new comparative findings of the research. The first is that while private
sector employees’ outcomes are sensitive to HPWS, public sector employees are indifferent to
them. The second is that the effects of HPWS in the private sector are mainly positive in the
4
booming British economy of 2004, but in the post-recessionary conditions of 2011 employees
find there can be ‘too much’ HPWS.
2 HRM/HPWS and effects on employees HRM loosely covers the range of people management and industrial relations functions exercised
either by personnel/HR departments or by line managements. We define HPWS as systems of
practice that constitute a subset of HRM, and form a suite intended to maximize organizational
effectiveness. When HPWS are aligned to an organization’s strategic position, it is common to
refer to them as SHRM (strategic HRM). Our focus is on HPWS, but since the research
literature often slides between HRM and HPWS we will often use the term HRM/HPWS when
referring to previous discussions and findings.
There has been great variation in what researchers have designated as the contents of HPWS, in
terms for instance of lists of operational practices. According to Appelbaum et al. (2000),
whose exemplar we follow, key features are employee participation in problem-solving and
change implementation processes, and team-working forms of work organization; these need to
be ‘supported’ by recruitment/selection, training/development, and pay/reward. We call these
‘HPWS domains’, with each domain represented by a set or cluster of practice items.
Participation and team-working domains provide the main value to employers, in performance
terms: participation provides structures and processes whereby employees can contribute
knowledge and information to problem solving and decision making, while team-working offers
structures for group learning, collaboration and monitoring. The support domains are also
important in supplying employees who are equipped and orientated for participative and
collaborative work. For instance, appraisals not only provide reward to employees but also serve
to align their personal work objectives with corporate goals or plans.
Most discussions of HRM/HPWS emphasize the importance of combining the constituent
practices and practice domains in ways that are mutually supportive and complementary. This is
often termed ‘bundling’. Bowen and Ostroff (2004) argue that to obtain a powerful effect from
HRM it is necessary to implement a wide range of practices that in combination constitute a

5
‘strong system’, i.e. one that is capable of sending influential ‘signals’ to employees about the
employer’s aspirations and the organizational culture.
From an economic viewpoint, it is useful to think of HRM/HPWS practices being adopted by
employers as an aspect of ‘management technology’ (Bloom et al., 2017). Such practices sit
alongside other aspects of management technology such as monitoring and control systems,
planning and target-setting. From the viewpoint of the present article, the chief point is simply
that HPWS are developed by managements to serve organizational performance goals alongside
other methods. However, employees must have sufficient goodwill toward their organization
so that they engage cooperatively with HPWS activities. Thus motivation enters the frame, even
if it is not the primary concern of employers.
Psychological theories of work motivation suggest how HPWS can have positive impacts.
Following Fishbein (1967), we assume first that attitudes are essentially motivational. Fishbein
regards attitude as a ‘mediating evaluative response’ that tends toward overt behavior. If this
conceptual model is valid, one should observe links between attitudes and work behaviour. This
link is confirmed by Harrison et al. (2006) with their meta-analysis showing that ‘overall job
attitude’ explains about 25 per cent of the variation (i.e., r=0.50) in workers’ ‘engagement’
behaviours (task performance, organizational citizenship, attendance, timeliness and reduced
propensity to quit). The components of overall job attitude are job satisfaction and
organizational commitment. A definition of job satisfaction that fits the general framework
sketched above comes from Latham and Locke (1990: 243): ‘The degree of satisfaction or
dissatisfaction will be a joint function of the degree of fulfilment of the value and the importance
of the value to the individual’. In simpler words, the more one gets something desired from
work, the more satisfied one is. Organizational commitment then enters the frame, according to
these authors, as a consequence of and complement to job satisfaction: ‘Only if satisfaction leads
to commitment to the organization and its goals ... will subsequent high performance result’
(Latham and Locke, 1990: 245).

6
It remains to specify what is the desired value that HPWS can supply to employees. We suggest
that this is increased autonomy or ‘self-determination’ (Gagné and Deci, 2005) . Notably,
employees working within an HPWS framework in principle have increased opportunities to
exercise influence on corporate decisions, to collaborate in operational problem-solving, and to
perform varied work roles and tasks within teams. If these self-enhancing possibilities are
realized in practice, there will be an increase of intrinsic job satisfaction and this will initiate the
virtuous circle outlined by Latham and Locke (1990).
However, there has been a growing debate as to whether this positive interpretation of HPWS is
realized in practice. Ramsay et al. (2000) deployed labour process theory to argue that HPWS
was designed to extract higher levels of work effort from employees and was therefore likely to
result in greater work strain. Godard (2001) reported negative effects of ‘alternative work
practices’ on employees when those practices were present at a high intensity. Subsequently
there have been numerous other studies exploring this territory, some deploying labour process
theory, some a more psychological approach involving demand-resource imbalance (see Kroon
et al., 2009, and the varied contributions in Ashkenasy et al., 2016).
The optimistic or positive view of HRM/HPWS has so far been largely supported in the
empirical literature (see especially the meta-analysis of Jiang et al., 2012, that covers 116
studies). However, there are two limitations in most of this literature, that affect any meta-
analysis based on it. First, it generally adopts a simple linear form: this excludes the possibility
of ‘too much’ HRM/HPWS, as envisaged by Godard (2001) and subsequent critiques , and it
also excludes the possibility of ‘too little’ HRM/HPWS, as suggested by ‘threshold’ models of
effectiveness (e.g., Becker and Huselid, 2006) or by the ‘strong system’ theory of Bowen and
Ostroff (2004). Second, it generally ignores contextual features that can moderate the effect of
HRM/HPWS, such as the sectoral differences discussed in the next section. For instance, one
can see from case studies that the positive effects of HRM/HPWS may be undone when external
pressures lead management to act in ways that violate the implicit contract (e.g., Coyle-Shapiro
and Kessler, 2000; Hailey et al., 2005). At a more macro level, Zatzick and Iverson (2006) use
Canadian data covering a period of economic recession to show that positive effects of

7
HRM/HPWS were sustained only by firms that avoided making lay-offs.2 Contrasting results
were obtained in a study of HPWS in British small firms during another recessionary period:
positive impacts on employees became clearer where the firm made wage or labour adjustments
in response to the recession (Author A and Author B, date withheld).
3 Contextual backgrounds
The private sector
We conceptualize the employment relationship in the private sector as conflictual or contested,
reflecting the fundamentally different interests of principals and their employees (Bowles and
Gintis, 1993). In a neoclassical view different interests are resolved by a bargain that represents
the best compromise available to the parties. In the radical economics perspective, however,
this bargain fails to remove the conflict of interests and thus remains provisional and subject to
continual renegotiation that takes place with shifts in relative power. In a sociological analysis,
Etzioni (1975) characterized private sector employers as wielding ‘remunerative power’ to
coordinate the work of employees with corporate aims, such that employees could only muster a
kind of ‘calculative commitment’ to their jobs or employers. This implied that employees would
exert effort in their jobs only to the extent they felt financially compensated.
The idea of HRM emerged in the USA in the 1970s/80s in a context of alienated workers and
highly controlling managements (e.g., Walton, 1972). The HRM concept was subsequently
promoted as a way for the US private sector to cope with Japanese competition, aiming to unlock
the problem-solving capacity of workers (Walton, 1987). At the early stage of development, US
firms and researchers alike focused on the improvements in operational and financial
performance that HRM promised. Appelbaum et al. (2000), who studied five manufacturing
branches, were the first to assess impacts on employees’ job satisfaction and commitment
alongside of firm performance. Their results established a ‘win-win’ ( or ‘mutual gains’)
interpretation of HPWS as a conventional wisdom. An alternative interpretation however is that
2 The findings in Godard’s (2001) study of Canadian employees may also have been affected by the Canadian recession of the late 1990s, although he does not refer to this himself.

8
this result may have reflected the low base level from which employee participation and agency
were being lifted in US manufacturing (e.g., see Harrison and Bluestone, 1988).
During the late 1990s and through the 2000s there was a widespread adoption of HRM and
HPWS practices in the private sector in Britain (Wood and Bryson, 2009; van Wanrooy et al.,
2013). Over the same period there were numerous reports of increased pressures on the
employment relationship in the private sector – generally to the disadvantage of employees –
such as increased precarity, work intensification , work-life imbalance, and earnings inequality
(for reviews, see Green, 2006; McGovern et al., 2007: 6-28; Standing, 2011). Thus, the advance
of HPWS can hardly be said to have been accompanied by any general positive change in
employment relations. On the other hand, it may well be that against such a negative
background HPWS provided private sector employees with some intrinsic satisfactions that they
would value all the more.
The final tableau for us to consider is the profound financial-led recession of 2008, effects of
which continued until at least 2013. Remarkably, consequences for the labour market were
muted by comparison with the previous recession of the early 1990s. Job loss and
unemployment remained at moderate levels. One plausible explanation (there are others) is that
employers had come to understand the value of preserving their skill-base through the recession.
Another salient feature of the recession was that most employers took steps to reduce labour
costs, generally in the form of wage freezes, wage cuts or hours restrictions, and these steps were
generally not resisted by employees. It is possible that habits of open discussion and consultation
fostered by HPWS contributed to this compliance. Another interpretation is that wage flexibility
was finally accepted by employees following a long process of ‘softening up’ through other
forms of flexibility.
The public sector
The employment relationship is of a different type in the public sector. Public sector work is
often extremely demanding (teaching, health services) or dangerous (police, fire-service), and it
is carried out largely to help individuals who need care (children, sick, elderly, victims) or

9
protection (crime, disaster). Etzioni (1975) characterized public sector workers as controlled by
‘moral commitment’, which he regarded as a more powerful influence on behaviour than the
calculative commitment that prevails in the private sector. In a more everyday terminology, one
could say that the motivational basis of the public service worker is vocational. Gallie et al.
(1998: 240) note that 73 per cent of public sector employees strongly assent to the view that their
organization is ‘useful for society’, while this applies to only 26 per cent of private sector
employees.
The public sector has played a large part in the development of systematic personnel
management. Farnham and Horton (1996) proposed that the British public sector is
characterized by ‘paternalism’, with an emphasis on welfare provision and staff wellbeing (see
also Russell, 1991, for historical examples); also by collectivism, with acceptance of high union
density; and by a conscious policy of seeking to be ‘model employers’. However, this tradition
came under pressure during the 1980s with the advent of Thatcherism, and with criticism of the
growing share of the public sector in the economy. Internationally, public services and public
administration reached a critical juncture during the 1990s (Esping-Anderson, 1996).
Underlying pressures came from demographic developments, notably increasing longevity and
in-migration flows, and higher popular aspirations with respect to education, health, and
consumption. These partly conflicting pressures led to demands for improved services, coupled
(in Britain at least) with popular resistance to increased taxation. In response, British
governments of both left and right persuasions have been asking the public services to ‘do more
with less’ by operating more cost-effectively and by embracing various types of organizational
and technical innovation. Another tendency, common to a number of countries, has been an
advance of ‘marketization’ of the public sector through, for instance, outsourcing , competitive
tendering and privatization (see, e.g., LeGrand and Bartlett, 1993). This suite of developments
has been labeled the New Public Management (NPM) (see Burke et al., 2013 for international
perspectives; Bach et al., 2009 for a British review). In broad terms, NPM would tend to reduce
differences in the employment relationship between the private and public sectors.

10
In Britain, political pressure for cost reduction has been intense. During the 1990s the British
public sector experienced a net loss of 800,000 jobs, 300,000 of which went in the single year
1993 (Hicks et al., 2005). After a few years of recovery during the early 2000s, further large-
scale cuts were initiated during the ‘austerity’ regime that followed the 2008 recession: current
estimates suggest a cumulative reduction from 2008 of about one million jobs is in process. It is
unclear however whether this process has been effectual, since staffing reductions may lead to
reduced service levels. Official statistics show the British public sector in 2014 trailing behind
France, Germany and the European Union average in terms of a conventional measure of
productivity (ONS, 2017).
The development of HRM/HPWS in the British public sector in the past two decades has been
steady (Cully et al., 1999; Kersley et al., 2006; Van Wanrooy et al., 2013). Bach et al. (2009:
324-9), looking across the late 1990s and early 2000s, discern a ‘performance orientation’ and
emulation of private sector HRM/HPWS, but without curtailment of the traditional welfare
emphasis in the public sector’s policies. Moreover, unionization has remained at a high level,
and unions have been an active and influential presence. Public perceptions of major
institutions such as the NHS appear to remain favourable, and there have been frequent anti-
government protests against cuts under austerity. All told, public sector employees can continue
to be reasonably confident in the value of their social role. Relative to that base, HRM/HPWS
may seem a matter of slight importance, despite the much more severe implications (relative to
the private sector) of the recession with respect to staffing levels.
Finally, one should note the substantial literature on work-strain and burnout in some of the
public services (e.g., Hsieh et al., 2012). Jensen and Van De Voorde (2016) provide some
evidence suggesting that HRM/HPWS can either exacerbate or ameliorate this type of problem.
There is a case, then, for investigating effects of HPWS on employee well-being across sectors.
4 Contextual hypotheses The hypotheses that we derive from our discussion are as follows.

11
H1a: We hypothesize that motivation, represented by organizational commitment (OC) and
intrinsic job satisfaction (IJS), is positively related to HPWS in the private sector. This
hypothesis is based on the previous literature (e.g., Jiang et al., 2012).
H1b: We hypothesize that the relationship of HPWS to motivation is less positive in the public
sector than in the private sector, on the assumption that public sector employees derive a strong
motivation from their social or vocational role (Etzioni, 1975) rendering HPWS practices
relatively unimportant.
Further hypotheses relate to the relationship of economic circumstances to the HPWS effect. We
conjecture that labour market pressures on employees, together with firms’ cost-cutting policies
in response to the recession, will modify the HPWS effect in the private sector, but on the basis
of previous research this modification could take alternative forms:
H2a – the pressures weaken any positive effect of HPWS. This could be either because
economic circumstances increase work pressures, leading to a work-stress effect (Godard, 2001),
or because employees find firms’ cost-cutting initiatives are inconsistent with the positive
intentions toward employees signalled by HPWS (Zatzick and Iverson, 2006)
Contrastingly, H2b postulates that firms’ recessionary policies strengthen positive effects of
HPWS, perhaps through a heightening of contrast (i.e., HPWS offers ‘positives’ for employees
relative to a generally negative context) (e.g., Bryson and White, 2019).
We also hypothesize, consistent with H1b, that public sector employees are less affected than in
the private sector by change resulting from the recessionary experience, since their motivational
basis is vocational rather than organizational (H2c).
We do not frame any hypotheses with respect to employee well-being, since the findings to date
do note give clear guidance (see Jensen and Van de Voorde, 2016), but leave this as an aspect for
exploratory investigation.

12
5 Research methods – data, variables, analysis Data
We used two years, 2004 and 2011, of the Workplace Employment Relations Survey series
(WERS). WERS covers the whole economy with the exception of agriculture, extraction, and
micro-businesses (those with less than five employees). As noted in the Introduction, our
analysis was confined to workplaces with at least 50 employees. Information was obtained
through interviews with senior managers responsible for HRM. Further information on the
WERS 2004 and 2011 surveys is available from the UK Data Archive and in Van Wanrooy et al.
(2013).
The overall response rates for the WERS 2004 manager interview was 64 per cent. In WERS
2011, survey response was (like most other social surveys at this time) somewhat depressed, with
a management response rate of 46 per cent. However, the total sample size was increased in
2011 vis-a-vis 2004. In both years a postal questionnaire survey of a random sample of 25
employees per workplace was conducted shortly after the management interview was completed.
Employee data were obtained from 61 per cent of sampled employees in 2004, and 50 per cent in
2011. Since the analysis conducted here uses employee outcome data, only workplaces with
linked employer-employee data are used. Subsample numbers available for the analyses were:
in 2004, private sector 591, public sector 393, and in 2011, private sector 498 and public sector
581. The public sector formed a larger proportion of the sample in 2011 than in 2004 (its
proportion rising from approximately 30 per cent to 40 per cent).
Dependent variables
We assessed motivation through the concept of overall job attitude (Harrison et al. 2006),
consisting of two variables that we label intrinsic job satisfaction (IJS) and organizational
commitment (OC). IJS was derived from four facet satisfaction items that were closely similar
to the ‘job itself intrinsic satisfaction’ subscale of Warr et al. (1979). The measure of OC
consists of three items that have counterparts in the six-item Lincoln-Kalleberg measure of
affective organizational commitment.

13
Alongside motivation, a further employee outcome to be considered is affective wellbeing. The
WERS surveys address this concept through a list of feelings that employees may have
experienced in their work; the employee is asked to report ‘how frequently’. An unfortunate
complication is that the lists differed between years. In 2004, well-being was derived from a six-
item list with three negative feelings and three positive. In 2011 all six items were negative
feelings. The latter would tend to increase response set, and consistent with this reliability alpha
rose from 0.85 in 2004 to 0.91 in 2011, with mean response shifting away from the central
position. In both years, as with other measures, we recoded responses in such a way that the
score would measure positivity. To keep the difference in well-being measures in mind, we
label them with year subscripts.
Three further measures were included to aid interpretation. A measure of perceived
communications was derived from a sequence of seven opinion items (covering both downward
and upward communications). Inclusion of this measure relates to the interpretation of HPWS as
a communications or ‘signalling’ system (Bowen and Ostroff, 2004). A measure of trust was
derived from five items relating to opinions about management. This is mainly for comparison
with Appelbaum et al. (2000) who argued that trust was a condition for commitment. Finally,
we constructed a measure of extrinsic job satisfaction (EJS), derived from three facet satisfaction
items (pay, job security, training); this serves a methodological purpose, since a less-positive
effect of HPWS on EJS strengthens discriminant validity for the IJS effect.
Each of these items was calculated by summing a score per employee and then averaging across
employee respondents at each workplace. These mean employee outcome variables were then
linked to the workplace (management interview) data that provided the HPWS measure and the
control variables (see below).
The use of mean employee outcome measures has several advantages. Averaging results in
smooth quasi-continuous measures that are suitable for regression analysis. From a practical
viewpoint, management presumably is concerned about motivations and other attitudes across all
employees, and that is what these measures indicate. Averaging also addresses the problem of

14
individual heterogeneity bias in attitudinal responses that is associated with unmeasured and
persistent personality and cognitive style attributes (see Diener and Lucas, 1999). Since
employers have no reliable means of measuring personality at selection interview, it can
reasonably be assumed that a random sample of employees also represents a random sample of
personality attributes with mean-zero bias. In practice, of course, one does not obtain a sample
of all employees, but only a sample of stayers, that involves (self-)selection processes over time.
None the less, one can reasonably expect that unobserved variable bias will be reduced by the
averaging process, by comparison with an analysis at the individual level.
See Appendix Table 1 for details of the outcome variables and their reliabilities.
Explanatory variable
The explanatory variable was a summative index of HPWS practices. In the HRM-performance
literature HPWS items have usually been aggregated into a single overall index of practices (e.g.,
Becker and Huselid (1998:63)), and we followed this method. We included only items that are
descriptive of current practice and ignored any items that sought the manager’s opinion about
workplace climate, management-employee relations etc. Altogether 43 items (each item
representing one practice) were used in 2004, and 44 in 2011, a larger number than in most other
studies of HPWS/HRM (Ramsay et al., 2000, and Guest et al., 2003, also used large sets of
items). There were detailed differences between the item-lists across years, but sufficient
similarity to maintain conceptual consistency. In each year, items were first grouped into five
‘domains’ (participation, team-working, training and development, recruitment/selection, and
performance pay) that were tested and refined by reliability analysis prior to pooling (see
Appendix Table 2). An advantage of using a large set of items/practices is that this reduces the
risk of omitted variable bias.
While many items were of the simple ‘present/absent’ type, others were derived by reducing a
quantified banded variable (such as proportion of employees taking part in the practice, or time
devoted to the practice) to dichotomous form by splitting at the overall median, an efficient
method of removing measurement error. Note also that while some items referred to fairly basic

15
HRM practices, others can be regarded as toward the sophisticated extreme: for instance, teams
that select their own leader, or communication meetings that discuss staffing levels or finances.
Empirical support for adopting a summative index as the HPWS measure has been provided by
Combs et al. (2006), who concluded from their meta-analysis of the HPWS-performance
relationship that summative scores have been about twice as predictive of outcomes as use of
separate measures. Wood and de Menezes (2011) have criticized the use of summative measures
on the grounds that they obscure the operation of conceptually distinct configurations within
HPWS. Arguments lending theoretical support for the summative approach can be found in
Becker and Huselid (2006).
See Appendix Table 2 for details of the explanatory variables.
Control variables
All explanatory analyses included control variables of a standard type. Structural variables were
workplace size – the log of the number of employees, and size of parent organization, with size-
groups less than 1000 employees, 1000-999, and 10,000-plus, compared with single-site as the
reference category. Industrial relations structure was represented by a trichotomous variable (no
union, one, more than one)3. Age of workplace had four categories (0-4 years, 5-9, 10-24, and
25-plus). Compositional variables were percentages of female employees, of part-time
employees, of those on fixed-term contracts, and of those in ‘higher’ and ‘lower’
occupational/skill categories with ‘intermediate’ as the reference category. A difficulty that
arose with the control variable for industry group was that certain industries had very few private
sector workplaces while others had very few public sector workplaces. The public sector was
described through five groups – commercial services (mainly but not exclusively in transport and
communications), public administration (includes government, police, and emergency services),
education, healthcare, and community services (mostly cultural, leisure and sports). For the
3 For the public sector, multi-unionism provides a more sensitive measure than simple union recognition, because unions are recognized throughout most of the public sector. Variant analyses using union membership density were also carried out but led to no increase in explanatory power.

16
private sector we split commercial services into manufacturing, utilities, construction,
distribution, hospitality, transport/communications, financial services, and business services,
while amalgamating public administration, education, health, and community services into one
group.
An additional control variable, for 2011 only, was based on workplaces’ adoption of cost-cutting
labour policies, such as wage freezes, wage cuts and short-time working, in response to the 2008
recession. A dummy variable was scored 1 if the workplace reported using three or more such
policies, and 0 otherwise. This criterion was reached by 25 per cent of private sector workplace
and 31 per cent of the public sector workplaces (weighted basis).
A table of descriptive statistics for the control variables is available on request.
Analysis methods
All analyses were carried out by robust regression (Berk, 1990). This differs from ordinary
regression in that the computation of standard errors takes account of survey weighting and
complex survey design, and generally yields somewhat conservative inferences by comparison
with OLS. Analyses were performed separately for the sector subsamples. This was necessary
because of the different industry-group variables by sector (see above), but has the advantage
that the covariance structure is allowed to be flexible across sector.
The regressions were carried out using two alternative specifications in the HPWS variable: (1)
linear, (2) linear-quadratic, i.e. the HPWS index score accompanied by HPWS-squared. However
we present the results of the linear-quadratic specifications only where they lead to a different
conclusion to the corresponding linear specification. Results for the complete set of linear-
quadratic models are available on request, as are any other results referred to in the text but not
reported in tabular form.
17
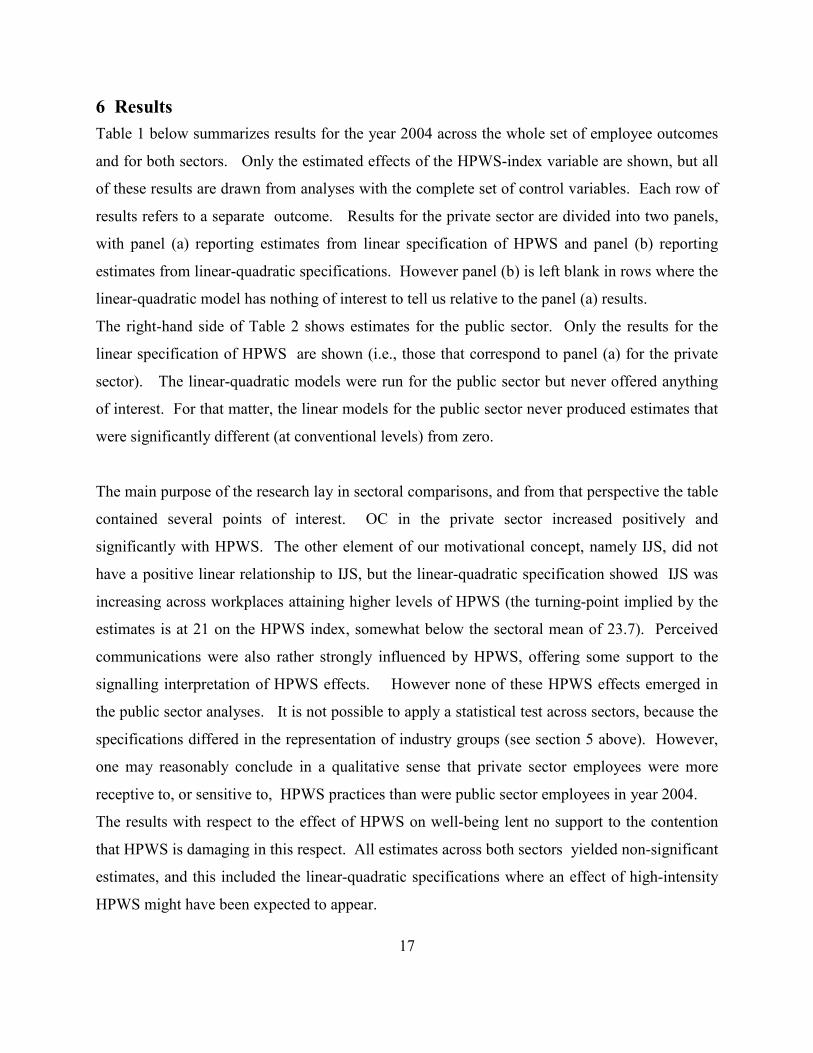
6 Results Table 1 below summarizes results for the year 2004 across the whole set of employee outcomes
and for both sectors. Only the estimated effects of the HPWS-index variable are shown, but all
of these results are drawn from analyses with the complete set of control variables. Each row of
results refers to a separate outcome. Results for the private sector are divided into two panels,
with panel (a) reporting estimates from linear specification of HPWS and panel (b) reporting
estimates from linear-quadratic specifications. However panel (b) is left blank in rows where the
linear-quadratic model has nothing of interest to tell us relative to the panel (a) results.
The right-hand side of Table 2 shows estimates for the public sector. Only the results for the
linear specification of HPWS are shown (i.e., those that correspond to panel (a) for the private
sector). The linear-quadratic models were run for the public sector but never offered anything
of interest. For that matter, the linear models for the public sector never produced estimates that
were significantly different (at conventional levels) from zero.
The main purpose of the research lay in sectoral comparisons, and from that perspective the table
contained several points of interest. OC in the private sector increased positively and
significantly with HPWS. The other element of our motivational concept, namely IJS, did not
have a positive linear relationship to IJS, but the linear-quadratic specification showed IJS was
increasing across workplaces attaining higher levels of HPWS (the turning-point implied by the
estimates is at 21 on the HPWS index, somewhat below the sectoral mean of 23.7). Perceived
communications were also rather strongly influenced by HPWS, offering some support to the
signalling interpretation of HPWS effects. However none of these HPWS effects emerged in
the public sector analyses. It is not possible to apply a statistical test across sectors, because the
specifications differed in the representation of industry groups (see section 5 above). However,
one may reasonably conclude in a qualitative sense that private sector employees were more
receptive to, or sensitive to, HPWS practices than were public sector employees in year 2004.
The results with respect to the effect of HPWS on well-being lent no support to the contention
that HPWS is damaging in this respect. All estimates across both sectors yielded non-significant
estimates, and this included the linear-quadratic specifications where an effect of high-intensity
HPWS might have been expected to appear.

18
Table 1 HPWS effects on attitudinal outcomes in year 2004 Private sector Public sector Model> (a) linear (b) linear-quadratic linear Outcomes: b (s.e) R-sq linear b (s.e.) quadratic b (s.e) b (s.e) R-sq OC 0.034 (0.010)** 0.160 0.003 (0.016) 0.378 trust 0.025 (0.025) 0.181 0.035 (0.039) 0.298 IJS -0.003 (0.015) 0.127 -0.109 (0.062)+ 0.0026 (0.0014)+ -0.001 (0.021) 0.221 EJS 0.011 (0.013) 0.170 0.005 (0.016) 0.240 well-being04 -0.012 (0.019) 0.221 0.006 (0.178) 0.226 perceived communications 0.139 (0.039)** 0.215 -0.020 (0.058) 0.237 Notes: Weighted regression analyses with a robust variance estimator. All analyses included full controls as described in text
(section 5). N for private sector analyses is 578, N for public sector analyses is 362. Estimate significantly different from zero: +
at the 10 per cent level * at the 5 per cent level ** at the 1 per cent level
Table 2 shows the corresponding results from year 2011. Recall that these analyses included an
additional control variable, a dummy indicating that the workplace had adopted three or more
cost-cutting labour policies (affecting wages, hours) in response to the 2008 recession. In the
public sector sample there was no indication that anything had changed in respect of the effect of
HPWS on employee outcomes, which remained near-zero everywhere. However there were
considerable changes in the picture for the private sector. The linear effect of HPWS on OC that
was observed in 2004 was replaced by a non-linear effect (see panel (b) of Table 2). The
estimates showed OC increasing up to moderate levels of HPWS intensity, but declining again
above that. A very similar picture applied both to the measure of trust in management and to the
measure of perceived communications. In each case, the effect of HPWS became negative above
the sectoral median of HPWS intensity. Overall, the results suggested that in 2011 employees
were less happy when there were above-average levels of HPWS. This inverted-U form of
relationship between HPWS and motivational measures was somewhat similar to that reported
by Godard (2001) with Canadian employees.
Furthermore, in the private sector there was a significant negative and linear effect of HPWS on
employee well-being (it should be recalled that the measure of wellbeing in 2011 differed from
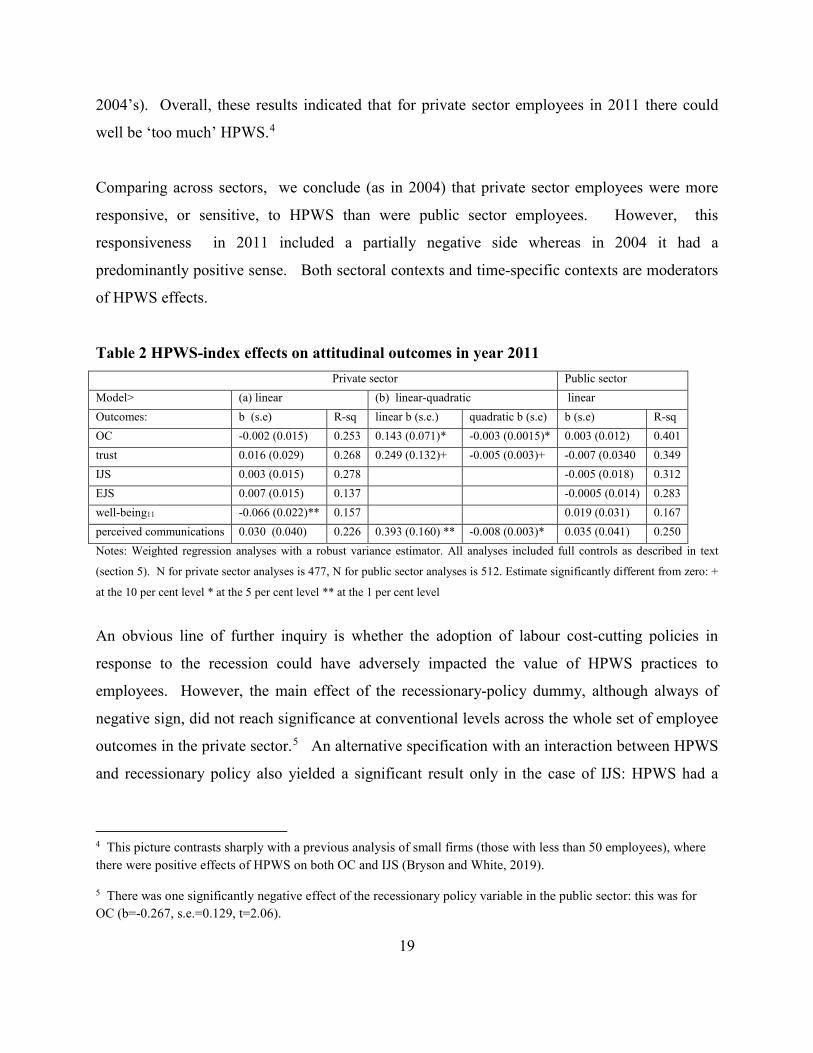
19
2004’s). Overall, these results indicated that for private sector employees in 2011 there could
well be ‘too much’ HPWS.4
Comparing across sectors, we conclude (as in 2004) that private sector employees were more
responsive, or sensitive, to HPWS than were public sector employees. However, this
responsiveness in 2011 included a partially negative side whereas in 2004 it had a
predominantly positive sense. Both sectoral contexts and time-specific contexts are moderators
of HPWS effects.
Table 2 HPWS-index effects on attitudinal outcomes in year 2011 Private sector Public sector Model> (a) linear (b) linear-quadratic linear Outcomes: b (s.e) R-sq linear b (s.e.) quadratic b (s.e) b (s.e) R-sq OC -0.002 (0.015) 0.253 0.143 (0.071)* -0.003 (0.0015)* 0.003 (0.012) 0.401 trust 0.016 (0.029) 0.268 0.249 (0.132)+ -0.005 (0.003)+ -0.007 (0.0340 0.349 IJS 0.003 (0.015) 0.278 -0.005 (0.018) 0.312 EJS 0.007 (0.015) 0.137 -0.0005 (0.014) 0.283 well-being11 -0.066 (0.022)** 0.157 0.019 (0.031) 0.167 perceived communications 0.030 (0.040) 0.226 0.393 (0.160) ** -0.008 (0.003)* 0.035 (0.041) 0.250 Notes: Weighted regression analyses with a robust variance estimator. All analyses included full controls as described in text
(section 5). N for private sector analyses is 477, N for public sector analyses is 512. Estimate significantly different from zero: +
at the 10 per cent level * at the 5 per cent level ** at the 1 per cent level
An obvious line of further inquiry is whether the adoption of labour cost-cutting policies in
response to the recession could have adversely impacted the value of HPWS practices to
employees. However, the main effect of the recessionary-policy dummy, although always of
negative sign, did not reach significance at conventional levels across the whole set of employee
outcomes in the private sector.5 An alternative specification with an interaction between HPWS
and recessionary policy also yielded a significant result only in the case of IJS: HPWS had a
4 This picture contrasts sharply with a previous analysis of small firms (those with less than 50 employees), where there were positive effects of HPWS on both OC and IJS (Bryson and White, 2019).
5 There was one significantly negative effect of the recessionary policy variable in the public sector: this was for OC (b=-0.267, s.e.=0.129, t=2.06).

20
positive effect on IJS only if the workplace had adopted cost-cutting policies,6 so offers no
support for the idea that cost-cutting is a bad combination with HPWS.
We earlier conjectured that public sector employees would be less motivated by HPWS than
private sector employees. Not being motivated by HPWS does not however imply not being
motivated at all; it may equally suggest that motivation is different. One way of checking this is
to examine the raw (i.e. unadjusted for HPWS and other covariates) means on the employee
outcome variables, by sector. Table 3 shows these means with their standard errors.
In 2004, public sector workplaces had at least as high (positive) scores on all employee outcome
measures as did private sector workplaces. Mean OC was indeed significantly higher in the
public sector and mean well-being was particularly high there. In 2011, differences had
generally shrunk; in some instances the private sector had a somewhat higher mean but none of
the differences was statistically significant. Overall, one can assert that the public sector
workplaces recorded levels of motivation and well-being as high as in the private sector, despite
not experiencing any of the positive effects of HPWS that the private sector had.
Table 3 Workplace means of attitudinal outcomes for 2004 and 2011, by sector Cell figures are weighted mean (s.e.) 2004 2011 Sector> Private Public Private Public Outcomes: OC 10.84 (0.08) 11.24 (0.08) 11.30 (0.08) 11.50 (0.08) trust 19.73 (0.18) 20.03 (0.19) 20.25 (0.20) 19.99 (0.19) IJS 14.78 (0.09) 14.96 (0.10) 15.18 (0.11) 15.20 (0.11) EJS 9.73 (0.08) 9.75 (0.08) 9.88 (0.09) 9.70 (0.08) well-being04 15.30 (0.13) 18.91 (0.14) --- --- well-being11 --- --- 23.86 (0.17) 23.61 (0.16) perceived communications 21.63 (0.24) 22.15 (0.30) 22.90 (0.26) 22.51 (0.23) N 591 393 498 531
6 The interaction shows HPWS having b0=-0.011 (s.e.=0.016) and b1=0.063 (s.e.=0.029), where the subscripts refer to the absence (0) or presence (1) of the recessionary policies.

21
7 Conclusions and Implications This research embarked with the idea that the effects of HPWS on employees are moderated by
the contexts in which HPWS operate. To investigate this conjecture we conducted analyses by
sector (private v public) and by time-period (boom-time v recession), with HPWS as the
explanatory variable for a range of employee outcomes. The investigation was focused upon
medium-sized and large workplaces.
The direct conclusions that can be drawn from the research results are largely (but not wholly)
supportive of the hypotheses set out in section 4. Because of unavoidable differences in analysis
specifications between sectors and across years, these conclusions do not emerge from formal
statistical tests but from qualitative assessment of results.
The private sector in 2004 provides evidence in support of hypothesis H1a: OC increases with
HPWS intensity, and IJS increases with HPWS once above-average HPWS has been reached.
There is also a positive effect of increasing HPWS on employee views of workplace
communications, a result that strengthens the interpretation of HPWS as a ‘signalling’ system.
Hypothesis H1b predicted that employee motivation in public sector workplaces would be less
affected by HPWS than in the private sector, and this too was supported – indeed there was no
sign of public sector employees responding positively to HPWS across the range of outcomes.
The basis of the prediction here was that public sector motivation tends to be ‘vocational’ rather
than organizational. Of course this interpretation remains speculative in the absence of measures
that directly address vocational motivation.
We then used 2011 data to assess what happened when the economic environment deteriorated
for employees. In the private sector, the findings supported H2a, with OC, trust, and
communications all taking on an inverted-U relationship to HPWS: in other words, these
outcomes were increasing up to moderate levels of HPWS but this relationship was reversed at
higher HPWS intensity. Private sector employees were finding that there could be ‘too much’
HPWS in the conditions of 2011. Moreover, HPWS was associated with declining well-being in
the private sector, a relationship not found in 2004.

22
Finally, hypothesis H2c, predicting that public sector employees would be less affected by the
changed economic circumstances, was supported by the 2011 evidence. Public sector
employees appeared not to experience even the limited positive impact of HPWS on
commitment and satisfaction that remained in the private sector of 2011. On the other hand,
nor did they experience the negative pressure from HPWS on well-being that was then present
in the private sector. One can perhaps attribute this to the protection provided by the traditional
welfare orientation of the public sector (Bach et al, 2009).
The findings, taken as a whole, reinforce a call for more attention to be paid to contextual
differences (Boxall, 2013) rather than assuming the ‘universalist’ view of HPWS. A case can
perhaps be made for universal effects of HPWS on organizational performance, in the sense that
the chief practices of HPWS are simply part of ‘good management’ (Bloom et al., 2017).7 But to
extend the universalist case to employee outcomes is to ignore the diversity of interests and the
differences in starting positions from which groups respond to HPWS.
Adopting a more contextual perspective should encourage the construction of wider-ranging
survey questions in organizational surveys. Relevant questioning on diverse motivations might
be found in such sources as the World Values surveys, or in studies of organizational climate that
take account of external roles and relations (e.g. Cavrini et al, 2015; Mosatafa et al, 2015). Also
relevant are the types of opinion questions relating to economic change and socio-economic
institutions in the British Attitudes Surveys and the European Social Surveys. In short,
workplace research, including research on HPWS, needs to think outside the workplace box if it
is to make headway in understanding motivational contexts.
7 In a companion paper using the same datasets (Author A and Author B,date withheld), we show that HPWS had significantly positive effects on workplace performance in the public sector as assessed by financial performance ratings and achievement of change in technology and work organization.

23
References
Appelbaum, E., Bailey, T., Berg, P. and Kalleberg, A.L. (2000) Manufacturing advantage: Why
high-performance work systems pay off, Ithaca NY: Cornell University Press.
Bach, S., Givan, R. and Forth, J. (2009) ‘The Public Sector in Transition’ in Brown, W., Bryson,
A., Forth, J. and Whitfield, K. (eds.) The Evolution of the Modern Workplace, Cambridge:
Cambridge University Press: 307-31.
Becker, B.E. and Huselid, M.A. (1998) ‘High performance work systems and firm performance:
A synthesis of research and managerial implications’. In Ferris, G.R. (ed.) Research in
personnel and human resources management, Vol. 16, Stamford, CT: JAI Press: 53-101.
Becker, B.E. and Huselid, M.A. (2006) Strategic human resources management: where do we go
from here?, Journal of Management, 32(6): 898-925.
Berk, R.A. (1990) ‘A Primer on Robust Regression’, in Fox, J. and Long, J.S. (eds.) Modern
Methods of Data Analysis, Newbury Park, CA: Sage: 292-324.
Bloom, N., Sadun, R., and Van Reenen, J. (2017) Management as a Technology? CEP
Discussion Paper 1433 (revised), London: Centre for Economic Performance.
Bowen, D.E. and Ostroff, C. (2004) Understanding HRM-performance linkages: The role of the
“strength” of the HRM system, Academy of Management Review, 29(2): 203-21.
Bowles, S. and Gintis, H. (1993) The Revenge of Homo Economicus: Contested Exchange and
the Revival of Political Economy, Journal of Economic Perspectives 7(1):83-102.
Boxall, P. (2013) ‘Building High-Performing Work Systems: Analysing HR Systems and Their
Contribution to Performance’, in Paauwe, J., Guest, D., and Wright, P. (eds) HRM and
Performance: Achievements and Challenges, Chichester: Wiley: 47-59.

24
Burke, R.J., Allisey, A.F., and Noblet, A.J. (2013) ‘The importance of human resource
management in the public sector, future challenges and the relevance of the current collection’,
in Burke, R.J., Noblet, A.J., and Cooper, C.L. (eds.) Human Resource Management in the Public
Sector, Cheltenham: Edward Elgar : 1-13.
Cavrini, G., Chianese, G., Boch, B., and Dozza, L. (2015) School Climate: Parents’, Students’
and Teachers’ Perceptions, Procedia – Social and Behavioral Studies, special issue of the 6th.
World Conference on Educational Sciences, 191 (June) 2044-8.
Combs, J., Liu, Y., Hall, A., and Ketchen, D. (2006) How much do high performance work
practices matter? A meta-analysis of their effects on organizational performance, Personnel
Psychology, 59(3): 501-28.
Coyle-Shapiro, J. and Kessler, I. (2000) Consequences of the Psychological Contract for the
Employment Relationship: A Large-Scale Survey, Journal of Management Studies, 37(7): 903-
29.
Cully, M., Woodland, S., O’Reilly, A. and Dix, G. (1999) Britain at Work: As depicted in the
1998 Workplace Employee Relations Survey, London: Routledge.
Diener, Ed and Richard E. Lucas. (1999) ‘Personality and Subjective Well-Being’, in Daniel
Kahneman Ed Diener, and David N. Schwartz (eds.) Well-Being: The Foundations of Hedonic
Psychology, New York: Russell Sage Foundation: 213-229.
Esping-Andersen, G, (1996) ‘After the Golden Age? Welfare State Dilemmas in a Global
Economy’, in Esping-Andersen, G. (ed.) Welfare States in Transition: National Adaptations in
Global Economies, Thousand Oaks, CA: Sage.
Etzioni, A. (1975) A Comparative Analysis of Complex Organizations, revised and enlarged
edition, New York: Free Press.

25
Farnham, D. and Horton, S. (1996) ‘Continuity and Change in the Public Services’ in Farnham,
D. and Horton, S. (eds.) Managing People in the Public Services, Basingstoke: Macmillan : 3-42.
Fishbein, Martin (1967) ‘A Behavior Theory Approach to the Relations between Beliefs about an
Object and the Attitude Toward the Object’, in Martin Fishbein (ed.) Attitude Theory and
Measurement, London; John Wiley & Sons: 389-400.
Gagné, Marylène and Edward L. Deci (2005) ‘Self-determination theory and work motivation’,
Journal of Organizational Behavior, 26(4): 331-62.
Gallie, D., White, M., Cheng, Y. and Tomlinson, M. (1998) Restructuring the Employment
Relationship, Oxford: Oxford University Press.
Gerhart, B. (2013) ‘Research on Human Resources and Effectiveness: Some Methodological
Challenges’ in Paauwe, J., Guest, D., and Wright, P. (eds) HRM and Performance: Achievements
and Challenges, Chichester: Wiley: 149-71.
Godard, J. (2001) High Performance and the Transformation of Work? The Implications of
Alternative Work Practices for the Experience and Outcomes of Work, Industrial and Labor
Relations Review, 54(4): 776-805.
Gould-Williams, J.S. and Gatenby, M. (2010) The effects of organizational context and
teamworking activities on performance outcomes, Public Management Review 12(6):759-87.
Green, F. (2006) Demanding Work: The Paradox of Job Quality in the Affluent Economy,
Woodstock: Princeton University Press.
Guest, D.E., Michie, J., Conway, N. and Sheehan, M. (2003) Human Resource Management and
Corporate Performance in the UK, British Journal of Industrial Relations, 41(2): 291-314.

26
Hailey, Veronica H., Elaine Farndale and Caherine Truss. (2005) ‘The HR Department’s Role in
Organisational Performance’, Human Resource Management Journal, 15(3): 49-66.
Harrison, B. and Bluestone, B. (1988) The Great U-turn: Corporate Restructuring and the
Polarizing of America, New York: Basic Books.
Harrison, D.A., Newman, D.A. and Roth, P.L. (2006) How Important are Job Attitudes? Meta-
analytical Comparisons of Integrative Behavioral Outcomes and Time Sequences, Academy of
Management Journal, 45(2): 305-325.
Hicks, A., Walling, A., Heap, D. and Livesey, D. (2005) Public Sector Employment Trends
2005, London: National Statistics.
Hsieh, C.-W., Jin, M., and Guy, M.E. (2012) Consequences of work-related emotions: analysis
of a cross-section of public sector workers, American Review of Public Administration, 42(1):
39-53.
Jensen, J.M. and Van De Voorde, K. (2016) ‘High Performance at the Expense of Employee
Health? Reconciling the Dark Side of High Performance Work Systems’ in Ashkenasy, N.M.,
Bennett, R.J. and Martinko, M.J. (eds.) Understanding the High Performance Workplace: The
Line Between Motivation and Abuse, New York, NY: Routledge: 148-69.
Jiang, K., Lepak, D.P., Hu, J. and Baer, J.C. (2012) How Does Human Resource Management
Influence Organizational Outcomes? A Meta-Analytic Investigation of Mediating Mechanisms,
Academy of Management Journal 55(6): 1264-94.
Kersley, B., Alpin, C., Forth, J., Bryson, A., Bewley, H., Dix, G. and Oxenbridge, S. (2006)
Inside the Workplace: Findings from the 2004 Workplace Employment Relations Survey,
London: Routledge.

27
Kroon, B., van de Voorde, K. and van Veldhoven, M. (2009) Cross-level effects of high
performance work practices on burnout: Two counteracting mediating mechanisms compared,
Personnel Review, 38(5); 509-25.
LeGrand, J. and Bartlett, W. (eds.) Quasi-Markets and Social Policy, London: Macmillan.
Latham, G.P. and Locke, E.A. (1990) Work Motivation and Satisfaction: Light at the End of the
Tunnel, Psychological Science, 1 (4): 240-6.
McGovern, P., Hill, S., Mills, C. and White, M. (2007) Market, Class, and Employment, Oxford:
Oxford University Press.
Mostafa, A.M.S., Gould-Williams, J.S. and Bottomley, P. (2015) High Performance Human
Resource Policies and Employee Outcomes: The Mediating Role of Public Service Motivation,
Public Administration Review,75(5): 747-57.
ONS (2017) International Comparisons of Labour Productivity by Industry: 2014, London:
Office of National Statistics web article, released 6th October 2017.
Podsakoff, Philip M., Scott B. MacKenzie, Joong-Yeon Lee, and Nathan P. Podsakoff (2003)
Common Method Biases in Behavioral Research: A Critical Review of the Literature and
Recommended Remedies, Journal of Applied Psychology, 88(5): 879-903.
Ramsay, H., Scholarios, D. and Harley, B. (2000) Employees and high-performance work
systems: Testing inside the black box, British Journal of Industrial Relations, 38(4): 501-32.
Russell, A, (1991) The Growth of Occupational Welfare in Britain: Evolution and
Harmonization of Modern Personnel Practice, Aldershot: Avebury.
28
Spector, P.E. (2016) ‘When More Can Become Less: High Performance Work Systems as a
Source of Occupational Stress’, in Ashkenasy, N.M., Bennett, R.J. and Martinko, M.J. (eds.)
Understanding the High Performance Workplace: The Line Between Motivation and Abuse, New
York, NY: Routledge: 148-69.
Standing G. (2011) The Precariat: The New Dangerous Class. London: Bloomsbury.
Storey, D., Saridakis, G., Sen-Gupta, D., Edwards, P. and Blackburn, R.A. (2010) Linking HR
Formality with Employee Job Quality: The Role of Firm and Workplace Size, Human Resource
Management, 49(2): 305-29.
van Wanrooy, B., Bewley, H., Bryson, A., Forth, J., Freeth, S., Stokes, L., and Wood, S.(2013)
Employment Relations in the Shadow of Recession, Basingstoke: Palgrave Macmillan.
Walton, R.E. (1972) ‘How to counter alienation in the plant’, Harvard Business Review, 72 No.
6: 70-81.
Walton, R.E. (1987) Innovating to Compete, London: Jossey-Bass.
Warr, P., Cook, J. and Wall, T. (1979) Scales for the measurement of some work attitudes and
aspects of psychological wellbeing, Journal of Occupational Psychology, 52(2): 129-48.
Wood, S. and Bryson, A. (2009) ‘High involvement management’, Chapter 7 in W. Brown, A.
Bryson, J. Forth and K. Whitfield (eds.) The Evolution of the Modern Workplace, pp. 151-175,
Cambridge University Press
Wood, S. and de Menezes, L.M. (2011) High involvement management, high-performance work
systems and wellbeing, International Journal of Human Resource Management, 22 (7): 1586-
1610.

29
Zatzick, Christopher D. and Roderick D. Iverson (2006) High-involvement management and
workforce reduction: Competitive advantage or disadvantage?, Academy of Management
Journal, 49(5): 999-1015.

30
Appendix Tables
Appendix Table 1 Dependent Variables
2004 2011 range mean s.d. N mean s.d. N Items IJS scale 4-20 14.69 1.34 984 15.00 1.42 1079 (Satisfaction with..) Sense of achievement from your
work, Scope for using your own initiative, Amount of influence over your job, The work itself. 5-point item response, high=more satisfied. Alpha = 0.87 (both years)
EJS scale
3-15 9.62 1.10 983 9.69 1.15 1079 (Satisfaction with …) Amount of pay you receive, Training your receive, Your job security. 5-point item response, high=more satisfied. Alpha =0.60 (2004) and 0.62 (2011)
OC scale 3-15 10.84 1.15 984 11.30 1.15 1078 (Agreement that …) Share many of the values of my organization, Feel loyal to my organization, Proud to tell people who I work for. 5-point item response, high=stronger agreement. Alpha = 0.85 (both years)
Trust scale
6-30 19.34 2.55 984 19.72 2.61 1079 (Agreement that managers…) Can be relied on to keep promises, Are sincere in attempting to understand employees’ views, Deal with employees honestly, Understand employees having responsibilities outside work, Encourage people to develop skills, Treat employees fairly. 5-point item response, high=stronger agreement. Alpha = 0.93 (both years)
Well-being scales
6-30 18.97 1.80 984 23.54 2.09 1078 (Thinking of past few weeks, how much of the time has your job made you feel…) (2004) Tense, Calm, Relaxed, Worried, Uneasy, Content (2011) Tense, Depressed, Worried, Gloomy, Uneasy, Miserable. 5-point item response, coded with high=more positive. Alpha=0.85 (2004) and 0.91 (2011)
Perceived communications scale
7-35 21.37 3.35 983 22.18 3.28 1077 (How good are managers at keeping you informed about …) Changes in how organization is run, Changes in staffing, Changes in how you do your job, Financial matters) AND (how good at …) Seeking views, Responding to suggestions. Allowing employees to influence decisions. Alpha=0.93 (2004) and 0.94 (2011).
Note: All items are coded so that high has positive.sense. Descriptives are at workplace level (workplaces with 50 or more employees and linked employer-employee data), unweighted. Alphas are based on the full employee sample.

31
Appendix Table 2: Items Used in Construction of HPWS Measures
Domain name Contents – Year 2004
Participation KR20=0.78
Meeting time; briefing time; subjects discussed in meetings (organization, production, staffing, finance, planning, pay); consultative committee set up; attitude surveys used; changes made with employee involvement.
Team working KR20=0.67
Proportion in teams; task rotation within teams; teams have inter-dependence, responsibility, autonomy,; team chooses their leader; quality circles used.
Development KR20=0.68
‘Investor in People’ standard achieved ; development included in firm strategy; proportion given off-job training; proportion given cross-job training; variety of training courses used; induction courses used; team training; training discussed in briefing groups; appraisal for non-managers.
Selection KR20=0.52
selection criteria: qualifications, skills, references, motivation, experience; use personality tests; use skill tests.
Incentives KR20=0.68
bonus for individual, group/team, workplace, organization performance; profit-sharing for non-managers; merit-based or performance pay; appraisals that affect pay differentials; incentives that affect pay differentials.
Contents – Year 2011 Participation KR20=0.78
Meeting time; briefing time; subjects discussed in meetings (organization, production, staffing, finance, planning, pay); consultative committee set up; attitude surveys used; changes made with employee involvement.
Team working KR20=0.67
Proportion in teams; task rotation within teams; teams have inter-dependence, responsibility, autonomy,; team chooses their leader; quality circles used.
Development KR20=0.68
‘Investor in People’ standard achieved ; development included in firm strategy; proportion given off-job training; proportion given cross-job training; variety of training courses used; induction courses used; team training; training discussed in briefing groups; appraisal for non-managers.
Selection KR20=0.52
selection criteria: qualifications, skills, references, motivation, experience; use personality tests; use skill tests.
Incentives KR20=0.68
bonus for individual, group/team, workplace, organization performance; profit-sharing for non-managers; merit-based or performance pay; appraisals that affect pay differentials; incentives that affect pay differentials.
Contents – Year 2011
Participation KR20=0.69
Meetings are regular; meeting frequency; staff time in meetings; briefing frequency; staff time in briefings; subjects discussed in meetings (staffing, finance, investment); consultative committee; attitude surveys.
Team working KR20=0.57
Proportion in teams; training for team-working; teams have inter-dependence, responsibility, autonomy; quality circles used.
Development KR20=0.60
‘Investor in People’ standard achieved ; development included in firm strategy; proportion given workplace training; proportion given off-job training; proportion given cross-job training; variety of training courses used; induction courses used; appraisal for managers; appraisal for all non-managers; employee development is part of workplace strategy; vacancies filled internally if possible.
Selection KR20=0.62
selection criteria: qualifications, skills, references, motivation, experience; use personality tests for manager jobs; use personality tests for non-manager jobs; use skill tests for manager jobs; use skill tests for non-manager jobs.
Incentives KR20=0.81
bonus for individual, group/team, workplace, organization performance; profit-sharing for non-managers; merit-based or performance pay; appraisals that affect pay differentials; incentives that affect pay differentials.
Notes: KR20 is the Kuder Richardson reliability measure for dichotomous item scales, computed over whole sample. Underlined items are quantitative banded variables reduced to dichotomies by splitting at the overall median. ‘Investor in People’ is an externally awarded standard for people development.


