Indi an Journal of Rad io & Space Physic s Vol. 31 , February 2002, pp . 15 -2 0 Diurnal, seasonal and solar cycle variations of ionospheric electron content over an Indian low latitude station, Waltair o s v V 0 Prasad & P V S Rama Rao* Department of Physics, Andhra Uni ve rs it y, Visakhapatnam 530003 Received 18 December 2000; revised 24 A/lgust 200 1; accepted 3 October 2001 The diurnal, seasonal and solar cyclc va riations of the ionosphe ri c el ec tron co nt e nt (lEe) durin g both hi gh ( 1979 -8 0) an d low ( 19 84-85) sun spot ac tivity periods at a low latitude sta ti on. Waltair (I7.7° N. 83 .3°E) ha ve be en studied. The diur- nal variation shows noon bite-out and post-sunset enhancement in l Ee during equinoctial a nd wint er months of hi gh sun - spot ac ti vit y period. The seaso nal variation show s minimum lEe during each of th e local hour s of th e day of l ow sunspot ac tivity period co mp ar ed to those in th e co rre sponding hours of hi gh sun spot activity period. The result s on th e diurn al va ri ati on of l Ee , parti cu larl y, durin g th e po st-s un set hour s of hi gh sun spot activit y period are discuss ed in rel ati on to the ef- fec t of E x B drift at the eq uator. 1 Introduction The effect of th e ionosphere on ve ry high fr e- quency radio waves has been studied for many years usin g the radio signals from the artificial earth sa tel- lites. These studies are of primary importance for th e evaluation of communicati on a nd navigation systems involving the use of the space vehic les, and in addi- ti on, they also provide va lu able in fo rm ation on th e properties and behav iour of the ionos ph ere. Th e advent of geos tationary sa tellites has made possibl e con tinuous recording of Faraday rotation (F R) which is used in computing th e electron co nt e nt of th e ionosphere (IEC) from ma ny fixed locations on the earth. It is generally observed that l Ee at a station va ries from ho ur to hour, season to season and year to yea . It is fo un d that among th e several fac tors th at affect the columnar electron content of th e iono- sphere, th e most important ones are: (i) variation of so lar zenith ang l e. caus in g both diurnal and seasonal variation in lEe and (ii ) sunspot activity changes in l Ee, relat ed to th e changi ng le ve l of solar ionizing radiations. Studies on diurnal and sea so nal va ri ation of l Ee as from geostationary satellites were made and are summarized in some excellent revi ews l - 5 • In th e rec e nt past, Ty agi and Das Gu pla 6 and lyer7 have reviewed the resu lt s of beaco n sate llite stud ies with pa rti cu lar refere nc e to the Indian secto r. It is kno wn that lEe shows marked yaria t ion with t he geogr aph ic locat io n of th e observi ng stati on . The *Emeritus Scienti,t. C. IR present station, Wallair (17 .7 ° N, 83 .3°E, 200N dip) is situ ated at an intermediate location between th e equator and the equ atorial ano mal y cre st regi on . A study on th e characteristics of lEe fo r thi s st ation helps in understanding th e represe nt ative behaviour of th e ionosphere both in th e low and equatorial lati tud e reg io ns. In thi s paper, th e diurna l, seasonal and solar cycle variations of lEe at the lo w latitude stati on, Walt ai r, are presented. 2 Data and method of anal ys is Faraday rotation (FR) data obta in ed continuously rou nd the clock over Waltair, us in g the 136 . 1123 MHz beacon transmissions from the ETS- IJ sate lli te dur in g th e high sunspot acti vity period of 1979-80 and the \ 36. 14 MH z beacon transmissions from th e SIRIO satell ite dLll ing the low sunspot activity peri od of 1984-85, are used in the present st ud y. The data are scaled at every IS-min in te rv als an d l Ee (N- r ) is co m- d . h . Q KMNT Q pute uSing t e rel at ion = ) ' where is the J- " FR in degree s, K = 2. 36 X 10 4 MKS un its , NT = f Ndh , o th e integrated l Ee in a ve rti cal column of unit cross- section up to (he sa tellite alti tud e, M be in g H cos e sec X and f is th e sate ll ite tr ans mi ssion fr equ ency in MHz . 3 Results 3.1 The va riation of lEe dur ing high an d low sunspot act iv ity periods With a view to compar·ng. the beh a vio ur of he di -
Transcript
Indian Journal of Radio & Space Physics Vol. 31 , February 2002, pp. 15-20
Diurnal , seasonal and solar cycle variations of ionospheric electron content over an Indian low latitude station, Waltair
o s v V 0 Prasad & P V S Rama Rao*
Department of Physics, Andhra Uni versit y, Visakhapatnam 530003
Received 18 December 2000; revised 24 A/lgust 2001; accepted 3 October 2001
The diurnal, seasonal and solar cyclc variations of the ionospheri c electron content (lEe) during both hi gh ( 1979-80) and low ( 1984-85) sunspot ac tivity periods at a low latitude station. Waltair (I7.7° N. 83 .3°E) have been studied. The diurnal variation shows noon bite-out and post-sunset enhancement in lEe during equinoctial and winter months of hi gh sun spot ac ti vit y period. The seasonal variation shows minimum lEe during each of the loca l hours of the day of low sunspot ac tivity period compared to those in the corresponding hours of hi gh sunspot activity period. The results on the diurn al variation of lEe, parti cu larly, during the post-sunset hours of hi gh sunspot act ivity period are discussed in relati on to the effec t of E x B drift at the equator.
1 Introduction The effect of the ionosphere on very high fre
quency radio waves has been studied for many years using the radio signals from the artificial earth satellites. These studies are of primary importance for the evaluation of communication and navigation systems involving the use of the space vehic les, and in additi on, they also provide va luable info rmation on the properties and behav iour of the ionosphere.
The advent of geostationary satellites has made possible con tinuous recording of Faraday rotation (FR) which is used in computing the electron content of the ionosphere (IEC) from many fixed locations on the earth. It is generally observed that lEe at a station varies from hour to hour, season to season and year to yea. It is found that among the several fac tors that affect the columnar electron content of the ionosphere, the most important ones are: (i) variation of solar zenith angle. causing both diurnal and seasonal variation in lEe and (ii ) sunspot activity changes in lEe, related to the changing level of so lar ionizing radiations. Studies on diurnal and seasonal va ri ation of lEe as measur~d from geostationary satellites were made and are summarized in some excellent reviews l
-5
•
In the recent past, Tyagi and Das Gupla6 and lyer7 have reviewed the resu lts of beacon satellite stud ies with particu lar reference to the Indian sector.
It is known that lEe shows marked yariation with the geograph ic location of the observing stati on . The
*Emeritus Scienti,t. C. IR
present station, Wallair (17 .7° N, 83 .3°E, 200N dip) is situated at an intermediate location between the equator and the equatorial anomaly crest region . A study on the characteristics of lEe fo r this station helps in understanding the representative behaviour of the ionosphere both in the low and equatorial lati tude regions. In thi s paper, the diurna l, seasonal and solar cyc le variations of lEe at the low latitude stati on, Waltai r, are presented.
2 Data and method of analysis Faraday rotation (FR) data obtained continuously
rou nd the clock over Waltair, using the 136.1123 MHz beacon transmissions from the ETS-IJ satelli te during the high sunspot acti vity period of 1979-80 and the \36. 14 MHz beacon transmissions from the SIRIO satell ite dLlling the low sunspot activity period of 1984-85, are used in the present study. The data are scaled at every IS-min intervals and lEe (N-r) is com-
d . h . Q KMNT Q pute uSing t e relation = ) ' where is the J-
" FR in degrees, K = 2.36 X 10⁴ MKS un its, NT = f Ndh , o
the integrated lEe in a verti cal column of unit crosssection up to (he satellite alti tude, M being H cos e sec X and f is the satell ite transmission frequency in MHz.
3 Results 3. 1 T he va r iation of lEe during high and low sunspot act ivity
periods
With a view to compar·ng. the behaviour of he di -
16 INDIAN J RADIO & SPACE PHYS, FEBRUARY 2002
umal features during the two different sunspot act ivity periods, the monthly mean diurnal variation plots of lEe during the three different seasons for the high (1979-80) and low (1984-85) sunspot activity periods are presented in Fig. I. Signi ficant dependence of lEe on the level of sunspot activity is evident from these plots. It is interesting to note that the day minimum level in lEe during both the sunspot activity periods and the local times of its occurrences are more or less the same, except during the months of October and November, where the day minimum levels are slightly (about 2 to 3 lEe units) higher during the high sunspot activity period.
From a comparison of the nighttime levels of ionization, particularly , between 0000 hrs LT and 0500 hrs LT, it is observed that during the high sunspot activity periods, the nighttime lEe values are sometimes high, indicating a strong nighttime maintenance of the ionization during the high sunspot activity period. In contrast to the above feature, the ionization remains nearly constant at the day-minimum level, during most of the nighttime hours of the low sunspot activity period.
The morning build-up of ionization during the high sunspot activity periods is rapid and steep resulting in
higher (95-55 lEe units) values of day maximum, whereas during the low sunspot activity period, the build-up is gradual and slow resulting in lesser (40-25 lEe units) day maximum values of IEe, indicating a strong sunspot control on the levels of ionization. The build-up rate in the morning hours (between 0900 hrs LT and 1100 hrs L T) vary from 3 to 6 lEe units/h during the low sunspot activity period, whereas during the high sunspot activity period, the build-up rates vary from 8 to 18 lEe uni tslh .
However, the decrease in the slope of the forenoon build-up region (0600-1200 hrs LT) with decrease in the sunspot activity indicates that the rate of production of ionization is positively correlated with the sunspot activitl. From IEe measurements made at Rajkot (a station close to anomaly crest region, 22°N), Modi and Iyer9 reported that higher values of daytime peak lEe are seen for any corresponding month of high sunspot year as compared to low sunspot year. But, in winter and summer months of low sunspot year, day time peak IEe values are almost the same. While in high sunspot year, the winter va lues of lEe are considerably higher than those in summer.
The noon bite-out features in lEe observed during the high sunspot activity period are not seen during
ETS - II (130oE), SIRIO (6S0 E)
)(
c5 UJ
100
80
- HIGH SOLAR ACTIVITY PERIOD (1978 TO 1982) ... _. LOW SOLAR ACTIViTY PERIOD (1983 TO 1985)
100 MAY JUN. JUl AUG
80
60
40
20
0 100
60
40
20
0 100
FEB 80
60
40
20
20 24°
TIME, hrs LT Fig. I-Monthly mean variation of IEC during high and low sunspot activi ty periods
N
E ....., Qi
<0 ~o ,...
)(
c5 UJ
t
..
j//,~, if' ;-~. ~""'V r i i( '<: ~ A N r) -, , ', r . -1 ' l) ( . CC. 0"<4 .• ,, . ... . .. _.
G ~ ,-j .... ~\,... I L). , '9 ,- , I " , ,],.'" "rl .. , .. c' / '-" Y1 ~ "-
PRASAD & RAM A RAO: VAR IATIONS OF IEC OVER WAL TAIR
the low sunspot activity period (Fig. 1). This could be due to a significant reduction in the strength of the equatorial anomaly and lack of transport of plasma over the off-equatorial regions like Waltair. From the electron content measurements made at a unique network of stations covering dip-latitudes of OON and 25°N during the ATS-6 period of low sunspot activity (1975-76), Rastogi and Klobucharlo reported that the daily variation of IEC at either the equatorial station, Ootacamund or at a station close to the crest region, Ahmedabad, or even at a station poleward of equatorial anomaly, Patiala, showed no indication of noon bite-out in lEe.
The other interesting region in the diurnal variation curves is the mid-afternoon region. During the high sunspot activity period, the decrease in IEC is equally faster as that of build-up but often followed by a postsunset enhancement in IEC, particularly, during equinoctial and winter months. This phenomenon has been explained on the basis of the combined effect of an increase in the post-sunset vertical drift of ionization at the equator with a simultaneous increase in the
. equatorward neutral wind velocity during the postsunset periods giving rise to the accumulation of ionization over the sub-tropical latitudes like Waltair ll . Interestingly enough, this feature of post-sunset increase in ionization is absent during the low sunspot activity period when the post-sunset vertical drift is small or absent. It is known from the vertical drift measurements l2 at the equatorial regions, the postsunset vertical drift is significant during the high sunspot activity period and is absent or insignificant during the low sunspot activity period, justifying the observed differences in the phenomenon of postsunset increase in ionization during the above two sunspot activity periods.
3.2 Diurnal variation of IEC during low sunspot activity period-A comparison with similar Indian data
The monthly mean variation of IEC during the low sunspot activity period for each of the twelve months is presented in Fig. 1. The time scale corresponds to the local time of the longitude of Waltair (83.3 °E). These plots typically show (i) a broad day minimum, (ii) gradual and slow morning increase in IEC, (iii) a broad mid-afternoon maximum in lEe. It is seen from Fig. 1 that the day minimum vary between 3 and 6 IEC units (l IEC unit = 10 16 eI./m2) reaching the lowest value around the local time of 0500 ± 1 h depending on the season of the year. Similar features are also
~ :t}1~\~ ~~ \ ' ...... - '-r .~-
" .... \. . ;..... ~ J..... ' \
reported by Rastogi et al. 13 from the low sunspot activity period data of ATS-6.
The build-up of ionization starts around 0600 hrs LT, gradually reaching the maximum by about 1100 hrs LT, from where the IEC continues to fluctuate around this level until it starts decreasing by about 1700 hrs LT, Thus, the day maximum is broad and, is of about 6 h duration. The hour at which IEC reaches its diurnal peak has been found to vary from day to day and with sunspot activitl. Although the sunspot activity is considerably low (Rz = 30 to 10) during this period (1984-85), the spread in the electron content is comparable l4 with that observed in the data of high sunspot activity. The monthly mean day maximum value of ionization vary from 39 to 26 IEC units during the low sunspot activity period. The IEC starts decreasing from about 1700 hrs L T and reaches its minimum level by about 2200 hrs LT, from where it shows a slow decrease before it reaches the day minimum around 0500 hrs L T.
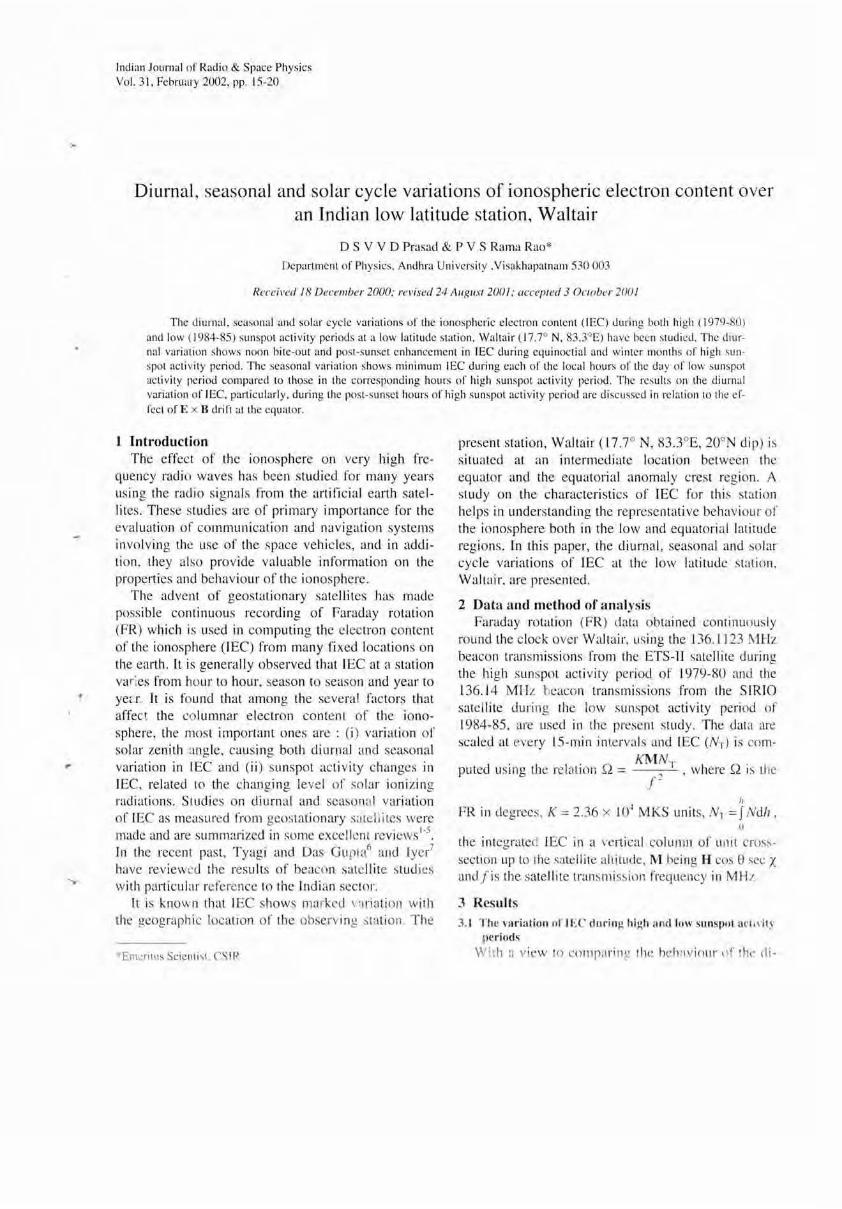
The diurnal behaviour of IEC at Bombay (18°N) during ATS-6 Campaign (1975-76) is compared in conjunction with the IEC data of Waltair (l7.rN) for a similar sunspot activity period 1984-85. The monthly mean diurnal variation plots of IEC obtained from Bombay for the year 1975-76 are presented along with similar plots of Waltair for the year 1984-85 in Fig. 2. Figure 2 shows nearly similar variation of IEC at both the stations, except that the IEC values of Bombay are slightly lower (by 3-5 IEC units) than those over Waltair. This may be attributed to the difference in the average sunspot number, which is slightly higher (Rz=22) during 1984-85 than the corresponding values (Rz= 17) of 1975-76. Thus, the general features in the diurnal behaviour is interestingly simi lar at the two different longitudes (Waltair
83.3°E; Bombay 73°E) and nearly same latitudes (Waltair 17.7°N; Bombay 18°N) during two different solar cycles of low sunspot activity conditions.
3.3 Seasonal variation of lEe The behaviour of IEC undergoes appreciable
changes in the different seasons of the year due to changes in the solar zenith angle. The season-wise diurnal variation of IEC for the three different seasons, namely equinox, winter and summer for the two sunspot activity periods is presented in Fig. I. The general features of IEC along with the post-sunset enhancements in IEC are seen during high sunspot activity period. During the high sunspot activity
18 INDIAN J RADI O & SPACE PHYS. FEBRUARY 2002
SIRIO (1984-85)
WALTAIR (17.7° N)
ATS - 6 (1975-76)
BOMBAY (t8°N)
'" E ....., Q)
lD
~O
.>< <5 w ~[~
40 APR ,
20
°0 04
'I ,-,-
" 08 12 16 20 24
WlNlER N('N,
FEB ,
~MER
~ --
" " ,; , " , " /' '-•
~ ,- ----, , , , -~
r~ ~-~ o 04 08 12 16 20 24
TIME, hrs LT Fi g, 2-Monthl y mean diu rnal va riation of IEC fo r the two low sunspot ac ti vity periods
period , the day max imum vary from 60 to 82 lEe units during equinox followed by winter (75 lEe units),
The post-sunset increase in lEe , peaking around 2200 hrs L T, is clearly seen in all the seasons of high sunspot activity period except during the summer months , The day minimum is consistently of short duration in all the three different seasons during the high sunspot acti vity period, The midnight values of lEe during the hi gh sunspot acti vi ty period are as hi gh as 50 lEe units during equinox and 40 lEe units during winter and is minimum (about 20 lEe units) during summer months, Further, the monthly mean lEe values in winter are about 20% greater than those in summer. Modi and lyer9 from the lEe measuremenrs made at Rajkot reported that the monthly mean lEe values in winter are about 29% greater than those in summer, clearly bringing out the effect of seasonal anomaly,
From the seasonal average diurnal plots of the low sunspot activity period presented in Fig, 1, it is seen that the lEe during all the local hours of the day is lower as compared to the corresponding values of the high sunspot activity period , The day maximum val-
ues of lEe during low sunspot ac tivity period varied from 40 lEe uni ts during winter and equ inoxes to 25 lEe units during summer months, The nighttime lEe curves during low sunspot activity period (unlike those in high sunspot activity period) are mostly flat and constant at the day minimum level. No significant nighttime increases in lEe are seen during low sunspot activity period, The absence of these post-sunset increases in lEe has already been explained in Sec, 3, I.
3.4 Solar cycle varia tion of IEC
The lEe undergoes appreciable change in differen t sunspot activity conditions, The monthly mean diurnal plots for a period of 8 years (1978-1985) covering the increasing and decreas ing epochs of the sunspot activity are also presented in Fig, I. It is seen from Fig, 1 that there is a gradual decrease in the values of lEe from year to year as the sunspot activity decreases. This feature is significantly visible, parti cularly, in the midnight and midday lEe values. The post-sunset enhancement in lEe is also seen to be gradually disappearing with the decreasing su nspot activity,
t
PRASAD & RAMA RAO: VARIATIONS OF IEC OVER WAL TAIR 19
The monthly mean day-maximum values of IEC for each of the months from 1978 to 1985 are presented in Fig. 3 along with the corresponding sunspot number (Rz) to see the dependence of IEC on sunspot number. The general trend of variation in IEC follows that of the monthly mean sunspot number, showing a strong solar control on the electron density of the ionosphere.
4 Discussion The prominent features of the diurnal and seasonal
variations of IEC during solar maximum and minimum periods are clearly brought out for a low latitude stat ion, Waltair, in the Indian sector. In general these features agree with similar results reported from other locations 15 around the same period. The outstanding features are : (i) slower rate of change of IEC after sunrise in summer, (ii) tendency for increase in postsunset enhancements in IEC during equinoctial and winter months, and (iii) seasonal anomaly in terms of IEC variations, winter values being larger than those in summer, similar to those observed at Calcutta l6 and Haifa l
?
The post-sunset enhancement in IEC is interpreted as due to the fountain effect pattern of plasma motion from the equatorial regions along the earth's magnetic lines of force. In the equatorial region, polarization of electric fields produces large upward drift of electrons at sunset resulting in a rapid lifting of the F-layer and massive field aligned flow of plasma I8
.19
. Model calculations by Das Gupta et al. 14
, incorporating a postsunset enhancement in upward E x B drift, which is a characteristic feature20 during solar maximum, revealed the post-sunset 1I1creases in IEC at low lati-
CL CJl Z :l CJl Z 50 <X: W ;:;E ... .. . . .. . . . .. ,...
. ..
. . . . . . .. .
.. ..
150
100
50
. . .. O~~-U_~~-~-L-~~~-~~~o
o 20 40 60 80 100 120
tEem." x 10'· el./m2
Fig. 3-Variation of monthly mean day maximum values of IEC at Waltair with the sunspot number (Rz) during the period 1978-1985
tudes. These post-sunset increases of IEC noticed in equinoctial and winter months of high sunspot activity period are the manifestations of the post-sunset equatorial anomaly. In addition to the above mechanism, the zonal and meriodional components of the prevailing neutral winds playa role in producing this phenomenon as reported by Anderson and Klobuchar2o
, Garg et a/. 21 and Bhuyan22•
Sant Prakash23 reported that at low latitude stations like Hawai, secondary maximum effect in IEC is more pronounced in winter than in any other season and suggested that the influx of ionization from proto nosphere and winds are responsible for the enhancement of ionization . Titheridge24 attributed the nocturnal increase in IEC to a nighttime source of ionization . Singh and Gurm25 suggested that the increase in IEC corresponds to an increase in the strength of the solar EUV flux at low latitude, while Rama Rao et al. 26
attributed that the nighttime enhancement in lEe at low latitudes is due to the inverse fountain effect. Thus, it may be concluded that the post-sunset enhancement in IEC, during winter and equinoctial months of moderate to high sunspot activity periods, is a consequence of the increase in the post-sunset vertical drift l
1.l2 at the equator coupled with an in
creased equatorward meridional wind velocity.
References I Rastogi R G & Sharma R P, PLanet & Space Sci ( UK). 19
(1971) 1505. 2 Rastogi R G, Sharma R P & Godhan V S, Planet & Space
Sci (UK), 21 (1973) 713. 3 Evans J V, J Geophys Res (USA), 73 ( 1968) 3489. 4 Davies K, Space Sci Rev (UK), 25 (1980) 357. 5 Somayajulu Y V, Proceedings of the International Sympo
sium on Beacon Satellite Studies of the Earth 's Environment , New Delhi, edited by T R Tyagi, 1983, p. 99.
6 Tyagi T R & Das Gupta A, Indian J Radio & Space Phys, 19 (1990) 424 .
7 Iyer K N, Indian J Radio & Space Phys, 22 (1993) 277 . 8 Bhuyan P K, Indian J Radio & Space Phys, 21 (1992) 170. 9 Modi R P & Iyer K N, Indian J Radio & Space Phys, 18
(1989) 23 . JO Rastogi R G & Klobuchar J A, J Geophys Res (USA). 95
(1990) 19045. II Rama Rao P V S, Niranjan K, Ramana Rao B V, Rao B V P
S & Prasad D S V V D, Proceedings of the URSIIIPS Conferen ce on the Ionosphere and Radio Wave Propagation, Sydney, Australia, 1985.
12 Woodman R F, J Geophys Res (USA). 75 (1970) 6249. 13 Rastogi R G, Sethia G, Chandra H, Deshpande M R, Davies
K & Murthy B S, J Atmos & Terr Phys (UK). 41 (1979) 561. 14 Rama Rao P V S, Ramana Rao B V, Nru D, Rao B V P S &
Rao M S, Low Latitude Aeronomical Proceedings, CaSPAR Symposium Series 8, 1979, p. 153.
20 INDIAN J RADIO & SPACE PHYS. FEBRUARY 2002
15 Vijay S K. Manjesh Singh & Gwal A K, Indian J Radio & Space Phys. 20 (199 1) 6 1.
16 Das Gupta A, Anderson D N & Kl obuchar J A, J Atmos & Ten Phy.\' (UK). 47 ( 1988) 9 17.
17 Soicher H, Klobuchar J A & Doherty P H, Radio Sci (USA). 19 ( 1984) 757.
18 Ri sbeth H, J Allnos & Terr Phys (UK). 39 ( 1977) 1159. 19 Woodman R F, Rastogi R G & Calderon C, J Geophys Res
(USA) . 82 ( 1077) 5257. 20 Anderson D N & Klobuchar J A, Proceedings of the Inter
lIatiollal Beacoll Satellite SymposiulII on Earth's Enviroll -
ment, New Delhi , edi ted by T R Tyagi, 1983, p. 151. 2 1 Garg S C. SomaYl~ulu Y V. Lakha Singh. Tyagi T R, Pro
ceedings of the International Symposium on Beacon Satellite Studies Oil the Earth's Environment. New Delhi , 1983. p. 359.
22 Bhuyan P K, Acta Phys Hung (Hungary). 73 ( 1993) 35. 23 Sant Prakash, Indian J Radio & Space Phys. 5 ( 1970) 336. 24 Titheridge J E, Plallet & Space Sci ( UK) , 21 ( 1973) 1775. 25 Singh M & Gurm H S, Indian J Radio & Space Phys, 8
(1979) 306. 26 Rama Rao P V S, Nru D & Srirama Rao M, Proceedings of