Corresponding Author: Showket A. Dar, SKUAST-K pin code: 190006, PG Boys Hostel, SKUAST-K, Srinager, J&K.Cell: +919858753492, Fax: +91194-2262207.
62
Diversity and Richness Indices and the Whittaker Plot Value of InsectPollinators of Peach Prunus persica in Landscapes of Temperate India
Showket A. Dar, G.M. Mir, M.A. Parry, S.B. Ahmad, M.A. Ganie,1 1 1 1 1
T.A. Raja, M. Yaqob, R. Khrusheed and S.H. Parry3 1 1 1
Department of Entomology; Sher-e-Kashmir University of Agricultural Science and Technology,1
Shalimar, Jammu and Kashmir-India-190025Fruit Science, Sher-e-Kashmir University of Agricultural Science and Technology,2
Shalimar, Jammu and Kashmir-India-190025Statistices, Sher-e-Kashmir University of Agricultural Science and Technology,3
Shalimar, Jammu and Kashmir-India-190025
Abstract: The doctorial study was carried out in temperate conditions of Kashmir Valley during 2013-2014.The patches of fruit crop selected were located in different types of landscape categories of Valley. The highestspecies richness of 46 was observed in landscapes of Budgam, belonging to 5 orders, 31 families and 20 generaof class Insecta. Of all these insects, genus Lassioglossum was most abundant flower visitor followed bycomparatively less abundant genera Xylocopa spp. andrena spp., Megachile spp., Syrphus spp. and Muscaspp. The minimum value of Simpson diversity index, Shannon diversity indices and Simpson’s dominance were5.415, -6.056 and 0.8115, respectively in district Srinager. The species richness of pollinators varies fromminimum of 32 (Srinager) to maximum of 46 (Budgam). The equitability of species varies form minimum of0.718 in Srinager to maximum of 0.931 on in Pulwama. The Pielou’s evenness, Nakamaru’s richness, Menhinick’sand Margalef’s varies across the different landscapes. Species richness showed a corresponding and parallelincrease with various indices estimated. The unequal distribution of abundance between species on three fruitcrops allow the use of dominance index of Berger-parker to express the proportion of individuals accounted forby the most abundant species (Lassioglossum marganatum) in each site of investigation and it varies fromminimum of 0.087 in Pulwama to maximum of 0.121 in Srinager. The dissimilarity coefficient of species richnessvaries from 11.00 to 19.83 during 2013 and 2014, respectively. The order Hymenoptera was most abundant withrank (K) one and K-dominance of 0.602 followed by Diptera with rank value 2 and K-dominance value -1.259and so on.
INTRODUCTION a vital ecosystem service and the strong effect of insect
Diversity of insect pollinator community significantly result of complementary behaviour of the variousaffects the pollination of important agricultural crops functional groups, their richness and abundance. From[1]. Insect pollination is one of the most important conservation point of view, the nesting behaviour,mechanisms in the maintenance and promotion of resources and sites has emerged a factor potentiallybiodiversity and in general, life on Earth. Many governing the pollinator community [3] in ecosystem.ecosystems, including agro ecosystems, depend on The stone fruit crops require only one viable pollen tubepollinator diversity to maintain overall biological diversity to produce a fruit and in most cases the pollen shouldand benefit the society by increasing food security and arrive from another compatible blossom at the right timeimproving the livelihoods [2]. Since, insect pollination is [4], for that the insect pollinator diversity is important to
pollinator diversity on the degree of pollination may be a
Acad. J. Entomol., 9 (4): 62-73, 2016
63
bear a satisfactory commercial yield. Generally, there are Syrphid sp. [13]. Wild, unmanaged pollinators arethree types of diversity i.e., alpha (á), beta (â) and gamma effective, often critical contributors to pollination services(ä) diversity. However, there are different types of insect in natural and managed crop systems [14]. Of these,pollinators like bees, wasps, ants, flies, butterflies, moths native bees are most important pollinator group and theirand beetles. In Kashmir valley (33°46’N, 74°49’E, 6275m) conservation has risen in tandem with honeybee declineamong the wild pollinators, the families viz. Helictidae, [15,16]. Wild bees have complex habitat requirements andEmpididae, Muscidae, Bibionidae, Pieridae, are the best indicators of overall species richness inSarcophagidae, Calliphoridae, Cathophgidae, Syrphidae agroecosystems [17].and Tenthredinidae were found abundant [5], indicating In spite of Honey Bee Act of 1922 and thethat pollinators other than honey bees are extremely subsequent Honey Bee Restriction Act of 1923, whichvaluable for fruit crop pollination. Further, the studies in decreed how honey bees could be housed, problemsKashmir (SKUAST-K) valley on pollinator diversity began to plague the honey bees. Beehives beganindicated that Helictid species viz, Lassioglossum disappearing [18] and beekeepers began losing vastmarganatum [6] and L. himalanysis [7] were abundant numbers of managed hives. In the meantime feral hivespollinators on stone fruit crops, respectively. Abrol [8] almost completely disappeared and by 1994, over 98% ofshowed that Hymenopteran bees are high in richness in the feral colonies were eliminated [19]. The shortage ofhorticultural ecosystems of Jammu (SKUAST-J). A total bees, especially for stone fruit pollination became soof 30 morphospecies from order Hymenoptera were severe that in 2005 the Honeybee Act of 1922 was alteredobserved belonged to families Apidae, Megachilidae to allow importation of bees from outside of Northandrenidae, Colletidae and Halictidae. The species America [20]. Keeping these losses into consideration,composition amongst different non-Apis bees showed researchers are looking for domestication and providingthat families viz, Apidae, Megachilidae and Halictidae habitat, as an alternative ways of using wild bees in placeconstitute 17, 9 and 2 different morphospecies, of honey bees [21]. Bees are the main crop pollinators inrespectively. Whiles, families’ viz. Andrenidae and the United States and about 35 % of world cropColletidae were represented by one morphospecies each. production depends on the pollinators [22]. Six species were found to be exclusively abundant in hilly In Kashmir division of state Jammu and Kashmirareas and 19 species abundant in the plains. However, (India), the stone fruit crops viz, Cherries (Prunus avium),only 5 species were observed from both landscapes. The plums (P. domestica), peaches (P. persica) and almondMegachilidae and Apidae were found to be distributed (P. amygdales) make up the common stone fruitsequally and represented by 9 morphospecies each. produced commercially in valley. All varieties of sweet
Wild bees can be more effective and extremely cherries and most plums, peach and almond varieties, arediverse with more than 20,000 pollinator bee species self-unfruitful [23], therefore depends on insects for cross(Hymenoptera: Apidae) described worldwide [9]. pollination to produce a good quality and quantityHowever, in present investigation a total of 46 different commercial crop. Keeping in view the importance of insectpollinators were observed on peach (Prunus persica). pollinator’s in stone fruit pollination no systematic workIn agro-ecosystems of Himalayan region of 2200 to 3000 has been done in the Himalayan region till date. Therefore,meter above mean sea level, the pollinator’s diversity of the present study will be designed to study the diversitystone fruits comprise of Osmia cornifrons (Panzer), of insect pollinator’s of stone fruits (P. persica) inAnthophora niveocincta (Smith), Anthophora landscapes of Kashmir Valley during 2013-2015.himalayensis (Rad), Anthophora crocea (Bangham),Bombus tunicatus (Smith), Xylocopa dissimilis (Lepel), MATERIALS AND METHODSXylocopa rufescens (Smith) andrena harrietae (Bangham)and Andrena anonyma (Cam) [10]; Osmia rufa (Penzer), Study Area and Sites: Jammu and Kashmir State of IndiaEristalis tenax (Linnaeus), Episyrphus balteatus (De is located in North-eastern of India. Geographically it isGeer) and Halictus (Latreille) [11]; Andrena (Fabricius), stretched between 32° 17" to 37° 60" N latitude and 73°Amegilla (Fabricius), Ceratina (Latreille); Ceratina 26" to 80° 30" E longitudes. The mountain range in theheiroglyphica (Smith) [8] and Xylocopa violacea [12]. In Himalayas region varies in altitude between 5,550mthe horticultural ecosystem of India the blossoms of on North-east dip down to about 2,770m on South.cherry, were found to be visited by Apis cerana Generally, the Kashmir contains the upper stages of the(Fabricius), A. mellifera (Linnaeus), Helictid sp. and forest vegetation and lower stages of agricultural and
Acad. J. Entomol., 9 (4): 62-73, 2016
64
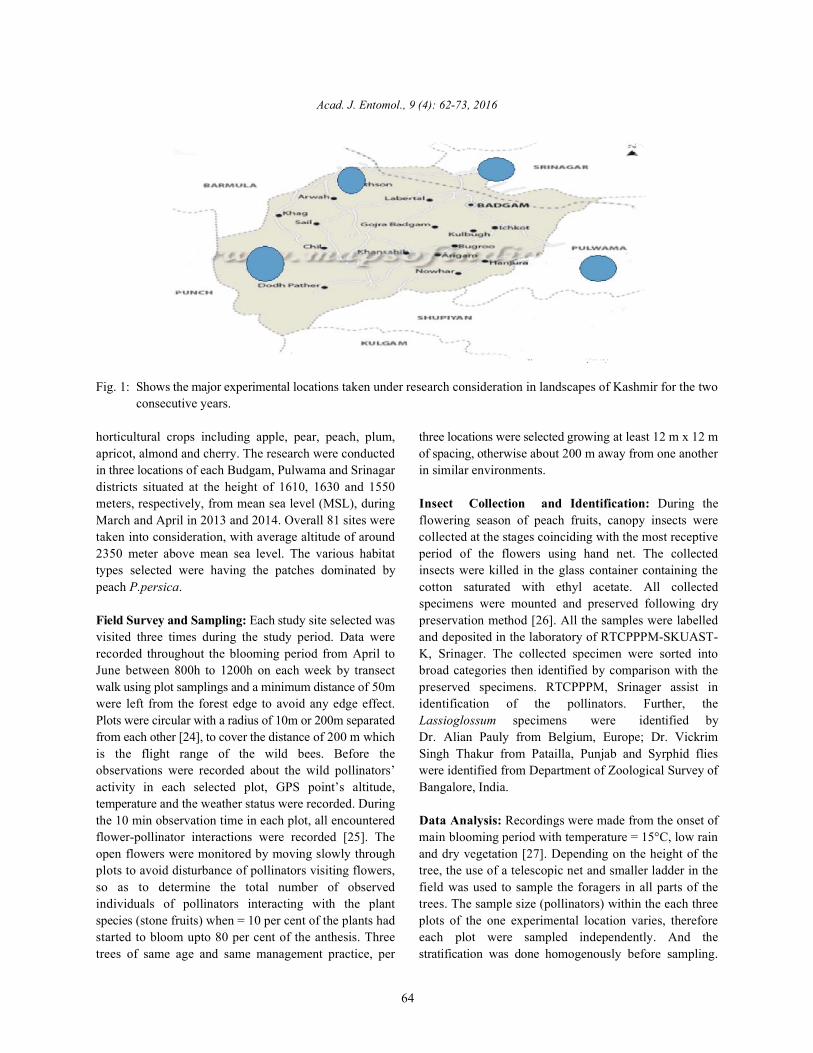
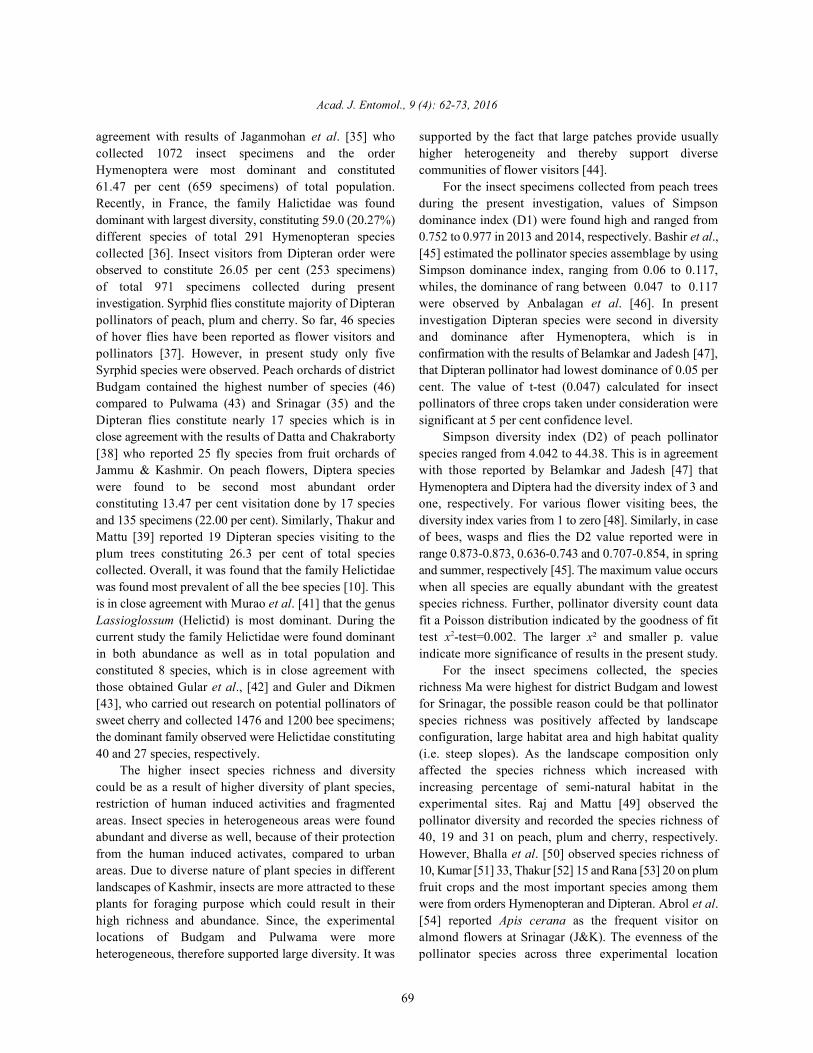
Fig. 1: Shows the major experimental locations taken under research consideration in landscapes of Kashmir for the twoconsecutive years.
horticultural crops including apple, pear, peach, plum, three locations were selected growing at least 12 m x 12 mapricot, almond and cherry. The research were conducted of spacing, otherwise about 200 m away from one anotherin three locations of each Budgam, Pulwama and Srinagar in similar environments.districts situated at the height of 1610, 1630 and 1550meters, respectively, from mean sea level (MSL), during Insect Collection and Identification: During theMarch and April in 2013 and 2014. Overall 81 sites were flowering season of peach fruits, canopy insects weretaken into consideration, with average altitude of around collected at the stages coinciding with the most receptive2350 meter above mean sea level. The various habitat period of the flowers using hand net. The collectedtypes selected were having the patches dominated by insects were killed in the glass container containing thepeach P.persica. cotton saturated with ethyl acetate. All collected
Field Survey and Sampling: Each study site selected was preservation method [26]. All the samples were labelledvisited three times during the study period. Data were and deposited in the laboratory of RTCPPPM-SKUAST-recorded throughout the blooming period from April to K, Srinager. The collected specimen were sorted intoJune between 800h to 1200h on each week by transect broad categories then identified by comparison with thewalk using plot samplings and a minimum distance of 50m preserved specimens. RTCPPPM, Srinager assist inwere left from the forest edge to avoid any edge effect. identification of the pollinators. Further, thePlots were circular with a radius of 10m or 200m separated Lassioglossum specimens were identified byfrom each other [24], to cover the distance of 200 m which Dr. Alian Pauly from Belgium, Europe; Dr. Vickrimis the flight range of the wild bees. Before the Singh Thakur from Patailla, Punjab and Syrphid fliesobservations were recorded about the wild pollinators’ were identified from Department of Zoological Survey ofactivity in each selected plot, GPS point’s altitude, Bangalore, India.temperature and the weather status were recorded. Duringthe 10 min observation time in each plot, all encountered Data Analysis: Recordings were made from the onset offlower-pollinator interactions were recorded [25]. The main blooming period with temperature = 15°C, low rainopen flowers were monitored by moving slowly through and dry vegetation [27]. Depending on the height of theplots to avoid disturbance of pollinators visiting flowers, tree, the use of a telescopic net and smaller ladder in theso as to determine the total number of observed field was used to sample the foragers in all parts of theindividuals of pollinators interacting with the plant trees. The sample size (pollinators) within the each threespecies (stone fruits) when = 10 per cent of the plants had plots of the one experimental location varies, thereforestarted to bloom upto 80 per cent of the anthesis. Three each plot were sampled independently. And thetrees of same age and same management practice, per stratification was done homogenously before sampling.
specimens were mounted and preserved following dry
Acad. J. Entomol., 9 (4): 62-73, 2016
65
The plots of every experimental location (strata) were RESULTSmutually exclusive. The strata are collectively exhaustiveand no population element was excluded. The Stratified The present study was carried out in three SouthernRandom Sampling was applied within each stratum. and western area of the valley close to the forest areasFurther each population per strata was its representative. and the location selected for the experiment were mostlyAnd the arithmetic mean of the population was done to from craves with dryland type topography which isdetermine the variability/exp. Location (strata). Various comparatively rich in diversity of insect pollinators. Thesoftwares like SPSS, Minitab, R and Axil were used to patches selected from the district Srinagar are mostlyanalysis the data, Poisson distribution, Multiple located in plane areas. The experimental location has aregression analysis, Chi square (x ) test and the T-test variety of weak habitats, both natural and man-made.2
were also used. Natural habitats include social forests, temperate
S.No Index Equation1 Species evenness (E H´= C {log10N - 1/N (log10
nr log10)}2 Pielou, s index (J) H/Hmax.
3 Species richness (Ma) Ma = S-1, Log e N4 Margalef’s index, D S-1/In Nml
5 Menhinick’s diversity index, D S/ NMh
6 Simpson’s dominance (D ) 1/1 P2i
7 Simpson’s diversity index (H) SC = {ni (ni-1) / N (N-1)}I =1
8 Nakamura’s index (M) SRI = R / S (M - I)i
r = i9 The Berger–Parker index (BP) 1/D10 Elucidean distance (d) D = (x -y ) +(x -y ) +(x -y )xy 1 1 2 2 3 3
2 2 2
In order to study the proportion of each specieswithin the local community, species diversity werecomputed based on Shannon- Wiener formula, where H isShannon-Wiener [28] biodiversity index; Pi is theproportion of each species in the sample (relativeabundance); log e Pi is the natural log of Pi; and S is thenumber of species in the pollinator’s community. Speciesevenness (E) measure similarity among different speciesin ecosystem and it estimate the equitability componentof diversity; Species richness (Ma) assess how thediversity of insect populations is distributed or organizedamong the particular species. Simpson’s index (D )2
represents the probability that two randomly selectedindividuals collected in the community belong to the samespecies. It is accounted for both richness and proportionof each species [29]. Nakamura’s index: “M” is the numberof rank of abundance (0, 1, 2, 3…M- I) and “R” is the rankvalue of “i ” species in the sample. The Berger–Parkerth
index (BP) denotes the proportional abundance of mostabundant species (Lassioglossum marginatum).Elucidean distance determines the difference between thespecies observed across the three experimental locationsduring the study period.
deciduous forests, meadows, grass lands, fruit orchardsand vegetable orchards. Grasslands are seen on the upperranges of all experimental locations with mean height asmuch as 1000 m from sea level. The diversity indexes ofShannon, Simpson as well as the evenness index of Pielouassess insect diversity within and between sites. Inaccordance with Magurran [30], the unequal distributionof abundance between species allow the use of thedominance index of Berger-parker, all these indices, werecommonly used in ecological community studies of insectpollinators of peach in current investigation. In total 971insect specimens were collected from peach Prunuspersica during the blooming period (>10 per centblooming) of years 2013 and 2014 from Budgam(281specimens), Pulwama (292 specimens) and Srinagar(398 specimens) experimental locations. About 534specimens collected, were from family Helictidae, thedominant species Lassioglossum marganatum constitutes51.87 per cent (277 specimens) of total Helictid. Insectvisitors from Dipteran order were recorded to constitute26.05 per cent (253 specimens) of the total specimens. Thediversity of insect pollinators/visitors of peach (Prunuspersica) are shown in Table 1.
The taxonomic composition of insect species (Table1)encountered on peach (Prunus persica) trees in Budgamwere found to fall in 46 different species under 5 orders, 20families and 30 genera (Table 2). Among the five ordersobserved, Hymenoptera and Diptera shared maximumspecies 23 and 17, with ranks 1 and 2, respectively.Further, followed by orders Lepidoptera (4 species),Hemiptera (one species) and Odonata (one species) withranks 3, 4 and 5 respectively. About 86.95 per cent species(40 species) were found as active and frequent visitors ofpeach flowers. Of them, Hymenopteran speciesconstituting about 50 per cent, to be significantly activeforagers throughout the day, followed by Diptera andLepidoptera is constituting nearly 36.95 and 8.69 per centspecies, respectively. However, the Odonata constituteonly 2.17 per cent of total species recorded.
Acad. J. Entomol., 9 (4): 62-73, 2016
66
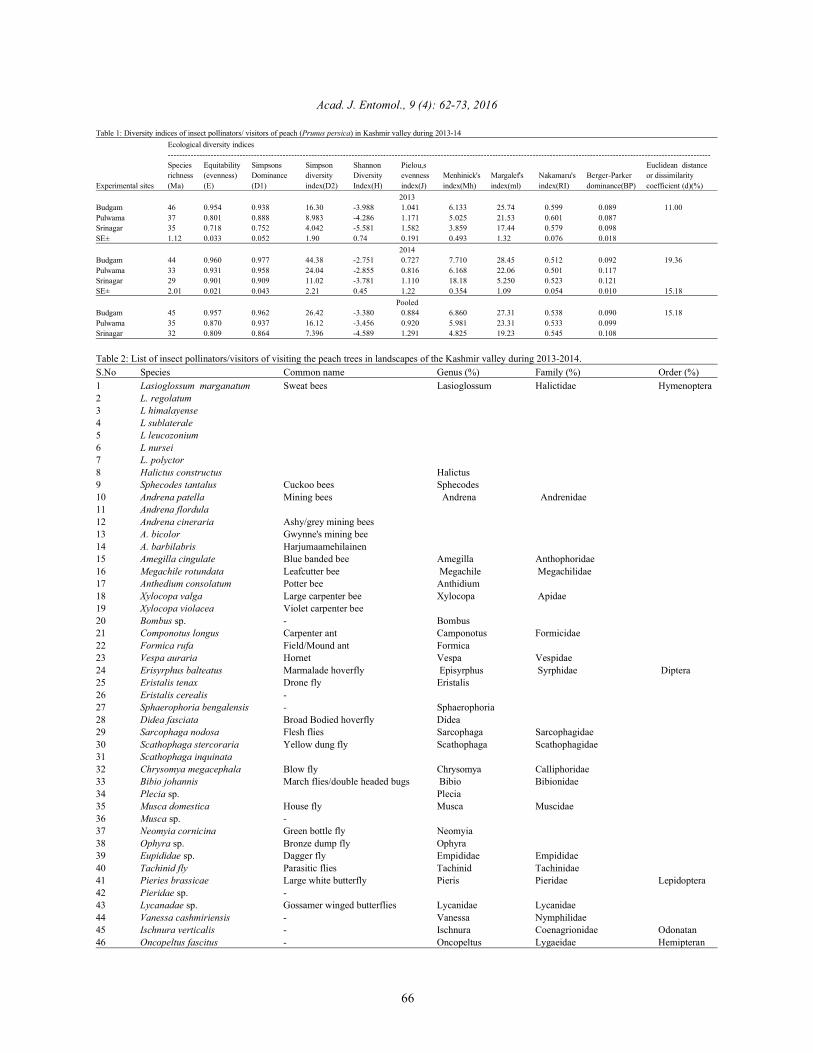
Table 1: Diversity indices of insect pollinators/ visitors of peach (Prunus persica) in Kashmir valley during 2013-14Ecological diversity indices---------------------------------------------------------------------------------------------------------------------------------------------------------------------------------------------Species Equitability Simpsons Simpson Shannon Pielou,s Euclidean distancerichness (evenness) Dominance diversity Diversity evenness Menhinick's Margalef's Nakamaru's Berger-Parker or dissimilarity
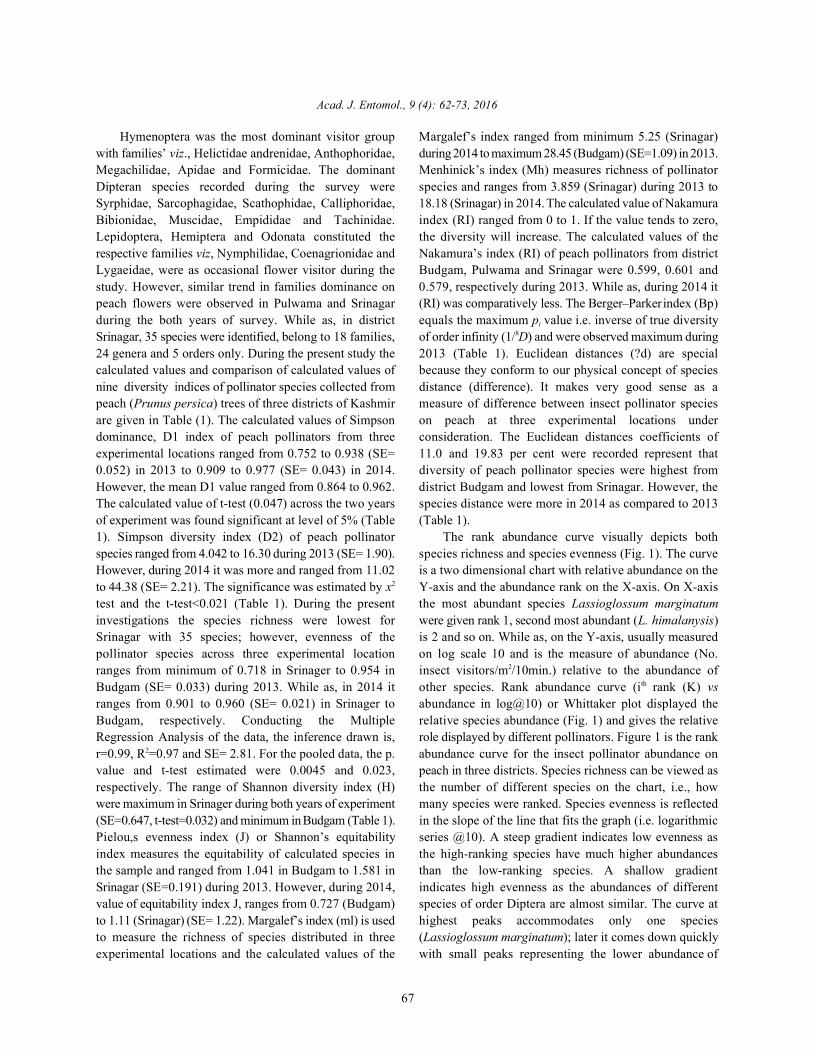
Table 2: List of insect pollinators/visitors of visiting the peach trees in landscapes of the Kashmir valley during 2013-2014.S.No Species Common name Genus (%) Family (%) Order (%)1 Lasioglossum marganatum Sweat bees Lasioglossum Halictidae Hymenoptera2 L. regolatum3 L himalayense4 L sublaterale5 L leucozonium6 L nursei7 L. polyctor8 Halictus constructus Halictus9 Sphecodes tantalus Cuckoo bees Sphecodes10 Andrena patella Mining bees Andrena Andrenidae11 Andrena flordula12 Andrena cineraria Ashy/grey mining bees13 A. bicolor Gwynne's mining bee14 A. barbilabris Harjumaamehilainen15 Amegilla cingulate Blue banded bee Amegilla Anthophoridae16 Megachile rotundata Leafcutter bee Megachile Megachilidae 17 Anthedium consolatum Potter bee Anthidium18 Xylocopa valga Large carpenter bee Xylocopa Apidae 19 Xylocopa violacea Violet carpenter bee20 Bombus sp. - Bombus21 Componotus longus Carpenter ant Camponotus Formicidae22 Formica rufa Field/Mound ant Formica23 Vespa auraria Hornet Vespa Vespidae24 Erisyrphus balteatus Marmalade hoverfly Episyrphus Syrphidae Diptera 25 Eristalis tenax Drone fly Eristalis26 Eristalis cerealis -27 Sphaerophoria bengalensis - Sphaerophoria28 Didea fasciata Broad Bodied hoverfly Didea29 Sarcophaga nodosa Flesh flies Sarcophaga Sarcophagidae30 Scathophaga stercoraria Yellow dung fly Scathophaga Scathophagidae31 Scathophaga inquinata 32 Chrysomya megacephala Blow fly Chrysomya Calliphoridae33 Bibio johannis March flies/double headed bugs Bibio Bibionidae34 Plecia sp. Plecia35 Musca domestica House fly Musca Muscidae36 Musca sp. -37 Neomyia cornicina Green bottle fly Neomyia38 Ophyra sp. Bronze dump fly Ophyra39 Eupididae sp. Dagger fly Empididae Empididae40 Tachinid fly Parasitic flies Tachinid Tachinidae41 Pieries brassicae Large white butterfly Pieris Pieridae Lepidoptera42 Pieridae sp. -43 Lycanadae sp. Gossamer winged butterflies Lycanidae Lycanidae44 Vanessa cashmiriensis - Vanessa Nymphilidae45 Ischnura verticalis - Ischnura Coenagrionidae Odonatan46 Oncopeltus fascitus - Oncopeltus Lygaeidae Hemipteran
Acad. J. Entomol., 9 (4): 62-73, 2016
67
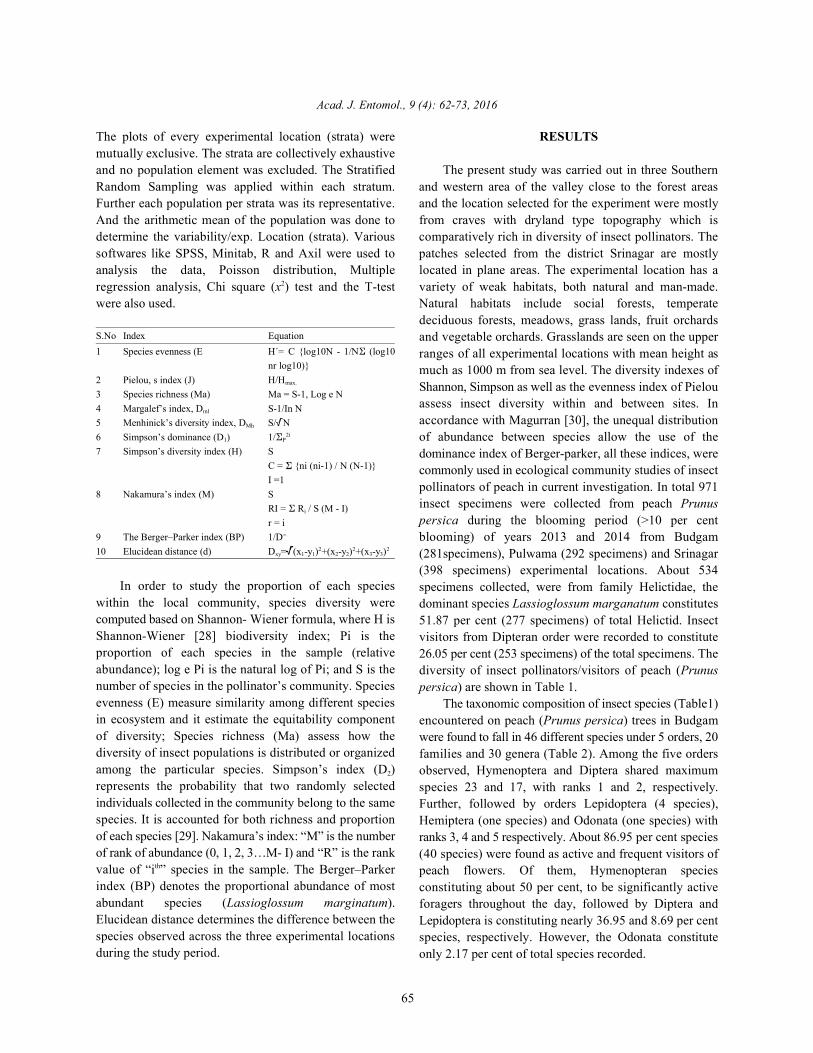
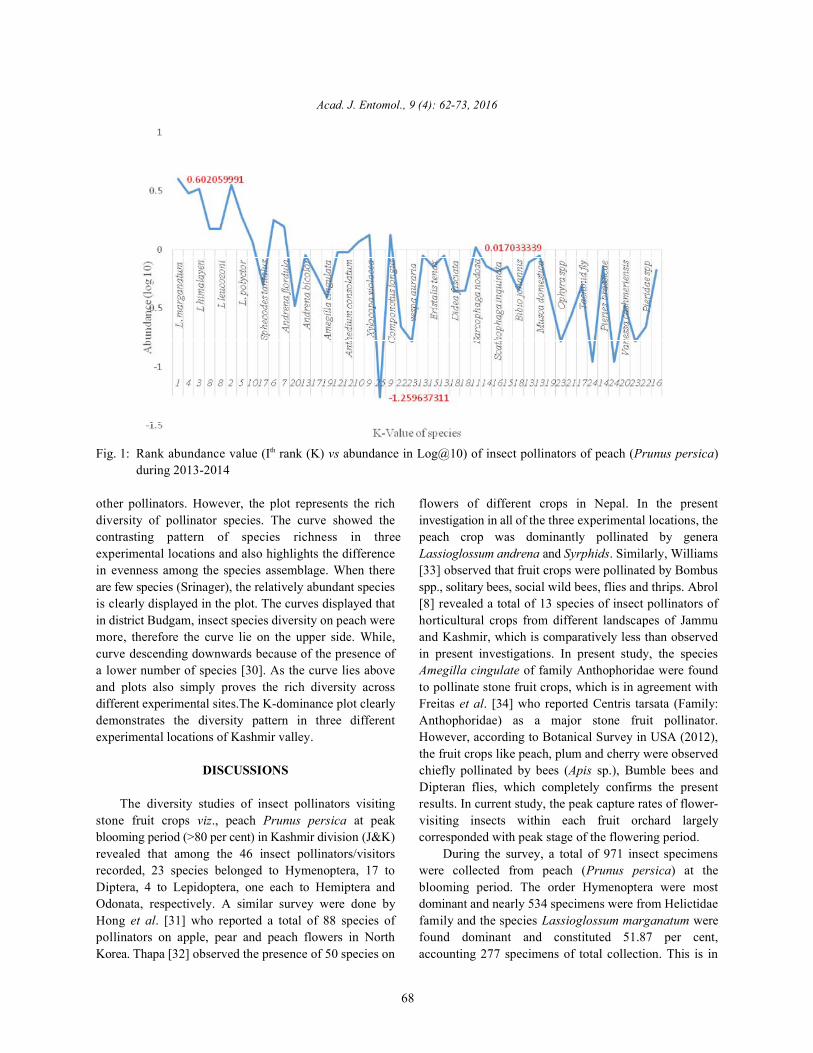
Hymenoptera was the most dominant visitor group Margalef’s index ranged from minimum 5.25 (Srinagar)with families’ viz., Helictidae andrenidae, Anthophoridae, during 2014 to maximum 28.45 (Budgam) (SE=1.09) in 2013.Megachilidae, Apidae and Formicidae. The dominant Menhinick’s index (Mh) measures richness of pollinatorDipteran species recorded during the survey were species and ranges from 3.859 (Srinagar) during 2013 toSyrphidae, Sarcophagidae, Scathophidae, Calliphoridae, 18.18 (Srinagar) in 2014. The calculated value of NakamuraBibionidae, Muscidae, Empididae and Tachinidae. index (RI) ranged from 0 to 1. If the value tends to zero,Lepidoptera, Hemiptera and Odonata constituted the the diversity will increase. The calculated values of therespective families viz, Nymphilidae, Coenagrionidae and Nakamura’s index (RI) of peach pollinators from districtLygaeidae, were as occasional flower visitor during the Budgam, Pulwama and Srinagar were 0.599, 0.601 andstudy. However, similar trend in families dominance on 0.579, respectively during 2013. While as, during 2014 itpeach flowers were observed in Pulwama and Srinagar (RI) was comparatively less. The Berger–Parkerindex (Bp)during the both years of survey. While as, in district equals the maximum p value i.e. inverse of true diversitySrinagar, 35 species were identified, belong to 18 families, of order infinity (1/ D) and were observed maximum during24 genera and 5 orders only. During the present study the 2013 (Table 1). Euclidean distances (?d) are specialcalculated values and comparison of calculated values of because they conform to our physical concept of speciesnine diversity indices of pollinator species collected from distance (difference). It makes very good sense as apeach (Prunus persica) trees of three districts of Kashmir measure of difference between insect pollinator speciesare given in Table (1). The calculated values of Simpson on peach at three experimental locations underdominance, D1 index of peach pollinators from three consideration. The Euclidean distances coefficients ofexperimental locations ranged from 0.752 to 0.938 (SE= 11.0 and 19.83 per cent were recorded represent that0.052) in 2013 to 0.909 to 0.977 (SE= 0.043) in 2014. diversity of peach pollinator species were highest fromHowever, the mean D1 value ranged from 0.864 to 0.962. district Budgam and lowest from Srinagar. However, theThe calculated value of t-test (0.047) across the two years species distance were more in 2014 as compared to 2013of experiment was found significant at level of 5% (Table (Table 1).1). Simpson diversity index (D2) of peach pollinator The rank abundance curve visually depicts bothspecies ranged from 4.042 to 16.30 during 2013 (SE= 1.90). species richness and species evenness (Fig. 1). The curveHowever, during 2014 it was more and ranged from 11.02 is a two dimensional chart with relative abundance on theto 44.38 (SE= 2.21). The significance was estimated by x Y-axis and the abundance rank on the X-axis. On X-axis2
test and the t-test<0.021 (Table 1). During the present the most abundant species Lassioglossum marginatuminvestigations the species richness were lowest for were given rank 1, second most abundant (L. himalanysis)Srinagar with 35 species; however, evenness of the is 2 and so on. While as, on the Y-axis, usually measuredpollinator species across three experimental location on log scale 10 and is the measure of abundance (No.ranges from minimum of 0.718 in Srinager to 0.954 in insect visitors/m /10min.) relative to the abundance ofBudgam (SE= 0.033) during 2013. While as, in 2014 it other species. Rank abundance curve (i rank (K) vsranges from 0.901 to 0.960 (SE= 0.021) in Srinager to abundance in log@10) or Whittaker plot displayed theBudgam, respectively. Conducting the Multiple relative species abundance (Fig. 1) and gives the relativeRegression Analysis of the data, the inference drawn is, role displayed by different pollinators. Figure 1 is the rankr=0.99, R =0.97 and SE= 2.81. For the pooled data, the p. abundance curve for the insect pollinator abundance on2
value and t-test estimated were 0.0045 and 0.023, peach in three districts. Species richness can be viewed asrespectively. The range of Shannon diversity index (H) the number of different species on the chart, i.e., howwere maximum in Srinager during both years of experiment many species were ranked. Species evenness is reflected(SE=0.647, t-test=0.032) and minimum in Budgam (Table 1). in the slope of the line that fits the graph (i.e. logarithmicPielou,s evenness index (J) or Shannon’s equitability series @10). A steep gradient indicates low evenness asindex measures the equitability of calculated species in the high-ranking species have much higher abundancesthe sample and ranged from 1.041 in Budgam to 1.581 in than the low-ranking species. A shallow gradientSrinagar (SE=0.191) during 2013. However, during 2014, indicates high evenness as the abundances of differentvalue of equitability index J, ranges from 0.727 (Budgam) species of order Diptera are almost similar. The curve atto 1.11 (Srinagar) (SE= 1.22). Margalef’s index (ml) is used highest peaks accommodates only one speciesto measure the richness of species distributed in three (Lassioglossum marginatum); later it comes down quicklyexperimental locations and the calculated values of the with small peaks representing the lower abundance of
i8
2
th
Acad. J. Entomol., 9 (4): 62-73, 2016
68
Fig. 1: Rank abundance value (I rank (K) vs abundance in Log@10) of insect pollinators of peach (Prunus persica)th
during 2013-2014
other pollinators. However, the plot represents the rich flowers of different crops in Nepal. In the presentdiversity of pollinator species. The curve showed the investigation in all of the three experimental locations, thecontrasting pattern of species richness in three peach crop was dominantly pollinated by generaexperimental locations and also highlights the difference Lassioglossum andrena and Syrphids. Similarly, Williamsin evenness among the species assemblage. When there [33] observed that fruit crops were pollinated by Bombusare few species (Srinager), the relatively abundant species spp., solitary bees, social wild bees, flies and thrips. Abrolis clearly displayed in the plot. The curves displayed that [8] revealed a total of 13 species of insect pollinators ofin district Budgam, insect species diversity on peach were horticultural crops from different landscapes of Jammumore, therefore the curve lie on the upper side. While, and Kashmir, which is comparatively less than observedcurve descending downwards because of the presence of in present investigations. In present study, the speciesa lower number of species [30]. As the curve lies above Amegilla cingulate of family Anthophoridae were foundand plots also simply proves the rich diversity across to pollinate stone fruit crops, which is in agreement withdifferent experimental sites.The K-dominance plot clearly Freitas et al. [34] who reported Centris tarsata (Family:demonstrates the diversity pattern in three different Anthophoridae) as a major stone fruit pollinator.experimental locations of Kashmir valley. However, according to Botanical Survey in USA (2012),
DISCUSSIONS chiefly pollinated by bees (Apis sp.), Bumble bees and
The diversity studies of insect pollinators visiting results. In current study, the peak capture rates of flower-stone fruit crops viz., peach Prunus persica at peak visiting insects within each fruit orchard largelyblooming period (>80 per cent) in Kashmir division (J&K) corresponded with peak stage of the flowering period.revealed that among the 46 insect pollinators/visitors During the survey, a total of 971 insect specimensrecorded, 23 species belonged to Hymenoptera, 17 to were collected from peach (Prunus persica) at theDiptera, 4 to Lepidoptera, one each to Hemiptera and blooming period. The order Hymenoptera were mostOdonata, respectively. A similar survey were done by dominant and nearly 534 specimens were from HelictidaeHong et al. [31] who reported a total of 88 species of family and the species Lassioglossum marganatum werepollinators on apple, pear and peach flowers in North found dominant and constituted 51.87 per cent,Korea. Thapa [32] observed the presence of 50 species on accounting 277 specimens of total collection. This is in
the fruit crops like peach, plum and cherry were observed
Dipteran flies, which completely confirms the present
Acad. J. Entomol., 9 (4): 62-73, 2016
69
agreement with results of Jaganmohan et al. [35] who supported by the fact that large patches provide usuallycollected 1072 insect specimens and the order higher heterogeneity and thereby support diverseHymenoptera were most dominant and constituted communities of flower visitors [44].61.47 per cent (659 specimens) of total population. For the insect specimens collected from peach treesRecently, in France, the family Halictidae was found during the present investigation, values of Simpsondominant with largest diversity, constituting 59.0 (20.27%) dominance index (D1) were found high and ranged fromdifferent species of total 291 Hymenopteran species 0.752 to 0.977 in 2013 and 2014, respectively. Bashir et al.,collected [36]. Insect visitors from Dipteran order were [45] estimated the pollinator species assemblage by usingobserved to constitute 26.05 per cent (253 specimens) Simpson dominance index, ranging from 0.06 to 0.117,of total 971 specimens collected during present whiles, the dominance of rang between 0.047 to 0.117investigation. Syrphid flies constitute majority of Dipteran were observed by Anbalagan et al. [46]. In presentpollinators of peach, plum and cherry. So far, 46 species investigation Dipteran species were second in diversityof hover flies have been reported as flower visitors and and dominance after Hymenoptera, which is inpollinators [37]. However, in present study only five confirmation with the results of Belamkar and Jadesh [47],Syrphid species were observed. Peach orchards of district that Dipteran pollinator had lowest dominance of 0.05 perBudgam contained the highest number of species (46) cent. The value of t-test (0.047) calculated for insectcompared to Pulwama (43) and Srinagar (35) and the pollinators of three crops taken under consideration wereDipteran flies constitute nearly 17 species which is in significant at 5 per cent confidence level. close agreement with the results of Datta and Chakraborty Simpson diversity index (D2) of peach pollinator[38] who reported 25 fly species from fruit orchards of species ranged from 4.042 to 44.38. This is in agreementJammu & Kashmir. On peach flowers, Diptera species with those reported by Belamkar and Jadesh [47] thatwere found to be second most abundant order Hymenoptera and Diptera had the diversity index of 3 andconstituting 13.47 per cent visitation done by 17 species one, respectively. For various flower visiting bees, theand 135 specimens (22.00 per cent). Similarly, Thakur and diversity index varies from 1 to zero [48]. Similarly, in caseMattu [39] reported 19 Dipteran species visiting to the of bees, wasps and flies the D2 value reported were inplum trees constituting 26.3 per cent of total species range 0.873-0.873, 0.636-0.743 and 0.707-0.854, in springcollected. Overall, it was found that the family Helictidae and summer, respectively [45]. The maximum value occurswas found most prevalent of all the bee species [10]. This when all species are equally abundant with the greatestis in close agreement with Murao et al. [41] that the genus species richness. Further, pollinator diversity count dataLassioglossum (Helictid) is most dominant. During the fit a Poisson distribution indicated by the goodness of fitcurrent study the family Helictidae were found dominant test x -test=0.002. The larger x² and smaller p. valuein both abundance as well as in total population and indicate more significance of results in the present study.constituted 8 species, which is in close agreement with For the insect specimens collected, the speciesthose obtained Gular et al., [42] and Guler and Dikmen richness Ma were highest for district Budgam and lowest[43], who carried out research on potential pollinators of for Srinagar, the possible reason could be that pollinatorsweet cherry and collected 1476 and 1200 bee specimens; species richness was positively affected by landscapethe dominant family observed were Helictidae constituting configuration, large habitat area and high habitat quality40 and 27 species, respectively. (i.e. steep slopes). As the landscape composition only
The higher insect species richness and diversity affected the species richness which increased withcould be as a result of higher diversity of plant species, increasing percentage of semi-natural habitat in therestriction of human induced activities and fragmented experimental sites. Raj and Mattu [49] observed theareas. Insect species in heterogeneous areas were found pollinator diversity and recorded the species richness ofabundant and diverse as well, because of their protection 40, 19 and 31 on peach, plum and cherry, respectively.from the human induced activates, compared to urban However, Bhalla et al. [50] observed species richness ofareas. Due to diverse nature of plant species in different 10, Kumar [51] 33, Thakur [52] 15 and Rana [53] 20 on plumlandscapes of Kashmir, insects are more attracted to these fruit crops and the most important species among themplants for foraging purpose which could result in their were from orders Hymenopteran and Dipteran. Abrol et al.high richness and abundance. Since, the experimental [54] reported Apis cerana as the frequent visitor onlocations of Budgam and Pulwama were more almond flowers at Srinagar (J&K). The evenness of theheterogeneous, therefore supported large diversity. It was pollinator species across three experimental location
2
Acad. J. Entomol., 9 (4): 62-73, 2016
70
ranges from minimum of 0.109 to 1.00. Differences in 2013. The Berger–Parker index Bp value for peach werespecies richness across the three locations could be due recorded highest in Budgam and minimum and non-to combination of large high-quality patches and significant in Srinager, which is in consonance with theheterogeneous landscapes, which maintains high bee findings of Anbalagan et al. [46] who recorded Bp fromspecies richness and communities with diverse trait 0.083 to 0.30.composition. During the current study, bee species The difference in species number were estimatedrichness recorded on peach, plum and cherry were 43.47; by Euclidean distances ( d) and it make very good sensehowever, the mean bee species richness recorded were as a measure of difference between insect pollinator67% of estimated species richness of the orchard patches species on peach across three experimental locations inand 83% of total study region [55]. The species evenness two study years. The species distance was more in 2014were observed statistically significant across the two as compared to 2013. For example, Wragg and Johnsonyears of study with t-test valued 0.027. Stirling and [58] used the euclidean distances to differentiate theWilsey [56] observed that evenness of species varies distance of perception by bees towards different floralfrom 0.58 to 0.99, which is partly in agreement with our traits attracting the different pollinator species. In thefindings that species evenness of the insect pollinators present study we used the Euclidean distance to quantifyvaries from 0.109 (Pulwama) to 1.00 (Budgam). Whiles, the difference in species number across the threeBelamkar and Jadesh [47] and Kyerematen et al. [57] locations for peach. Similarly, Ollerton et al. [59]recorded the insect pollinator species evenness of 0.928 calculated euclidean distances among the 3-dimentionaland 0.977, respectively. coordinates and compared the distance matrix with
In current investigation the high pollinator diversity distance relationships in original trait space, pollinationat location Budgam may be attributed to the fact that syndromes. Vereecken et al. [60] used the euclideanduring blooming period of the years 2013-2014, there were distance in floral odour between samples which attractsample food resources for the pollinators and the rainfall pollinator community on a highly specific basis throughwas not too heavy; since heavy rainfall tends to sweep the emission of odour blends that mimic the female sexmost pollinators away and destroy many of their food pheromone of the specific pollinator species. The rankresources. Further, the high dominance of Halictidae abundance curve visually represents both species(sweat bees) may have accounted for the low evenness richness and species evenness (Fig. 1) and the plotrecorded during the blooming season. demonstrates the diversity pattern in landscapes of
The calculated Shannon diversity index (H) of peach Kashmir valley.pollinators were maximum in Srinager and minimum inBudgam with p.value= 0.028, t-test=0.014. This is in close Future Work to Be Done: In future, the strategies areagreement with Belamkar and Jadesh [47], who recorded urgently required to ensure long term conservation ofthat Shannon diversity index (H) ranges from minimum present levels of global insect pollinator diversity. Since,1.009 for Hymenopteran pollinators to 2.226 for the insect diversity is huge and complex, with enoughColeopteran visitors. However, for Dipteran flower species making up a significant part of compositional andvisitors the calculated H value recorded were 1.00. functional diversity worldwide. Till now, only a fifth of allKyerematen et al. [57] studied the species composition insects have been scientifically described andand observed the highest Shannon diversity index (H) of documented and we have responsibility of conserving3.927, which is in close agreement with the present results. largely what is unknown. Unavoidably, it means that thereThe equitability of peach pollinator species ranged from are various challenges to address future of pollinatorminimum 0.727 (Budgam) during 2014 to 1.581 (Srinagar) diversity. Nevertheless, there are opportunities, especiallyin 2013; similarly, Anbalagan et al. [46] observed that when insect pollinators are seen as a major part toHymenopteran pollinator equitability ranged from 0.813 to contribute in food production in most terrestrial systems0.907 in different seasons of the year. across the globe. Therefore, bearing in mind that insect
Menhinick’s index (Mh) measures the richness of pollinators are of great value for human wellbeing.pollinator species and was recorded high in Budgam,supported by the results of Anbalagan et al. [46] who Summery and Conclusion: The ecological managementfound that Mh ranged from 1.22 to 1.79. Nakamura index of agroecosystems depends on interpreting the variousalso measures the richness of species and were found biological properties of natural environment surroundingmaximum in Pulwama and minimum in Srinagar during the ecosystem and the knowledge of local insect
Acad. J. Entomol., 9 (4): 62-73, 2016
71
communities and the way insect deal with environment 5. Ganie, M.A., A.K. Pal and N. Ahmad, 2013. Nativehave ubiquitous benefits for biodiversity conservation. insect pollinators in apple orchards under differentThe work presented here bring with the aims to insight management practices in the Kashmir Valley. Turkishinto. “Pollinator Species diversity indices of insect Journal of Agriculture - Food Science andpollinators of peach Prunus persica in temperate region”. Technology, 1(1): 29-36.The insect specimens collected during the blooming 6. Shahida, A., 2015. Pollinator diversity of almondperiod were observed to show variable diversity indices (Prunus amagdalis) in the Kashmir valley. Master’swith respect to landscapes of the study locations. The thesis submitted to department of entomology,taxonomic composition of insect species encountered on SKUAST-K, Srinager.peach trees was found to fall in 46 different and the order 7. Shahzada, R., 2016. Pollinator diversity of pear inHymenoptera were recorded dominant. The majority of Kashmir valley. Master’s thesis submitted toinsect pollinators are either neutral or beneficial to department of entomology, SKUAST-K, Srinager. humans. Budgam, with its vast territory, diverse climate 8. Abrol, D.P., 2012. Pollination biology: Conservationand ecosystems, is richest in insect diversity. However, as and Agricultural Production. Springer. Dordrechta result of the economic and population growth and Heidelberg London New York, USA. pp: 978.development in Srinager, the pollinator diversity is now 9. Michener, C.D., 2007. The Bees of the World. Thefaced with habitat degradation, species extinction and a Johns Hopkins University Press, 2 Edn. Baltimore,decline in foraging plants. These problems are due to MD Baltimore, Maryland 952: 6-11, 23-29, 57-58, 319-expansion of urbanization, industrialization, pollution, 412.mining and tourism, which in turn are responsible for 10. Hossain, Z., G.M. Gurr and S.D. Wratten, 1999.varied ranges of diversity indices across three Capture efficiency of insect natural enemies from tallexperimental locations. and short vegetation using vacuum sampling.
ACKNOWLEDGEMENT 11. Jauker, F., B. Bondarenko, H.C. Becker and D.H.
The authors are highly thankful to DST, New Delhi hoverflies provided to oilseed rape. Agricultural andfor financial assistance to conduct this research. Further, Forest Entomology, 14: 81-87.authors are also thankful to SKUAST-K, Srinager for the 12. Dar, S.A., G.M. Mir, M.A. Parry, M.A. Sofi andlaboratory and internet facilities provided during the S.A. Padder, 2016. Nest distribution and nestingstudies habits of Xylocopa violacea (Donovan), Fabricius
REFERENCES Experimental Zoology, India 19(1): 155-162.
1. Albrecht, M., B. Schmid, Y. Hautier and C.B. Müller, D.I. Steffan, 2013. Mass-flowering crops enhance2012. Diverse pollinator communities enhance plant wild bee abundance. Oecologia, 172: 477-484.reproductive success. Proceedings of the Royal 14. Garibaldi, L.A., G.C. Luísa, D.L. Sara andSociety British: Biological Sciences, 279: 4845-52. A.A. Marcelo, 2014. From research to action:
2. Khan, M.R. and M.R. Khan, 2004. The role of honey enhancing crop yield through wild pollinators. Frontbees Apis mellifera L. (Hymenoptera: Apidae) in Ecology Environment, 12(8): 439-447.pollination of apple. Pakistan Journal of Biological 15. Menz, M.H.M., R.D. Phillips, R. Winfree, C. Kremen,Science, 7: 359-362. M.A. Aizen and S.D. Johnson, 2011. Reconnecting
3. Potts, S.G., B. Vulliamy and S. Roberts, 2005. Role of plants and pollinators: challenges in the restorationnesting resources in organising diverse bee of pollination mutualisms. Trends Plant Science,communities in a Mediterranean landscape. 16: 4-12.Ecological Entomology, 30: 78-85. 16. Winfree, R., I. Bartomeus and D.P. Cariveau, 2010.
4. Mc-Gregor, S.F., 1976. Insect pollination of Native pollinators in anthropogenic habitats.cultivated crop plants. U.S. Dep. Agric. Handbook Annual Review of Ecolology and Evolution Studies,pp: 496. 42: 1-22.
nd
Annual Applied Biology, 135: 463-467.
Steffan, 2012. Pollination efficiency of wild bees and
(Hymenoptera: Apidae) in Kashmir valley. Journal of
13. Holzschuh, A., C.F. Dormann, T. Tscharntke and
Acad. J. Entomol., 9 (4): 62-73, 2016
72
17. Duelli, P. and M.K. Obrist, 1998. In search of the best 32. Thapa, B.B., 2006. Honeybees and other insectcorrelates for local organismal biodiversity incultivated areas. Biodiversity Conservation,7: 297-309.
18. Kearns, C.A.D., 2001. Endangered mutualisms: Theconservation of plant pollinator interaction. AnnualReview of Ecology and Systematics, 29: 83-112.
19. Watanabe, M., 1994. Pollination worries rise as honeybees decline. Science, 265: 1170.
20. Natural Resources Conservation Service, 2013.United States Department of Agriculture. AnimalEnhancement Activity- ANM09. Grazing managementto improve wildlife habitat. USDA, pp: 1-2.
21. James, R.R. and P.T.L. Singer, 2008. Bee Pollination inAgricultural Ecosystems. New York: OxfordUniversity Press, pp: 232.
22. Klein, A.M., B.E. Vaissière, J.H. Cane and C. Kremen,2007. Importance of pollinators in changinglandscapes for world crops. Proceedings of ResearchSociety of British Biological Science, 274: 303-313.
23. Missing24. Owiunjii, I., D. Nkuutu, D. Kujirakwinja, A. Plumptre,
M. Gray and A. McNeilage, 2004. The biodiversity ofthe virunga volcanoes. WCS, CFGFI, ICCN, ORTPN,UWA, IGCT, Kigali, pp: 21-27.
25. TIEE. 2004. Teaching Issues and Experiments inEcology, 2.http://tiee.ecoed.net/ vol/v2/experiments/pollinate.
26. Schauff, M.E., 1986. Collecting and preservinginsects and mites: Tools and techniques. SystematicEntomology Laboratory, USDA National Museum ofNatural History, Washington, D.C. 20560: 168.
27. Westphal, C., R. Bommarco, G. Carré and E. Lamborn,2008. Measuring bee biodiversity in differentEuropean habitats and biogeographical regions.Ecological Monograph, 78: 653-271.
28. Shannon, C.E. and W. Wiener, 1963. TheMathematical theory of communication. University ofJuionis Press, Urbana, pp: 117.
29. Simpson, E.H., 1949. Measurement of diversity.Nature, pp: 163-688.
31. Hong, K.J., S.H. Lee and K.M. Choi, 1989. Flowervisiting insects on the flowers of pear, peach andapple trees in Suwon. Korean Journal of Apiculture,4: 16-24.
pollinators of cultivated plants: A review. Journal ofthe Institute of Agriculture and Animal Science,27: 1-23.
33. Willians, I.H., 2002. Insect pollination and cropproduction: an European perspective. In: PollinatingBees. (Eds. P. Kevan and V.L. Imperatriz-Fonseca).The conservation link between agriculture andnature- ministry of environment, Brasília, pp: 59-65.
34. Freitas, B.M., J.E. Alves, G.F. Brandão andZ.B. Araújo, 2000. Pollination requirements ofWest Indian cherry (Malpighia emarginata) and itsputative pollinators, Centris bees, in NE Brazil.Journal of Agricultural Science, 133: 303-311.
35. Jaganmohan, M., L.S. Vailshery and H. Nagendra,2013. Patterns of insect abundance and distributionin urban domestic gardens in Bangalore, India.Diversity 5: 767-778.
36. Fortel, L., M. Henery, L. Guilbaud, A.L. Guirao,M. Kuhlmann and H. Mouret, 2014. Decreasingabundance, increasing diversity and changingstructure of the wild bee community (Hymenoptera:Anthophila) along an urbination gradient. PLOSONE, 9(8): e104679.
37. Mitra, B., 2010. Diversity of flower visiting flies(Insecta: Diptera) in India and their role in pollination.Zoological Survey of India, 110(2): 95-107.
38. Datta, M. and M. Chakraborty, 1983. On a collectionof flower flies (Diptera: Syrphidae) with new recordsfrom Jammu and Kashmir. Research ZoologicalSurvey of India, 81: 237-253.
39. Thakur, B. and V.K. Mattu, 2014. Diversity anddistribution of pollinators of temperate fruit crops ofShimla hills in Himachal Pradesh. Asian Journal ofAdvanced Basic Science, 3(1): 151-163.
40. Mullinax, T.J., 2015. Good fruit growers. GR-Bees1.Alkali species Walsh, pp: 1-2.
41. Murao, R., O. Tadauchi and T. Yamauchi, 2015.Taxonomic Revision of the Subgenus Ctenonomia ofthe Genus Lasioglossum (Hymenoptera, Halictidae)in Japan. Esakia, 49: 75-94.
42. Güler, K., F. Dikmen and A. Ozdem, 2015. Evaluationof bee diversity within different sweet cherryorchards in the Sultandaði reservoir (Turkey). Journalof Apicultural Science, 59(2): 13-25.
43. Güler, Y. and F. Dikmen, 2013. Potential beepollinators of sweet cherry in inclement weatherconditions. Journal of the Entomology ResearchSociety, 15(3): 9-19.
Acad. J. Entomol., 9 (4): 62-73, 2016
73
44. Lengyel, S., E. Déri and T. Magura, 2016. Species 54. Abrol, D.P., A.A. Bhat and A.R. Khan, 1987. Factorsrichness responses to structural or compositional affecting pollination activity of honeybees and fruithabitat diversity between and within grassland set in almond, Proceedings of National Symposiumpatches: A Multi-Taxon Approach. PLOS ONE, on Social Insects, (Bangalore, India) pp: 50-53.11(2): e0149662. 55. Hopfenmüller, S., I. Steffan-Dewenter and
45. Bashir, M.A., A. Saeed, A. Sajjad and A. Mudasir, A. Holzschuh, 2014. Trait-Specific Responses of2015. Seasonal variations in abundance and wild bee communities to landscape composition,diversity of insect pollinator in forest ecosystems of Configuration and local factors. PLOS ONE,Southern Punjab Pakistan. Pure and Applied Biology, 9(8): e104439 doi: 10.1371.4(3): 441-452. 56. Stirling, G. and B. Wilsey, 2001. Empirical
46. Anbalagan, V., M.G. Paulraj and S. Ignacimuthu, relationships between species richness, evenness2015. Biodiversity of insects in organic and chemical and proportional diversity. The American Naturalist,vegetable fields in Tiruvallur district, Tamil Nadu, 158(3): 286-99.India. International Journal of Pure and Applied 57. Kyerematen, R., A.L. Daniel, E. Owusu, R.S.Zoology, 3(2): 122-129. Anderson and Y.N. Baidu, 2014. Insect diversity of
47. Belamkar, N.V. and M.A. Jadesh, 2014. Preliminary the muni-pomadze ramsar site: An important site forstudy on abundance and diversity of insect fauna in biodiversity conservation in Ghana. Journal ofGulbarga district, Karnataka, India. International Insects id 985684, pp: 11.Journal of Science and Research, 3(12): 1670-1675. 58. Wragg, P.D. and S.D. Johnson, 2011. Transition from
48. Tepedino, V.J., T. Bowlin and L. Griswold, 2011. wind pollination to insect pollination in sedges:Diversity and pollination value of insects visiting the Experimental evidence and functional traits. Newflowers of a rare buckwheat (Eriogonum Phytologist, 191: 1128-1140.pelinophilum: Polygonaceae) in disturbed and 59. Ollerton, J., R. Winfree and S. Tarrant, 2009. How"natural" areas. Journal of Pollination Ecology, many flowering plants are pollinated by animals?4: 1920-7603. Oikos, 120: 321-326.
49. Raj, H. and V.K. Mattu, 2014. Diversity and 60. Vereecken, N.J., D. Amots and C. Salvatore, 2010.distribution of insect pollinators on various Pollination Syndromes in Mediterranean Orchids-temperate fruit crops in Himachal Himalaya, India. Implications for Speciation, Taxonomy andInternational Journal of Science and Nature, Conservation. Special orchid conservation issue5(4): 626-631. (June). Botanical Review, 76(2): 220-240.
50. Bhalla, O.P., H.S. Dhaliwal and A.K. Verma, 1983.Insect visitors of mustard bloom (Brassicacampestris var. sarson), their number and foragingbehaviour under mid-hill conditions. Journal ofEntomological Research, 7: 15-17.
51. Kumar, 1., 1988.1. Tree Science, 7(1): 38-40.52. Thakur, S.S., 1988. Insect pollination studies on
Almond, Ph. D Thesis, University of Horticulture andForestry, Solan, India, pp: 185.
53. Rana, R.S., 1989. Aggressive and hoarding behaviourof Apis mellifera L. and Apis cerana F. and their rolein pollination of plum and apple bloom, Ph.D. Thesis,Himachal Pradesh University, Shimla, India.